Embed Size (px)
Citation preview

Sunderland City Council Local Plan Evidence Base
SHIM Model Testing and Appraisal of the Local Plan Development Sites Including the South Sunderland Growth Area
FINAL
August 2014
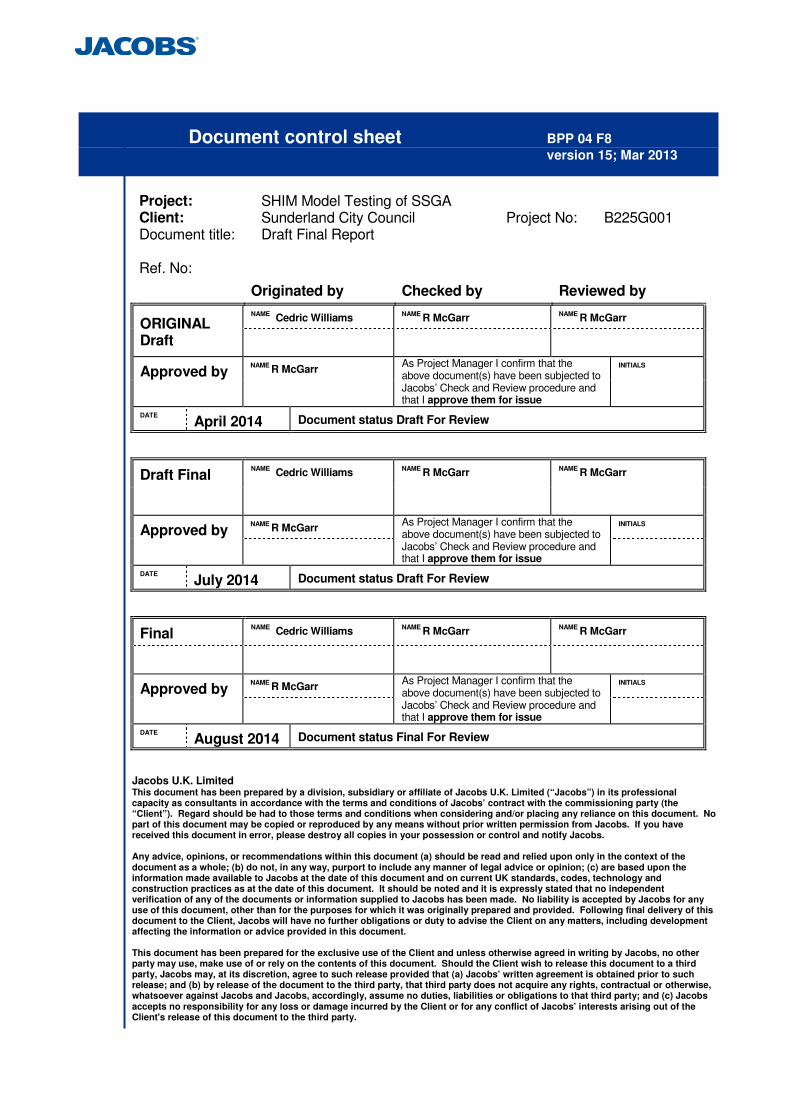
Document control sheet BPP 04 F8
version 15; Mar 2013
Project: SHIM Model Testing of SSGA Client: Sunderland City Council Project No: B225G001 Document title: Draft Final Report
Ref. No:
Originated by Checked by Reviewed by
ORIGINAL Draft
NAME Cedric Williams NAME R McGarr NAME
R McGarr
Approved by NAME
R McGarr As Project Manager I confirm that the above document(s) have been subjected to Jacobs’ Check and Review procedure and that I approve them for issue
INITIALS
DATE April 2014 Document status Draft For Review
Draft Final NAME Cedric Williams NAME
R McGarr NAME R McGarr
Approved by NAME
R McGarr As Project Manager I confirm that the above document(s) have been subjected to Jacobs’ Check and Review procedure and that I approve them for issue
INITIALS
DATE July 2014 Document status Draft For Review
Final NAME Cedric Williams NAME
R McGarr NAME R McGarr
Approved by NAME
R McGarr As Project Manager I confirm that the above document(s) have been subjected to Jacobs’ Check and Review procedure and that I approve them for issue
INITIALS
DATE August 2014 Document status Final For Review
Jacobs U.K. Limited This document has been prepared by a division, subsidiary or affiliate of Jacobs U.K. Limited (“Jacobs”) in its professional capacity as consultants in accordance with the terms and conditions of Jacobs’ contract with the commissioning party (the “Client”). Regard should be had to those terms and conditions when considering and/or placing any reliance on this document. No part of this document may be copied or reproduced by any means without prior written permission from Jacobs. If you have received this document in error, please destroy all copies in your possession or control and notify Jacobs. Any advice, opinions, or recommendations within this document (a) should be read and relied upon only in the context of the document as a whole; (b) do not, in any way, purport to include any manner of legal advice or opinion; (c) are based upon the information made available to Jacobs at the date of this document and on current UK standards, codes, technology and construction practices as at the date of this document. It should be noted and it is expressly stated that no independent verification of any of the documents or information supplied to Jacobs has been made. No liability is accepted by Jacobs for any use of this document, other than for the purposes for which it was originally prepared and provided. Following final delivery of this document to the Client, Jacobs will have no further obligations or duty to advise the Client on any matters, including development affecting the information or advice provided in this document. This document has been prepared for the exclusive use of the Client and unless otherwise agreed in writing by Jacobs, no other party may use, make use of or rely on the contents of this document. Should the Client wish to release this document to a third party, Jacobs may, at its discretion, agree to such release provided that (a) Jacobs’ written agreement is obtained prior to such release; and (b) by release of the document to the third party, that third party does not acquire any rights, contractual or otherwise, whatsoever against Jacobs and Jacobs, accordingly, assume no duties, liabilities or obligations to that third party; and (c) Jacobs accepts no responsibility for any loss or damage incurred by the Client or for any conflict of Jacobs’ interests arising out of the Client's release of this document to the third party.
Contents
1 Introduction 1
1.1 Overview 1
1.2 Aim of Study 3
1.3 Report Structure 3
2 Sunderland Highway Model (SHiM) 4
2.1 Sunderland Highway Model 4
2.2 Model Validity 4
2.3 2013 Interim Forecast 5
3 Traffic Growth and Forecasting 7
3.1 Overview 7
3.2 Application of Growth Factors 8
3.3 Growth in LGV and HGV 8
4 Development Sites 9
4.1 Introduction 9
4.2 Committed Development Sites 9
4.3 Local Plan Development Sites 10
4.4 Development Trip Generation 11
4.5 Development Trip Distribution 14
4.6 Highway Network Changes 14
5 The Effect of SSGA Development Traffic at Key Junctions 15
5.1 Introduction 15
5.2 Junction Assessment Results – With Ryhope Doxford Link Road 16
5.3 Interpretation of Assessment Results – with RDLR 20
5.4 Junction Assessment Results – Without Ryhope Doxford Link Road 22
6 Junction Improvements 25
6.1 Introduction 25
6.2 Changes to RFCs with Junction Improvements – with RDLR 26
6.3 Junction Assessment Results – Without Ryhope Doxford Link Road 29
7 Additional Network Assessments 32
7.1 Introduction 32
7.2 Effect on Strategic Road Network 32
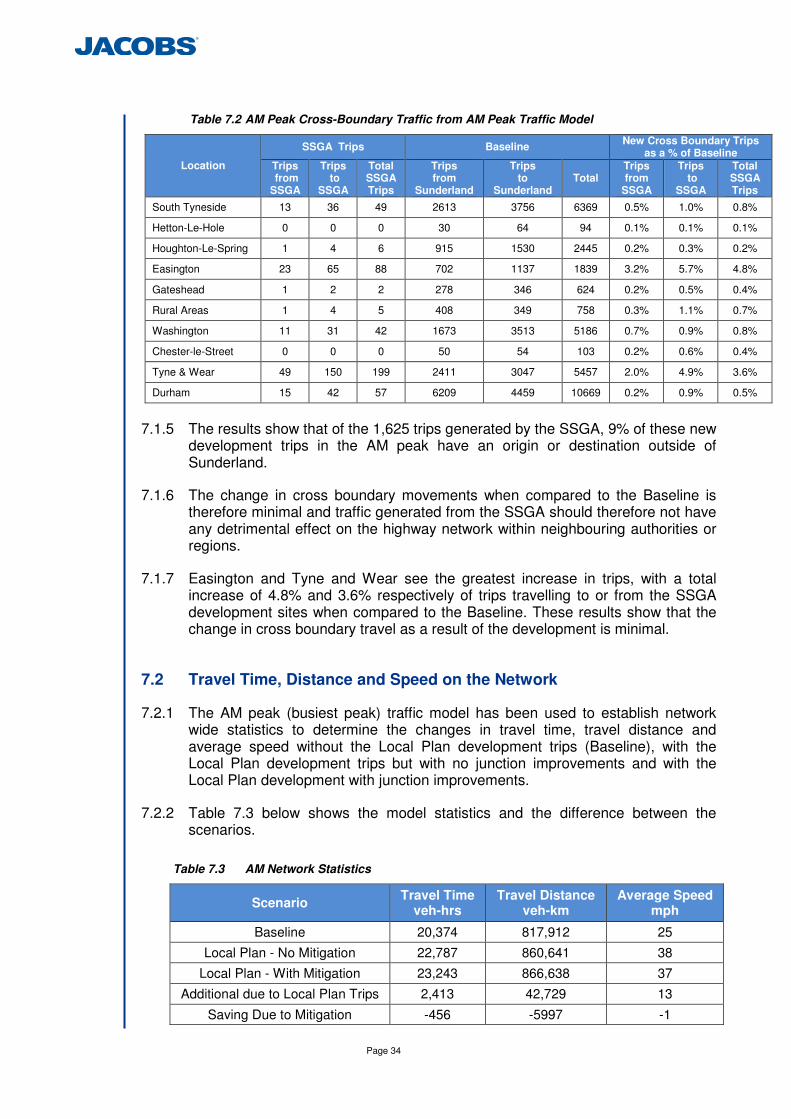
7.1 Analysis of Cross-Boundary and Sectorised Traffic 33
7.2 Travel Time, Distance and Speed on the Network 34
7.3 Network Utilisation 36
7.4 Potential Rat Running 38
8 Summary 39
8.1 Background Summary 39

8.2 Results Summary 40
8.3 Conclusion 42
Appendices Appendix A Trip Rates Summary Table
Tables
Table 2.1 Model Validation Results from Local Model Validation Report 4
Table 4.1 Committed Development Sites 9
Table 4.2 Local Plan Development Sites 10
Table 5.1 Strategic Junctions Flagged within Sunderland 15
Figures
Figure 1.1 Key Local Plan Development Locations 2
Figure 2.1 TADU Count Sites 5
Figure 5.1 Map of Strategic and RDLR Junctions 16
Figure 7.1 Diff between Local Plan (No Improvements) and Baseline Scenarios 36
Figure 7.2 Diff between Local Plan (No Improvements) and Local Plan (with Improvements) 37

Page 1
1 Introduction
1.1 Overview
1.1.1 The Sunderland Local Plan will define the strategic policies to shape spatial and economic development in the City to 2032. The Plan identifies the quantity and the location of new development across the urban area of Sunderland. To date, the City Council has prepared a Draft Revised Preferred Options for the Core Strategy and Development Management Policies (August 2013).
1.1.2 The Local Plan is a whole City document, though specific development of local policies since previous assessment work was completed have focussed on a number of policy areas to be implemented by 2032, leading to;
• Employment on both the Ultra-Low Carbon Enterprise Zone and new strategic employment site at Washington has led to the city becoming an international focus for low carbon technology, research and development, focussed around the Nissan car plant and ultra-low carbon vehicles. Washington’s location and accessibility to the strategic road network, large amounts of land for economic development, has led to increased job creation benefits for the city and sub-region.
• There is a short term prospect of further and significant employment land allocations and development to sites north of the existing Nissan site. This is expected to take the form of the proposed North east Advanced Manufacturing Park (NAMP), situated at the boundaries of Sunderland, South Tyneside and Gateshead local authority areas. Proposals for development of NAMP are at an early stage and there is little information in the public domain.
• South Sunderland has been a focus for new house building introducing a much needed mix of housing and providing the city with a supply of higher value executive homes. This has been a major contributor in diversifying the city’s housing stock further. South Sunderland will see major housing growth to accommodate the identified housing needs of the area, whilst absorbing some of the needs generated by the Washington and North Sunderland housing markets that cannot be accommodated in those areas. The southern periphery of this area has the potential to accommodate a significant amount of new housing across the entirety of the plan period. Sites at Chapelgarth, Cherry Knowle, Burdon Lane and South Ryhope are identified as separate locations for major development, though these will be brought forward together in a coordinated and comprehensive manner as the South Sunderland Growth Area (Policy CS2.2).
• Doxford International is a thriving business park and is home to a wide range of multinational companies drawn towards its prestigious high specification offices and availability of leading-edge telecommunications.
1.1.3 Key development locations from the Draft Revised Preferred Options are
illustrated in Figure 1.1 below.

Page 2
Figure 1.1 Key Local Plan Development Locations

Page 3
1.2 Aim of Study
1.2.1 This document seeks to provide evidence on the prospective future impacts of the Local Plan development proposals particularly the South Sunderland Growth Area (SSGA) element on the local transport network – especially the strategic and local roads network. The SSGA is made up of site locations 9, 10, 11 and 12 from Figure 1.1.
1.2.2 The purpose of this analysis is to examine the overall impact of development in terms of travel demands, network performance with a view to identifying the need for potential mitigation measures and junction improvements to complement the growth strategy and ensure its sustainability.
1.2.3 This analysis will develop the evidence base underpinning the Submission Documents put forward by the Council for Examination in Public. Key considerations during the study are, as follows;
• Identification of any major constraints on the local roads network as a result of the SSGA development proposals and assessment of improvement/mitigation opportunities.
• Identification of any major constraints on the Highways Agency’s (HA) road network as a result of SSGA local growth proposals and assessment of improvement/mitigation opportunities.
• Providing a transport evidence base to contribute to on-going development of a robust Developer Contributions funding mechanism to support delivery of the Local Plan.
1.3 Report Structure
1.3.1 The remainder of this report is structured as follows:
• Chapter 2 details the base traffic model utilised for the study;
• Chapter 3 details the forecasting methodology;
• Chapter 4 details the Local Plan and SSGA Sites;
• Chapter 5 contains the results of the junction assessments;
• Chapter 6 discusses further junction assessments should improvements be put in place;
• Chapter 7 contains the impacts on the strategic road network cross boundary traffic, network statistics and network utilisation
• Chapter 8 presents the final summary and conclusion
Page 4
2 Sunderland Highway Model (SHiM)
2.1 Sunderland Highway Model
2.1.1 The Sunderland Highway Model (SHiM) was developed for Sunderland City Council (SCC) as the Local Highway Authority using specialist SATURN modelling software. The model was completed in 2008 and through an interim forecast year of 2013 it forms the basis for the appraisal. The interim forecast model represents an AM peak and a PM peak on an average weekday (Monday to Friday) with a base year of 2013.
2.1.2 The model extent is sufficient to analyse in detail the impacts of developments within the Sunderland City Council Boundary as well as cross boundary trips.
2.1.3 The model consists of a highways only assignment and contains three separate vehicle types:
• Private Car
• Light Goods Vehicles (LGV)
• Heavy Goods Vehicles (HGV)
2.2 Model Validity
2.2.1 Upon construction of the ShiM traffic model in 2008, a Validation Report was produced for SCC, as the Local Highway Authority, which details the methods used to construct the model and shows the comparison of modelled traffic flows against observed traffic flows. The report was written to guidelines and nationally recognised standards as specified by the Department for Transport’s (DfT) Design Manual for Roads and Bridges (DMRB).
2.2.2 Table 2.1 shows a summary of the 2008 validation results from the Validation Report. 43 count sites were used across the model to check how well modelled flows matched observed flows. The model validates well against cars (the largest user group) and for all vehicles, which includes light and heavy goods vehicles.
Table 2.1 Model Validation Results from Local Model Validation Report
Validation Criteria AM PM
Individual Flows – All Vehicles 98% 97%
Individual Flows – Cars 97% 98%
Page 5
2.3 2013 Interim Forecast
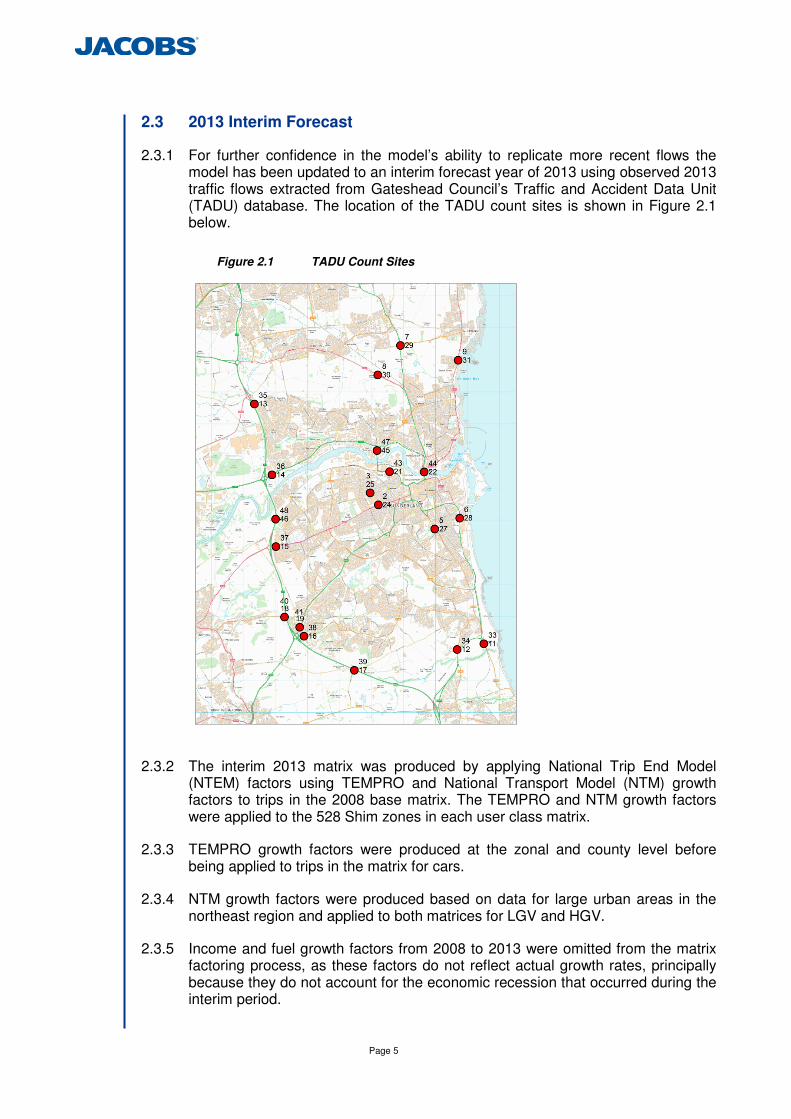
2.3.1 For further confidence in the model’s ability to replicate more recent flows the model has been updated to an interim forecast year of 2013 using observed 2013 traffic flows extracted from Gateshead Council’s Traffic and Accident Data Unit (TADU) database. The location of the TADU count sites is shown in Figure 2.1 below.
Figure 2.1 TADU Count Sites
2.3.2 The interim 2013 matrix was produced by applying National Trip End Model (NTEM) factors using TEMPRO and National Transport Model (NTM) growth factors to trips in the 2008 base matrix. The TEMPRO and NTM growth factors were applied to the 528 Shim zones in each user class matrix.
2.3.3 TEMPRO growth factors were produced at the zonal and county level before being applied to trips in the matrix for cars.
2.3.4 NTM growth factors were produced based on data for large urban areas in the northeast region and applied to both matrices for LGV and HGV.
2.3.5 Income and fuel growth factors from 2008 to 2013 were omitted from the matrix factoring process, as these factors do not reflect actual growth rates, principally because they do not account for the economic recession that occurred during the interim period.
Page 6
2.3.6 A process of matrix estimation was used to accurately calibrate the 2013 model. Matrix Estimation was conducted using the SATURN software suite.
2.3.7 The new matrices created through the matrix estimation process for the AM and PM peak were re-assigned to the network to produce modelled flows that were in line with observed counts and passed the relevant guidance criteria for network validation. The DMRB values for total vehicles in both the AM and PM peak periods are represented in Tables 2.2 and 2.3 below.
Table 2.2 2013 AM Peak Interim Forecast Validation Results
Total (Cars, LGVs & HGVs)
GEH < 5 DMRB
Pass 38 38 Fail 2 2
Total 40 40 % Pass 95% 95%
Table 2.3 2013 PM Peak Interim Forecast Validation Results
Total (Cars, LGVs & HGVs)
GEH < 5 DMRB
Pass 38 38 Fail 2 2
Total 40 40 % Pass 95% 95%

Page 7
3 Traffic Growth and Forecasting
3.1 Overview
3.1.1 This section describes the methodology and assumptions used for forecasting traffic growth between the interim forecast year model (2013) and the future year model (2032).
3.1.2 To determine the impact of development on the Sunderland area network, it was agreed that the analysis should be undertaken in the forecast year 2032 as this represents the end of the Local Plan period.
3.1.3 This assessment required factoring the 2013 interim forecast model to a 2032 model to represent the forecast growth in traffic. Growth has been calculated using the Department for Transport’s Trip End Model presentation PROgram (TEMPRO) and the National Traffic Model (NTM).
3.1.4 Forecasting entails a degree of uncertainty. WebTAG Unit 3.15.5: The Treatment of Uncertainty in Model Forecasting discusses the treatment of uncertainty in forecasting the impacts of a transport project, with particular reference to the use of transport models. The guidance says ‘Uncertainty in forecasting derives from the possibility of more than one outcome occurring during the period being forecasted and the forecast materially differing under these different outcomes. This would be represented by an input, or several inputs, to the forecast differing in the different views of the future’. The guidance discusses the need for a Core scenario and the option of a range of sensitivity tests and/or alternative scenarios to account for future uncertainty.
3.1.5 For the assessment of development growth in Sunderland, a Core scenario has been developed to test the most realistic levels of traffic growth and development site trip generation. High and low growth sensitivity tests usually associated with major infrastructure schemes have not been undertaken as they would not provide the most realistic results.
3.1.6 The DfT TEMPRO traffic growth is a nationally derived figure, but one which takes account of traffic growth due to local forecasts of changes to car ownership, income, population and jobs.
3.1.7 The traffic model used for this report is refined further because it takes account of the site specific impacts of large committed development sites and the population and jobs contained at these development sites.
3.1.8 To avoid double counting of development trips in the model the nationally derived TEMPRO traffic growth figures have been reduced to take account of the growth specifically associated with future development sites.

Page 8
3.1.9 The methodology adopted allows the following growth comparisons:-
• The factored growth in traffic between 2013 and 2032, which accounted for major committed development sites throughout the Sunderland area. This process produced the 2032 Baseline growth forecast.
• The factored growth in traffic between 2013 and 2032, which accounts for major committed developments and the proposed Local Plan development sites (including SSGA sites). This process produced the 2032 Local Growth forecast.
3.1.10 This approach accounts for all the critical contributors to traffic growth in 2032
and isolates the effects that the Local Plan sites have on the highway network.
3.1.11 The three vehicle types in the model (Cars, LGVs and HGVs) were each considered separately. TEMPRO growth was applied to cars, and NTM growth was applied to LGVs and HGVs.
3.2 Application of Growth Factors
3.2.1 The default TEMPRO planning assumptions, contained in the software, were adjusted to account for the number of households predicted in the 2032 forecast year. These growth factor adjustments were informed by committed and proposed developments of a particular size contained within the study area.
3.2.2 The increase in the number of jobs accounted for in TEMPRO approximately matched the level created by the Local Plan sites so this was not adjusted in the TEMPRO planning assumptions.
3.2.3 The TEMPRO factors were then fine-tuned to account for future fuel cost changes and income growth from the 2013 interim forecast year to the 2032 Baseline and Local Growth models. These factors were derived from Table 1 of the DfT’s Traffic Appraisal Guidance (TAG) Unit 3.15.2 (which can be accessed on the DfT’s website).
3.3 Growth in LGV and HGV
3.3.1 LGV and HGV growth factors have been taken from the DfT’s National Trip End Model (NTM) developed in 2013. This provides growth factors for all vehicle types on either a regional basis or by road classification.

Page 9
4 Development Sites
4.1 Introduction
4.1.1 The site specific information used in the traffic modelling for this report is divided into two types:
• Major development in Sunderland with planning permission, built or likely to be built after Sept 2009, but before March 2024. (Committed development sites)
• Draft Local Plan site allocations in Sunderland including sites contained within the South Sunderland Growth Area (SSGA).
4.2 Committed Development Sites
4.2.1 The committed development sites that have been taken into account are shown in Table 4.1 below.
Table 4.1 Committed Development Sites
ID Description Ref. No. GFA
x100m2
1 Three-storey office block 03/02670/LEG 43.2
2 Major retail development (Tesco)* 11/00560/REM 83.78
3 Retail development (Sainsbury’s)* 10/03918/FUL 101.8
4 St Benedict’s Hospice 11/03401/FUL 12.36**
5 Turbine Business Park 12/00803/REM 250.8
6 Grindon Hall School 12/02890/FUL -
7 Discount Food Store 12/03269/FUL 14.73
* - totals adjusted to include only new trips to and from existing sites ** - GFA estimated from site footprint (assumed 40% build-out)
Page 10
4.3 Local Plan Development Sites
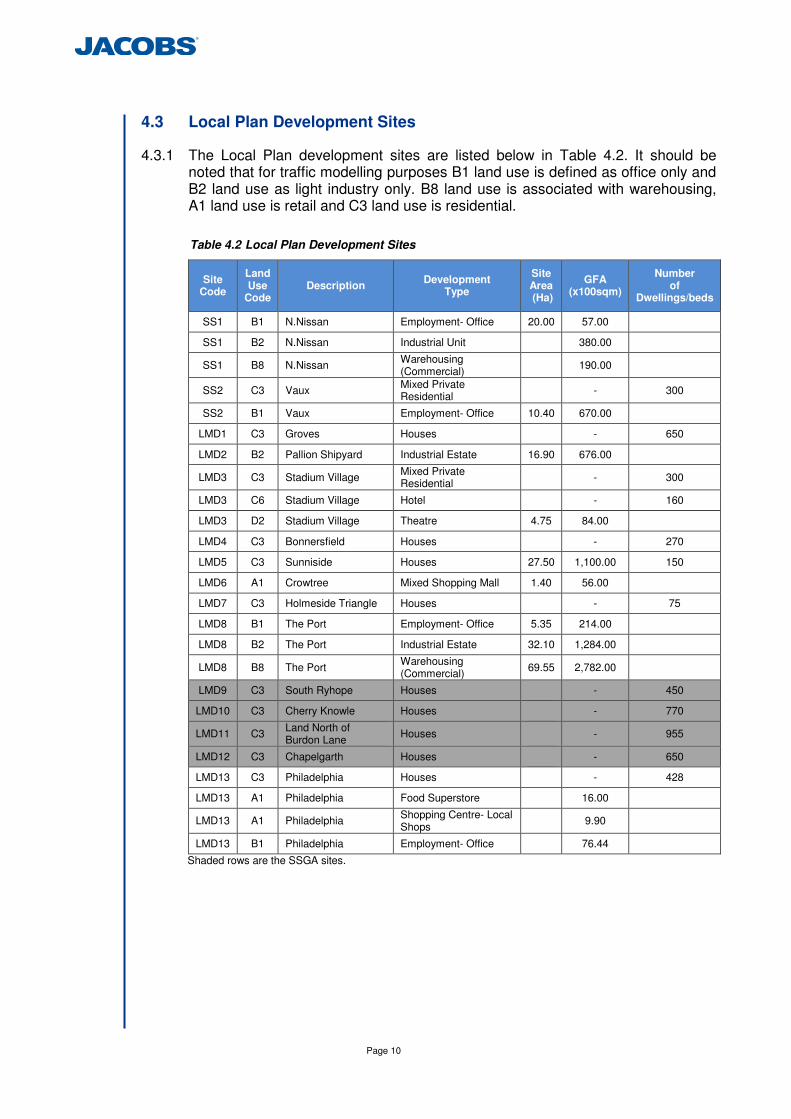
4.3.1 The Local Plan development sites are listed below in Table 4.2. It should be noted that for traffic modelling purposes B1 land use is defined as office only and B2 land use as light industry only. B8 land use is associated with warehousing, A1 land use is retail and C3 land use is residential.
Table 4.2 Local Plan Development Sites
Site Code
Land Use
Code Description
Development Type
Site Area (Ha)
GFA (x100sqm)
Number of
Dwellings/beds
SS1 B1 N.Nissan Employment- Office 20.00 57.00
SS1 B2 N.Nissan Industrial Unit
380.00
SS1 B8 N.Nissan Warehousing (Commercial)
190.00
SS2 C3 Vaux Mixed Private Residential
- 300
SS2 B1 Vaux Employment- Office 10.40 670.00
LMD1 C3 Groves Houses
- 650
LMD2 B2 Pallion Shipyard Industrial Estate 16.90 676.00
LMD3 C3 Stadium Village Mixed Private Residential
- 300
LMD3 C6 Stadium Village Hotel
- 160
LMD3 D2 Stadium Village Theatre 4.75 84.00
LMD4 C3 Bonnersfield Houses
- 270
LMD5 C3 Sunniside Houses 27.50 1,100.00 150
LMD6 A1 Crowtree Mixed Shopping Mall 1.40 56.00
LMD7 C3 Holmeside Triangle Houses
- 75
LMD8 B1 The Port Employment- Office 5.35 214.00
LMD8 B2 The Port Industrial Estate 32.10 1,284.00
LMD8 B8 The Port Warehousing (Commercial)
69.55 2,782.00
LMD9 C3 South Ryhope Houses
- 450
LMD10 C3 Cherry Knowle Houses
- 770
LMD11 C3 Land North of Burdon Lane
Houses
- 955
LMD12 C3 Chapelgarth Houses
- 650
LMD13 C3 Philadelphia Houses
- 428
LMD13 A1 Philadelphia Food Superstore
16.00
LMD13 A1 Philadelphia Shopping Centre- Local Shops
9.90
LMD13 B1 Philadelphia Employment- Office
76.44
Shaded rows are the SSGA sites.
Page 11
4.4 Development Trip Generation
4.4.1 The number of trips generated by the individual sites was estimated using trip rates calculated using the nationally accepted TRICS1 database. These trip rates are based on the number of dwellings and employment areas put forward as the Council’s Draft Allocations. A trip rate summary table is contained in Appendix A.
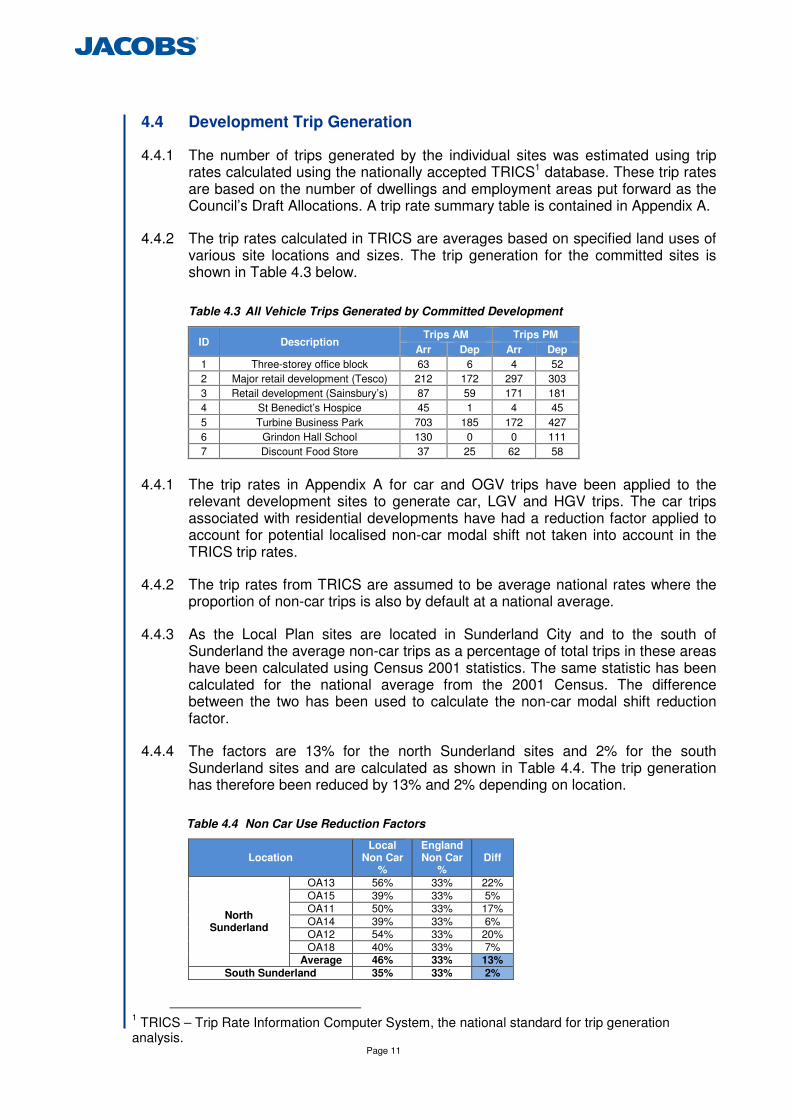
4.4.2 The trip rates calculated in TRICS are averages based on specified land uses of various site locations and sizes. The trip generation for the committed sites is shown in Table 4.3 below.
Table 4.3 All Vehicle Trips Generated by Committed Development
ID Description Trips AM Trips PM
Arr Dep Arr Dep
1 Three-storey office block 63 6 4 52
2 Major retail development (Tesco) 212 172 297 303
3 Retail development (Sainsbury’s) 87 59 171 181
4 St Benedict’s Hospice 45 1 4 45
5 Turbine Business Park 703 185 172 427
6 Grindon Hall School 130 0 0 111
7 Discount Food Store 37 25 62 58
4.4.1 The trip rates in Appendix A for car and OGV trips have been applied to the
relevant development sites to generate car, LGV and HGV trips. The car trips associated with residential developments have had a reduction factor applied to account for potential localised non-car modal shift not taken into account in the TRICS trip rates.
4.4.2 The trip rates from TRICS are assumed to be average national rates where the proportion of non-car trips is also by default at a national average.
4.4.3 As the Local Plan sites are located in Sunderland City and to the south of Sunderland the average non-car trips as a percentage of total trips in these areas have been calculated using Census 2001 statistics. The same statistic has been calculated for the national average from the 2001 Census. The difference between the two has been used to calculate the non-car modal shift reduction factor.
4.4.4 The factors are 13% for the north Sunderland sites and 2% for the south Sunderland sites and are calculated as shown in Table 4.4. The trip generation has therefore been reduced by 13% and 2% depending on location.
Table 4.4 Non Car Use Reduction Factors
Location Local
Non Car %
England Non Car
% Diff
North Sunderland
OA13 56% 33% 22%
OA15 39% 33% 5%
OA11 50% 33% 17%
OA14 39% 33% 6% OA12 54% 33% 20%
OA18 40% 33% 7% Average 46% 33% 13%
South Sunderland 35% 33% 2%
1 TRICS – Trip Rate Information Computer System, the national standard for trip generation
analysis.
Page 12
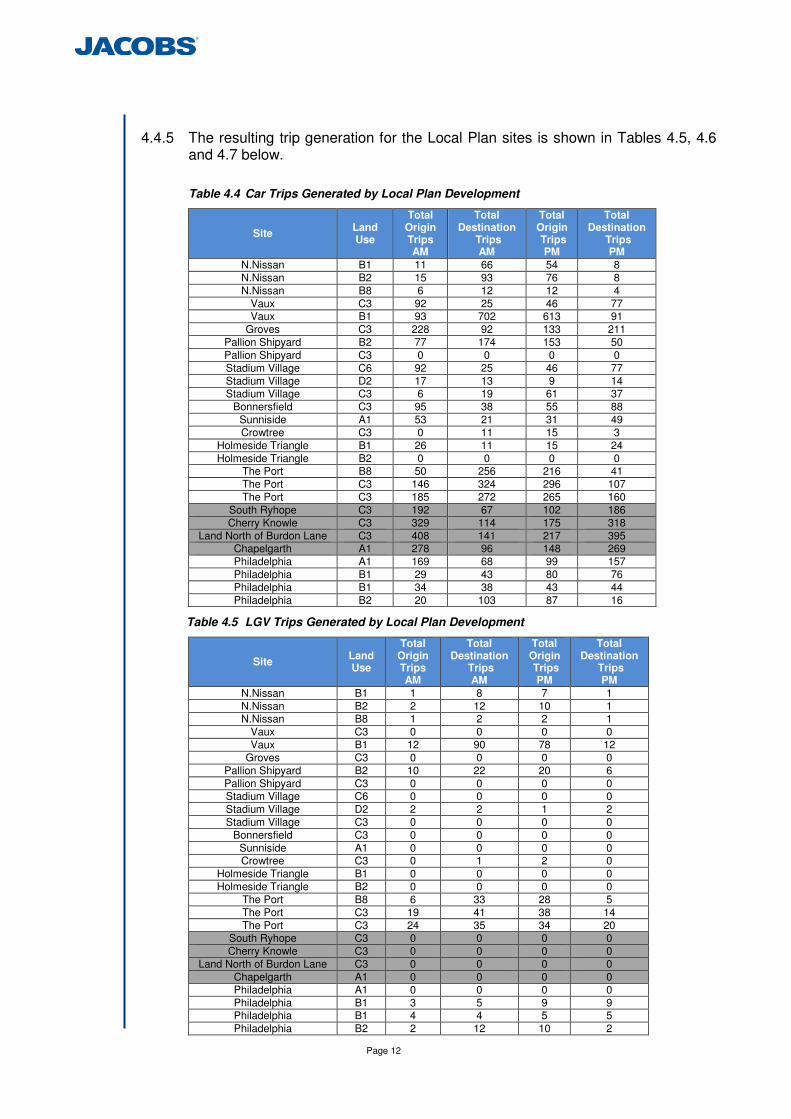
4.4.5 The resulting trip generation for the Local Plan sites is shown in Tables 4.5, 4.6
and 4.7 below.
Table 4.4 Car Trips Generated by Local Plan Development
Site Land Use
Total Origin Trips AM
Total Destination
Trips AM
Total Origin Trips
PM
Total Destination
Trips PM
N.Nissan B1 11 66 54 8
N.Nissan B2 15 93 76 8
N.Nissan B8 6 12 12 4
Vaux C3 92 25 46 77 Vaux B1 93 702 613 91
Groves C3 228 92 133 211
Pallion Shipyard B2 77 174 153 50
Pallion Shipyard C3 0 0 0 0
Stadium Village C6 92 25 46 77
Stadium Village D2 17 13 9 14 Stadium Village C3 6 19 61 37
Bonnersfield C3 95 38 55 88
Sunniside A1 53 21 31 49
Crowtree C3 0 11 15 3
Holmeside Triangle B1 26 11 15 24
Holmeside Triangle B2 0 0 0 0 The Port B8 50 256 216 41
The Port C3 146 324 296 107
The Port C3 185 272 265 160
South Ryhope C3 192 67 102 186
Cherry Knowle C3 329 114 175 318
Land North of Burdon Lane C3 408 141 217 395 Chapelgarth A1 278 96 148 269
Philadelphia A1 169 68 99 157
Philadelphia B1 29 43 80 76
Philadelphia B1 34 38 43 44
Philadelphia B2 20 103 87 16
Table 4.5 LGV Trips Generated by Local Plan Development
Site Land Use
Total Origin Trips AM
Total Destination
Trips AM
Total Origin Trips
PM
Total Destination
Trips PM
N.Nissan B1 1 8 7 1
N.Nissan B2 2 12 10 1 N.Nissan B8 1 2 2 1
Vaux C3 0 0 0 0
Vaux B1 12 90 78 12
Groves C3 0 0 0 0
Pallion Shipyard B2 10 22 20 6
Pallion Shipyard C3 0 0 0 0 Stadium Village C6 0 0 0 0
Stadium Village D2 2 2 1 2
Stadium Village C3 0 0 0 0
Bonnersfield C3 0 0 0 0
Sunniside A1 0 0 0 0 Crowtree C3 0 1 2 0
Holmeside Triangle B1 0 0 0 0
Holmeside Triangle B2 0 0 0 0
The Port B8 6 33 28 5
The Port C3 19 41 38 14
The Port C3 24 35 34 20 South Ryhope C3 0 0 0 0
Cherry Knowle C3 0 0 0 0
Land North of Burdon Lane C3 0 0 0 0
Chapelgarth A1 0 0 0 0
Philadelphia A1 0 0 0 0
Philadelphia B1 3 5 9 9 Philadelphia B1 4 4 5 5
Philadelphia B2 2 12 10 2

Page 13
Table 4.6 HGV Trips Generated by Local Plan Development
Site Land Use
Total Origin Trips
AM
Total Destination
Trips AM
Total Origin Trips
PM
Total Destination
Trips PM
N.Nissan B1 0 0 0 0
N.Nissan B2 10 9 4 3
N.Nissan B8 0 0 0 0
Vaux C3 0 0 0 0
Vaux B1 4 4 1 1
Groves C3 0 0 0 0 Pallion Shipyard B2 17 12 10 14
Pallion Shipyard C3 0 0 0 0
Stadium Village C6 0 0 0 0
Stadium Village D2 0 0 0 0
Stadium Village C3 0 0 0 0 Bonnersfield C3 0 0 0 0
Sunniside A1 0 0 0 0
Crowtree C3 0 0 0 0
Holmeside Triangle B1 0 0 0 0
Holmeside Triangle B2 0 0 0 0
The Port B8 1 1 0 0 The Port C3 33 31 13 10
The Port C3 2 4 3 2
South Ryhope C3 0 0 0 0
Cherry Knowle C3 0 0 0 0
Land North of Burdon Lane C3 0 0 0 0
Chapelgarth A1 0 0 0 0 Philadelphia A1 0 0 0 0
Philadelphia B1 0 0 0 0
Philadelphia B1 1 1 0 0
Philadelphia B2 0 0 0 0
4.4.6 The focus of this report is on the effects of the development traffic generated by the South Sunderland Growth Area (SSGA) sites.
4.4.7 Table 4.8 shows the total number of trips generated by the Local Plan developments and Table 4.9 shows the number of trips generated by the SSGA proposed development sites.
Table 4.8 Local Plan Development Trip Totals
Vehicle Type
Time Period
In Out Total
Car AM 2,824 2,651 5,475
PM 2,510 3,047 5,557
LGV AM 267 86 353
PM 78 244 322
HGV AM 62 68 130
PM 30 31 61
Table 4.8 SSGA Development Trip Totals
Vehicle Type
Time Period
In Out Total
Car AM 418 1,207 1,625
PM 1,168 642 1,810
LGV AM 0 0 0
PM 0 0 0
HGV AM 0 0 0
PM 0 0 0

Page 14
4.5 Development Trip Distribution
4.5.1 The development trips have been added to the model to represent 2032 traffic conditions in both the Baseline (committed only) and Local Growth scenarios. The development trips were added to the model zones in the model that represent the future development sites. For the SSGA sites the access points from these trip zones onto the highway network are based on the Draft/Concept Masterplan for the South Sunderland Growth Area (May 2013).
4.5.2 Each development required a trip distribution method to determine the origins and destinations of trips leaving and entering the sites. This was obtained by the use of a gravity model based on travel distance and number of households in model zones for the employment distribution; and based on travel distance and number of jobs for the residential distribution. Households and jobs were calculated using up to date 2011 Census data.
4.6 Highway Network Changes
4.6.1 As well as reflecting demand in the two forecast scenarios as accurately as possible, it was also necessary to model any significant highway changes that could influence routing choice for vehicles. The Baseline 2032 scenario traffic model highway network has been coded to include schemes either already completed since 2008, or with a very high likelihood of delivery. These schemes are:
• Wheatsheaf Gyratory Improvement
• A19/A690 southbound off-slip additional capacity
• Sunderland Strategic Transport Corridor (SSTC), including
• New Wear Bridge Crossing
4.6.2 In addition to the above, the Local Growth 2032 scenario traffic model highway
network has been coded to include highway infrastructure to support the Local Plan developments including those associated with the proposed links connecting the B1286 to the A1018 to create the Ryhope Doxford Link Road (RDLR) (listed from East to West):
• Changes to the roundabout at the junction of A1018, Stockton Road, and the proposed RDLR;
• Changes to the roundabout at the junction of Highclere Drive and the proposed RDLR;
• Changes to the roundabout at the junction of Eltham Road and the proposed RDLR;
• Changes to the roundabout at the junction of the B1286, Mill Hill Road, Hall Farm Road, and the proposed RDLR.
Page 15
5 The Effect of SSGA Development Traffic at Key Junctions
5.1 Introduction
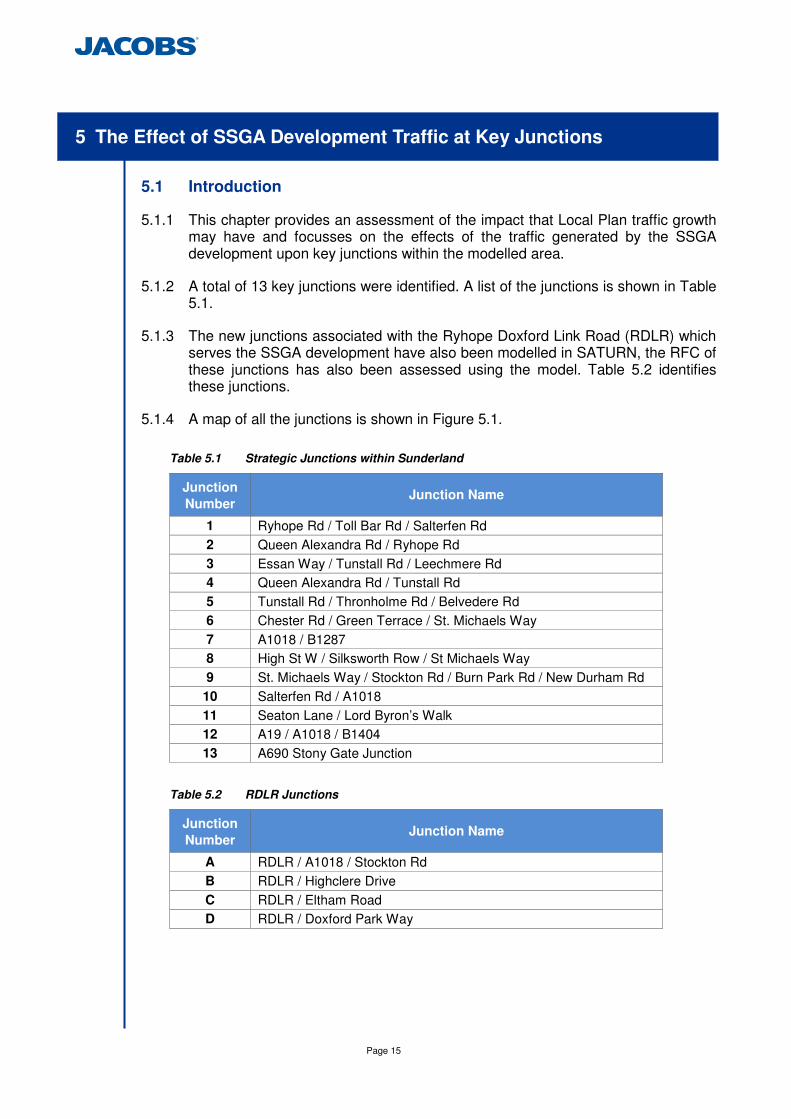
5.1.1 This chapter provides an assessment of the impact that Local Plan traffic growth may have and focusses on the effects of the traffic generated by the SSGA development upon key junctions within the modelled area.
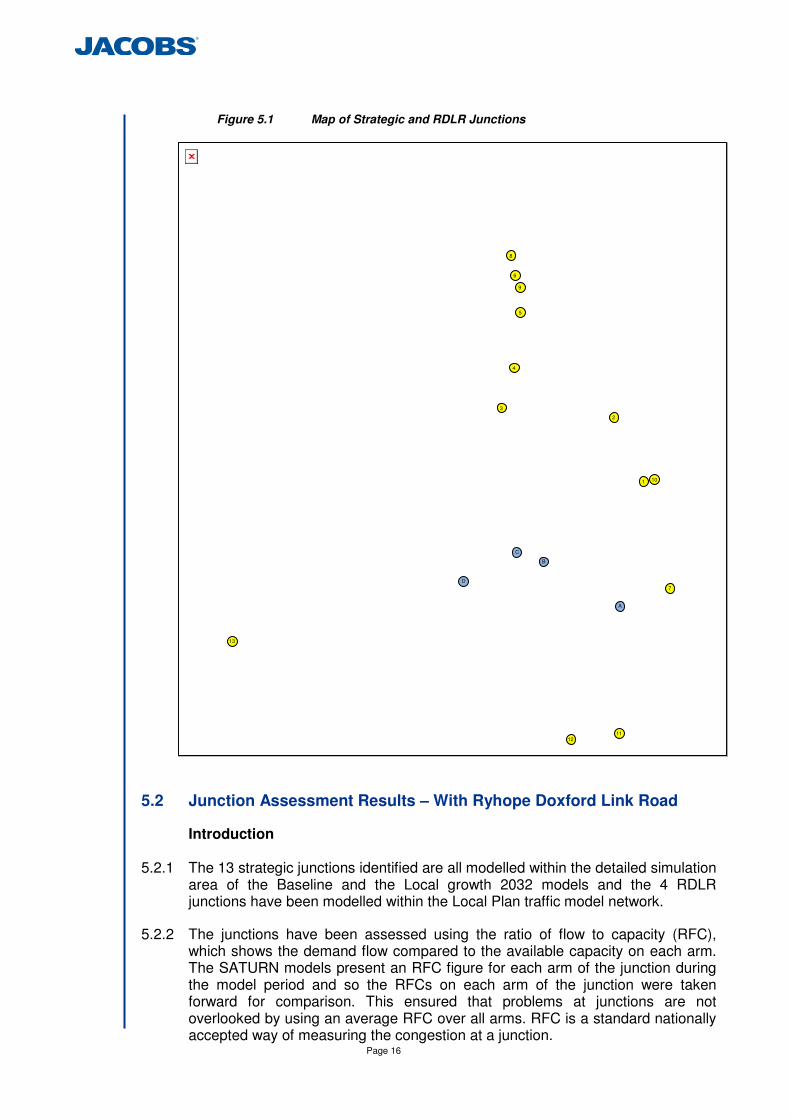
5.1.2 A total of 13 key junctions were identified. A list of the junctions is shown in Table 5.1.
5.1.3 The new junctions associated with the Ryhope Doxford Link Road (RDLR) which serves the SSGA development have also been modelled in SATURN, the RFC of these junctions has also been assessed using the model. Table 5.2 identifies these junctions.
5.1.4 A map of all the junctions is shown in Figure 5.1.
Table 5.1 Strategic Junctions within Sunderland
Junction
Number Junction Name
1 Ryhope Rd / Toll Bar Rd / Salterfen Rd
2 Queen Alexandra Rd / Ryhope Rd
3 Essan Way / Tunstall Rd / Leechmere Rd
4 Queen Alexandra Rd / Tunstall Rd
5 Tunstall Rd / Thronholme Rd / Belvedere Rd
6 Chester Rd / Green Terrace / St. Michaels Way
7 A1018 / B1287
8 High St W / Silksworth Row / St Michaels Way
9 St. Michaels Way / Stockton Rd / Burn Park Rd / New Durham Rd
10 Salterfen Rd / A1018
11 Seaton Lane / Lord Byron’s Walk
12 A19 / A1018 / B1404
13 A690 Stony Gate Junction
Table 5.2 RDLR Junctions
Junction
Number Junction Name
A RDLR / A1018 / Stockton Rd
B RDLR / Highclere Drive
C RDLR / Eltham Road
D RDLR / Doxford Park Way
Page 16
Figure 5.1 Map of Strategic and RDLR Junctions
5.2 Junction Assessment Results – With Ryhope Doxford Link Road
Introduction
5.2.1 The 13 strategic junctions identified are all modelled within the detailed simulation area of the Baseline and the Local growth 2032 models and the 4 RDLR junctions have been modelled within the Local Plan traffic model network.
5.2.2 The junctions have been assessed using the ratio of flow to capacity (RFC), which shows the demand flow compared to the available capacity on each arm. The SATURN models present an RFC figure for each arm of the junction during the model period and so the RFCs on each arm of the junction were taken forward for comparison. This ensured that problems at junctions are not overlooked by using an average RFC over all arms. RFC is a standard nationally accepted way of measuring the congestion at a junction.
11 12
13
1
2
3
4
5
6
7
8
9
10
A
B
C
D

Page 17
5.2.3 The RFCs are reported using a nationally accepted traffic light colouring system which works as follows:
• Green - RFC less than 0.85, junction is likely to operate without delays; 0.85 is an industry recognised level of congestion at which a junction is starting to approach its capacity.
• Amber - RFC between 0.85 and 1, junction is approaching capacity and may be subject to minor delay;
• Red - RFC greater than 1, junction is over capacity and delays will occur.
5.2.4 Perceived congestion at junctions may be worse than that shown in the modelling
results.
Results
5.2.5 The results of the strategic junction assessments for the 2032 Baseline and 2032
Local Plan scenario with the RDLR are shown in Table 5.3 which displays the maximum RFC value for each junction. The table also shows the proportion of all the Local Plan traffic using the junction which is to or from the SSGA development.
Table 5.3 Junction Assessment Results (Maximum RFC), with RDLR
Junct No.
Junction Name
AM PM Max RFC
Change if >85% and >Baseline
Baseline 2032
Local Growth
2032
% Dev. Trips from
SSGA
Baseline 2032
Local Growth
2032
% Dev. Trips from
SSGA
1 Ryhope Rd / Toll Bar Rd / Salterfen Rd
102 104 58% 37 33 83% 2 (AM)
2 Queen Alexandra Rd / Ryhope Rd
79 92 56% 49 38 57% 13 (AM)
3 Essan Way / Tunstall Rd / Leechmere Rd
109 111 42% 102 103 72% 2 (AM)
4 Queen Alexandra Rd / Tunstall Rd
77 96 33% 85 96 69% 19 (AM)
5 Tunstall Rd / Thronholme Rd / Belvedere Rd
86 99 32% 77 82 59% 13 (AM)
6 Chester Rd / Green Terrace / St. Michaels Way
76 96 13% 81 97 31% 20 (AM)
7 A1018 / B1287 101 79 78% 86 97 88% 11 (PM)
8 High St W / Silksworth Row / St Michaels Way
79 89 10% 67 73 25% -
9
St. Michaels Way / Stockton Rd / Burn Park Rd / New Durham Rd
89 97 15% 78 86 28% 8 (AM &
PM)
10 Salterfen Rd / A1018 101 106 65% 60 63 81% 5 (AM)
11 Seaton Lane / Lord Byron’s Walk
120 119 86% 119 121 86% 2 (PM)
12 A19 / A1018 / B1404 104 108 87% 108 109 76% 4 (AM)
13 A690 Stony Gate Junction 27 30 84% 20 23 81% -
Page 18
5.2.6 The results from Table 5.3 show, that left unimproved and with the RDLR in place, in one or both peak periods, 11 of the junctions are forecast to operate above 85% capacity and with a higher RFC than the Baseline scenario in 2032 when the Local Plan traffic is present on the highway network, these are shaded red or amber in the first two columns of the table.
5.2.7 5 of the 11 junctions will operate over capacity (RFC>100%, shaded red). These junctions are summarised below.
• Junction 1 will have an increase in RFC of only 2 percentage points in the AM peak, 58% of the Local Plan traffic using the junction is to or from the SSGA sites.
• Junction 3 will have an increase in RFC of only 2 percentage points in the AM peak and 1 percentage point in the PM peak. 42% of the Local Plan traffic using the junction in the AM peak is to or from the SSGA sites.
• Junction 10 will have an increase in RFC of 5 percentage points in the AM peak with 65% of the Local Plan traffic using the junction being to or from the SSGA sites.
• Junction 11 will have an increase in RFC of only 2 percentage points in the PM peak and 86% of the Local Plan traffic using the junction is to or from the SSGA sites.
• Junction 12 will have an increase in RFC of only 4 percentage points in the AM peak and 87% of the Local Plan traffic using the junction is to or from the SSGA sites.
5.2.8 As the increase in RFC as a result of the Local Plan traffic is so small for the above junctions and because it is likely that the increase in RFC is not wholly associated with the SSGA traffic, these junctions need not have any mitigation measures proposed.
5.2.9 The other 6 of the 11 junctions will operate with a RFC between 90% and 100% (shaded amber). These junctions are summarised below.
• Junction 2 will have an increase in RFC of 13 percentage points in the AM peak and only 56% of the Local Plan traffic using the junction is to or from the SSGA sites.
• Junction 4 will have an increase in RFC of 19 percentage points in the AM peak but only 33% of the Local Plan traffic using the junction is to or from the SSGA sites.
• Junction 5 will have an increase in RFC of 13 percentage points in the AM peak but only 32% of the Local Plan traffic using the junction is to or from the SSGA sites.
• Junction 6 will have an increase in RFC of 20 percentage points in the AM peak but only 13% of the Local Plan traffic using the junction is to or from the SSGA sites.
• Junction 7 will have an increase in RFC of 11 percentage points in the PM peak with 88% of the Local Plan traffic using the junction being to or from the SSGA sites.
• Junction 9 will have an increase in RFC of 8 percentage points in the AM peak but only 28% of the Local Plan traffic using the junction is to or from the SSGA sites.
Page 19
5.2.10 The operational capacity of junction 8 and junction 13 with the Local Plan traffic will be less than 85% or the same as or lower than the Baseline (shaded green).
5.2.11 It should be noted that as mentioned above the RFC at junctions 1, 3, 10, 11 and 12 increases by less than 5 percentage points which is not a significant increase and further analysis may not me necessary.
5.2.12 Junction 12 which is the junction between the A19/A1018/B1404 is a large junction made up of several merges and two priority junctions. The maximum RFCs referenced in Table 5.3 are for the left and right turn from the B1404 into the northbound on slip to the A19. The congestion caused will therefore be on the local road network. There will be no congestion imposed on the A19 or A1018 trunk road network.
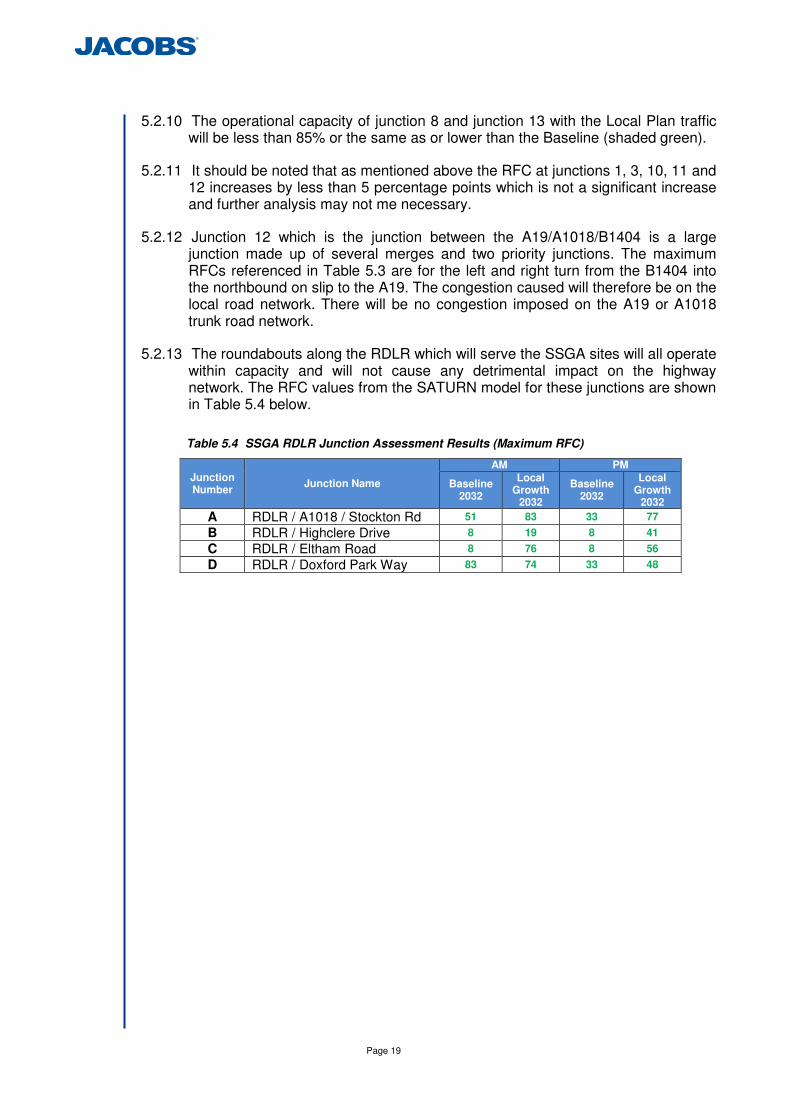
5.2.13 The roundabouts along the RDLR which will serve the SSGA sites will all operate within capacity and will not cause any detrimental impact on the highway network. The RFC values from the SATURN model for these junctions are shown in Table 5.4 below.
Table 5.4 SSGA RDLR Junction Assessment Results (Maximum RFC)
Junction Number
Junction Name
AM PM
Baseline 2032
Local Growth
2032
Baseline 2032
Local Growth
2032
A RDLR / A1018 / Stockton Rd 51 83 33 77
B RDLR / Highclere Drive 8 19 8 41
C RDLR / Eltham Road 8 76 8 56
D RDLR / Doxford Park Way 83 74 33 48
Page 20
5.3 Interpretation of Assessment Results – with RDLR
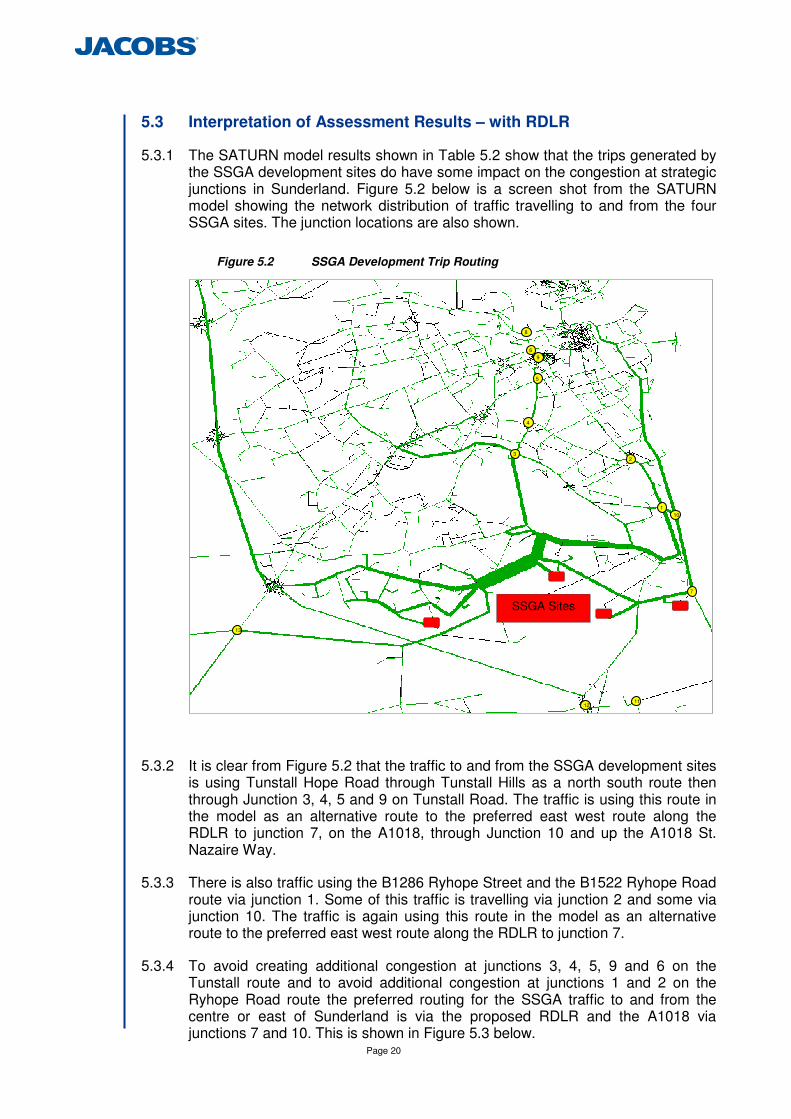
5.3.1 The SATURN model results shown in Table 5.2 show that the trips generated by the SSGA development sites do have some impact on the congestion at strategic junctions in Sunderland. Figure 5.2 below is a screen shot from the SATURN model showing the network distribution of traffic travelling to and from the four SSGA sites. The junction locations are also shown.
Figure 5.2 SSGA Development Trip Routing
5.3.2 It is clear from Figure 5.2 that the traffic to and from the SSGA development sites is using Tunstall Hope Road through Tunstall Hills as a north south route then through Junction 3, 4, 5 and 9 on Tunstall Road. The traffic is using this route in the model as an alternative route to the preferred east west route along the RDLR to junction 7, on the A1018, through Junction 10 and up the A1018 St. Nazaire Way.
5.3.3 There is also traffic using the B1286 Ryhope Street and the B1522 Ryhope Road route via junction 1. Some of this traffic is travelling via junction 2 and some via junction 10. The traffic is again using this route in the model as an alternative route to the preferred east west route along the RDLR to junction 7.
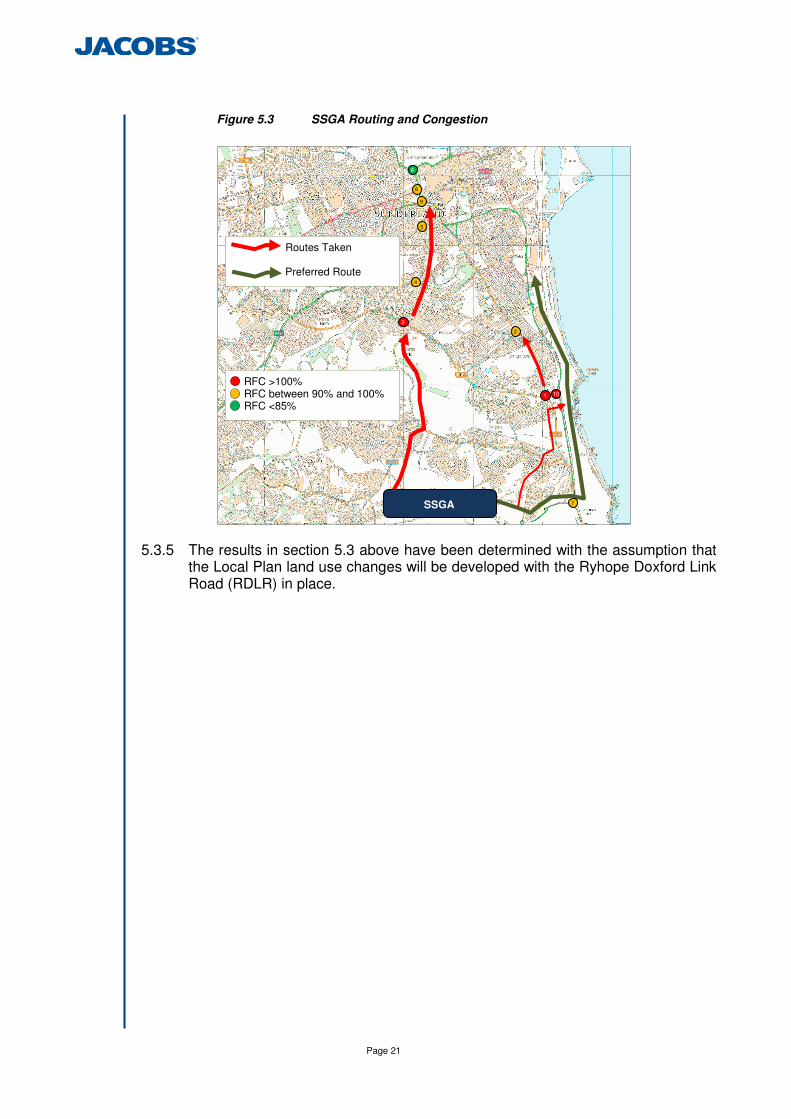
5.3.4 To avoid creating additional congestion at junctions 3, 4, 5, 9 and 6 on the Tunstall route and to avoid additional congestion at junctions 1 and 2 on the Ryhope Road route the preferred routing for the SSGA traffic to and from the centre or east of Sunderland is via the proposed RDLR and the A1018 via junctions 7 and 10. This is shown in Figure 5.3 below.
4
3 2
7
6
1
9
8
5
10
11 12
13
SSGA Sites
Page 21
Figure 5.3 SSGA Routing and Congestion
5.3.5 The results in section 5.3 above have been determined with the assumption that
the Local Plan land use changes will be developed with the Ryhope Doxford Link Road (RDLR) in place.
SSGA
RFC >100% RFC between 90% and 100% RFC <85%
Routes Taken Preferred Route
1
2
3
4
5
6
7
8
9
10
Page 22
5.4 Junction Assessment Results – Without Ryhope Doxford Link Road
Introduction
5.4.1 The results in section 5.3 above have been determined with the assumption that the Local Plan land use changes will be developed with the Ryhope Doxford Link Road (RDLR) in place.
5.4.2 It can be seen in Figure 5.2 that without any junction improvements trips will use the RDLR as well as the parallel Ryhope Street route.
5.4.3 As a sensitivity test the Local Plan development sites have also been modelled without the RDLR in place. This sensitivity test has been undertaken without any junction improvements or mitigation measures in place to alleviate any congestion.
Results
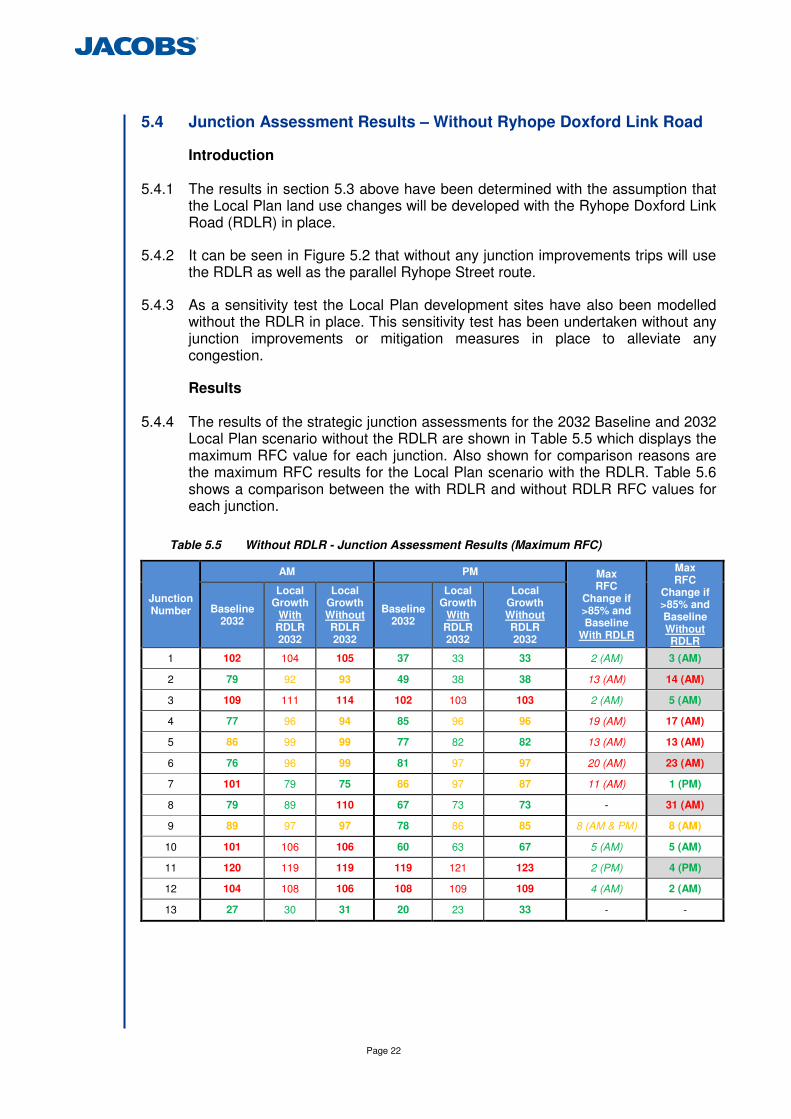
5.4.4 The results of the strategic junction assessments for the 2032 Baseline and 2032 Local Plan scenario without the RDLR are shown in Table 5.5 which displays the maximum RFC value for each junction. Also shown for comparison reasons are the maximum RFC results for the Local Plan scenario with the RDLR. Table 5.6 shows a comparison between the with RDLR and without RDLR RFC values for each junction.
Table 5.5 Without RDLR - Junction Assessment Results (Maximum RFC)
Junction Number
AM PM Max RFC
Change if >85% and Baseline
With RDLR
Max RFC
Change if >85% and Baseline Without RDLR
Baseline 2032
Local Growth
With RDLR 2032
Local Growth Without RDLR 2032
Baseline 2032
Local Growth
With RDLR 2032
Local Growth Without RDLR 2032
1 102 104 105 37 33 33 2 (AM) 3 (AM)
2 79 92 93 49 38 38 13 (AM) 14 (AM)
3 109 111 114 102 103 103 2 (AM) 5 (AM)
4 77 96 94 85 96 96 19 (AM) 17 (AM)
5 86 99 99 77 82 82 13 (AM) 13 (AM)
6 76 96 99 81 97 97 20 (AM) 23 (AM)
7 101 79 75 86 97 87 11 (AM) 1 (PM)
8 79 89 110 67 73 73 - 31 (AM)
9 89 97 97 78 86 85 8 (AM & PM) 8 (AM)
10 101 106 106 60 63 67 5 (AM) 5 (AM)
11 120 119 119 119 121 123 2 (PM) 4 (PM)
12 104 108 106 108 109 109 4 (AM) 2 (AM)
13 27 30 31 20 23 33 - -
Page 23
Table 5.6 Change in Maximum RFC when RDLR Removed
Junction Number
Change in RFC when RDLR is Removed
AM PM
1 1 0 2 1 0 3 3 0 4 -2 0 5 0 0 6 3 0 7 -4 -10 8 21 0 9 0 -1 10 0 4 11 0 2 12 -2 0 13 1 10
5.4.1 The tables show that the change in congestion (RFC) at each of the junctions is
not significant if the RDLR is not modelled. 8 of the junctions have an increase in RFC; these are shaded grey in Table 5.6. The most significant change is the RFC at junction 8 which increases from 89% to 110%.
5.4.2 Without the RDLR more of the SSGA traffic uses the parallel Ryhope Street route to get to and from the A1018 or travel north south on Ryhope Road. This explains why junctions 1 and 2 will experience more congestion and junction 7 less congestion without the RDLR in place.
5.4.3 There will also be more traffic using the Tunstall route which explains why junctions 3, 6 and 8 will experience more congestion.
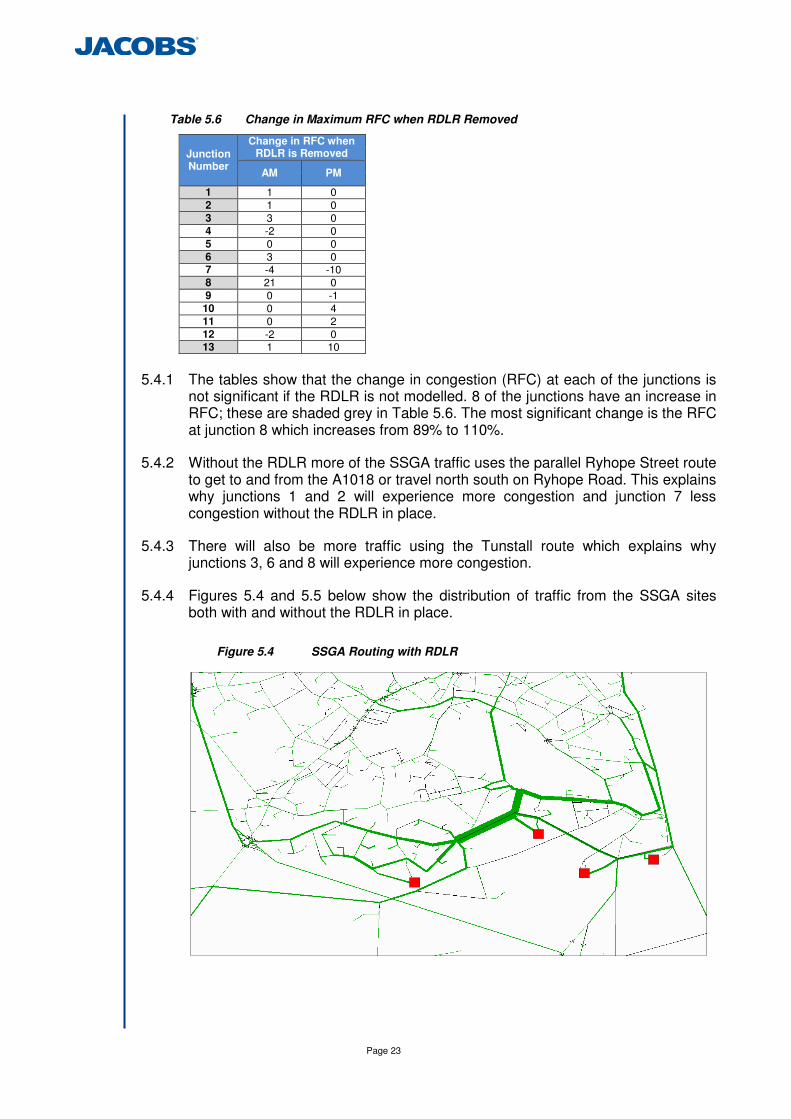
5.4.4 Figures 5.4 and 5.5 below show the distribution of traffic from the SSGA sites both with and without the RDLR in place.
Figure 5.4 SSGA Routing with RDLR

Page 24
Figure 5.5 SSGA Routing without RDLR
5.4.5 In summary this sensitivity test shows that ideally the RDLR should be encouraged to enable traffic from the SSGA sites to access the A1018 without causing any further congestion on the Ryhope Street and Ryhope Road routes and to avoid additional trips from using the Tunstall route.
Page 25
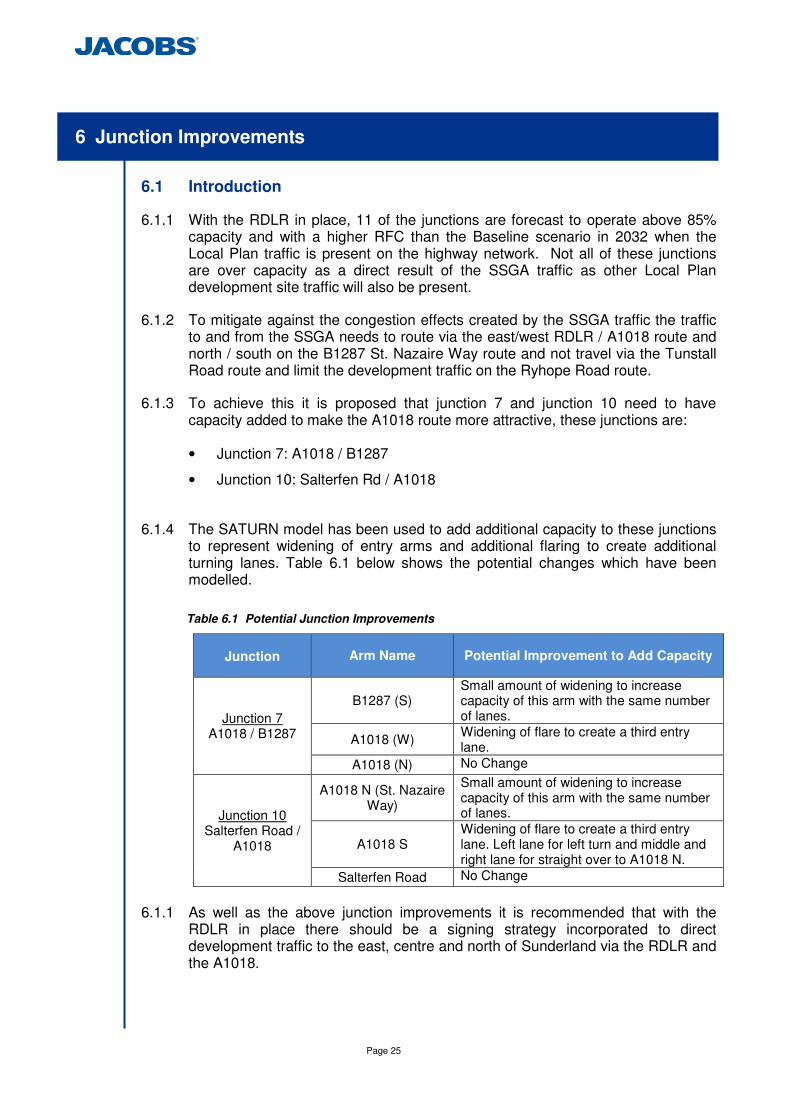
6 Junction Improvements
6.1 Introduction
6.1.1 With the RDLR in place, 11 of the junctions are forecast to operate above 85% capacity and with a higher RFC than the Baseline scenario in 2032 when the Local Plan traffic is present on the highway network. Not all of these junctions are over capacity as a direct result of the SSGA traffic as other Local Plan development site traffic will also be present.
6.1.2 To mitigate against the congestion effects created by the SSGA traffic the traffic to and from the SSGA needs to route via the east/west RDLR / A1018 route and north / south on the B1287 St. Nazaire Way route and not travel via the Tunstall Road route and limit the development traffic on the Ryhope Road route.
6.1.3 To achieve this it is proposed that junction 7 and junction 10 need to have capacity added to make the A1018 route more attractive, these junctions are:
• Junction 7: A1018 / B1287
• Junction 10: Salterfen Rd / A1018
6.1.4 The SATURN model has been used to add additional capacity to these junctions to represent widening of entry arms and additional flaring to create additional turning lanes. Table 6.1 below shows the potential changes which have been modelled.
Table 6.1 Potential Junction Improvements
Junction Arm Name Potential Improvement to Add Capacity
Junction 7 A1018 / B1287
B1287 (S) Small amount of widening to increase capacity of this arm with the same number of lanes.
A1018 (W) Widening of flare to create a third entry lane.
A1018 (N) No Change
Junction 10 Salterfen Road /
A1018
A1018 N (St. Nazaire Way)
Small amount of widening to increase capacity of this arm with the same number of lanes.
A1018 S Widening of flare to create a third entry lane. Left lane for left turn and middle and right lane for straight over to A1018 N.
Salterfen Road No Change
6.1.1 As well as the above junction improvements it is recommended that with the
RDLR in place there should be a signing strategy incorporated to direct development traffic to the east, centre and north of Sunderland via the RDLR and the A1018.

Page 26
6.2 Changes to RFCs with Junction Improvements – with RDLR
6.2.1 Mitigation measures to the junctions listed above are likely to change travel behaviour and as far as possible this has been assessed using the traffic model.
6.2.2 The RFC estimates from this assessment are shown in Table 6.2 and 6.3 for the AM and PM peaks. The baseline results and the results of the junction assessments with no junction improvement are included for comparison.
Table 6.2 Junction Improvement Assessment Results (Maximum RFC) AM Peak – with RDLR
Junction Number
Junction Name
Existing Junction Geometry
With Junction
Improvements
Baseline 2032
Local Growth
2032
Local Growth
2032
1 Ryhope Rd / Toll Bar Rd / Salterfen Rd 102 104 90 (Less than Baseline)
2 Queen Alexandra Rd / Ryhope Rd 79 92 94
3 Essan Way / Tunstall Rd / Leechmere Rd 109 111 109
4 Queen Alexandra Rd / Tunstall Rd 77 96 43 (Less than Baseline)
5 Tunstall Rd / Thronholme Rd / Belvedere Rd 86 99 84 (Less than Baseline)
6 Chester Rd / Green Terrace / St. Michaels Way 76 96 92
7 A1018 / B1287 101 79 87 (Less than Baseline)
8 High St W / Silksworth Row / St Michaels Way 79 89 79 (Same as Baseline)
9 St. Michaels Way / Stockton Rd / Burn Park Rd / New Durham Rd 89 97 89 (Same as Baseline)
10 Salterfen Rd / A1018 101 106 50 (Less than Baseline)
11 Seaton Lane / Lord Byron’s Walk 120 119 120 (Same as Baseline)
12 A19 / A1018 / B1404 104 108 105
13 A690 Stony Gate Junction 27 30 32
Table 6.3 Junction Improvement Assessment Results (Maximum RFC) PM Peak – with RDLR
Junction Number
Junction Name
Existing Junction Geometry
With Junction
Improvements
Baseline 2032
Local Growth
2032
Local Growth
2032
1 Ryhope Rd / Toll Bar Rd / Salterfen Rd 37 33 61
2 Queen Alexandra Rd / Ryhope Rd 49 38 80
3 Essan Way / Tunstall Rd / Leechmere Rd 102 103 99 (Less than Baseline)
4 Queen Alexandra Rd / Tunstall Rd 85 96 33 (Less than Baseline)
5 Tunstall Rd / Thronholme Rd / Belvedere Rd 77 82 84
6 Chester Rd / Green Terrace / St. Michaels Way 81 97 96
7 A1018 / B1287 86 97 92
8 High St W / Silksworth Row / St Michaels Way 67 73 68
9 St. Michaels Way / Stockton Rd / Burn Park Rd / New Durham Rd 78 86 67 (Less than Baseline)
10 Salterfen Rd / A1018 60 63 77
11 Seaton Lane / Lord Byron’s Walk 119 121 123
12 A19 / A1018 / B1404 108 109 109
13 A690 Stony Gate Junction 20 23 61
Page 27
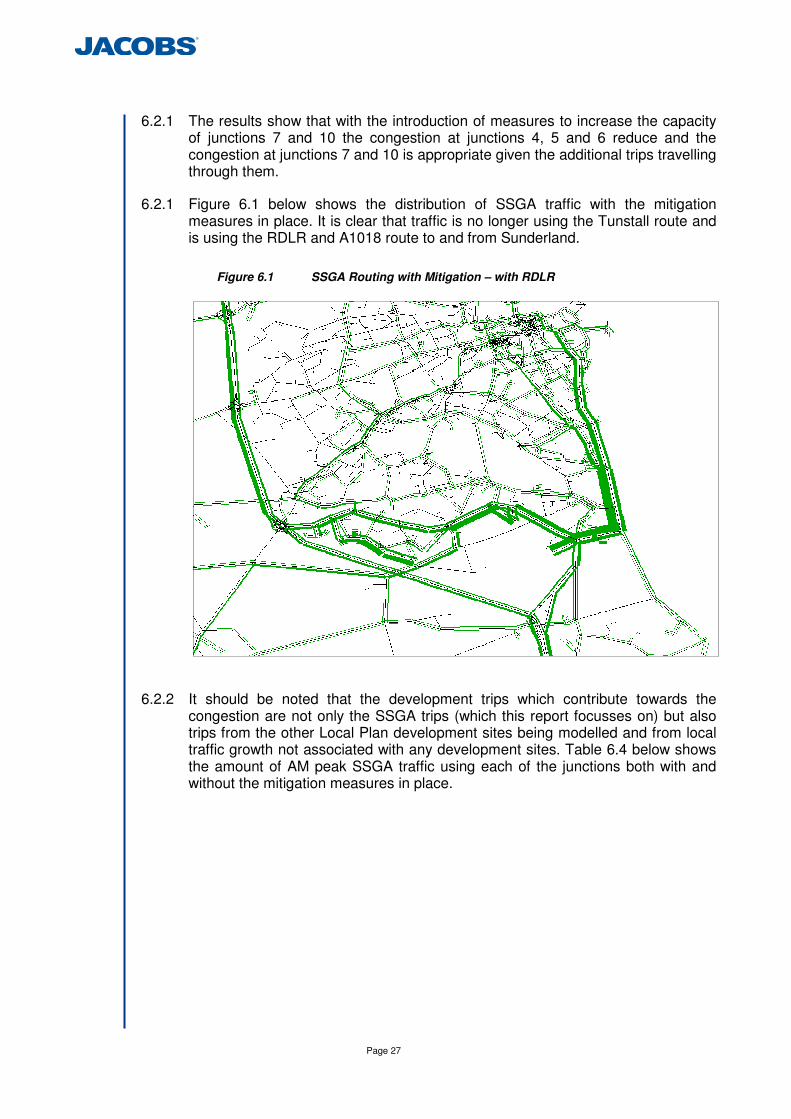
6.2.1 The results show that with the introduction of measures to increase the capacity of junctions 7 and 10 the congestion at junctions 4, 5 and 6 reduce and the congestion at junctions 7 and 10 is appropriate given the additional trips travelling through them.
6.2.1 Figure 6.1 below shows the distribution of SSGA traffic with the mitigation measures in place. It is clear that traffic is no longer using the Tunstall route and is using the RDLR and A1018 route to and from Sunderland.
Figure 6.1 SSGA Routing with Mitigation – with RDLR
6.2.2 It should be noted that the development trips which contribute towards the congestion are not only the SSGA trips (which this report focusses on) but also trips from the other Local Plan development sites being modelled and from local traffic growth not associated with any development sites. Table 6.4 below shows the amount of AM peak SSGA traffic using each of the junctions both with and without the mitigation measures in place.
Page 28
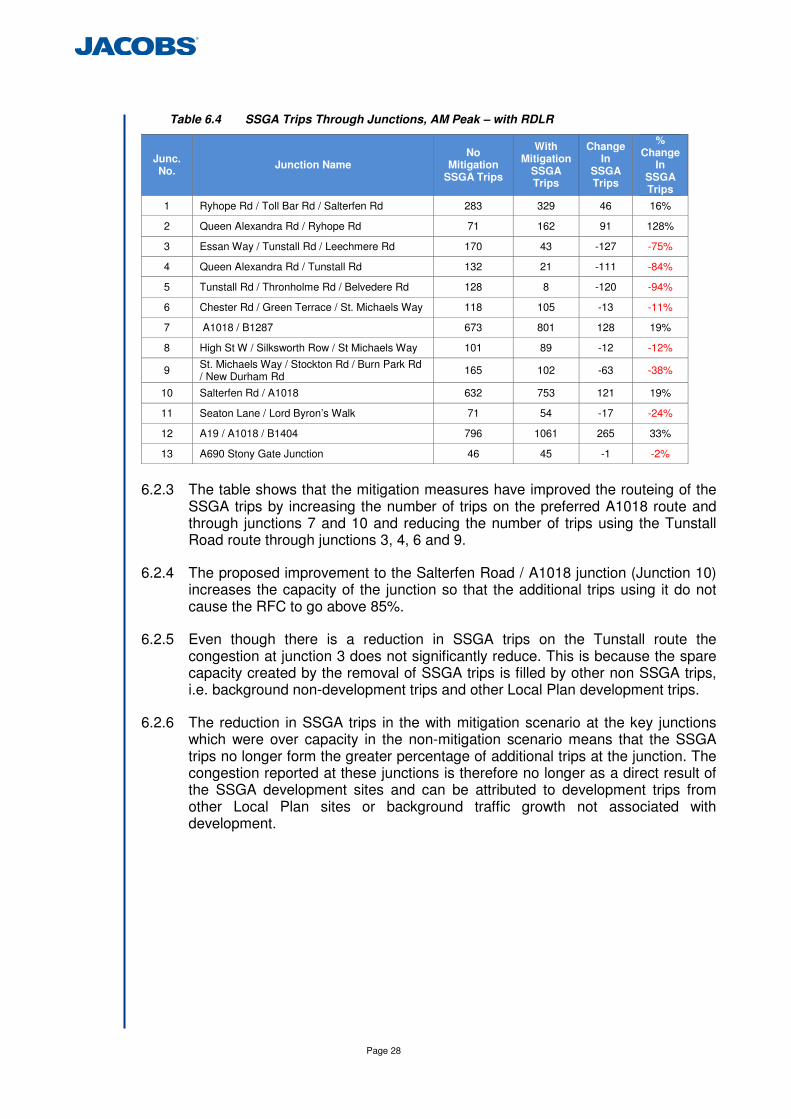
Table 6.4 SSGA Trips Through Junctions, AM Peak – with RDLR
Junc. No.
Junction Name No
Mitigation SSGA Trips
With Mitigation
SSGA Trips
Change In
SSGA Trips
% Change
In SSGA Trips
1 Ryhope Rd / Toll Bar Rd / Salterfen Rd 283 329 46 16%
2 Queen Alexandra Rd / Ryhope Rd 71 162 91 128%
3 Essan Way / Tunstall Rd / Leechmere Rd 170 43 -127 -75%
4 Queen Alexandra Rd / Tunstall Rd 132 21 -111 -84%
5 Tunstall Rd / Thronholme Rd / Belvedere Rd 128 8 -120 -94%
6 Chester Rd / Green Terrace / St. Michaels Way 118 105 -13 -11%
7 A1018 / B1287 673 801 128 19%
8 High St W / Silksworth Row / St Michaels Way 101 89 -12 -12%
9 St. Michaels Way / Stockton Rd / Burn Park Rd / New Durham Rd
165 102 -63 -38%
10 Salterfen Rd / A1018 632 753 121 19%
11 Seaton Lane / Lord Byron’s Walk 71 54 -17 -24%
12 A19 / A1018 / B1404 796 1061 265 33%
13 A690 Stony Gate Junction 46 45 -1 -2%
6.2.3 The table shows that the mitigation measures have improved the routeing of the
SSGA trips by increasing the number of trips on the preferred A1018 route and through junctions 7 and 10 and reducing the number of trips using the Tunstall Road route through junctions 3, 4, 6 and 9.
6.2.4 The proposed improvement to the Salterfen Road / A1018 junction (Junction 10) increases the capacity of the junction so that the additional trips using it do not cause the RFC to go above 85%.
6.2.5 Even though there is a reduction in SSGA trips on the Tunstall route the congestion at junction 3 does not significantly reduce. This is because the spare capacity created by the removal of SSGA trips is filled by other non SSGA trips, i.e. background non-development trips and other Local Plan development trips.
6.2.6 The reduction in SSGA trips in the with mitigation scenario at the key junctions which were over capacity in the non-mitigation scenario means that the SSGA trips no longer form the greater percentage of additional trips at the junction. The congestion reported at these junctions is therefore no longer as a direct result of the SSGA development sites and can be attributed to development trips from other Local Plan sites or background traffic growth not associated with development.
Page 29
6.3 Junction Assessment Results – Without Ryhope Doxford Link Road
Introduction
6.3.1 The results in section 6.2 above have been determined with the assumption that the Local Plan land use changes will be developed with the Ryhope Doxford Link Road (RDLR) in place.
6.3.2 As a further sensitivity test the Local Plan development sites have also been modelled without the RDLR in place but with the proposed junction improvements in place.
Results
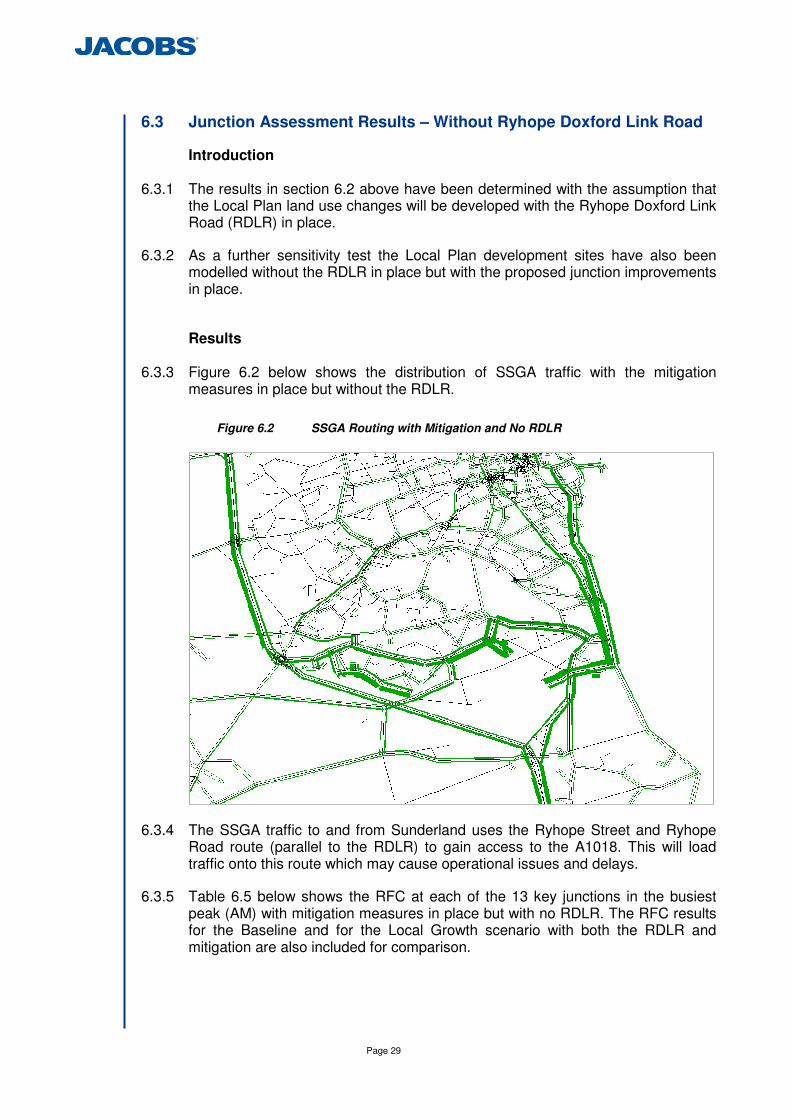
6.3.3 Figure 6.2 below shows the distribution of SSGA traffic with the mitigation measures in place but without the RDLR.
Figure 6.2 SSGA Routing with Mitigation and No RDLR
6.3.4 The SSGA traffic to and from Sunderland uses the Ryhope Street and Ryhope
Road route (parallel to the RDLR) to gain access to the A1018. This will load traffic onto this route which may cause operational issues and delays.
6.3.5 Table 6.5 below shows the RFC at each of the 13 key junctions in the busiest peak (AM) with mitigation measures in place but with no RDLR. The RFC results for the Baseline and for the Local Growth scenario with both the RDLR and mitigation are also included for comparison.

Page 30
Table 6.5 SSGA Trips Through Junctions, AM Peak
Junc. No.
Junction Name
Existing Junction Geometry
With Junction
Improvements
Baseline 2032
Local Growth
With RDLR 2032
Local Growth
With RDLR 2032
Local Growth Without RDLR 2032
1 Ryhope Rd / Toll Bar Rd / Salterfen Rd 102 104 90 (Less than Baseline)
100 (Less than Baseline)
2 Queen Alexandra Rd / Ryhope Rd 79 92 94 94
3 Essan Way / Tunstall Rd / Leechmere Rd 109 111 109 111
4 Queen Alexandra Rd / Tunstall Rd 77 96 43 (Less than Baseline)
44 (Less than Baseline)
5 Tunstall Rd / Thronholme Rd / Belvedere Rd 86 99 84 (Less than Baseline)
84 (Less than Baseline)
6 Chester Rd / Green Terrace / St. Michaels Way 76 96 92 96
7 A1018 / B1287 101 79 87 (Less than Baseline)
80 (Less than Baseline)
8 High St W / Silksworth Row / St Michaels Way 79 89 79 79
9 St. Michaels Way / Stockton Rd / Burn Park Rd / New Durham Rd
89 97 89 90
10 Salterfen Rd / A1018 101 106 50 (Less than Baseline)
41 (Less than Baseline)
11 Seaton Lane / Lord Byron’s Walk 120 119 120 120
12 A19 / A1018 / B1404 104 108 105 105
13 A690 Stony Gate Junction 27 30 32 32
6.3.1 Junctions 1 and 3 will operate above capacity and with a higher RFC than with the RDLR. Junctions 6 and 9 will operate above 85% but below capacity but both will operate with a higher RFC than with the RDLR. These junctions are shaded grey in the table.
6.3.2 The RDLR is a key section of road which is required to distribute the SSGA traffic to and from the A1018 to the immediate east of the development sites. The RDLR is also needed to prevent some traffic from causing some of the key junctions to operate over capacity.
6.3.3 The modelling work shows that the proposed level of development envisaged in the SSGA can be accommodated providing the RDLR is completed in its entirety. This is a fundamental issue as whilst the principle of developer funding has been established for some sections of the road, there is a section that doesn’t directly serve any particular development site in SSGA (and hence more difficult to secure developer funding) but which is critical to ensuring that the transport system facilitates the development.
6.3.4 Sensitivity testing undertaken by modelling the developments without the critical link of the RDLR between Cherry Knowle and the North of Burdon Lane sites shows that unacceptable levels of traffic will result on the B1286 Ryhope Street, within Ryhope village and on the former A1018 route through Grangetown into Sunderland city Centre. In addition the model shows that additional traffic will result around Tunstall Village Green, on Tunstall Hope Road and at junctions along Tunstall Road into the City Centre. In both instances significantly higher levels of congestion will occur at key junctions in adjacent areas of South Sunderland.

Page 31

Page 32
7 Additional Network Assessments
7.1 Introduction
7.1.1 In addition to the assessment of junction capacity a number of further assessments have been undertaken using the traffic model. These are as follows:
• Effect on the Strategic Road Network
• Analysis of Cross Boundary Traffic and Model Sectors
• Travel time and vehicle kilometres in the model network
• Network Utilisation – graphical changes in traffic volumes
• Potential ‘Rat Running’
7.2 Effect on Strategic Road Network
7.2.1 The A19 / A690 Doxford Park Junction is a five arm, grade separated traffic signal controlled roundabout and is located where the A690 passes over the A19. The A690 is a dual carriageway to the west of the junction and is a single carriageway passing through an urban area to the east of the junction. The fifth arm is the City Way dual carriageway serving the Doxford International Business Park and connecting into the RDLR serving the SSGA. Access to and from the A19 is via standard merge and diverge taper arrangements.
7.2.2 The existing junction experiences significant traffic demands and therefore congestion occurs during the peak hours.
7.2.3 The total trips entering the junction in the AM peak in 2032 is expected to be between 2,500 and 4,500 trips. The distribution of the SSGA trips shows that there will be 135 trips (8% of all SSGA trips) to and from the SSGA via the B1286 which will use the junction in the AM peak. This equates to between 4% and 7% of the total trip demand at the junction and 7% of the total trip demand on the Doxford Park arm of the junction.
7.2.4 29 of the 135 trips are to or from the Chapelgarth site, 98 are from the Land North of Burdon Lane site and 8 from the Cherry Knowle and Willow Farm sites. These trips are longer distance trips using the A19 to gain access to North Tyneside, the West or the south.
7.2.5 The relatively low proportion of SSGA trip demand at the junction means the proposed SSGA development will have minimal detrimental impact at the junction and will cause relatively minimal increases in congestion.
Page 33
7.1 Analysis of Cross-Boundary and Sectorised Traffic
7.1.1 The sectorisation of the development traffic allows the origins and destinations of the SSGA trips to be designated by sectors or areas within the traffic model. Table 7.1 shows where the SSGA trips are travelling to and from both in terms of absolute numbers and by proportion.
Table 7.1 Development Trip Sectorisation – AM Peak
Sector Trips From SSGA
Proportion Trips
to SSGA
Proportion
South Tyneside 13 1% 36 2%
Hetton-Le-Hole 0 0% 0 0%
Houghton-Le-Spring 1 0.1% 4 0.3%
Easington 23 1% 65 4%
Gateshead 1 0.0% 2 0.1%
Rural Areas 1 0.1% 4 0.2%
Washington 11 1% 31 2%
Chester-le-Street 0 0% 0 0%
Tyne & Wear 49 3% 150 9%
Durham 15 1% 42 3%
Sunderland 1512 93% 1290 79%
7.1.2 As expected the majority of the SSGA trips are travelling within the area of Sunderland. There are a number of employment sites within the Local Plan developments which will act as attractors for the SSGA traffic.
7.1.3 The analysis of cross-boundary traffic reviews the volume of SSGA traffic which has an origin or destination outside of the Sunderland City boundary or sector. This has been calculated using the AM peak traffic model and compared against the cross boundary traffic which will be present in the Baseline (i.e. no Local Plan)
7.1.4 The analysis of the cross-boundary traffic is presented in Table 7.2. These values have been calculated using the AM peak traffic model.
Page 34
Table 7.2 AM Peak Cross-Boundary Traffic from AM Peak Traffic Model
Location
SSGA Trips Baseline New Cross Boundary Trips
as a % of Baseline
Trips from SSGA
Trips to
SSGA
Total SSGA Trips
Trips from
Sunderland
Trips to
Sunderland Total
Trips from
SSGA
Trips to
SSGA
Total SSGA Trips
South Tyneside 13 36 49 2613 3756 6369 0.5% 1.0% 0.8%
Hetton-Le-Hole 0 0 0 30 64 94 0.1% 0.1% 0.1%
Houghton-Le-Spring 1 4 6 915 1530 2445 0.2% 0.3% 0.2%
Easington 23 65 88 702 1137 1839 3.2% 5.7% 4.8%
Gateshead 1 2 2 278 346 624 0.2% 0.5% 0.4%
Rural Areas 1 4 5 408 349 758 0.3% 1.1% 0.7%
Washington 11 31 42 1673 3513 5186 0.7% 0.9% 0.8%
Chester-le-Street 0 0 0 50 54 103 0.2% 0.6% 0.4%
Tyne & Wear 49 150 199 2411 3047 5457 2.0% 4.9% 3.6%
Durham 15 42 57 6209 4459 10669 0.2% 0.9% 0.5%
7.1.5 The results show that of the 1,625 trips generated by the SSGA, 9% of these new
development trips in the AM peak have an origin or destination outside of Sunderland.
7.1.6 The change in cross boundary movements when compared to the Baseline is therefore minimal and traffic generated from the SSGA should therefore not have any detrimental effect on the highway network within neighbouring authorities or regions.
7.1.7 Easington and Tyne and Wear see the greatest increase in trips, with a total increase of 4.8% and 3.6% respectively of trips travelling to or from the SSGA development sites when compared to the Baseline. These results show that the change in cross boundary travel as a result of the development is minimal.
7.2 Travel Time, Distance and Speed on the Network
7.2.1 The AM peak (busiest peak) traffic model has been used to establish network wide statistics to determine the changes in travel time, travel distance and average speed without the Local Plan development trips (Baseline), with the Local Plan development trips but with no junction improvements and with the Local Plan development with junction improvements.
7.2.2 Table 7.3 below shows the model statistics and the difference between the scenarios.
Table 7.3 AM Network Statistics
Scenario Travel Time
veh-hrs Travel Distance
veh-km Average Speed
mph
Baseline 20,374 817,912 25
Local Plan - No Mitigation 22,787 860,641 38
Local Plan - With Mitigation 23,243 866,638 37
Additional due to Local Plan Trips 2,413 42,729 13
Saving Due to Mitigation -456 -5997 -1

Page 35
7.2.3 The results show that the additional Local Plan development trips increase the
travel time on the network by over 2,400 hours and the distance travelled by over 42,000 km. The number of additional trips on the network as a result of Local Plan development is just under 6,000 trips. The additional time and distance on the network is therefore minimal as it equates to about 24 minutes per additional trip and 7km per additional trip which are practical and reasonable commuting times and distances.
7.2.4 The junction improvements described in the previous section of this report to minimise local junction congestion and rat running will increase the total travel time and distance on the network by 456 veh-hours and 5,997 veh-km. This is because traffic is using the longer but more desirable RDLR / A1018 route. There is no noticeable effect on the average speed on the network as a result of the mitigation.

Page 36
7.3 Network Utilisation
7.3.1 The traffic model can be used to graphically compare the flows in two different scenarios. This allows the utilisation of links on the highway network to be viewed and compared. Figure 7.1 below shows the difference between the Local Plan Scenario with no junction improvements modelled and the Baseline scenario. The blue lines show where the flow in the local plan scenario is lower than the Baseline and the green lines show where the flow is higher.
Figure 7.1 Diff between Local Plan (No Improvements) and Baseline Scenarios
7.3.2 The difference plot in Figure 7.1 shows that the network has a general increase in flow and how the Tunstall Hills and Tunstall Road route is being used by the additional development traffic with only minimal increases in flow on the preferred A1018 route.
7.3.3 Figure 7.2 below shows the difference between the Local Plan Scenario with no junction improvements modelled and the Local Plan Scenario with junction improvements.
7.3.4 The results in Figure 7.2 show that the trips on the Tunstall Hills route reduce (blue lines) and the trips on the preferred A1018 route increase (green lines). This is as described in Section 6 of this report.
Tunstall
Hills
SSGA
A1018 St. Nazaire
Way A19
River Wear
Doxford Pk

Page 37
Figure 7.2 Diff between Local Plan (No Improvements) and Local Plan (with Improvements)
Tunstall
Hills
SSGA
A1018 St. Nazaire
Way
A19
River Wear
Doxford Pk

Page 38
7.4 Potential Rat Running
7.4.1 As a result of the additional Local Plan traffic on the network it is likely that there will be some trips which will use the Burdon Lane route to gain access to the south and to get to and from the Stony Gate junction between Burdon Lane and the A690.
7.4.2 An assessment has been undertaken to establish the magnitude of this traffic in the busiest peak which is the AM peak. This has been undertaken by comparing the flow on Burdon Lane in the Baseline with the Local Plan scenario with improvement measures. A further assessment has also been undertaken to determine the amount of traffic on Burdon Lane which has an origin or destination within the SSGA development sites.
7.4.3 Table 7.4 shows the results of this assessment.
Model West Of Burdon Road
Trips West of Hangmans Lane
Trips
Baseline 552 740
Local Plan 681 910
SSGA Trips 141 108
7.4.1 As a result of the Local Plan traffic there will be 129 additional trips on the section
of Burdon Lane just west of Burdon Road and there will be 170 additional trips between Hangmans Lane and Stony Gate.
7.4.2 As a result of the additional trips on these roads some of the non-development traffic no longer uses the route. This explains why the SSGA trips on the roads are actually higher than the difference between the baseline and the Local Plan. The additional trips due to the SSGA site make up all of the additional trips on the route.
7.4.3 This level of ‘rat running’ trips equates to an increase of 23% but as the magnitude of the additional trips is low it is not expected to cause any detrimental impact. This is shown by the congestion results for the Stony Gate junction.
7.4.4 The 108 SSGA trips rat running on Burdon Lane to/from Stony Gate are split 50/50 at Stony Gate. 50% of the 108 trips are to/from the Houghton Le Spring direction south on the A690 and 50% are to/from the west in the Philadelphia direction.
Page 39
8 Summary
8.1 Background Summary
8.1.1 In order to establish the transport infrastructure requirements to enable the development of the Sunderland South Growth Area (SSGA) Jacobs were commissioned to update and expand the existing Sunderland Highway Improvement Model (SHIM). This was intended to provide evidence on the prospective future impacts of the SSGA on the local transport network and on the adjacent strategic and local roads.
8.1.2 The SSGA is identified as being the main location to accommodate significant housing growth in the City to 2030. Some 3,500 new dwellings are proposed over the plan period which represents over half of the city’s overall housing requirement through development of sites at Chapelgarth, North of Burdon Lane, Cherry Knowle and South Ryhope.
8.1.3 Due to the scale of development proposed, it would be preferable to bring these sites forward in a coordinated and comprehensive manner and the transport modelling work documented in this report is intended to inform this strategic approach by examining the future impacts on the transport network.
8.1.4 The reasons for commissioning the modelling work are as follows:
• Full consideration of impacts of changes to population and housing growth within Sunderland arising from analysis of the 2011 Census data and updates to the local SHLAA and SHMAA reports;
• Examination of the phasing of key infrastructure improvements – particularly the Ryhope-Doxford Link Road – to meet the City’s needs for enhanced connectivity to support and deliver economic and housing growth;
• Identification of any other major constraints on the local roads network as a result of local growth proposals and assessment of improvement/mitigation opportunities;
• Identification of constraints on the Highways Agency (A19) Trunk roads network as a result of local growth proposals and assessment of improvement/mitigation opportunities e.g. improvement of the A1018 /A19 junction;
• Exploring the scope for sustainable transport interventions as part of the transport interventions that support;
• Ensuring that the outcomes of the transport assessments demonstrate how transport infrastructure improvements contribute to delivery of the Local Plan’s core objectives; and
• Providing a transport evidence base to contribute to on-going development of a robust developer contributions funding mechanism to support delivery of the Local Plan.
8.1.5 In addition it could also potentially help in any decisions relating to how best to
phase the release of development sites if appropriate; what sites could be released without improvements; and ‘trigger’ points at which it becomes critical to provide key improvements to the highway infrastructure.
Page 40
8.1.6 The modelling work will feed into the Infrastructure Delivery Study (IDS) to help inform the preparation and completion of the South Sunderland Growth Area (SSGA) Supplementary Planning Document (SPD). This will enable the Council to ensure that planning obligations are proportionate and reasonable in accordance with the NPPF. The IDS will test the viability of development set out in the draft SPD, and establish a robust approach to establishing a tariff or alternative to deliver the full package of infrastructure requirements, including education, community facilities, public realm, public open space and play space, utilities, public transport, highways, employment and training.
8.2 Results Summary
8.2.1 The model takes into account forecast increases in car usage up to 2032 and the likely growth in traffic from those planning permissions likely to be built after 2009. Trip rates applied to these developments were agreed in consultation with those consultants acting for the developers to ensure that the model and any future Transportation Assessments relating SSGA sites are using consistent assumptions.
8.2.2 The modelling work shows that the proposed level of development envisaged in the SSGA can be accommodated providing the RDLR is completed in its entirety. This is a fundamental issue as whilst the principle of developer funding has been established for some sections of the road, there is a section that doesn’t directly serve any particular development site in SSGA (and hence more difficult to secure developer funding) but which is critical to ensuring that the transport system facilitates the development.
8.2.3 Sensitivity testing undertaken by modelling the developments without the critical link of the RDLR between Cherry Knowle and the North of Burdon Lane sites shows that unacceptable levels of traffic will result on the B1286 Ryhope Street, within Ryhope village and on the former A1018 route through Grangetown into Sunderland city Centre. In addition the model shows that additional traffic will result around Tunstall Village Green, on Tunstall Hope Road and at junctions along Tunstall Road into the City Centre. In both instances significantly higher levels of congestion will occur at key junctions in adjacent areas of South Sunderland.
8.2.4 A significant output from the model is an assessment of SSGA sites on 13 key junctions across the local highway network. This assessment, which assumes that RDLR is provided throughout highlighted that without improvement 6 of these junctions would operate over capacity as a result of the estimated traffic flow in 2032. These junctions are listed below:
• Ryhope Road/Toll Bar Road/Salterfen Road
• Essen Way/Leechmere Road/Tunstall Road
• A1018 St Nazaire Way/B1287 Seaham Road
• A1018 St Nazaire Way/Salterfen Road
• Seaton Lane/Lord Byron’s Walk (in County Durham)
• A19/A1018/B1404 Seaton Intersection (in County Durham, Trunk Road Junction)

Page 41
8.2.5 Mitigation measures are suggested for two of these junctions within Sunderland:
Junction Arm Name Suggested Improvement
A1018 St Nazaire Way / B1287 Seaham Road
B1287 (S)
Small amount of widening to increase capacity of this arm with the same number of lanes.
A1018 (W)
Widening of flare to create a third entry lane.
A1018 (N No Change
A1018 St Nazaire Way/Salterfen Road
A1018 N
Small amount of widening to increase capacity of this arm with the same number of lanes.
A1018 S
Widening of flare to create a third entry lane. Left lane for left turn and middle and right lane for straight over to A1018 N.
Salterfen Road No Change
Junction Arm Name Potential Improvement to Add Capacity
8.2.6 The other three junctions within Sunderland are on routes on which additional traffic should not be encouraged through improvement measures. Mitigation should include signage to encourage SSGA traffic to use the preferred route via the A1018.
8.2.7 It will be necessary to share the results of the modelling with the Durham County Council and the Highways Agency in order to identify the improvement and mitigation measures necessary to accommodate additional traffic resulting from SSGA at these two junctions.
8.2.8 The model was also used to assess the impact of increased traffic on the western section of Burdon Lane where ‘rat running’ occurs at present and changes to cross boundary traffic on the wider highway network. This found that there were some additional trips on Burdon Lane but these were offset by some non SSGA traffic transferring to other routes. The additional traffic was split evenly between the Stoneygate junction and the B1404 towards Houghton le Spring. In relation to cross boundary travel, Easington (Durham County) and Tyne and Wear saw the largest increase in trips resulting from SSGA at 4.8% and 3.6% respectively compared to the baseline. This can be regarded as fairly minimal.
8.2.9 An assessment of the impact of SSGA traffic on the A19 found that due to the relatively low level of SSGA traffic using the Trunk Road the need for mitigation on the A19 is likely to be minimal.

Page 42
8.3 Conclusion
8.3.1 The modelling work undertaken on the impact of the SSGA traffic shows that the proposed level of development can be accommodated within Sunderland if junction improvement measures are implemented and the RDLR is provided. Work to date on the necessary changes to 2 key junctions on the network indicates that improvements to the traffic flows at these junctions can be made.

Page 1
Appendix A Trip Rates Summary Table
Land Use Land Use Code Direction Avg 85th% Avg 85th% Avg 85th%
Arrival 2.559 - 3.065 - 2.558 -
Departure 2.100 - 2.060 - 1.967 -
Arrival - - 4.390 - 4.424 -
Departure - - 3.963 - 4.097 -
2A Arrival 0.845 - 1.341 - 1.465 -
Departure 0.132 - 0.359 - 0.144 -
Arrival - - 0.379 - 0.335 -
Departure - - 0.049 - 0.075 -
2D Arrival - - 0.382 - 0.514 0.921
Departure - - 0.176 - 0.234 0.553
Arrival - - 0.144 - 0.080 -
Departure - - 0.079 - 0.043 -
Arrival - - 4.291 - 3.476 -
Departure - - 3.024 - 1.857 -
Arrival - - 3.201 - 6.427 -
Departure - - 3.078 - 4.982 -
Arrival - - 7.264 - 9.677 -
Departure - - 7.292 - 9.477 -
Arrival - - 0.163 0.287 0.151 0.231
Departure - - 0.403 0.569 0.436 0.523
Arrival - - 1.291 - - -
Departure - - 0.882 - - -Discount Food Store 1C
2F
Industrial Estate
1A
Shopping Centre- Local Shops
Sunderland Local Plan - Trips Rates
AM Peak (0800-0900hrs) - All Vehicles Urban Centre Suburban Edge of Urban
Industrial Unit 2C
Food Superstore
Houses 3A
Petrol Filling Station- with retail 13B
1I
Education- Nursey 4D
Employment- Office
Education- Primary 4A
Warehousing (Commercial)
Land Use Land Use Code Direction Avg 85th% Avg 85th% Avg 85th%
Arrival 4.700 - 5.419 - 5.029 -
Departure 5.088 - 5.646 - 5.185 -
Arrival - - 5.021 - 4.916 -
Departure - - 4.974 - 4.547 -
2A Arrival 0.123 - 0.239 - 0.084 -
Departure 0.792 - 1.145 - 1.194 -
Arrival - - 0.053 - 0.036 -
Departure - - 0.440 - 0.265 -
2D Arrival - - 0.113 - 0.115 0.291
Departure - - 0.323 - 0.445 0.879
Arrival 0.150 - 0.065 - 0.029 -
Departure 0.215 - 0.131 - 0.080 -
Arrival - - 0.467 - 0.084 -
Departure - - 0.681 - 0.251 -
Arrival - - 2.400 - 4.334 -
Departure - - 2.626 - 4.776 -
Arrival - - 7.542 - 8.600 -
Departure - - 7.542 - 8.800 -
Arrival - - 0.374 0.545 0.422 0.478
Departure - - 0.236 0.333 0.232 0.314
Arrival - - 2.983 - - -
Departure - - 3.611 - - -Discount Food Store 1C
1I
Education- Primary
Education- Nursey
Houses C3
Industrial Estate
Petrol Filling Station- with retail
4D
Sunderland Local Plan - Trips Rates
PM Peak (1700-1800hrs) - All Vehicles Urban Centre Suburban Edge of Urban
Shopping Centre- Local Shops
1AFood Superstore
Industrial Unit 2C
Employment- Office
13B
Warehousing (Commercial) 2F
4A