Embed Size (px)
Citation preview
Commercial in Confidence
Sunderland Local Plan Initial Assessment of Transport Impacts April 2017

Sunderland Local Plan April 2017
Commercial in Confidence
Quality Management
Quality Management
Job No CS/086329
Project Sunderland Local Plan
Location City of Sunderland
Title Initial Assessment of Transport Impacts
Document Ref SLP-CAP-TPL-XX-RP-1001 Issue / Revision P04
File reference \\CSLNTCMU01\Data\Projects\Transport schemes\Sunderland Local Plan\03
Delivery\TPL TransportPlanning\04 Reports\4th Revision - SCC Changes,
FINAL\SLP-CAP-TPL-XX-RP-Y-1001_Draft version GB ed 19-07-17.docx
Date April 2017
Prepared by 1 Jolanta Otwinowska Signature (for file)
Prepared by 2 Faye Styles
Signature (for file)
Checked by Stuart Clarke Signature (for file)
Authorised by Stuart Clarke Signature (for file)
Revision Status / History
Rev Date Issue / Purpose/ Comment Prepared Checked Authorised
P01 March 17 Draft JO & CZ FS SC
P02 March 17 Draft JO & CZ SC SC
P03 April 17 Draft AF & FS SC SC
P04 April 17 Final Draft FS SC SC
Sunderland Local Plan April 2017
Commercial in Confidence
Contents
i
Contents 1. Background 1
1.1 Sunderland Local Plan 1 1.2 Transportation Assessment of the Emerging Local Plan 2 1.3 Purpose & Report Structure 3
2. Local Plan Development Sites 4
2.1 Residential Sites 4 2.2 Employment Sites 4
3. Traffic Modelling 5
3.1 SSTC Strategic SATURN Model 5 3.2 Local Plan SATURN Model 6 3.3 Forecasting the Future Year 6 3.4 Settlement Based Assessment – Gravity Model 7
4. Modelling Development Scenarios 9
4.1 Trip Generation 9 4.2 Modelling Scenarios 9 4.3 Trip Distribution 10 4.4 Traffic Growth 11 4.5 Forecast Traffic Demand 11
5. Local Plan Trip Generation Methodology 13
5.1 Strategic Housing Land Availability Assessment 13 5.2 Local Plan Residential Sites 13 5.3 Employment Land Review 17 5.4 Local Plan Employment Sites 17
6. Modelling Outputs & Impacted Junctions 20
6.1 Ratio of Flow to Capacity 20 6.2 RFC SATURN Node Results 20 6.3 RFC SATURN Junction Results 27 6.4 RFC SATURN Junction Results for the AM Peak 27 6.5 RFC SATURN Junction Results for the PM Peak 30 6.6 Impacted junctions 33
7. High-Level Highway Mitigation 36
7.1 Introduction 36 7.2 Geographical Locations Requiring Highway Mitigation 36 7.3 Potential Major Highway Mitigation 36 7.4 NECA Pipeline Schemes 38 7.5 NECA Pipeline Schemes & Local Plan Modelling Results 39 7.6 IAMP Committed Highway Improvements 40 7.7 Highways England 41
8. Public Transport Accessibility 42
8.1 Metro Services 42 8.2 Bus Services 43 8.3 Public Transport Accessibility Assessment Framework 45 8.4 Ranked Public Transport Accessibility for Local Plan Sites 45 8.5 Public Transport Accessibility Grading Criteria 46
Sunderland Local Plan April 2017
Commercial in Confidence
Contents
ii
8.6 Potential Public Transport Accessibility Improvements 49
9. Cycling & Walking Accessibility 51
9.1 Introduction 51 9.2 Cycling & Walking Acceptable Distances 51 9.3 Existing Cycling & Walking Network 51 9.4 Cycling & Walking Accessibility Assessment Framework 53 9.5 Ranked Cycle & Walking Accessibility for the Local Plan Sites 53 9.6 Potential Accessibility Improvements 54
10. Conclusions 56
10.1 Traffic Modelling & Traffic Impact 56 10.2 Smarter Choices & Sustainable Travel 57
Figures Figure 1 SATURN Trip Rate Methodology for Residential Sites 15 Figure 2 Trips Generated by the Local Plan Residential Sites 16 Figure 3 SATURN Trip Rate Methodology for Employment Sites 19 Figure 4 Metro Accessibility for Residential Sites 47 Figure 5 Bus Stop Accessibility for Residential Sites 48 Figure 6 Bus Service Frequency for Residential Sites 48
Tables Table 1 Phase 0 Trip Generation 10 Table 2 Phase 1 Trip Generation 10 Table 3 Phase 2 Trip Generation 10 Table 4 Phase 3 Trip Generation 10 Table 5 Trip Rate Reduction Factors 14 Table 6 Trip Rates for B1 Use Class 17 Table 7 Trip Rates for B2 Use Class 17 Table 8 Trip Rates for B6 Class 18 Table 9 Relationship: Inbound and Outbound Trips for the AM & PM Peaks 18 Table 10 Percentage of Jobs Deliverable during the Local Plan Periods 18 Table 11 Ratio of Flow to Capacity (RFC) Results for the Modelled
Network 21 Table 12 RFCs for Junctions with Capacity Issues during Phase 0 for the
AM Peak 27 Table 13 RFCs for Junctions with Capacity Issues during Phase 1 for the
AM Peak 29 Table 14 RFCs for Junctions with Capacity Issues during Phase 2 for the
AM Peak 29 Table 15 RFCs for Junctions with Capacity Issues during Phase 3 for the
AM Peak 30 Table 16 RFCs for Junctions with Capacity Issues during Phase 0 for the
PM Peak 30 Table 17 RFCs for Junctions with Capacity Issues during Phase 1 for the
PM Peak 31
Sunderland Local Plan April 2017
Commercial in Confidence
Contents
iii
Table 18 RFCs for Junctions with Capacity Issues during Phase 2 for the
PM Peak 32 Table 19 RFCs for Junctions with Capacity Issues during Phase 3 for the
PM Peak 33 Table 20 Junctions Reaching Capacity during the AM & PM Peaks 33 Table 21 Potential Major Highway Mitigation for Impacted Junctions 36 Table 22 NECA Schemes & Local Plan Junctions with Forecasted
Capacity Issues 39 Table 23 Sunderland Metro Stations’ Facilities 42 Table 24 Bus Services & Frequencies in the Study Area 44 Table 25 Public Transport Accessibility Grading Criteria 45 Table 26 Public Transport Accessibility Grading Volumes for the Local
Plan Sub-areas 46 Table 27 Metro Accessibility by Sub-area 46 Table 28 Cycling & Walking Accessibility Grading Criteria 53 Table 29 Cycling Accessibility Grading Volumes for the Local Plan Sub-
areas 53
Appendices Appendix A SHLAA & Housing Release Sites
Appendix B Employment Sites
Appendix C Local Plan Residential & Employment Sites Trip Generation
Appendix D Census Mode Share Devised Vehicular Trip Rates
Appendix E RFC SATURN Modelling Results for all of the Local Plan Delivery Phases
Appendix F Modelled Network Junction Reference Numbers
Appendix G NECA Pipeline Highway Schemes
Appendix H Existing Bus Services & Connections
Appendix I Public Transport Accessibility Ranking Results
Appendix J Identified Bus Service Improvements
Appendix K Sunderland Cycling Map
Appendix L Cycling & Walking Accessibility Ranking Results
Appendix M Identified Improvements to the Cycling Network
Appendix N Minor Highway Mitigation Works
Sunderland Local Plan April 2017
Commercial in Confidence
1/ Background
1
1. Background
1.1 Sunderland Local Plan
1.1.1 Sunderland City Council (SCC) is progressing the preparation of their Local Plan which will set out the long-term vision for development in Sunderland and define the strategic policies to shape spatial and economic development in the city up to 2033.
1.1.2 The Sunderland Local Plan aims to establish a policy framework that guides and shapes development, but is not seen as prescriptive. It will set the parameters for this to be achieved and will encourage and support development in coming forward. It will ensure that Sunderland is a city that is open for business and growth: providing jobs and prosperity for local people; delivering housing to meet the needs and aspirations of all of our communities; and tackling health inequalities and deprivation within the city, whilst protecting the city’s important natural and historic environmental assets.
1.1.3 Sunderland’s Local Plan is being prepared in the following three parts:
• Part One - Core Strategy & Development Plan (CSDP): which will set out an overarching strategy for future change and growth in Sunderland and include detailed development management policies. It is a strategic plan which covers the period 2015 to 2033. The CSDP will cover the whole of the area within Sunderland’s administrative boundaries.
Once adopted, the CSDP will become part of Sunderland’s statutory planning framework; guiding decisions on all development and regeneration activity over the period to 2033. The CSDP will replace some of the saved policies of the Sunderland Unitary Development Plan (UDP) 1998 and UDP Alteration No.2 (2007) which covers the Central Sunderland area. Some saved policies will continue to be used in the determination of planning applications until such time that they are replaced by the Local Plan Part 2: Allocations and Designations Plan.
• Part Two - Allocations & Designations Plan: which will set out site-specific policies for development, protection, and conservation of land in Sunderland in order to deliver the overall strategy set out within the CSDP.
• Part Three - International Advanced Manufacturing Park (IAMP) Area Action Plan (AAP) 2017-2037: which will set out site specific policies for delivery of a large advanced manufacturing park on land to the north of the existing Nissan car manufacturing plant. SCC is working jointly with South Tyneside Council on the preparation of the AAP, as the cross-boundary site is located within the administrative areas of both authorities. Planning applications within the AAP boundary will be primarily assessed against the policies within the IAMP AAP. However, where there are no specific relevant policies contained within the AAP, policies within the CSDP will apply.
1.1.4 Sunderland’s growth aspirations up to 2033 will inevitably place pressures on the city’s strategic transport network in particular the highway network of trunk roads and other major roads. These pressures need to be managed and planned for as an integral part of SCC’s Local Plan. The Local Plan will, therefore, draw on a wide range of strategic policies including housing provision, the economy, transport, and the environment to deliver a ‘spatial plan’ of integrated policies that encompass all aspects of planning for Sunderland’s growth.
Sunderland Local Plan April 2017
Commercial in Confidence
1/ Background
2
1.1.5 As part of the Local Plan preparation, SCC has commissioned Capita to undertake a transportation assessment of the emerging CSDP strategic residential and employment sites to appraise the suitability of the local highway impacted by the traffic generated by the Local Plan proposals. The assessment report will be used to provide an evidence base to support the transport policies in the Local Plan.
1.2 Transportation Assessment of the Emerging Local Plan
1.2.1 The purpose of the transportation assessment is to guide the emerging Local Plan and the supporting Infrastructure Delivery Plan (IDP). The main requirements of the transportation assessment are to assess the suitability of the local highway network impacted by the Local Plan strategic sites and identify potential network improvements to enable the delivery of Sunderland’s Local Plan.
1.2.2 There are two key elements in delivering this. Firstly, traffic modelling utilising an existing highway assignment model (SATURN) supported by a discrete settlement based model (gravity model), and secondly a Smarter Choices Assessment to review sustainable development accessibility and the identification of sustainable transport improvements.
1.2.3 To achieve this, the scope of works includes the following:
• An assessment of traffic flows generated by the Local Plan sites and the impact on the road network, especially proposed development site allocations;
• Development of a strategic traffic model which is appropriate to understand the overall impact the Local Plan sites will have on the highway network, as well as an understanding of the localised impacts of the strategic sites. The model is required to cover the full geographical extents of the Core Strategy, incorporate significant planned and committed highway infrastructure proposals, and must originate from a fully calibrated and validated SATURN model (to WebTAG standards), evidence for which is provided in a Local Model Validation Report (LMVR) which is available on request due to the size of the document;
• Scenario testing to be based at 5-yearly intervals throughout the plan period;
• An brief assessment of where and when future travel patterns will trigger the need for capacity improvements at particular junctions;
• An examination of high, medium, and low growth assumptions based on a review of existing strategy, demographic, and economic trends, and mobility and accessibility trends extrapolated into the future; and
• Consideration of the scope for Smarter Choices and sustainable travel, including existing public transport and cycling connections and the identification of high level gaps in transport provision between the large Local Plan sites that are likely to generate and attract large volumes of people.
1.2.4 The transportation assessment has built upon recent transport modelling work using SATURN that was undertaken in developing the major scheme business case for the Sunderland Strategic Transport Corridor scheme (SSTC).
1.2.5 The Sunderland SATURN model has been amended and used to test the Local Plan strategic sites up to 2033, to determine the traffic impacts of the preferred site allocations.
1.2.6 The results of the modelling work has been used to recommend potential highway infrastructure improvements to mitigate the traffic impacts of delivering the Local Plan sites, covering vehicular traffic as well as sustainable transport improvements. 139 housing sites, comprising
Sunderland Local Plan April 2017
Commercial in Confidence
1/ Background
3
of a mixture of SHLAA sites and Housing Release sites, and 66 employment sites identified by SCC have been considered in the transportation assessment.
1.3 Purpose & Report Structure
1.3.1 This report provides the results of the transportation assessment undertaken to determine the likely transport impacts of the emerging Sunderland Local Plan preferred options. The report is structured into the following sections:
• Chapter 2: describes the proposed Local Plan development sites, explaining the residential and employment site allocations and the general locations within the Sunderland sub-areas;
• Chapter 3: introduces the traffic modelling methodology adopted for the assessment, including the development of the strategic SATURN model and the gravity model developed for the settlement based assessment;
• Chapter 4: presents the modelling development scenarios and the four modelling phases that have been assessed in the SATURN model to establish the impacts of the Local Plan upon the highway network. This section also presents the trip generation exercises and the trip distribution process associated with the gravity model;
• Chapter 5: describes the Local Plan trip generation methodology for the residential and employment sites;
• Chapter 6: presents the SATURN modelling outputs and results, and describes the locations on the highway network which can be expected to experience capacity issues, and during which delivery stage of the Local Plan;
• Chapter 7: provides a summary of potential mitigation measures for those junctions that have been forecasted to become oversaturated during the Local Plan period, for which developer funding will be sought;
• Chapter 8: introduces the existing public transport network across the study extents, describes the results of the public transport accessibility assessment, and identifies potential improvements to the public transport network which would improve connectivity between the largest Local Plan sites where movements between the sites are anticipated to be significant;
• Chapter 9: introduces the existing cycling and walking network across the study extents and describes the results of the cycling/walking accessibility assessment. This chapter identifies potential improvements to the cycle network which would improve sustainable access between the largest Local Plan sites where movements between the sites are anticipated to be significant; and
• Chapter 10: concludes the transportation assessment by summarising the traffic modelling and traffic impact, and smarter choices and sustainable travel associated with the Local Plan strategic sites.

Sunderland Local Plan April 2017
Commercial in Confidence
2/ Local Plan Development Sites
4
2. Local Plan Development Sites
2.1 Residential Sites
2.1.1 The emerging Sunderland Core Strategy and Development Plan proposes the allocation of 15 Housing Release Sites and the South Sunderland Growth Area (4 sites) for residential development. Whilst the remainder of the residential site allocations will be made through the Site Allocations and Designations Plan, for modelling purposes, all of the sites included as deliverable and developable in the SHLAA within the Local Plan period have been included.
2.1.2 The spatial location of the sites denotes a few clusters of sites spread across the five sub-areas with varying degrees of proposed development volume. The largest cluster of proposed residential development with the largest volume of planned dwellings is located in the Sunderland south Growth Area, north of Burdon Lane and adjacent to and surrounding Hall Farm with immediate connections to the A19 in the west.
2.1.3 There are also a number of clusters of residential development proposed for the Coalfield sub-area, generally located along the western boundary of the Coalfield area and in the south of the Coalfield area. There are a very small number of residential developments proposed for the Sunderland central sub-area, including student accommodation.
2.1.4 In the Washington and Sunderland north sub-areas, the proposed residential developments are more dispersed across the area as individual isolated developments rather than being clustered together.
2.1.5 In total, 139 residential sites have been included within the transport modelling undertaken for this transportation assessment, comprising of 124 sites from the SHLAA (which also include the SSGA sites) and 15 Housing Release sites proposed through the Core Strategy and Development Plan.
2.1.6 A plan showing the location of the SHLAA sites and proposed Housing Release Sites is shown in Appendix A.
2.2 Employment Sites
2.2.1 The emerging Core Strategy proposes to safeguard a range of existing employment land for B1, B2, and B8 use. Within these safeguarded areas, the Employment Land Review identified a total of 66 parcels of land available for development. The spatial location of the proposed developments shows a number of employment sites in the Washington sub-region, and across the boundaries of the Sunderland north, Sunderland central, and Sunderland south sub-areas along the River Wear.
2.2.2 A large cluster of employment sites, including the enterprise zone sites, are situated along the A1231 Sunderland Highway in the Washington sub-area.
2.2.3 A small cluster of employment sites is also proposed for the western section of the Coalfield sub-area around Houghton-le-Spring, and along the eastern boundary of the Sunderland south sub-area adjacent to the North Sea.
2.2.4 Whilst not specifically being allocated through the Core Strategy, the proposed employment land at IAMP has also been included within the traffic modelling undertaken for the transportation assessment.
2.2.5 A plan showing the location of the Local Plan employment sites is provided in Appendix B.

Sunderland Local Plan April 2017
Commercial in Confidence
3/ Traffic Modelling
5
3. Traffic Modelling
3.1 SSTC Strategic SATURN Model
3.1.1 The base SSTC strategic SATURN model was developed from the A19 Highways Assessment Model 2 (A19HAM2), a model of the Tyne and Wear area developed by Arup for Highways England (HE). The model was built to undertake various assessments of key junctions on the A19, and was subsequently extended to assess the A19/A184 Testos junction improvement scheme. The modelled area includes all of Tyneside and smaller sections of Wearside and Northumberland.
3.1.2 The A19HAM2 model only considered the area to the north of the River Wear within Sunderland as part of the fully modelled and simulated area, although the residential areas were at a coarse level of detail. The area to the south of the River Wear was in the model as a simple buffer network (not part of the simulated network), and this included parts of Washington and Coalfield.
3.1.3 The SSTC SATURN modelling work therefore, increased on the level of detail that was in the A19HAM2 model. Areas to the north of the River Wear and the area within the central part of Sunderland to the south of the River Wear, was converted to detailed simulation network for inclusion in the fully modelled area for the assessment of the SSTC scheme.
3.1.4 In order to include the central part of Sunderland and the areas south of the River Wear as part of the detailed simulation network, additional SATURN zones were created in the model. These were initially based upon output areas and residential areas formed by two or more output areas, whilst employment areas were based upon workplace zones where possible. Other significant traffic generators, such as retail parks, were included as bespoke zones. Zones were constructed so that they were located within a single lower super output area.
3.1.5 The SSTC strategic SATURN model considers trips made by car, light goods vehicles, and heavy goods vehicles, and the car trips are segmented by trip purpose into commuting, business, and other trips. The traffic demand and flow matrices used in the SSTC strategic model were constructed using information from the following three sources:
• Roadside interviews undertaken in September 2015 to capture existing traffic movements across the River Wear;
• The demand matrices from the A19HAM2 model which were used for traffic to the north and west of the Sunderland urban area. The matrices were growthed to 2015 using rates from the National Trip End Model using the TEMPro software; and
• A synthetic gravity model created using TEMPro trip-end data and average trip length data from the roadside interviews, providing a traffic demand for unobserved movements to the south of Sunderland, as well as 24 hour production-attraction demand for the variable demand model.
3.1.6 The assignment of trips within the SSTC SATURN model uses the Wardrop User Equilibrium assignment for multiple user classes, applying the Frank-Wolfe Algorithm. The principle methodology behind the application of this assignment is that traffic arranges itself in the modelled network such that the cost of travel on all routes used between the origin and destination is equal to the minimum cost of travel.
3.1.7 The SSTC strategic SATURN model represents a 2015 base model, which calibrates and validates to acceptable standards against screenlines, link flows, and journey times. The following data sources were used to calibrate and validate the SSTC SATURN model:
Sunderland Local Plan April 2017
Commercial in Confidence
3/ Traffic Modelling
6
• Roadside interviews at three locations – River Wear screenline (Queen Alexandra Bridge and Wearmouth Bridge), Washington Road and Chester Road;
• Traffic data aggregated into 13 screenline locations around Sunderland;
• Trafficmaster GPS data for Sunderland; and
• In-car journey time surveys for four routes – Washington Road, Wessington Way, Chester Road/The Broadway and Queen Alexandra Bridge/Wearmouth Bridge loop.
3.1.8 The LMVR documents the full methodology adopted to develop the SSTC strategic SATURN model which is available on request.
3.1.9 The calibrated and validated SATURN model developed for the SSTC major scheme business case has been amended and used to assess the preferred development proposals in the emerging Sunderland Local Plan.
3.2 Local Plan SATURN Model
3.2.1 The Local Plan base SATURN model represents 2015 traffic conditions. Background traffic growth from the base 2015 to the assessment year of 2033 was undertaken using TEMPro 7 data. This data allocates a local growth factor for trips based upon Super Middle Output Areas, which was subsequently reduced to take into account committed developments that will be brought forward outside of the Sunderland Local Plan.
3.2.2 Individual growth factors were applied for different trip types and were not just limited to commuter based trips. As such, numerous traffic growth factors were included within the SATURN model based upon each zone and trip type.
3.2.3 The years of assessment for the impact of the Sunderland Local Plan follows the assessment years of the SSTC scheme, +15 years. This coincides with the aspirations of Sunderland’s Core Strategy for shaping spatial and economic development in the city for 15-20 years, up to 2033.
3.2.4 The peak hours for assessment of the Local Plan proposals are based upon those contained within the original A19HAM2 SATURN model and retained for the SSTC model. The AM peak within the model is 08:00-09:00hr, with traffic flows contained within this hour used as the AM peak hour traffic flows. The PM peak within the model is 16:00-18:00hrs, the PM peak hour being identified as the average hour within this timeframe.
3.2.5 The strategic SATURN model also includes an inter-peak period of 10:00-15:00 with a subsequent inter-peak hour defined as the average hour within this timeframe. As traffic flows are lower in the inter-peak period when compared to the AM and PM peak hours, the inter-peak has not been used for the transportation assessment of Sunderland’s emerging Local Plan.
3.2.6 The SATURN model considers car, light goods vehicle (van), and heavy goods vehicle trips. The car trips are segmented into the following four trip purposes:
• Commuting;
• Business;
• Education; and
• Other.
3.3 Forecasting the Future Year
3.3.1 The transportation assessment has considered a future year of 2033 in line with Sunderland’s
Sunderland Local Plan April 2017
Commercial in Confidence
3/ Traffic Modelling
7
Local Plan period. The base year was considered as 2015 and the modelling assessments have considered four future year phases spanning from year zero to year seventeen from the base year. The future year modelling scenarios that have been assessed include the following:
• Phase 0: 0-5 years;
• Phase 1: 5-10 years;
• Phase 2: 11-15 years; and
• Phase 3: 16-18 years.
3.3.2 Whilst the Core Strategy and Development Plan covers an eighteen year plan period from 2015-2033, the transport modelling assessments that were undertaken in early 2017 for the transportation assessment cover a 17 year period because development completions within the first year of the Local Plan period (2015/2016) had already taken place
3.3.3 Traffic growth was applied to the base model traffic flows to forecast the likely traffic demand in 2033. Traffic growth was calculated based on best practice guidance and future housing targets and this is discussed in chapter 4 of this report.
3.3.4 Committed development that would deliver modifications to the highway network are included in the SATURN model; the coding of links and junctions in the model were amended to reflect highway improvements that were approved and programmed to be delivered outside of the Local Plan.
3.3.5 The Local Plan traffic flows relating to specific development sites were added into the demand matrices for the SATURN model. This involved estimating the traffic demand for each development, and distributing these trips across the modelled network.
3.3.6 The model outputs were used to access the impact of these four scenarios. The model outputs include traffic flows, forecast junction capacity, and Ratio to Flow Capacity (RFC).
3.4 Settlement Based Assessment – Gravity Model
3.4.1 A first principles gravity model has been developed for the Local Plan development settlements which fall outside of the detailed simulation network in the SATURN model.
3.4.2 The gravity model was constructed using a more robust trip generation exercise for the Local Plan residential and employment sites, available through the use of locally based survey data. The model produced an origin-destination trip matrix to reflect new trips arising from the Sunderland Local Plan, made by population, employment, and other demographic changes.
3.4.3 The gravity model has been used to forecast the origin-destination pattern of travel in the future years being assessed, and produce demand matrices and traffic distributions that were assigned in the SATURN highway assignment model.
3.4.4 To reflect the new levels of trips/new trip types that will be made as a result of the Sunderland Local Plan sites (changes to the disposition of offices, residential, retail etc.), the gravity model required data concerning the number of trips generated by each zone and the number of trips attracted to each zone, input as origin trip ends and destination trip ends for each zone. These were obtained from the base year trip matrix and represent the base trip ends.
3.4.5 To calculate the future levels of trip making, traffic anticipated from committed development with planning consent, development likely to acquire planning approval, and trip generation from the Local Plan development sites, were added to the base trip ends for each model zone and input into the gravity model to provide the future phase 3 trip matrix.
3.4.6 The future phase 3 trip matrix was also constrained to reflect 67% of trips originating in Sunderland and remaining in Sunderland for employment purposes, and 33% of trips travelling

Sunderland Local Plan April 2017
Commercial in Confidence
3/ Traffic Modelling
8
from outside of Sunderland. New employment sites were also constrained to attract more trips from new housing developments. This is discussed in detail in section 5.4 of this report.
3.4.7 The base year trip matrices and the future year trip matrices were then input into the Local Plan SATURN model.

Sunderland Local Plan April 2017
Commercial in Confidence
4/ Modelling Development Scenarios
9
4. Modelling Development Scenarios
4.1 Trip Generation
4.1.1 The estimated traffic demand for all developments included within the Local Plan modelling scenarios was not estimated from TRICS; a nationally recognised database of trip rates for development sites in the UK, that is used for transport planning purposes to quantify the trip generation of new/proposed development. In general, the TRICS database proportions higher trip rates by using mean averages in the calculations.
4.1.2 Use of the database was deemed not suitable for the transportation assessment as more robust trip generation sources for the Local Plan residential and employment sites was available in the form of locally based survey data. The methodology adopted in the calculation of trip rates for the residential sites is described in section 5.2 and the methodology for the employment sites is described in section 5.4.
4.2 Modelling Scenarios
4.2.1 The future year modelling scenarios that have been assessed as part of the transportation assessment include the following:
• Phase 0: is the base scenario which includes committed developments and traffic growth in the year zero (0) to year five (5);
• Phase 1: includes phase 0 with the committed developments and traffic growth in years six (5) to eleven (10);
• Phase 2: include phase 0 and phase 1 with the committed developments and traffic growth in years twelve (11) to year fifteen (15); and
• Phase 3: is the full Local Plan scenario which includes phases 0 to 2 with the committed developments and traffic growth for the sixteen (16), seventeen (17), and eighteen (18) years.
4.2.2 Phase 0 is the reference case scenario. It includes developments which have planning permission and live applications that are likely to be granted planning approval. Other developments that are likely to gain planning permission by 2033 have been included where information was available. This is not prejudicial to the planning process and is based on guidance on uncertainty as defined by Table A2 in TAG Unit M4 Forecasting and Uncertainty.
4.2.3 Phase 3 includes traffic demand for a mix of development types, such as residential, employment, leisure, and retail, and consists of the following assumptions:
• Developments which have been completed between 2011 and 2016;
• Developments which have been granted planning permission (committed development); and
• All developments where a planning application has been submitted to the Local Authority as of May 2016, which have not yet been determined but are likely to be granted planning approval.
4.2.4 Site specific information for committed developments and those likely to be granted planning approval, including estimated peak trip rates and site access onto the highway network, was taken from the relevant supporting planning application documents.
Sunderland Local Plan April 2017
Commercial in Confidence
4/ Modelling Development Scenarios
10
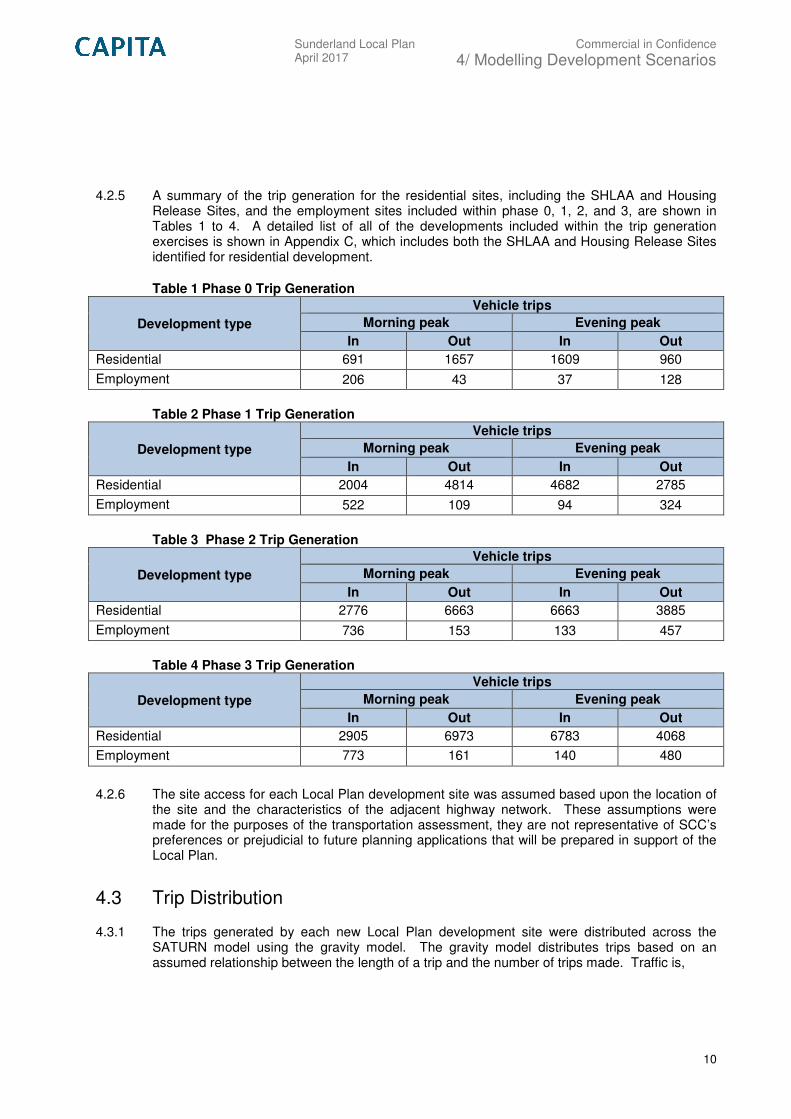
4.2.5 A summary of the trip generation for the residential sites, including the SHLAA and Housing Release Sites, and the employment sites included within phase 0, 1, 2, and 3, are shown in Tables 1 to 4. A detailed list of all of the developments included within the trip generation exercises is shown in Appendix C, which includes both the SHLAA and Housing Release Sites identified for residential development.
Table 1 Phase 0 Trip Generation
Development type
Vehicle trips
Morning peak Evening peak
In Out In Out
Residential 691 1657 1609 960
Employment 206 43 37 128
Table 2 Phase 1 Trip Generation
Development type
Vehicle trips
Morning peak Evening peak
In Out In Out
Residential 2004 4814 4682 2785
Employment 522 109 94 324
Table 3 Phase 2 Trip Generation
Development type
Vehicle trips
Morning peak Evening peak
In Out In Out
Residential 2776 6663 6663 3885
Employment 736 153 133 457
Table 4 Phase 3 Trip Generation
Development type
Vehicle trips
Morning peak Evening peak
In Out In Out
Residential 2905 6973 6783 4068
Employment 773 161 140 480
4.2.6 The site access for each Local Plan development site was assumed based upon the location of the site and the characteristics of the adjacent highway network. These assumptions were made for the purposes of the transportation assessment, they are not representative of SCC’s preferences or prejudicial to future planning applications that will be prepared in support of the Local Plan.
4.3 Trip Distribution
4.3.1 The trips generated by each new Local Plan development site were distributed across the SATURN model using the gravity model. The gravity model distributes trips based on an assumed relationship between the length of a trip and the number of trips made. Traffic is,
Sunderland Local Plan April 2017
Commercial in Confidence
4/ Modelling Development Scenarios
11
therefore, distributed based on the total forecast traffic generation and the cost of travel between origin and destination zones within the modelled network.
4.3.2 The cost of travel varies depending on trip ‘purpose’ and, therefore, a separate model was used for each different trip purpose. The trips were disaggregated by purpose using data from the National Trip End Model (NTEM).
4.3.3 The gravity model used for trip distribution in this study was of the form:
��� = ��������� (1)
where ��� is the number of trips between origin � and destination , � is a proportionality factor,
�� is the total number of trips starting at origin �, �� is the total number of trips ending at
destination and �(��) is a generalised function of travel costs known as the deterrence
function.
4.3.4 The deterrence function used was of the form:
���� = �������� (2)
where �� is the cost of travel between origin � and destination and �, � are parameters to be
defined.
4.3.5 Finally, the furness procedure was applied to the future year demand matrices to ensure the trip totals for each development were correct.
4.3.6 It should be noted that the assumptions regarding the highway network and traffic demand in small rural settlements included in the gravity model are simplistic. The highway network only includes key routes and traffic demand is aggregated into broad locations. This means that the costs used within the gravity model are often inaccurate for new trips that could potentially stay within the rural settlements. The result of this is that trips generated by new developments in rural locations are all external to that settlement, which represents a pessimistic assessment of trip generation on the wider highway network that is likely to be an overestimate.
4.4 Traffic Growth
4.4.1 Traffic growth is the change in the number of cars and goods vehicles on the highway network over time. When forecasting the performance of the highway network in the future it is necessary to allow for changes in traffic demand. Traffic growth can be split into two broad areas:
• New trips: changes in population, employment, and car ownership which directly affect how many vehicles travel on the highway network; and
• Frequency of trips: changes in GDP, income, and travel costs which affect how frequently people travel.
4.5 Forecast Traffic Demand
4.5.1 Growth in traffic demand in the future year modelling scenarios was considered in line with the fixed demand approach as defined in TAG Unit M4 Forecasting and Uncertainty. This approach was used so that the impact of the Local Plan development sites could be clearly assessed

Sunderland Local Plan April 2017
Commercial in Confidence
4/ Modelling Development Scenarios
12
between scenarios without the impact of other variables. Other variables include considerations such as, induced or suppressed traffic due to changes in travel costs, changes in travel choice, and changes in peak spreading.
4.5.2 Uncertainty in relation to the growth factors has not been considered as part of the transportation assessment. It was deemed unnecessary as the key outputs of the assessment are the differing impacts between different modelled scenarios.
4.5.3 The NTEM dataset represents the Department for Transport’s standard assumptions about growth in travel demand, access to which is provided through TEMPro software. TEMPro version 7.0 has been used to calculate growth factors for cars based on the future year being assessed, trip purpose, time period, and the origin and destination of trips. The assumptions within NTEM were adjusted using the alternative assumptions facility within TEMPro to derive at values representative of the Local Plan proposals.
4.5.4 The Local Plan aspires to deliver at least 13,842 net additional dwellings over the plan period from 2015 to 2033. It is assumed that this will involve the following build and delivery profile, which includes the 124 SHLAA sites and the 15 Housing Release Sites identified for residential development through the draft Core Strategy:
• 3,324 homes will be constructed between 0-5 years;
• 5,107 will be constructed between 6-10 years;
• 3464 homes will be developed 11-15 years; and
• 598 homes will be constructed in 16 and 18 years of the Local Plan period.
4.5.5 These dwelling volumes were used as the baseline for future housing numbers. The housing numbers from the specific developments in each scenario were then subtracted from this baseline and the housing assumptions within TEMPro were adjusted to match this Local Plan target.
4.5.6 This process ensured that the impact of new housing is not double-counted by including the developments in the model directly as well as applying a growth factor. The growth factors still account for other forecast changes that may affect traffic growth, such as demographic changes, car ownership, and economic changes.
4.5.7 As a fixed demand approach was used, fuel and income factors were calculated using TAG Databook Table M4.2.1 Forecast Fuel Price and Income Adjustment Factors. These factors are based upon relationships between car travel, household income, and fuel costs.
4.5.8 Growth factors for light goods vehicles and heavy goods vehicles were estimated from the National Transport Model, adjusted using local NTEM factors.
Sunderland Local Plan April 2017
Commercial in Confidence
5/ Local Plan Trip Generation Methodology
13
5. Local Plan Trip Generation Methodology
5.1 Strategic Housing Land Availability Assessment
5.1.1 Local Authorities are required to undertake Strategic Housing Land Availability Assessments (SHLAA) to assess potential sites for future housing development. The SHLAA forms part of the evidence base for the emerging Sunderland Local Plan.
5.1.2 The transportation assessment has considered 139 potential sites for residential development covering the plan period up to 2033, which are spread across north, south, and central Sunderland, Coalfield, and Washington. These sites are derived from the draft Core Strategy and SHLAA.
5.2 Local Plan Residential Sites
5.2.1 The vehicular trips generated by each development site were separated into the key journey purposes experienced during the AM and PM peaks. Each journey purpose results in a different trip distribution and gravity models for each different journey type were developed.
5.2.2 Vehicular trips rates were calculated based on traffic data from actual housing developments in the local region. Using 2011 Census data and GIS data, Census Output Areas have been linked to the SATURN zones within the modelled network. Census data provides information about modal split at Output Area level (neighbourhood level), and using a combination of traffic flow information and forecasted employment growth in Sunderland, trip rates were calculated for each output area and corresponding SATURN zone.
5.2.3 Using Census data, car mode share (%) for work journeys were assigned to Output Areas (geographical areas broken down by postcode units - providing consistently sized areas for neighbourhood statistics).
5.2.4 In Sunderland, the range of car usage for work journeys is between 25% - 81%. The lowest calculated trip rate was assigned to the sites with the lowest car usage and the highest calculated trip rate was assigned to the sites with the highest car usage.
5.2.5 The calculated trip rates are shown in Appendix D, based upon mode share data. When calculating these vehicular trip rates, cycling, walking, and public transport accessibility has been considered and the trip rates have been reduced to take account of the levels of accessibility by sustainable modes. The reduction factors are shown in Table 5 on the following page, where H represents high accessibility, M represents medium accessibility, and L represents low accessibility.
5.2.6 The methodology for assessing cycling, walking, and public transport accessibility is described in chapter 8 Public Transport Accessibility and chapter 9 Cycling & Walking Accessibility.
5.2.7 Additionally, vehicular trip rates were reduced for sites with student accommodation. For these sites, trip rates were assumed as zero because all of the student residential sites are located in the city centre areas which have high walking, cycling, and public transport accessibility.
5.2.8 The total number of houses planned to be built during the Local Plan period was provided by SCC, and based upon this number and the total number of houses for which the analysis was undertaken for, growth/constraint factors were applied to each site. All residential sites were linked to a SATURN Zone.

Sunderland Local Plan April 2017
Commercial in Confidence
5/ Local Plan Trip Generation Methodology
14
Table 5 Trip Rate Reduction Factors
Public
Transport Cycling Walking
Reduction
Factor
H H H 10%
H H M 9%
H H L 8%
H M H 8%
H M M 7%
H M L 7%
H L H 6%
H L M 6%
H L L 6%
M H H 5%
M H M 5%
M H L 5%
M M H 4%
M M M 4%
M M L 4%
M L H 3%
M L M 3%
M L L 3%
L H H 2%
L H M 2%
L H L 2%
L M H 2%
L M M 2%
L M L 2%
L L H 1%
L L M 1%
L L L 1%
5.2.9 The next stage involved calculating the number of trips in every considered time period using trip rates and yields delivered in each stage.
5.2.10 The diagram in Figure 1 shows the methodology for calculating the vehicular trips generated by the Local Plan residential sites and corresponding SATURN zones in the modelled network for the purposes of the transportation assessment.

Sunderland Local Plan April 2017
Commercial in Confidence
5/ Local Plan Trip Generation Methodology
15
Figure 1 SATURN Trip Rate Methodology for Residential Sites
SHLAA data - yields deliverable in considered time periods
CENSUS Output Areas linked to SATURN zones
Dynamic trip rates calculated based on modal split
Trip distribution calculated based on SATURN model
Cumulative impact of key junctions (SATURN outputs)
Phasing (SATURN outputs in every considered time period)
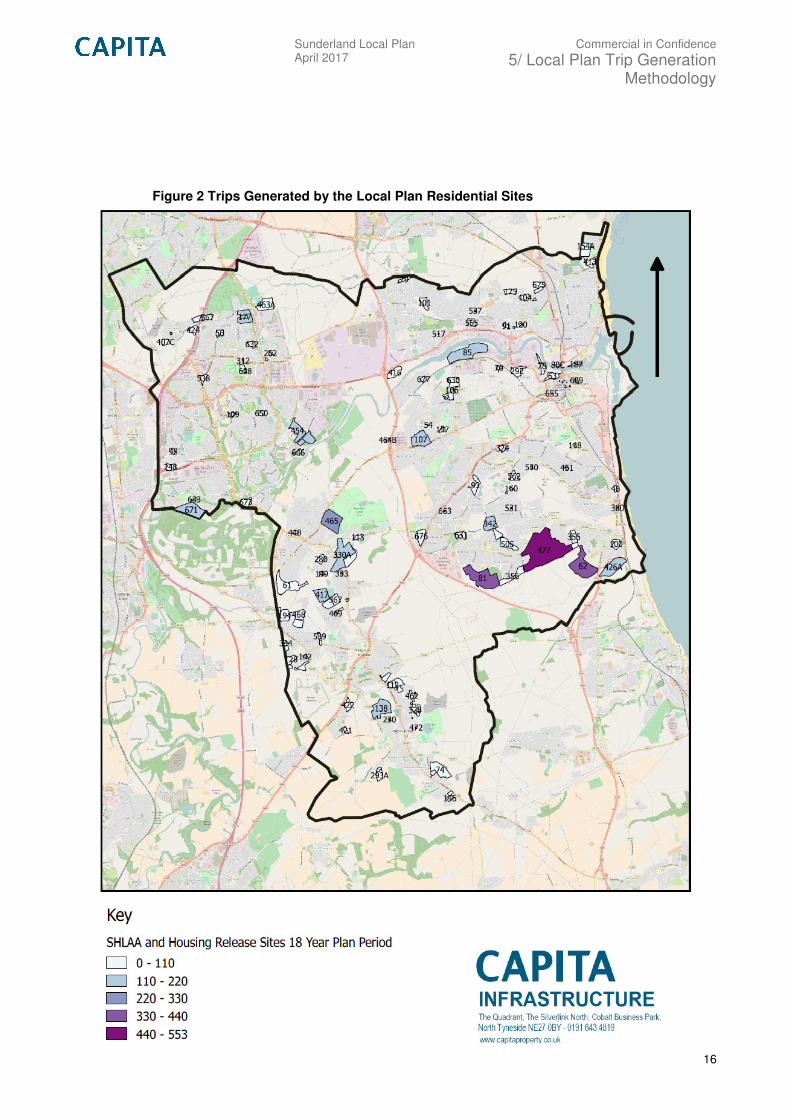
5.2.11 Figure 2 below shows the volume of trips anticipated to be generated by each Local Plan residential site.
Sunderland Local Plan April 2017
Commercial in Confidence
5/ Local Plan Trip Generation Methodology
16
Figure 2 Trips Generated by the Local Plan Residential Sites
Sunderland Local Plan April 2017
Commercial in Confidence
5/ Local Plan Trip Generation Methodology
17
5.2.12 It is important to note that the 15 sites in Sunderland that are proposed to be released from the green belt and brought forward for residential development as Housing Release Sites, have been subject to the same trip generation methodology as the 124 SHLAA sites.
5.2.13 A summary of the trip generation for the Housing Release Sites produced for phase 0, 1, 2, and 3 is shown in the spreadsheet in Appendix C, with the green belt sites being identifiable in column H of the spreadsheet.
5.3 Employment Land Review
5.3.1 SCC appointed Nathaniel Lichfield & Partners and Lambert Smith Hampton to prepare an Employment Land Review (ELR) for the local authority area in 2016. The purpose of the ELR was to provide SCC with evidence to support the development of Sunderland’s Local Plan. The review provided an understanding of the city’s current employment land supply and anticipated future employment growth and the impacts of this on land availability up to 2033.
5.3.2 In relation to market area profiles, the ELR considers that the market for employment premises can be divided into three distinctive areas; the Sunderland urban area, the Washington urban area, and the dispersed settlements of the Coalfield.
5.3.3 The study concluded and recommended that SCC needs to allocate between 95ha and 115ha of employment land up to 2033 across the three distinctive market areas. The transportation assessment has considered 66 sites that have been identified for employment land by SCC following the ELR.
5.4 Local Plan Employment Sites
5.4.1 For the purpose of assessing the transport impacts of the Local Plan employment sites, the sites identified in the ELR were reviewed. The area and composition of each site was calculated for each use class including B1, B2, and B8.
5.4.2 In addition to the sites identified through the ELR, SCC is separately preparing an Area Action Plan jointly with South Tyneside Council to release land from the green belt for the IAMP site. The impact of the IAMP site has been considered in the transportation assessment.
5.4.3 Trip rates for the employment sites were calculated based upon data from the North East region from AM peak inbound trip rates to employment sites for B1, B2, and B8 use classes. The trip rates are shown in Tables 6 to 8. This methodology was adopted as the AM inbound trips to employment sites represent the strongest correlation between the number of jobs being generated by the Local Plan and the trip generation calculation.
5.4.4 The trip rates for the Local Plan employment sites were then pro rata for each site based upon the size of the site and the proposed composition of use classes. All employment sites were linked with SATURN Zones.
Table 6 Trip Rates for B1 Use Class
B1 Arrivals
AM 1.552
Table 7 Trip Rates for B2 Use Class
B2 Arrivals
AM 0.516
Sunderland Local Plan April 2017
Commercial in Confidence
5/ Local Plan Trip Generation Methodology
18
Table 8 Trip Rates for B6 Class
B8 Arrivals
AM 0.031
5.4.5 Using the trip rates shown in Tables 6 to 8 above, and by estimating arrival and departure trip profiles for various local employment sites in the TRICS database, the volume of inbound and outbound trips for the AM and PM peaks were calculated based upon the relationship shown in Table 9.
Table 9 Relationship: Inbound and Outbound Trips for the AM & PM Peaks
AM PM
IN X 18%*X
OUT 34%*PM OUT 62%*X
5.4.6 The number of jobs planned to be delivered during each of the four Local Plan periods was calculated pro rata using the same proportions as delivered yields for the residential sites. This methodology was adopted because it was unknown at the time of preparing the transportation assessment of how many jobs would be delivered in each of the four Local Plan periods.
5.4.7 The calculated percentage volume of jobs to be delivered in each Local Plan period is shown in Table 10.
Table 10 Percentage of Jobs Deliverable during the Local Plan Periods
5 Years 6-10 Years 11-15 Years 16,17,18 Years
27% 41% 28% 5%
5.4.8 In order to formulate representative vehicular trips that may arise as a result of the new employment sites in Sunderland, mode share from the 2011 Census data for journeys to work by car was applied to the volume of jobs estimated to be delivered over the Local Plan period. The mode share for journeys to work by car was 65% (2011) and this has been applied to the volume of jobs expected to be delivered.
5.4.9 The calculation of the vehicular trip generation for the employment sites is shown in Appendix C.
5.4.10 The 2016 ELR denotes that the existing vehicular trips that originate from within Sunderland and travel to existing employment land in Sunderland represent 67% of total trips to existing employment sites. This is the self-containment rate and this has been applied to the Local Plan vehicle trips, i.e. 67% of the Local Plan trips will originate, remain, and travel to sites within Sunderland. The remaining 33% of Local Plan trips have been assumed to originate from neighbouring authorities outside of Sunderland and travel to existing employment sites within Sunderland.
5.4.11 67% of vehicular trips generated by the Local Plan have been assumed to represent self-containment trips, and therefore, to reduce double counting, the assessment of cycling, walking, and public transport accessibility has been undertaken for residential sites only as these trips constitute trips travelling to employment sites.
5.4.12 Employment sites held for expansion by an existing occupier were excluded from the ELR site

Sunderland Local Plan April 2017
Commercial in Confidence
5/ Local Plan Trip Generation Methodology
19
allocations on the basis that they are not available to the wider market for economic development and their inclusion would have resulted in double counting of potential job creation.
5.4.13 The diagram in Figure 3 shows the methodology for calculating the vehicular trips generated by the Local Plan employment sites for the purposes of this transportation assessment.
Figure 3 SATURN Trip Rate Methodology for Employment Sites
Site Area
Site composition (percentage of B1, B2 & B8)
Number of trips calculated based on site composition & site area
Removal double counting from SHLAA

Sunderland Local Plan April 2017
Commercial in Confidence
6/ Modelling Outputs & Impacted Junctions
20
6. Modelling Outputs & Impacted Junctions
6.1 Ratio of Flow to Capacity
6.1.1 The Ratio of Flow to Capacity (RFC) of a highway link or a junction is one of the principle factors influencing queues and delays on the highway network. RFC is an indicator of the likely performance of a junction under a future year scenario incorporating future traffic demand.
6.1.2 An RFC of 85% (0.85) demonstrates that a junction will operate within capacity and with 15% spare capacity, and an RFC of 86% (0.86) and above suggests a junction will operate within capacity but may experience capacity issues in the future. An RFC of 100%+ (1.00) indicates that a junction will operate beyond the design capacity and become oversaturated, highlighting that traffic delays and congestion are more than likely to occur.
6.1.3 RFC is therefore, a useful tool in helping to devise improvements that will enable a link or junction to operate without major queues and delays if it is predicted to become oversaturated.
6.2 RFC SATURN Node Results
6.2.1 In relation to the SATURN modelling results in Table 11 below, the following points should be noted when reviewing SATURN outputs:
• Large complex junctions in the network have been coded as several nodes joining together to form the junction, for example, nodes 7125, 7127, 7129, 7131 and 7133 are all part of the A1231/A690 junction. This is a coding condition of SATURN and the number of nodes in Table 11 does not equate to the number of junctions;
• Signalised junctions have been added in the simulation results without undertaking signal optimisation as the assessment is to test if the current infrastructure can withstand future demand. A reduction in the RFC at some junctions could be expected if signal optimisation had been undertaken to improve junction performance. However, this would have modified the existing infrastructure and not provided accurate results based upon existing junction operations;
• Gyratory type roundabouts have been coded as signalised junctions in the modelled network and will exhibit higher RFCs given that signal optimisation has not been undertaken; and
• Nodes with very low traffic flows and low capacity also showed higher RFCs but in general there are not to be included as the capacity can be increased with a significant reduction in RFC.
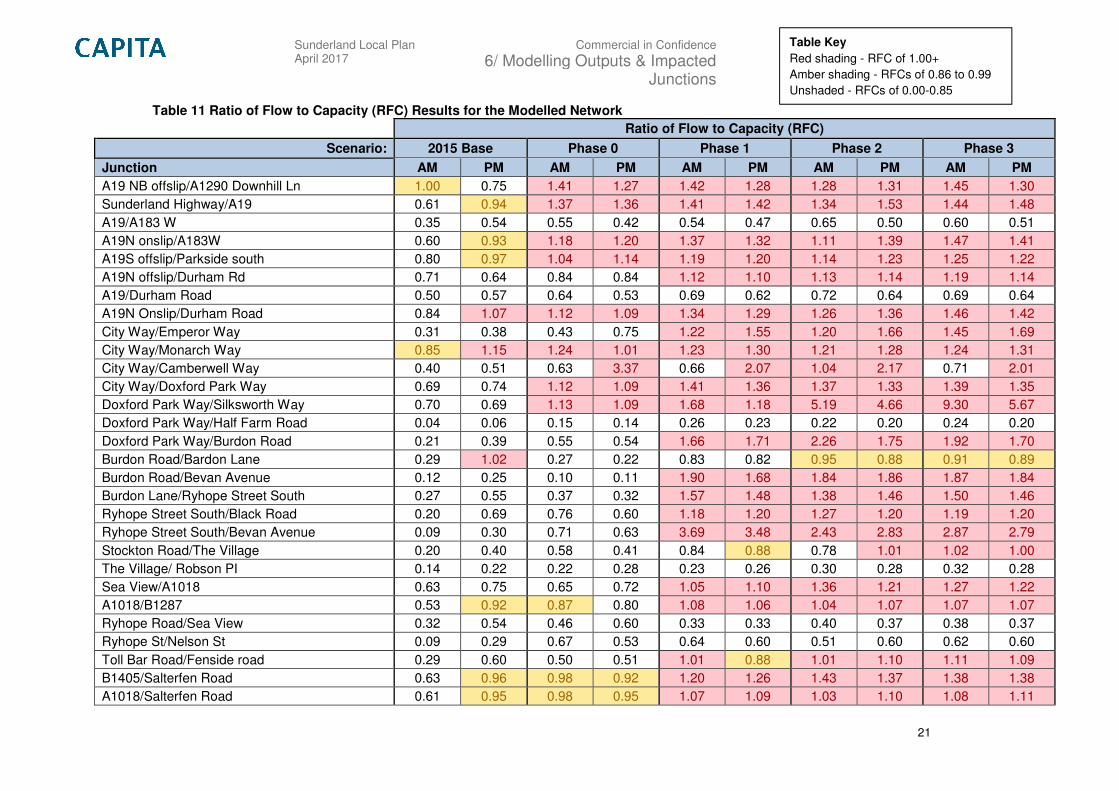
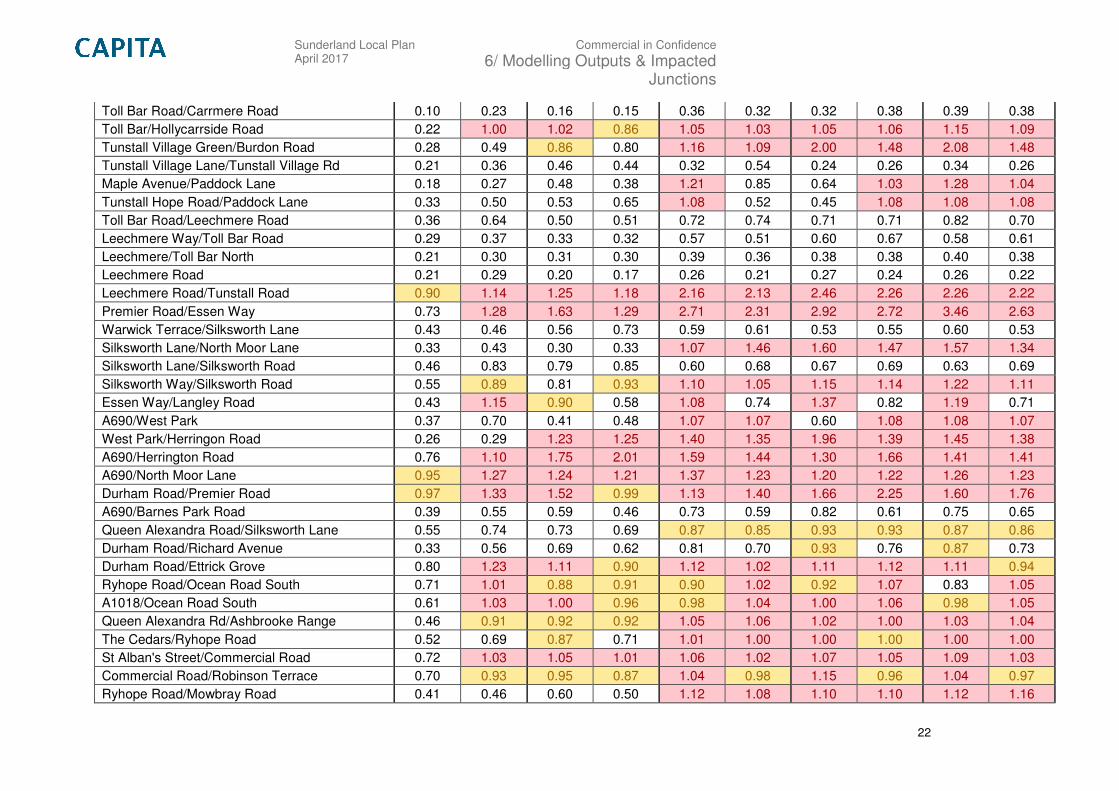
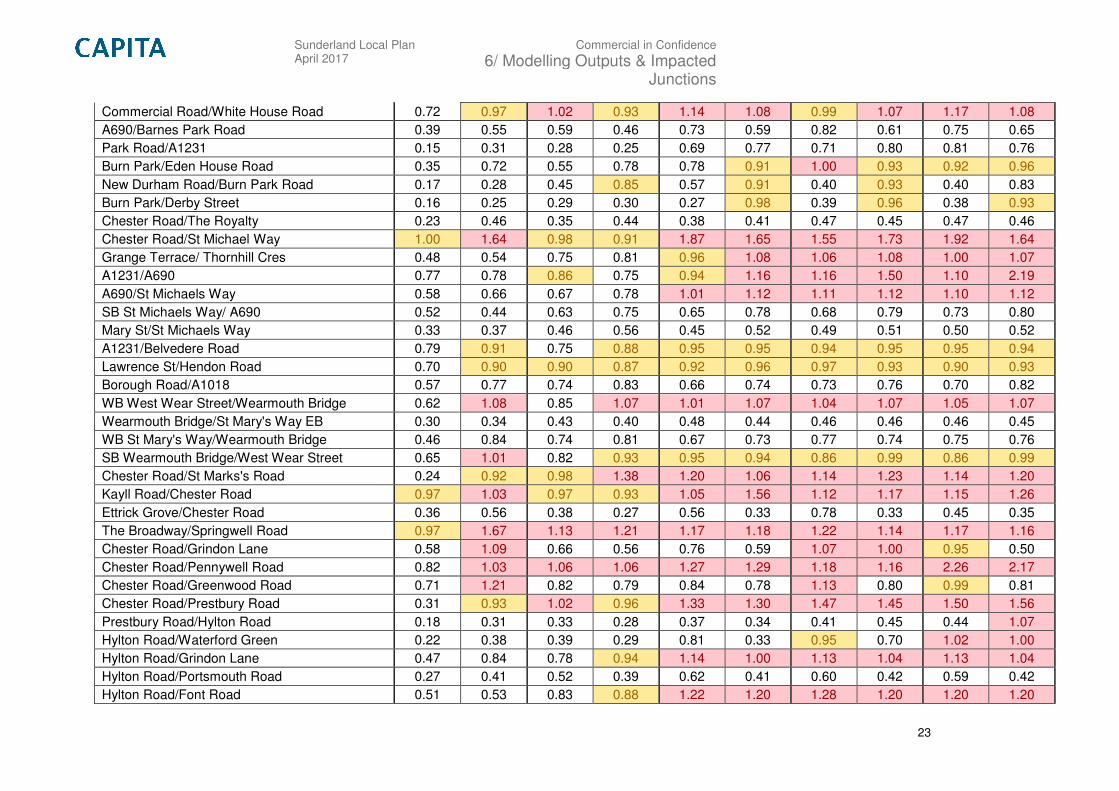
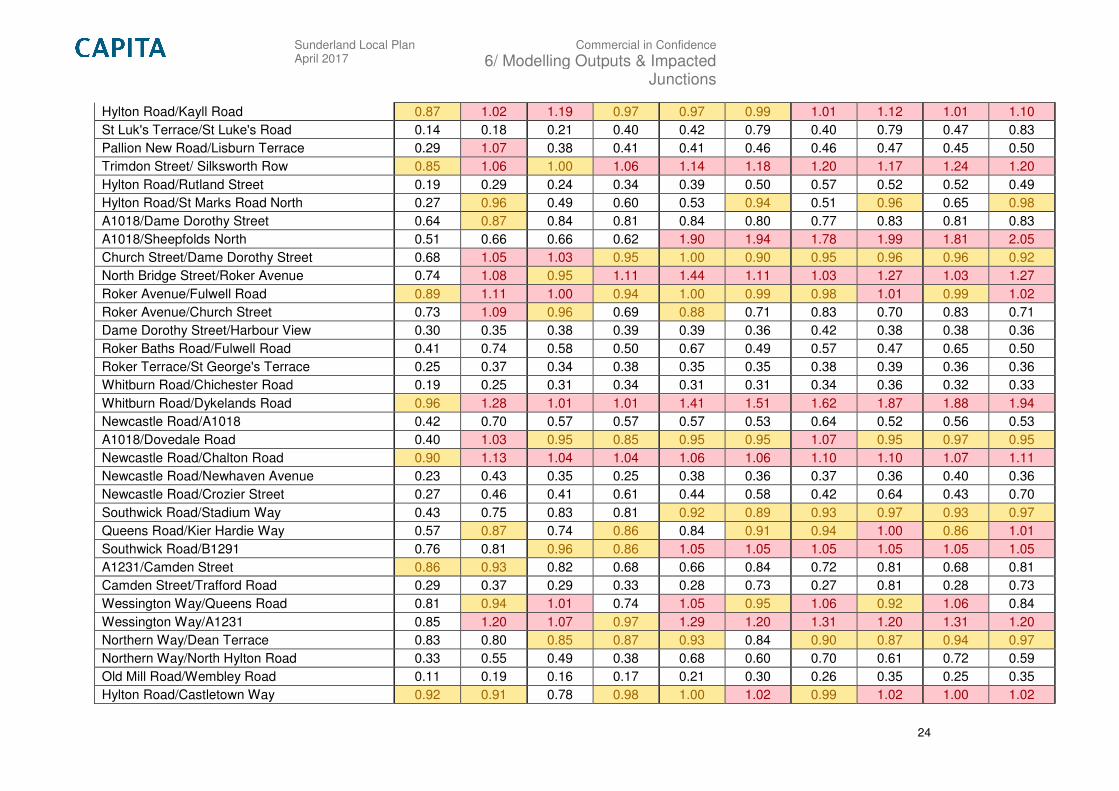
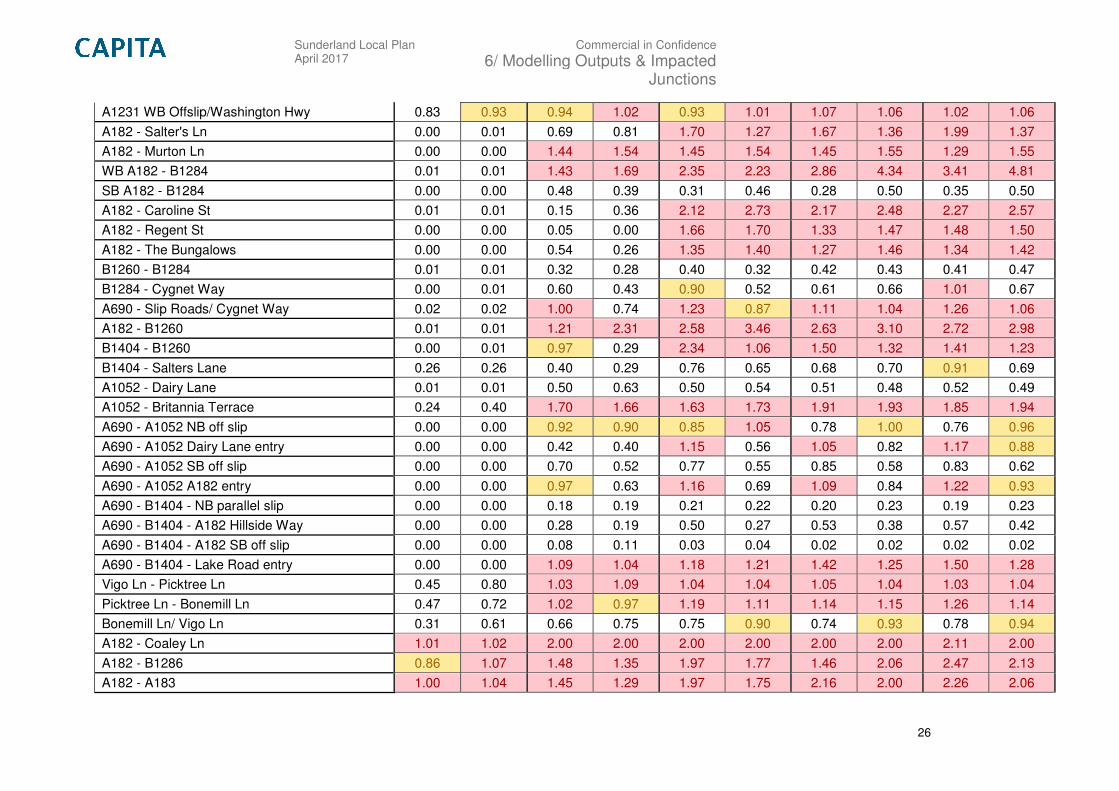
6.2.2 Table 11 shows the RFC results for each node within the SATURN model (multiple nodes are used to code up individual junctions). The RFCs have been presented for each Local Plan phase, including the 2015 base year, for the AM and PM peaks. In the table, red shading indicates a node is operating with an RFC of 1.00+, amber shading shows RFCs of 0.86 to 0.99, and the cells unshaded are locations with RFCs of 0.00-0.85.
6.2.3 Further analysis has been undertaken which shows when individual junctions in the modelled network will experience capacity issues over the Local Plan period, which is discussed in sections 6.4 to 6.6 following Table 11.
Sunderland Local Plan April 2017
Commercial in Confidence
6/ Modelling Outputs & Impacted Junctions
21
Table 11 Ratio of Flow to Capacity (RFC) Results for the Modelled Network
Ratio of Flow to Capacity (RFC)
Scenario: 2015 Base Phase 0 Phase 1 Phase 2 Phase 3
Junction AM PM AM PM AM PM AM PM AM PM
A19 NB offslip/A1290 Downhill Ln 1.00 0.75 1.41 1.27 1.42 1.28 1.28 1.31 1.45 1.30
Sunderland Highway/A19 0.61 0.94 1.37 1.36 1.41 1.42 1.34 1.53 1.44 1.48
A19/A183 W 0.35 0.54 0.55 0.42 0.54 0.47 0.65 0.50 0.60 0.51
A19N onslip/A183W 0.60 0.93 1.18 1.20 1.37 1.32 1.11 1.39 1.47 1.41
A19S offslip/Parkside south 0.80 0.97 1.04 1.14 1.19 1.20 1.14 1.23 1.25 1.22
A19N offslip/Durham Rd 0.71 0.64 0.84 0.84 1.12 1.10 1.13 1.14 1.19 1.14
A19/Durham Road 0.50 0.57 0.64 0.53 0.69 0.62 0.72 0.64 0.69 0.64
A19N Onslip/Durham Road 0.84 1.07 1.12 1.09 1.34 1.29 1.26 1.36 1.46 1.42
City Way/Emperor Way 0.31 0.38 0.43 0.75 1.22 1.55 1.20 1.66 1.45 1.69
City Way/Monarch Way 0.85 1.15 1.24 1.01 1.23 1.30 1.21 1.28 1.24 1.31
City Way/Camberwell Way 0.40 0.51 0.63 3.37 0.66 2.07 1.04 2.17 0.71 2.01
City Way/Doxford Park Way 0.69 0.74 1.12 1.09 1.41 1.36 1.37 1.33 1.39 1.35
Doxford Park Way/Silksworth Way 0.70 0.69 1.13 1.09 1.68 1.18 5.19 4.66 9.30 5.67
Doxford Park Way/Half Farm Road 0.04 0.06 0.15 0.14 0.26 0.23 0.22 0.20 0.24 0.20
Doxford Park Way/Burdon Road 0.21 0.39 0.55 0.54 1.66 1.71 2.26 1.75 1.92 1.70
Burdon Road/Bardon Lane 0.29 1.02 0.27 0.22 0.83 0.82 0.95 0.88 0.91 0.89
Burdon Road/Bevan Avenue 0.12 0.25 0.10 0.11 1.90 1.68 1.84 1.86 1.87 1.84
Burdon Lane/Ryhope Street South 0.27 0.55 0.37 0.32 1.57 1.48 1.38 1.46 1.50 1.46
Ryhope Street South/Black Road 0.20 0.69 0.76 0.60 1.18 1.20 1.27 1.20 1.19 1.20
Ryhope Street South/Bevan Avenue 0.09 0.30 0.71 0.63 3.69 3.48 2.43 2.83 2.87 2.79
Stockton Road/The Village 0.20 0.40 0.58 0.41 0.84 0.88 0.78 1.01 1.02 1.00
The Village/ Robson PI 0.14 0.22 0.22 0.28 0.23 0.26 0.30 0.28 0.32 0.28
Sea View/A1018 0.63 0.75 0.65 0.72 1.05 1.10 1.36 1.21 1.27 1.22
A1018/B1287 0.53 0.92 0.87 0.80 1.08 1.06 1.04 1.07 1.07 1.07
Ryhope Road/Sea View 0.32 0.54 0.46 0.60 0.33 0.33 0.40 0.37 0.38 0.37
Ryhope St/Nelson St 0.09 0.29 0.67 0.53 0.64 0.60 0.51 0.60 0.62 0.60
Toll Bar Road/Fenside road 0.29 0.60 0.50 0.51 1.01 0.88 1.01 1.10 1.11 1.09
B1405/Salterfen Road 0.63 0.96 0.98 0.92 1.20 1.26 1.43 1.37 1.38 1.38
A1018/Salterfen Road 0.61 0.95 0.98 0.95 1.07 1.09 1.03 1.10 1.08 1.11
Table Key
Red shading - RFC of 1.00+
Amber shading - RFCs of 0.86 to 0.99
Unshaded - RFCs of 0.00-0.85
Sunderland Local Plan April 2017
Commercial in Confidence
6/ Modelling Outputs & Impacted Junctions
22
Toll Bar Road/Carrmere Road 0.10 0.23 0.16 0.15 0.36 0.32 0.32 0.38 0.39 0.38
Toll Bar/Hollycarrside Road 0.22 1.00 1.02 0.86 1.05 1.03 1.05 1.06 1.15 1.09
Tunstall Village Green/Burdon Road 0.28 0.49 0.86 0.80 1.16 1.09 2.00 1.48 2.08 1.48
Tunstall Village Lane/Tunstall Village Rd 0.21 0.36 0.46 0.44 0.32 0.54 0.24 0.26 0.34 0.26
Maple Avenue/Paddock Lane 0.18 0.27 0.48 0.38 1.21 0.85 0.64 1.03 1.28 1.04
Tunstall Hope Road/Paddock Lane 0.33 0.50 0.53 0.65 1.08 0.52 0.45 1.08 1.08 1.08
Toll Bar Road/Leechmere Road 0.36 0.64 0.50 0.51 0.72 0.74 0.71 0.71 0.82 0.70
Leechmere Way/Toll Bar Road 0.29 0.37 0.33 0.32 0.57 0.51 0.60 0.67 0.58 0.61
Leechmere/Toll Bar North 0.21 0.30 0.31 0.30 0.39 0.36 0.38 0.38 0.40 0.38
Leechmere Road 0.21 0.29 0.20 0.17 0.26 0.21 0.27 0.24 0.26 0.22
Leechmere Road/Tunstall Road 0.90 1.14 1.25 1.18 2.16 2.13 2.46 2.26 2.26 2.22
Premier Road/Essen Way 0.73 1.28 1.63 1.29 2.71 2.31 2.92 2.72 3.46 2.63
Warwick Terrace/Silksworth Lane 0.43 0.46 0.56 0.73 0.59 0.61 0.53 0.55 0.60 0.53
Silksworth Lane/North Moor Lane 0.33 0.43 0.30 0.33 1.07 1.46 1.60 1.47 1.57 1.34
Silksworth Lane/Silksworth Road 0.46 0.83 0.79 0.85 0.60 0.68 0.67 0.69 0.63 0.69
Silksworth Way/Silksworth Road 0.55 0.89 0.81 0.93 1.10 1.05 1.15 1.14 1.22 1.11
Essen Way/Langley Road 0.43 1.15 0.90 0.58 1.08 0.74 1.37 0.82 1.19 0.71
A690/West Park 0.37 0.70 0.41 0.48 1.07 1.07 0.60 1.08 1.08 1.07
West Park/Herringon Road 0.26 0.29 1.23 1.25 1.40 1.35 1.96 1.39 1.45 1.38
A690/Herrington Road 0.76 1.10 1.75 2.01 1.59 1.44 1.30 1.66 1.41 1.41
A690/North Moor Lane 0.95 1.27 1.24 1.21 1.37 1.23 1.20 1.22 1.26 1.23
Durham Road/Premier Road 0.97 1.33 1.52 0.99 1.13 1.40 1.66 2.25 1.60 1.76
A690/Barnes Park Road 0.39 0.55 0.59 0.46 0.73 0.59 0.82 0.61 0.75 0.65
Queen Alexandra Road/Silksworth Lane 0.55 0.74 0.73 0.69 0.87 0.85 0.93 0.93 0.87 0.86
Durham Road/Richard Avenue 0.33 0.56 0.69 0.62 0.81 0.70 0.93 0.76 0.87 0.73
Durham Road/Ettrick Grove 0.80 1.23 1.11 0.90 1.12 1.02 1.11 1.12 1.11 0.94
Ryhope Road/Ocean Road South 0.71 1.01 0.88 0.91 0.90 1.02 0.92 1.07 0.83 1.05
A1018/Ocean Road South 0.61 1.03 1.00 0.96 0.98 1.04 1.00 1.06 0.98 1.05
Queen Alexandra Rd/Ashbrooke Range 0.46 0.91 0.92 0.92 1.05 1.06 1.02 1.00 1.03 1.04
The Cedars/Ryhope Road 0.52 0.69 0.87 0.71 1.01 1.00 1.00 1.00 1.00 1.00
St Alban's Street/Commercial Road 0.72 1.03 1.05 1.01 1.06 1.02 1.07 1.05 1.09 1.03
Commercial Road/Robinson Terrace 0.70 0.93 0.95 0.87 1.04 0.98 1.15 0.96 1.04 0.97
Ryhope Road/Mowbray Road 0.41 0.46 0.60 0.50 1.12 1.08 1.10 1.10 1.12 1.16
Sunderland Local Plan April 2017
Commercial in Confidence
6/ Modelling Outputs & Impacted Junctions
23
Commercial Road/White House Road 0.72 0.97 1.02 0.93 1.14 1.08 0.99 1.07 1.17 1.08
A690/Barnes Park Road 0.39 0.55 0.59 0.46 0.73 0.59 0.82 0.61 0.75 0.65
Park Road/A1231 0.15 0.31 0.28 0.25 0.69 0.77 0.71 0.80 0.81 0.76
Burn Park/Eden House Road 0.35 0.72 0.55 0.78 0.78 0.91 1.00 0.93 0.92 0.96
New Durham Road/Burn Park Road 0.17 0.28 0.45 0.85 0.57 0.91 0.40 0.93 0.40 0.83
Burn Park/Derby Street 0.16 0.25 0.29 0.30 0.27 0.98 0.39 0.96 0.38 0.93
Chester Road/The Royalty 0.23 0.46 0.35 0.44 0.38 0.41 0.47 0.45 0.47 0.46
Chester Road/St Michael Way 1.00 1.64 0.98 0.91 1.87 1.65 1.55 1.73 1.92 1.64
Grange Terrace/ Thornhill Cres 0.48 0.54 0.75 0.81 0.96 1.08 1.06 1.08 1.00 1.07
A1231/A690 0.77 0.78 0.86 0.75 0.94 1.16 1.16 1.50 1.10 2.19
A690/St Michaels Way 0.58 0.66 0.67 0.78 1.01 1.12 1.11 1.12 1.10 1.12
SB St Michaels Way/ A690 0.52 0.44 0.63 0.75 0.65 0.78 0.68 0.79 0.73 0.80
Mary St/St Michaels Way 0.33 0.37 0.46 0.56 0.45 0.52 0.49 0.51 0.50 0.52
A1231/Belvedere Road 0.79 0.91 0.75 0.88 0.95 0.95 0.94 0.95 0.95 0.94
Lawrence St/Hendon Road 0.70 0.90 0.90 0.87 0.92 0.96 0.97 0.93 0.90 0.93
Borough Road/A1018 0.57 0.77 0.74 0.83 0.66 0.74 0.73 0.76 0.70 0.82
WB West Wear Street/Wearmouth Bridge 0.62 1.08 0.85 1.07 1.01 1.07 1.04 1.07 1.05 1.07
Wearmouth Bridge/St Mary's Way EB 0.30 0.34 0.43 0.40 0.48 0.44 0.46 0.46 0.46 0.45
WB St Mary's Way/Wearmouth Bridge 0.46 0.84 0.74 0.81 0.67 0.73 0.77 0.74 0.75 0.76
SB Wearmouth Bridge/West Wear Street 0.65 1.01 0.82 0.93 0.95 0.94 0.86 0.99 0.86 0.99
Chester Road/St Marks's Road 0.24 0.92 0.98 1.38 1.20 1.06 1.14 1.23 1.14 1.20
Kayll Road/Chester Road 0.97 1.03 0.97 0.93 1.05 1.56 1.12 1.17 1.15 1.26
Ettrick Grove/Chester Road 0.36 0.56 0.38 0.27 0.56 0.33 0.78 0.33 0.45 0.35
The Broadway/Springwell Road 0.97 1.67 1.13 1.21 1.17 1.18 1.22 1.14 1.17 1.16
Chester Road/Grindon Lane 0.58 1.09 0.66 0.56 0.76 0.59 1.07 1.00 0.95 0.50
Chester Road/Pennywell Road 0.82 1.03 1.06 1.06 1.27 1.29 1.18 1.16 2.26 2.17
Chester Road/Greenwood Road 0.71 1.21 0.82 0.79 0.84 0.78 1.13 0.80 0.99 0.81
Chester Road/Prestbury Road 0.31 0.93 1.02 0.96 1.33 1.30 1.47 1.45 1.50 1.56
Prestbury Road/Hylton Road 0.18 0.31 0.33 0.28 0.37 0.34 0.41 0.45 0.44 1.07
Hylton Road/Waterford Green 0.22 0.38 0.39 0.29 0.81 0.33 0.95 0.70 1.02 1.00
Hylton Road/Grindon Lane 0.47 0.84 0.78 0.94 1.14 1.00 1.13 1.04 1.13 1.04
Hylton Road/Portsmouth Road 0.27 0.41 0.52 0.39 0.62 0.41 0.60 0.42 0.59 0.42
Hylton Road/Font Road 0.51 0.53 0.83 0.88 1.22 1.20 1.28 1.20 1.20 1.20
Sunderland Local Plan April 2017
Commercial in Confidence
6/ Modelling Outputs & Impacted Junctions
24
Hylton Road/Kayll Road 0.87 1.02 1.19 0.97 0.97 0.99 1.01 1.12 1.01 1.10
St Luk's Terrace/St Luke's Road 0.14 0.18 0.21 0.40 0.42 0.79 0.40 0.79 0.47 0.83
Pallion New Road/Lisburn Terrace 0.29 1.07 0.38 0.41 0.41 0.46 0.46 0.47 0.45 0.50
Trimdon Street/ Silksworth Row 0.85 1.06 1.00 1.06 1.14 1.18 1.20 1.17 1.24 1.20
Hylton Road/Rutland Street 0.19 0.29 0.24 0.34 0.39 0.50 0.57 0.52 0.52 0.49
Hylton Road/St Marks Road North 0.27 0.96 0.49 0.60 0.53 0.94 0.51 0.96 0.65 0.98
A1018/Dame Dorothy Street 0.64 0.87 0.84 0.81 0.84 0.80 0.77 0.83 0.81 0.83
A1018/Sheepfolds North 0.51 0.66 0.66 0.62 1.90 1.94 1.78 1.99 1.81 2.05
Church Street/Dame Dorothy Street 0.68 1.05 1.03 0.95 1.00 0.90 0.95 0.96 0.96 0.92
North Bridge Street/Roker Avenue 0.74 1.08 0.95 1.11 1.44 1.11 1.03 1.27 1.03 1.27
Roker Avenue/Fulwell Road 0.89 1.11 1.00 0.94 1.00 0.99 0.98 1.01 0.99 1.02
Roker Avenue/Church Street 0.73 1.09 0.96 0.69 0.88 0.71 0.83 0.70 0.83 0.71
Dame Dorothy Street/Harbour View 0.30 0.35 0.38 0.39 0.39 0.36 0.42 0.38 0.38 0.36
Roker Baths Road/Fulwell Road 0.41 0.74 0.58 0.50 0.67 0.49 0.57 0.47 0.65 0.50
Roker Terrace/St George's Terrace 0.25 0.37 0.34 0.38 0.35 0.35 0.38 0.39 0.36 0.36
Whitburn Road/Chichester Road 0.19 0.25 0.31 0.34 0.31 0.31 0.34 0.36 0.32 0.33
Whitburn Road/Dykelands Road 0.96 1.28 1.01 1.01 1.41 1.51 1.62 1.87 1.88 1.94
Newcastle Road/A1018 0.42 0.70 0.57 0.57 0.57 0.53 0.64 0.52 0.56 0.53
A1018/Dovedale Road 0.40 1.03 0.95 0.85 0.95 0.95 1.07 0.95 0.97 0.95
Newcastle Road/Chalton Road 0.90 1.13 1.04 1.04 1.06 1.06 1.10 1.10 1.07 1.11
Newcastle Road/Newhaven Avenue 0.23 0.43 0.35 0.25 0.38 0.36 0.37 0.36 0.40 0.36
Newcastle Road/Crozier Street 0.27 0.46 0.41 0.61 0.44 0.58 0.42 0.64 0.43 0.70
Southwick Road/Stadium Way 0.43 0.75 0.83 0.81 0.92 0.89 0.93 0.97 0.93 0.97
Queens Road/Kier Hardie Way 0.57 0.87 0.74 0.86 0.84 0.91 0.94 1.00 0.86 1.01
Southwick Road/B1291 0.76 0.81 0.96 0.86 1.05 1.05 1.05 1.05 1.05 1.05
A1231/Camden Street 0.86 0.93 0.82 0.68 0.66 0.84 0.72 0.81 0.68 0.81
Camden Street/Trafford Road 0.29 0.37 0.29 0.33 0.28 0.73 0.27 0.81 0.28 0.73
Wessington Way/Queens Road 0.81 0.94 1.01 0.74 1.05 0.95 1.06 0.92 1.06 0.84
Wessington Way/A1231 0.85 1.20 1.07 0.97 1.29 1.20 1.31 1.20 1.31 1.20
Northern Way/Dean Terrace 0.83 0.80 0.85 0.87 0.93 0.84 0.90 0.87 0.94 0.97
Northern Way/North Hylton Road 0.33 0.55 0.49 0.38 0.68 0.60 0.70 0.61 0.72 0.59
Old Mill Road/Wembley Road 0.11 0.19 0.16 0.17 0.21 0.30 0.26 0.35 0.25 0.35
Hylton Road/Castletown Way 0.92 0.91 0.78 0.98 1.00 1.02 0.99 1.02 1.00 1.02

Sunderland Local Plan April 2017
Commercial in Confidence
6/ Modelling Outputs & Impacted Junctions
25
North Hylton Road/Radlett Road 0.45 0.85 0.86 0.59 0.73 0.53 0.93 0.60 0.80 0.73
Castletown Way/Riverside Road 0.63 0.42 0.67 0.48 1.17 1.11 1.11 1.10 2.24 0.80
Wessington Way/Castletown Way 0.94 1.23 1.18 1.07 1.19 1.19 1.21 1.53 1.54 1.18
Wessington Way/Colima Avenue 0.89 1.21 1.87 1.11 1.29 1.57 1.45 1.41 1.35 1.43
Grange Road/Barons Quay Road 0.26 0.34 0.36 0.76 0.54 0.80 0.68 0.85 0.49 0.88
Wessington Way/Ferryboat Lane 0.98 1.21 1.15 1.07 1.29 1.10 1.31 1.21 1.31 1.12
Washington Road/Ferryboat Lane 0.74 1.15 1.08 1.11 1.08 1.16 1.03 1.18 1.08 1.17
Washington Road/Blackwood Road 0.65 1.10 0.99 1.02 1.10 1.04 1.07 1.03 1.10 1.04
Washington Road/Canterbury Road 0.18 0.32 0.28 0.55 0.28 0.68 0.28 0.65 0.33 0.67
Washington Road/Hylton Lane 0.85 1.02 0.88 1.00 1.04 0.95 1.07 0.93 1.03 0.93
Washington Road/Craigavon Road 0.71 0.89 1.00 0.95 1.08 1.06 1.10 1.06 1.08 1.05
Washington Road/Rotherfield Road 0.38 0.90 0.93 0.66 0.92 0.51 1.57 0.53 0.94 0.66
Kingsway Road/Hylton Lane 0.10 0.14 0.29 0.28 0.48 0.53 0.59 0.56 0.50 0.50
A1290/Downhill Lane 0.21 0.47 0.94 1.43 1.51 1.23 1.03 1.32 1.22 1.31
A1290/Nissan Sight 0.67 0.65 1.01 1.04 1.15 1.26 0.90 1.38 1.28 1.36
A1290/Cherry Blossom Way 0.20 0.49 1.11 0.99 7.59 2.10 0.61 3.32 6.79 3.91
Nissan Way/A1231 0.14 0.25 0.55 0.38 3.02 2.01 0.32 3.02 3.76 3.01
Sunderland Highway/ SB Pattinson Road 0.16 0.21 0.26 0.12 0.18 0.15 0.26 0.15 0.18 0.15
NB Pattinson Way/A1231 0.33 0.55 2.67 2.67 2.67 2.67 2.67 2.67 2.67 2.67
Sunderland Highway/ NB Nissan Way 0.11 0.19 0.17 0.25 0.26 0.26 0.26 0.24 1.07 1.00
Glover Road/Spire Road 0.11 0.37 0.53 0.49 0.70 0.66 0.49 0.95 0.82 0.95
A1231/Spire Road 0.15 0.53 0.62 0.60 0.88 0.74 0.65 1.03 0.93 1.03
A1231/Horsley Road 0.20 0.34 0.97 0.27 0.37 0.33 0.31 1.01 0.47 1.01
Northumberland Way SB Onslip/Sunderland Highway
0.21 0.34 0.19 0.36 0.22 0.34 0.31 0.34 0.27 0.35
Northumberland Way /Sunderland Hwy Offslip 0.19 0.22 0.31 0.29 0.29 0.25 0.33 0.17 0.30 0.17
Northumberland Way NB Onslip/Sunderland Hwy
0.17 0.26 0.26 0.34 0.34 0.37 0.38 0.38 0.36 0.38
Northumberland Way NB/Sunderland Hwy Offslip
0.22 0.30 0.32 0.35 0.37 0.36 0.38 0.30 0.36 0.29
Washington Hwy SB Offslip/A1231 0.75 0.92 1.01 1.01 1.03 1.09 1.05 1.14 1.05 1.14
Sunderland Hwy EB Offslip/Washington Hwy SB
0.84 0.97 1.05 0.73 1.00 0.73 0.79 0.72 0.96 0.70
Washington Hwy NB Offslip/A1231 0.51 0.73 0.82 0.94 0.83 0.98 0.68 0.94 0.93 0.95
Sunderland Local Plan April 2017
Commercial in Confidence
6/ Modelling Outputs & Impacted Junctions
26
A1231 WB Offslip/Washington Hwy 0.83 0.93 0.94 1.02 0.93 1.01 1.07 1.06 1.02 1.06
A182 - Salter's Ln 0.00 0.01 0.69 0.81 1.70 1.27 1.67 1.36 1.99 1.37
A182 - Murton Ln 0.00 0.00 1.44 1.54 1.45 1.54 1.45 1.55 1.29 1.55
WB A182 - B1284 0.01 0.01 1.43 1.69 2.35 2.23 2.86 4.34 3.41 4.81
SB A182 - B1284 0.00 0.00 0.48 0.39 0.31 0.46 0.28 0.50 0.35 0.50
A182 - Caroline St 0.01 0.01 0.15 0.36 2.12 2.73 2.17 2.48 2.27 2.57
A182 - Regent St 0.00 0.00 0.05 0.00 1.66 1.70 1.33 1.47 1.48 1.50
A182 - The Bungalows 0.00 0.00 0.54 0.26 1.35 1.40 1.27 1.46 1.34 1.42
B1260 - B1284 0.01 0.01 0.32 0.28 0.40 0.32 0.42 0.43 0.41 0.47
B1284 - Cygnet Way 0.00 0.01 0.60 0.43 0.90 0.52 0.61 0.66 1.01 0.67
A690 - Slip Roads/ Cygnet Way 0.02 0.02 1.00 0.74 1.23 0.87 1.11 1.04 1.26 1.06
A182 - B1260 0.01 0.01 1.21 2.31 2.58 3.46 2.63 3.10 2.72 2.98
B1404 - B1260 0.00 0.01 0.97 0.29 2.34 1.06 1.50 1.32 1.41 1.23
B1404 - Salters Lane 0.26 0.26 0.40 0.29 0.76 0.65 0.68 0.70 0.91 0.69
A1052 - Dairy Lane 0.01 0.01 0.50 0.63 0.50 0.54 0.51 0.48 0.52 0.49
A1052 - Britannia Terrace 0.24 0.40 1.70 1.66 1.63 1.73 1.91 1.93 1.85 1.94
A690 - A1052 NB off slip 0.00 0.00 0.92 0.90 0.85 1.05 0.78 1.00 0.76 0.96
A690 - A1052 Dairy Lane entry 0.00 0.00 0.42 0.40 1.15 0.56 1.05 0.82 1.17 0.88
A690 - A1052 SB off slip 0.00 0.00 0.70 0.52 0.77 0.55 0.85 0.58 0.83 0.62
A690 - A1052 A182 entry 0.00 0.00 0.97 0.63 1.16 0.69 1.09 0.84 1.22 0.93
A690 - B1404 - NB parallel slip 0.00 0.00 0.18 0.19 0.21 0.22 0.20 0.23 0.19 0.23
A690 - B1404 - A182 Hillside Way 0.00 0.00 0.28 0.19 0.50 0.27 0.53 0.38 0.57 0.42
A690 - B1404 - A182 SB off slip 0.00 0.00 0.08 0.11 0.03 0.04 0.02 0.02 0.02 0.02
A690 - B1404 - Lake Road entry 0.00 0.00 1.09 1.04 1.18 1.21 1.42 1.25 1.50 1.28
Vigo Ln - Picktree Ln 0.45 0.80 1.03 1.09 1.04 1.04 1.05 1.04 1.03 1.04
Picktree Ln - Bonemill Ln 0.47 0.72 1.02 0.97 1.19 1.11 1.14 1.15 1.26 1.14
Bonemill Ln/ Vigo Ln 0.31 0.61 0.66 0.75 0.75 0.90 0.74 0.93 0.78 0.94
A182 - Coaley Ln 1.01 1.02 2.00 2.00 2.00 2.00 2.00 2.00 2.11 2.00
A182 - B1286 0.86 1.07 1.48 1.35 1.97 1.77 1.46 2.06 2.47 2.13
A182 - A183 1.00 1.04 1.45 1.29 1.97 1.75 2.16 2.00 2.26 2.06
Sunderland Local Plan April 2017
Commercial in Confidence
6/ Modelling Outputs & Impacted Junctions
27
6.3 RFC SATURN Junction Results
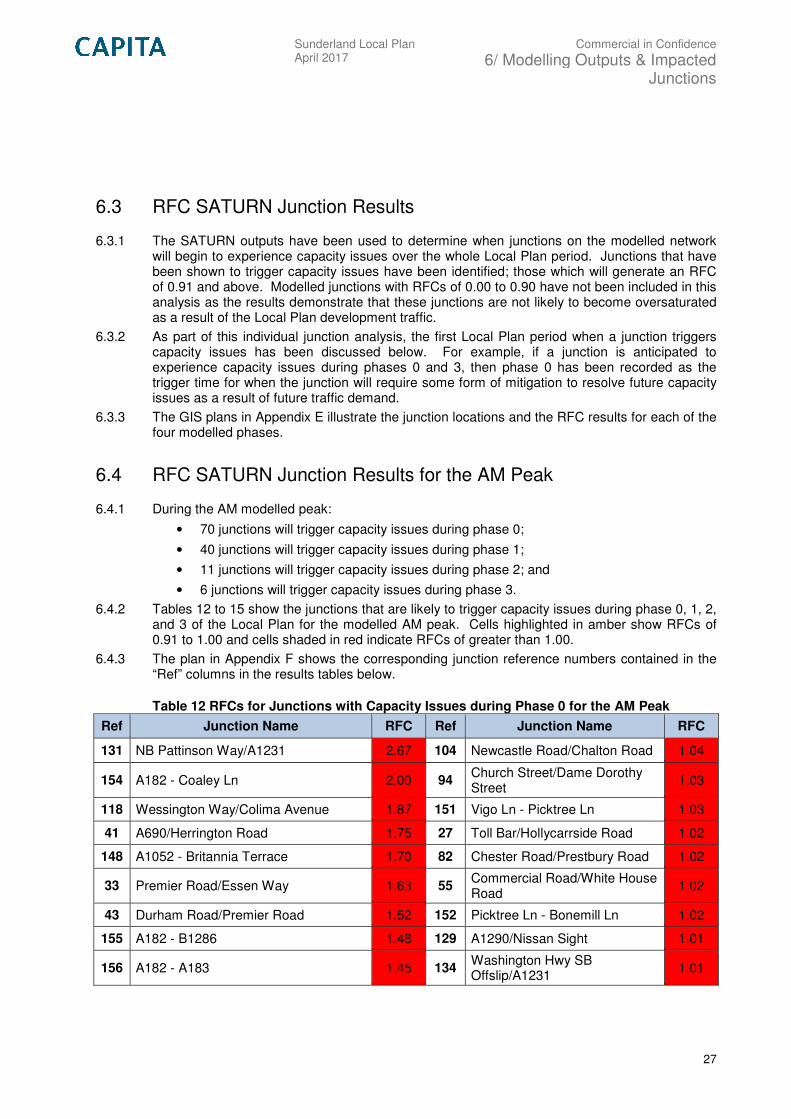
6.3.1 The SATURN outputs have been used to determine when junctions on the modelled network will begin to experience capacity issues over the whole Local Plan period. Junctions that have been shown to trigger capacity issues have been identified; those which will generate an RFC of 0.91 and above. Modelled junctions with RFCs of 0.00 to 0.90 have not been included in this analysis as the results demonstrate that these junctions are not likely to become oversaturated as a result of the Local Plan development traffic.
6.3.2 As part of this individual junction analysis, the first Local Plan period when a junction triggers capacity issues has been discussed below. For example, if a junction is anticipated to experience capacity issues during phases 0 and 3, then phase 0 has been recorded as the trigger time for when the junction will require some form of mitigation to resolve future capacity issues as a result of future traffic demand.
6.3.3 The GIS plans in Appendix E illustrate the junction locations and the RFC results for each of the four modelled phases.
6.4 RFC SATURN Junction Results for the AM Peak
6.4.1 During the AM modelled peak:
• 70 junctions will trigger capacity issues during phase 0;
• 40 junctions will trigger capacity issues during phase 1;
• 11 junctions will trigger capacity issues during phase 2; and
• 6 junctions will trigger capacity issues during phase 3.
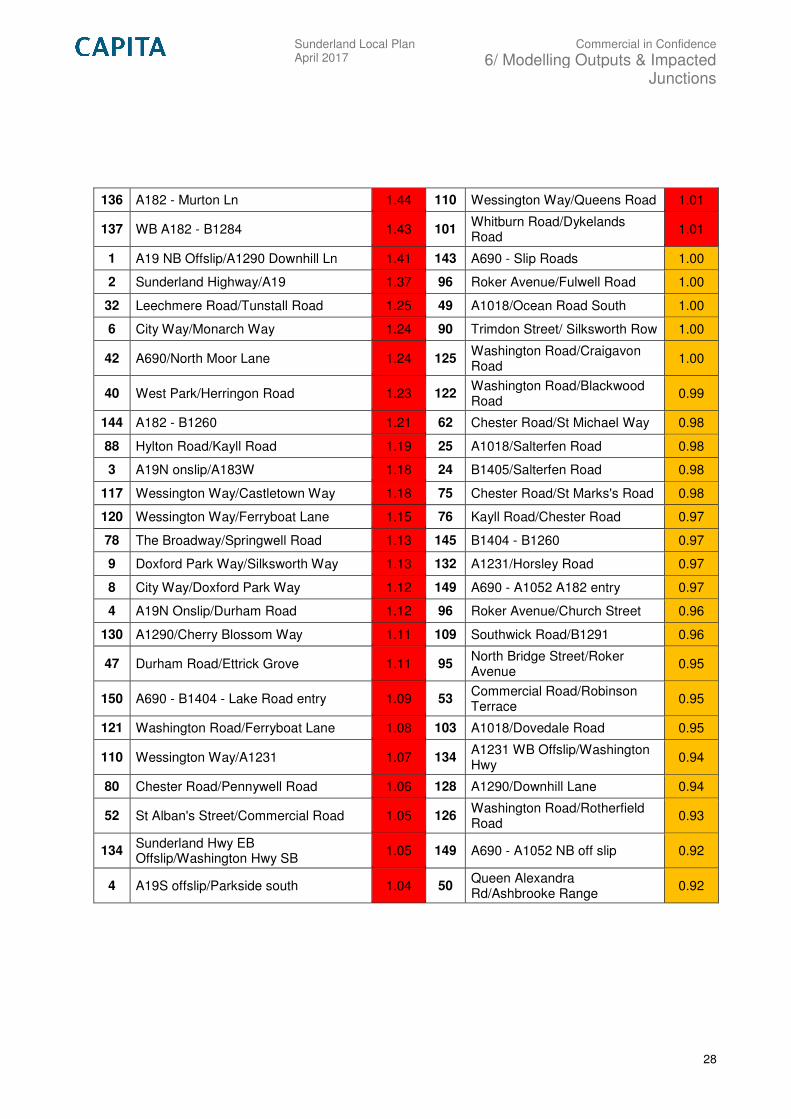
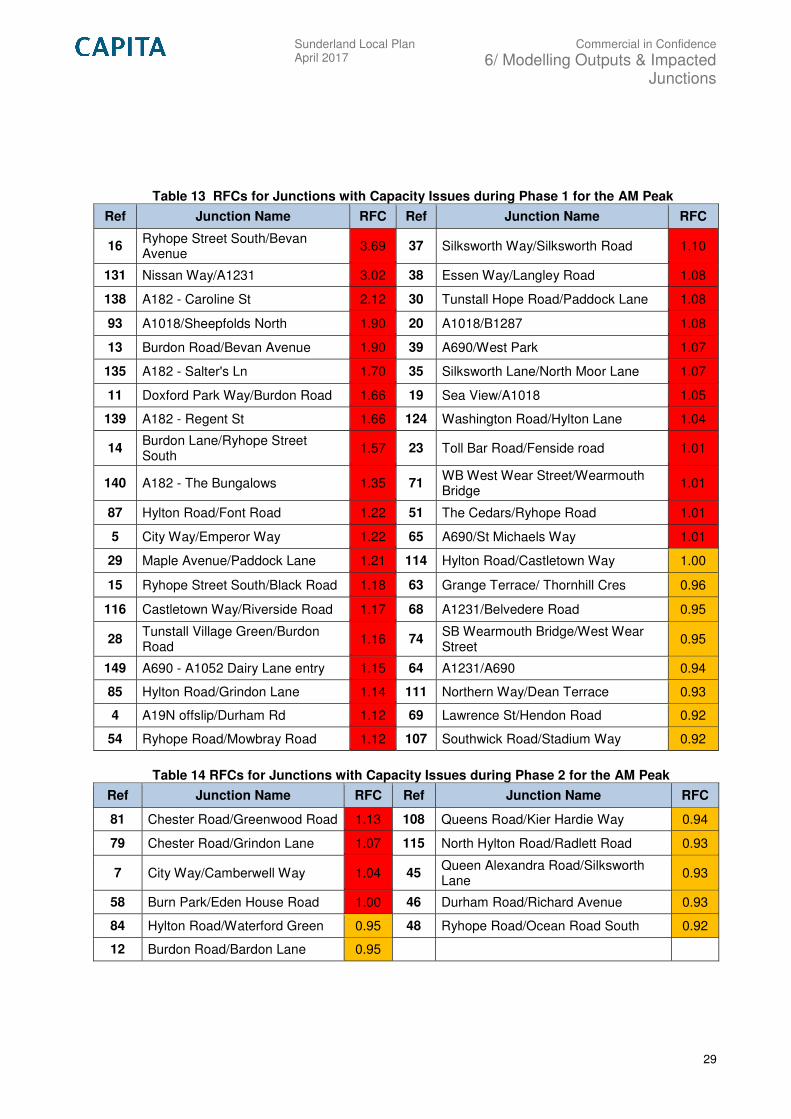
6.4.2 Tables 12 to 15 show the junctions that are likely to trigger capacity issues during phase 0, 1, 2, and 3 of the Local Plan for the modelled AM peak. Cells highlighted in amber show RFCs of 0.91 to 1.00 and cells shaded in red indicate RFCs of greater than 1.00.
6.4.3 The plan in Appendix F shows the corresponding junction reference numbers contained in the “Ref” columns in the results tables below.
Table 12 RFCs for Junctions with Capacity Issues during Phase 0 for the AM Peak
Ref Junction Name RFC Ref Junction Name RFC
131 NB Pattinson Way/A1231 2.67 104 Newcastle Road/Chalton Road 1.04
154 A182 - Coaley Ln 2.00 94 Church Street/Dame Dorothy Street
1.03
118 Wessington Way/Colima Avenue 1.87 151 Vigo Ln - Picktree Ln 1.03
41 A690/Herrington Road 1.75 27 Toll Bar/Hollycarrside Road 1.02
148 A1052 - Britannia Terrace 1.70 82 Chester Road/Prestbury Road 1.02
33 Premier Road/Essen Way 1.63 55 Commercial Road/White House Road
1.02
43 Durham Road/Premier Road 1.52 152 Picktree Ln - Bonemill Ln 1.02
155 A182 - B1286 1.48 129 A1290/Nissan Sight 1.01
156 A182 - A183 1.45 134 Washington Hwy SB Offslip/A1231
1.01
Sunderland Local Plan April 2017
Commercial in Confidence
6/ Modelling Outputs & Impacted Junctions
28
136 A182 - Murton Ln 1.44 110 Wessington Way/Queens Road 1.01
137 WB A182 - B1284 1.43 101 Whitburn Road/Dykelands Road
1.01
1 A19 NB Offslip/A1290 Downhill Ln 1.41 143 A690 - Slip Roads 1.00
2 Sunderland Highway/A19 1.37 96 Roker Avenue/Fulwell Road 1.00
32 Leechmere Road/Tunstall Road 1.25 49 A1018/Ocean Road South 1.00
6 City Way/Monarch Way 1.24 90 Trimdon Street/ Silksworth Row 1.00
42 A690/North Moor Lane 1.24 125 Washington Road/Craigavon Road
1.00
40 West Park/Herringon Road 1.23 122 Washington Road/Blackwood Road
0.99
144 A182 - B1260 1.21 62 Chester Road/St Michael Way 0.98
88 Hylton Road/Kayll Road 1.19 25 A1018/Salterfen Road 0.98
3 A19N onslip/A183W 1.18 24 B1405/Salterfen Road 0.98
117 Wessington Way/Castletown Way 1.18 75 Chester Road/St Marks's Road 0.98
120 Wessington Way/Ferryboat Lane 1.15 76 Kayll Road/Chester Road 0.97
78 The Broadway/Springwell Road 1.13 145 B1404 - B1260 0.97
9 Doxford Park Way/Silksworth Way 1.13 132 A1231/Horsley Road 0.97
8 City Way/Doxford Park Way 1.12 149 A690 - A1052 A182 entry 0.97
4 A19N Onslip/Durham Road 1.12 96 Roker Avenue/Church Street 0.96
130 A1290/Cherry Blossom Way 1.11 109 Southwick Road/B1291 0.96
47 Durham Road/Ettrick Grove 1.11 95 North Bridge Street/Roker Avenue
0.95
150 A690 - B1404 - Lake Road entry 1.09 53 Commercial Road/Robinson Terrace
0.95
121 Washington Road/Ferryboat Lane 1.08 103 A1018/Dovedale Road 0.95
110 Wessington Way/A1231 1.07 134 A1231 WB Offslip/Washington Hwy
0.94
80 Chester Road/Pennywell Road 1.06 128 A1290/Downhill Lane 0.94
52 St Alban's Street/Commercial Road 1.05 126 Washington Road/Rotherfield Road
0.93
134 Sunderland Hwy EB Offslip/Washington Hwy SB
1.05 149 A690 - A1052 NB off slip 0.92
4 A19S offslip/Parkside south 1.04 50 Queen Alexandra Rd/Ashbrooke Range
0.92
Sunderland Local Plan April 2017
Commercial in Confidence
6/ Modelling Outputs & Impacted Junctions
29
Table 13 RFCs for Junctions with Capacity Issues during Phase 1 for the AM Peak
Ref Junction Name RFC Ref Junction Name RFC
16 Ryhope Street South/Bevan Avenue
3.69 37 Silksworth Way/Silksworth Road 1.10
131 Nissan Way/A1231 3.02 38 Essen Way/Langley Road 1.08
138 A182 - Caroline St 2.12 30 Tunstall Hope Road/Paddock Lane 1.08
93 A1018/Sheepfolds North 1.90 20 A1018/B1287 1.08
13 Burdon Road/Bevan Avenue 1.90 39 A690/West Park 1.07
135 A182 - Salter's Ln 1.70 35 Silksworth Lane/North Moor Lane 1.07
11 Doxford Park Way/Burdon Road 1.66 19 Sea View/A1018 1.05
139 A182 - Regent St 1.66 124 Washington Road/Hylton Lane 1.04
14 Burdon Lane/Ryhope Street South
1.57 23 Toll Bar Road/Fenside road 1.01
140 A182 - The Bungalows 1.35 71 WB West Wear Street/Wearmouth Bridge
1.01
87 Hylton Road/Font Road 1.22 51 The Cedars/Ryhope Road 1.01
5 City Way/Emperor Way 1.22 65 A690/St Michaels Way 1.01
29 Maple Avenue/Paddock Lane 1.21 114 Hylton Road/Castletown Way 1.00
15 Ryhope Street South/Black Road 1.18 63 Grange Terrace/ Thornhill Cres 0.96
116 Castletown Way/Riverside Road 1.17 68 A1231/Belvedere Road 0.95
28 Tunstall Village Green/Burdon Road
1.16 74 SB Wearmouth Bridge/West Wear Street
0.95
149 A690 - A1052 Dairy Lane entry 1.15 64 A1231/A690 0.94
85 Hylton Road/Grindon Lane 1.14 111 Northern Way/Dean Terrace 0.93
4 A19N offslip/Durham Rd 1.12 69 Lawrence St/Hendon Road 0.92
54 Ryhope Road/Mowbray Road 1.12 107 Southwick Road/Stadium Way 0.92
Table 14 RFCs for Junctions with Capacity Issues during Phase 2 for the AM Peak
Ref Junction Name RFC Ref Junction Name RFC
81 Chester Road/Greenwood Road 1.13 108 Queens Road/Kier Hardie Way 0.94
79 Chester Road/Grindon Lane 1.07 115 North Hylton Road/Radlett Road 0.93
7 City Way/Camberwell Way 1.04 45 Queen Alexandra Road/Silksworth Lane
0.93
58 Burn Park/Eden House Road 1.00 46 Durham Road/Richard Avenue 0.93
84 Hylton Road/Waterford Green 0.95 48 Ryhope Road/Ocean Road South 0.92
12 Burdon Road/Bardon Lane 0.95
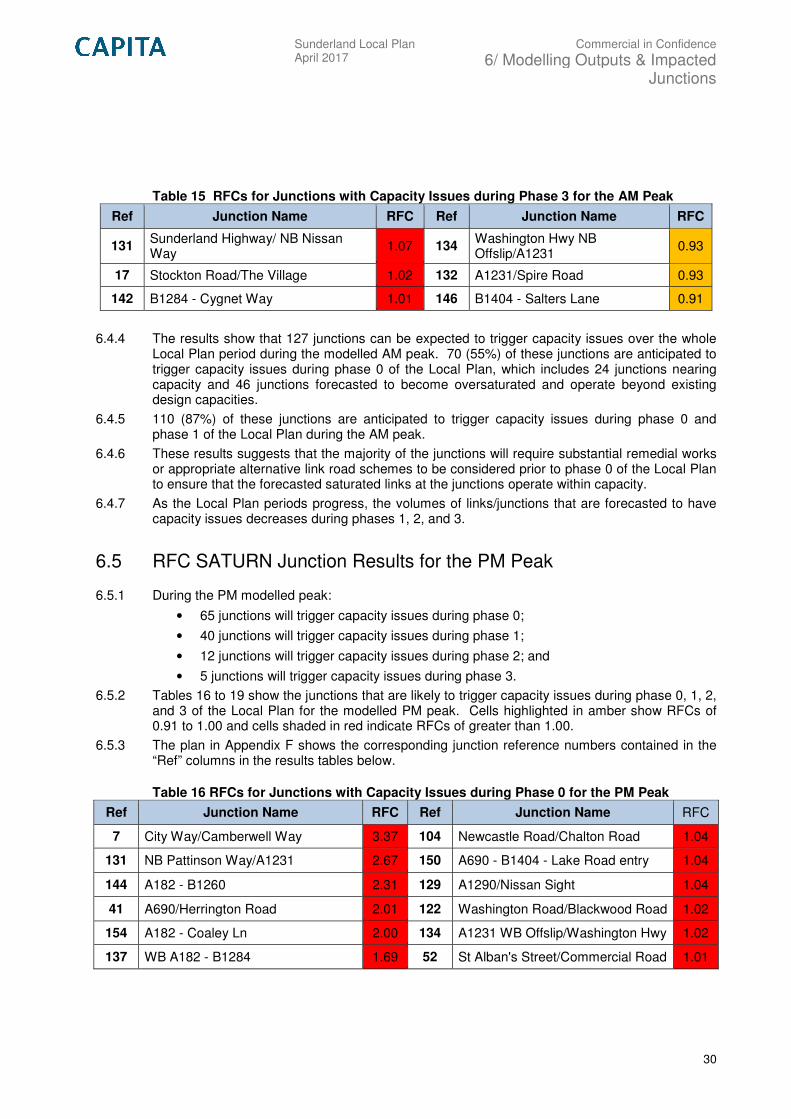
Sunderland Local Plan April 2017
Commercial in Confidence
6/ Modelling Outputs & Impacted Junctions
30
Table 15 RFCs for Junctions with Capacity Issues during Phase 3 for the AM Peak
Ref Junction Name RFC Ref Junction Name RFC
131 Sunderland Highway/ NB Nissan Way
1.07 134 Washington Hwy NB Offslip/A1231
0.93
17 Stockton Road/The Village 1.02 132 A1231/Spire Road 0.93
142 B1284 - Cygnet Way 1.01 146 B1404 - Salters Lane 0.91
6.4.4 The results show that 127 junctions can be expected to trigger capacity issues over the whole Local Plan period during the modelled AM peak. 70 (55%) of these junctions are anticipated to trigger capacity issues during phase 0 of the Local Plan, which includes 24 junctions nearing capacity and 46 junctions forecasted to become oversaturated and operate beyond existing design capacities.
6.4.5 110 (87%) of these junctions are anticipated to trigger capacity issues during phase 0 and phase 1 of the Local Plan during the AM peak.
6.4.6 These results suggests that the majority of the junctions will require substantial remedial works or appropriate alternative link road schemes to be considered prior to phase 0 of the Local Plan to ensure that the forecasted saturated links at the junctions operate within capacity.
6.4.7 As the Local Plan periods progress, the volumes of links/junctions that are forecasted to have capacity issues decreases during phases 1, 2, and 3.
6.5 RFC SATURN Junction Results for the PM Peak
6.5.1 During the PM modelled peak:
• 65 junctions will trigger capacity issues during phase 0;
• 40 junctions will trigger capacity issues during phase 1;
• 12 junctions will trigger capacity issues during phase 2; and
• 5 junctions will trigger capacity issues during phase 3.
6.5.2 Tables 16 to 19 show the junctions that are likely to trigger capacity issues during phase 0, 1, 2, and 3 of the Local Plan for the modelled PM peak. Cells highlighted in amber show RFCs of 0.91 to 1.00 and cells shaded in red indicate RFCs of greater than 1.00.
6.5.3 The plan in Appendix F shows the corresponding junction reference numbers contained in the “Ref” columns in the results tables below.
Table 16 RFCs for Junctions with Capacity Issues during Phase 0 for the PM Peak
Ref Junction Name RFC Ref Junction Name RFC
7 City Way/Camberwell Way 3.37 104 Newcastle Road/Chalton Road 1.04
131 NB Pattinson Way/A1231 2.67 150 A690 - B1404 - Lake Road entry 1.04
144 A182 - B1260 2.31 129 A1290/Nissan Sight 1.04
41 A690/Herrington Road 2.01 122 Washington Road/Blackwood Road 1.02
154 A182 - Coaley Ln 2.00 134 A1231 WB Offslip/Washington Hwy 1.02
137 WB A182 - B1284 1.69 52 St Alban's Street/Commercial Road 1.01
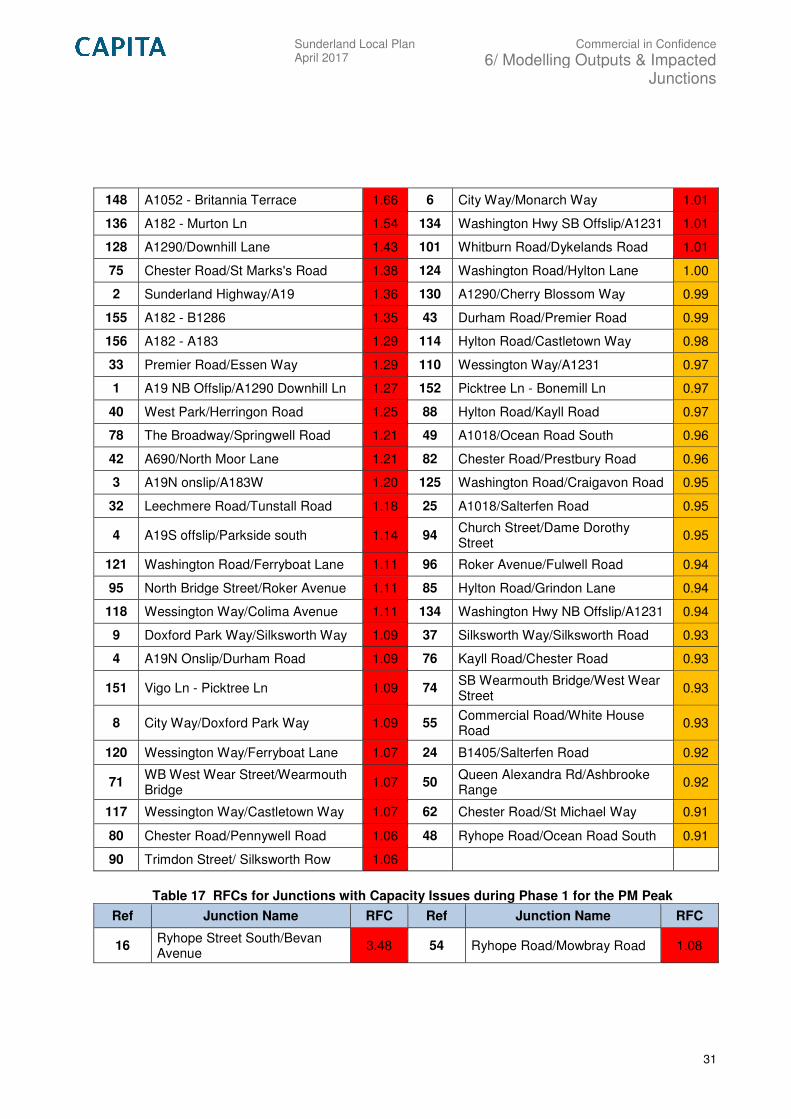
Sunderland Local Plan April 2017
Commercial in Confidence
6/ Modelling Outputs & Impacted Junctions
31
148 A1052 - Britannia Terrace 1.66 6 City Way/Monarch Way 1.01
136 A182 - Murton Ln 1.54 134 Washington Hwy SB Offslip/A1231 1.01
128 A1290/Downhill Lane 1.43 101 Whitburn Road/Dykelands Road 1.01
75 Chester Road/St Marks's Road 1.38 124 Washington Road/Hylton Lane 1.00
2 Sunderland Highway/A19 1.36 130 A1290/Cherry Blossom Way 0.99
155 A182 - B1286 1.35 43 Durham Road/Premier Road 0.99
156 A182 - A183 1.29 114 Hylton Road/Castletown Way 0.98
33 Premier Road/Essen Way 1.29 110 Wessington Way/A1231 0.97
1 A19 NB Offslip/A1290 Downhill Ln 1.27 152 Picktree Ln - Bonemill Ln 0.97
40 West Park/Herringon Road 1.25 88 Hylton Road/Kayll Road 0.97
78 The Broadway/Springwell Road 1.21 49 A1018/Ocean Road South 0.96
42 A690/North Moor Lane 1.21 82 Chester Road/Prestbury Road 0.96
3 A19N onslip/A183W 1.20 125 Washington Road/Craigavon Road 0.95
32 Leechmere Road/Tunstall Road 1.18 25 A1018/Salterfen Road 0.95
4 A19S offslip/Parkside south 1.14 94 Church Street/Dame Dorothy Street
0.95
121 Washington Road/Ferryboat Lane 1.11 96 Roker Avenue/Fulwell Road 0.94
95 North Bridge Street/Roker Avenue 1.11 85 Hylton Road/Grindon Lane 0.94
118 Wessington Way/Colima Avenue 1.11 134 Washington Hwy NB Offslip/A1231 0.94
9 Doxford Park Way/Silksworth Way 1.09 37 Silksworth Way/Silksworth Road 0.93
4 A19N Onslip/Durham Road 1.09 76 Kayll Road/Chester Road 0.93
151 Vigo Ln - Picktree Ln 1.09 74 SB Wearmouth Bridge/West Wear Street
0.93
8 City Way/Doxford Park Way 1.09 55 Commercial Road/White House Road
0.93
120 Wessington Way/Ferryboat Lane 1.07 24 B1405/Salterfen Road 0.92
71 WB West Wear Street/Wearmouth Bridge
1.07 50 Queen Alexandra Rd/Ashbrooke Range
0.92
117 Wessington Way/Castletown Way 1.07 62 Chester Road/St Michael Way 0.91
80 Chester Road/Pennywell Road 1.06 48 Ryhope Road/Ocean Road South 0.91
90 Trimdon Street/ Silksworth Row 1.06
Table 17 RFCs for Junctions with Capacity Issues during Phase 1 for the PM Peak
Ref Junction Name RFC Ref Junction Name RFC
16 Ryhope Street South/Bevan Avenue
3.48 54 Ryhope Road/Mowbray Road 1.08
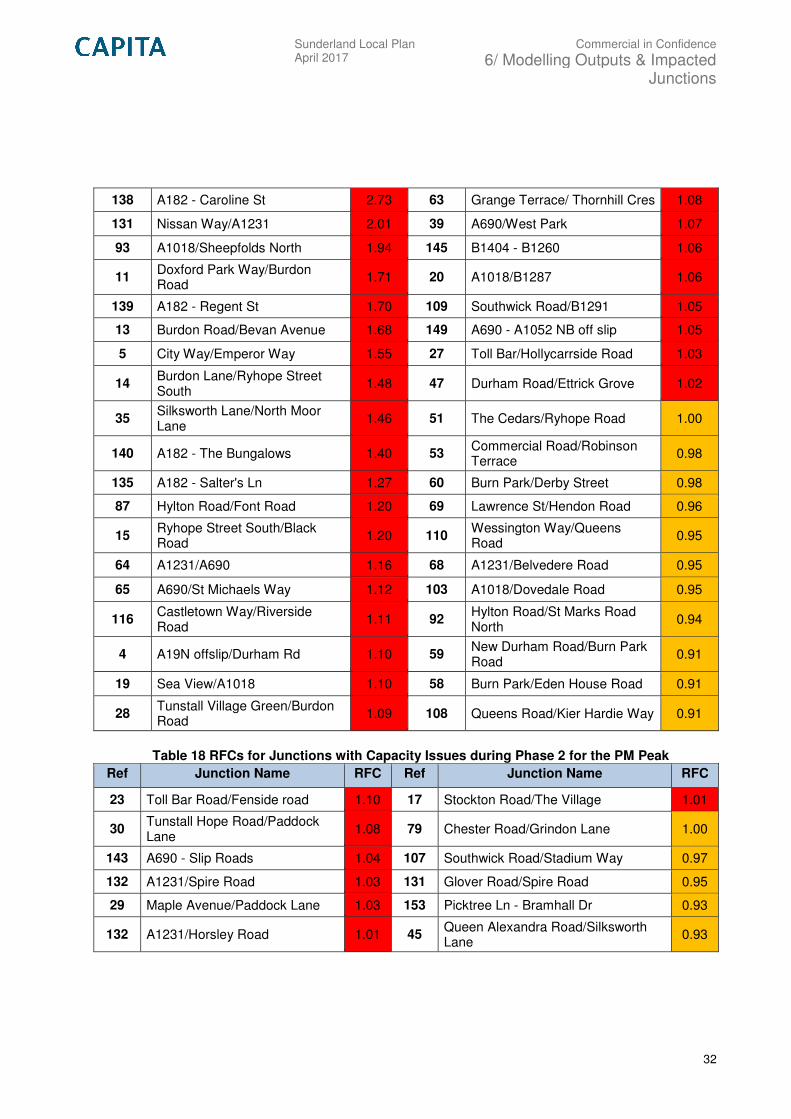
Sunderland Local Plan April 2017
Commercial in Confidence
6/ Modelling Outputs & Impacted Junctions
32
138 A182 - Caroline St 2.73 63 Grange Terrace/ Thornhill Cres 1.08
131 Nissan Way/A1231 2.01 39 A690/West Park 1.07
93 A1018/Sheepfolds North 1.94 145 B1404 - B1260 1.06
11 Doxford Park Way/Burdon Road
1.71 20 A1018/B1287 1.06
139 A182 - Regent St 1.70 109 Southwick Road/B1291 1.05
13 Burdon Road/Bevan Avenue 1.68 149 A690 - A1052 NB off slip 1.05
5 City Way/Emperor Way 1.55 27 Toll Bar/Hollycarrside Road 1.03
14 Burdon Lane/Ryhope Street South
1.48 47 Durham Road/Ettrick Grove 1.02
35 Silksworth Lane/North Moor Lane
1.46 51 The Cedars/Ryhope Road 1.00
140 A182 - The Bungalows 1.40 53 Commercial Road/Robinson Terrace
0.98
135 A182 - Salter's Ln 1.27 60 Burn Park/Derby Street 0.98
87 Hylton Road/Font Road 1.20 69 Lawrence St/Hendon Road 0.96
15 Ryhope Street South/Black Road
1.20 110 Wessington Way/Queens Road
0.95
64 A1231/A690 1.16 68 A1231/Belvedere Road 0.95
65 A690/St Michaels Way 1.12 103 A1018/Dovedale Road 0.95
116 Castletown Way/Riverside Road
1.11 92 Hylton Road/St Marks Road North
0.94
4 A19N offslip/Durham Rd 1.10 59 New Durham Road/Burn Park Road
0.91
19 Sea View/A1018 1.10 58 Burn Park/Eden House Road 0.91
28 Tunstall Village Green/Burdon Road
1.09 108 Queens Road/Kier Hardie Way 0.91
Table 18 RFCs for Junctions with Capacity Issues during Phase 2 for the PM Peak
Ref Junction Name RFC Ref Junction Name RFC
23 Toll Bar Road/Fenside road 1.10 17 Stockton Road/The Village 1.01
30 Tunstall Hope Road/Paddock Lane
1.08 79 Chester Road/Grindon Lane 1.00
143 A690 - Slip Roads 1.04 107 Southwick Road/Stadium Way 0.97
132 A1231/Spire Road 1.03 131 Glover Road/Spire Road 0.95
29 Maple Avenue/Paddock Lane 1.03 153 Picktree Ln - Bramhall Dr 0.93
132 A1231/Horsley Road 1.01 45 Queen Alexandra Road/Silksworth Lane
0.93
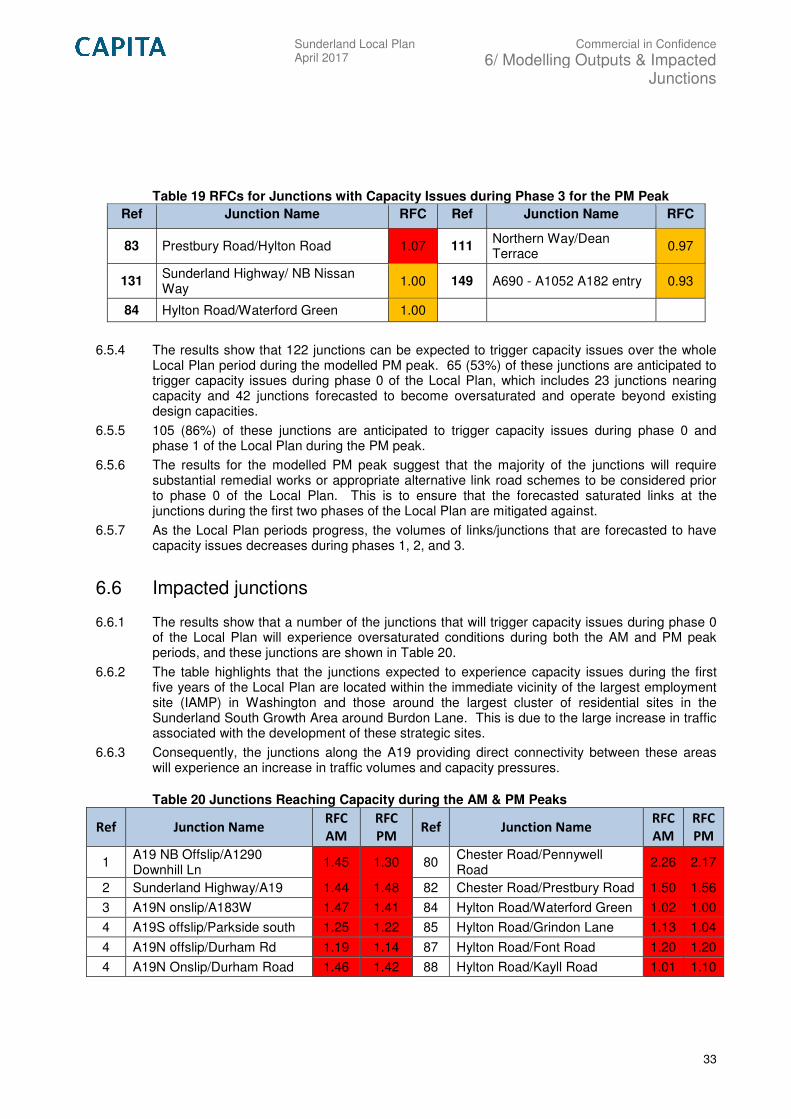
Sunderland Local Plan April 2017
Commercial in Confidence
6/ Modelling Outputs & Impacted Junctions
33
Table 19 RFCs for Junctions with Capacity Issues during Phase 3 for the PM Peak
Ref Junction Name RFC Ref Junction Name RFC
83 Prestbury Road/Hylton Road 1.07 111 Northern Way/Dean Terrace
0.97
131 Sunderland Highway/ NB Nissan Way
1.00 149 A690 - A1052 A182 entry 0.93
84 Hylton Road/Waterford Green 1.00
6.5.4 The results show that 122 junctions can be expected to trigger capacity issues over the whole Local Plan period during the modelled PM peak. 65 (53%) of these junctions are anticipated to trigger capacity issues during phase 0 of the Local Plan, which includes 23 junctions nearing capacity and 42 junctions forecasted to become oversaturated and operate beyond existing design capacities.
6.5.5 105 (86%) of these junctions are anticipated to trigger capacity issues during phase 0 and phase 1 of the Local Plan during the PM peak.
6.5.6 The results for the modelled PM peak suggest that the majority of the junctions will require substantial remedial works or appropriate alternative link road schemes to be considered prior to phase 0 of the Local Plan. This is to ensure that the forecasted saturated links at the junctions during the first two phases of the Local Plan are mitigated against.
6.5.7 As the Local Plan periods progress, the volumes of links/junctions that are forecasted to have capacity issues decreases during phases 1, 2, and 3.
6.6 Impacted junctions
6.6.1 The results show that a number of the junctions that will trigger capacity issues during phase 0 of the Local Plan will experience oversaturated conditions during both the AM and PM peak periods, and these junctions are shown in Table 20.
6.6.2 The table highlights that the junctions expected to experience capacity issues during the first five years of the Local Plan are located within the immediate vicinity of the largest employment site (IAMP) in Washington and those around the largest cluster of residential sites in the Sunderland South Growth Area around Burdon Lane. This is due to the large increase in traffic associated with the development of these strategic sites.
6.6.3 Consequently, the junctions along the A19 providing direct connectivity between these areas will experience an increase in traffic volumes and capacity pressures.
Table 20 Junctions Reaching Capacity during the AM & PM Peaks
Ref Junction Name RFC
AM
RFC
PM Ref Junction Name
RFC
AM
RFC
PM
1 A19 NB Offslip/A1290 Downhill Ln
1.45 1.30 80 Chester Road/Pennywell Road
2.26 2.17
2 Sunderland Highway/A19 1.44 1.48 82 Chester Road/Prestbury Road 1.50 1.56
3 A19N onslip/A183W 1.47 1.41 84 Hylton Road/Waterford Green 1.02 1.00
4 A19S offslip/Parkside south 1.25 1.22 85 Hylton Road/Grindon Lane 1.13 1.04
4 A19N offslip/Durham Rd 1.19 1.14 87 Hylton Road/Font Road 1.20 1.20
4 A19N Onslip/Durham Road 1.46 1.42 88 Hylton Road/Kayll Road 1.01 1.10
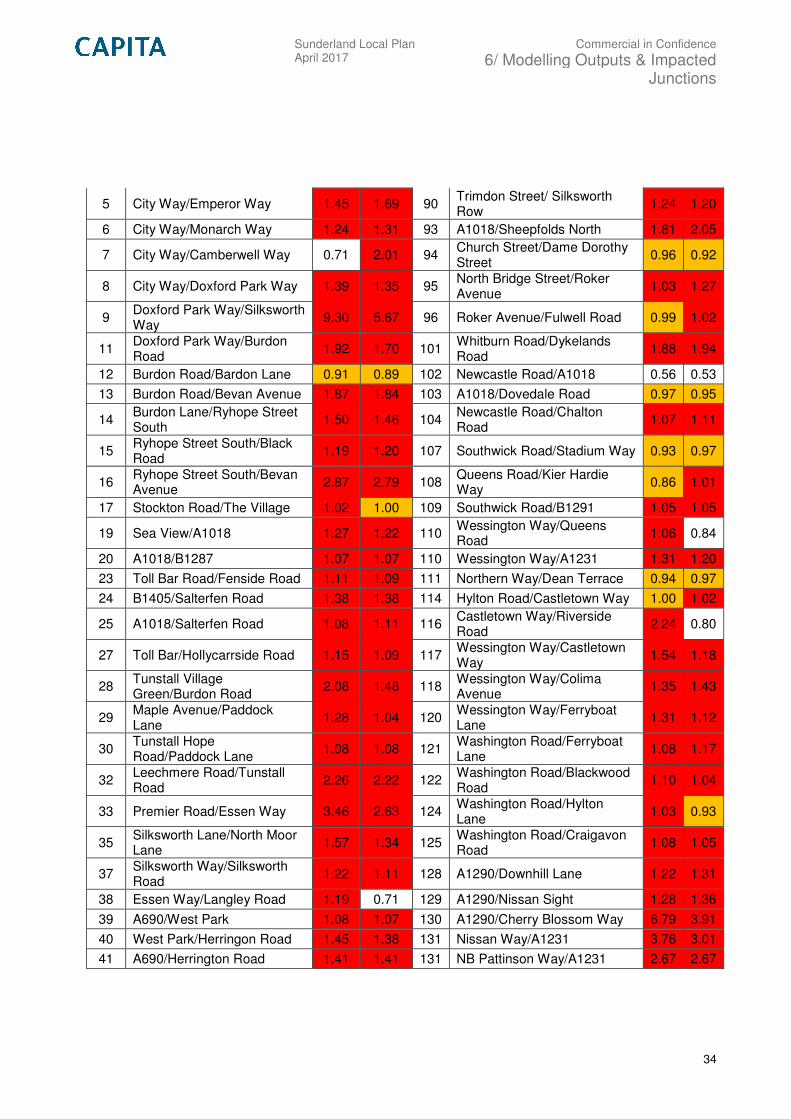
Sunderland Local Plan April 2017
Commercial in Confidence
6/ Modelling Outputs & Impacted Junctions
34
5 City Way/Emperor Way 1.45 1.69 90 Trimdon Street/ Silksworth Row
1.24 1.20
6 City Way/Monarch Way 1.24 1.31 93 A1018/Sheepfolds North 1.81 2.05
7 City Way/Camberwell Way 0.71 2.01 94 Church Street/Dame Dorothy Street
0.96 0.92
8 City Way/Doxford Park Way 1.39 1.35 95 North Bridge Street/Roker Avenue
1.03 1.27
9 Doxford Park Way/Silksworth Way
9.30 5.67 96 Roker Avenue/Fulwell Road 0.99 1.02
11 Doxford Park Way/Burdon Road
1.92 1.70 101 Whitburn Road/Dykelands Road
1.88 1.94
12 Burdon Road/Bardon Lane 0.91 0.89 102 Newcastle Road/A1018 0.56 0.53
13 Burdon Road/Bevan Avenue 1.87 1.84 103 A1018/Dovedale Road 0.97 0.95
14 Burdon Lane/Ryhope Street South
1.50 1.46 104 Newcastle Road/Chalton Road
1.07 1.11
15 Ryhope Street South/Black Road
1.19 1.20 107 Southwick Road/Stadium Way 0.93 0.97
16 Ryhope Street South/Bevan Avenue
2.87 2.79 108 Queens Road/Kier Hardie Way
0.86 1.01
17 Stockton Road/The Village 1.02 1.00 109 Southwick Road/B1291 1.05 1.05
19 Sea View/A1018 1.27 1.22 110 Wessington Way/Queens Road
1.06 0.84
20 A1018/B1287 1.07 1.07 110 Wessington Way/A1231 1.31 1.20
23 Toll Bar Road/Fenside Road 1.11 1.09 111 Northern Way/Dean Terrace 0.94 0.97
24 B1405/Salterfen Road 1.38 1.38 114 Hylton Road/Castletown Way 1.00 1.02
25 A1018/Salterfen Road 1.08 1.11 116 Castletown Way/Riverside Road
2.24 0.80
27 Toll Bar/Hollycarrside Road 1.15 1.09 117 Wessington Way/Castletown Way
1.54 1.18
28 Tunstall Village Green/Burdon Road
2.08 1.48 118 Wessington Way/Colima Avenue
1.35 1.43
29 Maple Avenue/Paddock Lane
1.28 1.04 120 Wessington Way/Ferryboat Lane
1.31 1.12
30 Tunstall Hope Road/Paddock Lane
1.08 1.08 121 Washington Road/Ferryboat Lane
1.08 1.17
32 Leechmere Road/Tunstall Road
2.26 2.22 122 Washington Road/Blackwood Road
1.10 1.04
33 Premier Road/Essen Way 3.46 2.63 124 Washington Road/Hylton Lane
1.03 0.93
35 Silksworth Lane/North Moor Lane
1.57 1.34 125 Washington Road/Craigavon Road
1.08 1.05
37 Silksworth Way/Silksworth Road
1.22 1.11 128 A1290/Downhill Lane 1.22 1.31
38 Essen Way/Langley Road 1.19 0.71 129 A1290/Nissan Sight 1.28 1.36
39 A690/West Park 1.08 1.07 130 A1290/Cherry Blossom Way 6.79 3.91
40 West Park/Herringon Road 1.45 1.38 131 Nissan Way/A1231 3.76 3.01
41 A690/Herrington Road 1.41 1.41 131 NB Pattinson Way/A1231 2.67 2.67
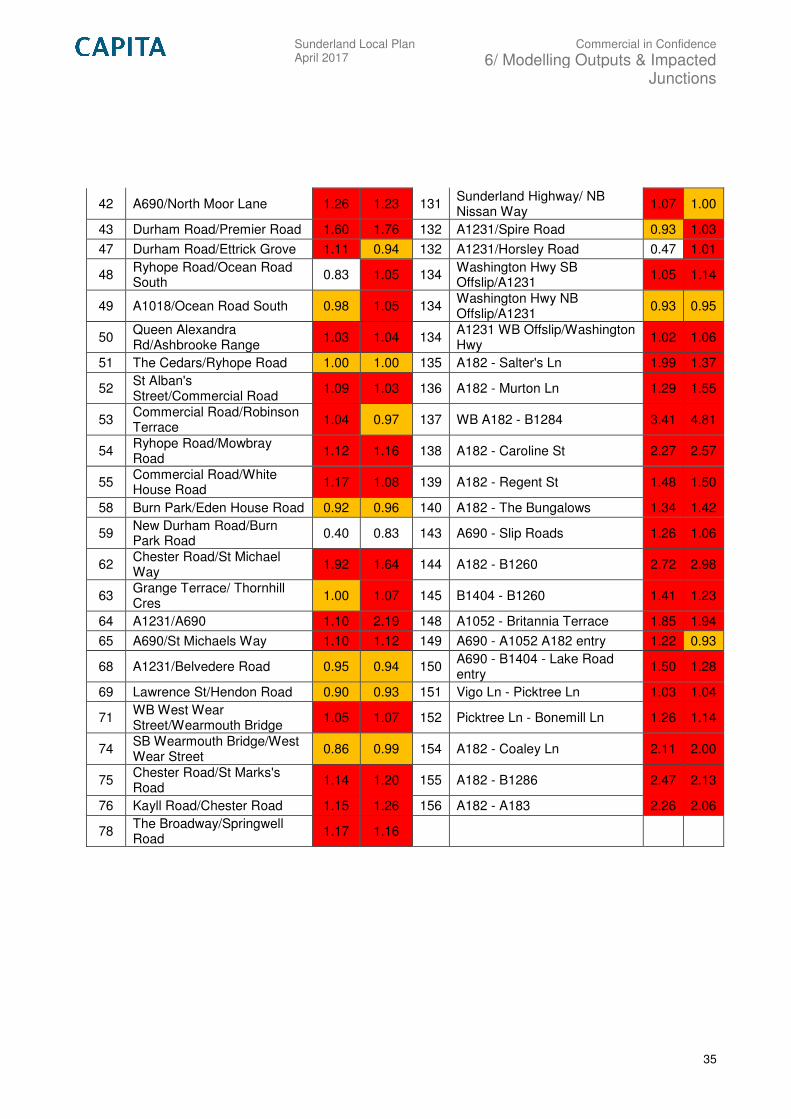
Sunderland Local Plan April 2017
Commercial in Confidence
6/ Modelling Outputs & Impacted Junctions
35
42 A690/North Moor Lane 1.26 1.23 131 Sunderland Highway/ NB Nissan Way
1.07 1.00
43 Durham Road/Premier Road 1.60 1.76 132 A1231/Spire Road 0.93 1.03
47 Durham Road/Ettrick Grove 1.11 0.94 132 A1231/Horsley Road 0.47 1.01
48 Ryhope Road/Ocean Road South
0.83 1.05 134 Washington Hwy SB Offslip/A1231
1.05 1.14
49 A1018/Ocean Road South 0.98 1.05 134 Washington Hwy NB Offslip/A1231
0.93 0.95
50 Queen Alexandra Rd/Ashbrooke Range
1.03 1.04 134 A1231 WB Offslip/Washington Hwy
1.02 1.06
51 The Cedars/Ryhope Road 1.00 1.00 135 A182 - Salter's Ln 1.99 1.37
52 St Alban's Street/Commercial Road
1.09 1.03 136 A182 - Murton Ln 1.29 1.55
53 Commercial Road/Robinson Terrace
1.04 0.97 137 WB A182 - B1284 3.41 4.81
54 Ryhope Road/Mowbray Road
1.12 1.16 138 A182 - Caroline St 2.27 2.57
55 Commercial Road/White House Road
1.17 1.08 139 A182 - Regent St 1.48 1.50
58 Burn Park/Eden House Road 0.92 0.96 140 A182 - The Bungalows 1.34 1.42
59 New Durham Road/Burn Park Road
0.40 0.83 143 A690 - Slip Roads 1.26 1.06
62 Chester Road/St Michael Way
1.92 1.64 144 A182 - B1260 2.72 2.98
63 Grange Terrace/ Thornhill Cres
1.00 1.07 145 B1404 - B1260 1.41 1.23
64 A1231/A690 1.10 2.19 148 A1052 - Britannia Terrace 1.85 1.94
65 A690/St Michaels Way 1.10 1.12 149 A690 - A1052 A182 entry 1.22 0.93
68 A1231/Belvedere Road 0.95 0.94 150 A690 - B1404 - Lake Road entry
1.50 1.28
69 Lawrence St/Hendon Road 0.90 0.93 151 Vigo Ln - Picktree Ln 1.03 1.04
71 WB West Wear Street/Wearmouth Bridge
1.05 1.07 152 Picktree Ln - Bonemill Ln 1.26 1.14
74 SB Wearmouth Bridge/West Wear Street
0.86 0.99 154 A182 - Coaley Ln 2.11 2.00
75 Chester Road/St Marks's Road
1.14 1.20 155 A182 - B1286 2.47 2.13
76 Kayll Road/Chester Road 1.15 1.26 156 A182 - A183 2.26 2.06
78 The Broadway/Springwell Road
1.17 1.16
Sunderland Local Plan April 2017
Commercial in Confidence
7/ High-Level Highway Mitigation
36
7. High-Level Highway Mitigation
7.1 Introduction
7.1.1 For the junctions that have been forecasted to experience the most severe capacity issues; those anticipated to become oversaturated during phase 0 of the Local Plan, potential mitigation to alleviate the impacts have been explored. Please note, the high level mitigation suggestions shown in this chapter of the report have not been modelled as part of the transportation assessment.
7.2 Geographical Locations Requiring Highway Mitigation
7.2.1 The areas of the highway network that will be impacted by traffic generated by the Local Plan development sites are generally centred around the IAMP site (Washington) and the residential sites surrounding Burdon Lane (Sunderland South Growth Area). The highway network adjacent to Burdon Lane, for example, mainly consists of one-lane carriageways which do not provide adequate capacity for the traffic demand generated by the residential sites, which subsequently causes delay and queuing at key junctions, such as those providing access to the A19.
7.2.2 This is suggestive that mitigation should not be explored in isolation for each individual location on the highway network, but should consider the links/approaches to junctions, as well as the operation of the junctions themselves. New bus and cycle connections should also be considered to reduce the need to travel by vehicles.
7.2.3 Some of the Local Plan sites will directly impact upon junctions in Sunderland city centre. Mitigation for this part of the highway network will need to be thoroughly tested and modelled as traffic and transport issues in city centres are often more complex given the volume of traffic, travel demand, and extent of the urbanised area found in these locations.
7.3 Potential Major Highway Mitigation
7.3.1 Appendix N provides a list of potential minor highway mitigation works that have been compiled for the purposes of the transportation assessment.
7.3.2 Table 21 below highlights the potential major highway mitigation works that have been compiled for the assessment. The table includes a list of known and identified schemes provided by SCC that would mitigate capacity issues at the junctions listed. The plan in Appendix F shows the corresponding junction reference numbers in Table 21.
Table 21 Potential Major Highway Mitigation for Impacted Junctions
Junction
Ref
Junction Name Potential Major Highway Mitigation Council Identified
Schemes
9 Doxford Park Way
/ Silksworth Way
Doxford Park Way/City Way junction to
Monarch Way, the carriageway has 1 lane
and cannot accommodate additional
traffic. Creating an additional lane from
Doxford Park Way to Monarch Way
A19 junction
improvements and City
Way dualling.
Sunderland Local Plan April 2017
Commercial in Confidence
7/ High-Level Highway Mitigation
37
would provide additional capacity.
12 Burdon Road /
Burdon Lane
Increasing the number of lanes on Burdon
Lane from 1 lane in each direction to 2
lanes in each direction, and the
introduction of a signalised junction at
this location to control higher traffic flows
on this part of the network. Consideration
could be given to bus/cycle provision
along Burdon Lane.
Doxford Park / Ryhope Link
Road and localised
junction improvements.
13 Burdon Road /
Bevan Avenue The same as above.
Doxford Park / Ryhope Link
Road and localised
junction improvements.
14
Burdon Lane /
Ryhope Street
South
The same as above.
Doxford Park / Ryhope Link
Road and localised
junction improvements.
15 Ryhope Street
South / Black Road Introduce traffic signal control.
Doxford Park / Ryhope Link
Road and localised
junction improvements.
16
Ryhope Street
South / Bevan
Avenue
Introduce traffic signal control.
Doxford Park / Ryhope Link
Road and localised
junction improvements.
20 Saint Nazaire Way
/ B1287
Because of the high volumes of traffic on
A1018, vehicles turning from Sea View
will not have sufficient gaps in the traffic
to make these manoeuvres. Signalising
the junction would accommodate the
safe turning movements and reduce
queuing.
Doxford Park / Ryhope Link
Road and localised
junction improvements.
27 Toll Bar Road /
Hollycarrside Road
High traffic volumes on Toll Bar Road
means vehicles turning from Hollycarrside
Road will not have sufficient gaps in the
traffic to make the turning manoeuvres.
Signalising the junction would
accommodate these movements and
reduce queueing/congestion.
Toll Bar Road /
Hollycarrside Road
roundabout and localised
junction improvements.
Sunderland Local Plan April 2017
Commercial in Confidence
7/ High-Level Highway Mitigation
38
42 A690 / North
Moor Lane
High traffic demand from Durham Road
and vehicles from North Moor Lane will
not have sufficient gaps in the traffic to
enter the roundabout. Creating a
signalised junction with a new layout
would alleviate this issue.
Farringdon Bypass.
47 Durham Road /
Ettrick Grove
Potential traffic signal controlled junction
layout.
A690 Durham Road
Corridor improvements.
52 St Alban's Street /
Commercial Road
Increase the number of lanes or build a
flare on Alban’s Street approach.
SSTC5 and localised
junction improvements.
55
Commercial Road
/ White House
Road
Hendon Road approach is 1 lane and
cannot accommodate traffic going to
Commercial Road. Increase the number
of lanes or extend flare on Hendon Road.
SSTC5 and localised
junction improvements.
136 A690 - Slip Roads Build additional lane for merge on A690. A690 / A19 junction
improvements.
143 A690 - B1404 -
Lake Road entry
Introducing 2 lanes on the exit at Lake
Road.
Central Route and localised
junction improvements.
4 A19S off-slip /
Parkside south Traffic signal optimisation.
A690 / A19 junction
improvements.
39 Parkside South /
West Park Traffic signal optimisation.
A690 / A19 junction
improvements.
7.4 NECA Pipeline Schemes
7.4.1 The spreadsheet shown in Appendix G shows the capital project pipeline for Sunderland and includes major highway improvement schemes that will deliver various benefits to the surrounding highway network. This pipeline of works has been cross referenced with the impacted junctions identified in this transportation assessment.
7.4.2 The following NECA pipeline schemes address areas of the highway network that have been identified as having capacity issues:
• Commercial Road/White House Road – being improved by SSTC phase 5;
• A1018 between southern bridgehead of Wearmouth Bridge and the roundabout junction of Hendon Road/Commercial Road;
• Proposed single carriageway road linking SSTC/A1018 Southern Radial Route with the Port of Sunderland;
• Improved transport links with south Sunderland and A690;
• Remodelling of a section of carriageway between A19 and A1018 to create improved transport links;
• Durham Road/A19/A690/B1286 – involving improved transport links with the south of Sunderland and A19 south Sunderland growth area access, the Doxford International Technology Park access (B1286) and the A19 junction study;
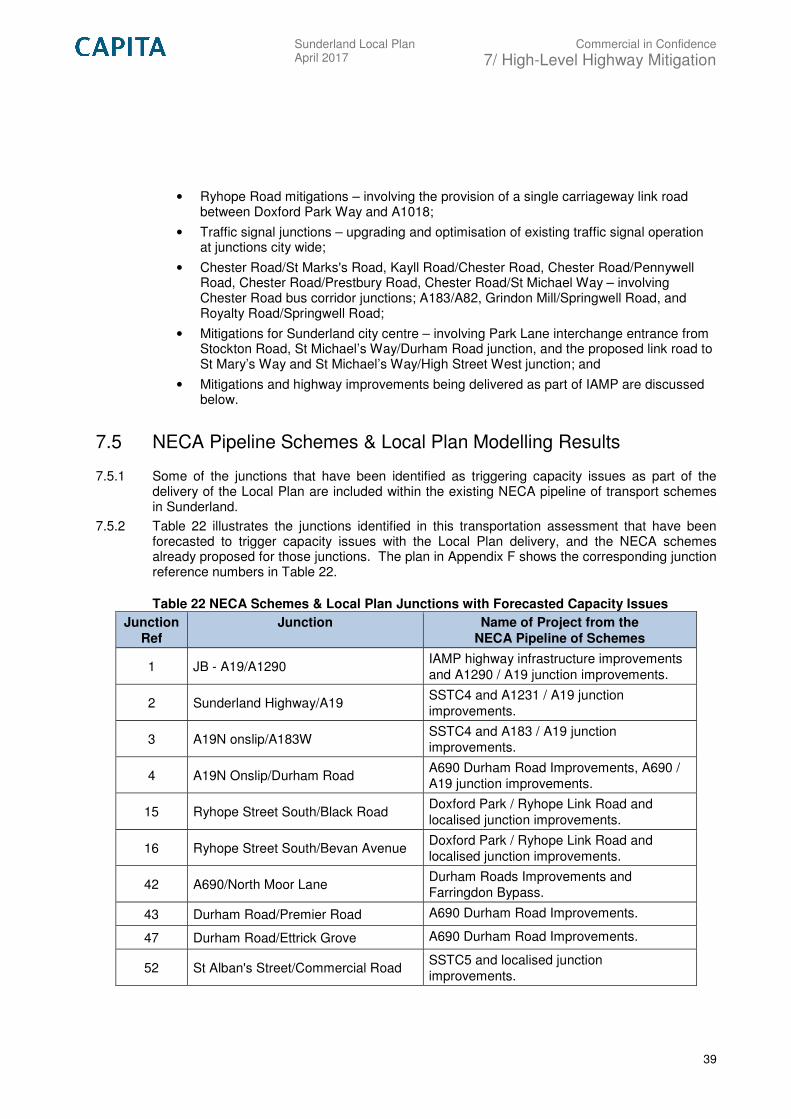
Sunderland Local Plan April 2017
Commercial in Confidence
7/ High-Level Highway Mitigation
39
• Ryhope Road mitigations – involving the provision of a single carriageway link road between Doxford Park Way and A1018;
• Traffic signal junctions – upgrading and optimisation of existing traffic signal operation at junctions city wide;
• Chester Road/St Marks's Road, Kayll Road/Chester Road, Chester Road/Pennywell Road, Chester Road/Prestbury Road, Chester Road/St Michael Way – involving Chester Road bus corridor junctions; A183/A82, Grindon Mill/Springwell Road, and Royalty Road/Springwell Road;
• Mitigations for Sunderland city centre – involving Park Lane interchange entrance from Stockton Road, St Michael’s Way/Durham Road junction, and the proposed link road to St Mary’s Way and St Michael’s Way/High Street West junction; and
• Mitigations and highway improvements being delivered as part of IAMP are discussed below.
7.5 NECA Pipeline Schemes & Local Plan Modelling Results
7.5.1 Some of the junctions that have been identified as triggering capacity issues as part of the delivery of the Local Plan are included within the existing NECA pipeline of transport schemes in Sunderland.
7.5.2 Table 22 illustrates the junctions identified in this transportation assessment that have been forecasted to trigger capacity issues with the Local Plan delivery, and the NECA schemes already proposed for those junctions. The plan in Appendix F shows the corresponding junction reference numbers in Table 22.
Table 22 NECA Schemes & Local Plan Junctions with Forecasted Capacity Issues
Junction
Ref
Junction Name of Project from the
NECA Pipeline of Schemes
1 JB - A19/A1290 IAMP highway infrastructure improvements
and A1290 / A19 junction improvements.
2 Sunderland Highway/A19 SSTC4 and A1231 / A19 junction
improvements.
3 A19N onslip/A183W SSTC4 and A183 / A19 junction
improvements.
4 A19N Onslip/Durham Road A690 Durham Road Improvements, A690 /
A19 junction improvements.
15 Ryhope Street South/Black Road Doxford Park / Ryhope Link Road and
localised junction improvements.
16 Ryhope Street South/Bevan Avenue Doxford Park / Ryhope Link Road and
localised junction improvements.
42 A690/North Moor Lane Durham Roads Improvements and
Farringdon Bypass.
43 Durham Road/Premier Road A690 Durham Road Improvements.
47 Durham Road/Ettrick Grove A690 Durham Road Improvements.
52 St Alban's Street/Commercial Road SSTC5 and localised junction
improvements.

Sunderland Local Plan April 2017
Commercial in Confidence
7/ High-Level Highway Mitigation
40
55 Commercial Road/White House Road SSTC5 and localised junction
improvements.
62 Chester Road/St Michael Way Upgrading of existing traffic signals city wide
and city centre junction improvements.
65 A690/St Michaels Way Upgrading of existing traffic signals city wide
and city centre junction improvements.
80 Chester Road/Pennywell Road
Signalisation of junctions and construction
of direct access to land to the north in order
to facilitate regeneration of the Pennywell
housing area. Link 2 £3,000,000. A183
Chester Road corridor improvements.
82 Chester Road/Prestbury Road A183 Chester Road corridor improvements.
85 Hylton Road/Grindon Lane Durham Road (A690) / Grindon Lane and
A183 Chester Road corridor improvements.
110 Wessington Way/A1231 SSTC4 and A1231 / A19 junction
improvements.
114 Wessington Way/Castletown Way SSTC4 and A1231 / A19 junction
improvements.
118 Wessington Way/Colima Avenue SSTC4 and A1231 / A19 junction
improvements.
120 Wessington Way/Ferryboat Lane SSTC4 and A1231 / A19 junction
improvements.
121 Washington Road/Ferryboat Lane SSTC4 and A1231 / A19 junction
improvements.
122 Washington Road/Blackwood Road SSTC4 and A1231 / A19 junction
improvements.
125 Washington Road/Craigavon Road SSTC4 and A1231 / A19 junction
improvements.
128 A1290/Follingsby Lane IAMP highway infrastructure.
129 A1290/Nissan Sight IAMP highway infrastructure.
130 A1290/Cherry Blossom Way IAMP highway infrastructure.
131 Nissan Way/A1231 IAMP highway infrastructure.
7.6 IAMP Committed Highway Improvements
7.6.1 IAMP is the largest employment site in the Sunderland area and a detailed assessment was prepared by SYSTRA JMP Consultants, which included highway improvements and new infrastructure to support the delivery of the IAMP site. The number of jobs in IAMP will increase significantly during the Local Plan period meaning there will be a large impact on the highway network. In reference to IAMP in Table 18 above, the following mitigation will be delivered as part of this extensive site:
1. A1290 to become dual carriageway and tie into existing single carriageway immediately east of West Moor Farm;
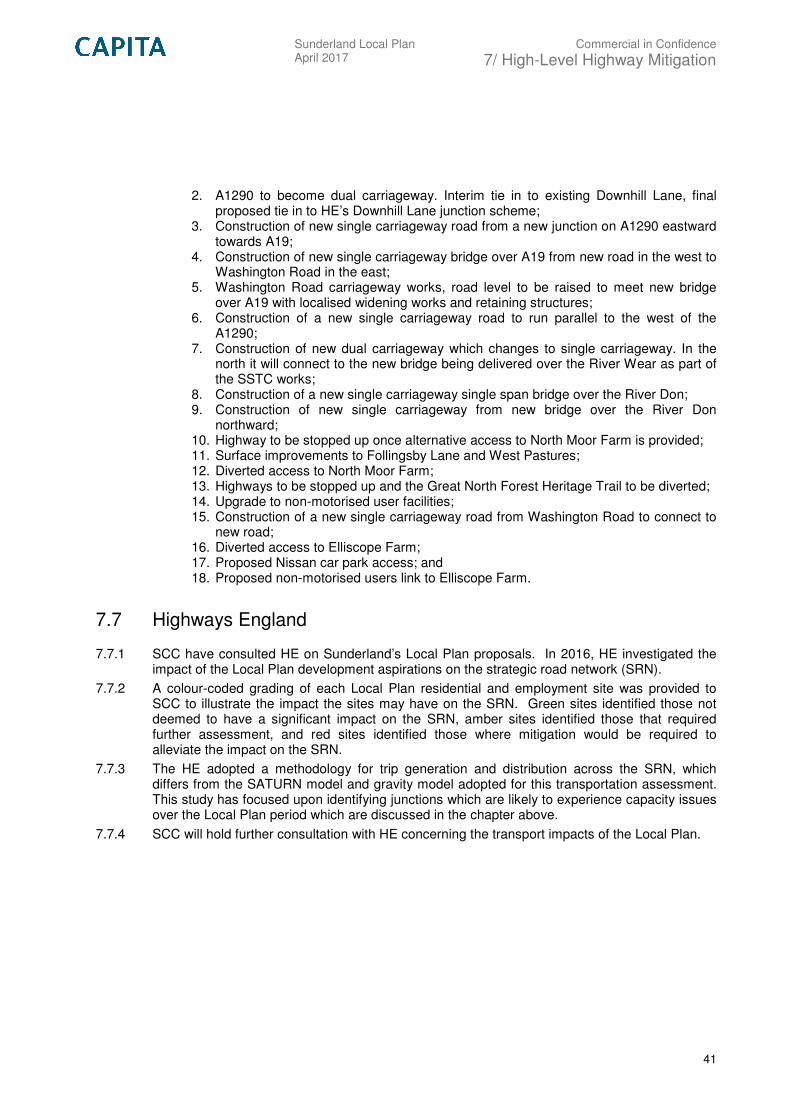
Sunderland Local Plan April 2017
Commercial in Confidence
7/ High-Level Highway Mitigation
41
2. A1290 to become dual carriageway. Interim tie in to existing Downhill Lane, final proposed tie in to HE’s Downhill Lane junction scheme;
3. Construction of new single carriageway road from a new junction on A1290 eastward towards A19;
4. Construction of new single carriageway bridge over A19 from new road in the west to Washington Road in the east;
5. Washington Road carriageway works, road level to be raised to meet new bridge over A19 with localised widening works and retaining structures;
6. Construction of a new single carriageway road to run parallel to the west of the A1290;
7. Construction of new dual carriageway which changes to single carriageway. In the north it will connect to the new bridge being delivered over the River Wear as part of the SSTC works;
8. Construction of a new single carriageway single span bridge over the River Don; 9. Construction of new single carriageway from new bridge over the River Don
northward; 10. Highway to be stopped up once alternative access to North Moor Farm is provided; 11. Surface improvements to Follingsby Lane and West Pastures; 12. Diverted access to North Moor Farm; 13. Highways to be stopped up and the Great North Forest Heritage Trail to be diverted; 14. Upgrade to non-motorised user facilities; 15. Construction of a new single carriageway road from Washington Road to connect to
new road; 16. Diverted access to Elliscope Farm; 17. Proposed Nissan car park access; and 18. Proposed non-motorised users link to Elliscope Farm.
7.7 Highways England
7.7.1 SCC have consulted HE on Sunderland’s Local Plan proposals. In 2016, HE investigated the impact of the Local Plan development aspirations on the strategic road network (SRN).
7.7.2 A colour-coded grading of each Local Plan residential and employment site was provided to SCC to illustrate the impact the sites may have on the SRN. Green sites identified those not deemed to have a significant impact on the SRN, amber sites identified those that required further assessment, and red sites identified those where mitigation would be required to alleviate the impact on the SRN.
7.7.3 The HE adopted a methodology for trip generation and distribution across the SRN, which differs from the SATURN model and gravity model adopted for this transportation assessment. This study has focused upon identifying junctions which are likely to experience capacity issues over the Local Plan period which are discussed in the chapter above.
7.7.4 SCC will hold further consultation with HE concerning the transport impacts of the Local Plan.

Sunderland Local Plan April 2017
Commercial in Confidence
8/ Public Transport Accessibility
42
8. Public Transport Accessibility
8.1 Metro Services
8.1.1 The Metro, the North East’s urban transit system managed by Nexus, connects 60 stations across Tyne and Wear on two railway lines (yellow line and green line). The yellow line extends from St James Park stadium in Newcastle upon Tyne and loops around the coastal areas in North Tyneside and along the southern banks of the River Tyne to South Shields. The green line extends from Newcastle International Airport to South Hylton in Sunderland. 12 stations on the Metro system provide interchange between the yellow line and green line.
8.1.2 Zone C of the green line runs through Sunderland and provides rail connectivity to nine stations including South Hylton, Pallion, Millfield, University, Park Lane, Sunderland, St Peters, Stadium of Light, and Seaburn. These stations are generally located along the southern banks of the River Wear with the Metro system entering Sunderland in the north at Seaburn.
8.1.3 Table 23 shows the transport facilities that are available at the Metro stations in Sunderland. All stations provide cycle parking facilities to support sustainable multi-modal journeys, all stations except three provide car parking provision, and the central Metro stations, including Park Lane and Sunderland, provide rail and bus interchange.
Table 23 Sunderland Metro Stations’ Facilities
8.1.4 The average one-directional frequency of Metro services serving the stations in Sunderland is every 12 minutes Monday-Saturday and every 15 minutes on Sundays. All nine stations are positioned in built-up locations with access enabled by walking/cycling through a combination of general highway infrastructure and mode specific infrastructure, such as cycle lanes and bus services.
8.1.5 The platforms at Sunderland station are shared by light rail (Metro) and heavy rail (National Rail) services. Therefore, Sunderland station provides interchange with long distance rail journeys, to places such as Blaydon, Durham, Gateshead, Middlesbrough, and Newcastle, as well as towns/cities further afield including York, Leeds, Liverpool, London, and Edinburgh.
8.1.6 The Metro and the heavy rail systems do not extend into the Coalfield and Washington areas.
Station Cycle Parking Car Parking Taxi Rank Rail
Interchange
Bus
Interchange
South Hylton 10 24 No No No
Pallion 10 0 No No No
Millfield 8 12 Yes No No
University 12 0 No No No
Park Lane 24
630 (Civic
Centre) Yes Yes Yes
Sunderland 10 0 Yes Yes Yes
St Peters 10 23 2 spaces No No
Stadium of
Light 10 182 No No No
Seaburn 10 11 No No No

Sunderland Local Plan April 2017
Commercial in Confidence
8/ Public Transport Accessibility
43
8.2 Bus Services
8.2.1 Given the scale and extents of the study area being reviewed in this transportation assessment, there are countless bus stops located within northern, southern, and central Sunderland, Coalfield, and Washington that provide local and regional public transport connections. The bus route map shown in Appendix H shows the extent of the bus routes and connections throughout the study area.
8.2.2 Sunderland city centre, Sunderland central, and parts of the northern and southern sub-areas, are the most built-up urban areas within the study extents. The city centre and surrounding urban fringes provide multiple opportunities for public transport interchange and numerous bus services operate from within and through the city centre. Most of the public transport services originate and are destined for Sunderland Interchange near Park Lane. The main bus operators in the city centre, central, northern, and southern sub-areas are Go North East, Stagecoach, and Arriva.
8.2.3 In comparison, the bus service coverage in the Washington and Coalfield sub-areas is not as comprehensive as the city centre, central, north, and south sub-areas. The existing bus services in Washington and Coalfield are not frequent services and operate mostly during peak periods. The sub-area with the weakest bus service provision is Washington.
8.2.4 Bus services going to/from Washington connect Sunderland with Consett (Go North East 78 and 78A) and Stanley (Go North East 8). An existing bus service going to the IAMP site from Sunderland travels through the central part of Washington (Go North East 56).
8.2.5 In relation to the Coalfield, the accessibility to public transport is high in relation to many of the Local Plan sites. However, the bus services do not provide regular and frequent hourly services and the Coalfield sub-area has been identified as having the lowest public transport accessibility. The Coalfield area is connected with Heworth, Durham, and South Shields by Go North East services, and with Peterlee and Houghton Health Centre by Go North East and Station Taxi services.
8.2.6 Table 24 provides a summary of the bus services and the average weekday hourly frequency.
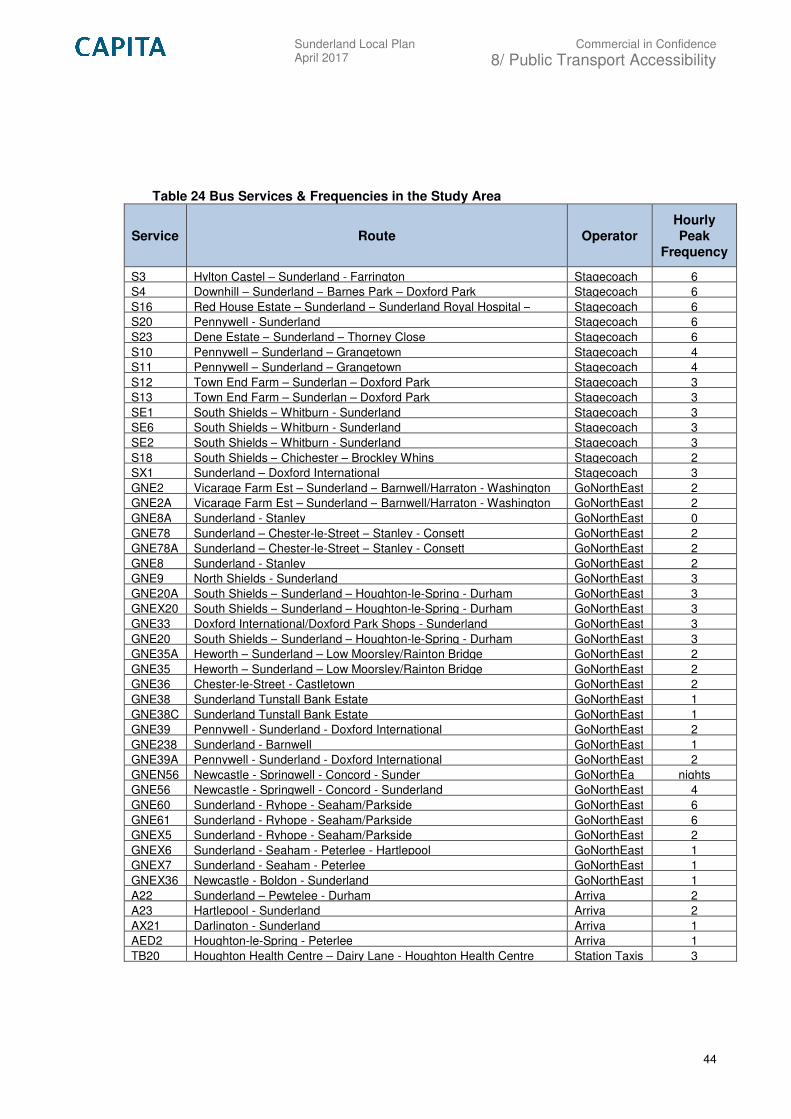
Sunderland Local Plan April 2017
Commercial in Confidence
8/ Public Transport Accessibility
44
Table 24 Bus Services & Frequencies in the Study Area
Service Route Operator
Hourly
Peak
Frequency
S3 Hylton Castel – Sunderland - Farrington Stagecoach 6
S4 Downhill – Sunderland – Barnes Park – Doxford Park Stagecoach 6
S16 Red House Estate – Sunderland – Sunderland Royal Hospital – Stagecoach 6
S20 Pennywell - Sunderland Stagecoach 6
S23 Dene Estate – Sunderland – Thorney Close Stagecoach 6
S10 Pennywell – Sunderland – Grangetown Stagecoach 4
S11 Pennywell – Sunderland – Grangetown Stagecoach 4
S12 Town End Farm – Sunderlan – Doxford Park Stagecoach 3
S13 Town End Farm – Sunderlan – Doxford Park Stagecoach 3
SE1 South Shields – Whitburn - Sunderland Stagecoach 3
SE6 South Shields – Whitburn - Sunderland Stagecoach 3
SE2 South Shields – Whitburn - Sunderland Stagecoach 3
S18 South Shields – Chichester – Brockley Whins Stagecoach 2
SX1 Sunderland – Doxford International Stagecoach 3
GNE2 Vicarage Farm Est – Sunderland – Barnwell/Harraton - Washington GoNorthEast 2
GNE2A Vicarage Farm Est – Sunderland – Barnwell/Harraton - Washington GoNorthEast 2
GNE8A Sunderland - Stanley GoNorthEast 0
GNE78 Sunderland – Chester-le-Street – Stanley - Consett GoNorthEast 2
GNE78A Sunderland – Chester-le-Street – Stanley - Consett GoNorthEast 2
GNE8 Sunderland - Stanley GoNorthEast 2
GNE9 North Shields - Sunderland GoNorthEast 3
GNE20A South Shields – Sunderland – Houghton-le-Spring - Durham GoNorthEast 3
GNEX20 South Shields – Sunderland – Houghton-le-Spring - Durham GoNorthEast 3
GNE33 Doxford International/Doxford Park Shops - Sunderland GoNorthEast 3
GNE20 South Shields – Sunderland – Houghton-le-Spring - Durham GoNorthEast 3
GNE35A Heworth – Sunderland – Low Moorsley/Rainton Bridge GoNorthEast 2
GNE35 Heworth – Sunderland – Low Moorsley/Rainton Bridge GoNorthEast 2
GNE36 Chester-le-Street - Castletown GoNorthEast 2
GNE38 Sunderland Tunstall Bank Estate GoNorthEast 1
GNE38C Sunderland Tunstall Bank Estate GoNorthEast 1
GNE39 Pennywell - Sunderland - Doxford International GoNorthEast 2
GNE238 Sunderland - Barnwell GoNorthEast 1
GNE39A Pennywell - Sunderland - Doxford International GoNorthEast 2
GNEN56 Newcastle - Springwell - Concord - Sunder GoNorthEa nights
GNE56 Newcastle - Springwell - Concord - Sunderland GoNorthEast 4
GNE60 Sunderland - Ryhope - Seaham/Parkside GoNorthEast 6
GNE61 Sunderland - Ryhope - Seaham/Parkside GoNorthEast 6
GNEX5 Sunderland - Ryhope - Seaham/Parkside GoNorthEast 2
GNEX6 Sunderland - Seaham - Peterlee - Hartlepool GoNorthEast 1
GNEX7 Sunderland - Seaham - Peterlee GoNorthEast 1
GNEX36 Newcastle - Boldon - Sunderland GoNorthEast 1
A22 Sunderland – Pewtelee - Durham Arriva 2
A23 Hartlepool - Sunderland Arriva 2
AX21 Darlington - Sunderland Arriva 1
AED2 Houghton-le-Spring - Peterlee Arriva 1
TB20 Houghton Health Centre – Dairy Lane - Houghton Health Centre Station Taxis 3

Sunderland Local Plan April 2017
Commercial in Confidence
8/ Public Transport Accessibility
45
8.3 Public Transport Accessibility Assessment Framework
8.3.1 For reference for this section of the report, the 124 SHLAA sites and 15 Housing Release sites for the Sunderland Local Plan are shown in Appendix A.
8.3.2 The purpose of assessing the public transport accessibility of the Local Plan sites is to determine the existing public transport connectivity available surrounding the site locations. The sites deemed to have low accessibility would require the most public transport improvements to raise the level of accessibility.
8.3.3 The assessment framework developed for grading public transport accessibility for each Local Plan site considers three factors; Metro accessibility, bus accessibility, and bus frequencies/services, which are summarised in Table 25. This criteria was developed by Capita in support of the transportation evidence developed for another Local Authority as part of their emerging Local Plan.
Table 25 Public Transport Accessibility Grading Criteria
Metro Access
Bus Stop Access Bus Service Frequency
Distance Access Distance Access Service Levels Provision
Within 500m High Within 400m High Multiple services with 15
minute frequency High
500m – 1200m Medium 400m – 800m Medium Multiple services with 30
minute frequency Medium
More than 1200m Low More than
800m Low
Single service with 30
minute frequency or less Low
8.4 Ranked Public Transport Accessibility for Local Plan Sites
8.4.1 Using the grading criteria from the assessment framework, each Local Plan residential site has been ranked in terms of the existing level of public transport accessibility. The full grading results for each site is shown in Appendix I, where the sites identified as having high accessibility are shaded in green, medium accessibility shaded in orange, and low accessibility shaded in red.
8.4.2 With consideration to all three of the public transport accessibility grading factors, 35% of the residential sites have been ranked as having high public transport accessibility, 35% have been ranked as having medium public transport accessibility, and 30% have been ranked as having low public transport accessibility.
8.4.3 The sites with high public transport accessibility tend to be located within the vicinity of Sunderland city centre, where bus services and routes begin/terminate and provide interchange with light and heavy rail services at various Metro stations and Sunderland station.
8.4.4 The sites with low public transport accessibility tend to be situated within the Coalfield areas where there are no Metro stations and there are very few bus services that provide moderate hourly frequencies. Almost half of the sites that have been rated as having low public transport accessibility are located within the Coalfield sub-area.
8.4.5 Table 26 below summarises the volume of sites found within each of the Local Plan sub-areas and the grading of public transport accessibility.
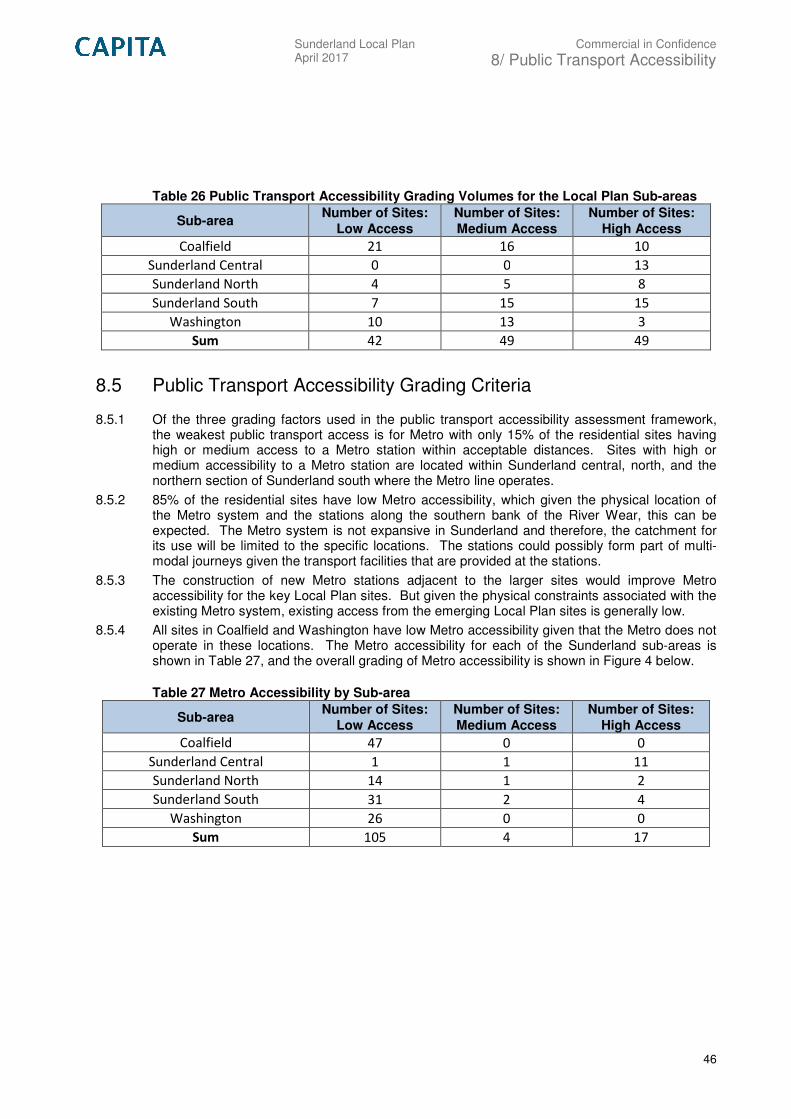
Sunderland Local Plan April 2017
Commercial in Confidence
8/ Public Transport Accessibility
46
Table 26 Public Transport Accessibility Grading Volumes for the Local Plan Sub-areas
Sub-area Number of Sites:
Low Access
Number of Sites:
Medium Access
Number of Sites:
High Access
Coalfield 21 16 10
Sunderland Central 0 0 13
Sunderland North 4 5 8
Sunderland South 7 15 15
Washington 10 13 3
Sum 42 49 49
8.5 Public Transport Accessibility Grading Criteria
8.5.1 Of the three grading factors used in the public transport accessibility assessment framework, the weakest public transport access is for Metro with only 15% of the residential sites having high or medium access to a Metro station within acceptable distances. Sites with high or medium accessibility to a Metro station are located within Sunderland central, north, and the northern section of Sunderland south where the Metro line operates.
8.5.2 85% of the residential sites have low Metro accessibility, which given the physical location of the Metro system and the stations along the southern bank of the River Wear, this can be expected. The Metro system is not expansive in Sunderland and therefore, the catchment for its use will be limited to the specific locations. The stations could possibly form part of multi-modal journeys given the transport facilities that are provided at the stations.
8.5.3 The construction of new Metro stations adjacent to the larger sites would improve Metro accessibility for the key Local Plan sites. But given the physical constraints associated with the existing Metro system, existing access from the emerging Local Plan sites is generally low.
8.5.4 All sites in Coalfield and Washington have low Metro accessibility given that the Metro does not operate in these locations. The Metro accessibility for each of the Sunderland sub-areas is shown in Table 27, and the overall grading of Metro accessibility is shown in Figure 4 below.
Table 27 Metro Accessibility by Sub-area
Sub-area Number of Sites:
Low Access
Number of Sites:
Medium Access
Number of Sites:
High Access
Coalfield 47 0 0
Sunderland Central 1 1 11
Sunderland North 14 1 2
Sunderland South 31 2 4
Washington 26 0 0
Sum 105 4 17
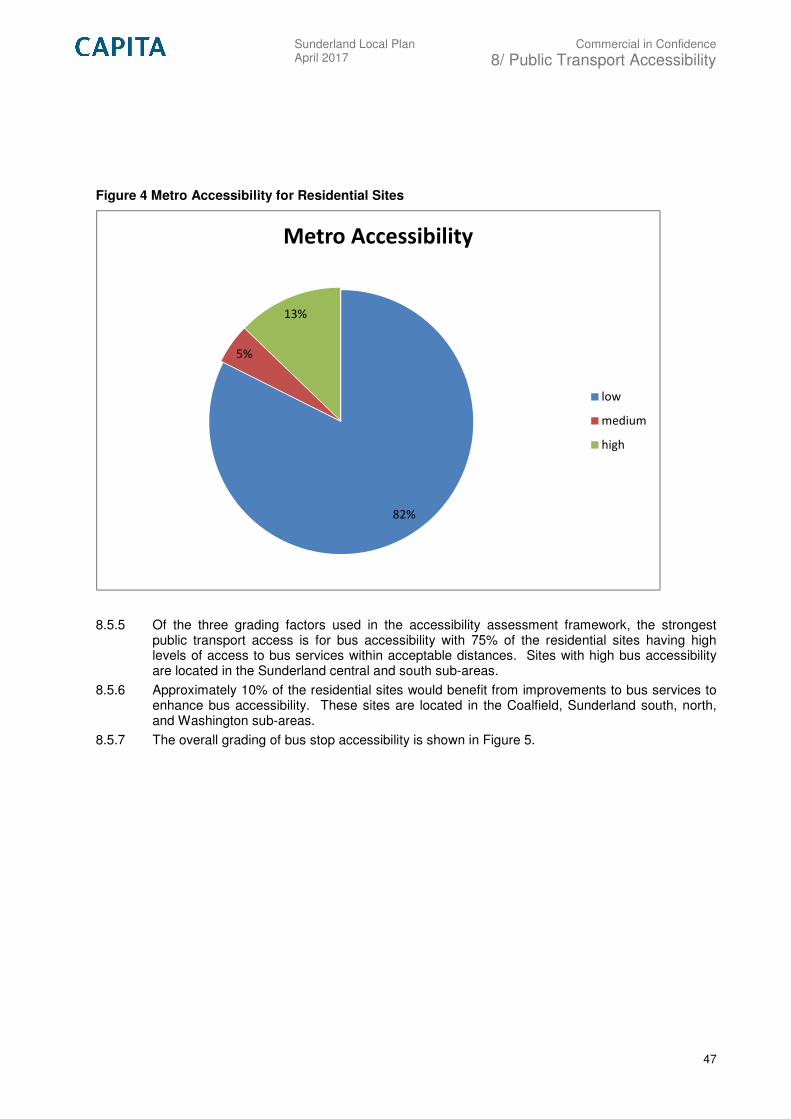
Sunderland Local Plan April 2017
Commercial in Confidence
8/ Public Transport Accessibility
47
Figure 4 Metro Accessibility for Residential Sites
8.5.5 Of the three grading factors used in the accessibility assessment framework, the strongest public transport access is for bus accessibility with 75% of the residential sites having high levels of access to bus services within acceptable distances. Sites with high bus accessibility are located in the Sunderland central and south sub-areas.
8.5.6 Approximately 10% of the residential sites would benefit from improvements to bus services to enhance bus accessibility. These sites are located in the Coalfield, Sunderland south, north, and Washington sub-areas.
8.5.7 The overall grading of bus stop accessibility is shown in Figure 5.
82%
5%
13%
Metro Accessibility
low
medium
high

Sunderland Local Plan April 2017
Commercial in Confidence
8/ Public Transport Accessibility
48
Figure 5 Bus Stop Accessibility for Residential Sites
8.5.8 In relation to the third grading factor used in the public transport accessibility; bus frequencies and provision, even though 75% of the residential sites have high levels of access to bus services within acceptable distances, for a number of these sites the bus services do not necessarily provide frequent hourly services.
8.5.9 Only 39% of the residential sites have high bus service frequencies even though accessibility to the bus stops and the services is deemed high. These sites are located mainly in the Sunderland central and south sub-areas.
8.5.10 31% of the residential sites have low bus service frequencies, which is defined as two or less services per hour serving the bus stops within the vicinity of the sites. These sites are located within the Coalfield, Washington and Sunderland south sub-areas.
8.5.11 The overall grading of bus service frequency is shown in Figure 6.
Figure 6 Bus Service Frequency for Residential Sites
32%
31%
37%
Bus Service Frequency
low
medium
high
10%
15%
75%
Bus Stop Accessibility
low
medium
high
Sunderland Local Plan April 2017
Commercial in Confidence
8/ Public Transport Accessibility
49
8.6 Potential Public Transport Accessibility Improvements
8.6.1 The public transport accessibility assessment framework and corresponding grading criteria have been used to determine the existing level of public transport connectivity at each of the identified residential sites.
8.6.2 The future traffic flows extrapolated from the strategic SATURN model provided volumes of origin and destination demand likely to be generated by travel between the Local Plan residential and employment sites. The modelling data also provide travel routes and distributional data for the travel demand generated by the sites.
8.6.3 A combination of the accessibility assessment results and the anticipated SATURN model travel demand, has enabled an analysis of where there may be gaps in public transport accessibility and provision of services for travel between the Local Plan residential and employment sites. The analysis indicates that there are only a small number of gaps in the existing public transport accessibility across Sunderland and the various sub-areas.
8.6.4 Recommended public transport connections linking the Local Plan sites where travel demand has been forecasted to be high and overall public transport accessibility is deemed low, have been developed and are shown in Appendix J. These suggestions include a combination of making changes to existing public transport connections and bus routes, and providing new bus services in those locations where connections do not exist to serve the Local Plan sites.
8.6.5 The cluster of residential sites numbered 62, 477, 35, and 81 which are located in the Sunderland south sub-area will generate the highest traffic demand from the residential sites included within this assessment. There is very little public transport accessibility between these residential sites (largest residential demand) and the largest employment site and employment attractor, namely IAMP.
8.6.6 Based upon this analysis, the following public transport accessibility enhancements would improve public transport connectivity between the largest residential and employment sites being delivered as part of the Local Plan (Appendix J):
• Connection 1: connecting Local Plan sites located in the northern part of Washington
(sites 56, 538, 312, 258, 628, 632, 543, 252) with the cluster of employment sites (62,
64, 66 and 70) around the industrial parks along A1231, as well as Sunderland north
sub-area and Sunderland city centre;
• Connection 2: connecting Sunderland city centre with the employment sites located on
the Port and Hendon Industrial Estate, connecting to the large residential sites located
on Burdon Lane in the Sunderland south sub-area, and connecting with Rainton Bridge
North Industrial Estate;
• Connection 3: linking Sunderland city centre with the cluster of residential sites (sites
417, 115, 468 etc) located in the Coalfield sub-area which have the lowest level of
public transport accessibility;
• Connection 4: connecting the residential sites situated south of IAMP in Washington to
the IAMP employment site and the employment sites at the industrial parks around the
A1231;
• Connection 5: linking Sunderland city centre and the Sunderland north sub-area with
the residential sites in south-west Washington. This connection includes passing
through Turbine Business Park;
• Connection 6: connecting Sunderland city centre with Sunderland south sub-area and
with Rainton Bridge North Industrial Estate, via Burton Way, and the western sites in
the Coalfield sub-area;

Sunderland Local Plan April 2017
Commercial in Confidence
8/ Public Transport Accessibility
50
• Connection 7: connecting the major residential sites surrounding Burdon Lane in the
Sunderland south sub-area with the major IAMP employment site in Washington, via
the A19; and
• Connection 8: an alternative to connection 7 where the route takes an alternative path
through the residential sites around Burdon Lane.
Sunderland Local Plan April 2017
Commercial in Confidence
9/ Cycling & Walking Accessibility
51
9. Cycling & Walking Accessibility
9.1 Introduction
9.1.1 As part of the smarter choices assessment, existing walking and cycling accessibility within the Sunderland study area has been examined in relation to some of the larger residential sites. Similarly to the public transport connectivity review, an accessibility assessment framework has been adopted to provide an indication of the active travel accessibility surrounding the propsoed residential sites.
9.1.2 Whithin Sunderland, there are various means by which people can make sustainable journeys. The urban environment offers various infrastructure types for use by cyclists, including dedicated cycle paths/lanes, shared use paths/surfaces, as well as advisory cycle routes on local roads deemed suitable for cycling. The national cycling network (NCN) also travels through Sunderland and provides connections to the wider North East region. Some sections of the NCN overlaps with the local cycling routes in Sunderalnd.
9.1.3 Most, if not all, urban environments have pedestrian/walking infrastructure. Footways, footpaths, street lighting, pedestrian crossings (controlled and uncontrolled), flush kerbs/tactile paving, and shared use paths are all examples of the infrastructure evident in the developed areas in Sunderland, including all of the sub-areas identified in this assessment.
9.2 Cycling & Walking Acceptable Distances
9.2.1 There are limits to the distances generally considered acceptable for utility cycling and walking. LTN 1/04 - Policy, Planning and Design for Walking and Cycling (Department for Transport) states that ‘the mean average length for walking journeys is approximately 1 km (0.6 miles) and for cycling, it is 4km (2.4 miles), although journeys of up to three times these distances are not uncommon for regular commuters’.
9.2.2 The distances people are prepared to walk or cycle depend on their fitness and physical ability, journey purpose, settlement size, and walking/cycling conditions. The suggested acceptable maximum walking distance for commuter, school, and leisure trips is 2km (Guidelines for Providing for Journeys on Foot (CIHT, 2000), and 5km suggested as the maximum acceptable cycling distance.
9.3 Existing Cycling & Walking Network
9.3.1 Sunderland is conducive to encouraging walking and cycling due to its relatively flat topography with only slight height differential between sea / river level and inland, with no steep hills throughout the walking environment. Sunderland contains a number of small urban areas which provide accessible services within short walking and cycling distances.
9.3.2 A number of the NCN and RCN routes in the North East region travel through Sunderland and the transportation study extents. The majority of the Local Plan sites are not located where there is easy access to these routes. The NCN and RCN routes that are within the study area include the following:
• NCN, Route 7: this route begins at the mouth of the River Wear and travels westbound along the north banks of the Wear in Sunderland central and north sub-areas. The route continues westbound into the Washington sub-area loosely following the path of
Sunderland Local Plan April 2017
Commercial in Confidence
9/ Cycling & Walking Accessibility
52
the River Wear;
• NCN, Route 1: this route travels along the coastline through Seaburn and Roker and into the mouth of the River Wear on the northern banks. The cycle route crosses the Wearmouth Bridge and connects to The Bridges shopping centre in the Sunderland central sub-area. The cycle route travels into the Sunderland south sub-area along A690 Durham road, and south of Plains Farm, the cycle route travels east through Tunstall and to Ryhope on the coastline; and
• NCN, Route 70: this route travels along the coastline through Seaburn and Roker and the mouth of the River Wear on the northern banks. The cycle route crosses the Wearmouth Bridge and connects to The Bridges shopping centre in the Sunderland central sub-area. The cycle route travels into the Sunderland south sub-area along A690 Durham road, and south of Plains Farm, the route travels south west to Farringdon and into the Coalfield sub-area to Hetton-le-Hole.
9.3.3 South of the River Wear, a mainly traffic free cycle path travels through the Sunderland central and south sub-areas, following the Metro line from University Metro station to South Hylton Metro station. This cycle route then connects to a range of cycle paths/routes through the Sunderland south, Washington, and Coalfield sub-areas.
9.3.4 The Sunderland central sub-area and the Sunderland north and south sub-areas adjacent to central benefit from the most comprehensive cycling connections and infrastructure given the extensive development in these urban areas. The three NCNs in Sunderland connect in Sunderland city centre and provide local and regional cycle connectivity to various locations.
9.3.5 The Coalfield and Sunderland south sub-areas have the least comprehensive cycle connectivity coverage, particularly in the central section of Coalfield where the majority of the cycle paths are advisory and there is very limited dedicated local cycling infrastructure such as cycle lanes (on-road and off-road). NCN 70 which runs through the Coalfield sub-area provides long-distance cycle connectivity, likely to be leisure cycling, rather than providing cycle accessibility between residential and employment settlements.
9.3.6 In relation to the largest employment site (IAMP) and the largest cluster of residential developments (around Burdon Lane, Sunderland south sub-area) being delivered as part of the Local Plan, the existing cycle connectivity and accessibility surrounding these locations includes the following:
• IAMP employment site: a traffic-free route surrounds the IAMP site, which travels along
the A1290, Cherry Blossom Way, off-road to the west of the Nissan site, and provides
immediate cycle connectivity to various off-road and on-road cycle paths. These
include cycle accessibility through Washington via traffic free routes and NCN 7, direct
cycle access to the east into the Sunderland north sub-area along the traffic free paths
running alongside Washington Road and via NCN 7, which also provides cycle
connectivity into Sunderland central and Sunderland south sub-areas via the existing
cycle infrastructure. The proposed Local Plan residential sites located within these
localities appear to be accessible via existing cycling infrastructure, however, some of
the distances between the sites would indicate that the use of the infrastructure would
be dependent upon the experience of cyclists; and
• Burdon Lane cluster of residential sites: NCN 70 accessible via Hangmans Lane in the
west of Burdon Lane, provides a traffic-free route south into the Coalfield sub-area, as
well as north into the Sunderland south sub-area and Sunderland city centre. These
routes represent long-distance cycle journeys. Although there is a very limited volume
of employment sites that will be located within acceptable cycling distances from this
cluster of residential sites.
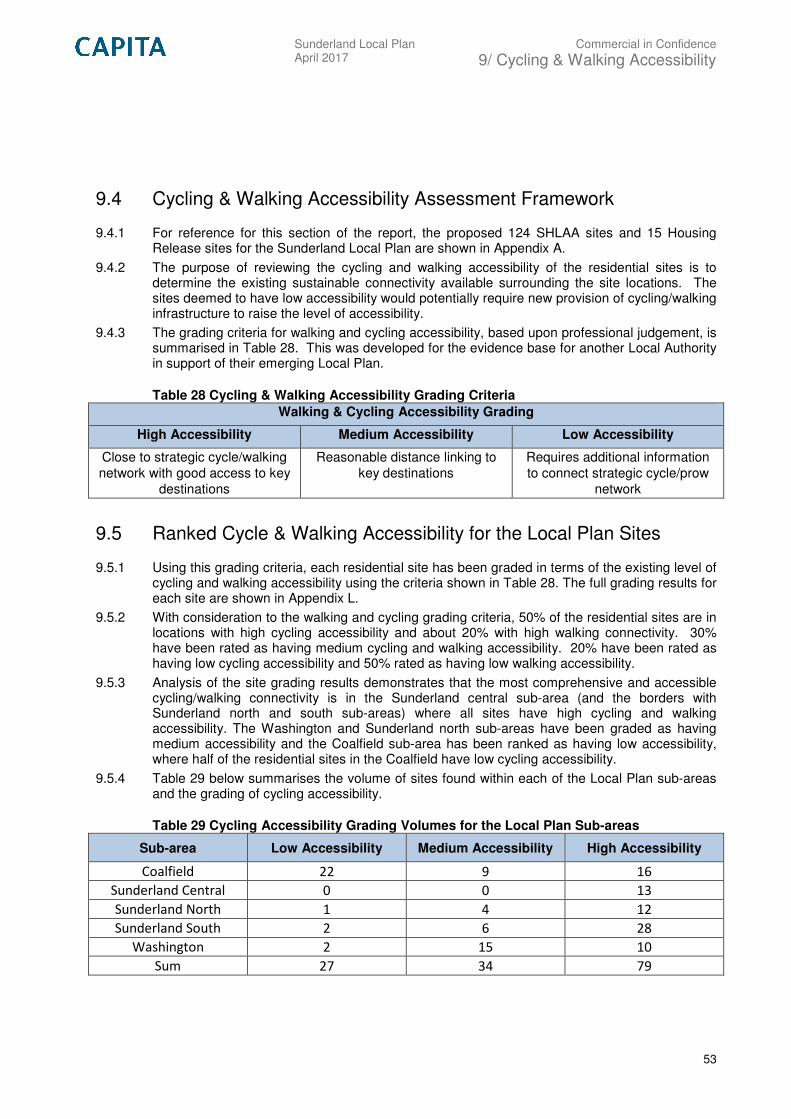
Sunderland Local Plan April 2017
Commercial in Confidence
9/ Cycling & Walking Accessibility
53
9.4 Cycling & Walking Accessibility Assessment Framework
9.4.1 For reference for this section of the report, the proposed 124 SHLAA sites and 15 Housing Release sites for the Sunderland Local Plan are shown in Appendix A.
9.4.2 The purpose of reviewing the cycling and walking accessibility of the residential sites is to determine the existing sustainable connectivity available surrounding the site locations. The sites deemed to have low accessibility would potentially require new provision of cycling/walking infrastructure to raise the level of accessibility.
9.4.3 The grading criteria for walking and cycling accessibility, based upon professional judgement, is summarised in Table 28. This was developed for the evidence base for another Local Authority in support of their emerging Local Plan.
Table 28 Cycling & Walking Accessibility Grading Criteria
Walking & Cycling Accessibility Grading
High Accessibility Medium Accessibility
Low Accessibility
Close to strategic cycle/walking
network with good access to key
destinations
Reasonable distance linking to
key destinations
Requires additional information
to connect strategic cycle/prow
network
9.5 Ranked Cycle & Walking Accessibility for the Local Plan Sites
9.5.1 Using this grading criteria, each residential site has been graded in terms of the existing level of cycling and walking accessibility using the criteria shown in Table 28. The full grading results for each site are shown in Appendix L.
9.5.2 With consideration to the walking and cycling grading criteria, 50% of the residential sites are in locations with high cycling accessibility and about 20% with high walking connectivity. 30% have been rated as having medium cycling and walking accessibility. 20% have been rated as having low cycling accessibility and 50% rated as having low walking accessibility.
9.5.3 Analysis of the site grading results demonstrates that the most comprehensive and accessible cycling/walking connectivity is in the Sunderland central sub-area (and the borders with Sunderland north and south sub-areas) where all sites have high cycling and walking accessibility. The Washington and Sunderland north sub-areas have been graded as having medium accessibility and the Coalfield sub-area has been ranked as having low accessibility, where half of the residential sites in the Coalfield have low cycling accessibility.
9.5.4 Table 29 below summarises the volume of sites found within each of the Local Plan sub-areas and the grading of cycling accessibility.
Table 29 Cycling Accessibility Grading Volumes for the Local Plan Sub-areas
Sub-area Low Accessibility Medium Accessibility High Accessibility
Coalfield 22 9 16
Sunderland Central 0 0 13
Sunderland North 1 4 12
Sunderland South 2 6 28
Washington 2 15 10
Sum 27 34 79
Sunderland Local Plan April 2017
Commercial in Confidence
9/ Cycling & Walking Accessibility
54
9.6 Potential Accessibility Improvements
9.6.1 All residential sites will be constructed where connections to existing footpaths will be provided for pedestrians entering/exiting the sites, making all sites permeable to surrounding walking infrastructure.
9.6.2 Given the small scale nature of walking; the fact that people can walk wherever they choose to, and the nature of built up environments in Sunderland which provide the necessary infrastructure to enable walking journeys, this transportation assessment has not identified any significant gaps in walking accessibility surrounding the residential and employment sites.
9.6.3 Walking distances between the residential sites and nearby bus stops/public transport services varies approximately between 200m and 800m+. However, the majority of the largest sites are located where public transport services operate on nearby carriageways.
9.6.4 The public transport accessibility plan shown in Appendix J illustrates recommended improvements to public transport provision where additional/extension to existing services would deliver improved accessibility between the residential sites where connectivity is currently limited/none existent.
9.6.5 In relation to cycling accessibility, the area within the Sunderland extents where connectivity is the weakest is the central part of the Coalfield sub-area, where the cycle network connections are sparse. Advisory cycle routes are common with a very small volume of traffic free cycle paths.
9.6.6 Within this area, a cluster of proposed employment sites including Dubmire and Rainton Bridge North Industrial Estates (sites 0, 78, 80, 81, 85, 87) are located within reasonable distances from the Local Plan residential sites (339, 112, 197, 540, 462, 637, 11, 74 etc.). The average distances between these sites is 3.5km-5km, which constitute acceptable cycling distances.
9.6.7 Within Washington, cycling accessibility mainly constitutes advisory cycle paths or paths (where people are advised to walk their bikes). NCN 7, however, provides a good level of cycling connectivity in Washington, and connects the IAMP site with Sunderland city centre.
9.6.8 Based upon this analysis, the transportation assessment suggests the following cycle accessibility enhancements for improved connectivity between the largest residential and employment sites, which are shown in Appendix M:
• Connection 1: linking NCN 70 with the traffic free routes that provide access to Rainton
Bridge North Industrial Estate;
• Connection 2: linking the traffic free routes located at the east of A182 with traffic routes
into Rainton Bridge North Industrial Estate via B1260;
• Connection 3: linking some advisory cycle paths at the east of A19 with A183 along the
B1286;
• Connection 4: linking NCN 1 with NCN 70 via Burdon Lane;
• Connection 5: linking NCN 1 to Sunderland city centre with a new cycle connection
along the A1018 and via Hendon Industrial Estate;
• Connection 6: linking NCN 7 with the traffic free cycle path east of A1 (eastern
boundary of the borough) via A1231. This link would connect Nissan, Pattinson North
and Stephenson Industrial Estate and provide direct cycle routes to the existing traffic
free cycle paths located south of the IAMP site; and
• Connection 7: linking the proposed connection 3 above with the advisory cycle paths on
the east of A19 south of Market Place Industrial Estate.

Sunderland Local Plan April 2017
Commercial in Confidence
9/ Cycling & Walking Accessibility
55
9.6.9 At this stage in the Local Plan process, these connections have been suggested to bridge current gaps in cycle accessibility between the largest of the residential sites. Further detailed feasibility studies to inform the IDP to be undertaken by Highways/Traffic Engineers would be required to determine the appropriateness of providing on-road/off-road cycle paths and connections between the sites.
9.6.10 In relation to the largest of the sites which will generate a high footfall of movements, pedestrian crossings would be recommended as part of delivering a high standard of site permeability for sustainable transport and access.
Sunderland Local Plan April 2017
Commercial in Confidence
10/ Conclusions
56
10. Conclusions
10.1 Traffic Modelling & Traffic Impact
10.1.1 The transportation assessment has examined the traffic impacts of the strategic residential and employment sites proposed in the emerging Sunderland Local Plan. The study area included in the assessment is Sunderland, consisting of the Sunderland central, north, south, Washington, and Coalfield sub-areas. The sites examined have included 124 SHLAA sites, 15 additional Housing Release sites, and 66 employment sites spread across the sub-areas. The assessment also included the proposed IAMP development.
10.1.2 A methodical trip generation exercise has been undertaken to determine the anticipated vehicular trips likely to be generated by the Local Plan sites, calculated based upon the number of jobs and houses being delivered, as well as a comprehensive review of committed development trips and future traffic growth.
10.1.3 A strategic SATURN model of the study area has been developed from a model generated to assess the impacts of the SSTC scheme. The future year matrix development and future year traffic distribution has been supported by a settlement based gravity model which considers parts of the study area that were not contained within the SATURN simulation network.
10.1.4 The entire Local Plan period is broken down into four groups; phase 0 (0-5 years), phase 1 (6-10 years), phase 2 (11-15 years), and phase 3 (16 and 18 years). The traffic demand for these four periods have been assessed in the SATURN model for the weekday AM and PM peak periods to highlight the traffic impact of the Local Plan proposals on junctions in the modelled network.
10.1.5 70 junctions and 40 junctions in the AM peak are anticipated to experience capacity issues during phase 0 and phase 1 of the Local Plan respectively. 65 junctions and 40 junctions in the PM peak are anticipated to experience capacity issues during phase 0 and phase 1 of the Local Plan respectively. During the proceeding Local Plan phases, however, the volume of junctions that are forecasted to experience capacity issues reduces significantly, indicating that mitigation works will be required during the first 5 years of the Local Plan.
10.1.6 Of these junctions, 70+ can be expected to become oversaturated during both the AM and PM peaks. These junctions are located within the immediate vicinity of the largest employment site (IAMP) in Washington and those around the largest cluster of residential sites in the Sunderland South Growth Area around Burdon Lane. This is due to the large increase in traffic associated with the development of these sites. Consequently, the junctions along the A19 providing direct connectivity between these areas will experience an increase in traffic volumes and capacity pressures.
10.1.7 Various high level mitigation recommendations have been made for those junctions that are anticipated to become oversaturated during the Local Plan period. These remedial suggestions are indicative at best and will require further investigation and traffic modelling to determine the impact of them on junction performance.
10.1.8 There is a clear indication from the SATURN modelling that the highway network in the Coalfield sub-area will need to be upgraded to accommodate the additional traffic generated by the residential and employment sites in the Local Plan. Whilst major highway interventions are not currently programmed for implementation during the Local Plan period, it is evident that these will need to be brought forward if the sites identified in the Coalfield sub-area are to be delivered.

Sunderland Local Plan April 2017
Commercial in Confidence
10/ Conclusions
57
10.1.9 Furthermore, the suggested improvements and highway mitigations contained in this report would need to be tested in the SATURN model to determine the impacts of the mitigation at the specific junctions and the impacts on the wider highway network collectively. Individual modelling of specific complex junctions’ may be required also which would provide a greater understanding of the effects of junction changes which may not be as obvious in the strategic SATURN model.
10.1.10 This further work will be required at this level of detail to inform the proposals for the IDP. On determination of the specific highway modifications required, and following traffic modelling to support these improvements, the costs for the improvements can be divided between the site developers where traffic is deemed to contribute to future capacity issues. The contribution costs should be calculated based upon the share of the impact of each Local Plan site (based upon the number of trips generated at each junction), and the cost share should be applied pro rata for each site.
10.2 Smarter Choices & Sustainable Travel
10.2.1 The transportation assessment has assessed the public transport accessibility of the Local Plan sites to determine the existing public transport connectivity available surrounding the site locations. The grading criteria used included Metro accessibility, bus accessibility, and bus services/frequencies.
10.2.2 35% of the Local Plan sites have been ranked as having high public transport accessibility, 35% have been ranked as having medium public transport accessibility, and 30% have been ranked as having low public transport accessibility. The sites with high accessibility tend to be located within the vicinity of Sunderland city centre and sites with low accessibility tend to be situated within the Coalfield sub-area.
10.2.3 Eight public transport improvements have been suggested to provide bus links between the Local Plan residential and employment sites where significant movements are anticipated to occur, and where low public accessibility has been determined. These are a combination of extensions to existing bus services and the provision of new services linking Sunderland city centre with the key residential sites and the largest employment sites, the distribution for which has been determine by the strategic SATURN model outputs.
10.2.4 The transportation assessment has reviewed the cycling and walking accessibility of the Local Plan sites to establish the existing sustainable connectivity and infrastructure available surrounding the site locations. 50% of the Local Plan sites are proposed in locations with high cycling accessibility, 20% with high walking accessibility, and 30% have been rated as having medium cycling and walking accessibility. 20% have been rated as having low cycling accessibility and 50% have been rated as having low walking accessibility.
10.2.5 The most comprehensive and accessible cycling/walking connectivity has been found to be in the Sunderland central sub-area. The Coalfield sub-area has been ranked as having low sustainable accessibility, where half of the Local Plan sites within this area have been ranked as having low cycling accessibility.
10.2.6 Seven cycling accessibility improvements have been suggested to provide improved sustainable transport connections between the Local Plan residential and employment sites where significant movements are anticipated to occur, and where cycling distances are deemed acceptable for journeys by bicycle.

Commercial in Confidence
Capita Property and Infrastructure Ltd
North Tyneside Council
The Quadrant
The Silverlink North
Cobalt Business Park
North Tyneside NE27 0BY
www.capita.co.uk

Commercial in Confidence
Appendix A SHLAA & Housing Release Sites
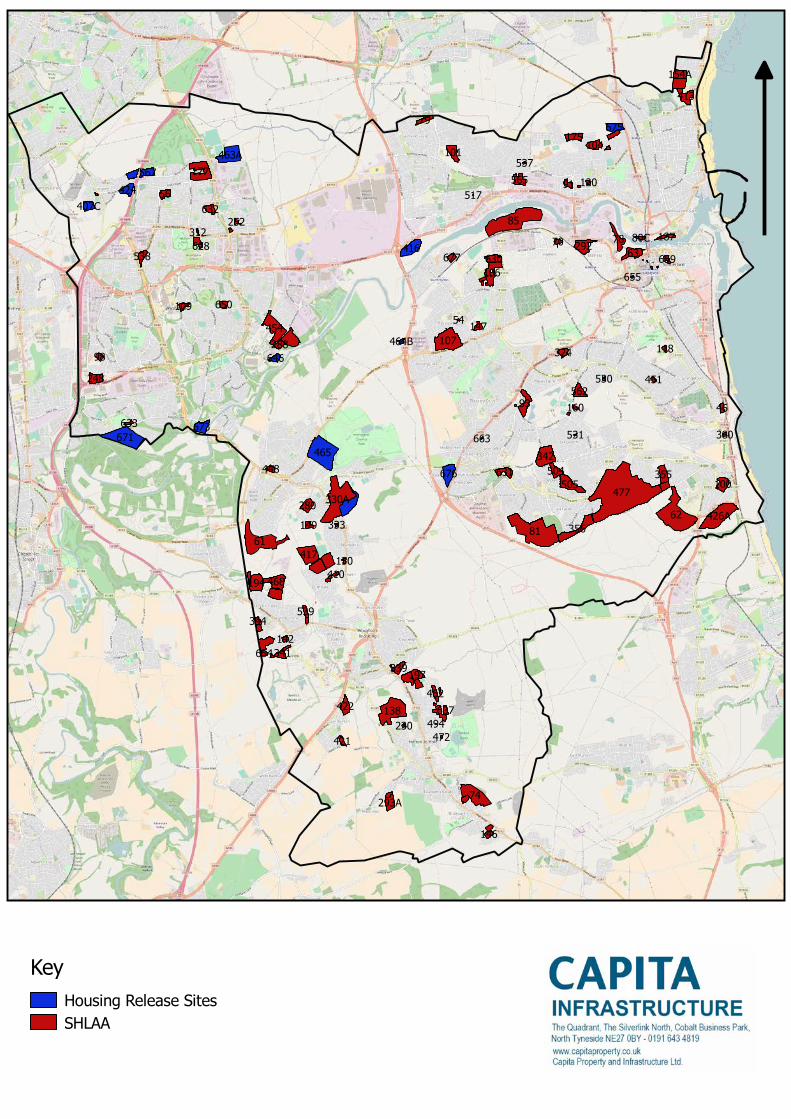
Housing Release SitesSHLAA
Key

Commercial in Confidence
Appendix B Employment Sites
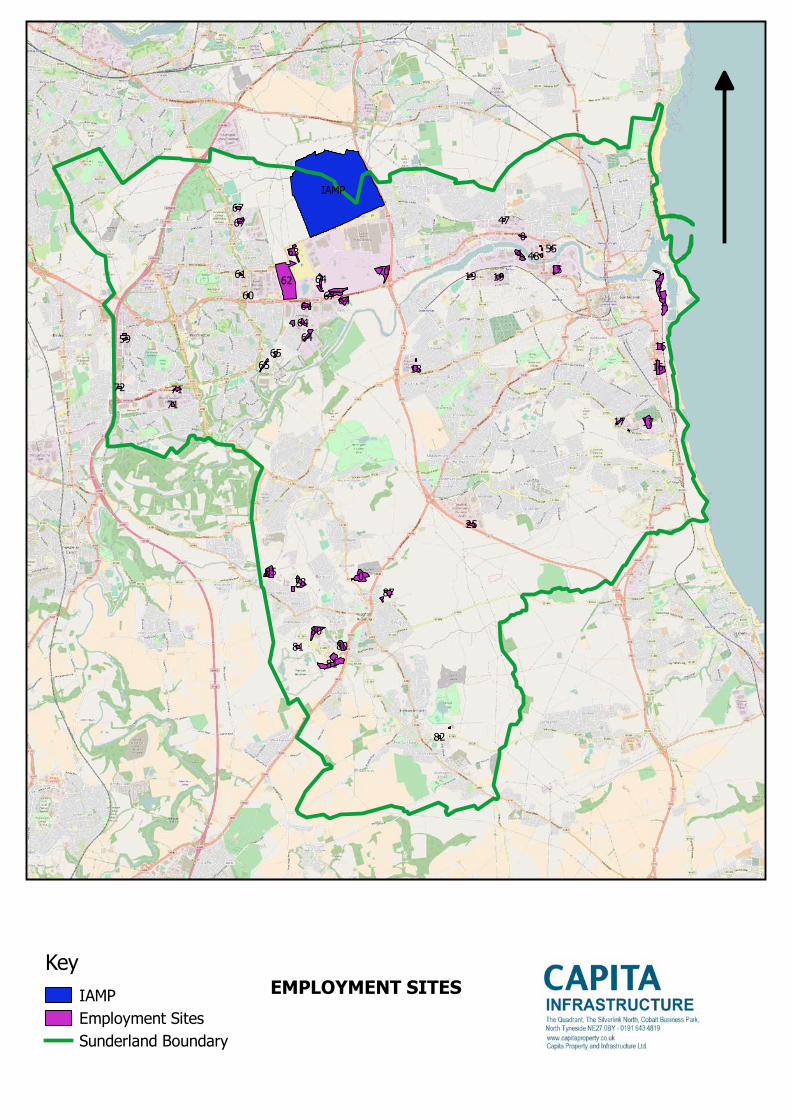
IAMPEmployment SitesSunderland Boundary
KeyEMPLOYMENT SITES

Commercial in Confidence
Appendix C Local Plan Residential & Employment Sites Trip Generation
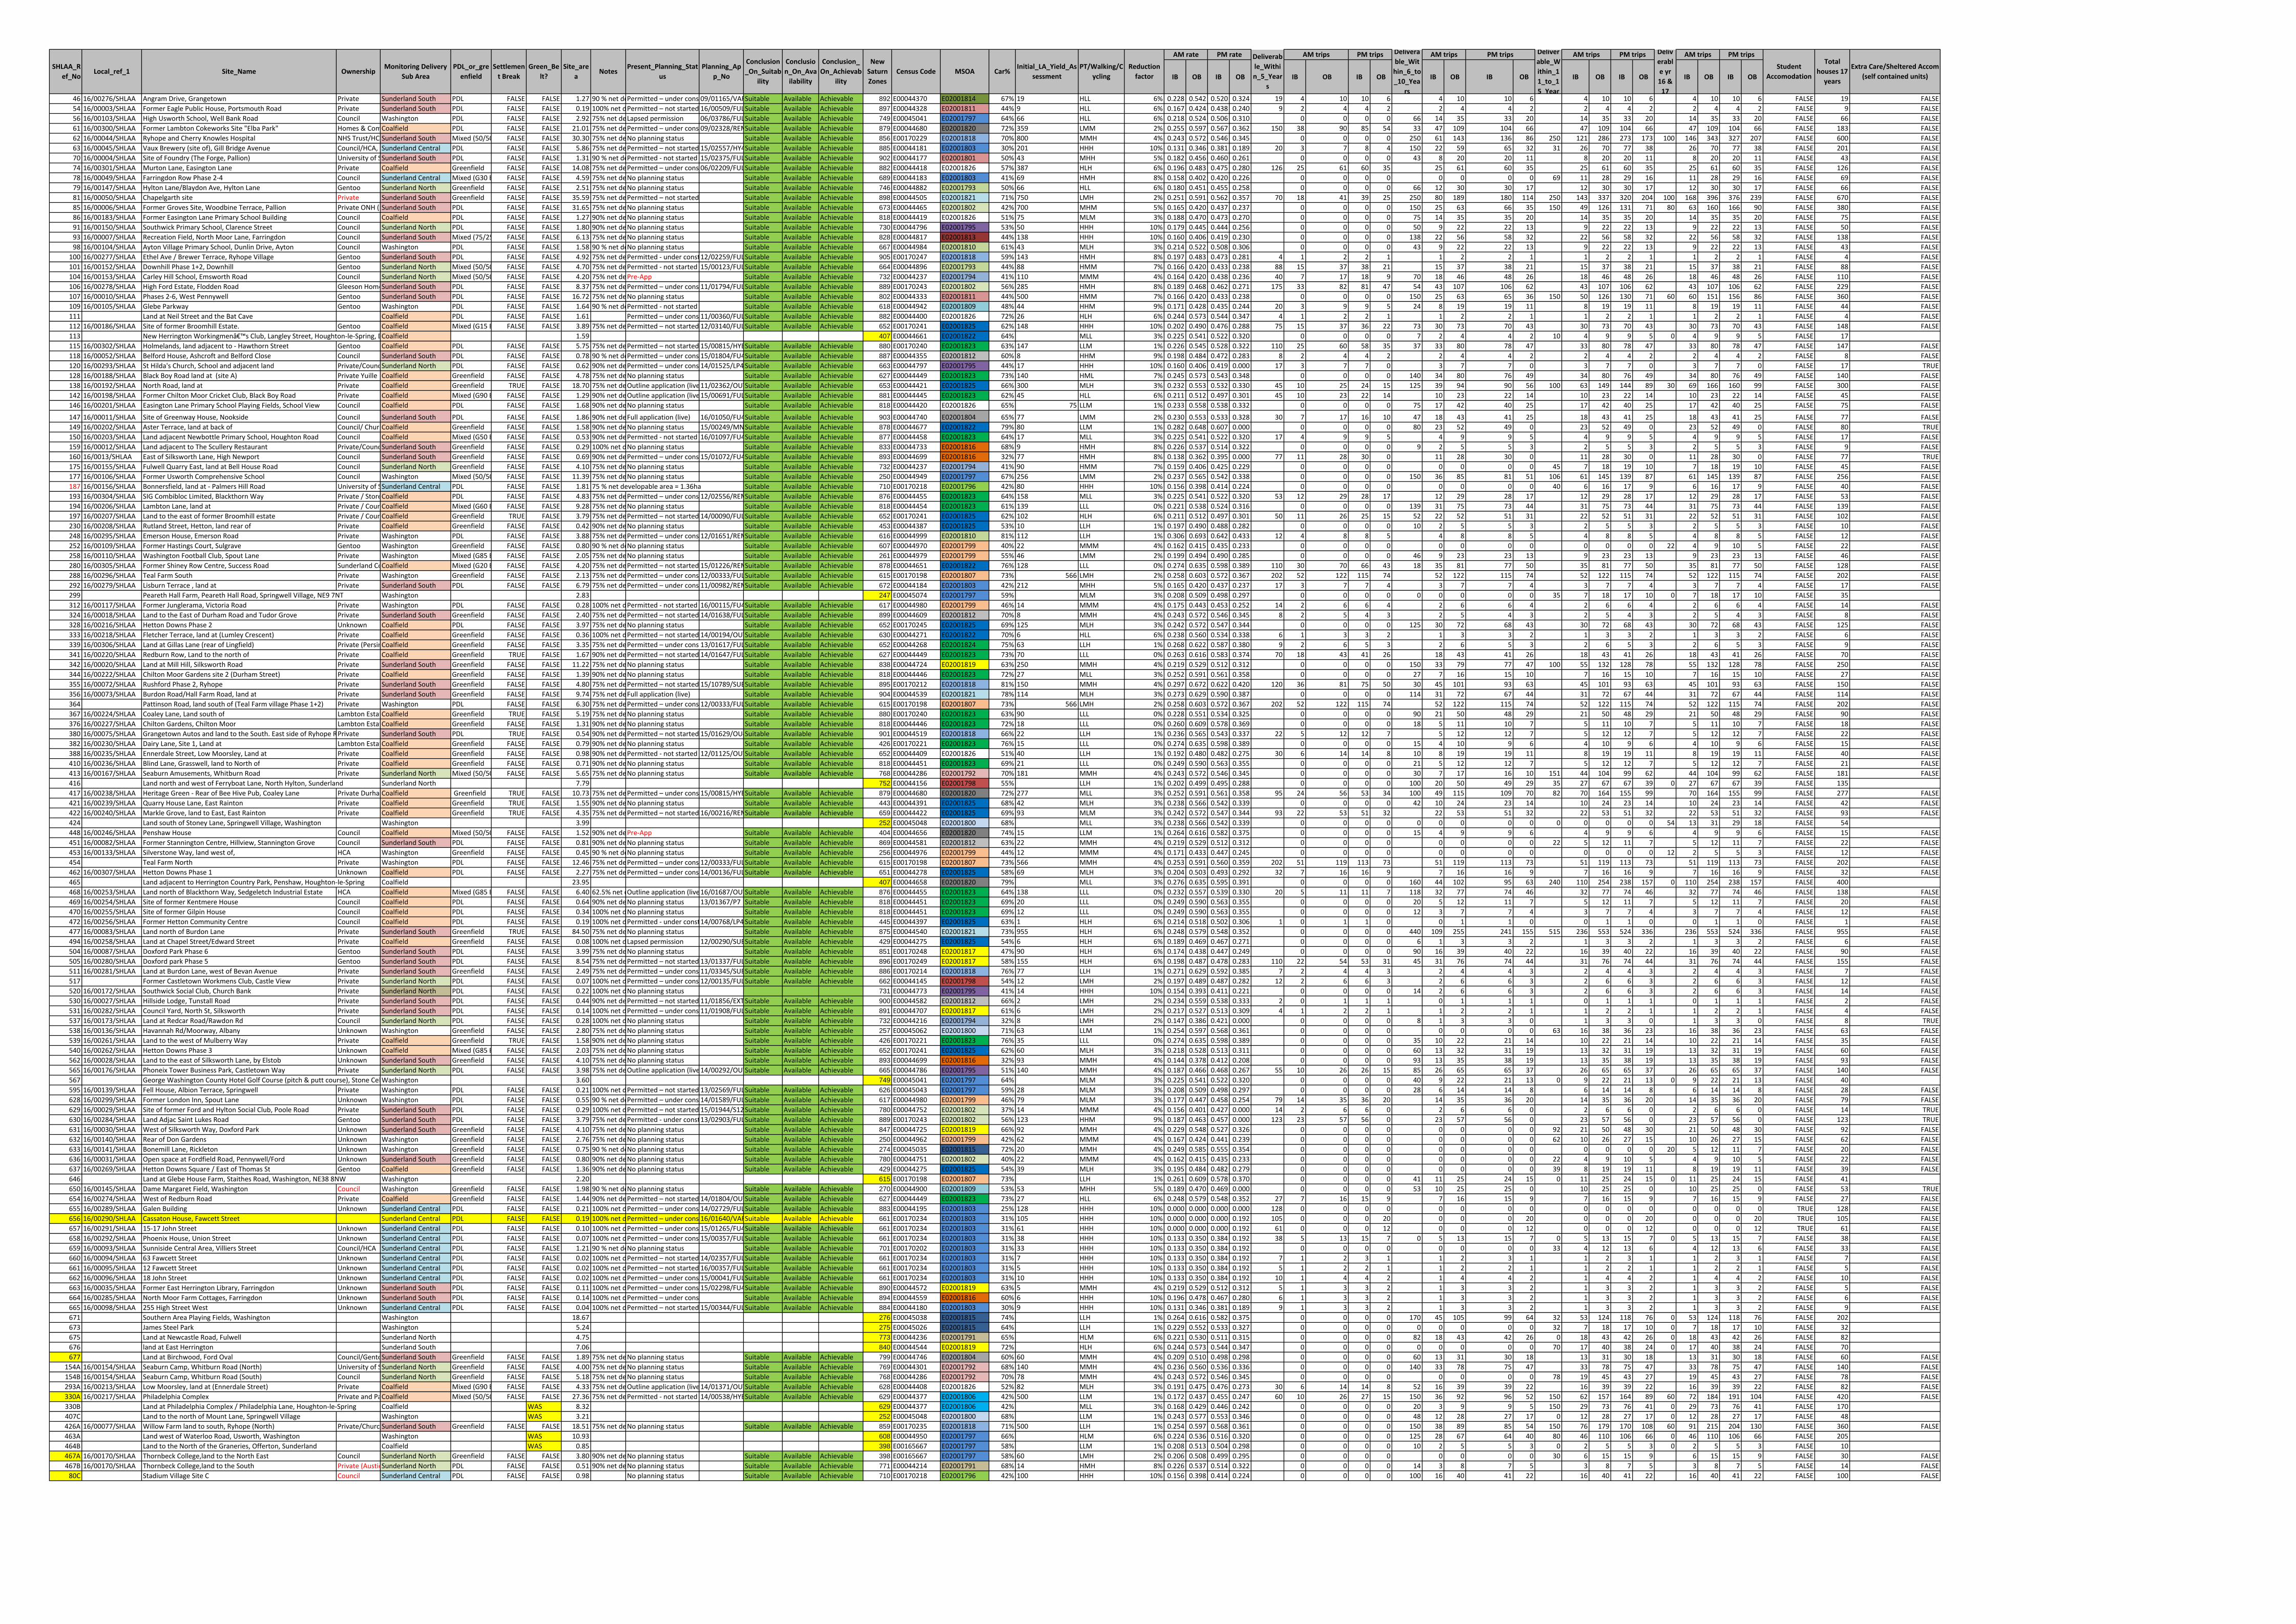
IB OB IB OB IB OB IB OB IB OB IB OB IB OB IB OB IB OB IB OB
46 16/00276/SHLAA Angram Drive, Grangetown Private Sunderland South PDL FALSE FALSE 1.27 90 % net developable area = 1.14haPermitted – under construction09/01165/VARSuitable Available Achievable 892 E00044370 E02001814 67% 19 HLL 6% 0.228 0.542 0.520 0.324 19 4 10 10 6 4 10 10 6 4 10 10 6 4 10 10 6 FALSE 19 FALSE
54 16/00003/SHLAA Former Eagle Public House, Portsmouth Road Private Sunderland South PDL FALSE FALSE 0.19 100% net developable areaPermitted – not started 16/00509/FULSuitable Available Achievable 897 E00044328 E02001811 44% 9 HLL 6% 0.167 0.424 0.438 0.240 9 2 4 4 2 2 4 4 2 2 4 4 2 2 4 4 2 FALSE 9 FALSE
56 16/00103/SHLAA High Usworth School, Well Bank Road Council Washington PDL FALSE FALSE 2.92 75% net developable area =2.19haLapsed permission 06/03786/FULSuitable Available Achievable 749 E00045041 E02001797 64% 66 HLL 6% 0.218 0.524 0.506 0.310 0 0 0 0 66 14 35 33 20 14 35 33 20 14 35 33 20 FALSE 66 FALSE
61 16/00300/SHLAA Former Lambton Cokeworks Site "Elba Park" Homes & Communities Agency/ Barratt developer/ BDW Trading LtdCoalfield PDL FALSE FALSE 21.01 75% net developable area =15.76haPermitted – under construction09/02328/REMSuitable Available Achievable 879 E00044680 E02001820 72% 359 LMM 2% 0.255 0.597 0.567 0.362 150 38 90 85 54 33 47 109 104 66 47 109 104 66 47 109 104 66 FALSE 183 FALSE
62 16/00044/SHLAA Ryhope and Cherry Knowles Hospital NHS Trust/HCASunderland South Mixed (50/50) FALSE FALSE 30.30 75% net developable area =22.73haNo planning status Suitable Available Achievable 856 E00170229 E02001818 70% 800 MMH 4% 0.243 0.572 0.546 0.345 0 0 0 0 250 61 143 136 86 250 121 286 273 173 100 146 343 327 207 FALSE 600 FALSE
63 16/00045/SHLAA Vaux Brewery (site of), Gill Bridge Avenue Council/HCA, purchase of site from Tesco February 2011Sunderland Central PDL FALSE FALSE 5.86 75% net developable area = 4.40haPermitted – not started 15/02557/HY4Suitable Available Achievable 885 E00044181 E02001803 30% 201 HHH 10% 0.131 0.346 0.381 0.189 20 3 7 8 4 150 22 59 65 32 31 26 70 77 38 26 70 77 38 FALSE 201 FALSE
70 16/00004/SHLAA Site of Foundry (The Forge, Pallion) University of SunderlandSunderland South PDL FALSE FALSE 1.31 90 % net developable area = 1.18haPermitted - not started 15/02375/FULSuitable Available Achievable 902 E00044177 E02001801 50% 43 MHH 5% 0.182 0.456 0.460 0.261 0 0 0 0 43 8 20 20 11 8 20 20 11 8 20 20 11 FALSE 43 FALSE
74 16/00301/SHLAA Murton Lane, Easington Lane Private Coalfield Greenfield FALSE FALSE 14.08 75% net developable area =10.56haPermitted – under construction06/02209/FULSuitable Available Achievable 882 E00044418 E02001826 57% 387 HLH 6% 0.196 0.483 0.475 0.280 126 25 61 60 35 25 61 60 35 25 61 60 35 25 61 60 35 FALSE 126 FALSE
78 16/00049/SHLAA Farringdon Row Phase 2-4 Council Sunderland Central Mixed (G30 B70) FALSE FALSE 4.59 75% net developable area = 3.44haNo planning status Suitable Available Achievable 689 E00044183 E02001803 41% 69 HMH 8% 0.158 0.402 0.420 0.226 0 0 0 0 0 0 0 0 69 11 28 29 16 11 28 29 16 FALSE 69 FALSE
79 16/00147/SHLAA Hylton Lane/Blaydon Ave, Hylton Lane Gentoo Sunderland North Greenfield FALSE FALSE 2.51 75% net developable area = 1.88 haNo planning status Suitable Available Achievable 746 E00044882 E02001793 50% 66 HLL 6% 0.180 0.451 0.455 0.258 0 0 0 0 66 12 30 30 17 12 30 30 17 12 30 30 17 FALSE 66 FALSE
81 16/00050/SHLAA Chapelgarth site Private Sunderland South Greenfield FALSE FALSE 35.59 75% net developable area =26.69haPermitted – not started Suitable Available Achievable 898 E00044505 E02001821 71% 750 LMH 2% 0.251 0.591 0.562 0.357 70 18 41 39 25 250 80 189 180 114 250 143 337 320 204 100 168 396 376 239 FALSE 670 FALSE
85 16/00006/SHLAA Former Groves Site, Woodbine Terrace, Pallion Private ONH (owner)Sunderland South PDL FALSE FALSE 31.65 75% net developable area =23.74haNo planning status Suitable Available Achievable 673 E00044465 E02001802 42% 700 MHM 5% 0.165 0.420 0.437 0.237 0 0 0 0 150 25 63 66 35 150 49 126 131 71 80 63 160 166 90 FALSE 380 FALSE
86 16/00183/SHLAA Former Easington Lane Primary School Building Council Coalfield PDL FALSE FALSE 1.27 90% net developable area = 1.14haNo planning status Suitable Available Achievable 818 E00044419 E02001826 51% 75 MLM 3% 0.188 0.470 0.473 0.270 0 0 0 0 75 14 35 35 20 14 35 35 20 14 35 35 20 FALSE 75 FALSE
91 16/00150/SHLAA Southwick Primary School, Clarence Street Council Sunderland North PDL FALSE FALSE 1.80 90% net developable area = 1.62haNo planning status Suitable Available Achievable 730 E00044796 E02001795 53% 50 HHH 10% 0.179 0.445 0.444 0.256 0 0 0 0 50 9 22 22 13 9 22 22 13 9 22 22 13 FALSE 50 FALSE
93 16/00007/SHLAA Recreation Field, North Moor Lane, Farringdon Council Sunderland South Mixed (75/25) FALSE FALSE 6.13 75% net developable area =4.60haNo planning status Suitable Available Achievable 828 E00044817 E02001813 44% 138 HHH 10% 0.160 0.406 0.419 0.230 0 0 0 0 138 22 56 58 32 22 56 58 32 22 56 58 32 FALSE 138 FALSE
98 16/00104/SHLAA Ayton Village Primary School, Dunlin Drive, Ayton Council Washington PDL FALSE FALSE 1.58 90 % net developable area = 1.42ha. Formerly Ayton Primary School, Gold Crest RoadNo planning status Suitable Available Achievable 667 E00044984 E02001810 61% 43 MLH 3% 0.214 0.522 0.508 0.306 0 0 0 0 43 9 22 22 13 9 22 22 13 9 22 22 13 FALSE 43 FALSE
100 16/00277/SHLAA Ethel Ave / Brewer Terrace, Ryhope Village Gentoo Sunderland South PDL FALSE FALSE 4.92 75% net developable area =3.69haPermitted - under construction12/02259/FULSuitable Available Achievable 905 E00170247 E02001818 59% 143 HMH 8% 0.197 0.483 0.473 0.281 4 1 2 2 1 1 2 2 1 1 2 2 1 1 2 2 1 FALSE 4 FALSE
101 16/00152/SHLAA Downhill Phase 1+2, Downhill Gentoo Sunderland North Mixed (50/50) FALSE FALSE 4.70 75% net developable area = 3.53haPermitted - not started 15/00123/FULSuitable Available Achievable 664 E00044896 E02001793 44% 88 HMM 7% 0.166 0.420 0.433 0.238 88 15 37 38 21 15 37 38 21 15 37 38 21 15 37 38 21 FALSE 88 FALSE
104 16/00153/SHLAA Carley Hill School, Emsworth Road Council Sunderland North Mixed (50/50) FALSE FALSE 4.20 75% net developable area = 3.15haPre-App Suitable Available Achievable 732 E00044237 E02001794 41% 110 MMM 4% 0.164 0.420 0.438 0.236 40 7 17 18 9 70 18 46 48 26 18 46 48 26 18 46 48 26 FALSE 110 FALSE
106 16/00278/SHLAA High Ford Estate, Flodden Road Gleeson Homes LtdSunderland South PDL FALSE FALSE 8.37 75% net developable area =6.28haPermitted – under construction11/01794/FULSuitable Available Achievable 889 E00170243 E02001802 56% 285 HMH 8% 0.189 0.468 0.462 0.271 175 33 82 81 47 54 43 107 106 62 43 107 106 62 43 107 106 62 FALSE 229 FALSE
107 16/00010/SHLAA Phases 2-6, West Pennywell Gentoo Sunderland South PDL FALSE FALSE 16.72 75% net developable area =12.54haNo planning status Suitable Available Achievable 802 E00044333 E02001811 44% 500 HMM 7% 0.166 0.420 0.433 0.238 0 0 0 0 150 25 63 65 36 150 50 126 130 71 60 60 151 156 86 FALSE 360 FALSE
109 16/00105/SHLAA Glebe Parkway Gentoo Washington PDL FALSE FALSE 1.64 90 % net developable area = 1.48haPermitted - not started Suitable Available Achievable 618 E00044942 E02001809 48% 44 HHM 9% 0.171 0.428 0.435 0.244 20 3 9 9 5 24 8 19 19 11 8 19 19 11 8 19 19 11 FALSE 44 FALSE
111 Land at Neil Street and the Bat Cave Coalfield PDL FALSE FALSE 1.61 Permitted – under construction11/00360/FULSuitable Available Achievable 882 E00044400 E02001826 72% 26 HLH 6% 0.244 0.573 0.544 0.347 4 1 2 2 1 1 2 2 1 1 2 2 1 1 2 2 1 FALSE 4 FALSE
112 16/00186/SHLAA Site of former Broomhill Estate. Gentoo Coalfield Mixed (G15 B85) FALSE FALSE 3.89 75% net developable area =2.92haPermitted – not started 12/03140/FULSuitable Available Achievable 652 E00170241 E02001825 62% 148 HHH 10% 0.202 0.490 0.476 0.288 75 15 37 36 22 73 30 73 70 43 30 73 70 43 30 73 70 43 FALSE 148 FALSE
113 New Herrington Workingmen’s Club, Langley Street, Houghton-le-Spring, DH4 4LJCoalfield 1.59 407 E00044661 E02001822 64% MLL 3% 0.225 0.541 0.522 0.320 0 0 0 0 7 2 4 4 2 10 4 9 9 5 0 4 9 9 5 FALSE 17
115 16/00302/SHLAA Holmelands, land adjacent to - Hawthorn Street Gentoo Coalfield PDL FALSE FALSE 5.75 75% net developable area =4.31haPermitted – not started 15/00815/HYBSuitable Available Achievable 880 E00170240 E02001823 63% 147 LLM 1% 0.226 0.545 0.528 0.322 110 25 60 58 35 37 33 80 78 47 33 80 78 47 33 80 78 47 FALSE 147 FALSE
118 16/00052/SHLAA Belford House, Ashcroft and Belford Close Council Sunderland South PDL FALSE FALSE 0.78 90 % net developable area = 0.70haPermitted – under construction15/01804/FU4Suitable Available Achievable 887 E00044355 E02001812 60% 8 HHM 9% 0.198 0.484 0.472 0.283 8 2 4 4 2 2 4 4 2 2 4 4 2 2 4 4 2 FALSE 8 FALSE
120 16/00293/SHLAA St Hilda's Church, School and adjacent land Private/CouncilSunderland North PDL FALSE FALSE 0.62 90% net developable area = 0.56haPermitted – under construction14/01525/LP4 Suitable Available Achievable 663 E00044797 E02001795 44% 17 HHH 10% 0.160 0.406 0.419 0.000 17 3 7 7 0 3 7 7 0 3 7 7 0 3 7 7 0 FALSE 17 TRUE
128 16/00188/SHLAA Black Boy Road land at (site A) Private Yuille Coalfield Greenfield FALSE FALSE 4.78 75% net developable area =3.59haNo planning status Suitable Available Achievable 627 E00044449 E02001823 73% 140 HML 7% 0.245 0.573 0.543 0.348 0 0 0 0 140 34 80 76 49 34 80 76 49 34 80 76 49 FALSE 140 FALSE
138 16/00192/SHLAA North Road, land at Private Coalfield Greenfield TRUE FALSE 18.70 75% net developable area =14.03haOutline application (live)11/02362/OUTSuitable Available Achievable 653 E00044421 E02001825 66% 300 MLH 3% 0.232 0.553 0.532 0.330 45 10 25 24 15 125 39 94 90 56 100 63 149 144 89 30 69 166 160 99 FALSE 300 FALSE
142 16/00198/SHLAA Former Chilton Moor Cricket Club, Black Boy Road Private Coalfield Mixed (G90 B10) FALSE FALSE 1.29 90% net developable area = 1.16haOutline application (live)15/00691/FULSuitable Available Achievable 881 E00044445 E02001823 62% 45 HLL 6% 0.211 0.512 0.497 0.301 45 10 23 22 14 10 23 22 14 10 23 22 14 10 23 22 14 FALSE 45 FALSE
146 16/00201/SHLAA Easington Lane Primary School Playing Fields, School View Council Coalfield PDL FALSE FALSE 1.68 90% net developable area = 1.51haNo planning status Suitable Available Achievable 818 E00044420 E02001826 65% 75 LLM 1% 0.233 0.558 0.538 0.332 0 0 0 0 75 17 42 40 25 17 42 40 25 17 42 40 25 FALSE 75 FALSE
147 16/00011/SHLAA Site of Greenway House, Nookside Council Sunderland South PDL FALSE FALSE 1.86 90% net developable area = 1.67haFull application (live) 16/01050/FU4Suitable Available Achievable 903 E00044740 E02001804 65% 77 LMM 2% 0.230 0.553 0.533 0.328 30 7 17 16 10 47 18 43 41 25 18 43 41 25 18 43 41 25 FALSE 77 FALSE
149 16/00202/SHLAA Aster Terrace, land at back of Council/ Church CommissionersCoalfield Greenfield FALSE FALSE 1.58 90% net developable area = 1.42haNo planning status 15/00249/MNQSuitable Available Achievable 878 E00044677 E02001822 79% 80 LLM 1% 0.282 0.648 0.607 0.000 0 0 0 0 80 23 52 49 0 23 52 49 0 23 52 49 0 FALSE 80 TRUE
150 16/00203/SHLAA Land adjacent Newbottle Primary School, Houghton Road Council Coalfield Mixed (G50 B50) FALSE FALSE 0.53 90% net developable area = 0.48haPermitted - not started 16/01097/FU4Suitable Available Achievable 877 E00044458 E02001823 64% 17 MLL 3% 0.225 0.541 0.522 0.320 17 4 9 9 5 4 9 9 5 4 9 9 5 4 9 9 5 FALSE 17 FALSE
159 16/00012/SHLAA Land adjacent to The Scullery Restaurant Private/CouncilSunderland South Greenfield FALSE FALSE 0.29 100% net developable area. Site formerly known as Sportsman's Arms, land adjacent to - Durham Terrace, Silksworth.No planning status Suitable Available Achievable 833 E00044733 E02001816 68% 9 HMH 8% 0.226 0.537 0.514 0.322 0 0 0 0 9 2 5 5 3 2 5 5 3 2 5 5 3 FALSE 9 FALSE
160 16/0013/SHLAA East of Silksworth Lane, High Newport Council Sunderland South Greenfield FALSE FALSE 0.69 90% net developable area = 0.62ha. Formerly East of Silksworth Lane - Dene StreetPermitted – under construction15/01072/FU4Suitable Available Achievable 893 E00044699 E02001816 32% 77 HMH 8% 0.138 0.362 0.395 0.000 77 11 28 30 0 11 28 30 0 11 28 30 0 11 28 30 0 FALSE 77 TRUE
175 16/00155/SHLAA Fulwell Quarry East, land at Bell House Road Council Sunderland North Greenfield FALSE FALSE 4.10 75% net developabel area = 3.08haNo planning status Suitable Available Achievable 732 E00044237 E02001794 41% 90 HMM 7% 0.159 0.406 0.425 0.229 0 0 0 0 0 0 0 0 45 7 18 19 10 7 18 19 10 FALSE 45 FALSE
177 16/00106/SHLAA Former Usworth Comprehensive School Council Washington Mixed (50/50) FALSE FALSE 11.39 75% net developable area =8.54haNo planning status Suitable Available Achievable 250 E00044949 E02001797 67% 256 LMM 2% 0.237 0.565 0.542 0.338 0 0 0 0 150 36 85 81 51 106 61 145 139 87 61 145 139 87 FALSE 256 FALSE
187 16/00156/SHLAA Bonnersfield, land at - Palmers Hill Road University of SunderlandSunderland Central PDL FALSE FALSE 1.81 75 % net developable area = 1.36ha Suitable Available Achievable 710 E00170218 E02001796 42% 80 HHH 10% 0.156 0.398 0.414 0.224 0 0 0 0 0 0 0 0 40 6 16 17 9 6 16 17 9 FALSE 40 FALSE
193 16/00304/SHLAA SIG Combibloc Limited, Blackthorn Way Private / Storeys;SSPCoalfield PDL FALSE FALSE 4.83 75% net developable area =3.62haPermitted – under construction12/02556/REMSuitable Available Achievable 876 E00044455 E02001823 64% 158 MLL 3% 0.225 0.541 0.522 0.320 53 12 29 28 17 12 29 28 17 12 29 28 17 12 29 28 17 FALSE 53 FALSE
194 16/00206/SHLAA Lambton Lane, land at Private / CouncilCoalfield Mixed (G60 B40) FALSE FALSE 9.28 75% net developable area =6.96haNo planning status Suitable Available Achievable 818 E00044454 E02001823 61% 139 LLL 0% 0.221 0.538 0.524 0.316 0 0 0 0 139 31 75 73 44 31 75 73 44 31 75 73 44 FALSE 139 FALSE
197 16/00207/SHLAA Land to the east of former Broomhill estate Private / CouncilCoalfield Greenfield TRUE FALSE 3.79 75% net developable area =2.84haPermitted – not started 14/00090/FULSuitable Available Achievable 652 E00170241 E02001825 62% 102 HLH 6% 0.211 0.512 0.497 0.301 50 11 26 25 15 52 22 52 51 31 22 52 51 31 22 52 51 31 FALSE 102 FALSE
230 16/00208/SHLAA Rutland Street, Hetton, land rear of Private Coalfield Greenfield FALSE FALSE 0.42 90% net developable area = 0.38haNo planning status Suitable Available Achievable 453 E00044387 E02001825 53% 10 LLH 1% 0.197 0.490 0.488 0.282 0 0 0 0 10 2 5 5 3 2 5 5 3 2 5 5 3 FALSE 10 FALSE
248 16/00295/SHLAA Emerson House, Emerson Road Private Washington PDL FALSE FALSE 3.88 75% net developable area =2.19haPermitted – under construction12/01651/REMSuitable Available Achievable 616 E00044999 E02001810 81% 112 LLH 1% 0.306 0.693 0.642 0.433 12 4 8 8 5 4 8 8 5 4 8 8 5 4 8 8 5 FALSE 12 FALSE
252 16/00109/SHLAA Former Hastings Court, Sulgrave Gentoo Washington Greenfield FALSE FALSE 0.80 90 % net developable area = 0.72haNo planning status Suitable Available Achievable 607 E00044970 E02001799 40% 22 MMM 4% 0.162 0.415 0.435 0.233 0 0 0 0 0 0 0 0 0 0 0 0 22 4 9 10 5 FALSE 22 FALSE
258 16/00110/SHLAA Washington Football Club, Spout Lane Private Washington Mixed (G85 B15) FALSE FALSE 2.05 75% net developable area =1.54ha. Formerly know as Albany Park, Spout Lane.No planning status Suitable Available Achievable 261 E00044979 E02001799 55% 46 LMM 2% 0.199 0.494 0.490 0.285 0 0 0 0 46 9 23 23 13 9 23 23 13 9 23 23 13 FALSE 46 FALSE
280 16/00305/SHLAA Former Shiney Row Centre, Success Road Sunderland CollegeCoalfield Mixed (G20 B80) FALSE FALSE 4.20 75% net developable area =3.15haPermitted – not started 15/01226/REMSuitable Available Achievable 878 E00044651 E02001822 76% 128 LLL 0% 0.274 0.635 0.598 0.389 110 30 70 66 43 18 35 81 77 50 35 81 77 50 35 81 77 50 FALSE 128 FALSE
288 16/00296/SHLAA Teal Farm South Private Washington Greenfield FALSE FALSE 2.13 75% net developable area =1.60haPermitted – under construction12/00333/FULSuitable Available Achievable 615 E00170198 E02001807 73% 566 LMH 2% 0.258 0.603 0.572 0.367 202 52 122 115 74 52 122 115 74 52 122 115 74 52 122 115 74 FALSE 202 FALSE
292 16/00279/SHLAA Lisburn Terrace , land at Private Sunderland South PDL FALSE FALSE 6.79 75% net developable area =5.09haPermitted – under construction11/00982/REMSuitable Available Achievable 672 E00044184 E02001803 42% 212 MHH 5% 0.165 0.420 0.437 0.237 17 3 7 7 4 3 7 7 4 3 7 7 4 3 7 7 4 FALSE 17 FALSE
299 Peareth Hall Farm, Peareth Hall Road, Springwell Village, NE9 7NT Washington 2.83 247 E00045074 E02001797 59% MLM 3% 0.208 0.509 0.498 0.297 0 0 0 0 0 0 0 0 0 35 7 18 17 10 0 7 18 17 10 FALSE 35
312 16/00117/SHLAA Former Junglerama, Victoria Road Private Washington PDL FALSE FALSE 0.28 100% net developable areaPermitted - not started 16/00115/FU4Suitable Available Achievable 617 E00044980 E02001799 46% 14 MMM 4% 0.175 0.443 0.453 0.252 14 2 6 6 4 2 6 6 4 2 6 6 4 2 6 6 4 FALSE 14 FALSE
324 16/00018/SHLAA Land to the East of Durham Road and Tudor Grove Private Sunderland South Greenfield FALSE FALSE 2.40 75% net developable area =1.80haPermitted – not started 14/01638/FULSuitable Available Achievable 899 E00044609 E02001812 70% 8 MMH 4% 0.243 0.572 0.546 0.345 8 2 5 4 3 2 5 4 3 2 5 4 3 2 5 4 3 FALSE 8 FALSE
328 16/00216/SHLAA Hetton Downs Phase 2 Unknown Coalfield PDL FALSE FALSE 3.97 75% net developable area =2.98haNo planning status Suitable Available Achievable 652 E00170245 E02001825 69% 125 MLH 3% 0.242 0.572 0.547 0.344 0 0 0 0 125 30 72 68 43 30 72 68 43 30 72 68 43 FALSE 125 FALSE
333 16/00218/SHLAA Fletcher Terrace, land at (Lumley Crescent) Private Coalfield Greenfield FALSE FALSE 0.36 100% net developable areaPermitted – not started 14/00194/OUTSuitable Available Achievable 630 E00044271 E02001822 70% 6 HLL 6% 0.238 0.560 0.534 0.338 6 1 3 3 2 1 3 3 2 1 3 3 2 1 3 3 2 FALSE 6 FALSE
339 16/00306/SHLAA Land at Gillas Lane (rear of Lingfield) Private (Persimmon)Coalfield Greenfield FALSE FALSE 3.35 75% net developable area =2.51ha Permitted – under construction13/01617/FULSuitable Available Achievable 652 E00044268 E02001824 75% 63 LLH 1% 0.268 0.622 0.587 0.380 9 2 6 5 3 2 6 5 3 2 6 5 3 2 6 5 3 FALSE 9 FALSE
341 16/00220/SHLAA Redburn Row, Land to the north of Private Coalfield Greenfield TRUE FALSE 1.67 90% net developable area = 1.50haPermitted – not started 14/01647/FULSuitable Available Achievable 627 E00044449 E02001823 73% 70 LLL 0% 0.263 0.616 0.583 0.374 70 18 43 41 26 18 43 41 26 18 43 41 26 18 43 41 26 FALSE 70 FALSE
342 16/00020/SHLAA Land at Mill Hill, Silksworth Road Private Sunderland South Greenfield FALSE FALSE 11.22 75% net developable area =8.42ha. Formerly Mill Hill, Land at - Silksworth LaneNo planning status Suitable Available Achievable 838 E00044724 E02001819 63% 250 MMH 4% 0.219 0.529 0.512 0.312 0 0 0 0 150 33 79 77 47 100 55 132 128 78 55 132 128 78 FALSE 250 FALSE
344 16/00222/SHLAA Chilton Moor Gardens site 2 (Durham Street) Private Coalfield Greenfield FALSE FALSE 1.39 90% net developable area = 1.25haNo planning status Suitable Available Achievable 818 E00044446 E02001823 72% 27 MLL 3% 0.252 0.591 0.561 0.358 0 0 0 0 27 7 16 15 10 7 16 15 10 7 16 15 10 FALSE 27 FALSE
355 16/00072/SHLAA Rushford Phase 2, Ryhope Private Sunderland South Greenfield FALSE FALSE 4.80 75% net developable area =3.60haPermitted – not started 15/10789/SUBSuitable Available Achievable 895 E00170212 E02001818 81% 150 MMH 4% 0.297 0.672 0.622 0.420 120 36 81 75 50 30 45 101 93 63 45 101 93 63 45 101 93 63 FALSE 150 FALSE
356 16/00073/SHLAA Burdon Road/Hall Farm Road, land at Private Sunderland South Greenfield FALSE FALSE 9.74 75% net developable area =7.31haFull application (live) Suitable Available Achievable 904 E00044539 E02001821 78% 114 MLH 3% 0.273 0.629 0.590 0.387 0 0 0 0 114 31 72 67 44 31 72 67 44 31 72 67 44 FALSE 114 FALSE
364 Pattinson Road, land south of (Teal Farm village Phase 1+2) Private Washington PDL FALSE FALSE 6.30 75% net developable area =4.73ha (364 / 475)Permitted – under construction12/00333/FULSuitable Available Achievable 615 E00170198 E02001807 73% 566 LMH 2% 0.258 0.603 0.572 0.367 202 52 122 115 74 52 122 115 74 52 122 115 74 52 122 115 74 FALSE 202 FALSE
367 16/00224/SHLAA Coaley Lane, Land south of Lambton EstatesCoalfield Greenfield TRUE FALSE 5.19 75% net developable area =3.89ha No planning status Suitable Available Achievable 880 E00170240 E02001823 63% 90 LLL 0% 0.228 0.551 0.534 0.325 0 0 0 0 90 21 50 48 29 21 50 48 29 21 50 48 29 FALSE 90 FALSE
376 16/00227/SHLAA Chilton Gardens, Chilton Moor Lambton EstatesCoalfield Greenfield FALSE FALSE 1.31 90% net developable area = 1.18haNo planning status Suitable Available Achievable 818 E00044446 E02001823 72% 18 LLL 0% 0.260 0.609 0.578 0.369 0 0 0 0 18 5 11 10 7 5 11 10 7 5 11 10 7 FALSE 18 FALSE
380 16/00075/SHLAA Grangetown Autos and land to the South. East side of Ryhope RoadPrivate Sunderland South PDL TRUE FALSE 0.54 90% net developable area = 0.49haPermitted – not started 15/01629/OU4Suitable Available Achievable 901 E00044519 E02001818 66% 22 LLH 1% 0.236 0.565 0.543 0.337 22 5 12 12 7 5 12 12 7 5 12 12 7 5 12 12 7 FALSE 22 FALSE
382 16/00230/SHLAA Dairy Lane, Site 1, Land at Lambton EstatesCoalfield Greenfield FALSE FALSE 0.79 90% net developable area = 0.71haNo planning status Suitable Available Achievable 426 E00170221 E02001823 76% 15 LLL 0% 0.274 0.635 0.598 0.389 0 0 0 0 15 4 10 9 6 4 10 9 6 4 10 9 6 FALSE 15 FALSE
388 16/00235/SHLAA Ennerdale Street, Low Moorsley, Land at Private Coalfield Greenfield FALSE FALSE 0.98 90% net developable area = 0.88haPermitted - not started 12/01125/OUTSuitable Available Achievable 652 E00044409 E02001826 51% 40 LLH 1% 0.192 0.480 0.482 0.275 30 6 14 14 8 10 8 19 19 11 8 19 19 11 8 19 19 11 FALSE 40 FALSE
410 16/00236/SHLAA Blind Lane, Grasswell, land to North of Private Coalfield Greenfield FALSE FALSE 0.71 90% net developable area = 0.64haNo planning status Suitable Available Achievable 818 E00044451 E02001823 69% 21 LLL 0% 0.249 0.590 0.563 0.355 0 0 0 0 21 5 12 12 7 5 12 12 7 5 12 12 7 FALSE 21 FALSE
413 16/00167/SHLAA Seaburn Amusements, Whitburn Road Private Sunderland North Mixed (50/50) FALSE FALSE 5.65 75% net developable area = 4.24haNo planning status Suitable Available Achievable 768 E00044286 E02001792 70% 181 MMH 4% 0.243 0.572 0.546 0.345 0 0 0 0 30 7 17 16 10 151 44 104 99 62 44 104 99 62 FALSE 181 FALSE
416 Land north and west of Ferryboat Lane, North Hylton, Sunderland Sunderland North 7.79 752 E00044156 E02001798 55% LLH 1% 0.202 0.499 0.495 0.288 0 0 0 0 100 20 50 49 29 35 27 67 67 39 0 27 67 67 39 FALSE 135
417 16/00238/SHLAA Heritage Green - Rear of Bee Hive Pub, Coaley Lane Private Durham EstatesCoalfield Greenfield TRUE FALSE 10.73 75% net developable area =8.05ha Permitted – under construction15/00815/HYBSuitable Available Achievable 879 E00044680 E02001820 72% 277 MLL 3% 0.252 0.591 0.561 0.358 95 24 56 53 34 100 49 115 109 70 82 70 164 155 99 70 164 155 99 FALSE 277 FALSE
421 16/00239/SHLAA Quarry House Lane, East Rainton Private Coalfield Greenfield TRUE FALSE 1.55 90% net developable area = 1.40haNo planning status Suitable Available Achievable 443 E00044391 E02001825 68% 42 MLH 3% 0.238 0.566 0.542 0.339 0 0 0 0 42 10 24 23 14 10 24 23 14 10 24 23 14 FALSE 42 FALSE
422 16/00240/SHLAA Markle Grove, land to East, East Rainton Private Coalfield Greenfield TRUE FALSE 4.35 75% net developable area =3.26ha Permitted – not started 16/00216/REMSuitable Available Achievable 659 E00044422 E02001825 69% 93 MLM 3% 0.242 0.572 0.547 0.344 93 22 53 51 32 22 53 51 32 22 53 51 32 22 53 51 32 FALSE 93 FALSE
424 Land south of Stoney Lane, Springwell Village, Washington Washington 3.99 252 E00045048 E02001800 68% MLL 3% 0.238 0.566 0.542 0.339 0 0 0 0 0 0 0 0 0 0 0 0 0 0 54 13 31 29 18 FALSE 54
448 16/00246/SHLAA Penshaw House Council Coalfield Mixed (50/50) FALSE FALSE 1.52 90% net developable area = 1.37haPre-App Suitable Available Achievable 404 E00044656 E02001820 74% 15 LLM 1% 0.264 0.616 0.582 0.375 0 0 0 0 15 4 9 9 6 4 9 9 6 4 9 9 6 FALSE 15 FALSE
451 16/00082/SHLAA Former Stannington Centre, Hillview, Stannington Grove Council Sunderland South PDL FALSE FALSE 0.81 90% net developable area = 0.73haNo planning status Suitable Available Achievable 869 E00044581 E02001812 63% 22 MMH 4% 0.219 0.529 0.512 0.312 0 0 0 0 0 0 0 0 22 5 12 11 7 5 12 11 7 FALSE 22 FALSE
453 16/00133/SHLAA Silverstone Way, land west of, HCA Washington Greenfield FALSE FALSE 0.45 90 % net developable area = 0.41haNo planning status Suitable Available Achievable 256 E00044976 E02001799 44% 12 MMM 4% 0.171 0.433 0.447 0.245 0 0 0 0 0 0 0 0 0 0 0 0 12 2 5 5 3 FALSE 12 FALSE
454 Teal Farm North Private Washington PDL FALSE FALSE 12.46 75% net developable area =9.35ha (454 / 476 / 71)Permitted – under construction12/00333/FULSuitable Available Achievable 615 E00170198 E02001807 73% 566 MMH 4% 0.253 0.591 0.560 0.359 202 51 119 113 73 51 119 113 73 51 119 113 73 51 119 113 73 FALSE 202 FALSE
462 16/00307/SHLAA Hetton Downs Phase 1 Unknown Coalfield PDL FALSE FALSE 2.27 75% net developable area =1.70ha Permitted – under construction14/00136/FULSuitable Available Achievable 651 E00044278 E02001825 58% 69 MLH 3% 0.204 0.503 0.493 0.292 32 7 16 16 9 7 16 16 9 7 16 16 9 7 16 16 9 FALSE 32 FALSE
465 Land adjacent to Herrington Country Park, Penshaw, Houghton-le-Spring Coalfield 23.95 407 E00044658 E02001820 79% MLL 3% 0.276 0.635 0.595 0.391 0 0 0 0 160 44 102 95 63 240 110 254 238 157 0 110 254 238 157 FALSE 400
468 16/00253/SHLAA Land north of Blackthorn Way, Sedgeletch Industrial Estate HCA Coalfield Mixed (G85 B15) FALSE FALSE 6.40 62.5% net developable area =4ha (mpm standard assumption) Outline application (live)16/01687/OUTSuitable Available Achievable 876 E00044455 E02001823 64% 138 LLL 0% 0.232 0.557 0.539 0.330 20 5 11 11 7 118 32 77 74 46 32 77 74 46 32 77 74 46 FALSE 138 FALSE
469 16/00254/SHLAA Site of former Kentmere House Council Coalfield PDL FALSE FALSE 0.64 90% net developable area = 0.58haNo planning status 13/01367/P7 Suitable Available Achievable 818 E00044451 E02001823 69% 20 LLL 0% 0.249 0.590 0.563 0.355 0 0 0 0 20 5 12 11 7 5 12 11 7 5 12 11 7 FALSE 20 FALSE
470 16/00255/SHLAA Site of former Gilpin House Council Coalfield PDL FALSE FALSE 0.34 100% net developable areaNo planning status Suitable Available Achievable 818 E00044451 E02001823 69% 12 LLL 0% 0.249 0.590 0.563 0.355 0 0 0 0 12 3 7 7 4 3 7 7 4 3 7 7 4 FALSE 12 FALSE
472 16/00256/SHLAA Former Hetton Community Centre Council Coalfield PDL FALSE FALSE 0.19 100% net developable areaPermitted - under construction14/00768/LP4 Suitable Available Achievable 445 E00044397 E02001825 63% 1 HLH 6% 0.214 0.518 0.502 0.306 1 0 1 1 0 0 1 1 0 0 1 1 0 0 1 1 0 FALSE 1 FALSE
477 16/00083/SHLAA Land north of Burdon Lane Private Sunderland South Greenfield TRUE FALSE 84.50 75% net developable area =63.38haNo planning status Suitable Available Achievable 875 E00044540 E02001821 73% 955 HLH 6% 0.248 0.579 0.548 0.352 0 0 0 0 440 109 255 241 155 515 236 553 524 336 236 553 524 336 FALSE 955 FALSE
494 16/00258/SHLAA Land at Chapel Street/Edward Street Private Coalfield Greenfield FALSE FALSE 0.08 100% net developable areaLapsed permission 12/00290/SUBSuitable Available Achievable 429 E00044275 E02001825 54% 6 HLH 6% 0.189 0.469 0.467 0.271 0 0 0 0 6 1 3 3 2 1 3 3 2 1 3 3 2 FALSE 6 FALSE
504 16/00087/SHLAA Doxford Park Phase 6 Gentoo Sunderland South PDL FALSE FALSE 3.99 75% net developable area =2.99haNo planning status Suitable Available Achievable 851 E00170248 E02001817 47% 90 HLH 6% 0.174 0.438 0.447 0.249 0 0 0 0 90 16 39 40 22 16 39 40 22 16 39 40 22 FALSE 90 FALSE
505 16/00280/SHLAA Doxford park Phase 5 Gentoo Sunderland South PDL FALSE FALSE 8.54 75% net developable area =6.41haPermitted – not started 13/01337/FULSuitable Available Achievable 896 E00170249 E02001817 58% 155 HLH 6% 0.198 0.487 0.478 0.283 110 22 54 53 31 45 31 76 74 44 31 76 74 44 31 76 74 44 FALSE 155 FALSE
511 16/00281/SHLAA Land at Burdon Lane, west of Bevan Avenue Private Sunderland South Greenfield FALSE FALSE 2.49 75% net developable area =1.87haPermitted – under construction11/03345/SUBSuitable Available Achievable 886 E00170214 E02001818 76% 77 LLH 1% 0.271 0.629 0.592 0.385 7 2 4 4 3 2 4 4 3 2 4 4 3 2 4 4 3 FALSE 7 FALSE
517 Former Castletown Workmens Club, Castle View Private Sunderland North PDL FALSE FALSE 0.07 100% net developable areaPermitted – under construction12/00135/FULSuitable Available Achievable 662 E00044145 E02001798 54% 12 LMH 2% 0.197 0.489 0.487 0.282 12 2 6 6 3 2 6 6 3 2 6 6 3 2 6 6 3 FALSE 12 FALSE
520 16/00172/SHLAA Southwick Social Club, Church Bank Private Sunderland North PDL FALSE FALSE 0.22 100% net developable areaNo planning status 731 E00044773 E02001795 41% 14 HHH 10% 0.154 0.393 0.411 0.221 0 0 0 0 14 2 6 6 3 2 6 6 3 2 6 6 3 FALSE 14 FALSE
530 16/00027/SHLAA Hillside Lodge, Tunstall Road Private Sunderland South PDL FALSE FALSE 0.44 90% net developable area = 0.40haPermitted – not started 11/01856/EXT1Suitable Available Achievable 900 E00044582 E02001812 66% 2 LMH 2% 0.234 0.559 0.538 0.333 2 0 1 1 1 0 1 1 1 0 1 1 1 0 1 1 1 FALSE 2 FALSE
531 16/00282/SHLAA Council Yard, North St, Silksworth Private Sunderland South PDL FALSE FALSE 0.14 100% net developable areaPermitted – under construction11/01908/FULSuitable Available Achievable 891 E00044707 E02001817 61% 6 LMH 2% 0.217 0.527 0.513 0.309 4 1 2 2 1 1 2 2 1 1 2 2 1 1 2 2 1 FALSE 4 FALSE
537 16/00173/SHLAA Land at Redcar Road/Rawdon Rd Council Sunderland North PDL FALSE FALSE 0.28 100% net developable areaNo planning status Suitable Available Achievable 732 E00044216 E02001794 32% 8 LMH 2% 0.147 0.386 0.421 0.000 0 0 0 0 8 1 3 3 0 1 3 3 0 1 3 3 0 FALSE 8 TRUE
538 16/00136/SHLAA Havannah Rd/Moorway, Albany Unknown Washington Greenfield FALSE FALSE 2.80 75% net developable area =2.10haNo planning status Suitable Available Achievable 257 E00045062 E02001800 71% 63 LLM 1% 0.254 0.597 0.568 0.361 0 0 0 0 0 0 0 0 63 16 38 36 23 16 38 36 23 FALSE 63 FALSE
539 16/00261/SHLAA Land to the west of Mulberry Way Private Coalfield Greenfield TRUE FALSE 1.58 90% net developable area =1.42haNo planning status Suitable Available Achievable 426 E00170221 E02001823 76% 35 LLL 0% 0.274 0.635 0.598 0.389 0 0 0 0 35 10 22 21 14 10 22 21 14 10 22 21 14 FALSE 35 FALSE
540 16/00262/SHLAA Hetton Downs Phase 3 Unknown Coalfield Mixed (G85 B15) FALSE FALSE 2.03 75% net developable area =1.52ha No planning status Suitable Available Achievable 652 E00170241 E02001825 62% 60 MLH 3% 0.218 0.528 0.513 0.311 0 0 0 0 60 13 32 31 19 13 32 31 19 13 32 31 19 FALSE 60 FALSE
562 16/00028/SHLAA Land to the east of Silksworth Lane, by Elstob Unknown Sunderland South Greenfield FALSE FALSE 4.10 75% net developable area =3.08haNo planning status Suitable Available Achievable 893 E00044699 E02001816 32% 93 MMH 4% 0.144 0.378 0.412 0.208 0 0 0 0 93 13 35 38 19 13 35 38 19 13 35 38 19 FALSE 93 FALSE
565 16/00176/SHLAA Phoneix Tower Business Park, Castletown Way Private Sunderland North PDL FALSE FALSE 3.98 75% net developable area = 2.99haOutline application (live)14/00292/OUTSuitable Available Achievable 665 E00044786 E02001795 51% 140 MMH 4% 0.187 0.466 0.468 0.267 55 10 26 26 15 85 26 65 65 37 26 65 65 37 26 65 65 37 FALSE 140 FALSE
567 George Washington County Hotel Golf Course (pitch & putt course), Stone Cellar Road, WashingtonWashington 3.60 749 E00045041 E02001797 64% MLM 3% 0.225 0.541 0.522 0.320 0 0 0 0 40 9 22 21 13 0 9 22 21 13 0 9 22 21 13 FALSE 40
595 16/00139/SHLAA Fell House, Albion Terrace, Springwell Private Washington PDL FALSE FALSE 0.21 100% net developable areaPermitted – not started 13/02569/FULSuitable Available Achievable 626 E00045043 E02001797 59% 28 MLM 3% 0.208 0.509 0.498 0.297 0 0 0 0 28 6 14 14 8 6 14 14 8 6 14 14 8 FALSE 28 FALSE
628 16/00299/SHLAA Former London Inn, Spout Lane Unknown Washington PDL FALSE FALSE 0.55 90 % net developable area = 0.50haPermitted – under construction14/01589/FULSuitable Available Achievable 617 E00044980 E02001799 46% 79 MLM 3% 0.177 0.447 0.458 0.254 79 14 35 36 20 14 35 36 20 14 35 36 20 14 35 36 20 FALSE 79 FALSE
629 16/00029/SHLAA Site of former Ford and Hylton Social Club, Poole Road Private Sunderland South PDL FALSE FALSE 0.29 100% net developable areaPermitted – not started 15/01944/S12Suitable Available Achievable 780 E00044752 E02001802 37% 14 MMM 4% 0.156 0.401 0.427 0.000 14 2 6 6 0 2 6 6 0 2 6 6 0 2 6 6 0 FALSE 14 TRUE
630 16/00284/SHLAA Land Adjac Saint Lukes Road Gentoo Sunderland South PDL FALSE FALSE 3.79 75% net developable area =2.84haPermitted - under construction13/02903/FULSuitable Available Achievable 889 E00170243 E02001802 56% 123 HHM 9% 0.187 0.463 0.457 0.000 123 23 57 56 0 23 57 56 0 23 57 56 0 23 57 56 0 FALSE 123 TRUE
631 16/00030/SHLAA West of Silksworth Way, Doxford Park Unknown Sunderland South Greenfield FALSE FALSE 4.10 75% net developable area =3.08haNo planning status Suitable Available Achievable 847 E00044725 E02001819 66% 92 MMH 4% 0.229 0.548 0.527 0.326 0 0 0 0 0 0 0 0 92 21 50 48 30 21 50 48 30 FALSE 92 FALSE
632 16/00140/SHLAA Rear of Don Gardens Unknown Washington Greenfield FALSE FALSE 2.76 75% net developable area =2.07haNo planning status Suitable Available Achievable 250 E00044962 E02001799 42% 62 MMM 4% 0.167 0.424 0.441 0.239 0 0 0 0 0 0 0 0 62 10 26 27 15 10 26 27 15 FALSE 62 FALSE
633 16/00141/SHLAA Bonemill Lane, Rickleton Unknown Washington Greenfield FALSE FALSE 0.75 90 % net developable area = 0.68haNo planning status Suitable Available Achievable 274 E00045035 E02001815 72% 20 MMH 4% 0.249 0.585 0.555 0.354 0 0 0 0 0 0 0 0 0 0 0 0 20 5 12 11 7 FALSE 20 FALSE
636 16/00031/SHLAA Open space at Fordfield Road, Pennywell/Ford Unknown Sunderland South Greenfield FALSE FALSE 0.80 90% net developable area = 0.72haNo planning status Suitable Available Achievable 780 E00044751 E02001802 40% 22 MMM 4% 0.162 0.415 0.435 0.233 0 0 0 0 0 0 0 0 22 4 9 10 5 4 9 10 5 FALSE 22 FALSE
637 16/00269/SHLAA Hetton Downs Square / East of Thomas St Gentoo Coalfield Greenfield FALSE FALSE 1.36 90% net developable area =1.22haNo planning status Suitable Available Achievable 429 E00044275 E02001825 54% 39 MLH 3% 0.195 0.484 0.482 0.279 0 0 0 0 0 0 0 0 39 8 19 19 11 8 19 19 11 FALSE 39 FALSE
646 Land at Glebe House Farm, Staithes Road, Washington, NE38 8NW Washington 2.20 615 E00170198 E02001807 73% LLH 1% 0.261 0.609 0.578 0.370 0 0 0 0 41 11 25 24 15 0 11 25 24 15 0 11 25 24 15 FALSE 41
650 16/00145/SHLAA Dame Margaret Field, Washington Council Washington Greenfield FALSE FALSE 1.98 90 % net developable area = 1.78haNo planning status Suitable Available Achievable 270 E00044900 E02001809 53% 53 MHH 5% 0.189 0.470 0.469 0.000 0 0 0 0 53 10 25 25 0 10 25 25 0 10 25 25 0 FALSE 53 TRUE
654 16/00274/SHLAA West of Redburn Road Private Coalfield Greenfield FALSE FALSE 1.44 90% net developable area =1.30haPermitted – not started 14/01804/OUTSuitable Available Achievable 627 E00044449 E02001823 73% 27 HLL 6% 0.248 0.579 0.548 0.352 27 7 16 15 9 7 16 15 9 7 16 15 9 7 16 15 9 FALSE 27 FALSE
655 16/00289/SHLAA Galen Building Unknown Sunderland Central PDL FALSE FALSE 0.21 100% net developable areaPermitted – under construction14/02729/FULSuitable Available Achievable 883 E00044195 E02001803 25% 128 HHH 10% 0.000 0.000 0.000 0.000 128 0 0 0 0 0 0 0 0 0 0 0 0 0 0 0 0 TRUE 128 FALSE
656 16/00290/SHLAA Cassaton House, Fawcett Street Sunderland Central PDL FALSE FALSE 0.19 100% net developable areaPermitted – under construction16/01640/VARSuitable Available Achievable 661 E00170234 E02001803 31% 105 HHH 10% 0.000 0.000 0.000 0.192 105 0 0 0 20 0 0 0 20 0 0 0 20 0 0 0 20 TRUE 105 FALSE
657 16/00291/SHLAA 15-17 John Street Unknown Sunderland Central PDL FALSE FALSE 0.10 100% net developable areaPermitted – under construction15/01265/FU4Suitable Available Achievable 661 E00170234 E02001803 31% 61 HHH 10% 0.000 0.000 0.000 0.192 61 0 0 0 12 0 0 0 12 0 0 0 12 0 0 0 12 TRUE 61 FALSE
658 16/00292/SHLAA Phoenix House, Union Street Unknown Sunderland Central PDL FALSE FALSE 0.07 100% net developable areaPermitted – under construction15/00357/FULSuitable Available Achievable 661 E00170234 E02001803 31% 38 HHH 10% 0.133 0.350 0.384 0.192 38 5 13 15 7 0 5 13 15 7 0 5 13 15 7 0 5 13 15 7 FALSE 38 FALSE
659 16/00093/SHLAA Sunniside Central Area, Villiers Street Council/HCA Sunderland Central PDL FALSE FALSE 1.21 90 % net developable area = 1.09haNo planning status Suitable Available Achievable 701 E00170202 E02001803 31% 33 HHH 10% 0.133 0.350 0.384 0.192 0 0 0 0 0 0 0 0 33 4 12 13 6 4 12 13 6 FALSE 33 FALSE
660 16/00094/SHLAA 63 Fawcett Street Unknown Sunderland Central PDL FALSE FALSE 0.02 100% net developable areaPermitted – not started 14/02357/FULSuitable Available Achievable 661 E00170234 E02001803 31% 7 HHH 10% 0.133 0.350 0.384 0.192 7 1 2 3 1 1 2 3 1 1 2 3 1 1 2 3 1 FALSE 7 FALSE
661 16/00095/SHLAA 12 Fawcett Street Unknown Sunderland Central PDL FALSE FALSE 0.02 100% net developable areaPermitted – not started 16/00357/FUL & 14/01962/FULSuitable Available Achievable 661 E00170234 E02001803 31% 5 HHH 10% 0.133 0.350 0.384 0.192 5 1 2 2 1 1 2 2 1 1 2 2 1 1 2 2 1 FALSE 5 FALSE
662 16/00096/SHLAA 18 John Street Unknown Sunderland Central PDL FALSE FALSE 0.02 100% net developable areaPermitted – under construction15/00041/FUL & 15/00040/FULSuitable Available Achievable 661 E00170234 E02001803 31% 10 HHH 10% 0.133 0.350 0.384 0.192 10 1 4 4 2 1 4 4 2 1 4 4 2 1 4 4 2 FALSE 10 FALSE
663 16/00035/SHLAA Former East Herrington Library, Farringdon Unknown Sunderland South PDL FALSE FALSE 0.11 100% net developable areaPermitted – under construction15/02298/FU4Suitable Available Achievable 890 E00044572 E02001819 63% 5 MMH 4% 0.219 0.529 0.512 0.312 5 1 3 3 2 1 3 3 2 1 3 3 2 1 3 3 2 FALSE 5 FALSE
664 16/00285/SHLAA North Moor Farm Cottages, Farringdon Unknown Sunderland South PDL FALSE FALSE 0.14 100% net developable areaPermitted – under construction Suitable Available Achievable 894 E00044559 E02001816 60% 6 HHH 10% 0.196 0.478 0.467 0.280 6 1 3 3 2 1 3 3 2 1 3 3 2 1 3 3 2 FALSE 6 FALSE
665 16/00098/SHLAA 255 High Street West Unknown Sunderland Central PDL FALSE FALSE 0.04 100% net developable areaPermitted – not started 15/00344/FULSuitable Available Achievable 884 E00044180 E02001803 30% 9 HHH 10% 0.131 0.346 0.381 0.189 9 1 3 3 2 1 3 3 2 1 3 3 2 1 3 3 2 FALSE 9 FALSE
671 Southern Area Playing Fields, Washington Washington 18.67 276 E00045038 E02001815 74% LLH 1% 0.264 0.616 0.582 0.375 0 0 0 0 170 45 105 99 64 32 53 124 118 76 0 53 124 118 76 FALSE 202
673 James Steel Park Washington 5.24 275 E00045026 E02001815 64% LLH 1% 0.229 0.552 0.533 0.327 0 0 0 0 0 0 0 0 0 32 7 18 17 10 0 7 18 17 10 FALSE 32
675 Land at Newcastle Road, Fulwell Sunderland North 4.75 773 E00044236 E02001791 65% HLM 6% 0.221 0.530 0.511 0.315 0 0 0 0 82 18 43 42 26 0 18 43 42 26 0 18 43 42 26 FALSE 82
676 land at East Herrington Sunderland South 7.06 840 E00044544 E02001819 72% HLH 6% 0.244 0.573 0.544 0.347 0 0 0 0 0 0 0 0 0 70 17 40 38 24 0 17 40 38 24 FALSE 70
677 Land at Birchwood, Ford Oval Council/GentooSunderland South Greenfield FALSE FALSE 1.89 75% net developable area = 1.41haNo planning status Suitable Available Achievable 799 E00044746 E02001804 60% 60 MMH 4% 0.209 0.510 0.498 0.298 0 0 0 0 60 13 31 30 18 13 31 30 18 13 31 30 18 FALSE 60 FALSE
154A 16/00154/SHLAA Seaburn Camp, Whitburn Road (North) University of Sunderland & CouncilSunderland North Greenfield FALSE FALSE 4.00 75% net developable area = 8.90haNo planning status Suitable Available Achievable 769 E00044301 E02001792 68% 140 MMH 4% 0.236 0.560 0.536 0.336 0 0 0 0 140 33 78 75 47 33 78 75 47 33 78 75 47 FALSE 140 FALSE
154B 16/00154/SHLAA Seaburn Camp, Whitburn Road (South) Council Sunderland North Greenfield FALSE FALSE 5.18 75% net developable area = 8.90haNo planning status Suitable Available Achievable 768 E00044286 E02001792 70% 78 MMH 4% 0.243 0.572 0.546 0.345 0 0 0 0 0 0 0 0 78 19 45 43 27 19 45 43 27 FALSE 78 FALSE
293A 16/00213/SHLAA Low Moorsley, land at (Ennerdale Street) Private Coalfield Mixed (G90 B10) FALSE FALSE 4.33 75% net developable area =24.75haOutline application (live)14/01371/OUTSuitable Available Achievable 628 E00044408 E02001826 52% 82 MLH 3% 0.191 0.475 0.476 0.273 30 6 14 14 8 52 16 39 39 22 16 39 39 22 16 39 39 22 FALSE 82 FALSE
330A 16/00217/SHLAA Philadelphia Complex Private and Part CouncilCoalfield Mixed (50/50) FALSE FALSE 27.36 75% net developable area =20.52haPermitted - not started 14/00538/HYBSuitable Available Achievable 629 E00044377 E02001806 42% 500 LLM 1% 0.172 0.437 0.455 0.247 60 10 26 27 15 150 36 92 96 52 150 62 157 164 89 60 72 184 191 104 FALSE 420 FALSE
330B Land at Philadelphia Complex / Philadelphia Lane, Houghton-le-Spring Coalfield WAS 8.32 629 E00044377 E02001806 42% MLL 3% 0.168 0.429 0.446 0.242 0 0 0 0 20 3 9 9 5 150 29 73 76 41 0 29 73 76 41 FALSE 170
407C Land to the north of Mount Lane, Springwell Village Washington WAS 3.21 252 E00045048 E02001800 68% LLM 1% 0.243 0.577 0.553 0.346 0 0 0 0 48 12 28 27 17 0 12 28 27 17 0 12 28 27 17 FALSE 48
426A 16/00077/SHLAA Willow Farm land to south, Ryhope (North) Private/Church CommissionerSunderland South Greenfield FALSE FALSE 18.51 75% net developable area =13.89haNo planning status Suitable Available Achievable 859 E00170235 E02001818 71% 500 LLH 1% 0.254 0.597 0.568 0.361 0 0 0 0 150 38 89 85 54 150 76 179 170 108 60 91 215 204 130 FALSE 360 FALSE
463A Land west of Waterloo Road, Usworth, Washington Washington WAS 10.93 608 E00044950 E02001797 66% HLM 6% 0.224 0.536 0.516 0.320 0 0 0 0 125 28 67 64 40 80 46 110 106 66 0 46 110 106 66 FALSE 205
464B Land to the North of the Graneries, Offerton, Sunderland Coalfield WAS 0.85 398 E00165667 E02001797 58% LLM 1% 0.208 0.513 0.504 0.298 0 0 0 0 10 2 5 5 3 0 2 5 5 3 0 2 5 5 3 FALSE 10
467A 16/00170/SHLAA Thornbeck College,land to the North East Council Sunderland North Greenfield FALSE FALSE 3.80 90% net developable area = 0.45haNo planning status Suitable Available Achievable 398 E00165667 E02001797 58% 60 LMH 2% 0.206 0.508 0.499 0.295 0 0 0 0 0 0 0 0 30 6 15 15 9 6 15 15 9 FALSE 30 FALSE
467B 16/00170/SHLAA Thornbeck College,land to the South Private (Austic Society)Sunderland North PDL FALSE FALSE 0.51 90% net developable area = 0.45haNo planning status Suitable Available Achievable 771 E00044214 E02001791 68% 14 HMH 8% 0.226 0.537 0.514 0.322 0 0 0 0 14 3 8 7 5 3 8 7 5 3 8 7 5 FALSE 14 FALSE
80C Stadium Village Site C Council Sunderland Central PDL FALSE FALSE 0.98 No planning status Suitable Available Achievable 710 E00170218 E02001796 42% 100 HHH 10% 0.156 0.398 0.414 0.224 0 0 0 0 100 16 40 41 22 16 40 41 22 16 40 41 22 FALSE 100 FALSE
Student
Accomodation
Planning_Ap
p_No
Conclusion
_On_Suitab
ility
Conclusio
n_On_Ava
ilability
Conclusion_
On_Achievab
ility
New
Saturn
Zones
Reduction
factor
PT/Walking/C
yclingMSOA
Site_are
a
SHLAA_R
ef_NoLocal_ref_1 Site_Name NotesOwnership
Monitoring Delivery
Sub Area
PDL_or_gre
enfield
Settlemen
t Break
Green_Be
lt?
Present_Planning_Stat
us
AM trips
Initial_LA_Yield_As
sessment
Deliverab
le_Withi
n_5_Year
s
AM rate PM rate
Extra Care/Sheltered Accom
(self contained units)Census Code Car%
PM tripsDeliver
able_W
ithin_1
1_to_1
5_Year
AM trips PM tripsDeliv
erabl
e yr
16 &
17
AM trips PM trips AM trips PM tripsDelivera
ble_Wit
hin_6_to
_10_Yea
rs
Total
houses 17
years
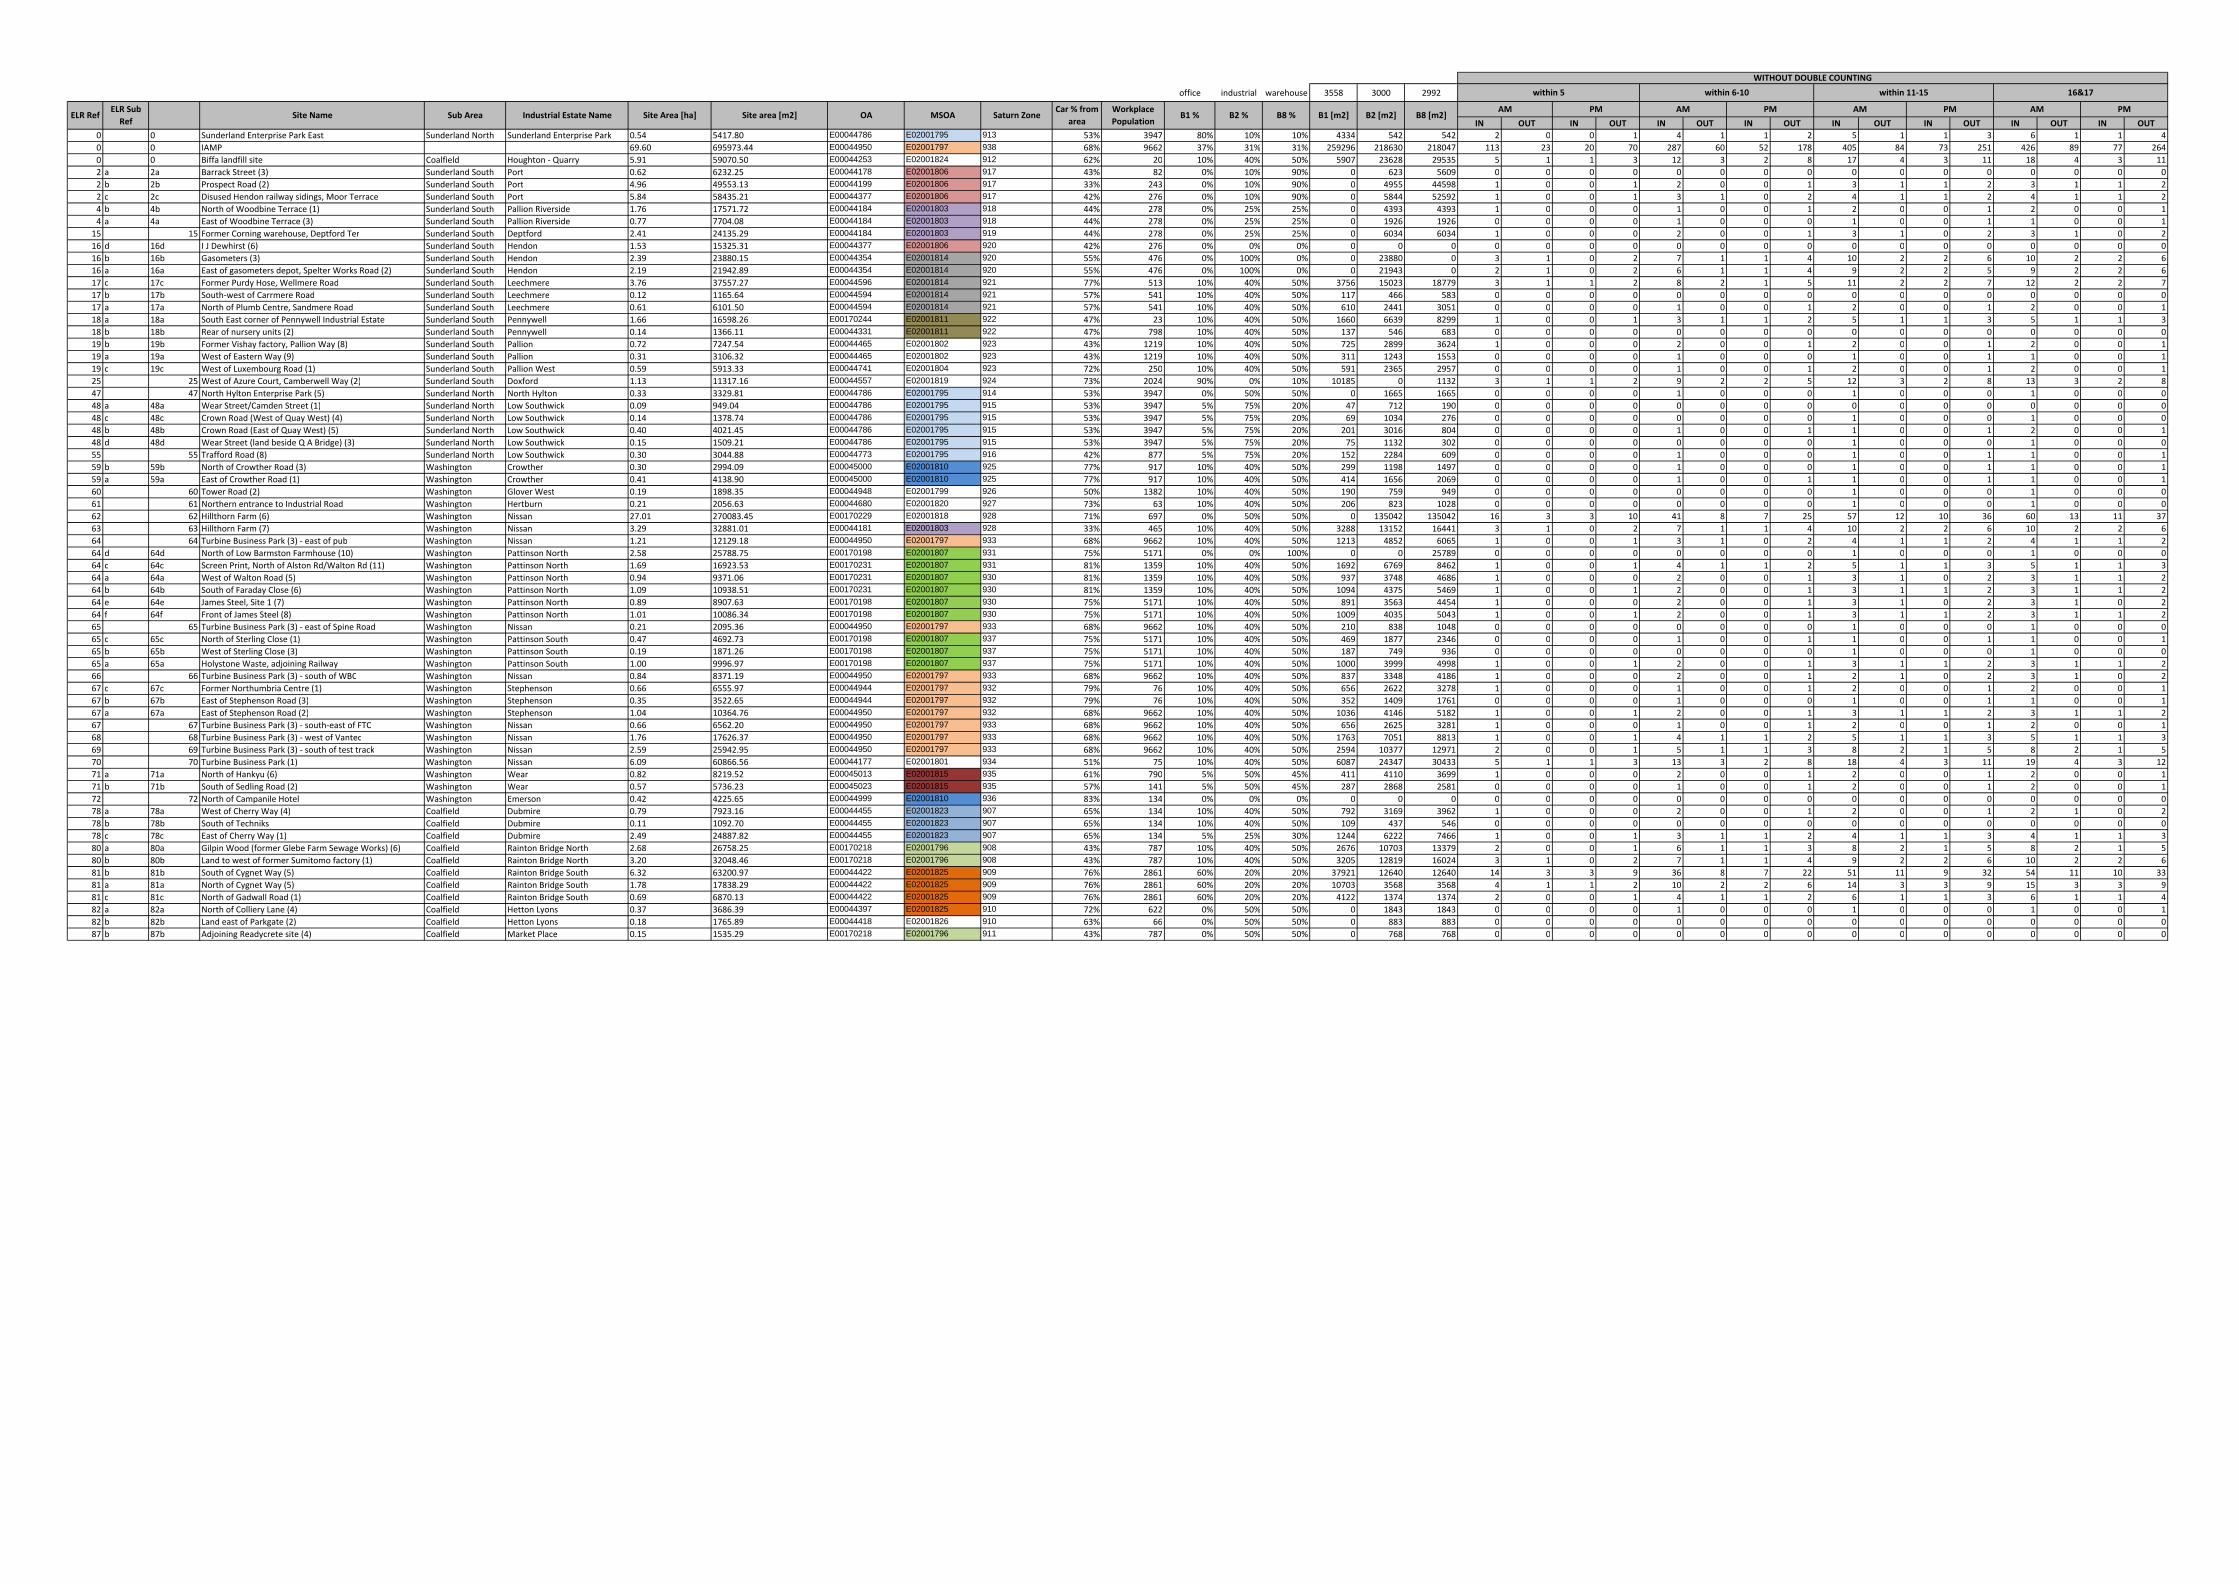
office industrial warehouse 3558 3000 2992
IN OUT IN OUT IN OUT IN OUT IN OUT IN OUT IN OUT IN OUT
0 0 Sunderland Enterprise Park East Sunderland North Sunderland Enterprise Park 0.54 5417.80 E00044786 E02001795 913 53% 3947 80% 10% 10% 4334 542 542 2 0 0 1 4 1 1 2 5 1 1 3 6 1 1 4
0 0 IAMP 69.60 695973.44 E00044950 E02001797 938 68% 9662 37% 31% 31% 259296 218630 218047 113 23 20 70 287 60 52 178 405 84 73 251 426 89 77 264
0 0 Biffa landfill site Coalfield Houghton - Quarry 5.91 59070.50 E00044253 E02001824 912 62% 20 10% 40% 50% 5907 23628 29535 5 1 1 3 12 3 2 8 17 4 3 11 18 4 3 11
2 a 2a Barrack Street (3) Sunderland South Port 0.62 6232.25 E00044178 E02001806 917 43% 82 0% 10% 90% 0 623 5609 0 0 0 0 0 0 0 0 0 0 0 0 0 0 0 0
2 b 2b Prospect Road (2) Sunderland South Port 4.96 49553.13 E00044199 E02001806 917 33% 243 0% 10% 90% 0 4955 44598 1 0 0 1 2 0 0 1 3 1 1 2 3 1 1 2
2 c 2c Disused Hendon railway sidings, Moor Terrace Sunderland South Port 5.84 58435.21 E00044377 E02001806 917 42% 276 0% 10% 90% 0 5844 52592 1 0 0 1 3 1 0 2 4 1 1 2 4 1 1 2
4 b 4b North of Woodbine Terrace (1) Sunderland South Pallion Riverside 1.76 17571.72 E00044184 E02001803 918 44% 278 0% 25% 25% 0 4393 4393 1 0 0 0 1 0 0 1 2 0 0 1 2 0 0 1
4 a 4a East of Woodbine Terrace (3) Sunderland South Pallion Riverside 0.77 7704.08 E00044184 E02001803 918 44% 278 0% 25% 25% 0 1926 1926 0 0 0 0 1 0 0 0 1 0 0 1 1 0 0 1
15 15 Former Corning warehouse, Deptford Ter Sunderland South Deptford 2.41 24135.29 E00044184 E02001803 919 44% 278 0% 25% 25% 0 6034 6034 1 0 0 0 2 0 0 1 3 1 0 2 3 1 0 2
16 d 16d I J Dewhirst (6) Sunderland South Hendon 1.53 15325.31 E00044377 E02001806 920 42% 276 0% 0% 0% 0 0 0 0 0 0 0 0 0 0 0 0 0 0 0 0 0 0 0
16 b 16b Gasometers (3) Sunderland South Hendon 2.39 23880.15 E00044354 E02001814 920 55% 476 0% 100% 0% 0 23880 0 3 1 0 2 7 1 1 4 10 2 2 6 10 2 2 6
16 a 16a East of gasometers depot, Spelter Works Road (2) Sunderland South Hendon 2.19 21942.89 E00044354 E02001814 920 55% 476 0% 100% 0% 0 21943 0 2 1 0 2 6 1 1 4 9 2 2 5 9 2 2 6
17 c 17c Former Purdy Hose, Wellmere Road Sunderland South Leechmere 3.76 37557.27 E00044596 E02001814 921 77% 513 10% 40% 50% 3756 15023 18779 3 1 1 2 8 2 1 5 11 2 2 7 12 2 2 7
17 b 17b South-west of Carrmere Road Sunderland South Leechmere 0.12 1165.64 E00044594 E02001814 921 57% 541 10% 40% 50% 117 466 583 0 0 0 0 0 0 0 0 0 0 0 0 0 0 0 0
17 a 17a North of Plumb Centre, Sandmere Road Sunderland South Leechmere 0.61 6101.50 E00044594 E02001814 921 57% 541 10% 40% 50% 610 2441 3051 0 0 0 0 1 0 0 1 2 0 0 1 2 0 0 1
18 a 18a South East corner of Pennywell Industrial Estate Sunderland South Pennywell 1.66 16598.26 E00170244 E02001811 922 47% 23 10% 40% 50% 1660 6639 8299 1 0 0 1 3 1 1 2 5 1 1 3 5 1 1 3
18 b 18b Rear of nursery units (2) Sunderland South Pennywell 0.14 1366.11 E00044331 E02001811 922 47% 798 10% 40% 50% 137 546 683 0 0 0 0 0 0 0 0 0 0 0 0 0 0 0 0
19 b 19b Former Vishay factory, Pallion Way (8) Sunderland South Pallion 0.72 7247.54 E00044465 E02001802 923 43% 1219 10% 40% 50% 725 2899 3624 1 0 0 0 2 0 0 1 2 0 0 1 2 0 0 1
19 a 19a West of Eastern Way (9) Sunderland South Pallion 0.31 3106.32 E00044465 E02001802 923 43% 1219 10% 40% 50% 311 1243 1553 0 0 0 0 1 0 0 0 1 0 0 1 1 0 0 1
19 c 19c West of Luxembourg Road (1) Sunderland South Pallion West 0.59 5913.33 E00044741 E02001804 923 72% 250 10% 40% 50% 591 2365 2957 0 0 0 0 1 0 0 1 2 0 0 1 2 0 0 1
25 25 West of Azure Court, Camberwell Way (2) Sunderland South Doxford 1.13 11317.16 E00044557 E02001819 924 73% 2024 90% 0% 10% 10185 0 1132 3 1 1 2 9 2 2 5 12 3 2 8 13 3 2 8
47 47 North Hylton Enterprise Park (5) Sunderland North North Hylton 0.33 3329.81 E00044786 E02001795 914 53% 3947 0% 50% 50% 0 1665 1665 0 0 0 0 1 0 0 0 1 0 0 0 1 0 0 0
48 a 48a Wear Street/Camden Street (1) Sunderland North Low Southwick 0.09 949.04 E00044786 E02001795 915 53% 3947 5% 75% 20% 47 712 190 0 0 0 0 0 0 0 0 0 0 0 0 0 0 0 0
48 c 48c Crown Road (West of Quay West) (4) Sunderland North Low Southwick 0.14 1378.74 E00044786 E02001795 915 53% 3947 5% 75% 20% 69 1034 276 0 0 0 0 0 0 0 0 1 0 0 0 1 0 0 0
48 b 48b Crown Road (East of Quay West) (5) Sunderland North Low Southwick 0.40 4021.45 E00044786 E02001795 915 53% 3947 5% 75% 20% 201 3016 804 0 0 0 0 1 0 0 1 1 0 0 1 2 0 0 1
48 d 48d Wear Street (land beside Q A Bridge) (3) Sunderland North Low Southwick 0.15 1509.21 E00044786 E02001795 915 53% 3947 5% 75% 20% 75 1132 302 0 0 0 0 0 0 0 0 1 0 0 0 1 0 0 0
55 55 Trafford Road (8) Sunderland North Low Southwick 0.30 3044.88 E00044773 E02001795 916 42% 877 5% 75% 20% 152 2284 609 0 0 0 0 1 0 0 0 1 0 0 1 1 0 0 1
59 b 59b North of Crowther Road (3) Washington Crowther 0.30 2994.09 E00045000 E02001810 925 77% 917 10% 40% 50% 299 1198 1497 0 0 0 0 1 0 0 0 1 0 0 1 1 0 0 1
59 a 59a East of Crowther Road (1) Washington Crowther 0.41 4138.90 E00045000 E02001810 925 77% 917 10% 40% 50% 414 1656 2069 0 0 0 0 1 0 0 1 1 0 0 1 1 0 0 1
60 60 Tower Road (2) Washington Glover West 0.19 1898.35 E00044948 E02001799 926 50% 1382 10% 40% 50% 190 759 949 0 0 0 0 0 0 0 0 1 0 0 0 1 0 0 0
61 61 Northern entrance to Industrial Road Washington Hertburn 0.21 2056.63 E00044680 E02001820 927 73% 63 10% 40% 50% 206 823 1028 0 0 0 0 0 0 0 0 1 0 0 0 1 0 0 0
62 62 Hillthorn Farm (6) Washington Nissan 27.01 270083.45 E00170229 E02001818 928 71% 697 0% 50% 50% 0 135042 135042 16 3 3 10 41 8 7 25 57 12 10 36 60 13 11 37
63 63 Hillthorn Farm (7) Washington Nissan 3.29 32881.01 E00044181 E02001803 928 33% 465 10% 40% 50% 3288 13152 16441 3 1 0 2 7 1 1 4 10 2 2 6 10 2 2 6
64 64 Turbine Business Park (3) - east of pub Washington Nissan 1.21 12129.18 E00044950 E02001797 933 68% 9662 10% 40% 50% 1213 4852 6065 1 0 0 1 3 1 0 2 4 1 1 2 4 1 1 2
64 d 64d North of Low Barmston Farmhouse (10) Washington Pattinson North 2.58 25788.75 E00170198 E02001807 931 75% 5171 0% 0% 100% 0 0 25789 0 0 0 0 0 0 0 0 1 0 0 0 1 0 0 0
64 c 64c Screen Print, North of Alston Rd/Walton Rd (11) Washington Pattinson North 1.69 16923.53 E00170231 E02001807 931 81% 1359 10% 40% 50% 1692 6769 8462 1 0 0 1 4 1 1 2 5 1 1 3 5 1 1 3
64 a 64a West of Walton Road (5) Washington Pattinson North 0.94 9371.06 E00170231 E02001807 930 81% 1359 10% 40% 50% 937 3748 4686 1 0 0 0 2 0 0 1 3 1 0 2 3 1 1 2
64 b 64b South of Faraday Close (6) Washington Pattinson North 1.09 10938.51 E00170231 E02001807 930 81% 1359 10% 40% 50% 1094 4375 5469 1 0 0 1 2 0 0 1 3 1 1 2 3 1 1 2
64 e 64e James Steel, Site 1 (7) Washington Pattinson North 0.89 8907.63 E00170198 E02001807 930 75% 5171 10% 40% 50% 891 3563 4454 1 0 0 0 2 0 0 1 3 1 0 2 3 1 0 2
64 f 64f Front of James Steel (8) Washington Pattinson North 1.01 10086.34 E00170198 E02001807 930 75% 5171 10% 40% 50% 1009 4035 5043 1 0 0 1 2 0 0 1 3 1 1 2 3 1 1 2
65 65 Turbine Business Park (3) - east of Spine Road Washington Nissan 0.21 2095.36 E00044950 E02001797 933 68% 9662 10% 40% 50% 210 838 1048 0 0 0 0 0 0 0 0 1 0 0 0 1 0 0 0
65 c 65c North of Sterling Close (1) Washington Pattinson South 0.47 4692.73 E00170198 E02001807 937 75% 5171 10% 40% 50% 469 1877 2346 0 0 0 0 1 0 0 1 1 0 0 1 1 0 0 1
65 b 65b West of Sterling Close (3) Washington Pattinson South 0.19 1871.26 E00170198 E02001807 937 75% 5171 10% 40% 50% 187 749 936 0 0 0 0 0 0 0 0 1 0 0 0 1 0 0 0
65 a 65a Holystone Waste, adjoining Railway Washington Pattinson South 1.00 9996.97 E00170198 E02001807 937 75% 5171 10% 40% 50% 1000 3999 4998 1 0 0 1 2 0 0 1 3 1 1 2 3 1 1 2
66 66 Turbine Business Park (3) - south of WBC Washington Nissan 0.84 8371.19 E00044950 E02001797 933 68% 9662 10% 40% 50% 837 3348 4186 1 0 0 0 2 0 0 1 2 1 0 2 3 1 0 2
67 c 67c Former Northumbria Centre (1) Washington Stephenson 0.66 6555.97 E00044944 E02001797 932 79% 76 10% 40% 50% 656 2622 3278 1 0 0 0 1 0 0 1 2 0 0 1 2 0 0 1
67 b 67b East of Stephenson Road (3) Washington Stephenson 0.35 3522.65 E00044944 E02001797 932 79% 76 10% 40% 50% 352 1409 1761 0 0 0 0 1 0 0 0 1 0 0 1 1 0 0 1
67 a 67a East of Stephenson Road (2) Washington Stephenson 1.04 10364.76 E00044950 E02001797 932 68% 9662 10% 40% 50% 1036 4146 5182 1 0 0 1 2 0 0 1 3 1 1 2 3 1 1 2
67 67 Turbine Business Park (3) - south-east of FTC Washington Nissan 0.66 6562.20 E00044950 E02001797 933 68% 9662 10% 40% 50% 656 2625 3281 1 0 0 0 1 0 0 1 2 0 0 1 2 0 0 1
68 68 Turbine Business Park (3) - west of Vantec Washington Nissan 1.76 17626.37 E00044950 E02001797 933 68% 9662 10% 40% 50% 1763 7051 8813 1 0 0 1 4 1 1 2 5 1 1 3 5 1 1 3
69 69 Turbine Business Park (3) - south of test track Washington Nissan 2.59 25942.95 E00044950 E02001797 933 68% 9662 10% 40% 50% 2594 10377 12971 2 0 0 1 5 1 1 3 8 2 1 5 8 2 1 5
70 70 Turbine Business Park (1) Washington Nissan 6.09 60866.56 E00044177 E02001801 934 51% 75 10% 40% 50% 6087 24347 30433 5 1 1 3 13 3 2 8 18 4 3 11 19 4 3 12
71 a 71a North of Hankyu (6) Washington Wear 0.82 8219.52 E00045013 E02001815 935 61% 790 5% 50% 45% 411 4110 3699 1 0 0 0 2 0 0 1 2 0 0 1 2 0 0 1
71 b 71b South of Sedling Road (2) Washington Wear 0.57 5736.23 E00045023 E02001815 935 57% 141 5% 50% 45% 287 2868 2581 0 0 0 0 1 0 0 1 2 0 0 1 2 0 0 1
72 72 North of Campanile Hotel Washington Emerson 0.42 4225.65 E00044999 E02001810 936 83% 134 0% 0% 0% 0 0 0 0 0 0 0 0 0 0 0 0 0 0 0 0 0 0 0
78 a 78a West of Cherry Way (4) Coalfield Dubmire 0.79 7923.16 E00044455 E02001823 907 65% 134 10% 40% 50% 792 3169 3962 1 0 0 0 2 0 0 1 2 0 0 1 2 1 0 2
78 b 78b South of Techniks Coalfield Dubmire 0.11 1092.70 E00044455 E02001823 907 65% 134 10% 40% 50% 109 437 546 0 0 0 0 0 0 0 0 0 0 0 0 0 0 0 0
78 c 78c East of Cherry Way (1) Coalfield Dubmire 2.49 24887.82 E00044455 E02001823 907 65% 134 5% 25% 30% 1244 6222 7466 1 0 0 1 3 1 1 2 4 1 1 3 4 1 1 3
80 a 80a Gilpin Wood (former Glebe Farm Sewage Works) (6) Coalfield Rainton Bridge North 2.68 26758.25 E00170218 E02001796 908 43% 787 10% 40% 50% 2676 10703 13379 2 0 0 1 6 1 1 3 8 2 1 5 8 2 1 5
80 b 80b Land to west of former Sumitomo factory (1) Coalfield Rainton Bridge North 3.20 32048.46 E00170218 E02001796 908 43% 787 10% 40% 50% 3205 12819 16024 3 1 0 2 7 1 1 4 9 2 2 6 10 2 2 6
81 b 81b South of Cygnet Way (5) Coalfield Rainton Bridge South 6.32 63200.97 E00044422 E02001825 909 76% 2861 60% 20% 20% 37921 12640 12640 14 3 3 9 36 8 7 22 51 11 9 32 54 11 10 33
81 a 81a North of Cygnet Way (5) Coalfield Rainton Bridge South 1.78 17838.29 E00044422 E02001825 909 76% 2861 60% 20% 20% 10703 3568 3568 4 1 1 2 10 2 2 6 14 3 3 9 15 3 3 9
81 c 81c North of Gadwall Road (1) Coalfield Rainton Bridge South 0.69 6870.13 E00044422 E02001825 909 76% 2861 60% 20% 20% 4122 1374 1374 2 0 0 1 4 1 1 2 6 1 1 3 6 1 1 4
82 a 82a North of Colliery Lane (4) Coalfield Hetton Lyons 0.37 3686.39 E00044397 E02001825 910 72% 622 0% 50% 50% 0 1843 1843 0 0 0 0 1 0 0 0 1 0 0 0 1 0 0 1
82 b 82b Land east of Parkgate (2) Coalfield Hetton Lyons 0.18 1765.89 E00044418 E02001826 910 63% 66 0% 50% 50% 0 883 883 0 0 0 0 0 0 0 0 0 0 0 0 0 0 0 0
87 b 87b Adjoining Readycrete site (4) Coalfield Market Place 0.15 1535.29 E00170218 E02001796 911 43% 787 0% 50% 50% 0 768 768 0 0 0 0 0 0 0 0 0 0 0 0 0 0 0 0
AM PMAM PM AM PM AM PMSub Area B1 [m2] B2 [m2]
Workplace
PopulationB1 % B2 % B8 % B8 [m2]Industrial Estate Name Site Area [ha] Site area [m2] OA Saturn Zone
Car % from
areaELR Ref
ELR Sub
RefSite Name MSOA
within 11-15 16&17within 5 within 6-10
WITHOUT DOUBLE COUNTING

Commercial in Confidence
Appendix D Census Mode Share Devised Vehicular Trip Rates
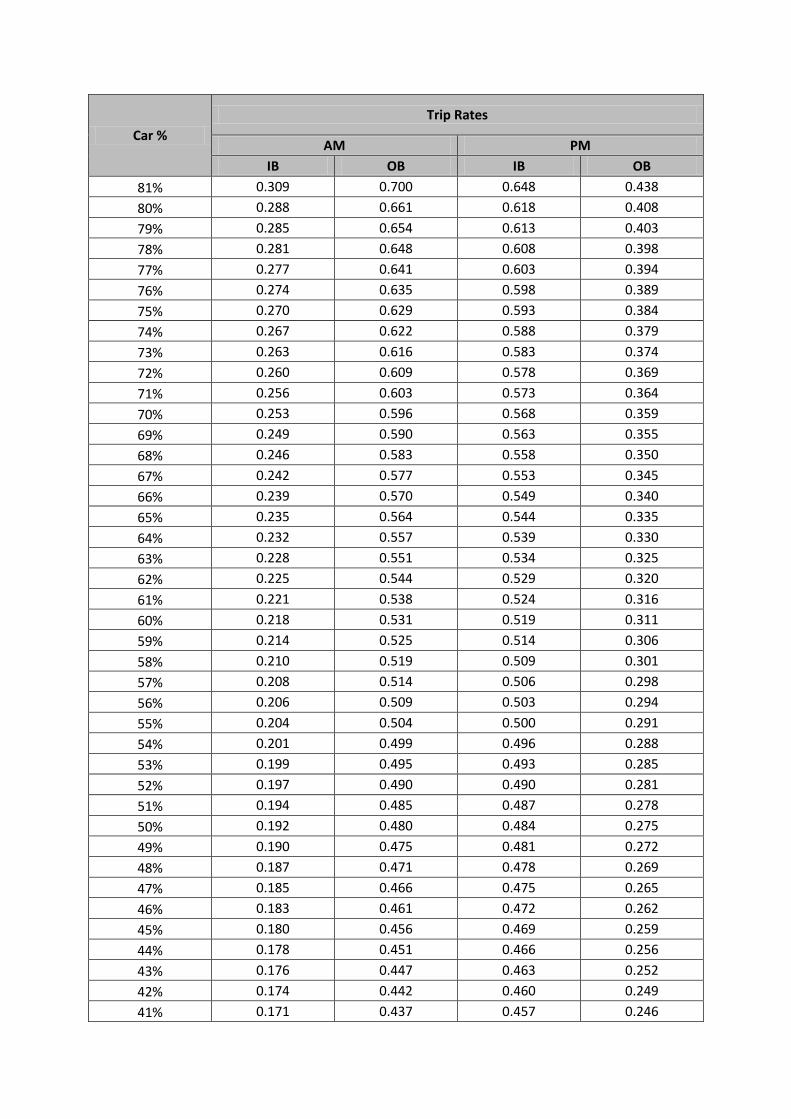
Car %
Trip Rates
AM PM
IB OB IB OB
81% 0.309 0.700 0.648 0.438
80% 0.288 0.661 0.618 0.408
79% 0.285 0.654 0.613 0.403
78% 0.281 0.648 0.608 0.398
77% 0.277 0.641 0.603 0.394
76% 0.274 0.635 0.598 0.389
75% 0.270 0.629 0.593 0.384
74% 0.267 0.622 0.588 0.379
73% 0.263 0.616 0.583 0.374
72% 0.260 0.609 0.578 0.369
71% 0.256 0.603 0.573 0.364
70% 0.253 0.596 0.568 0.359
69% 0.249 0.590 0.563 0.355
68% 0.246 0.583 0.558 0.350
67% 0.242 0.577 0.553 0.345
66% 0.239 0.570 0.549 0.340
65% 0.235 0.564 0.544 0.335
64% 0.232 0.557 0.539 0.330
63% 0.228 0.551 0.534 0.325
62% 0.225 0.544 0.529 0.320
61% 0.221 0.538 0.524 0.316
60% 0.218 0.531 0.519 0.311
59% 0.214 0.525 0.514 0.306
58% 0.210 0.519 0.509 0.301
57% 0.208 0.514 0.506 0.298
56% 0.206 0.509 0.503 0.294
55% 0.204 0.504 0.500 0.291
54% 0.201 0.499 0.496 0.288
53% 0.199 0.495 0.493 0.285
52% 0.197 0.490 0.490 0.281
51% 0.194 0.485 0.487 0.278
50% 0.192 0.480 0.484 0.275
49% 0.190 0.475 0.481 0.272
48% 0.187 0.471 0.478 0.269
47% 0.185 0.466 0.475 0.265
46% 0.183 0.461 0.472 0.262
45% 0.180 0.456 0.469 0.259
44% 0.178 0.451 0.466 0.256
43% 0.176 0.447 0.463 0.252
42% 0.174 0.442 0.460 0.249
41% 0.171 0.437 0.457 0.246
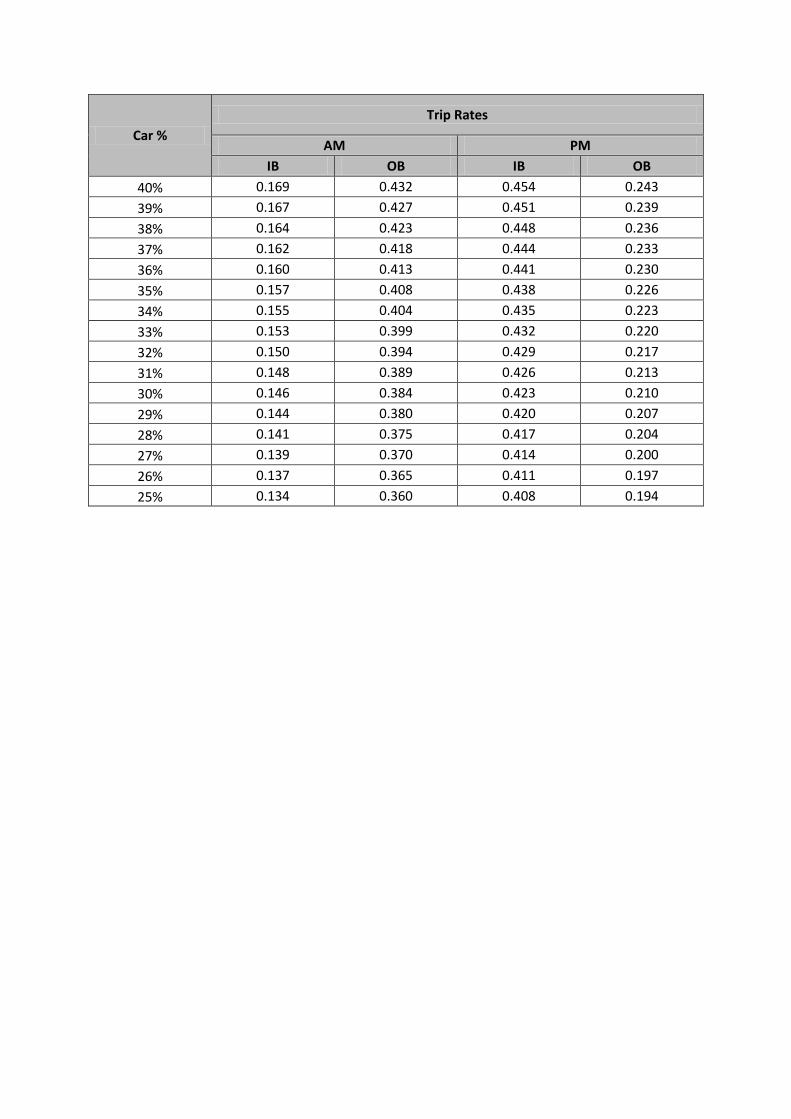
Car %
Trip Rates
AM PM
IB OB IB OB
40% 0.169 0.432 0.454 0.243
39% 0.167 0.427 0.451 0.239
38% 0.164 0.423 0.448 0.236
37% 0.162 0.418 0.444 0.233
36% 0.160 0.413 0.441 0.230
35% 0.157 0.408 0.438 0.226
34% 0.155 0.404 0.435 0.223
33% 0.153 0.399 0.432 0.220
32% 0.150 0.394 0.429 0.217
31% 0.148 0.389 0.426 0.213
30% 0.146 0.384 0.423 0.210
29% 0.144 0.380 0.420 0.207
28% 0.141 0.375 0.417 0.204
27% 0.139 0.370 0.414 0.200
26% 0.137 0.365 0.411 0.197
25% 0.134 0.360 0.408 0.194
Commercial in Confidence
Appendix E RFC SATURN Modelling Results for all of the Local Plan Delivery Phases

Ratio of flow to capacity
<0.850.86 - 0.900.91 - 1.00> 1.00
Key
Base 2015 AM

Ratio of flow to capacity
<0.850.86 - 0.900.91 - 1.00> 1.00
Key
Base 2015 PM

Ratio of flow to capacity
<0.850.86 - 0.900.91 - 1.00> 1.00
Key
Phase 0 AM
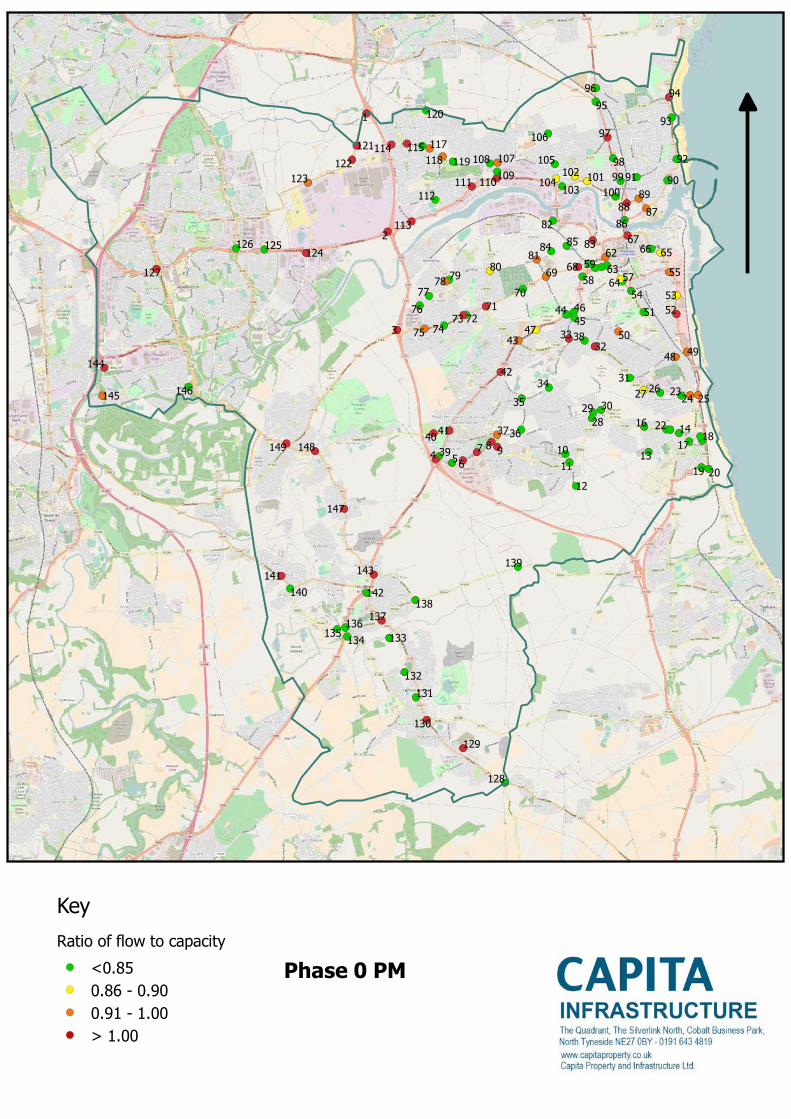
Ratio of flow to capacity
<0.850.86 - 0.900.91 - 1.00> 1.00
Key
Phase 0 PM
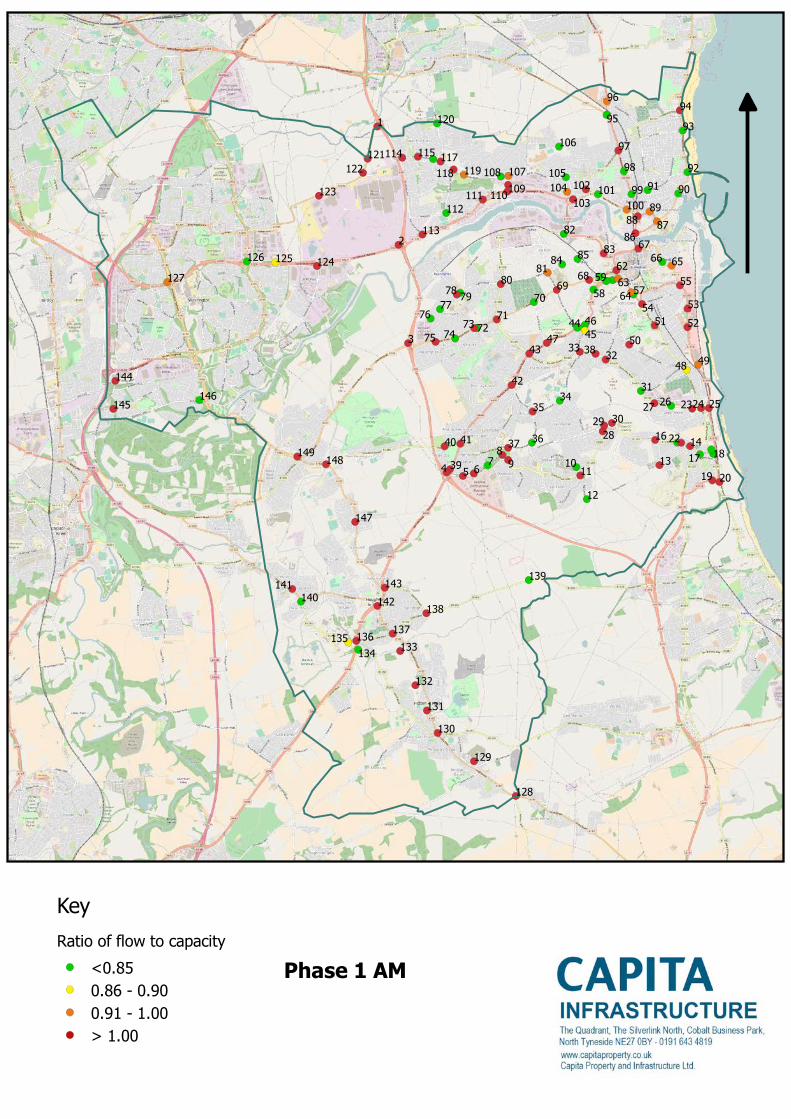
Ratio of flow to capacity
<0.850.86 - 0.900.91 - 1.00> 1.00
Key
Phase 1 AM
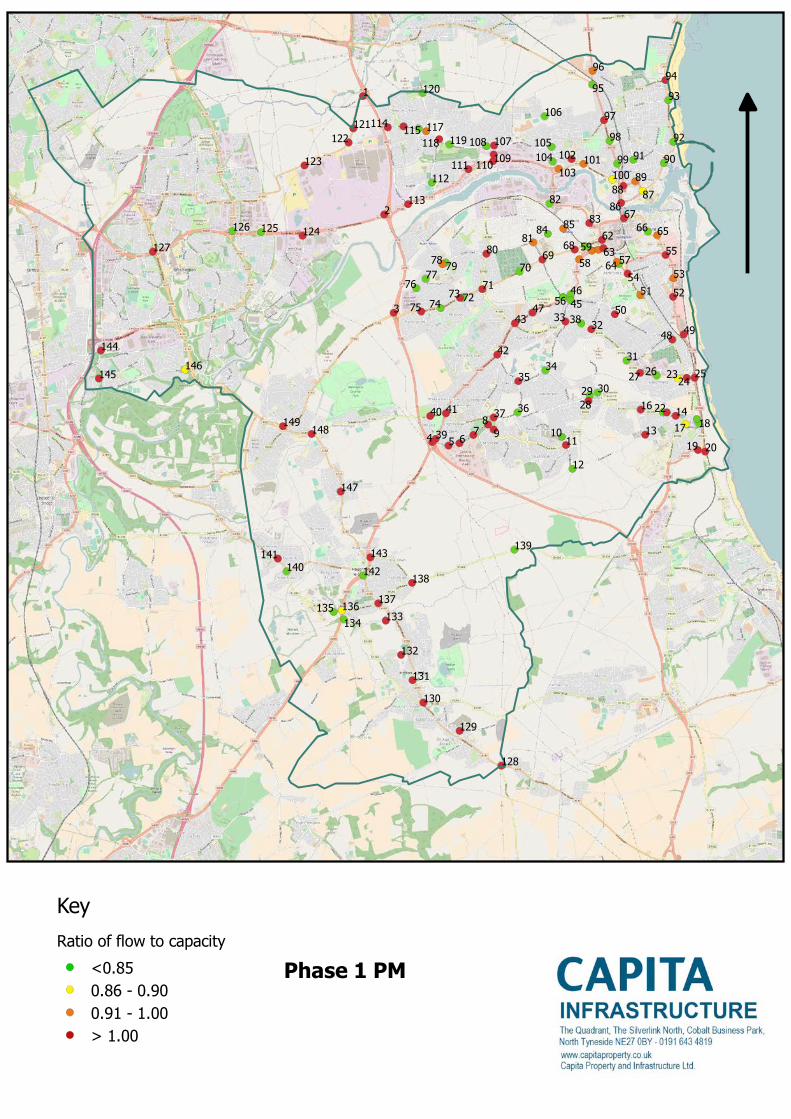
Ratio of flow to capacity
<0.850.86 - 0.900.91 - 1.00> 1.00
Key
Phase 1 PM
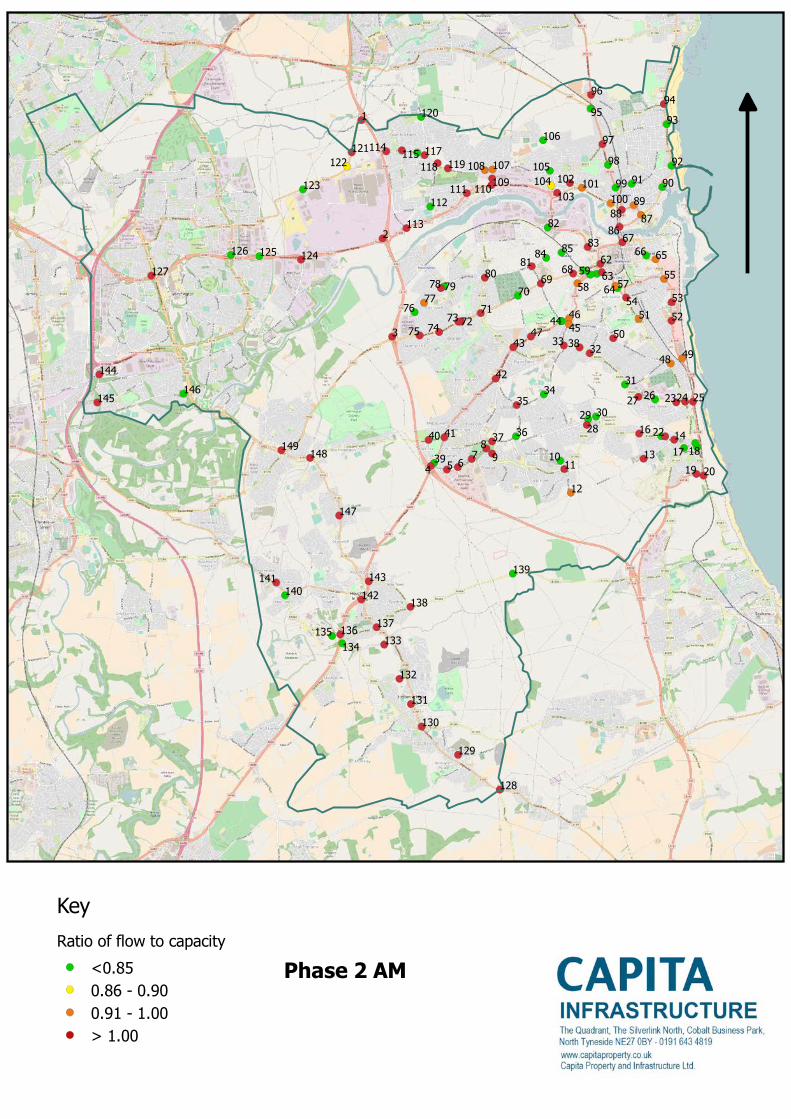
Ratio of flow to capacity
<0.850.86 - 0.900.91 - 1.00> 1.00
Key
Phase 2 AM
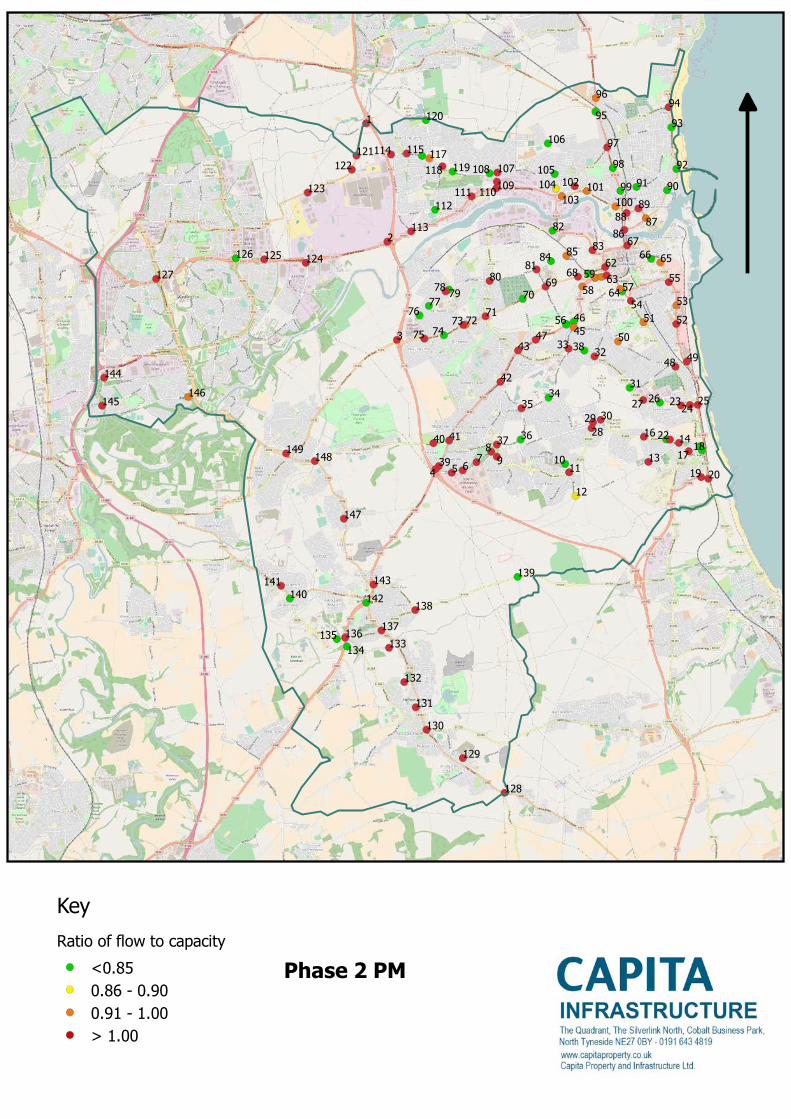
Ratio of flow to capacity
<0.850.86 - 0.900.91 - 1.00> 1.00
Key
Phase 2 PM

Ratio of flow to capacity
<0.850.86 - 0.900.91 - 1.00> 1.00
Key
Phase 3 AM

Ratio of flow to capacity
<0.850.86 - 0.900.91 - 1.00> 1.00
Key
Phase 3 PM

Commercial in Confidence
Appendix F Modelled Network Junction Reference Numbers

JUNCTION REFERENCE NUMBERS

Commercial in Confidence
Appendix G NECA Pipeline Highway Schemes
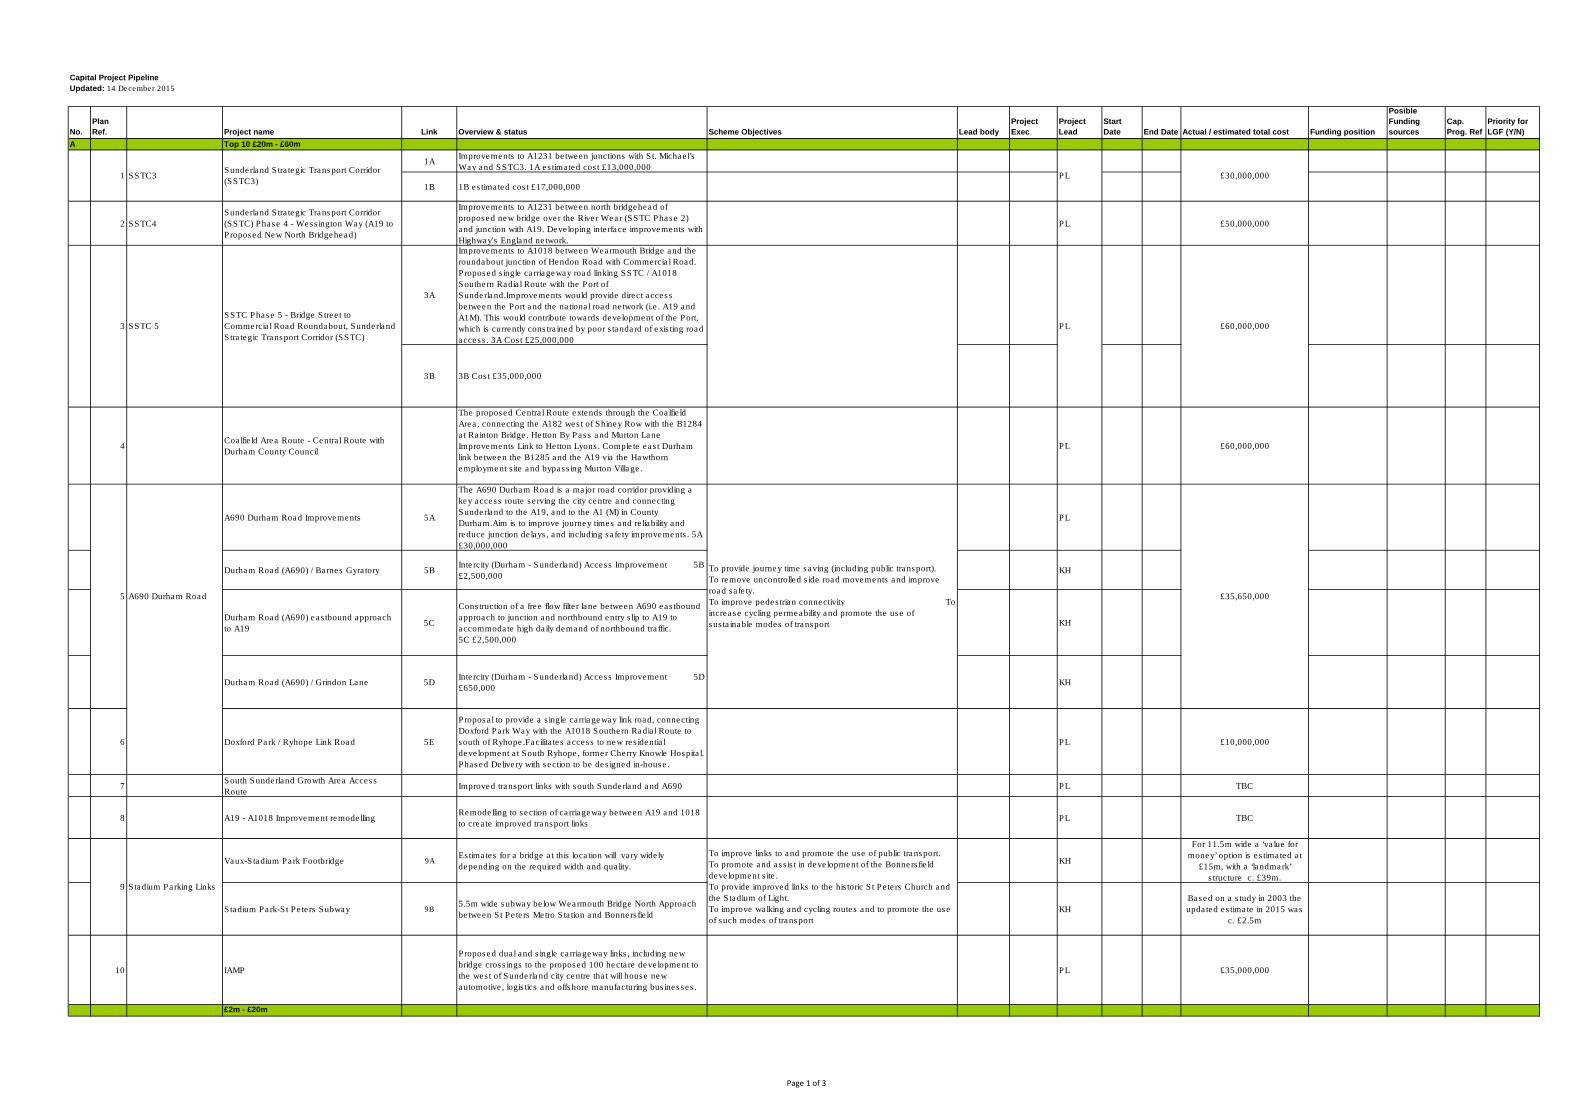
Capital Project Pipeline
Updated: 14 December 2015
No.
Plan
Ref. Project name Link Overview & status Scheme Objectives Lead body
Project
Exec
Project
Lead
Start
Date End Date Actual / estimated total cost Funding position
Posible
Funding
sources
Cap.
Prog. Ref
Priority for
LGF (Y/N)
A Top 10 £20m - £60m
1AImprovements to A1231 between junctions with St. Michael’s
Way and SSTC3. 1A estimated cost £13,000,000
1B 1B estimated cost £17,000,000
2 SSTC4
Sunderland Strategic Transport Corridor
(SSTC) Phase 4 - Wessington Way (A19 to
Proposed New North Bridgehead)
Improvements to A1231 between north bridgehead of
proposed new bridge over the River Wear (SSTC Phase 2)
and junction with A19. Developing interface improvements with
Highway's England network.
PL £50,000,000
3A
Improvements to A1018 between Wearmouth Bridge and the
roundabout junction of Hendon Road with Commercial Road.
Proposed single carriageway road linking SSTC / A1018
Southern Radial Route with the Port of
Sunderland.Improvements would provide direct access
between the Port and the national road network (i.e. A19 and
A1M). This would contribute towards development of the Port,
which is currently constrained by poor standard of existing road
access. 3A Cost £25,000,000
3B 3B Cost £35,000,000
4Coalfield Area Route - Central Route with
Durham County Council
The proposed Central Route extends through the Coalfield
Area, connecting the A182 west of Shiney Row with the B1284
at Rainton Bridge. Hetton By Pass and Murton Lane
Improvements Link to Hetton Lyons. Complete east Durham
link between the B1285 and the A19 via the Hawthorn
employment site and bypassing Murton Village.
PL £60,000,000
A690 Durham Road Improvements 5A
The A690 Durham Road is a major road corridor providing a
key access route serving the city centre and connecting
Sunderland to the A19, and to the A1 (M) in County
Durham.Aim is to improve journey times and reliability and
reduce junction delays, and including safety improvements. 5A
£30,000,000
PL
Durham Road (A690) / Barnes Gyratory 5BIntercity (Durham - Sunderland) Access Improvement 5B
£2,500,000KH
Durham Road (A690) eastbound approach
to A195C
Construction of a free flow filter lane between A690 eastbound
approach to junction and northbound entry slip to A19 to
accommodate high daily demand of northbound traffic.
5C £2,500,000
KH
Durham Road (A690) / Grindon Lane 5DIntercity (Durham - Sunderland) Access Improvement 5D
£650,000KH
6 Doxford Park / Ryhope Link Road 5E
Proposal to provide a single carriageway link road, connecting
Doxford Park Way with the A1018 Southern Radial Route to
south of Ryhope.Facilitates access to new residential
development at South Ryhope, former Cherry Knowle Hospital.
Phased Delivery with section to be designed in-house.
PL £10,000,000
7South Sunderland Growth Area Access
Route Improved transport links with south Sunderland and A690 PL TBC
8 A19 - A1018 Improvement remodelling Remodelling to section of carriageway between A19 and 1018
to create improved transport links PL TBC
Vaux-Stadium Park Footbridge 9AEstimates for a bridge at this location will vary widely
depending on the required width and quality.KH
For 11.5m wide a ‘value for
money’ option is estimated at
£15m, with a ‘landmark’
structure c. £39m.
Stadium Park-St Peters Subway 9B5.5m wide subway below Wearmouth Bridge North Approach
between St Peters Metro Station and BonnersfieldKH
Based on a study in 2003 the
updated estimate in 2015 was
c. £2.5m
10 IAMP
Proposed dual and single carriageway links, including new
bridge crossings to the proposed 100 hectare development to
the west of Sunderland city centre that will house new
automotive, logistics and offshore manufacturing businesses.
PL £35,000,000
£2m - £20m
£35,650,000
To improve links to and promote the use of public transport.
To promote and assist in development of the Bonnersfield
development site.
To provide improved links to the historic St Peters Church and
the Stadium of Light.
To improve walking and cycling routes and to promote the use
of such modes of transport
Sunderland Strategic Transport Corridor
(SSTC3) 1
Stadium Parking Links
To provide journey time saving (including public transport).
To remove uncontrolled side road movements and improve
road safety.
To improve pedestrian connectivity To
increase cycling permeability and promote the use of
sustainable modes of transport
£60,000,000PL
SSTC3 £30,000,000PL
SSTC Phase 5 - Bridge Street to
Commercial Road Roundabout, Sunderland
Strategic Transport Corridor (SSTC)
3
5
SSTC 5
A690 Durham Road
9
Page 1 of 3

11Traffic Signals - Upgrading of existing traffic
signals city wide
The signals asset is ageing and around 50% of the 155 signal
installations are close to, or beyond, design life.
This means that not only is the physical state of the equipment
generally poor; but also the technology is aged.
The asset is fulfilling its basic requirement of regulating traffic
flows, but is doing so in a basic/unintelligent/isolated manner
With modern, intelligent, networked equipment and design,
there would be substantial gains in efficiency for highway users
by reduction of delays/stopping/speed alterations.
Additionally, modern LED aspects use substantially less
energy, leading to reduced revenue costs as well as
measurable carbon savings.
GC£7,500,000: Circa £1.5m per
annum over 5 years
Chester Road Bus Corridor (A183) A183 /
A182 (Shiney Row) Junction12A
Journey time saving and removal of congestion pinch point.
Link 1 £5,000,000KH
12B
Signalisation of junctions and construction of direct access to
land to the north inorder to facilitate regenaration of the
Pennywell housing area. Link 2 £3,000,000
12C
Signalisation of existing junction and improvement to mainline
approaches to reduce congestion and delay. Link 3
£1,300,000
Chester Road Bus Corridor (A183) Royalty
Junction and Springwell Road Junction 12D
Journey time saving & congestion relief.
Link 4 £2,000,000KH
13 North Bridge StreetCreation City Centre Gateway and conversion of North Bridge
Street and Dame Dorothy Street to two-way traffic flow.
To create a gateway to the City in order to promote economic
development.
To provide journey time saving.
To reduce congestion.
To improve links between the City centre and the coastal areas
of Roker, Seaburn and Whitburn.
To improve pedestrian connectivity
KH £4,000,000
14(B1286) Doxford International Technology
Park Access
Dualling of route and removal of Congestion Pinch point at
entry to City Way (Economic regeneration)KH £4,000,000
Investment Corridors Phase 215A
Environmental improvements providing strategic link between
Sunderland University and City Centre. Link 1
£2,000,000
KH
Park Lane Interchange entrance from
Stockton Road 15B
Improves public transport links through journey time saving and
provides congestion relief in City centre (Holmeside). Link 2
£1,500,000
KH
St Michael’s Way / Durham Road junction 15CJourney time saving and removal of congestion pinch point.
Link 3 1,300,000KH
15DProvides link to SSTC from City centre (High Street West).
Link 5 £1,000,000KH
15ERemoval of Congestion Pinch point. Link 6 £700,000 KH
16 Four Lane Ends Junction Journey time saving and removal of congestion pinch point. KH £2,000,000
17Park Lane Interchange entrance from
Stockton Road
Improves public transport links through journey time saving and
provides congestion relief in City centre (Holmeside).KH £1,500,000
18 Leechmere Road / Toll Bar Road Junction Journey time saving. KH £1,500,000
19(A1231) Queen Alexandra Bridge / Camden
Street GyratoryMajor Event Management Project
To provide journey time saving.
To improve access to / from the Stadium.
To allow the efficient management of traffic to / from A19 Trunk
Road following Major Events or in an Emergency scenario.
KH £1,000,000
? 20Houghton Road (A182) / Coaley Lane
JunctionRemoval of Congestion Pinch point and Collision Mitigation KH £1,000,000
21 Hetton Road (A182) / Gillas Lane Junction Removal of Congestion Pinch point and Collision Mitigation KH £800,000
22 Hetton Downs Access RoadNew Link Road to assist delivery of the Hetton Downs Action
Plan. Scheme to be designed in-houseKH/PL £750,000
24 Strategic Cycle Network Development.
Sunderland has a strong transport policy (LTP, DfT) imperative
and political support for the continued development of a
strategic cycle network across the city. The five Regeneration
Area Committees/Place Boards have formally supported and
endorsed the initiative.
- The project will be embedded in and strongly support the
integrated development of transport for Sunderland, and will be
linked to a regional cycle network in accordance with LTP3
policy.
The project will support economic regeneration by linking
residential and employment areas, broadening the labour
market available to employers.
The project will support modal shift for short-medium length
journeys, thus supporting congestion reduction and improved
air quality.
The project will support equitable access to work by targeting
areas with low car ownership and higher indices of multiple
deprivation.
The project will run in tandem with health initiatives by targeting
areas with a higher imperative for increased physical activity to
reduce the health effects of inactivity
GC TBC
25 Camden St Gyratory Resurfacing of the Camden St Gyratory and signals/cycling
works to be carried out
To provide journey time saving.
To improve access to / from the Stadium.
To allow the efficient management of traffic to / from A19 Trunk
Road following Major Events or in an Emergency scenario.
GC TBC
25 IAMP Phase 2 Transport Infrastructure
Proposed dualing of A1290 link to A195, including new bridge
crossing over the Leamside Line to the proposed 100 hectare
development to the west of the A19 that will house new
automotive, logistics and offshore manufacturing businesses.
26
Penshaw / Philadelphia / Sedgewick Link
Road
Open area to residential development and Improve safety on
the A18 TBC
27 Central Station Nexus
Strategic Studies
£11.300,000
£6,500,000
To provide journey time saving (including public transport).
To improve junctions at A183 and A690.
To improve pedestrian links.
To provide a gateway to the University and the City.
KH
Up to £1-5m
Chester Road Bus Corridor (A183) Grindon
Mill and Springwell Road Junction Chester Road
City Centre
To provide journey time saving.
To improve access to / from the City Centre and promote
Economic Development.
To provide journey time saving and congestion relief.
To improve road safety and reduce delay for pedestrians
crossing movements;
12
15
Link Road through police station onto St
Mary’s Way St
Michael’s Way / High Street West junction
Page 2 of 3
28 Durham Coast / Picton Line Rail Study TBC29 A19 Junction Study TBC
Page 3 of 3

Commercial in Confidence
Appendix H Existing Bus Services & Connections

Residential SitesEmployment SitesBus RoutesmetroSunderland Boundary
KeyBus Routes in Sunderland

Commercial in Confidence
Appendix I Public Transport Accessibility Ranking Results

PT Accessibility
HighMediumLowBus RoutesSunderland Boundary
Key
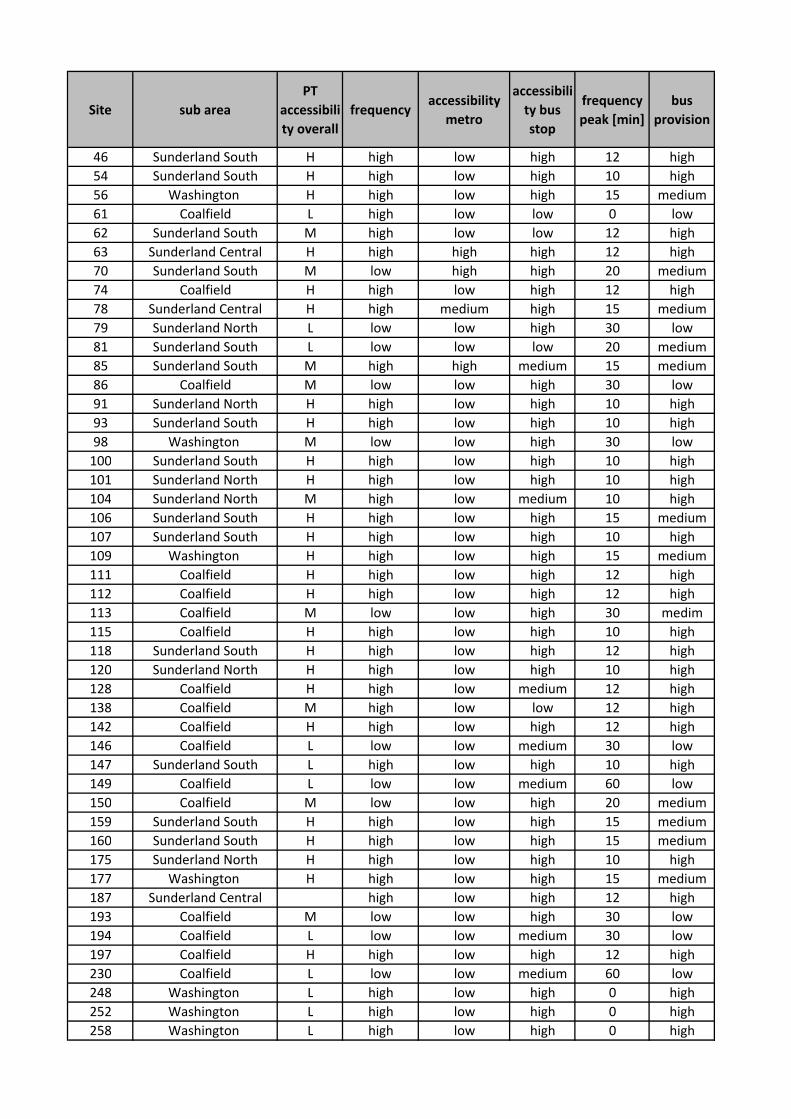
Site sub area
PT
accessibili
ty overall
frequencyaccessibility
metro
accessibili
ty bus
stop
frequency
peak [min]
bus
provision
46 Sunderland South H high low high 12 high
54 Sunderland South H high low high 10 high
56 Washington H high low high 15 medium
61 Coalfield L high low low 0 low
62 Sunderland South M high low low 12 high
63 Sunderland Central H high high high 12 high
70 Sunderland South M low high high 20 medium
74 Coalfield H high low high 12 high
78 Sunderland Central H high medium high 15 medium
79 Sunderland North L low low high 30 low
81 Sunderland South L low low low 20 medium
85 Sunderland South M high high medium 15 medium
86 Coalfield M low low high 30 low
91 Sunderland North H high low high 10 high
93 Sunderland South H high low high 10 high
98 Washington M low low high 30 low
100 Sunderland South H high low high 10 high
101 Sunderland North H high low high 10 high
104 Sunderland North M high low medium 10 high
106 Sunderland South H high low high 15 medium
107 Sunderland South H high low high 10 high
109 Washington H high low high 15 medium
111 Coalfield H high low high 12 high
112 Coalfield H high low high 12 high
113 Coalfield M low low high 30 medim
115 Coalfield H high low high 10 high
118 Sunderland South H high low high 12 high
120 Sunderland North H high low high 10 high
128 Coalfield H high low medium 12 high
138 Coalfield M high low low 12 high
142 Coalfield H high low high 12 high
146 Coalfield L low low medium 30 low
147 Sunderland South L high low high 10 high
149 Coalfield L low low medium 60 low
150 Coalfield M low low high 20 medium
159 Sunderland South H high low high 15 medium
160 Sunderland South H high low high 15 medium
175 Sunderland North H high low high 10 high
177 Washington H high low high 15 medium
187 Sunderland Central high low high 12 high
193 Coalfield M low low high 30 low
194 Coalfield L low low medium 30 low
197 Coalfield H high low high 12 high
230 Coalfield L low low medium 60 low
248 Washington L high low high 0 high
252 Washington L high low high 0 high
258 Washington L high low high 0 high
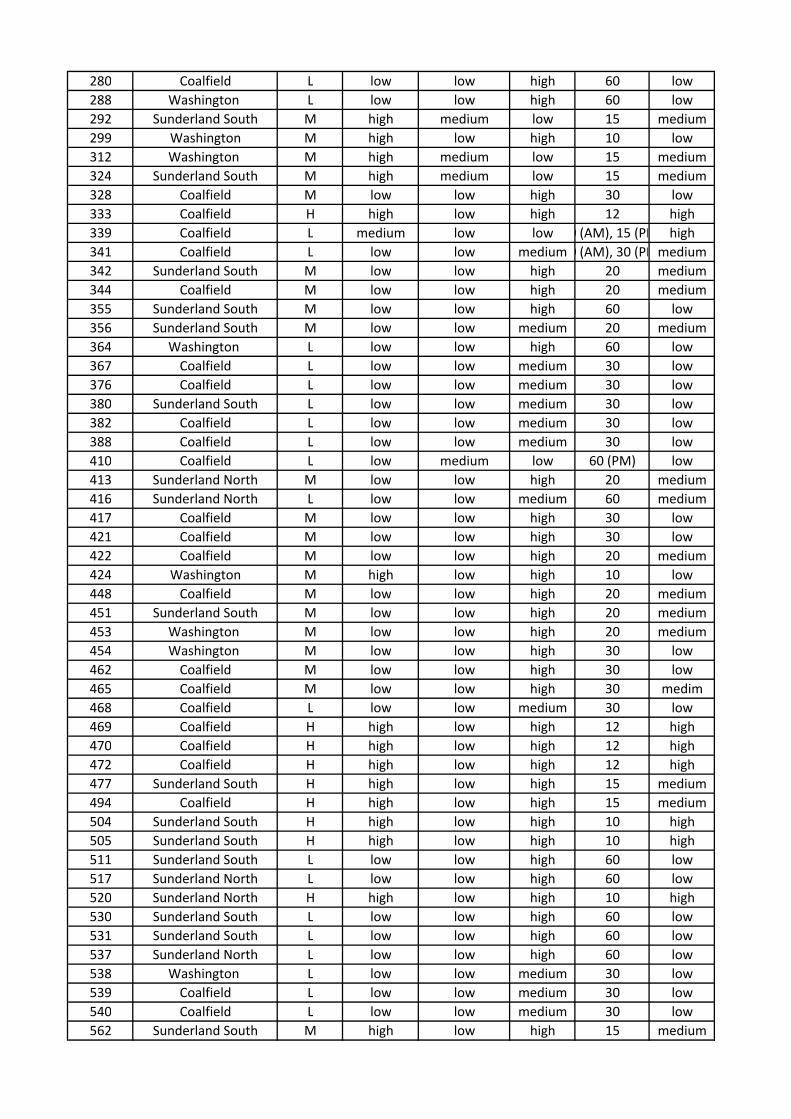
280 Coalfield L low low high 60 low
288 Washington L low low high 60 low
292 Sunderland South M high medium low 15 medium
299 Washington M high low high 10 low
312 Washington M high medium low 15 medium
324 Sunderland South M high medium low 15 medium
328 Coalfield M low low high 30 low
333 Coalfield H high low high 12 high
339 Coalfield L medium low low 10 (AM), 15 (PM) high
341 Coalfield L low low medium20 (AM), 30 (PM)medium
342 Sunderland South M low low high 20 medium
344 Coalfield M low low high 20 medium
355 Sunderland South M low low high 60 low
356 Sunderland South M low low medium 20 medium
364 Washington L low low high 60 low
367 Coalfield L low low medium 30 low
376 Coalfield L low low medium 30 low
380 Sunderland South L low low medium 30 low
382 Coalfield L low low medium 30 low
388 Coalfield L low low medium 30 low
410 Coalfield L low medium low 60 (PM) low
413 Sunderland North M low low high 20 medium
416 Sunderland North L low low medium 60 medium
417 Coalfield M low low high 30 low
421 Coalfield M low low high 30 low
422 Coalfield M low low high 20 medium
424 Washington M high low high 10 low
448 Coalfield M low low high 20 medium
451 Sunderland South M low low high 20 medium
453 Washington M low low high 20 medium
454 Washington M low low high 30 low
462 Coalfield M low low high 30 low
465 Coalfield M low low high 30 medim
468 Coalfield L low low medium 30 low
469 Coalfield H high low high 12 high
470 Coalfield H high low high 12 high
472 Coalfield H high low high 12 high
477 Sunderland South H high low high 15 medium
494 Coalfield H high low high 15 medium
504 Sunderland South H high low high 10 high
505 Sunderland South H high low high 10 high
511 Sunderland South L low low high 60 low
517 Sunderland North L low low high 60 low
520 Sunderland North H high low high 10 high
530 Sunderland South L low low high 60 low
531 Sunderland South L low low high 60 low
537 Sunderland North L low low high 60 low
538 Washington L low low medium 30 low
539 Coalfield L low low medium 30 low
540 Coalfield L low low medium 30 low
562 Sunderland South M high low high 15 medium

565 Sunderland North M high high low 10 high
567 Washington M high low high 10 low
595 Washington M low high low 10 high
628 Washington M low low high 30 low
629 Washington H high low high 15 medium
630 Sunderland South H high low high 15 medium
631 Sunderland South M low low high 20 medium
632 Washington M low low high 20 medium
633 Washington M low low high 20 medium
636 Sunderland South M low low high 20 medium
637 Coalfield M low low high 20 medium
646 Washington L low low low 60 low
650 Washington M low low high 30 low
654 Coalfield H high low high 10 high
655 Sunderland Central H high high high 10 high
656 Sunderland Central H high high high 10 high
657 Sunderland Central H high high high 10 high
658 Sunderland Central H high high high 10 high
659 Sunderland Central H high high high 10 high
660 Sunderland Central H high high high 10 high
661 Sunderland Central H high high high 10 high
662 Sunderland Central H high high high 10 high
663 Sunderland South M low low high 20 medium
664 Sunderland South H high low high 10 high
665 Sunderland Central H high high high 10 high
671 Washington L low low low 0 low
673 Washington L low low high 30 medium
675 Sunderland North H medium high high 20 medium
676 Sunderland South H high low high 15 high
677 Sunderland South M low high high 30 low
154A Sunderland North M low low high 20 medium
154B Sunderland North M low low high 20 medium
293A Coalfield M low low medium 30 low
330A Coalfield H high low high 12 high
330B Coalfield M low low high 30 medim
407C Washington L low low high 30 low
426A Sunderland South L low low high 60 low
463A Washington H high low high 10 high
464B Coalfield L low low low 30 medium
467A Sunderland North L low medium low 20 medium
467B Sunderland North H high low high 10 high
80C Sunderland Central H high high high 15 medium

Commercial in Confidence
Appendix J Identified Bus Service Improvements
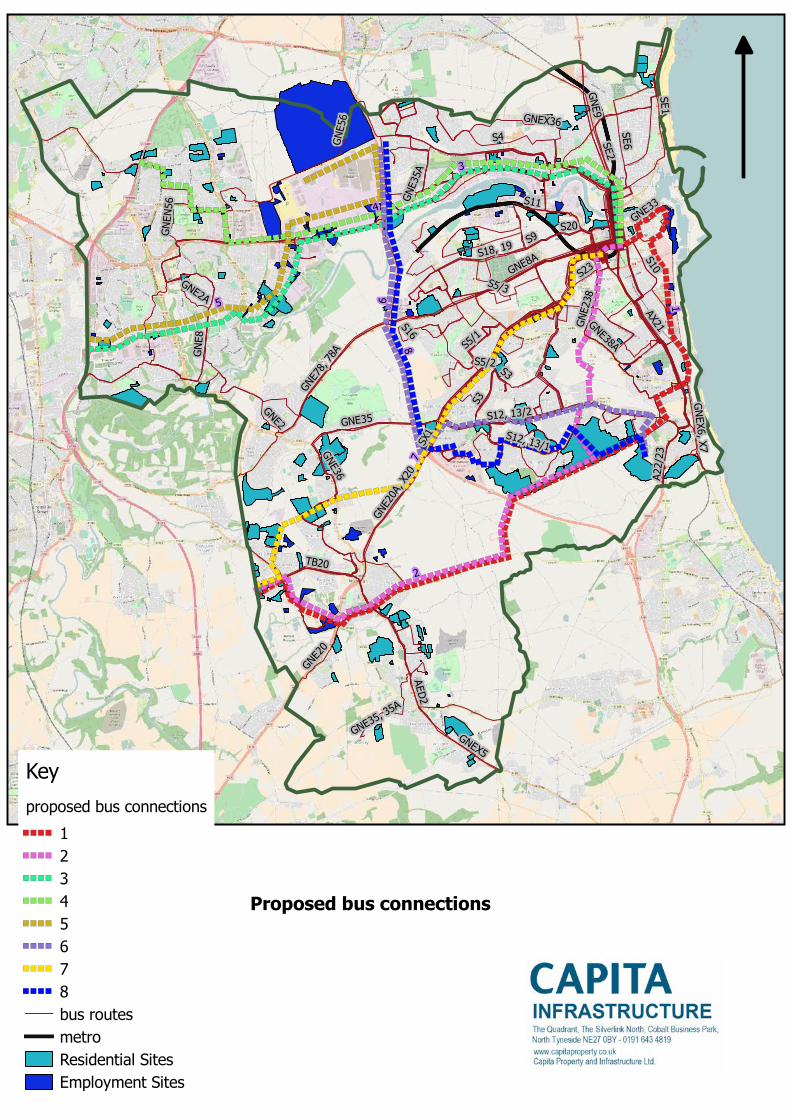
proposed bus connections
12345678bus routesmetroResidential SitesEmployment Sites
Key
Proposed bus connections

Commercial in Confidence
Appendix K Sunderland Cycling Map

Commercial in Confidence
Appendix L Cycling & Walking Accessibility Ranking Results

Site Walking Cycling Site Walking Cycling Site Walking Cycling
46 L L 252 M M 520 H H
54 L L 258 M M 530 M H
56 L L 280 L L 531 M H
61 M M 288 M H 537 M H
62 M H 292 H H 538 L M
63 H H 299 L M 539 L L
70 H H 312 M M 540 L H
74 L H 324 M H 562 M H
78 M H 328 L H 565 M H
79 L L 333 L L 567 L M
81 M H 339 L H 595 L M
85 H M 341 L L 628 L M
86 L M 342 M H 629 M M
91 H H 344 L L 630 H M
93 H H 355 M H 631 M H
98 L H 356 L H 632 M M
100 M H 364 M H 633 M H
101 M M 367 L L 636 M M
104 M M 376 L L 637 L H
106 M H 380 L H 646 L H
107 M M 382 L L 650 H H
109 H M 388 L H 654 L L
111 L H 410 L L 655 H H
112 H H 413 M H 656 H H
113 L L 416 L H 657 H H
115 L M 417 L L 658 H H
118 H M 421 L H 659 H H
120 H H 422 L M 660 H H
128 M L 424 L L 661 H H
138 L H 448 L M 662 H H
142 L L 451 M H 663 M H
146 L M 453 M M 664 H H
147 M M 454 M H 665 H H
149 L M 462 L H 671 L H
150 L L 465 L L 673 L H
159 M H 468 L L 675 L M
160 M H 469 L L 676 L H
175 M M 470 L L 677 M H
177 M M 472 L H 154A M H
187 H H 477 L H 154B M H
193 L L 494 L H 293A L H
194 L L 504 L H 330A L M
197 L H 505 L H 330B L L
230 L H 511 L H 407C L M
248 L H 517 M H 426A L H
463A L M 467A M H 80C H H
464B L M 467B M H

Commercial in Confidence
Appendix M Identified Improvements to the Cycling Network
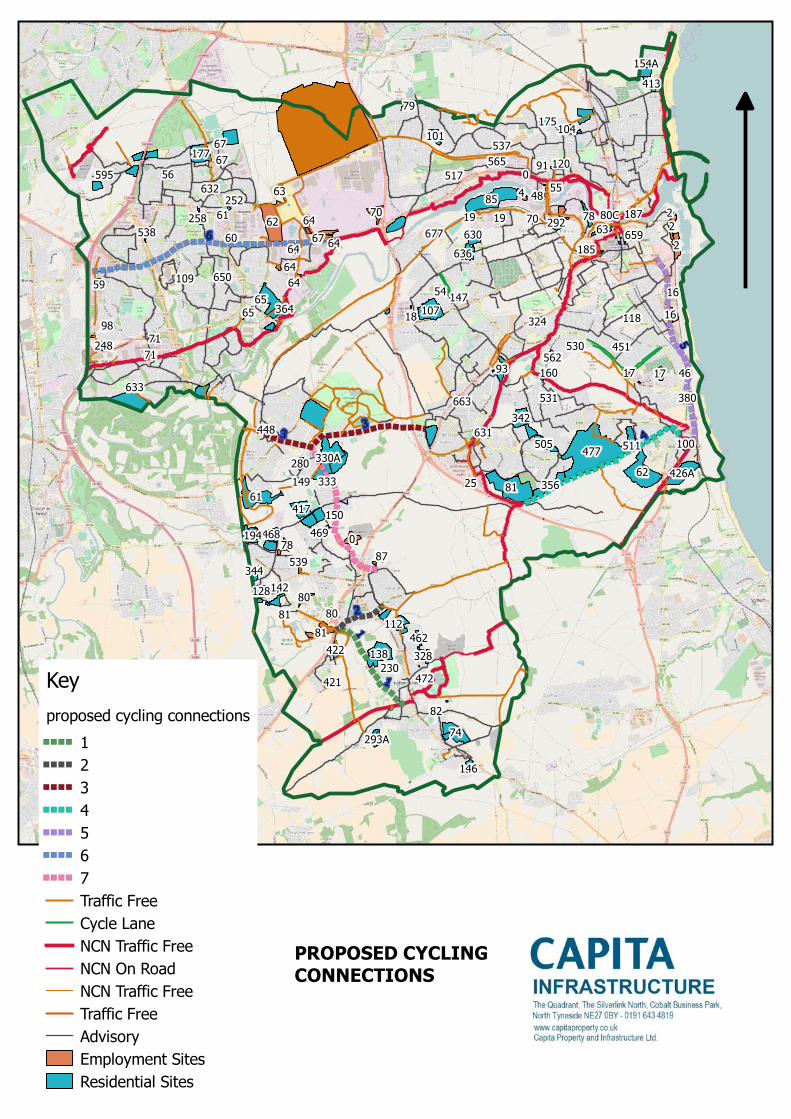
proposed cycling connections
1234567Traffic FreeCycle LaneNCN Traffic FreeNCN On RoadNCN Traffic FreeTraffic FreeAdvisoryEmployment Sites Residential Sites
Key
PROPOSED CYCLINGCONNECTIONS

Commercial in Confidence
Appendix N Minor Highway Mitigation Works
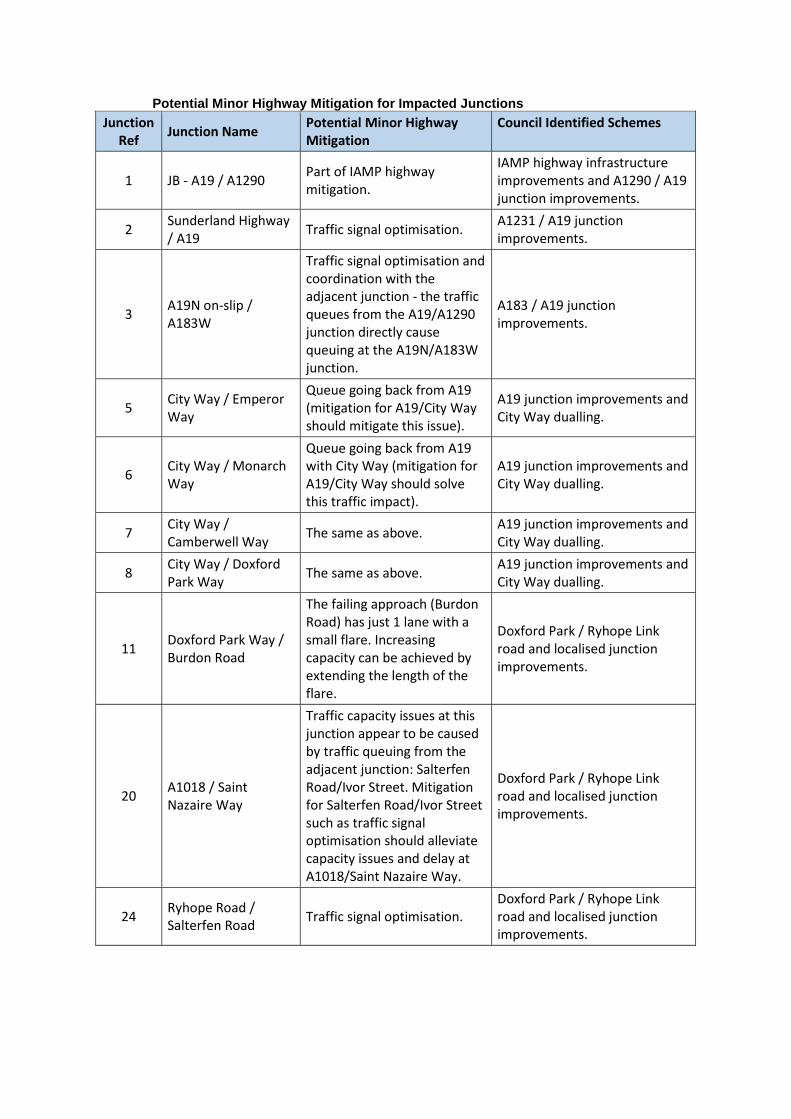
Potential Minor Highway Mitigation for Impacted Junctions
Junction
Ref Junction Name
Potential Minor Highway
Mitigation
Council Identified Schemes
1 JB - A19 / A1290 Part of IAMP highway
mitigation.
IAMP highway infrastructure
improvements and A1290 / A19
junction improvements.
2 Sunderland Highway
/ A19 Traffic signal optimisation.
A1231 / A19 junction
improvements.
3 A19N on-slip /
A183W
Traffic signal optimisation and
coordination with the
adjacent junction - the traffic
queues from the A19/A1290
junction directly cause
queuing at the A19N/A183W
junction.
A183 / A19 junction
improvements.
5 City Way / Emperor
Way
Queue going back from A19
(mitigation for A19/City Way
should mitigate this issue).
A19 junction improvements and
City Way dualling.
6 City Way / Monarch
Way
Queue going back from A19
with City Way (mitigation for
A19/City Way should solve
this traffic impact).
A19 junction improvements and
City Way dualling.
7 City Way /
Camberwell Way The same as above.
A19 junction improvements and
City Way dualling.
8 City Way / Doxford
Park Way The same as above.
A19 junction improvements and
City Way dualling.
11 Doxford Park Way /
Burdon Road
The failing approach (Burdon
Road) has just 1 lane with a
small flare. Increasing
capacity can be achieved by
extending the length of the
flare.
Doxford Park / Ryhope Link
road and localised junction
improvements.
20 A1018 / Saint
Nazaire Way
Traffic capacity issues at this
junction appear to be caused
by traffic queuing from the
adjacent junction: Salterfen
Road/Ivor Street. Mitigation
for Salterfen Road/Ivor Street
such as traffic signal
optimisation should alleviate
capacity issues and delay at
A1018/Saint Nazaire Way.
Doxford Park / Ryhope Link
road and localised junction
improvements.
24 Ryhope Road /
Salterfen Road Traffic signal optimisation.
Doxford Park / Ryhope Link
road and localised junction
improvements.
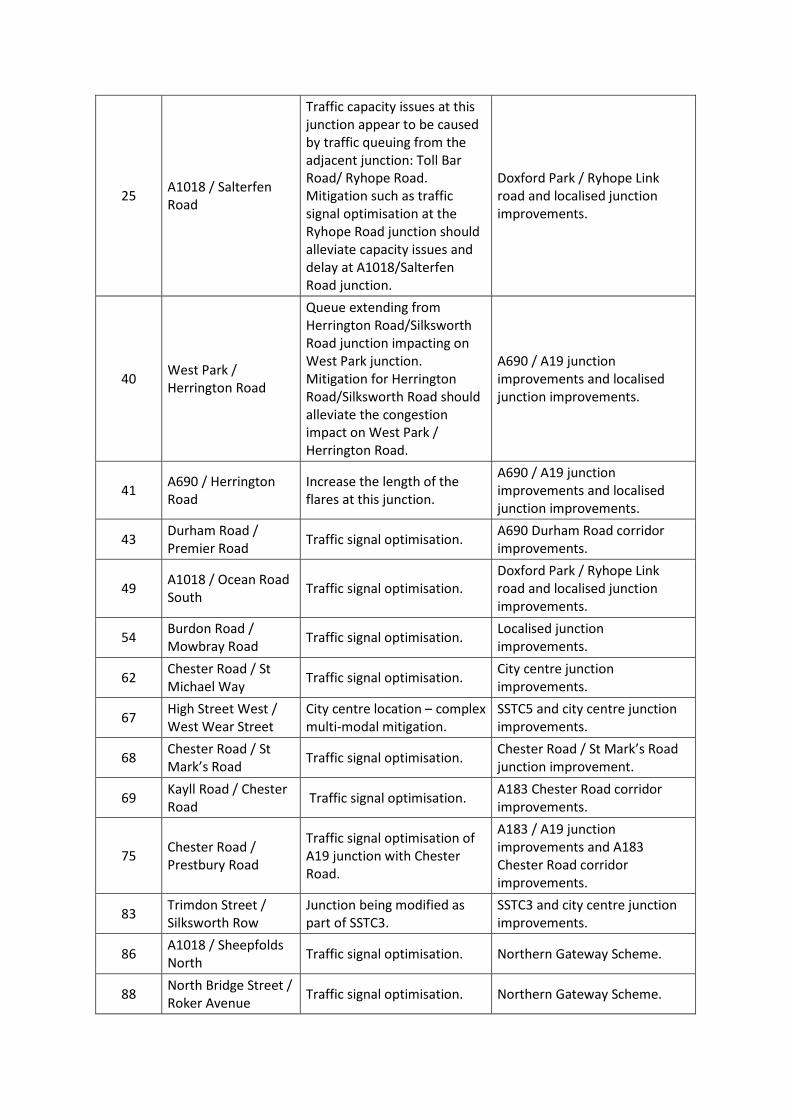
25 A1018 / Salterfen
Road
Traffic capacity issues at this
junction appear to be caused
by traffic queuing from the
adjacent junction: Toll Bar
Road/ Ryhope Road.
Mitigation such as traffic
signal optimisation at the
Ryhope Road junction should
alleviate capacity issues and
delay at A1018/Salterfen
Road junction.
Doxford Park / Ryhope Link
road and localised junction
improvements.
40 West Park /
Herrington Road
Queue extending from
Herrington Road/Silksworth
Road junction impacting on
West Park junction.
Mitigation for Herrington
Road/Silksworth Road should
alleviate the congestion
impact on West Park /
Herrington Road.
A690 / A19 junction
improvements and localised
junction improvements.
41 A690 / Herrington
Road
Increase the length of the
flares at this junction.
A690 / A19 junction
improvements and localised
junction improvements.
43 Durham Road /
Premier Road Traffic signal optimisation.
A690 Durham Road corridor
improvements.
49 A1018 / Ocean Road
South Traffic signal optimisation.
Doxford Park / Ryhope Link
road and localised junction
improvements.
54 Burdon Road /
Mowbray Road Traffic signal optimisation.
Localised junction
improvements.
62 Chester Road / St
Michael Way Traffic signal optimisation.
City centre junction
improvements.
67 High Street West /
West Wear Street
City centre location – complex
multi-modal mitigation.
SSTC5 and city centre junction
improvements.
68 Chester Road / St
Mark’s Road Traffic signal optimisation.
Chester Road / St Mark’s Road
junction improvement.
69 Kayll Road / Chester
Road Traffic signal optimisation.
A183 Chester Road corridor
improvements.
75 Chester Road /
Prestbury Road
Traffic signal optimisation of
A19 junction with Chester
Road.
A183 / A19 junction
improvements and A183
Chester Road corridor
improvements.
83 Trimdon Street /
Silksworth Row
Junction being modified as
part of SSTC3.
SSTC3 and city centre junction
improvements.
86 A1018 / Sheepfolds
North Traffic signal optimisation. Northern Gateway Scheme.
88 North Bridge Street /
Roker Avenue Traffic signal optimisation. Northern Gateway Scheme.

94 Whitburn Road /
Dykelands Road Traffic signal optimisation.
Localised junction
improvements.
97 Newcastle Road /
Chalton Road Traffic signal optimisation.
Localised junction
improvements.
103 Wessington Way /
A1231 Traffic signal optimisation.
SSTC4 and A1231 / A19 junction
improvements.
110 Wessington Way /
Castletown Way Traffic signal optimisation.
SSTC4 and A1231 / A19 junction
improvements.
113 Washington Road /
Ferryboat Lane Traffic signal optimisation.
SSTC4 and A1231 / A19 junction
improvements.
115 Washington Road /
Blackwood Road Traffic signal optimisation.
SSTC4 and A1231 / A19 junction
improvements.
118 Washington Road /
Craigavon Road Traffic signal optimisation.
Localised junction
improvements.
148 A182 - B1260 Traffic signal optimisation.
Coalfield Regeneration Route
(Hetton Bypass) and localised
junction improvements.
142 A690 - A1052 –
A182
Increase the length of the
flare on Hetton Road.
Coalfield Regeneration Route
(Hetton Bypass) and localised
junction improvements.
144 Vigo Lane / Picktree
Lane Traffic signal optimisation.
Localised junction
improvements.
145 Picktree Lane /
Bramhall Drive
2 lanes are not intuitive,
provision of lane markings on
the circulatory.
Localised junction
improvements.
147 A182 / Coaley Lane Traffic signal optimisation.
Coaley Lane / Philadelphia Link
Road and localised junction
improvements.
155 A182 / B1286
A182 northbound delay,
introduce restriction access to
the local garage.
New Herrington / Penshaw Link
Road.
71 The Broadway /
Springwell Road
Northern and western
approaches to the
roundabout are 1 lane
approaches, suggest
increasing these to 2 lane
approaches.
A183 Chester Road Corridor
improvements.
73 Chester Road /
Pennywell Road
Northern approach to the
junction is 1 lane, and suggest
building a flare or additional
lane on this junction
approach.
A183 Chester Road Corridor
improvements.
78 Hylton Road /
Grindon Lane
Creation of an additional lane
for ahead and right turning
movements at the junction.
A183 Chester Road Corridor
improvements.
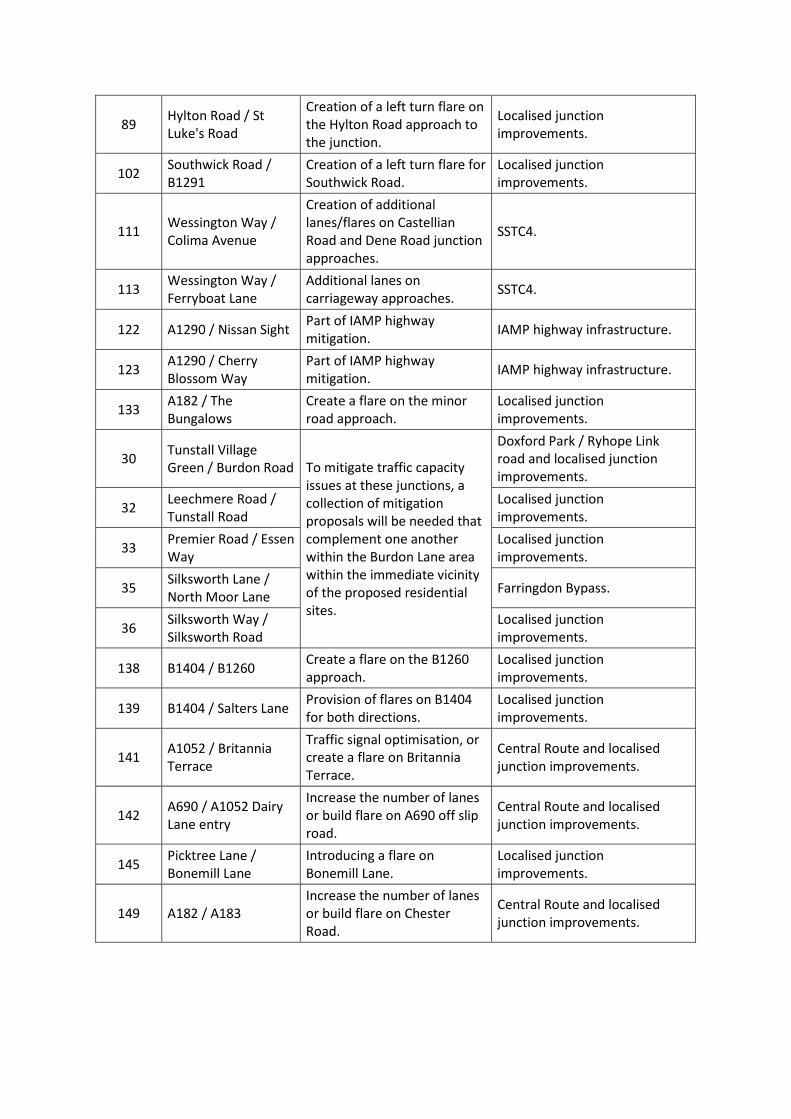
89 Hylton Road / St
Luke's Road
Creation of a left turn flare on
the Hylton Road approach to
the junction.
Localised junction
improvements.
102 Southwick Road /
B1291
Creation of a left turn flare for
Southwick Road.
Localised junction
improvements.
111 Wessington Way /
Colima Avenue
Creation of additional
lanes/flares on Castellian
Road and Dene Road junction
approaches.
SSTC4.
113 Wessington Way /
Ferryboat Lane
Additional lanes on
carriageway approaches. SSTC4.
122 A1290 / Nissan Sight Part of IAMP highway
mitigation. IAMP highway infrastructure.
123 A1290 / Cherry
Blossom Way
Part of IAMP highway
mitigation. IAMP highway infrastructure.
133 A182 / The
Bungalows
Create a flare on the minor
road approach.
Localised junction
improvements.
30 Tunstall Village
Green / Burdon Road To mitigate traffic capacity
issues at these junctions, a
collection of mitigation
proposals will be needed that
complement one another
within the Burdon Lane area
within the immediate vicinity
of the proposed residential
sites.
Doxford Park / Ryhope Link
road and localised junction
improvements.
32 Leechmere Road /
Tunstall Road
Localised junction
improvements.
33 Premier Road / Essen
Way
Localised junction
improvements.
35 Silksworth Lane /
North Moor Lane Farringdon Bypass.
36 Silksworth Way /
Silksworth Road
Localised junction
improvements.
138 B1404 / B1260 Create a flare on the B1260
approach.
Localised junction
improvements.
139 B1404 / Salters Lane Provision of flares on B1404
for both directions.
Localised junction
improvements.
141 A1052 / Britannia
Terrace
Traffic signal optimisation, or
create a flare on Britannia
Terrace.
Central Route and localised
junction improvements.
142 A690 / A1052 Dairy
Lane entry
Increase the number of lanes
or build flare on A690 off slip
road.
Central Route and localised
junction improvements.
145 Picktree Lane /
Bonemill Lane
Introducing a flare on
Bonemill Lane.
Localised junction
improvements.
149 A182 / A183
Increase the number of lanes
or build flare on Chester
Road.
Central Route and localised
junction improvements.

Commercial in Confidence
Capita Property and Infrastructure Ltd
North Tyneside Council
The Quadrant
The Silverlink North
Cobalt Business Park
North Tyneside NE27 0BY
www.capita.co.uk