Embed Size (px)
DESCRIPTION
‘Working for Desirable Future’ : Transparency and participation in electricity sector planning in Thailand. Suphakit Nuntavorakarn Healthy Public Policy Foundation, THAILAND 26th September 2011 FESTI International Conference, Bishkek. Installed Capacity by Type of Producers, April 2011. - PowerPoint PPT Presentation
Citation preview
‘Working for Desirable Future’:Transparency and participation
in electricity sector planning in ThailandSuphakit Nuntavorakarn
Healthy Public Policy Foundation, THAILAND26th September 2011 FESTI International Conference, Bishkek
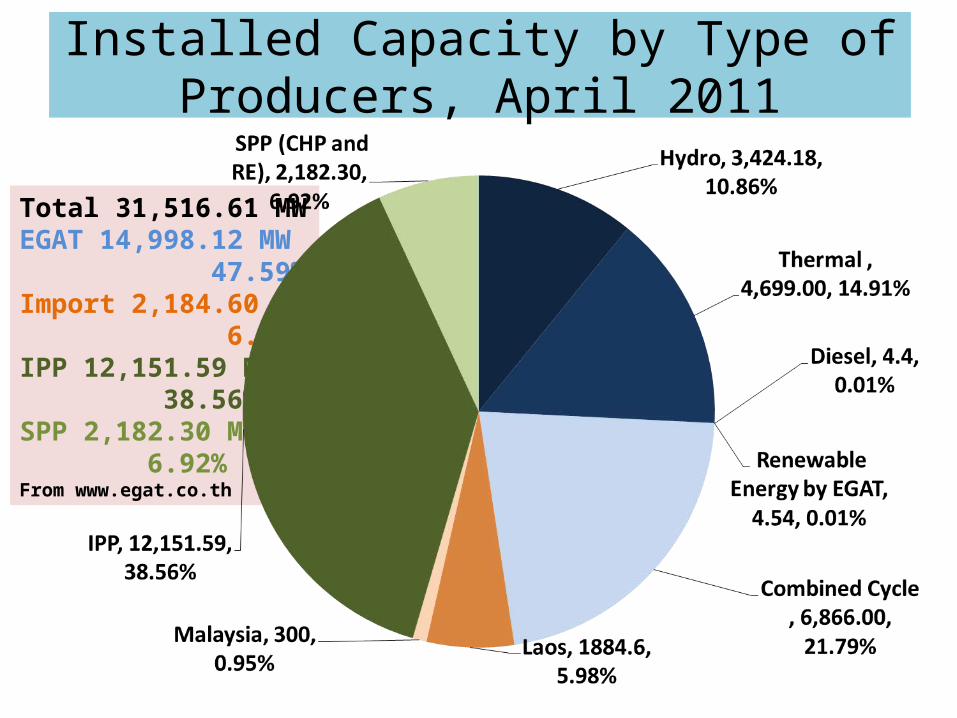
Installed Capacity by Type of Producers, April 2011
Total 31,516.61 MWEGAT 14,998.12 MW 47.59%Import 2,184.60 MW 6.93%IPP 12,151.59 MW 38.56%SPP 2,182.30 MW 6.92%From www.egat.co.th
Power Development Plan (PDP)• PDP is the long-term strategic plan of the Thai power
sector (15-20 years timeframe)• PDP determines the future investment on power
generation - how many and which types of power plant – and the transmission network.
– For example, total investment of PDP2010 120 billion USD
• So PDP also determines the future impacts of the power sector, including environmental, economic, social, and health impacts
0
5,000
10,000
15,000
20,000
25,000
30,000
35,000
40,000
45,000
50,000
55,000
60,000
65,000
70,000
2553 2554 2555 2556 2557 2558 2559 2560 2561 2562 2563 2564 2565 2566 2567 2568 2569 2570 2571 2572 2573
ดีเซล พลังงานหมุนเวียน น้ำ�า มันเตา ซื� อต่างประเทศก๊าซ ธรรมชาติ ถ่านหินน้ำา เข้า ลิกไ นต์ นิวเคลียร์ พลังน้ำ�า
MWMW
ปีปี
45%45%
49%49%
54%54%
61%61%64%64%68%68% 64%64%65%65% 66%66% 67%67% 63%63% 60%60%57%57%
51%51%51%51%
47%47%45%45%
44%44% 43%43% 43%43% 42%42%
5%5% 7%7% 7%7% 7%7% 7%7% 7%7% 7%7% 7%7% 7%7% 8%8% 8%8% 9%9% 9%9% 12%12% 11%11% 11%11% 13%13% 13%13% 15%15% 15%15% 17%17%
7%7% 7%7% 6%6% 6%6% 5%5% 5%5% 5%5% 5%5% 5%5% 5%5% 5%5% 5%5% 4%4% 4%4% 4%4%
5%5% 5%5% 6%6% 6%6% 7%7% 7%7% 7%7%7%7% 8%8%
8%8% 8%8% 8%8%
4%4% 4%4% 6%6% 8%8% 7%7% 7%7% 8%8% 8%8% 8%8%4%4%
6%6% 8%8% 10%10% 11%11% 12%12% 13%13% 14%14% 15%15% 15%15% 15%15% 16%16% 17%17%17%17%
6%6%7%7%7%7%
11%11% 10%10% 10%10% 9%9% 9%9% 9%9% 8%8% 9%9% 9%9% 9%9% 9%9% 8%8% 8%8% 8%8% 7%7% 7%7% 7%7% 7%7% 6%6% 6%6% 6%6%
18%18%18%18%
18%18%18%18%7%7%
7%7%7%7%
8%8%
7%7%
5%5%
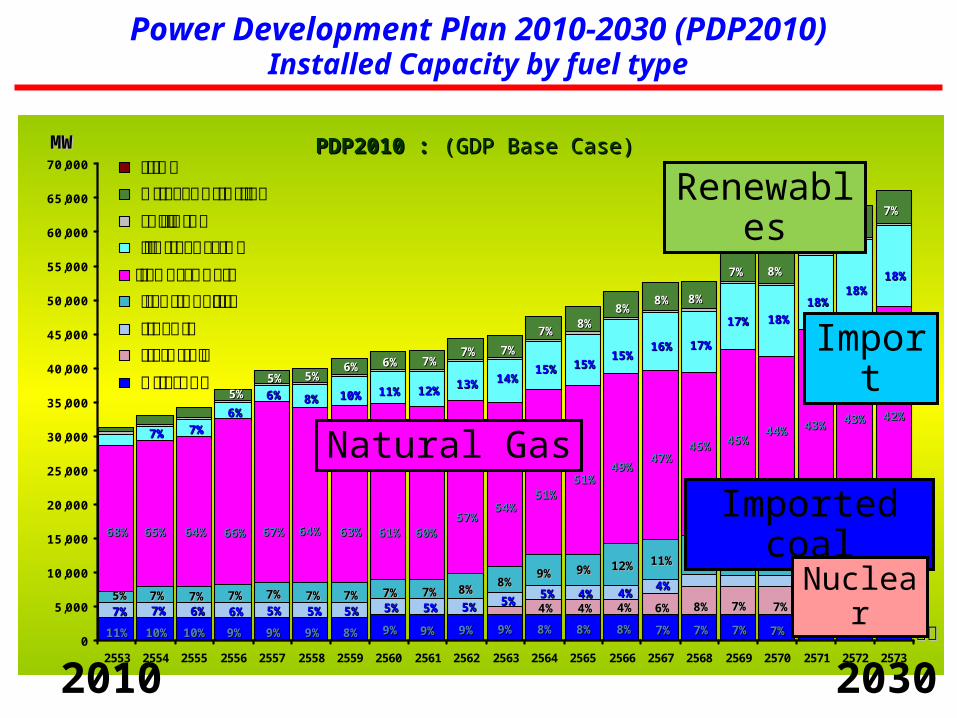
PDP2010 :PDP2010 : ( (GDP Base CaseGDP Base Case))
Power Development Plan 2010-2030 (PDP2010)Installed Capacity by fuel type
Renewables
Import
Natural GasImported coal
Nuclear
2010 2030
Drivers and institutional improvements on PDP
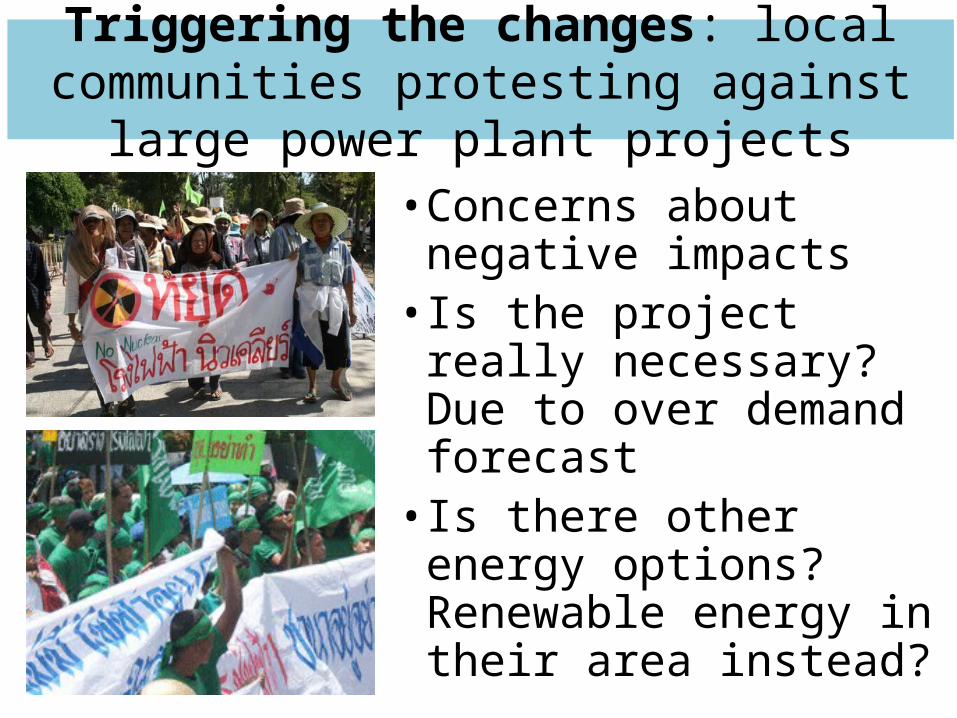
Triggering the changes: local communities protesting against large power plant projects
• Concerns about negative impacts
• Is the project really necessary? Due to over demand forecast
• Is there other energy options? Renewable energy in their area instead?
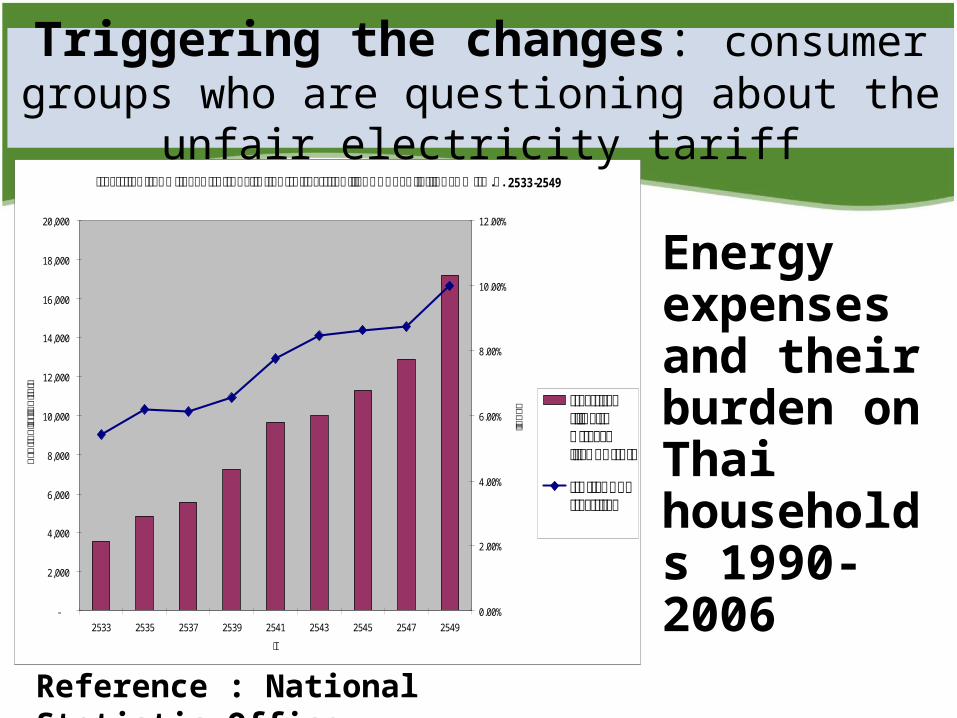
ค่า ใ ช้ จ่ายด้านพลังงา นต่อปีและ สัดส่วนต่อค่า ใ ช้ จ่ายท้ั งหมดของครัวเรือนไ ทย ปีพ.ศ. 2533-2549
-
2,000
4,000
6,000
8,000
10,000
12,000
14,000
16,000
18,000
20,000
2533 2535 2537 2539 2541 2543 2545 2547 2549
ปี
บาทต่
อครัว
เรือน
ต่อปี
0.00%
2.00%
4.00%
6.00%
8.00%
10.00%
12.00%
ร้อยล
ะ ค่าใ ช้จ่ายเก่ียวกับพลังงานทั� งหมดต่อปี
สัดส่วนของค่าใ ช้จ่าย
Reference : National Statistic Office
Energy expenses and their burden onThai households 1990-2006
Triggering the changes: consumer groups who are questioning about the unfair electricity tariff
Academic contributions andpublic communication
• Information and analysis on the electricity sector- to create basic understanding for different social sector and
to get their attentions on various issues about PDP
• Development and impact assessment on Alternative Power Development Plans
- to create ‘Choice Awareness’ on many energy options andthese can be discuss deliberately as a social learning process
• Electricity Governance Assessment- focus on transparency, public participation, and accountability in the
Thai power sector
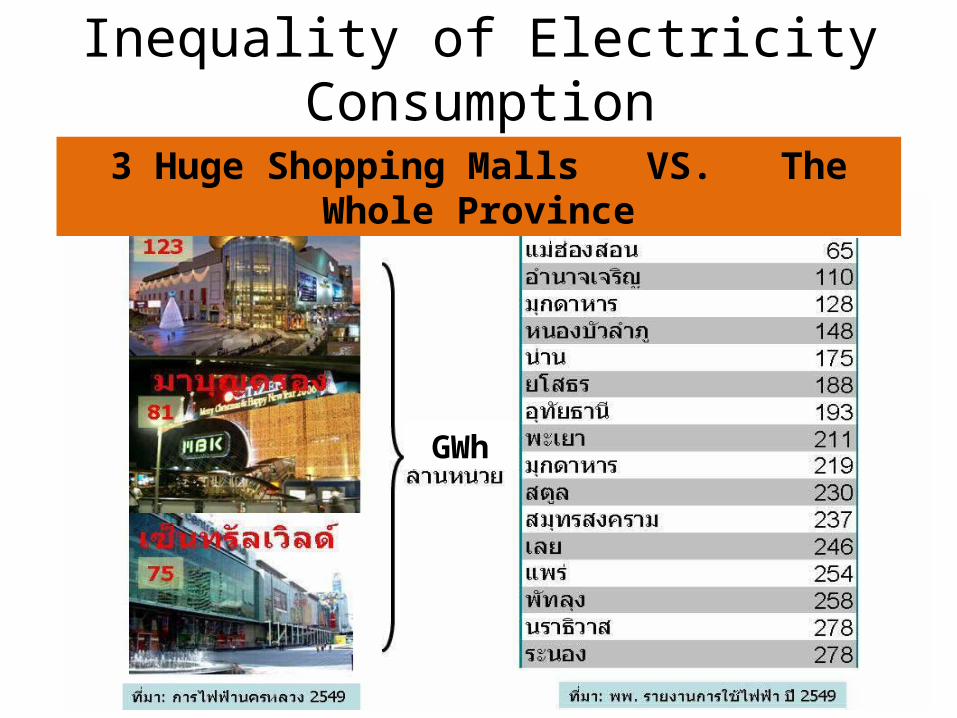
GWh
GWh3 Huge Shopping Malls VS. The Whole Province
Inequality of Electricity Consumption
8,000
12,000
16,000
20,000
24,000
28,000
32,000
36,000
40,000
44,000
48,000
1992 1994 1996 1998 2000 2002 2004 2006 2008 2010 2012 2014 2016 2018 2020
Jun-93Dec-94Oct-95Apr-96Oct-96Jun-97Sep-97Sep-98(MER)Feb-01Aug-02Jan-04(LEG)Jan-04(MEG)Apr-06 (MEG)Jan-07ACTUAL
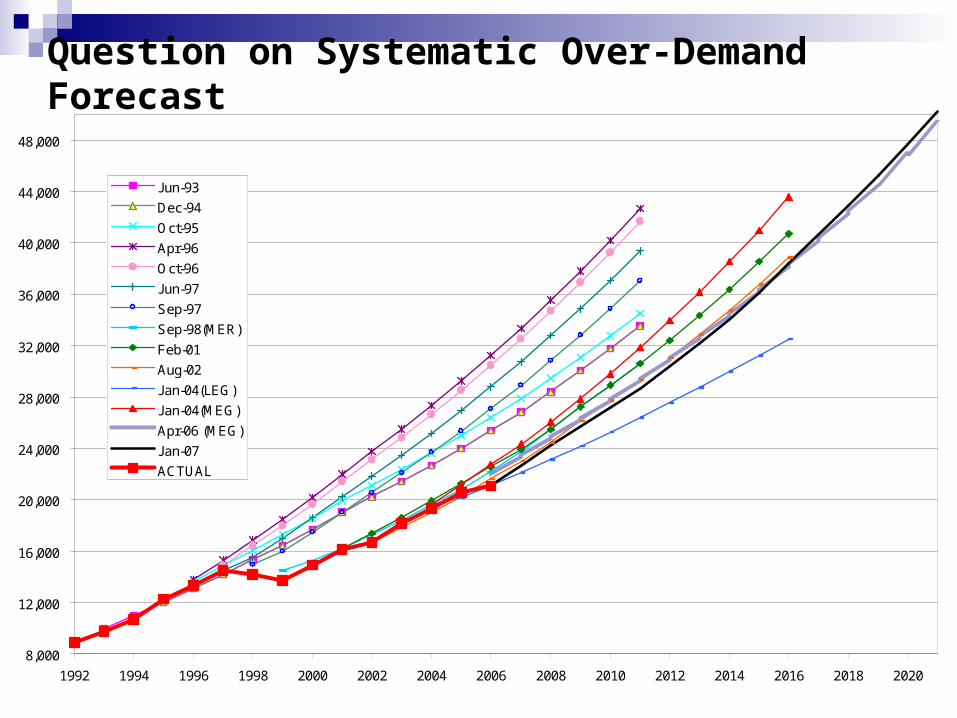
Question on Systematic Over-Demand Forecast
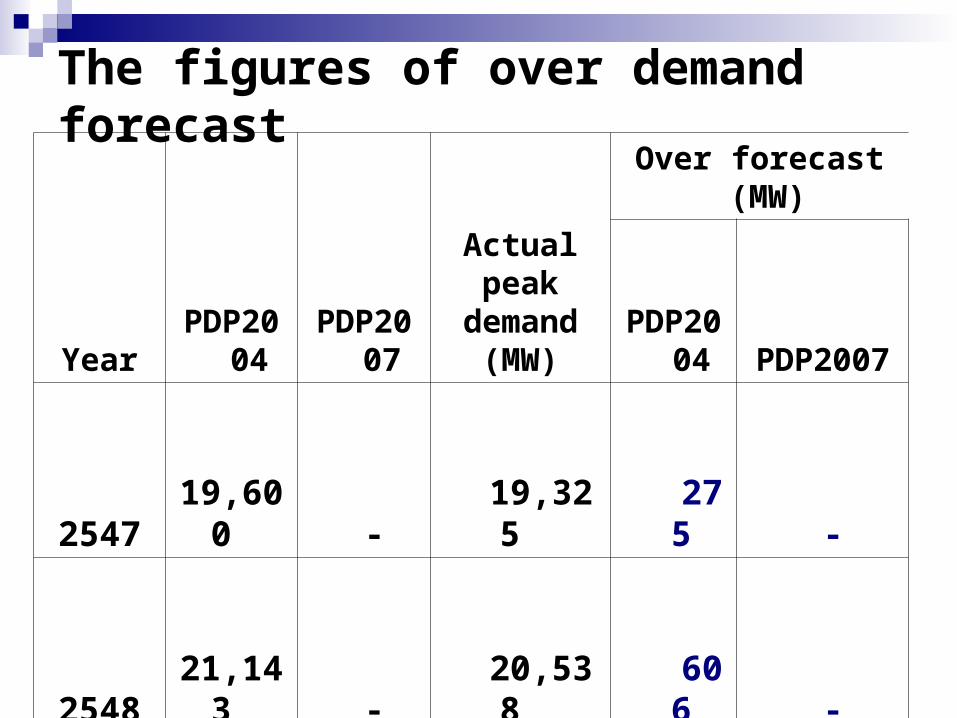
The figures of over demand forecast
YearPDP2
004PDP2
007
Actual peak
demand (MW)
Over forecast (MW)
PDP2004
PDP2007
2547
196,
00 -
1932
5
27
5 -
2548
211,
43 -
2053,
8
60
6 -
2549
227,
38 -
2106,
4
1,67
4 -
2550
243,
44
225,
86
2258,
6
1,75
8 -
2551
260,
48
2395
7
2256,
8
3,48
0
1,38
9
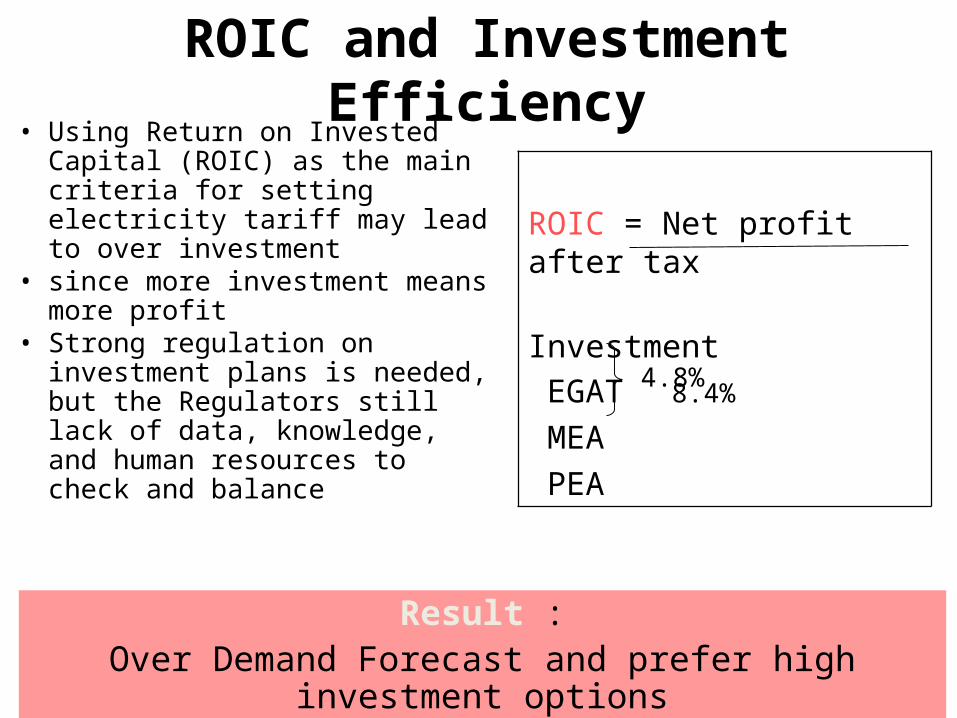
• Using Return on Invested Capital (ROIC) as the main criteria for setting electricity tariff may lead to over investment
• since more investment means more profit
• Strong regulation on investment plans is needed, but the Regulators still lack of data, knowledge, and human resources to check and balance
ROIC and Investment Efficiency
ROIC = Net profit after tax Investment EGAT 84. % MEA PEA
48.%
Result :Over Demand Forecast and prefer high investment
options
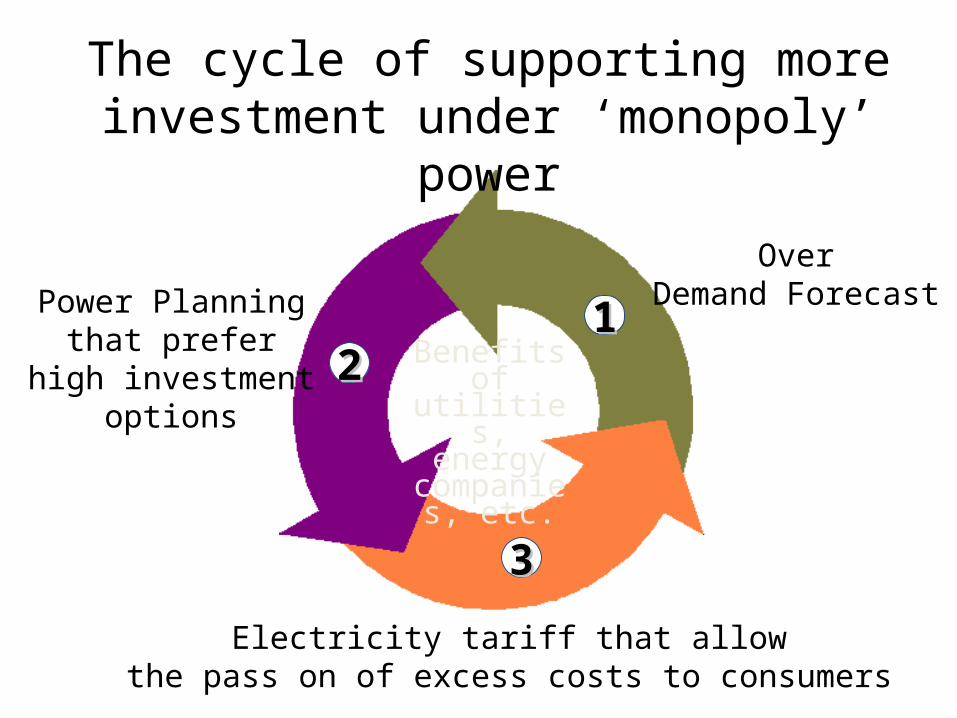
The cycle of supporting more investment under ‘monopoly’ power
OverDemand ForecastPower Planning
that preferhigh investment
options
Electricity tariff that allowthe pass on of excess costs to consumers
Benefits of utilities, energy companies, etc.
1122
33
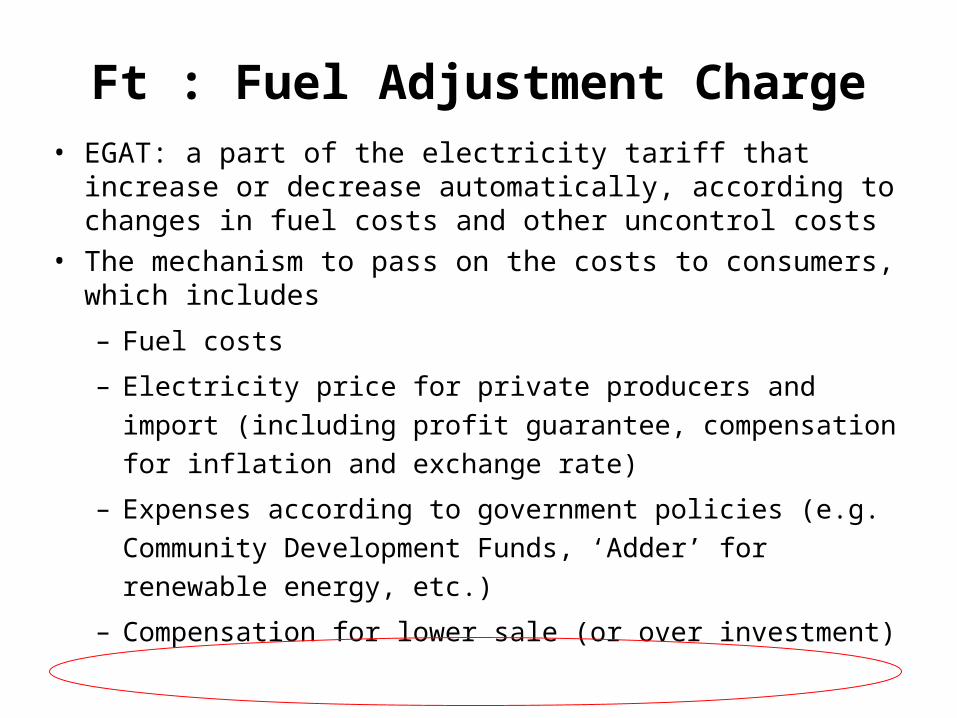
Ft : Fuel Adjustment Charge• EGAT: a part of the electricity tariff that increase or
decrease automatically, according to changes in fuel costs and other uncontrol costs
• The mechanism to pass on the costs to consumers, which includes– Fuel costs– Electricity price for private producers and import
(including profit guarantee, compensation for inflation and exchange rate)
– Expenses according to government policies (e.g. Community Development Funds, ‘Adder’ for renewable energy, etc.)
– Compensation for lower sale (or over investment)
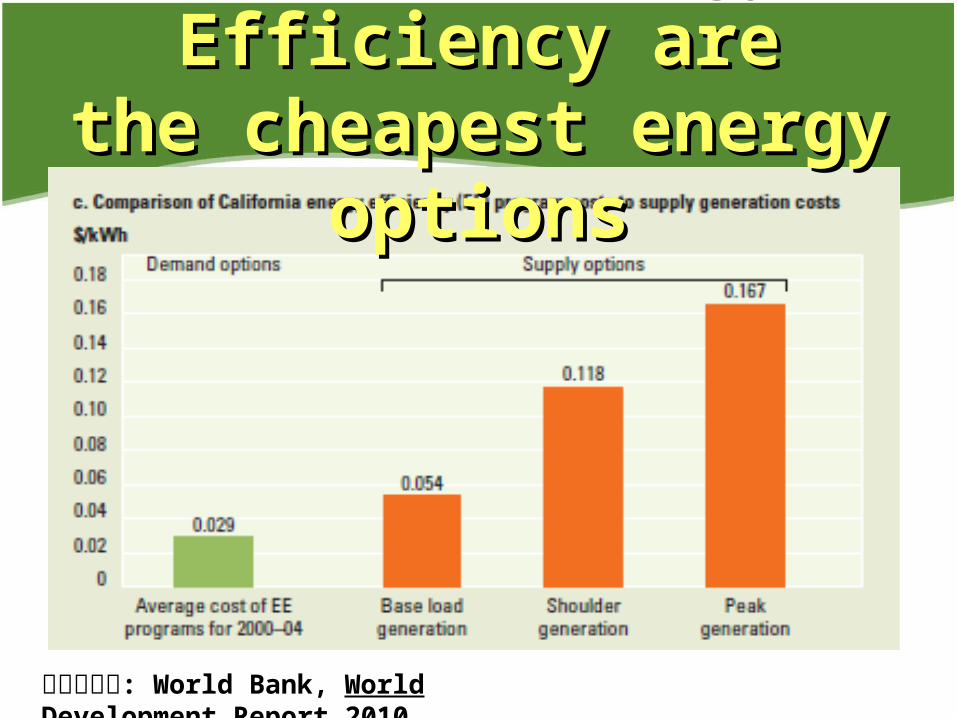
DSM and Energy DSM and Energy Efficiency areEfficiency are
the cheapest energy the cheapest energy optionsoptions
ท่ีมา: World Bank, World Development Report 2010
16
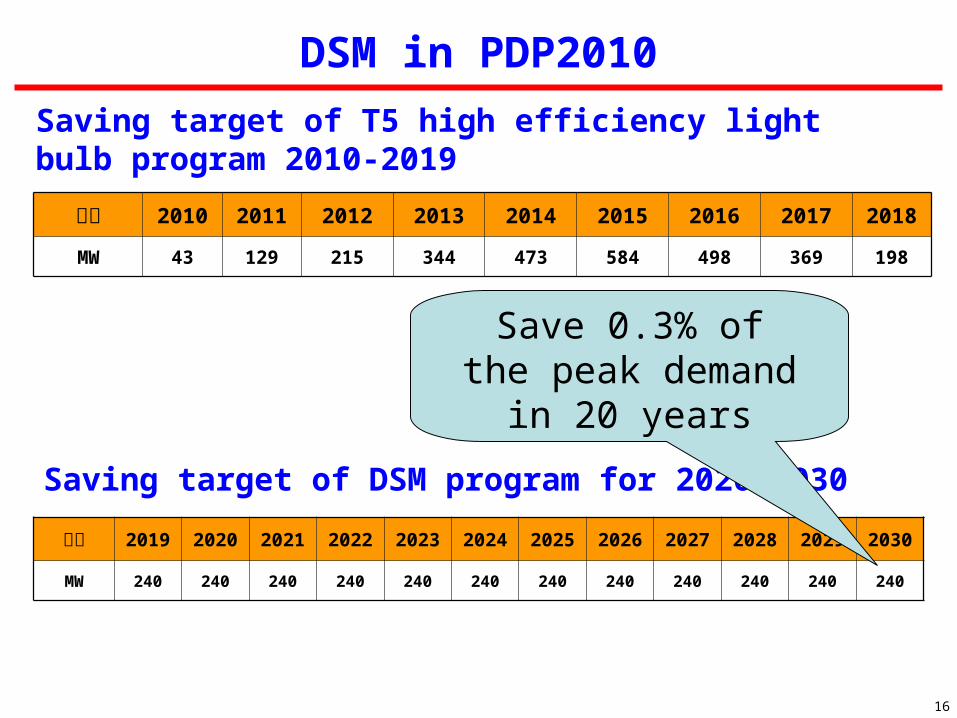
DSM in PDP2010
ปี 2019
2020
2021
2022
2023
2024
2025
2026
2027
2028
2029
2030
MW 240 240 240 240 240 240 240 240 240 240 240 240
Saving target of T5 high efficiency light bulb program 2010-2019
ปี 2010 2011 2012 2013 2014 2015 2016 2017 2018MW 43 129 215 344 473 584 498 369 198
Saving target of DSM program for 2020-2030
Save 0.3% ofthe peak demand in
20 years
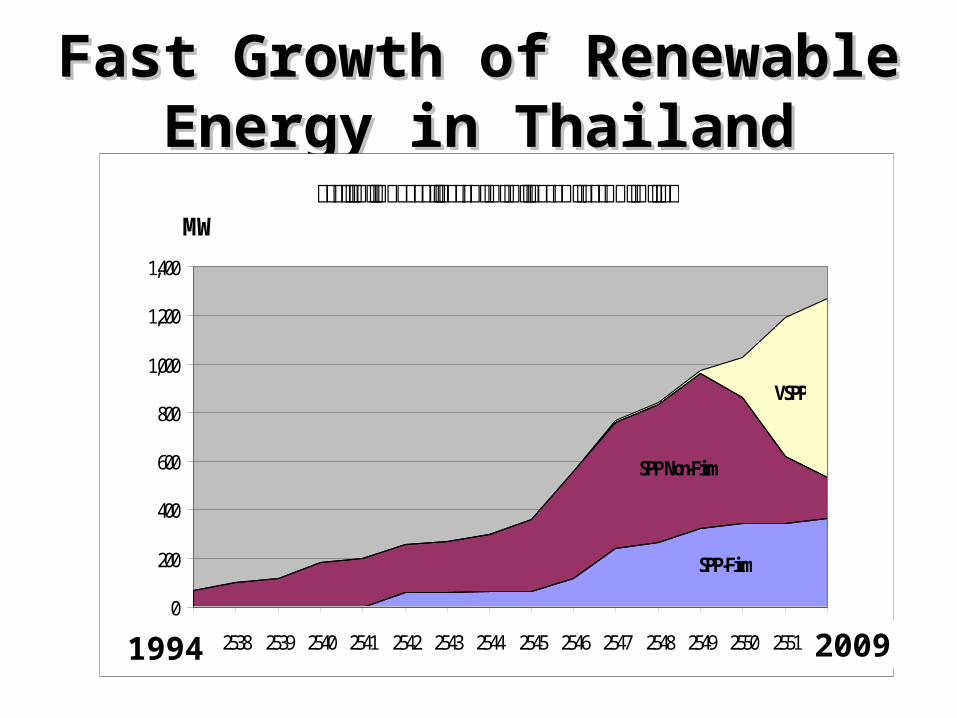
Fast Growth of Fast Growth of Renewable Energy in Renewable Energy in
ThailandThailandการเพ่ิมข้ึนของกำาลังการผลิตติดต้ังจากพลังงานหมุนเวียน
SPP-Firm
SPP Non-Firm
VSPP
0
200
400
600
800
1,000
1,200
1,400
2537 2538 2539 2540 2541 2542 2543 2544 2545 2546 2547 2548 2549 2550 2551 2552
MW
1994 2009
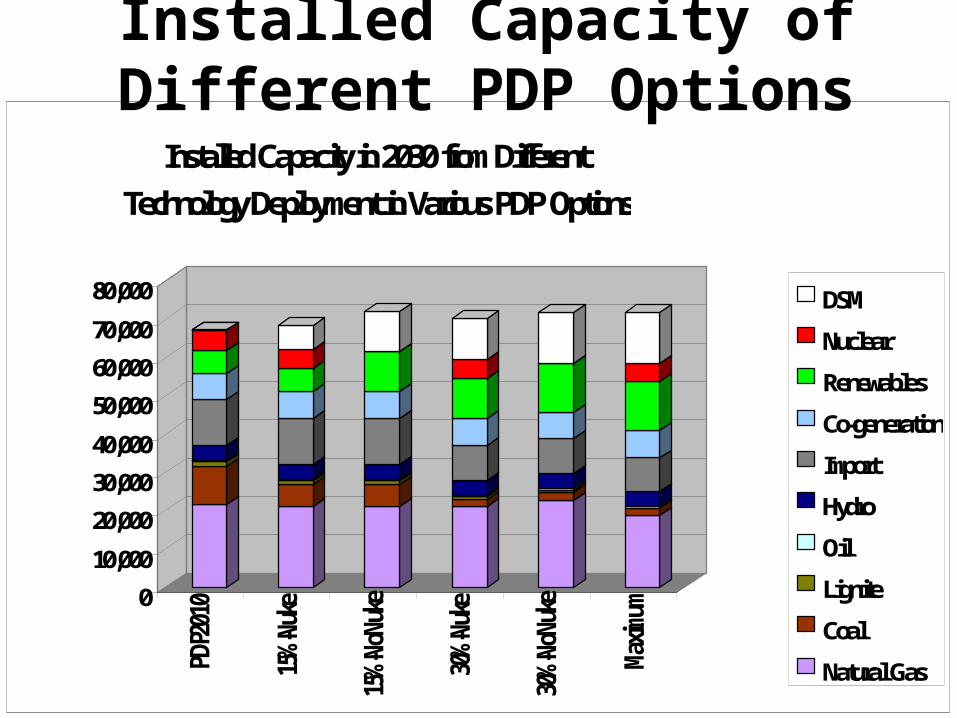
Example of PDP-Alternative
010,00020,00030,00040,00050,00060,00070,00080,000
PDP20
10
15%-Nu
ke
15%-No
Nuke
30%-Nu
ke
30%-No
Nuke
Maxim
um
Installed Capacity in 2030 from Different Technology Deployment in Various PDP Options
DSMNuclearRenewablesCo-generationImportHydroOilLigniteCoal Natural Gas
Installed Capacity of Different PDP Options
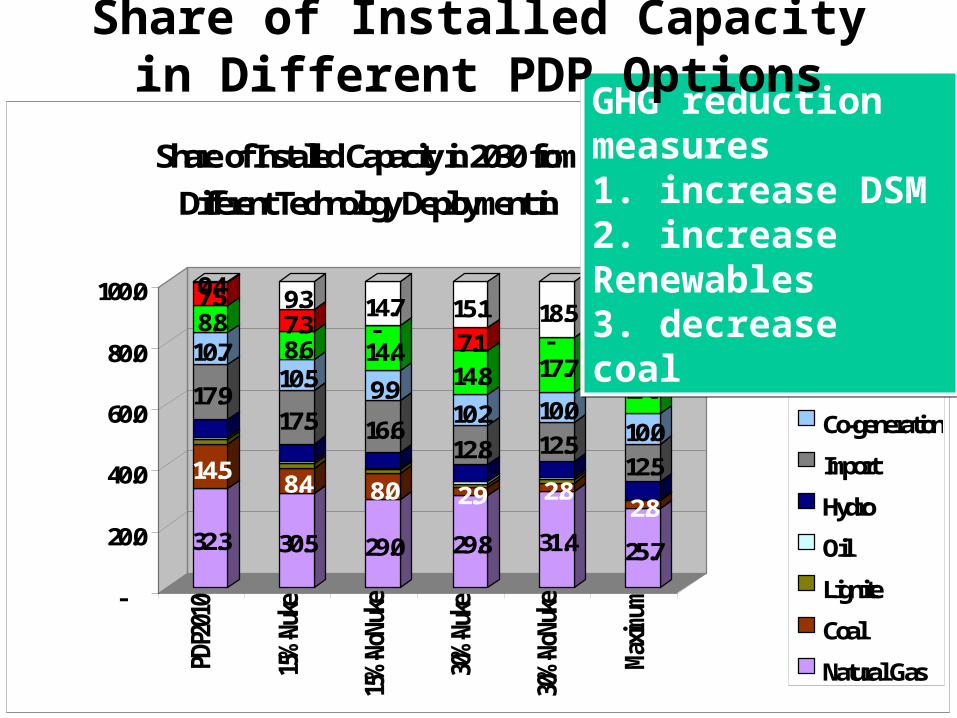
32.3
14.5
17.910.78.87.50.4
30.5
8.4
17.510.58.67.39.3
29.0
8.0
16.69.914.4-14.7
29.8
2.912.810.214.87.115.1
31.4
2.812.510.017.7-18.5
25.72.812.510.017.77.018.4
-
20.0
40.0
60.0
80.0
100.0
PDP20
10
15%-Nu
ke
15%-No
Nuke
30%-Nu
ke
30%-No
Nuke
Maxim
um
Share of Installed Capacity in 2030 from Different Technology Deployment in
DSMNuclearRenewablesCo-generationImportHydroOilLigniteCoal Natural Gas
GHG reduction measures1 . increase DSM2. increase Renewables3. decrease coal
Share of Installed Capacity in Different PDP Options

050,000
100,000150,000200,000250,000300,000350,000400,000
PDP20
10
15%-Nu
ke
15%-No
Nuke
30%-Nu
ke
30%-No
Nuke
Maxim
um
Energy Generations from Different Technology Deployment in Various PDP Options
DSMNuclearRenewablesCo-generationImportHydroOilLigniteCoal Natural Gas
Energy Generation in Different PDP Options
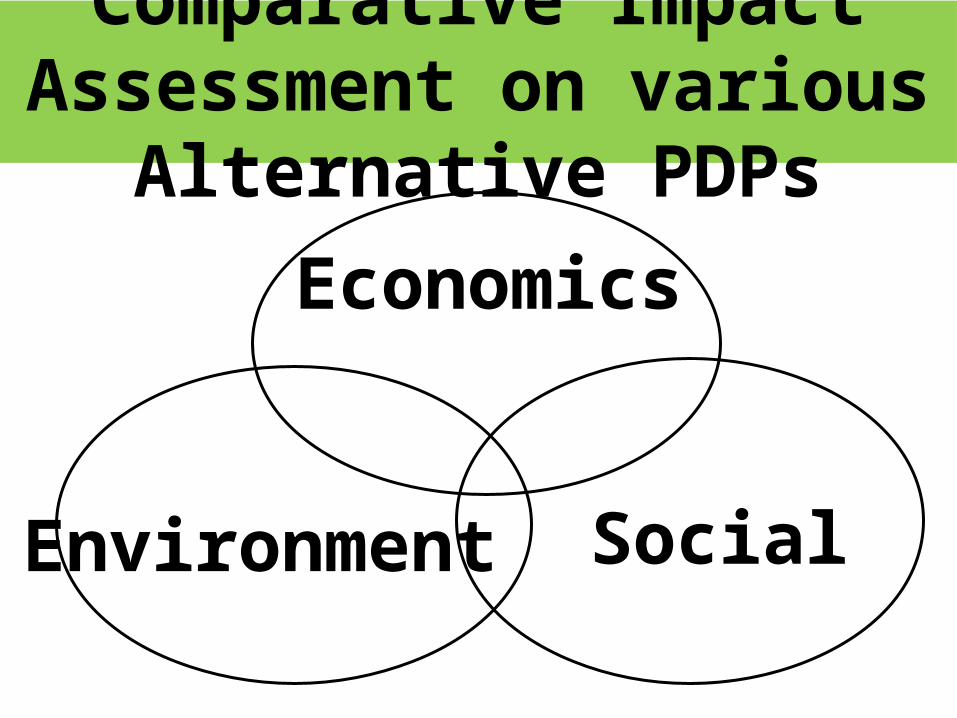
Comparative Impact Assessment on various
Alternative PDPsEconomics
Environment Social
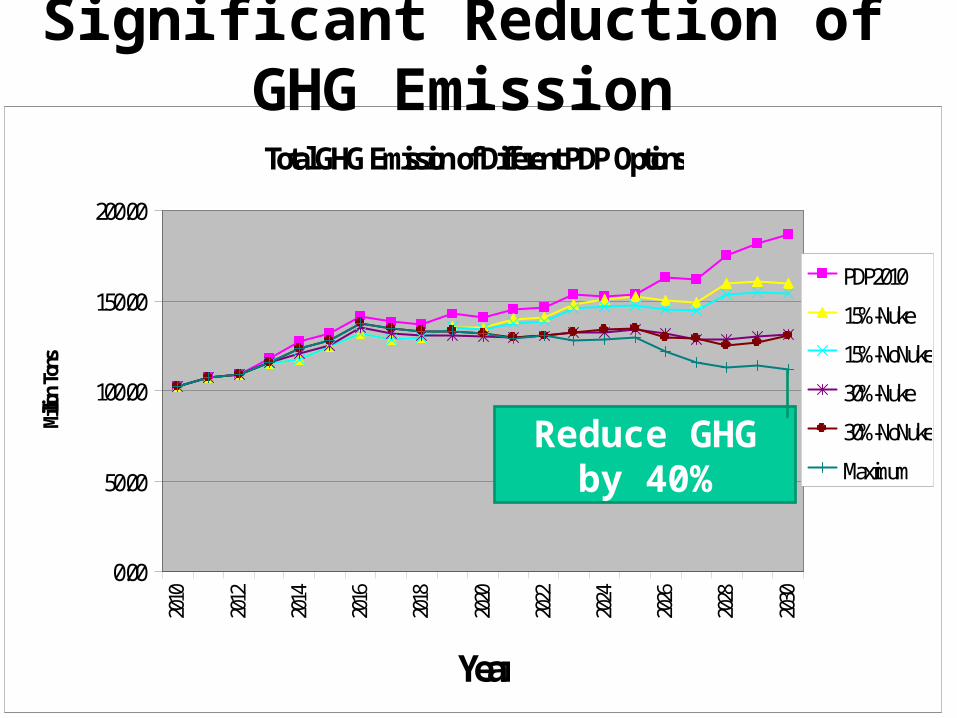
Total GHG Emission of Different PDP Options
0.00
50.00
100.00
150.00
200.00201
0
2012
2014
2016
2018
2020
2022
2024
2026
2028
2030
Year
Million
Tons
PDP201015%-Nuke15%-NoNuke30%-Nuke30%-NoNukeMaximum
Reduce GHG by 40%
Significant Reduction of GHG Emission
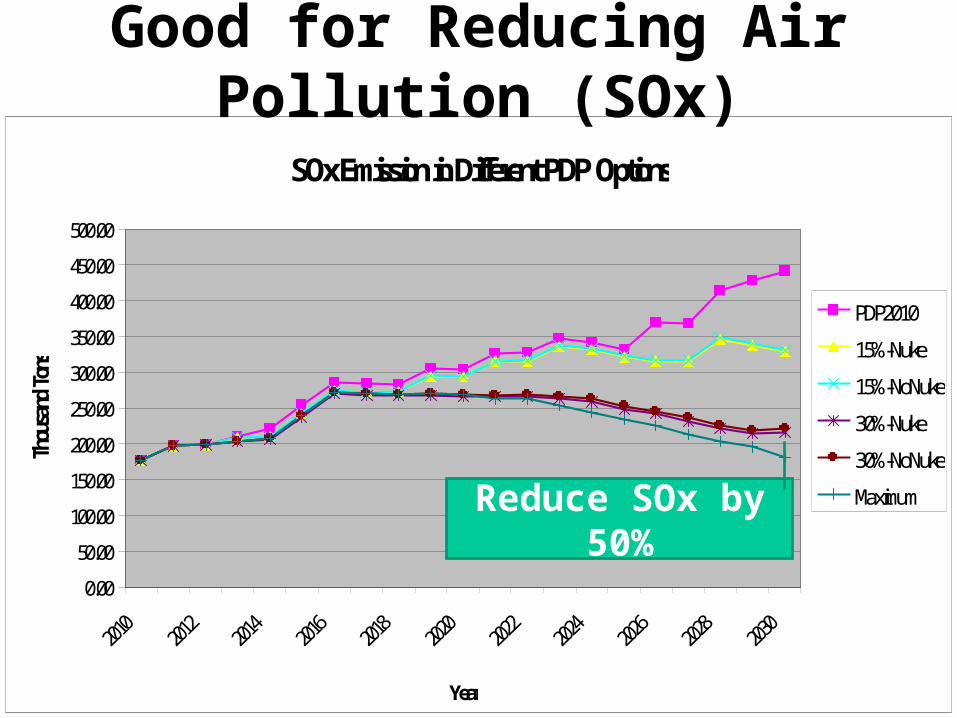
SOx Emission in Different PDP Options
0.0050.00
100.00150.00200.00250.00300.00350.00400.00450.00500.00
Year
Thousa
nd Ton
s
PDP201015%-Nuke15%-NoNuke30%-Nuke30%-NoNukeMaximumReduce SOx by
50%
Good for Reducing Air Pollution (SOx)
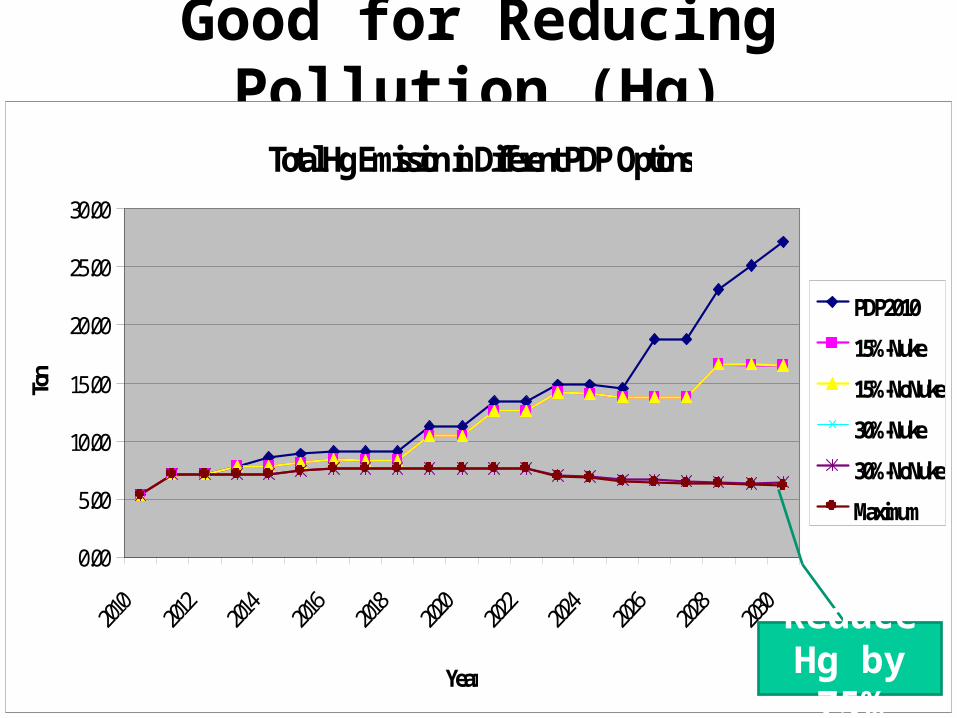
Good for Reducing Pollution (Hg)Total Hg Emission in Different PDP Options
0.00
5.00
10.00
15.00
20.00
25.00
30.00
Year
Ton
PDP201015%-Nuke15%-NoNuke30%-Nuke30%-NoNukeMaximum
Reduce Hg by 75%
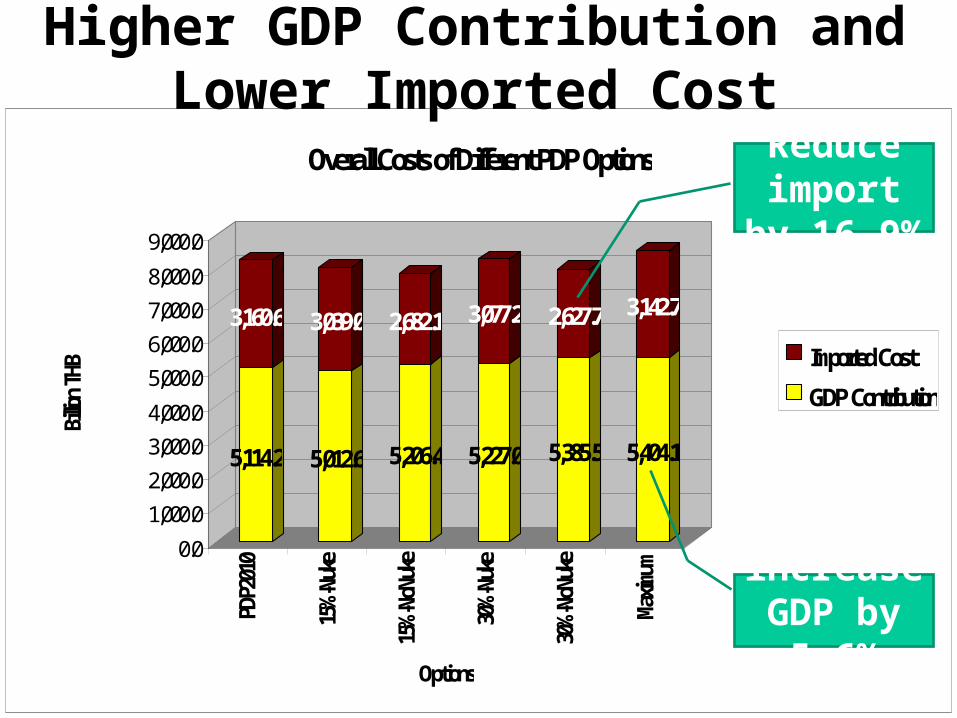
5,114.2
3,160.6
5,012.6
3,039.0
5,206.4
2,682.1
5,227.0
3,077.2
5,385.5
2,627.7
5,404.1
3,142.7
0.01,000.02,000.03,000.04,000.05,000.06,000.07,000.08,000.09,000.0
Billion
THB
PDP20
10
15%-Nu
ke
15%-No
Nuke
30%-Nu
ke
30%-No
Nuke
Maxim
umOptions
Overall Costs of Different PDP Options
Imported CostGDP Contribution
increase GDP by 5.6%
Reduce import
by 16.9%
Higher GDP Contribution and Lower Imported Cost
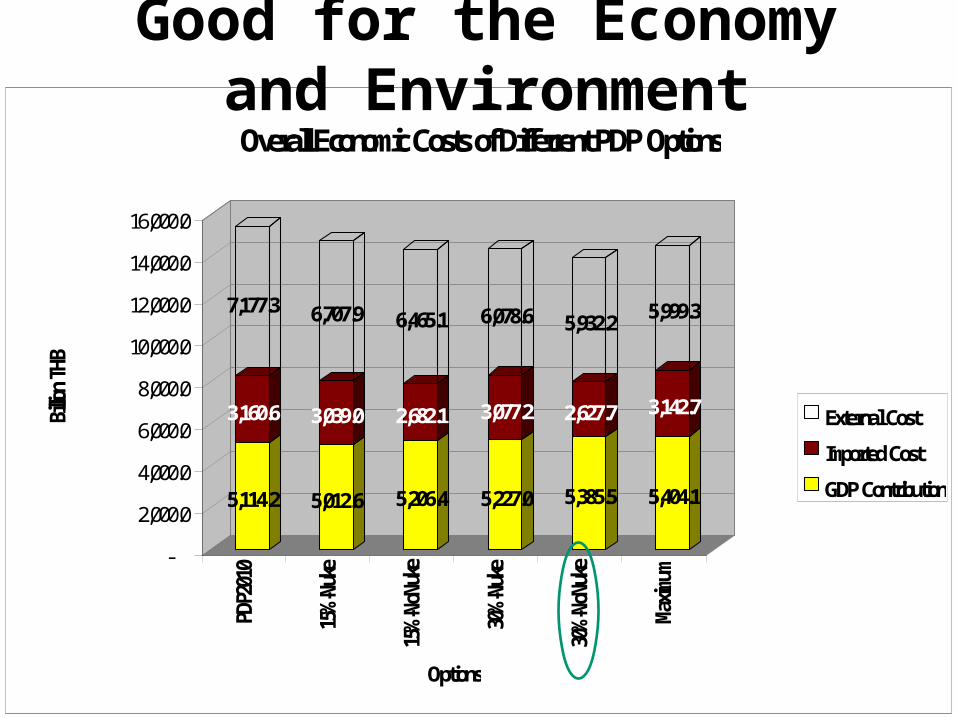
5,114.2
3,160.6
7,177.3
5,012.6
3,039.0
6,707.9
5,206.4
2,682.1
6,465.1
5,227.0
3,077.2
6,078.6
5,385.5
2,627.7
5,932.2
5,404.1
3,142.7
5,999.3
-2,000.04,000.06,000.08,000.0
10,000.012,000.014,000.016,000.0
Billion
THB
PDP20
10
15%-Nu
ke
15%-No
Nuke
30%-Nu
ke
30%-No
Nuke
Maxim
umOptions
Overall Economic Costs of Differrent PDP Options
External CostImported CostGDP Contribution
Good for the Economy and Environment
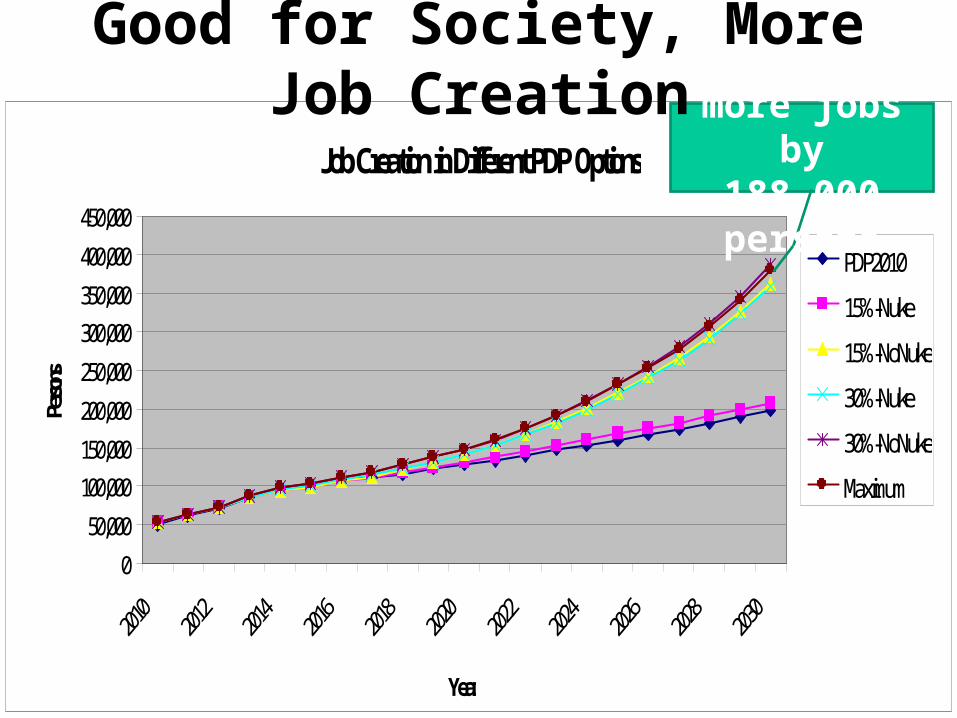
Job Creation in Different PDP Options
050,000
100,000150,000200,000250,000300,000350,000400,000450,000
Year
Perso
ns
PDP201015%-Nuke15%-NoNuke30%-Nuke30%-NoNukeMaximum
Create more jobs
by18800
0 persons
Good for Society, More Job Creation
Institutional Improvements on PDP:The policy network
• Expanding from mainly local communities against projects, NGOs, and some academics
• To different parts of the society, for example, consumer networks, community energy movement, National Human Rights Commission, several Ministries, Senate committee, the regulators, as well as EGAT and Ministry of Energy
• The network itself was transformed from ‘physical’ network to ‘coordinate by contents’ and more open aiming at social learning process on PDP
Institutional Improvements on PDP:The role of private sector
• The group on renewable energy, SPP and VSPP, was rather active, but conservative on pushing for change.
• The large power companies, IPP, have been passive to push for changes.
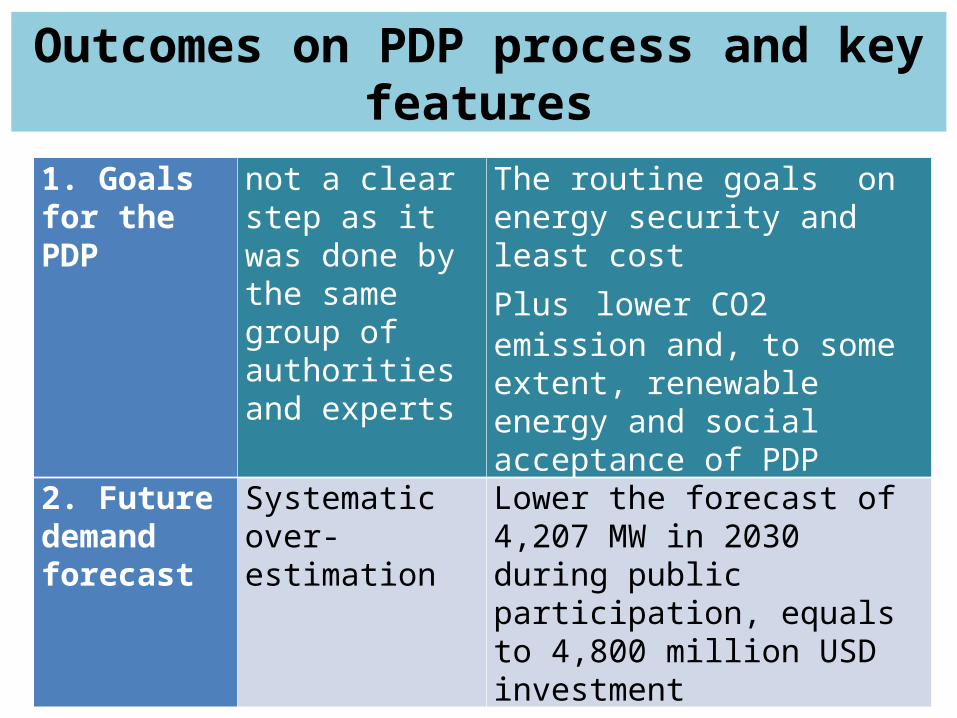
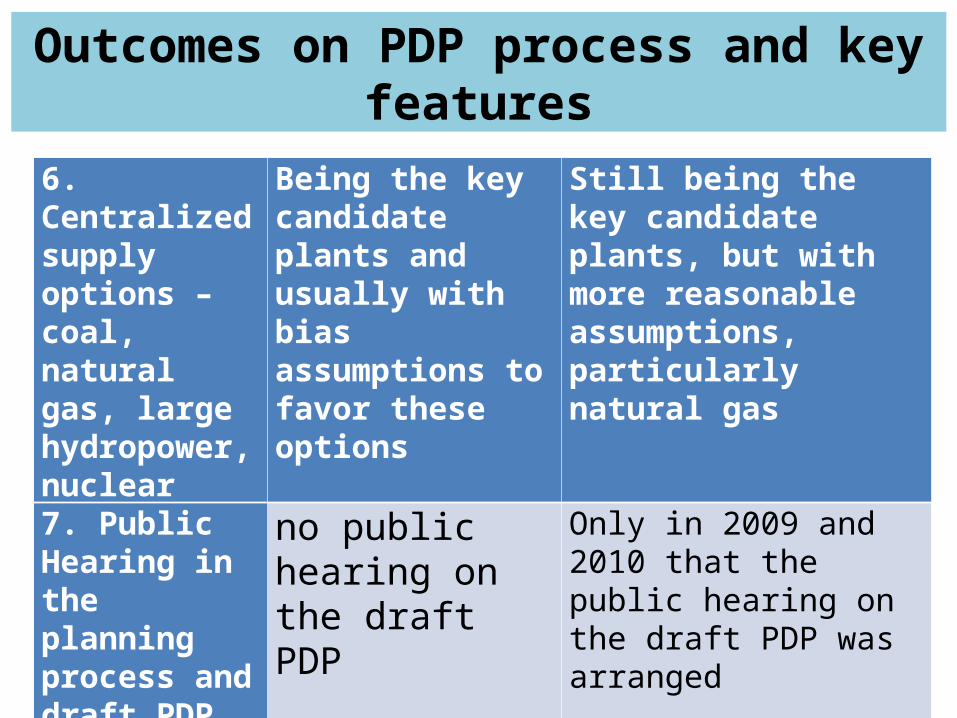
Outcomes on PDP process and key features
1. Goals for the PDP
not a clear step as it was done by the same group of authorities and experts
The routine goals on energy security and least costPlus lower CO2 emission and, to some extent, renewable energy and social acceptance of PDP
2. Future demand forecast
Systematic over-estimation
Lower the forecast of 4,207 MW in 2030 during public participation, equals to 4,800 million USD investment

Outcomes on PDP process and key features
3. DSM and EE Not consider in the planning process
Integrate DSM in load forecast and the generation expansion (but with extremely low figure)
4. Renewable energy
Not consider majority of RE projects as dependable capacity
Include the re-estimated RE target and approved dependable capacity of each RE technology
5. Combined Heat and Power (CHP)
Problems in the continuity of the policy on buying electricity from new CHP projects
Include CHP of 7,177 MW within 2030
Outcomes on PDP process and key features
6. Centralized supply options – coal, natural gas, large hydropower, nuclear
Being the key candidate plants and usually with bias assumptions to favor these options
Still being the key candidate plants, but with more reasonable assumptions, particularly natural gas
7. Public Hearing in the planning process and draft PDP
no public hearing on the draft PDP
Only in 2009 and 2010 that the public hearing on the draft PDP was arranged
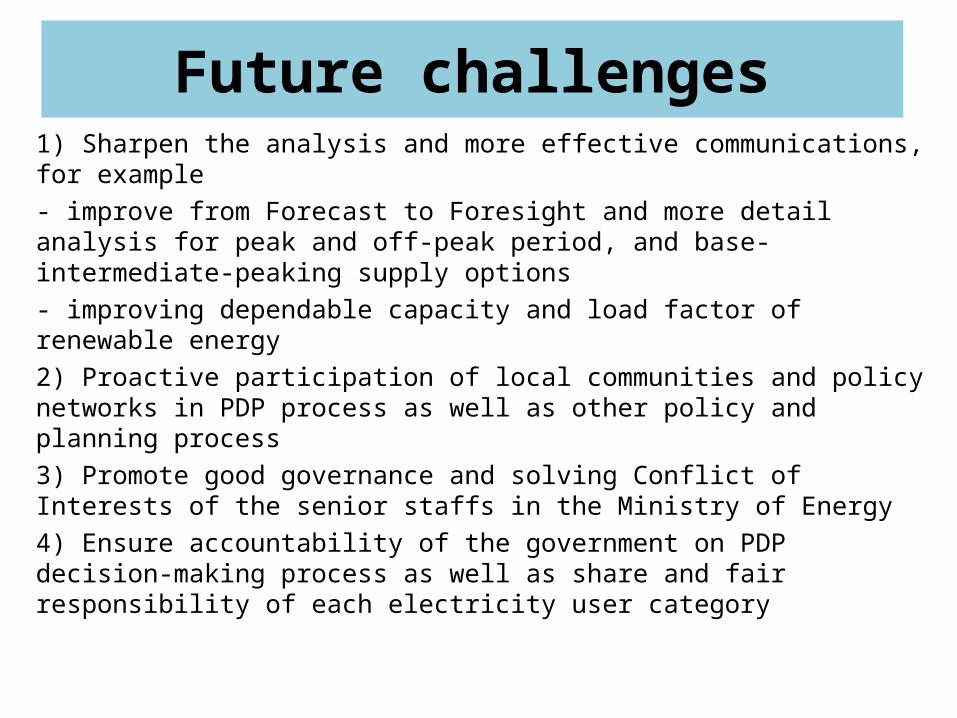
Future challenges1) Sharpen the analysis and more effective communications,for example- improve from Forecast to Foresight and more detail analysis for peak and off-peak period, and base-intermediate-peaking supply options- improving dependable capacity and load factor of renewable energy2) Proactive participation of local communities and policy networks in PDP process as well as other policy and planning process3) Promote good governance and solving Conflict of Interests of the senior staffs in the Ministry of Energy4) Ensure accountability of the government on PDP decision-making process as well as share and fair responsibility of each electricity user category

Thank youThank youfor your attentionfor your attention
35