Embed Size (px)
Citation preview
Supplement to Science
AAAS is here – connecting government to the scientifi c community.
As a part of its efforts to introduce fully open government, the White House is reaching out to the scientifi c community for a conversation around America’s national scientifi c and technological priorities.
To enable the White House’s dialogue with scientists, AAAS launched Expert Labs, under the direction of blogger and tech guru Anil Dash. Expert Labs is building online tools that allow government agencies to ask questions of the scientifi c community and then sort and rank the answers they receive.
On April 12, 2010, AAAS asked scientists everywhere to submit their ideas to the Obama administration and at the same time launched the fi rst of Expert Labs tools, Think Tank, to help policy makers collect the subsequent responses. The result was thousands of responses to the White House’s request, many of which are already under consideration by the Offi ce of Science and Technology Policy.
As a AAAS member, your dues support our efforts to help government base policy on direct feedback from the scientifi c community. If you are not already a member, join us. Together we can make a difference.
To learn more, visit aaas.org/plusyou/expertlabs

1
2 Into the Depths Sean Sanders
3 Revisiting the Ocean's Carbon Cycle Farooq Azam and Nianzhi Jiao
PREFACES
5 The Invisible Hand Behind A Vast Carbon Reservoir Richard Stone
7 Microbial Control of Oceanic Carbon Flux: The Plot Thickens Farooq Azam
9 Production of Refractory Dissolved Organic Matter by Bacteria Hiroshi Ogawa, Yukio Amagai, Isao Koike, Karl Kaiser, Ronald Benner
13 Bulk Chemical Characteristics of Dissolved Organic Matter in the Ocean Ronald Benner, J. Dean Paulski, Matthew McCarthy, John I. Hedges, Patrick G. Hatcher
16 Microbes, Molecules, and Marine Ecosystems Farooq Azam and Alexandra Z. Worden
18 Major Bacterial Contribution to Marine Dissolved Organic Nitrogen Matthew D. McCarthy, John I. Hedges, Ronald Benner
22 Dissolved Organic Carbon Support of Respiration in the Dark Ocean Javier Arísteguí, Carlos M. Duarte, Susana Agustí, Marylo Doval, Xosé A. Álvarez-Salgado, Dennis A. Hansell
23 Community Genomics Among Stratified Microbial Assemblages in the Ocean's Interior Edward F. DeLong, Christina M. Preston, Tracy Mincer, Virginia Rich, Steven J. Hallam, Niels-Ulrik Frigaard, Asuncion Martinez, Matthew B. Sullivan, Robert Edwards, Beltran Rodriguez Brito, Sallie W. Chisholm, David M. Karl
31 Variability in Radiocarbon Ages of Individual Organic Compounds from Marine Sediments Timothy I. Eglinton, Bryan C. Benitez-Nelson, Ann Pearson, Ann P. McNichol, James E. Bauer, Ellen R. M. Druffel
35 Lipid-Like Material as the Source of the Uncharacterized Organic Carbon in the Ocean Jeomshik Hwang and Ellen R. M. Druffel
38 Two Chemically Distinct Pools of Organic Nitrogen Accumulate in the Ocean Lihini I. Aluwihare, Daniel J. Repeta, Silvio Pantoja, Carl G. Johnson
CHAPTER ONE
CHAPTER TWO43 Microbial Carbon Pump and its Significance for Carbon Sequestration in the Ocean Nianzhi Jiao and Farooq Azam
46 Bacterially Derived Dissolved Organic Matter in the Microbial Carbon Pump Ronald Benner and Gerhard J. Herndl
49 Role of Photoheterotrophic Bacteria in the Marine Carbon Cycle Michal Koblížek
52 Microbial Heterotrophic Metabolic Rates Constrain the Microbial Carbon Pump Carol Robinson and Nagappa Ramaiah
54 Virus-Mediated Redistribution and Partitioning of Carbon in the Global Oceans Markus G. Weinbauer, Feng Chen, Steven W. Wilhelm
57 DOC Persistence and its Fate After Export Within the Ocean Interior Craig A. Carlson, Dennis A. Hansell, Christian Tamburini
60 Molecular Characterization of Dissolved Organic Matter and Constraints for Prokaryotic Utilization Gerhard Kattner, Meinhard Simon, Boris P. Koch
62 Shedding Light on a Black Box: UV-Visible Spectroscopic Characterization of Marine Dissolved Organic Matter Colin A. Stedmon and Xosé Antón Álvarez-Salgado
64 Application of Functional Gene Arrays (GeoChips) in Monitoring Carbon Cycling Joy D. Van Nostrand and Jizhon Zhou
66 Toward a Mechanistic Approach to Modeling Bacterial DOC Pathways: A Review Marie Eichinger, Jean-Christophe Poggiale, Richard Sempéré
© 2011 by The American Association for the Advancement of Science. All rights reserved.
Front image (background) © istockphoto.com/BobHemphill
13 May 2011
Front and back cover images adapted from Jiao, N. et al., Nature Reviews Microbiology, 8, 593 (2010).
CONTENTS
Microbes. Those unassuming and unseen inhabitants, occupying almost every niche on land and sea, have once more been found to have importance far beyond their physical stature. Microbes have been found living thousands of meters above sea level on Mount Everest, as well as in the deepest oceans, withstanding extraordinary hydrostatic pressure. Many scientists are familiar with Thermus aquaticus, a thermophilic microbe that can survive temperatures upwards of 70°C, discovered in a geyser in the Yellow Stone National Park and source of the first thermostable DNA polymerase, the eponymously named Taq. Microbes related to T. aquaticus even live at the deep-sea hydrothermal vents, often mak-ing use of sulfur from these vents as a source of energy. But in the water columns between the deep-sea vents and ocean surface lives an extraordinarily diverse range of interconnected microbial populations that are only now being characterized and understood. More importantly, scientists are uncovering new roles that these microbes play in the ocean carbon cycle and, consequently, in the global climate.
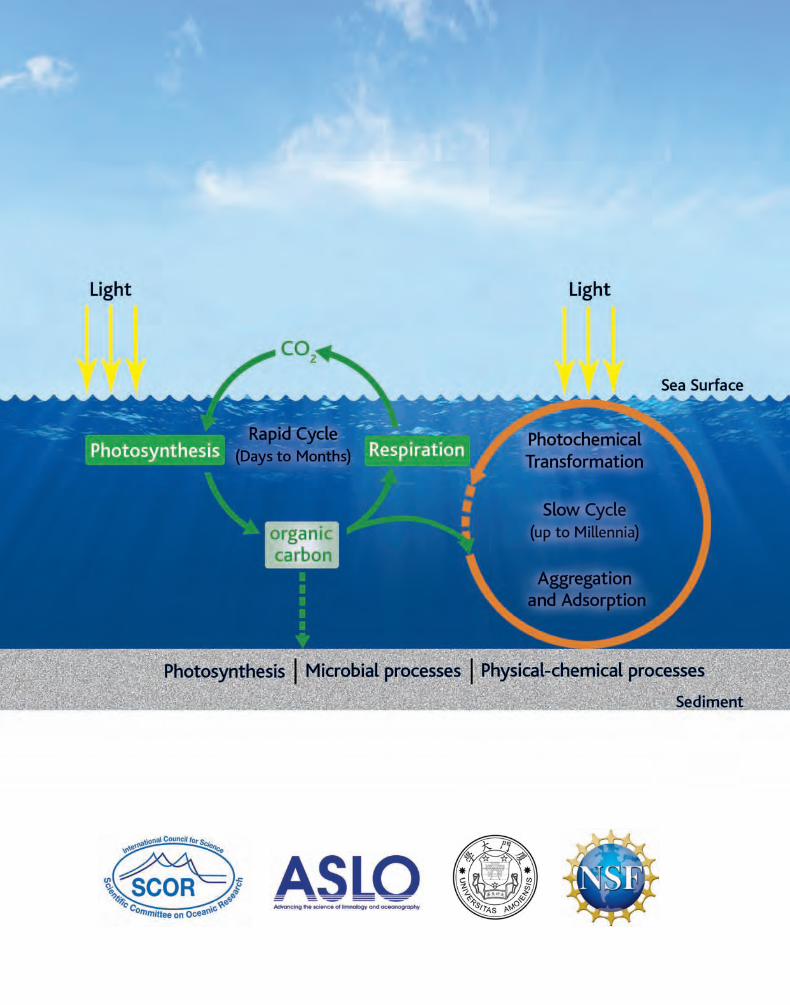
This volume seeks to bring together both the historical and the current research on this topic. In the first chapter are presented a selection of papers published in the last 20 years in Science that have helped us understand the chemical makeup of dissolved organic matter (DOM), how the carbon con-tained in them enters and exits the ocean carbon cycle, and how ocean-dwelling microbes interact with this cycle. Originally suspected to only assimilate or respire DOM, both Bacteria and Archaea have been demonstrated to play a much broader and more important role, in fact being integral cogs in the carbon cycle machine. The recently described microbial carbon pump (MCP), pictured on the cover of this booklet, provides a framework that describes how microbes are also DOM creators and, more importantly, contributors to the creation of refractory DOM (RDOM), a persistent form of DOM that can survive for thousands of years, constituting a previously undescribed mechanism of carbon seques- mechanism of carbon seques- of carbon seques-tration.
The second chapter brings us right up to the present day with 10 review articles from some of the leading international scientists in a variety of fields—including marine biogeochemistry, microbiology, and genomics—who put the past three decades of work in perspective and give us a glimpse of where the research might take us in the near future. Covering ground from describing possible ways to model the MCP, to the contribution of virus activity to the creation of RDOM, to discussions of the underlying biochemical and molecular mechanisms at play in the MCP, these articles—vetted and reviewed by fellow scientists within the Scientific Committee for Oceanic Research working group—promise to be both enlightening and provocative.
Understanding and fully characterizing the MCP provides us with critical knowledge needed to refine current models of the ocean carbon cycle so that we may better predict its response to increases in atmospheric CO2. Through this research, it should be possible to define the resilience of the ocean carbon cycle and its relationship to global climate. This will benefit climate change research as well as provide a robust scientific basis for crafting climate policy. Gaining a deeper understanding of these diverse and often unique microbial inhabitants in our oceans may also allow us to make them our allies as we face future uncertainties for our climate.
Sean Sanders, Ph.D.Editor, Science/AAAS Custom Publishing
2
Dr. Sanders completed his undergraduate training at the University of Cape Town, South Africa, and his Ph.D. at the University of Cambridge, United Kingdom. Following postdoctoral training at the National Institutes of Health and Georgetown University, he worked for three years at a biotechnology startup before moving into editing. Dr. Sanders is currently the Editor, Custom Publishing for the journal Science and Science Careers, and Program Director for Outreach.
Into the Depths
3
Whether the ocean could serve as a repository for anthropogenic CO2, as it has for other human wastes, has prompted intense interest and inquiry into ocean carbon biogeochemistry. Fully one-half of global photosynthesis occurs in the ocean. It generates huge amounts of organic matter that is acted on by diverse biological and physical forces that modify, decompose, and redistribute its constituents in the ocean space in timeframes of hours to millennia. Most carbon is rapidly respired back to CO2 by the diverse biota, while a minuscule fraction sinks, or is actively transported by biota, to the sea bottom (the “biological pump”). There, some of it is respired by the sediment microbes, while the remainder becomes part of the sediment. The biological pump has also been invoked in studies of the fate of an-thropogenic pollutants entering the ocean, including radionuclides, to assess whether their association with sinking particles will rid us of them for long periods of time.
We now know that a large fraction of photosynthetically produced organic matter in fact becomes dis-solved organic matter (DOM) by a variety of physiological and trophic mechanisms; hence, we need to know the biogeochemical behavior of DOM as well. While microbes readily respire most newly pro-duced DOM, might a small fraction be (or become) refractory and join the enormous refractory DOM (RDOM) pool present in ocean water column, with turnover times of millennia? Even minor changes in RDOM concentration could significantly affect carbon sequestration in the ocean with consequences for the climate. The origin and fate of RDOM, and the underlying mechanisms for its formation and degradation are unknown. Why marine microbes are not able to degrade RDOM is still under investi� Why marine microbes are not able to degrade RDOM is still under investi�Why marine microbes are not able to degrade RDOM is still under investi-gation though their inability to do so is fortunate: if all RDOM were respired and the carbon released to the atmosphere, it would double the atmospheric CO2 inventory. Looking at the other side of the equation we can ask: Do bacteria play a major role in the production of RDOM? Further, might the balance between microbial degradation of DOM and production of RDOM shift due to climate change and might the response of the RDOM pool exacerbate climate change impacts through a positive feed-back loop? These are new challenges for climate change microbial ecology.
Progress in elucidating the role of microbes in carbon sequestration in the ocean had been limited not only by methodological limitations, but also by the lack of a unifying biogeochemical framework. In recent years, there has been a powerful convergence of marine genomics, ecophysiology, and new tools for DOM analysis. Therefore, the time is ripe for a fresh look at this “refractory” and important problem. The microbial carbon pump (MCP; Jiao et al. 2010. Nat Rev Microbiol. 8, 593–599) was pro-posed as a conceptual framework to formulate and test new hypotheses about DOM sources and sinks as well as the mechanistic bases for the regulation of microbial carbon storage in the refractory DOM pool. This research is necessarily highly interdisciplinary involving, at the minimum, microbial ocean-ographers, marine organic chemists, and geochemists.
A SCOR (Scientific Committee for Oceanic Research) working group (WG134) joined by 26 scientists from 12 countries has been formed to address the problem. In the past two years, the working group has convened several independent workshops, as well as MCP-focused sessions in conjunction with oceanography and microbial ecology conferences. These brainstorming sessions have provided the necessary, and rapidly broadening, interdisciplinary interactions, creating much excitement and mo-mentum. It is our hope that the articles in this book convey this sense of excitement, and an optimism that we are making progress in solving this long-standing problem in science, one which is also of considerable societal import.
Farooq Azam, Ph.D.Nianzhi Jiao, Ph.D.
Dr. Farooq Azam studies microbial oceanography and marine biogeochemistry. Dr. Azam and his students have made significant contributions to our understanding of the role of microbes in the functioning of marine ecosystems and carbon cycle. Dr. Azam is a Distinguished Professor at Scripps Institution of Oceanography, University of California, San Diego and co�chairs the Scientific Committee for Ocean Research (SCOR) Working Group 134 on “Microbial Carbon Pump in the Ocean.”
Dr. Nianzhi Jiao is Cheung Kong Chair Professor at Xiamen University, China. After receiving his Ph.D. from Ocean University of Qingdao in 1991, he continued his studies at MIT in the United States, the University of Tokyo, and the National Institute for Environmental Studies, Japan. Dr. Jiao’s research focuses on microbial ecology and carbon cycling. He is a co�chair of the Scientific Committee for Ocean Research (SCOR) Working Group 134 on “Microbial Carbon Pump in the Ocean.”
Revisiting the Ocean's Carbon Cycle

4
Chapter One

518 JUNE 2010 VOL 328 SCIENCE www.sciencemag.org 1476
NEWSFOCUS
CR
ED
ITS:
CO
URT
ESY
OF
JIA
O N
IAN
ZHI
XIAMEN, CHINA—For simple sea creatures, dissolved organic carbon (DOC) is the staff of life. Much of it, however, is as unpalatable as chaff and accumulates in the water column. Scientists are unraveling how organic matter in the marine food chain is converted into forms that less readily relinquish carbon in the form of carbon dioxide (CO
2). “The exis-
tence of this ‘inedible’ organic carbon in the ocean has been known for quite some time. But its role in the global carbon cycle has been recognized only recently,” says Michal Koblizek, a microbiologist at the Institute of Microbiology in Trebon, Czech Republic.
New fi ndings are unmasking the invisible processes that suspend immense amounts of carbon just below the ocean waves. “It’s really huge. It’s comparable to all the carbon diox-ide in the air,” says Jiao Nianzhi, a micro-bial ecologist here at Xiamen University. He and others are exploring the tantalizing prospect of sequestering CO
2 in this reser-
voir. It’s too early to say whether the vast pool will respond to geoengineering, says Dennis Hansell, a marine biogeochemist at the University of Miami in Florida. However, he says, “I expect the light to come on over heads and we’ll experience an ‘ah ha!’ moment.”
Data from several research cruises have yielded a broad-brush view of what Jiao has dubbed the microbial carbon pump (MCP): the microbe-driven conversion of bioavail-able organic carbon into diffi cult-to-digest forms known as refractory DOC. This sum-mer, the European Project on Ocean Acidifi -cation is carrying out a slate of experiments in Arctic waters that includes probing the MCP. Then in October, Jiao’s team heads to the opposite thermal extreme: They will explore the mechanisms of the MCP and CO
2
sequestration in the equatorial Indo-Pacifi c Warm Pool, the warmest marine waters in the world. The MCP will also be featured next month at a Gordon Research Confer-ence on marine microbes, and it is outlined in a paper in press at Nature Reviews Micro-biology. The concept “could revolution-ize our view of carbon sequestration,” says Markus Weinbauer, a microbial oceanog-rapher at Laboratoire d’Océanographie de Villefranche in France.
The ocean surface is like a planet-sized set of lungs that inhale and exhale CO
2. As a global average, the
oceans take up about 2% more of the gas than they release. Some CO
2 dis-
solves into the water column, form-ing carbonic acid. As atmospheric CO
2 levels rise, ocean pH decreases,
a phenomenon called acidification that could endanger corals and other creatures by slowing the growth of carbonate skeletons (see p. 1500). Carbon also enters the seas through the food web: During photo-synthesis, phytoplankton fi xes CO
2 to organic car-
bon—as much as 60 gigatons of carbon per year, roughly the same amount f ixed on land. “The carbon is not captured for long,” says Koblizek. Most new marine bio-mass is consumed in days and returned to the air as CO
2.
Some, however, ends up in the deep ocean sink, when remains of dead organisms fall to the sea fl oor. Each year, this biological pump deposits roughly 300 million tons of carbon in the seabed.
Even more massive amounts of carbon are suspended in the water column as DOC. The oceans hold an estimated 700 billion tons of carbon as DOC—more than all land biomass put together (600 billion tons of carbon) and nearly as much as all the CO
2
in the air (750 billion tons of carbon). About 95% of organic carbon is bound up as refractory DOC: “the largest pool of organic matter in the ocean,” says Farooq Azam, a microbiologist at Scripps Institution of Oceanography in San Diego, California. In the December 2009 issue of Oceanography, a team led by Hansell and Craig Carlson of the University of California, Santa Barbara, compiled the fi rst global map of DOC dis-tribution. Carbon-14 studies suggest that refractory compounds swirl in this micro-bial eddy for more than 6000 years, several times the circulation time of the ocean.
The realization that refractory DOC is a key element in the global
carbon cycle has lit a fi re under efforts to fi gure out what the stuff is and where it comes from. Researchers now know that refractory DOC consists of thousands of compounds, such as complex polysaccharides and humic acids. A team led by Xosé Antón Álvarez Salgado of the Instituto de Investigaciones Marinas in Vigo, Spain, has tracked the con-version of some forms of bioavailable carbon to refractory carbon by observing changes in their optical properties: Humic substances absorb UV light and re-emit it as blue fl uo-rescence at specifi c wavelengths.
The origins of most refractory DOC are a black box. Some is produced when light degrades organic matter near the ocean sur-face. Oil seeps contribute to the pool. “The oil spill in the Gulf of Mexico is just one drastic example of how this material is released into the ocean,” says Meinhard Simon, a micro-bial oceanographer at the University of Old-enburg in Germany. Other compounds are likely forged in underwater vents or in wild-fi res and swept into the sea. For the most part, however, says Azam, “we lack understanding of the mechanisms of its formation or varia-tions in its magnitude and composition.”
The Invisible Hand Behind A Vast Carbon ReservoirA key element of the carbon cycle is the microbial conversion of dissolved organic carbon into inedible forms. Can it also serve to sequester CO
2?
M A R I N E B I O G E O C H E M I ST RY
DOC doc. Jiao Nianzhi formulated the MCP concept based on his studies of AAPB, an unusual kind of photo-synthetic bacteria (left).
0618NewsFocus.indd 1476 6/14/10 5:12:41 PM
18 JUNE 2010 VOL 328 SCIENCE www.sciencemag.org 1476
NEWSFOCUS
CR
ED
ITS:
CO
URT
ESY
OF
JIA
O N
IAN
ZHI
XIAMEN, CHINA—For simple sea creatures, dissolved organic carbon (DOC) is the staff of life. Much of it, however, is as unpalatable as chaff and accumulates in the water column. Scientists are unraveling how organic matter in the marine food chain is converted into forms that less readily relinquish carbon in the form of carbon dioxide (CO
2). “The exis-
tence of this ‘inedible’ organic carbon in the ocean has been known for quite some time. But its role in the global carbon cycle has been recognized only recently,” says Michal Koblizek, a microbiologist at the Institute of Microbiology in Trebon, Czech Republic.
New fi ndings are unmasking the invisible processes that suspend immense amounts of carbon just below the ocean waves. “It’s really huge. It’s comparable to all the carbon diox-ide in the air,” says Jiao Nianzhi, a micro-bial ecologist here at Xiamen University. He and others are exploring the tantalizing prospect of sequestering CO
2 in this reser-
voir. It’s too early to say whether the vast pool will respond to geoengineering, says Dennis Hansell, a marine biogeochemist at the University of Miami in Florida. However, he says, “I expect the light to come on over heads and we’ll experience an ‘ah ha!’ moment.”
Data from several research cruises have yielded a broad-brush view of what Jiao has dubbed the microbial carbon pump (MCP): the microbe-driven conversion of bioavail-able organic carbon into diffi cult-to-digest forms known as refractory DOC. This sum-mer, the European Project on Ocean Acidifi -cation is carrying out a slate of experiments in Arctic waters that includes probing the MCP. Then in October, Jiao’s team heads to the opposite thermal extreme: They will explore the mechanisms of the MCP and CO
2
sequestration in the equatorial Indo-Pacifi c Warm Pool, the warmest marine waters in the world. The MCP will also be featured next month at a Gordon Research Confer-ence on marine microbes, and it is outlined in a paper in press at Nature Reviews Micro-biology. The concept “could revolution-ize our view of carbon sequestration,” says Markus Weinbauer, a microbial oceanog-rapher at Laboratoire d’Océanographie de Villefranche in France.
The ocean surface is like a planet-sized set of lungs that inhale and exhale CO
2. As a global average, the
oceans take up about 2% more of the gas than they release. Some CO
2 dis-
solves into the water column, form-ing carbonic acid. As atmospheric CO
2 levels rise, ocean pH decreases,
a phenomenon called acidification that could endanger corals and other creatures by slowing the growth of carbonate skeletons (see p. 1500). Carbon also enters the seas through the food web: During photo-synthesis, phytoplankton fi xes CO
2 to organic car-
bon—as much as 60 gigatons of carbon per year, roughly the same amount f ixed on land. “The carbon is not captured for long,” says Koblizek. Most new marine bio-mass is consumed in days and returned to the air as CO
2.
Some, however, ends up in the deep ocean sink, when remains of dead organisms fall to the sea fl oor. Each year, this biological pump deposits roughly 300 million tons of carbon in the seabed.
Even more massive amounts of carbon are suspended in the water column as DOC. The oceans hold an estimated 700 billion tons of carbon as DOC—more than all land biomass put together (600 billion tons of carbon) and nearly as much as all the CO
2
in the air (750 billion tons of carbon). About 95% of organic carbon is bound up as refractory DOC: “the largest pool of organic matter in the ocean,” says Farooq Azam, a microbiologist at Scripps Institution of Oceanography in San Diego, California. In the December 2009 issue of Oceanography, a team led by Hansell and Craig Carlson of the University of California, Santa Barbara, compiled the fi rst global map of DOC dis-tribution. Carbon-14 studies suggest that refractory compounds swirl in this micro-bial eddy for more than 6000 years, several times the circulation time of the ocean.
The realization that refractory DOC is a key element in the global
carbon cycle has lit a fi re under efforts to fi gure out what the stuff is and where it comes from. Researchers now know that refractory DOC consists of thousands of compounds, such as complex polysaccharides and humic acids. A team led by Xosé Antón Álvarez Salgado of the Instituto de Investigaciones Marinas in Vigo, Spain, has tracked the con-version of some forms of bioavailable carbon to refractory carbon by observing changes in their optical properties: Humic substances absorb UV light and re-emit it as blue fl uo-rescence at specifi c wavelengths.
The origins of most refractory DOC are a black box. Some is produced when light degrades organic matter near the ocean sur-face. Oil seeps contribute to the pool. “The oil spill in the Gulf of Mexico is just one drastic example of how this material is released into the ocean,” says Meinhard Simon, a micro-bial oceanographer at the University of Old-enburg in Germany. Other compounds are likely forged in underwater vents or in wild-fi res and swept into the sea. For the most part, however, says Azam, “we lack understanding of the mechanisms of its formation or varia-tions in its magnitude and composition.”
The Invisible Hand Behind A Vast Carbon ReservoirA key element of the carbon cycle is the microbial conversion of dissolved organic carbon into inedible forms. Can it also serve to sequester CO
2?
M A R I N E B I O G E O C H E M I ST RY
DOC doc. Jiao Nianzhi formulated the MCP concept based on his studies of AAPB, an unusual kind of photo-synthetic bacteria (left).
0618NewsFocus.indd 1476 6/14/10 5:12:41 PM
XIAMEN, CHINA—For simple sea crea-tures, dissolved organic carbon (DOC) is the staff of life. Much of it, however, is as unpalatable as chaff and accumulates in the water column. Scientists are unravel-ing how organic matter in the marine food chain is converted into forms that less read-ily relinquish carbon in the form of carbon dioxide (CO2). “The existence of this ‘ined-ible’ organic carbon in the ocean has been known for quite some time. But its role in the global carbon cycle has been recognized only recently,” says Michal Koblížek, a micro-biologist at the Institute of Microbiology in Trebon, Czech Republic.
New findings are unmasking the invisi-ble processes that suspend immense amounts of carbon just below the ocean waves. “It’s really huge. It’s comparable to all the car-bon dioxide in the air,” says Jiao Nianzhi, a microbial ecologist here at Xiamen Univer-sity. He and others are exploring the tantaliz-ing prospect of sequestering CO2 in this reser-voir. It’s too early to say whether the vast pool will respond to geoengineering, says Dennis Hansell, a marine biogeochemist at the University of Miami in Florida. However, he says, “I expect the light to come on over heads and we’ll experience an ‘ah ha!’ moment.”
Data from several research cruises have yielded a broad-brush view of what Jiao has dubbed the microbial carbon pump (MCP): the microbe-driven conversion of bioavailable organic carbon into difficult-to�digest forms known as refractory DOC. This summer, the European Project on Ocean Acidification is carrying out a slate of experiments in Arctic waters that includes probing the MCP. Then in October, Jiao’s team heads to the opposite thermal extreme: They will explore the mechanisms of the MCP and CO2 sequestration in the equatorial Indo-Pacific Warm Pool, the warmest marine waters in the world. The MCP will also be featured next month at a Gordon Research Conference on marine microbes, and it is outlined in a paper in press at Nature Reviews Microbiology. The concept “could revolutionize our view of carbon sequestration,” says Markus Weinbauer, a microbial oceanographer at Laboratoire d’Océanographie de Villefranche in France.
The ocean surface is like a planet-sized set of lungs that inhale and exhale CO2. As a global average, the oceans take up about 2% more of the gas than they release. Some CO2 dis-solves into the water column, form-ing carbonic acid. As atmospheric CO2 levels rise, ocean pH decreases, a phenomenon called acidification that could endanger corals and other crea-tures by slowing the growth of car-bonate skeletons (see Science 18 June 2010, p. 1500). Carbon also enters the seas through the foodweb: Dur-ing photosynthesis, phy-toplankton fixes CO2 to organic carbon—as much as 60 giga-tons of carbon per year, roughly the same amount fixed on land. “The carbon is not captured for long,” says Koblížek. Most new marine bio-mass is consumed in days and returned to the air as CO2. Some, however, ends up in the deep ocean sink, when remains of dead organisms fall to the sea floor. Each year, this biological pump deposits roughly 300 million tons of carbon in the seabed.
Even more massive amounts of carbon are suspended in the water column as DOC. The oceans hold an estimated 700 billion tons of carbon as DOC—more than all land biomass put together (600 billion tons of carbon) and nearly as much as all the CO2 in the air (750 billion tons of carbon). About 95% of organic carbon is bound up as refractory DOC: “the largest pool of organic matter in the ocean,” says Farooq Azam, a microbiologist at Scripps Institution of Oceanography in San Diego, California. In the December 2009 issue of Oceanography, a team led by Hansell and Craig Carlson of the University of California, Santa Barbara, compiled the first global map of DOC distri-bution. Carbon�14 studies suggest that refrac-tory compounds swirl in this microbial eddy for more than 6000 years, several times the circulation time of the ocean.
The realization that refractory DOC is a key element in the global
carbon cycle has lit a fire under efforts to figure out what the stuff is and where
it comes from. Researchers now know that refractory DOC consists of thousands of compounds, such as complex polysaccha-rides and humic acids. A team led by Xosé Antón Álvarez Salgado of the Instituto de Investigaciones Marinas in Vigo, Spain, has tracked the conversion of some forms of bioavailable carbon to refractory carbon by observing changes in their optical proper-ties: Humic substances absorb UV light and re-emit it as blue fluorescence at specific wavelengths.
The origins of most refractory DOC are a black box. Some is produced when light degrades organic matter near the ocean sur-face. Oil seeps contribute to the pool. “The oil spill in the Gulf of Mexico is just one drastic example of how this material is released into the ocean,” says Meinhard Simon, a micro-bial oceanographer at the University of Old-enburg in Germany. Other compounds are likely forged in underwater vents or in wild-fires and swept into the sea. For the most part, however, says Azam, “we lack understanding of the mechanisms of its formation or varia-tions in its magnitude and composition.”
Originally published 18 June 2010
CRE
DIT
S: (O
PPO
SITE
PA
GE)
PH
OTO
ILLU
STRA
TIO
N S
CIE
NC
E, (I
MA
GE)
© IS
TOC
KPH
OTO
.CO
M/T
AM
MY6
16;
(TH
IS P
AG
E) C
OU
RTES
Y O
F JIA
O N
IAN
ZHI
6
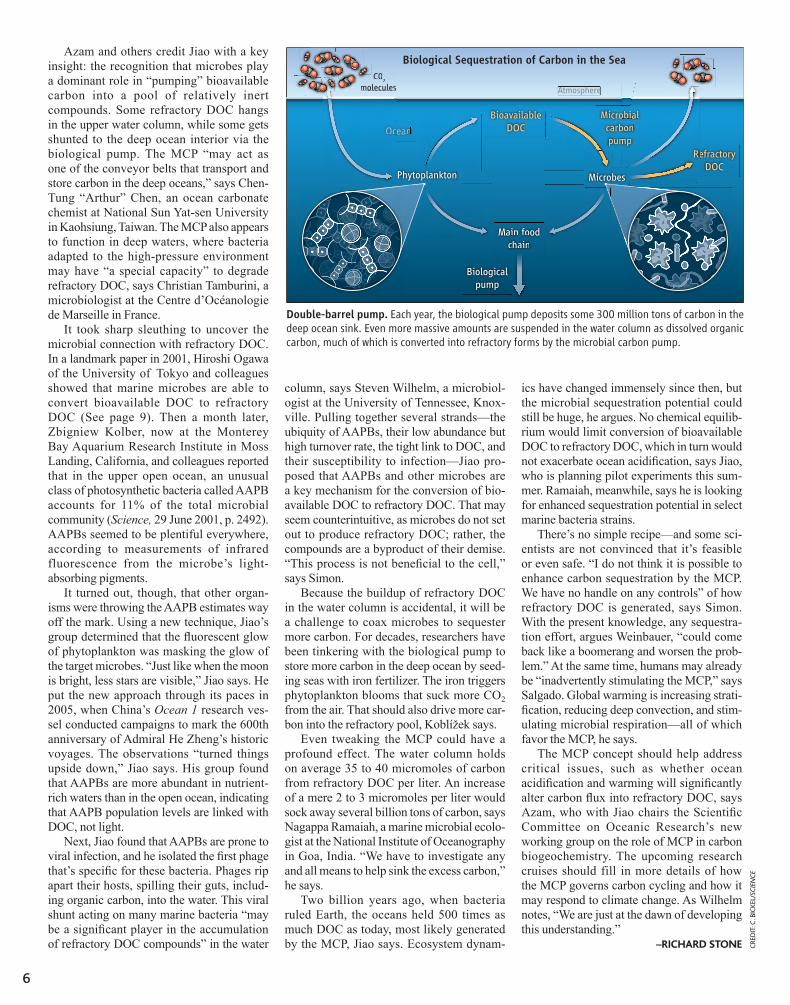
Azam and others credit Jiao with a key insight: the recognition that microbes play a dominant role in “pumping” bioavailable carbon into a pool of relatively inert compounds. Some refractory DOC hangs in the upper water column, while some gets shunted to the deep ocean interior via the biological pump. The MCP “may act as one of the conveyor belts that transport and store carbon in the deep oceans,” says Chen-Tung “Arthur” Chen, an ocean carbonate chemist at National Sun Yat-sen University in Kaohsiung, Taiwan. The MCP also appears to function in deep waters, where bacteria adapted to the high-pressure environment may have “a special capacity” to degrade refractory DOC, says Christian Tamburini, a microbiologist at the Centre d’Océanologie de Marseille in France.
It took sharp sleuthing to uncover the microbial connection with refractory DOC. In a landmark paper in 2001, Hiroshi Ogawa of the University of Tokyo and colleagues showed that marine microbes are able to convert bioavailable DOC to refractory DOC (See page 9). Then a month later, Zbigniew Kolber, now at the Monterey Bay Aquarium Research Institute in Moss Landing, California, and colleagues reported that in the upper open ocean, an unusual class of photosynthetic bacteria called AAPB accounts for 11% of the total microbial community (Science, 29 June 2001, p. 2492). AAPBs seemed to be plentiful everywhere, according to measurements of infrared fluorescence from the microbe’s light�absorbing pigments.
It turned out, though, that other organ-isms were throwing the AAPB estimates way off the mark. Using a new technique, Jiao’s group determined that the fluorescent glow of phytoplankton was masking the glow of the target microbes. “Just like when the moon is bright, less stars are visible,” Jiao says. He put the new approach through its paces in 2005, when China’s Ocean 1 research ves-sel conducted campaigns to mark the 600th anniversary of Admiral He Zheng’s historic voyages. The observations “turned things upside down,” Jiao says. His group found that AAPBs are more abundant in nutrient-rich waters than in the open ocean, indicating that AAPB population levels are linked with DOC, not light.
Next, Jiao found that AAPBs are prone to viral infection, and he isolated the first phage that’s specific for these bacteria. Phages rip apart their hosts, spilling their guts, includ-ing organic carbon, into the water. This viral shunt acting on many marine bacteria “may be a significant player in the accumulation of refractory DOC compounds” in the water
column, says Steven Wilhelm, a microbiol-ogist at the University of Tennessee, Knox-ville. Pulling together several strands—the ubiquity of AAPBs, their low abundance but high turnover rate, the tight link to DOC, and their susceptibility to infection—Jiao pro-posed that AAPBs and other microbes are a key mechanism for the conversion of bio-available DOC to refractory DOC. That may seem counterintuitive, as microbes do not set out to produce refractory DOC; rather, the compounds are a byproduct of their demise. “This process is not beneficial to the cell,” says Simon.
Because the buildup of refractory DOC in the water column is accidental, it will be a challenge to coax microbes to sequester more carbon. For decades, researchers have been tinkering with the biological pump to store more carbon in the deep ocean by seed-ing seas with iron fertilizer. The iron triggers phytoplankton blooms that suck more CO2 from the air. That should also drive more car-bon into the refractory pool, Koblížek says.
Even tweaking the MCP could have a profound effect. The water column holds on average 35 to 40 micromoles of carbon from refractory DOC per liter. An increase of a mere 2 to 3 micromoles per liter would sock away several billion tons of carbon, says Nagappa Ramaiah, a marine microbial ecolo-gist at the National Institute of Oceanography in Goa, India. “We have to investigate any and all means to help sink the excess carbon,” he says.
Two billion years ago, when bacteria ruled Earth, the oceans held 500 times as much DOC as today, most likely generated by the MCP, Jiao says. Ecosystem dynam-
ics have changed immensely since then, but the microbial sequestration potential could still be huge, he argues. No chemical equilib-rium would limit conversion of bioavailable DOC to refractory DOC, which in turn would not exacerbate ocean acidification, says Jiao, who is planning pilot experiments this sum-mer. Ramaiah, meanwhile, says he is looking for enhanced sequestration potential in select marine bacteria strains.
There’s no simple recipe—and some sci-entists are not convinced that it’s feasible or even safe. “I do not think it is possible to enhance carbon sequestration by the MCP. We have no handle on any controls” of how refractory DOC is generated, says Simon. With the present knowledge, any sequestra-tion effort, argues Weinbauer, “could come back like a boomerang and worsen the prob-lem.” At the same time, humans may already be “inadvertently stimulating the MCP,” says Salgado. Global warming is increasing strati-fication, reducing deep convection, and stim-ulating microbial respiration—all of which favor the MCP, he says.
The MCP concept should help address critical issues, such as whether ocean acidification and warming will significantly alter carbon flux into refractory DOC, says Azam, who with Jiao chairs the Scientific Committee on Oceanic Research’s new working group on the role of MCP in carbon biogeochemistry. The upcoming research cruises should fill in more details of how the MCP governs carbon cycling and how it may respond to climate change. As Wilhelm notes, “We are just at the dawn of developing this understanding.”
–RICHARD STONE
www.sciencemag.org SCIENCE VOL 328 18 JUNE 2010 1477
NEWSFOCUS
CR
ED
IT: C
. BIC
KE
L/SC
IEN
CE
Azam and others credit Jiao with a key insight: the recognition that microbes play a dominant role in “pumping” bioavailable carbon into a pool of relatively inert com-pounds. Some refractory DOC hangs in the upper water column, while some gets shunted to the deep ocean interior via the biological pump. The MCP “may act as one of the conveyor belts that transport and store carbon in the deep oceans,” says Chen-Tung “Arthur” Chen, an ocean carbonate chemist at National Sun Yat-sen University in Kaohsi-ung, Taiwan. The MCP also appears to func-tion in deep waters, where bacteria adapted to the high-pressure environment may have “a special capacity” to degrade refractory DOC, says Christian Tamburini, a microbi-ologist at the Centre d’Océanologie de Mar-seille in France.
It took sharp sleuthing to uncover the microbial connection with refractory DOC. In a landmark paper in 2001, Hiroshi Ogawa of the University of Tokyo and colleagues showed that marine microbes are able to convert bioavailable DOC to refractory DOC (Science, 4 May 2001, p. 917). Then a month later, Zbigniew Kolber, now at the Monterey Bay Aquarium Research Institute in Moss Landing, California, and colleagues reported that in the upper open ocean, an unusual class of photosynthetic bacteria called AAPB accounts for 11% of the total microbial community (Science, 29 June 2001, p. 2492). AAPBs seemed to be plenti-ful everywhere, according to measurements of infrared fl uorescence from the microbe’s light-absorbing pigments.
It turned out, though, that other organ-isms were throwing the AAPB estimates way off the mark. Using a new technique, Jiao’s group determined that the fluores-cent glow of phytoplankton was masking the glow of the target microbes. “Just like when the moon is bright, less stars are visible,” Jiao says. He put the new approach through its paces in 2005, when China’s Ocean 1 research vessel conducted campaigns to mark the 600th anniversary of Admiral He Zheng’s historic voyages. The observations “turned things upside down,” Jiao says. His group found that AAPBs are more abun-dant in nutrient-rich waters than in the open ocean, indicating that AAPB population lev-els are linked with DOC, not light.
Next, Jiao found that AAPBs are prone to viral infection, and he isolated the fi rst phage that’s specifi c for these bacteria. Phages rip apart their hosts, spilling their guts, includ-ing organic carbon, into the water. This viral shunt acting on many marine bacteria “may be a signifi cant player in the accumulation
of refractory DOC compounds” in the water column, says Steven Wilhelm, a microbiol-ogist at the University of Tennessee, Knox-ville. Pulling together several strands—the ubiquity of AAPBs, their low abundance but high turnover rate, the tight link to DOC, and their susceptibility to infection—Jiao pro-posed that AAPBs and other microbes are a key mechanism for the conversion of bio-available DOC to refractory DOC. That may seem counterintuitive, as microbes do not set out to produce refractory DOC; rather, the compounds are a byproduct of their demise. “This process is not benefi cial to the cell,” says Simon.
Because the buildup of refractory DOC in the water column is accidental, it will be a challenge to coax microbes to sequester more carbon. For decades, researchers have been tinkering with the biological pump to store more carbon in the deep ocean by seed-ing seas with iron fertilizer. The iron triggers phytoplankton blooms that suck more CO
2
from the air. That should also drive more car-bon into the refractory pool, Koblizek says.
Even tweaking the MCP could have a profound effect. The water column holds on average 35 to 40 micromoles of carbon from refractory DOC per liter. An increase of a mere 2 to 3 micromoles per liter would sock away several billion tons of carbon, says Nagappa Ramaiah, a marine microbial ecol-ogist at the National Institute of Oceanogra-phy in Goa, India. “We have to investigate any and all means to help sink the excess carbon,” he says.
Two billion years ago, when bacteria ruled Earth, the oceans held 500 times as much DOC as today, most likely generated
by the MCP, Jiao says. Ecosystem dynamics have changed immensely since then, but the microbial sequestration potential could still be huge, he argues. No chemical equilibrium would limit conversion of bioavailable DOC to refractory DOC, which in turn would not exacerbate ocean acidification, says Jiao, who is planning pilot experiments this sum-mer. Ramaiah, meanwhile, says he is look-ing for enhanced sequestration potential in select marine bacteria strains.
There’s no simple recipe—and some sci-entists are not convinced that it’s feasible or even safe. “I do not think it is possible to enhance carbon sequestration by the MCP. We have no handle on any controls” of how refractory DOC is generated, says Simon. With the present knowledge, any sequestra-tion effort, argues Weinbauer, “could come back like a boomerang and worsen the prob-lem.” At the same time, humans may already be “inadvertently stimulating the MCP,” says Salgado. Global warming is increasing strati-fi cation, reducing deep convection, and stim-ulating microbial respiration—all of which favor the MCP, he says.
The MCP concept should help address critical issues, such as whether ocean acidi-fi cation and warming will signifi cantly alter carbon fl ux into refractory DOC, says Azam, who with Jiao chairs the Scientifi c Committee on Oceanic Research’s new working group on the role of MCP in carbon biogeochemistry. The upcoming research cruises should fi ll in more details of how the MCP governs carbon cycling and how it may respond to climate change. As Wilhelm notes, “We are just at the dawn of developing this understanding.”
–RICHARD STONE
AtAtmosphhere
Biological Sequestration of Carbon in the SeaC0
2
molecules
Bioavailable
DOC
Microbial
carbon
pump
Main food
chain
Microbes
Biological
pump
Phytoplankton
cean
Refractory
DOCs
ain foo
ch inha
s
c
C02
molecules
Oc
Re
obi
bo
m
bial
on
mp
Mic
ca
p
Double-barrel pump. Each year, the biological pump deposits some 300 million tons of carbon in the deep ocean sink. Even more massive amounts are suspended in the water column as dissolved organic carbon, much of which is converted into refractory forms by the microbial carbon pump.
0618NewsFocus.indd 1477 6/14/10 5:12:42 PM
CRE
DIT
: C. B
ICKE
L/SC
IEN
CE
7
Photosynthesis fixes carbon into organic matter in the ocean. Biological forces then paint intricate flux patterns for
carbon in ocean space and in time, as it flows through the foodweb, becomes stored in the sediments and exchanged with the atmosphere. Predicting how these carbon flux patterns might respond to global change (or to human manipulation) is a primary reason for learning more about the workings of the ocean’s carbon cycle. The flux patterns are a result of intricate interactions of a diverse biota with a physically and chemically complex pool of organic mat-ter. It now seems that things will get even more complicated before they get simpler. New fun-damental findings on the roles of microbes in the fate of organic matter and, recently, on the nature of the organic matter itself (1–4) must be properly assimilated before we can hope to construct ecosystem models to predict the pat-terns of carbon flux. This impetus could lead to a powerful new synthesis.
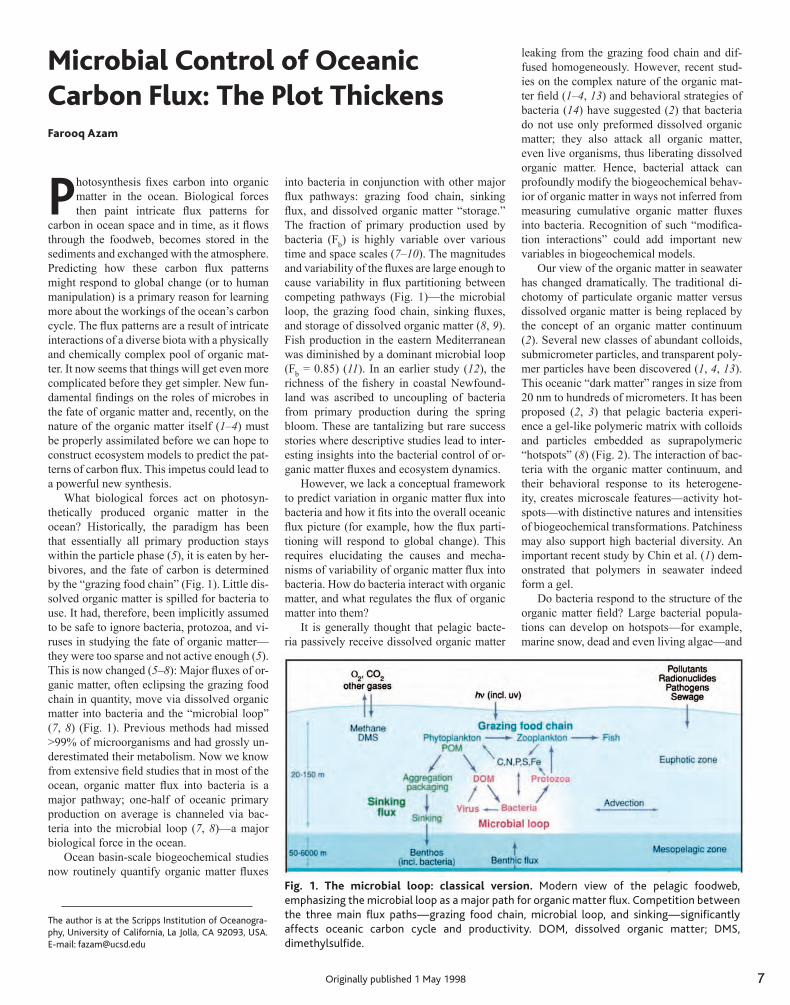
What biological forces act on photosyn-thetically produced organic matter in the ocean? Historically, the paradigm has been that essentially all primary production stays within the particle phase (5), it is eaten by her-bivores, and the fate of carbon is determined by the “grazing food chain” (Fig. 1). Little dis-solved organic matter is spilled for bacteria to use. It had, therefore, been implicitly assumed to be safe to ignore bacteria, protozoa, and vi-ruses in studying the fate of organic matter—they were too sparse and not active enough (5). This is now changed (5–8): Major fluxes of or-ganic matter, often eclipsing the grazing food chain in quantity, move via dissolved organic matter into bacteria and the “microbial loop” (7, 8) (Fig. 1). Previous methods had missed >99% of microorganisms and had grossly un-derestimated their metabolism. Now we know from extensive field studies that in most of the ocean, organic matter flux into bacteria is a major pathway; one�half of oceanic primary production on average is channeled via bac-teria into the microbial loop (7, 8)—a major biological force in the ocean.
Ocean basin�scale biogeochemical studies now routinely quantify organic matter fluxes
into bacteria in conjunction with other major flux pathways: grazing food chain, sinking flux, and dissolved organic matter “storage.” The fraction of primary production used by bacteria (Fb) is highly variable over various time and space scales (7–10). The magnitudes and variability of the fluxes are large enough to cause variability in flux partitioning between competing pathways (Fig. 1)—the microbial loop, the grazing food chain, sinking fluxes, and storage of dissolved organic matter (8, 9). Fish production in the eastern Mediterranean was diminished by a dominant microbial loop (Fb = 0.85) (11). In an earlier study (12), the richness of the fishery in coastal Newfound-land was ascribed to uncoupling of bacteria from primary production during the spring bloom. These are tantalizing but rare success stories where descriptive studies lead to inter-esting insights into the bacterial control of or-ganic matter fluxes and ecosystem dynamics.
However, we lack a conceptual framework to predict variation in organic matter flux into bacteria and how it fits into the overall oceanic flux picture (for example, how the flux parti-tioning will respond to global change). This requires elucidating the causes and mecha-nisms of variability of organic matter flux into bacteria. How do bacteria interact with organic matter, and what regulates the flux of organic matter into them?
It is generally thought that pelagic bacte-ria passively receive dissolved organic matter
leaking from the grazing food chain and dif-fused homogeneously. However, recent stud-ies on the complex nature of the organic mat-ter field (1–4, 13) and behavioral strategies of bacteria (14) have suggested (2) that bacteria do not use only preformed dissolved organic matter; they also attack all organic matter, even live organisms, thus liberating dissolved organic matter. Hence, bacterial attack can profoundly modify the biogeochemical behav-ior of organic matter in ways not inferred from measuring cumulative organic matter fluxes into bacteria. Recognition of such “modifica-tion interactions” could add important new variables in biogeochemical models.
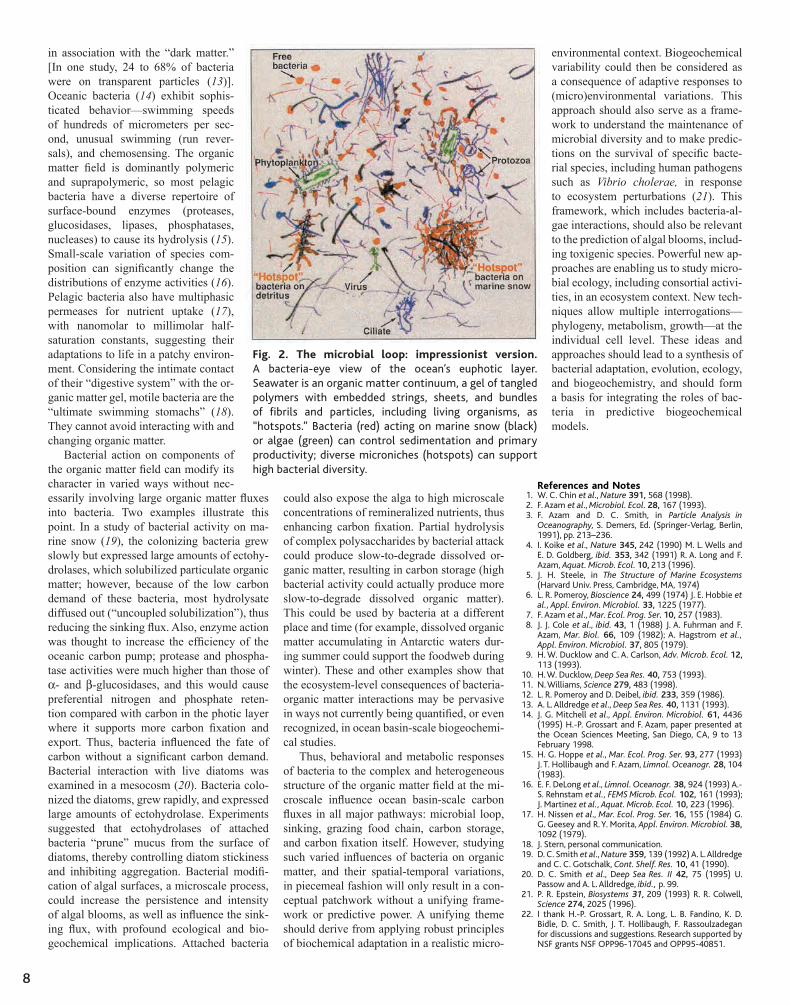
Our view of the organic matter in seawater has changed dramatically. The traditional di-chotomy of particulate organic matter versus dissolved organic matter is being replaced by the concept of an organic matter continuum (2). Several new classes of abundant colloids, submicrometer particles, and transparent poly-mer particles have been discovered (1, 4, 13). This oceanic “dark matter” ranges in size from 20 nm to hundreds of micrometers. It has been proposed (2, 3) that pelagic bacteria experi-ence a gel-like polymeric matrix with colloids and particles embedded as suprapolymeric “hotspots” (8) (Fig. 2). The interaction of bac-teria with the organic matter continuum, and their behavioral response to its heterogene-ity, creates microscale features—activity hot-spots—with distinctive natures and intensities of biogeochemical transformations. Patchiness may also support high bacterial diversity. An important recent study by Chin et al. (1) dem-onstrated that polymers in seawater indeed form a gel.
Do bacteria respond to the structure of the organic matter field? Large bacterial popula-tions can develop on hotspots—for example, marine snow, dead and even living algae—and
The author is at the Scripps Institution of Oceanogra-phy, University of California, La Jolla, CA 92093, USA. E-mail: [email protected]
Microbial Control of Oceanic Carbon Flux: The Plot ThickensFarooq Azam
Fig. 1. The microbial loop: classical version. Modern view of the pelagic foodweb, emphasizing the microbial loop as a major path for organic matter flux. Competition between the three main flux paths—grazing food chain, microbial loop, and sinking—significantly affects oceanic carbon cycle and productivity. DOM, dissolved organic matter; DMS, dimethylsulfide.
Originally published 1 May 1998
8
in association with the “dark matter.” [In one study, 24 to 68% of bacteria were on transparent particles (13)]. Oceanic bacteria (14) exhibit sophis-ticated behavior—swimming speeds of hundreds of micrometers per sec-ond, unusual swimming (run rever-sals), and chemosensing. The organic matter field is dominantly polymeric and suprapolymeric, so most pelagic bacteria have a diverse repertoire of surface-bound enzymes (proteases, glucosidases, lipases, phosphatases, nucleases) to cause its hydrolysis (15). Small-scale variation of species com-position can significantly change the distributions of enzyme activities (16). Pelagic bacteria also have multiphasic permeases for nutrient uptake (17), with nanomolar to millimolar half-saturation constants, suggesting their adaptations to life in a patchy environ-ment. Considering the intimate contact of their “digestive system” with the or-ganic matter gel, motile bacteria are the “ultimate swimming stomachs” (18). They cannot avoid interacting with and changing organic matter.
Bacterial action on components of the organic matter field can modify its character in varied ways without nec-essarily involving large organic matter fluxes into bacteria. Two examples illustrate this point. In a study of bacterial activity on ma-rine snow (19), the colonizing bacteria grew slowly but expressed large amounts of ectohy-drolases, which solubilized particulate organic matter; however, because of the low carbon demand of these bacteria, most hydrolysate diffused out (“uncoupled solubilization”), thus reducing the sinking flux. Also, enzyme action was thought to increase the efficiency of the oceanic carbon pump; protease and phospha-tase activities were much higher than those of α- and β-glucosidases, and this would cause preferential nitrogen and phosphate reten-tion compared with carbon in the photic layer where it supports more carbon fixation and export. Thus, bacteria influenced the fate of carbon without a significant carbon demand. Bacterial interaction with live diatoms was examined in a mesocosm (20). Bacteria colo-nized the diatoms, grew rapidly, and expressed large amounts of ectohydrolase. Experiments suggested that ectohydrolases of attached bacteria “prune” mucus from the surface of diatoms, thereby controlling diatom stickiness and inhibiting aggregation. Bacterial modifi-cation of algal surfaces, a microscale process, could increase the persistence and intensity of algal blooms, as well as influence the sink-ing flux, with profound ecological and bio-geochemical implications. Attached bacteria
could also expose the alga to high microscale concentrations of remineralized nutrients, thus enhancing carbon fixation. Partial hydrolysis of complex polysaccharides by bacterial attack could produce slow-to-degrade dissolved or-ganic matter, resulting in carbon storage (high bacterial activity could actually produce more slow-to-degrade dissolved organic matter). This could be used by bacteria at a different place and time (for example, dissolved organic matter accumulating in Antarctic waters dur-ing summer could support the foodweb during winter). These and other examples show that the ecosystem-level consequences of bacteria-organic matter interactions may be pervasive in ways not currently being quantified, or even recognized, in ocean basin-scale biogeochemi-cal studies.
Thus, behavioral and metabolic responses of bacteria to the complex and heterogeneous structure of the organic matter field at the mi-croscale influence ocean basin�scale carbon fluxes in all major pathways: microbial loop, sinking, grazing food chain, carbon storage, and carbon fixation itself. However, studying such varied influences of bacteria on organic matter, and their spatial-temporal variations, in piecemeal fashion will only result in a con-ceptual patchwork without a unifying frame-work or predictive power. A unifying theme should derive from applying robust principles of biochemical adaptation in a realistic micro-
Fig. 2. The microbial loop: impressionist version. A bacteria-eye view of the ocean’s euphotic layer. Seawater is an organic matter continuum, a gel of tangled polymers with embedded strings, sheets, and bundles of fibrils and particles, including living organisms, as “hotspots.” Bacteria (red) acting on marine snow (black) or algae (green) can control sedimentation and primary productivity; diverse microniches (hotspots) can support high bacterial diversity.
environmental context. Biogeochemical variability could then be considered as a consequence of adaptive responses to (micro)environmental variations. This approach should also serve as a frame-work to understand the maintenance of microbial diversity and to make predic-tions on the survival of specific bacte-rial species, including human pathogens such as Vibrio cholerae, in response to ecosystem perturbations (21). This framework, which includes bacteria-al-gae interactions, should also be relevant to the prediction of algal blooms, includ-ing toxigenic species. Powerful new ap-proaches are enabling us to study micro-bial ecology, including consortial activi-ties, in an ecosystem context. New tech-niques allow multiple interrogations—phylogeny, metabolism, growth—at the individual cell level. These ideas and approaches should lead to a synthesis of bacterial adaptation, evolution, ecology, and biogeochemistry, and should form a basis for integrating the roles of bac-teria in predictive biogeochemical models.
1. W. C. Chin et al., Nature 391, 568 (1998). 2. F. Azam et al., Microbiol. Ecol. 28, 167 (1993). 3. F. Azam and D. C. Smith, in Particle Analysis in
Oceanography, S. Demers, Ed. (Springer-Verlag, Berlin, 1991), pp. 213–236.
4. I. Koike et al., Nature 345, 242 (1990) M. L. Wells and E. D. Goldberg, ibid. 353, 342 (1991) R. A. Long and F. Azam, Aquat. Microb. Ecol. 10, 213 (1996).
5. J. H. Steele, in The Structure of Marine Ecosystems (Harvard Univ. Press, Cambridge, MA, 1974)
6. L. R. Pomeroy, Bioscience 24, 499 (1974) J. E. Hobbie et al., Appl. Environ. Microbiol. 33, 1225 (1977).
7. F. Azam et al., Mar. Ecol. Prog. Ser. 10, 257 (1983). 8. J. J. Cole et al., ibid. 43, 1 (1988) J. A. Fuhrman and F.
Azam, Mar. Biol. 66, 109 (1982); A. Hagstrom et al., Appl. Environ. Microbiol. 37, 805 (1979).
9. H. W. Ducklow and C. A. Carlson, Adv. Microb. Ecol. 12, 113 (1993).
10. H. W. Ducklow, Deep Sea Res. 40, 753 (1993).11. N. Williams, Science 279, 483 (1998).12. L. R. Pomeroy and D. Deibel, ibid. 233, 359 (1986).13. A. L. Alldredge et al., Deep Sea Res. 40, 1131 (1993).14. J. G. Mitchell et al., Appl. Environ. Microbiol. 61, 4436
(1995) H.-P. Grossart and F. Azam, paper presented at the Ocean Sciences Meeting, San Diego, CA, 9 to 13 February 1998.
15. H. G. Hoppe et al., Mar. Ecol. Prog. Ser. 93, 277 (1993) J. T. Hollibaugh and F. Azam, Limnol. Oceanogr. 28, 104 (1983).
16. E. F. DeLong et al., Limnol. Oceanogr. 38, 924 (1993) A.-S. Rehnstam et al., FEMS Microb. Ecol. 102, 161 (1993);J. Martinez et al., Aquat. Microb. Ecol. 10, 223 (1996).
17. H. Nissen et al., Mar. Ecol. Prog. Ser. 16, 155 (1984) G. G. Geesey and R. Y. Morita, Appl. Environ. Microbiol. 38, 1092 (1979).
18. J. Stern, personal communication.19. D. C. Smith et al., Nature 359, 139 (1992) A. L. Alldredge
and C. C. Gotschalk, Cont. Shelf. Res. 10, 41 (1990).20. D. C. Smith et al., Deep Sea Res. II 42, 75 (1995) U.
Passow and A. L. Alldredge, ibid., p. 99.21. P. R. Epstein, Biosystems 31, 209 (1993) R. R. Colwell,
Science 274, 2025 (1996).22. I thank H.-P. Grossart, R. A. Long, L. B. Fandino, K. D.
Bidle, D. C. Smith, J. T. Hollibaugh, F. Rassoulzadegan for discussions and suggestions. Research supported by NSF grants NSF OPP96-17045 and OPP95-40851.
cells (28), whereas only glucosamine andgalactosamine were detected at the end of theincubation (Table 2). The glucosamine:galac-tosamine ratio (2 :1) in bacterially derivedDOM at the end of the incubation was similarto the ratio of these amino sugars in seawater(28).
Recent studies have identified specificcomponents of the cell envelopes of marinebacteria in DOM from the surface and deepocean (4, 5). In addition to this evidence for abacterial source of marine DOM, laboratorystudies with radiotracers and marine bacterianoted the production of refractory DOM fromsimple compounds (9–11). Results from ourstudy support these observations, and indi-cate that diagenetic processing by microor-ganisms is rapid and critical for shaping thecomposition and refractory nature of marineDOM.
The amino sugar muramic acid isuniquely found in the repeating disaccha-ride backbone of the bacterial cell wall
polymer commonly known as peptidogly-can, and it is therefore an excellent biomar-ker for peptidoglycan in DOM (28). In theglucose experiment, muramic acid C con-centrations of 35 to 89 nM were measuredduring the first week of incubation, andbased on a typical muramic acid content inpeptidoglycan (29), we estimate that pepti-doglycan accounted for �1% of the C and�7.5% of the N in DOM. Muramic acidconcentrations were below detection after 1year of incubation (Table 2), indicating thatpeptidoglycan was absent in the refractoryDOM derived from bacteria. This findingwas unexpected given recent observationsin marine DOM of high D/L enantiomerratios in specific amino acids that are foundin the peptide component of peptidoglycan(5). Overall, these results suggest that bac-terial degradation sufficiently alters thestructure of peptidoglycan so that its poly-saccharide component is no longer recog-nizable at the molecular level.
Our results are inconsistent with severalmechanisms that have been proposed forthe formation of refractory organic matterin the ocean. It is unlikely that abioticcondensation reactions or humification pro-cesses (8) were important for producingrefractory DOM in our study, because theincubations were conducted in the dark atlow temperature, concentrations of reac-tants were low, and the compositionalchanges were rapid (hours to days). Thus, itappears that biological processes were crit-ical for the formation of refractory DOM.Specific biochemical components of cellscan be selectively preserved during diagen-esis (30), but these are relatively minorconstituents of cells that should only slowlyaccumulate. Amino acids, neutral sugars,and amino sugars typically compose �70%of bacterial biomass (29), but these bio-chemicals were relatively minor compo-nents of bacterially derived DOM. It ap-pears that the selective preservation of un-usual biochemical components of cellscould not, by itself, account for the rapidformation and accumulation of bacteriallyderived DOM.
Components of bacterial cells are re-leased into the surrounding water as DOMthrough a variety of biological processes,including direct release (11, 31), viral lysis(32), and grazing (33). Exoenzyme activityis critical for the microbial utilization ofthis DOM, and it appears that enzymaticactivity plays an important role in the for-mation of refractory DOM that is of smallsize (34 ). It is possible that nonspecific orpromiscuous activities of enzymes, that oc-cur with much lower efficiency than prima-ry activities (35), occasionally producefragments from macromolecules that es-cape recognition by bacterial enzymes andmolecular-level chemical analyses. Giventhis scenario, the rate of formation of re-fractory DOM is dependent on the rate ofmicrobial activity. This relatively simplemechanism could be responsible for muchof the sequestration of fixed C in the ocean.
References and Notes1. R. Benner, J. D. Pakulski, M. McCarthy, J. I. Hedges,P. G. Hatcher, Science 255, 1561 (1992).
2. M. D. McCarthy, T. Pratum, J. Hedges, R. Benner,Nature 390, 150 (1997).
3. L. L. Clark, E. D. Ingall, R. Benner, Nature 393, 426(1998).
4. E. Tanoue, S. Nishiyama, M. Kamo, A. Tsugita,Geochim. Cosmochim. Acta 59, 2643 (1995).
5. M. D. McCarthy, J. I. Hedges, R. Benner, Science 281,231 (1998).
6. P. M. Williams, E. R. M. Druffel, Oceanography 1, 14(1988).
7. J. I. Hedges et al., Org. Geochem. 31, 945 (2000).8. G. R. Harvey, D. A. Boran, L. A. Chesal, J. M. Tokar,Mar. Chem. 12, 119 (1983).
9. J. E. Brophy, D. J. Carlson, Deep-Sea Res. 36, 497(1989).
Table 2. Chemical composition of bacterially derived DOM in the glucose and glutamate experiments. Allare the mean of duplicate-bottle experiments, except for the data indicated by asterisks, which wereobtained from single bottles. The mean deviation of replicates was 0.9 �M for DOC, 0.2 �M for DON, 2for C/N ratio, and 1 to 2% of DOC, DON, THAS, and THAA compositions. The “uncharacterized” fractionin the glucose experiment is estimated as the difference between the total DOC and the DOC accountedfor as THNS�THAS�THAA, and between the total DON and the DON accounted for as THAA�THAS,except for the data after 1 year, in which THNS was not included (data in parenthesis). The “uncharac-terized” fraction in the glutamate experiment is based only on THAA, because THNS and THAS were notmeasured (indicated by “nm”).
Chemicalcomposition
Initial substrate
Glucose Glutamate
Incubation time(days)
Incubation time(days)
2 4 7 365 2 4 9 560
Concentration of the bulk DOM (�M)DOC 30 18 16 11 18 13 14 9.0DON 1.0 0.7 0.6 1.2 3.1 2.4 1.5 0.7
DOC composition (% as)THNS 2.5 4.9 5.9 nm nm nm nm nmTHAS 0.7 1.4 1.5 3.8 nm nm nm nmTHAA 2.5 4.3 3.7 2.5 13 18* 12 3.1Uncharacterized 94 89 89 (94) 87 82* 88 97
DON composition (% as)THAS 3.4 5.5 6.6 5.6 nm nm nm nmTHAA 22 29 27 6.4 15 31* 33 11Uncharacterized 75 66 67 88 85 69* 67 89
C:N molar ratioBulk 32 26 28 8.9 5.1 5.7 9.3 13Total characterized 7.5 7.9 9.2 (4.6) 3.5 3.1 3.3 3.6Uncharacterized 41 37 37 (10) 5.4 6.3* 12 14
THAS composition (mole %)GalN 20 26 31 33 nm nm nm nmGlcN 55 50 56 67 nm nm nm nmMA 26 24 12 0 nm nm nm nm
THAA composition (mole %)Acidic 26 27 21 30 26 12 17 28Basic 12 10 11 11 8 6 7 8Neutral 23 27 31 41 24 56 36 46Hydrophobic 38 36 37 18 41 27 40 18
R E P O R T S
www.sciencemag.org SCIENCE VOL 292 4 MAY 2001 919

9
DOM is the largest reservoir of fixed carbon in the ocean and is approxi-mately equivalent to the reservoir of
atmospheric CO2. The major bioelements (C, N, and P) in DOM occur in functional groups common to biopolymers found in marine or-ganisms (1–3). Specific cellular components of bacteria have been identified in marine DOM (4,5), indicating that bacteria are an im-portant source of this material. These obser-vations indicate the predominance of biomol-ecules in DOM, but <25% of marine DOM has been identified as specific biochemicals (6, 7), suggesting that its molecular structure has been modified. It appears that these molecular modifications also reduce the bioavailability of the DOM. Physicochemical reactions were proposed as the dominant mechanism for the formation of molecularly uncharacterized and refractory DOM (8), but a few studies reported that microorganisms also produce DOM that is resistant to decomposition (9–11). In a se-ries of experiments, we examined the bacterial utilization of simple biochemicals and traced the production of fresh DOM by the bacterial community.
We used seawater cultures with natural bacterial assemblages to examine DOM pro-duction by marine bacteria (12). Culture me-dia were prepared with organic�free artificial seawater and either glucose or glutamate as the sole C source. Incubations with glucose received ammonium and phosphate as N and P sources and an inoculum from Gulf of Mexico surface water. Incubations with glutamate re-ceived phosphate as a P source and an inocu-
lum from Sagami Bay, Japan. Concentrations of free glucose and glutamate were measured using high-performance liquid chromatogra-phy (HPLC) (13, 14). Measurements of total organic carbon (TOC), dissolved organic car-bon (DOC), and dissolved organic nitrogen (DON), were made using high�temperature combustion (15, 16). Concentrations of total hydrolyzable neutral sugars (THNS), total hydrolyzable amino sugars (THAS), and to-tal hydrolyzable amino acids (THAA) were measured by HPLC after acid hydrolysis (17). Both experiments were conducted at room temperature (22° to 28°C) with duplicate bot-tles under dark conditions.
Glucose (208 μM C) was rapidly con-sumed and undetectable after 2 days (Fig. 1). Within 2 days, TOC concentrations decreased by 78% due to respiration, and 7% of the ini-tial glucose C was converted to particulate organic carbon (POC, i.e., bacterial biomass), whereas 15% was converted to DOC (Table 1). Similarly, glutamate was completely con-sumed within 2 days, and 66% of the added C was respired. Compared to the glucose in-cubations, glutamate incubations had a greater yield of bacterial biomass (22% of initial glu-tamate C), but a similar yield of DOC (13%). After 2 days, bacterial growth yields were 8% in the N-limited glucose incubations and 25% in the glutamate incubations, if bacteri-ally derived DOC was excluded from yield calculations. Inclusion of bacterially derived DOC results in growth yield estimates of 22 and 35%, respectively, in the glucose and glu-tamate incubations.
Concentrations of bacterially derived DOC decreased gradually during the next week of decomposition (Stage II in Table 1). Assuming first�order kinetics, the average decay constant during Stage II was reduced by a factor of 8 compared with the utilization of glucose and glutamate (Stage I). It is generally recognized that bacteria in natural waters rapidly utilize labile compounds, such as free amino acids
and monosaccharides, even at low (nM) con-centrations (18, 19). Therefore, it is unlikely that the concentrations of remaining bacteri-ally derived DOC (20 to 30 μM C) would limit bacterial utilization. Neither ammonium nor phosphate was depleted after 1 week of incu-bation, suggesting nutrients were not limiting for decomposition. These results demonstrate that marine bacteria rapidly consumed labile DOM and produced DOM that was relatively resistant to decomposition.
The experiments were continued to exam-ine the long-term persistence of bacterially de-rived DOM. Consequently, 10.5 and 9.0 μM DOC were measured after 1 and 1.5 years, respectively, of incubation in the glucose and glutamate experiments, corresponding to 5 and 7% of the initial DOC added in each experi-ment and to 37 and 50% of the bacterially de-rived DOC concentrations at the end of 2 days. Although the degradation of DOC continued throughout the incubation (Stage III in Table 1), the degradation rate was remarkably low, and the decay constants were up to 100 times lower than those in Stage II. These decay con-stants were similar to previous estimates from long-term degradation experiments with ma-rine DOC from oligotrophic waters (20) and corresponded to residence times of 1.2 to 2.3 years. Thus, bacteria rapidly produced a ma-jor component of refractory DOM from labile substrates.
Chromatographic characterizations of major biogenic components of bacterially derived DOM indicated that THAA, THNS, and THAS accounted for 2.5 to 4.3%, 2.5 to 5.9%, and 0.7 to 1.5% of the DOC, respectively, during the first week in the glucose experiment (Table 2). Only 6 to 11% of the DOC was identified at the molecular level. Amino acids and amino sugars are also important nitrogenous components of DON. No DON was initially present in the glucose experiment, but concentrations of 0.6 to 1.0 μM DON were measured during the incubation. Marine bacteria produced DON from glucose and ammonium, and amino acids and amino sugars accounted for 22 to 29% and 3.4 to 6.6%, respectively, of the DON during the first week (Table 2). As with DOC, most (67 to 75%) of the DON was not characterized at the molecular level. The C:N ratio of the DOM was 28 to 32, indicating that bacterially derived DOM was C�rich relative to the initial substrates (glucose C:NH4-N = 20:1). The C:N ratio for the molecularly characterized DOM (THAA+THNS+THAS) was 7.5 to 9.2. In contrast, the C:N ratio of the molecularly uncharacterized DOM was 37 to 41, indicating a N-poor composition.
In the glutamate experiment, only amino acids (THAA) were measured in bacterially derived DOM. The yields of THAA were 12
Production of Refractory Dissolved Organic Matter by BacteriaHiroshi Ogawa,1* Yukio Amagai,1 Isao Koike,1 Karl Kaiser,2 Ronald Benner2
Most of the oceanic reservoir of dissolved organic matter (DOM) is of marine origin and is resistant to microbial oxidation, but little is known about the mechanisms of its formation. In a laboratory study, natural assemblages of marine bacteria rapidly (in <48 hours) utilized labile compounds (glucose, glutamate) and produced refractory DOM that persisted for more than a year. Only 10 to 15% of the bacterially derived DOM was identified as hydrolyzable amino acids and sugars, a feature consistent with marine DOM. These results suggest that microbial processes alter the molecular structure of DOM, making it resistant to further degradation and thereby preserving fixed carbon in the ocean.
1Ocean Research Institute, The University of Tokyo, 1-15-1 Minamidai, Nakano, Tokyo 164-8639, Japan. 2Department of Biological Sciences and Marine Science Program, University of South Carolina, Columbia, SC 29208, USA.
*To whom correspondence should be addressed. E-mail: [email protected]
Originally published 4 May 2001

10
Fig. 1. Concentrations of free glucose (A), free glutamate (B), and TOC, DOC, POC, and DON in seawater cultures with natural bacterial as-semblages and either glucose (A, C, and E) or glutamate (B, D, and F) as the sole carbon sources for bacterial growth. Panels (C) and (D) are re-illustrations of panels (A) and (B) with magnified scales of the y-axis. Each point and er-ror bar represents the average and range of duplicate-bottle experiments. Water samples were gravity-filtered through a glass fiber filter (GF/F, Whatman) in the glucose ex-periments for separation of the particulate and dissolved phases. In the glutamate ex-periments, water samples were passed through a 0.1-μm polytetrafluoroethylene membrane filter (Omnipore, Millipore) under reduced pres-sure. The DON concentration at the beginning of the glu-cose experiment was omitted because it was not significantly different from zero. Initial concentrations of DOC in glucose and glutamate experiments were accounted for in the measured concentrations of these compounds, indicating that no other sources of DOC were in the initial culture medium.
acids (THAA) were measured in bacteriallyderived DOM. The yields of THAA were12 to 18% of the DOC and 15 to 33% of theDON during the first week of the incuba-tion. The uncharacterized fraction com-posed most of the DOM (82 to 88% of Cand 67 to 85% of N). The C:N ratio of thetotal DOM was 5.1 to 9.3, whereas the C:Nratios of the THAA and uncharacterizedfractions were 3.1 to 3.5 and 5.4 to 12,respectively, suggesting that most bacteri-ally derived DOM was depleted in N rela-tive to the initial substrate (glutamateC:N � 5). The yields of amino acids inDOM were higher and the C:N ratios werelower in the glutamate experiment com-pared with the glucose experiment, reflect-ing the different N content of initial sub-strates. By 1.5 years, the yields of aminoacids decreased (3.1% of the DOC and 11%of the DON) in the glutamate experiment,and the C:N ratio of the DOM increased to13. In both experiments, bacterially derivedDOM was largely uncharacterized at themolecular level and rich in C relative to N.
Most oceanic DOM is of marine origin(21, 22), refractory (20, 21, 23), molecularlyuncharacterized (6, 7 ), rich in C relative to N(C:N � 10 to 25) (16, 24 ), and exists asrelatively small molecules (1, 15, 24 ). Thesimple experiments described here demon-strate that the bulk properties of bacteriallyderived DOM are similar to those of marine
DOM. The size distribution of DOM in theglutamate experiment was investigated usingultrafiltration (15). After 6 months, 84 � 3%of the DOC was �10 kD in size, consistentwith the size distribution of marine DOM(�90% of DOC is �10 kD) (15).
The amino acid composition of marineDOM is relatively rich in neutral amino acids(30 to 40 mole %) and depleted in basicamino acids (5 to 10 mole %) (25, 26 ) com-pared with marine organisms, including bac-
teria (neutral � 25 mole %; basic � 15 mole%) (27 ). During the incubations, the aminoacid compositions of bacterially derivedDOM rapidly shifted from a compositionsimilar to that of microorganisms to a com-position similar to that of marine DOM (Ta-ble 2). A similar transition was observed inamino sugar compositions of bacterially de-rived DOM in the glucose incubations. Theinitial amino sugar composition of DOM inthe incubations was similar to that in bacterial
Table 1. Carbon balances and kinetic decay constants for DOM at different stages in seawatercultures with bacteria and glucose or glutamate as an initial substrate. The data are given as themean � �mean-replicate� of duplicate bottle incubations. Carbon balances were calculated at the endof each stage period, including remineralized % (i.e., the loss of TOC) and remaining % as DOC orPOC relative to the initial TOC. The results of POC at Stage III were not available, because thedifference between TOC and DOC were statistically insignificant or no measurement of TOC wasmade. The decay constants for DOC during each stage were calculated on the assumption offirst-order decay kinetics.
Stage (days) Remineralized %Remaining %
Decay constant(day�1)
DOC POC
Glucose (208 � 0 �M C)
I (0–2) 78� 1 15� 0 7� 1 1.1� 0.0II (2–7) 87� 1 8� 1 6� 1 0.13� 0.03III (7–365) 95� 0 5� 0 – 0.0012� 0.0003
Glutamate (132 � 2 �M C)
I (0–2) 66� 5 13� 7 22� 2 1.1� 0.1II (2–9) 77� 2 10� 1 13� 1 0.14� 0.08III (9–560) 93� 1 7� 1 – 0.0023� 0.0003
Fig. 1. Concentrations of freeglucose (A), free glutamate(B), and TOC, DOC, POC, andDON in seawater cultureswith natural bacterial assem-blages and either glucose (A,C, and E) or glutamate (B, D,and F) as the sole carbonsources for bacterial growth.Panels (C) and (D) are re-illustrations of panels (A) and(B) with magnified scales ofthe y-axis. Each point and er-ror bar represents the aver-age and range of duplicate-bottle experiments. Watersamples were gravity-filteredthrough a glass fiber filter(GF/F, Whatman) in the glu-cose experiments for separa-tion of the particulate anddissolved phases. In the glu-tamate experiments, watersamples were passed througha 0.1-�m polytetrafluoroeth-ylene membrane filter (Om-nipore, Millipore) under re-duced pressure. The DONconcentration at the begin-ning of the glucose experi-ment was omitted because itwas not significantly differ-ent from zero. Initial concen-trations of DOC in glucose and glutamate experiments were accounted for in the measured concentrations of these compounds, indicating that noother sources of DOC were in the initial culture medium.
R E P O R T S
4 MAY 2001 VOL 292 SCIENCE www.sciencemag.org918
to 18% of the DOC and 15 to 33% of the DON during the first week of the incubation. The uncharacterized fraction composed most of the DOM (82 to 88% of C and 67 to 85% of N). The C:N ratio of the total DOM was 5.1 to 9.3, whereas the C:N ratios of the THAA
and uncharacterized fractions were 3.1 to 3.5 and 5.4 to 12, respectively, suggesting that most bacterially derived DOM was depleted in N relative to the initial substrate (glutamate C:N = 5). The yields of amino acids in DOM were higher and the C:N ratios were lower in
the glutamate experiment compared with the glucose experiment, reflecting the different N content of initial substrates. By 1.5 years, the yields of amino acids decreased (3.1% of the DOC and 11% of the DON) in the glutamate experiment, and the C:N ratio of the
Table 1. Carbon balances and kinetic decay constants for DOM at different stages in seawater cultures with bacteria and glucose or glutamate as an initial substrate. The data are given as the mean ± |mean-replicate| of duplicate bottle incubations. Carbon balances were calculated at the end of each stage period, including remineralized % (i.e., the loss of TOC) and remaining % as DOC or POC relative to the initial TOC. The results of POC at Stage III were not available, because the difference between TOC and DOC were statistically insignificant or no measurement of TOC was made. The decay constants for DOC during each stage were calculated on the assumption of first-order decay kinetics.
acids (THAA) were measured in bacteriallyderived DOM. The yields of THAA were12 to 18% of the DOC and 15 to 33% of theDON during the first week of the incuba-tion. The uncharacterized fraction com-posed most of the DOM (82 to 88% of Cand 67 to 85% of N). The C:N ratio of thetotal DOM was 5.1 to 9.3, whereas the C:Nratios of the THAA and uncharacterizedfractions were 3.1 to 3.5 and 5.4 to 12,respectively, suggesting that most bacteri-ally derived DOM was depleted in N rela-tive to the initial substrate (glutamateC:N � 5). The yields of amino acids inDOM were higher and the C:N ratios werelower in the glutamate experiment com-pared with the glucose experiment, reflect-ing the different N content of initial sub-strates. By 1.5 years, the yields of aminoacids decreased (3.1% of the DOC and 11%of the DON) in the glutamate experiment,and the C:N ratio of the DOM increased to13. In both experiments, bacterially derivedDOM was largely uncharacterized at themolecular level and rich in C relative to N.
Most oceanic DOM is of marine origin(21, 22), refractory (20, 21, 23), molecularlyuncharacterized (6, 7 ), rich in C relative to N(C:N � 10 to 25) (16, 24 ), and exists asrelatively small molecules (1, 15, 24 ). Thesimple experiments described here demon-strate that the bulk properties of bacteriallyderived DOM are similar to those of marine
DOM. The size distribution of DOM in theglutamate experiment was investigated usingultrafiltration (15). After 6 months, 84 � 3%of the DOC was �10 kD in size, consistentwith the size distribution of marine DOM(�90% of DOC is �10 kD) (15).
The amino acid composition of marineDOM is relatively rich in neutral amino acids(30 to 40 mole %) and depleted in basicamino acids (5 to 10 mole %) (25, 26 ) com-pared with marine organisms, including bac-
teria (neutral � 25 mole %; basic � 15 mole%) (27 ). During the incubations, the aminoacid compositions of bacterially derivedDOM rapidly shifted from a compositionsimilar to that of microorganisms to a com-position similar to that of marine DOM (Ta-ble 2). A similar transition was observed inamino sugar compositions of bacterially de-rived DOM in the glucose incubations. Theinitial amino sugar composition of DOM inthe incubations was similar to that in bacterial
Table 1. Carbon balances and kinetic decay constants for DOM at different stages in seawatercultures with bacteria and glucose or glutamate as an initial substrate. The data are given as themean � �mean-replicate� of duplicate bottle incubations. Carbon balances were calculated at the endof each stage period, including remineralized % (i.e., the loss of TOC) and remaining % as DOC orPOC relative to the initial TOC. The results of POC at Stage III were not available, because thedifference between TOC and DOC were statistically insignificant or no measurement of TOC wasmade. The decay constants for DOC during each stage were calculated on the assumption offirst-order decay kinetics.
Stage (days) Remineralized %Remaining %
Decay constant(day�1)
DOC POC
Glucose (208 � 0 �M C)
I (0–2) 78� 1 15� 0 7� 1 1.1� 0.0II (2–7) 87� 1 8� 1 6� 1 0.13� 0.03III (7–365) 95� 0 5� 0 – 0.0012� 0.0003
Glutamate (132 � 2 �M C)
I (0–2) 66� 5 13� 7 22� 2 1.1� 0.1II (2–9) 77� 2 10� 1 13� 1 0.14� 0.08III (9–560) 93� 1 7� 1 – 0.0023� 0.0003
Fig. 1. Concentrations of freeglucose (A), free glutamate(B), and TOC, DOC, POC, andDON in seawater cultureswith natural bacterial assem-blages and either glucose (A,C, and E) or glutamate (B, D,and F) as the sole carbonsources for bacterial growth.Panels (C) and (D) are re-illustrations of panels (A) and(B) with magnified scales ofthe y-axis. Each point and er-ror bar represents the aver-age and range of duplicate-bottle experiments. Watersamples were gravity-filteredthrough a glass fiber filter(GF/F, Whatman) in the glu-cose experiments for separa-tion of the particulate anddissolved phases. In the glu-tamate experiments, watersamples were passed througha 0.1-�m polytetrafluoroeth-ylene membrane filter (Om-nipore, Millipore) under re-duced pressure. The DONconcentration at the begin-ning of the glucose experi-ment was omitted because itwas not significantly differ-ent from zero. Initial concen-trations of DOC in glucose and glutamate experiments were accounted for in the measured concentrations of these compounds, indicating that noother sources of DOC were in the initial culture medium.
R E P O R T S
4 MAY 2001 VOL 292 SCIENCE www.sciencemag.org918
-
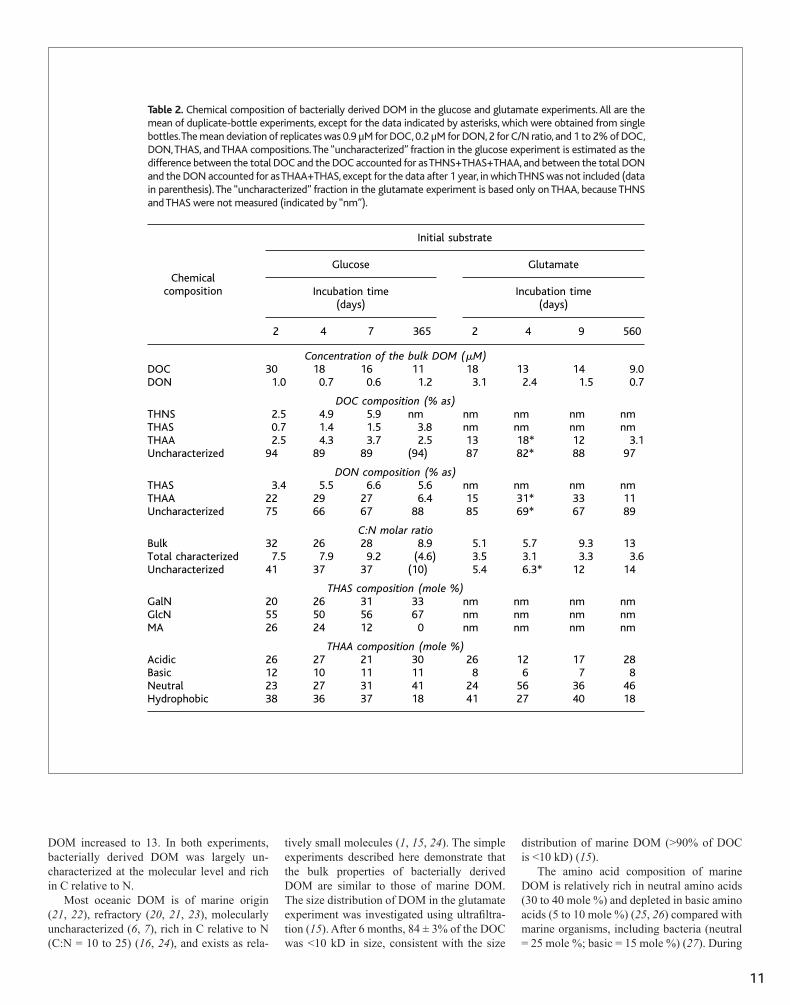
11
DOM increased to 13. In both experiments, bacterially derived DOM was largely un�characterized at the molecular level and rich in C relative to N.
Most oceanic DOM is of marine origin (21, 22), refractory (20, 21, 23), molecularly uncharacterized (6, 7), rich in C relative to N (C:N = 10 to 25) (16, 24), and exists as rela-
tively small molecules (1, 15, 24). The simple experiments described here demonstrate that the bulk properties of bacterially derived DOM are similar to those of marine DOM. The size distribution of DOM in the glutamate experiment was investigated using ultrafiltra-tion (15). After 6 months, 84 ± 3% of the DOC was <10 kD in size, consistent with the size
distribution of marine DOM (>90% of DOC is <10 kD) (15).
The amino acid composition of marine DOM is relatively rich in neutral amino acids (30 to 40 mole %) and depleted in basic amino acids (5 to 10 mole %) (25, 26) compared with marine organisms, including bacteria (neutral = 25 mole %; basic = 15 mole %) (27). During
cells (28), whereas only glucosamine andgalactosamine were detected at the end of theincubation (Table 2). The glucosamine:galac-tosamine ratio (2 :1) in bacterially derivedDOM at the end of the incubation was similarto the ratio of these amino sugars in seawater(28).
Recent studies have identified specificcomponents of the cell envelopes of marinebacteria in DOM from the surface and deepocean (4, 5). In addition to this evidence for abacterial source of marine DOM, laboratorystudies with radiotracers and marine bacterianoted the production of refractory DOM fromsimple compounds (9–11). Results from ourstudy support these observations, and indi-cate that diagenetic processing by microor-ganisms is rapid and critical for shaping thecomposition and refractory nature of marineDOM.
The amino sugar muramic acid isuniquely found in the repeating disaccha-ride backbone of the bacterial cell wall
polymer commonly known as peptidogly-can, and it is therefore an excellent biomar-ker for peptidoglycan in DOM (28). In theglucose experiment, muramic acid C con-centrations of 35 to 89 nM were measuredduring the first week of incubation, andbased on a typical muramic acid content inpeptidoglycan (29), we estimate that pepti-doglycan accounted for �1% of the C and�7.5% of the N in DOM. Muramic acidconcentrations were below detection after 1year of incubation (Table 2), indicating thatpeptidoglycan was absent in the refractoryDOM derived from bacteria. This findingwas unexpected given recent observationsin marine DOM of high D/L enantiomerratios in specific amino acids that are foundin the peptide component of peptidoglycan(5). Overall, these results suggest that bac-terial degradation sufficiently alters thestructure of peptidoglycan so that its poly-saccharide component is no longer recog-nizable at the molecular level.
Our results are inconsistent with severalmechanisms that have been proposed forthe formation of refractory organic matterin the ocean. It is unlikely that abioticcondensation reactions or humification pro-cesses (8) were important for producingrefractory DOM in our study, because theincubations were conducted in the dark atlow temperature, concentrations of reac-tants were low, and the compositionalchanges were rapid (hours to days). Thus, itappears that biological processes were crit-ical for the formation of refractory DOM.Specific biochemical components of cellscan be selectively preserved during diagen-esis (30), but these are relatively minorconstituents of cells that should only slowlyaccumulate. Amino acids, neutral sugars,and amino sugars typically compose �70%of bacterial biomass (29), but these bio-chemicals were relatively minor compo-nents of bacterially derived DOM. It ap-pears that the selective preservation of un-usual biochemical components of cellscould not, by itself, account for the rapidformation and accumulation of bacteriallyderived DOM.
Components of bacterial cells are re-leased into the surrounding water as DOMthrough a variety of biological processes,including direct release (11, 31), viral lysis(32), and grazing (33). Exoenzyme activityis critical for the microbial utilization ofthis DOM, and it appears that enzymaticactivity plays an important role in the for-mation of refractory DOM that is of smallsize (34 ). It is possible that nonspecific orpromiscuous activities of enzymes, that oc-cur with much lower efficiency than prima-ry activities (35), occasionally producefragments from macromolecules that es-cape recognition by bacterial enzymes andmolecular-level chemical analyses. Giventhis scenario, the rate of formation of re-fractory DOM is dependent on the rate ofmicrobial activity. This relatively simplemechanism could be responsible for muchof the sequestration of fixed C in the ocean.
References and Notes1. R. Benner, J. D. Pakulski, M. McCarthy, J. I. Hedges,P. G. Hatcher, Science 255, 1561 (1992).
2. M. D. McCarthy, T. Pratum, J. Hedges, R. Benner,Nature 390, 150 (1997).
3. L. L. Clark, E. D. Ingall, R. Benner, Nature 393, 426(1998).
4. E. Tanoue, S. Nishiyama, M. Kamo, A. Tsugita,Geochim. Cosmochim. Acta 59, 2643 (1995).
5. M. D. McCarthy, J. I. Hedges, R. Benner, Science 281,231 (1998).
6. P. M. Williams, E. R. M. Druffel, Oceanography 1, 14(1988).
7. J. I. Hedges et al., Org. Geochem. 31, 945 (2000).8. G. R. Harvey, D. A. Boran, L. A. Chesal, J. M. Tokar,Mar. Chem. 12, 119 (1983).
9. J. E. Brophy, D. J. Carlson, Deep-Sea Res. 36, 497(1989).
Table 2. Chemical composition of bacterially derived DOM in the glucose and glutamate experiments. Allare the mean of duplicate-bottle experiments, except for the data indicated by asterisks, which wereobtained from single bottles. The mean deviation of replicates was 0.9 �M for DOC, 0.2 �M for DON, 2for C/N ratio, and 1 to 2% of DOC, DON, THAS, and THAA compositions. The “uncharacterized” fractionin the glucose experiment is estimated as the difference between the total DOC and the DOC accountedfor as THNS�THAS�THAA, and between the total DON and the DON accounted for as THAA�THAS,except for the data after 1 year, in which THNS was not included (data in parenthesis). The “uncharac-terized” fraction in the glutamate experiment is based only on THAA, because THNS and THAS were notmeasured (indicated by “nm”).
Chemicalcomposition
Initial substrate
Glucose Glutamate
Incubation time(days)
Incubation time(days)
2 4 7 365 2 4 9 560
Concentration of the bulk DOM (�M)DOC 30 18 16 11 18 13 14 9.0DON 1.0 0.7 0.6 1.2 3.1 2.4 1.5 0.7
DOC composition (% as)THNS 2.5 4.9 5.9 nm nm nm nm nmTHAS 0.7 1.4 1.5 3.8 nm nm nm nmTHAA 2.5 4.3 3.7 2.5 13 18* 12 3.1Uncharacterized 94 89 89 (94) 87 82* 88 97
DON composition (% as)THAS 3.4 5.5 6.6 5.6 nm nm nm nmTHAA 22 29 27 6.4 15 31* 33 11Uncharacterized 75 66 67 88 85 69* 67 89
C:N molar ratioBulk 32 26 28 8.9 5.1 5.7 9.3 13Total characterized 7.5 7.9 9.2 (4.6) 3.5 3.1 3.3 3.6Uncharacterized 41 37 37 (10) 5.4 6.3* 12 14
THAS composition (mole %)GalN 20 26 31 33 nm nm nm nmGlcN 55 50 56 67 nm nm nm nmMA 26 24 12 0 nm nm nm nm
THAA composition (mole %)Acidic 26 27 21 30 26 12 17 28Basic 12 10 11 11 8 6 7 8Neutral 23 27 31 41 24 56 36 46Hydrophobic 38 36 37 18 41 27 40 18
R E P O R T S
www.sciencemag.org SCIENCE VOL 292 4 MAY 2001 919
Table 2. Chemical composition of bacterially derived DOM in the glucose and glutamate experiments. All are the mean of duplicate-bottle experiments, except for the data indicated by asterisks, which were obtained from single bottles. The mean deviation of replicates was 0.9 μM for DOC, 0.2 μM for DON, 2 for C/N ratio, and 1 to 2% of DOC, DON, THAS, and THAA compositions. The “uncharacterized” fraction in the glucose experiment is estimated as the difference between the total DOC and the DOC accounted for as THNS+THAS+THAA, and between the total DON and the DON accounted for as THAA+THAS, except for the data after 1 year, in which THNS was not included (data in parenthesis). The “uncharacterized” fraction in the glutamate experiment is based only on THAA, because THNS and THAS were not measured (indicated by “nm”).
12
the incubations, the amino acid compositions of bacterially derived DOM rapidly shifted from a composition similar to that of micro-organisms to a composition similar to that of marine DOM (Table 2). A similar transition was observed in amino sugar compositions of bacterially derived DOM in the glucose incubations. The initial amino sugar composi-tion of DOM in the incubations was similar to that in bacterial cells (28), whereas only glucosamine and galactosamine were detected at the end of the incubation (Table 2). The glucosamine:galactosamine ratio (2:1) in bac-terially derived DOM at the end of the incu-bation was similar to the ratio of these amino sugars in seawater (28).
Recent studies have identified specific components of the cell envelopes of marine bacteria in DOM from the surface and deep ocean (4, 5). In addition to this evidence for a bacterial source of marine DOM, laboratory studies with radiotracers and marine bacteria noted the production of refractory DOM from simple compounds (9–11). Results from our study support these observations, and indicate that diagenetic processing by microorganisms is rapid and critical for shaping the composi-tion and refractory nature of marine DOM.
The amino sugar muramic acid is uniquely found in the repeating disaccharide backbone of the bacterial cell wall polymer commonly known as peptidoglycan, and it is therefore an excellent biomarker for peptidoglycan in
DOM (28). In the glucose experiment, mu-ramic acid C concentrations of 35 to 89 nM were measured during the first week of incu-bation, and based on a typical muramic acid content in peptidoglycan (29), we estimate that peptidoglycan accounted for ∼1% of the C and ∼7.5% of the N in DOM. Muramic acid concentrations were below detection after 1 year of incubation (Table 2), indicating that peptidoglycan was absent in the refractory DOM derived from bacteria. This finding was unexpected given recent observations in marine DOM of high D/L enantiomer ratios in specific amino acids that are found in the peptide component of peptidoglycan (5). Overall, these results suggest that bacterial degradation sufficiently alters the structure of peptidoglycan so that its polysaccharide component is no longer recognizable at the molecular level.
Our results are inconsistent with several mechanisms that have been proposed for the formation of refractory organic matter in the ocean. It is unlikely that abiotic condensation reactions or humification processes (8) were important for producing refractory DOM in our study, because the incubations were conducted in the dark at low temperature, concentrations of reactants were low, and the compositional changes were rapid (hours to days). Thus, it appears that biological processes were critical for the formation of refractory DOM. Specific biochemical components of cells can be
selectively preserved during diagenesis (30), but these are relatively minor constituents of cells that should only slowly accumulate. Amino acids, neutral sugars, and amino sugars typically compose >70% of bacterial biomass (29), but these biochemicals were relatively minor components of bacterially derived DOM. It appears that the selective preservation of unusual biochemical components of cells could not, by itself, account for the rapid formation and accumulation of bacterially derived DOM.
Components of bacterial cells are released into the surrounding water as DOM through a variety of biological processes, including direct release (11, 31), viral lysis (32), and grazing (33). Exoenzyme activity is critical for the microbial utilization of this DOM, and it appears that enzymatic activity plays an important role in the formation of refractory DOM that is of small size (34). It is possible that nonspecific or promiscuous activities of enzymes, that occur with much lower efficiency than primary activities (35), occasionally produce fragments from macromolecules that escape recognition by bacterial enzymes and molecular-level chemical analyses. Given this scenario, the rate of formation of refractory DOM is dependent on the rate of microbial activity. This relatively simple mechanism could be responsible for much of the sequestration of fixed C in the ocean.
cells (28), whereas only glucosamine andgalactosamine were detected at the end of theincubation (Table 2). The glucosamine:galac-tosamine ratio (2 :1) in bacterially derivedDOM at the end of the incubation was similarto the ratio of these amino sugars in seawater(28).
Recent studies have identified specificcomponents of the cell envelopes of marinebacteria in DOM from the surface and deepocean (4, 5). In addition to this evidence for abacterial source of marine DOM, laboratorystudies with radiotracers and marine bacterianoted the production of refractory DOM fromsimple compounds (9–11). Results from ourstudy support these observations, and indi-cate that diagenetic processing by microor-ganisms is rapid and critical for shaping thecomposition and refractory nature of marineDOM.
The amino sugar muramic acid isuniquely found in the repeating disaccha-ride backbone of the bacterial cell wall
polymer commonly known as peptidogly-can, and it is therefore an excellent biomar-ker for peptidoglycan in DOM (28). In theglucose experiment, muramic acid C con-centrations of 35 to 89 nM were measuredduring the first week of incubation, andbased on a typical muramic acid content inpeptidoglycan (29), we estimate that pepti-doglycan accounted for �1% of the C and�7.5% of the N in DOM. Muramic acidconcentrations were below detection after 1year of incubation (Table 2), indicating thatpeptidoglycan was absent in the refractoryDOM derived from bacteria. This findingwas unexpected given recent observationsin marine DOM of high D/L enantiomerratios in specific amino acids that are foundin the peptide component of peptidoglycan(5). Overall, these results suggest that bac-terial degradation sufficiently alters thestructure of peptidoglycan so that its poly-saccharide component is no longer recog-nizable at the molecular level.
Our results are inconsistent with severalmechanisms that have been proposed forthe formation of refractory organic matterin the ocean. It is unlikely that abioticcondensation reactions or humification pro-cesses (8) were important for producingrefractory DOM in our study, because theincubations were conducted in the dark atlow temperature, concentrations of reac-tants were low, and the compositionalchanges were rapid (hours to days). Thus, itappears that biological processes were crit-ical for the formation of refractory DOM.Specific biochemical components of cellscan be selectively preserved during diagen-esis (30), but these are relatively minorconstituents of cells that should only slowlyaccumulate. Amino acids, neutral sugars,and amino sugars typically compose �70%of bacterial biomass (29), but these bio-chemicals were relatively minor compo-nents of bacterially derived DOM. It ap-pears that the selective preservation of un-usual biochemical components of cellscould not, by itself, account for the rapidformation and accumulation of bacteriallyderived DOM.
Components of bacterial cells are re-leased into the surrounding water as DOMthrough a variety of biological processes,including direct release (11, 31), viral lysis(32), and grazing (33). Exoenzyme activityis critical for the microbial utilization ofthis DOM, and it appears that enzymaticactivity plays an important role in the for-mation of refractory DOM that is of smallsize (34 ). It is possible that nonspecific orpromiscuous activities of enzymes, that oc-cur with much lower efficiency than prima-ry activities (35), occasionally producefragments from macromolecules that es-cape recognition by bacterial enzymes andmolecular-level chemical analyses. Giventhis scenario, the rate of formation of re-fractory DOM is dependent on the rate ofmicrobial activity. This relatively simplemechanism could be responsible for muchof the sequestration of fixed C in the ocean.
References and Notes1. R. Benner, J. D. Pakulski, M. McCarthy, J. I. Hedges,P. G. Hatcher, Science 255, 1561 (1992).
2. M. D. McCarthy, T. Pratum, J. Hedges, R. Benner,Nature 390, 150 (1997).
3. L. L. Clark, E. D. Ingall, R. Benner, Nature 393, 426(1998).
4. E. Tanoue, S. Nishiyama, M. Kamo, A. Tsugita,Geochim. Cosmochim. Acta 59, 2643 (1995).
5. M. D. McCarthy, J. I. Hedges, R. Benner, Science 281,231 (1998).
6. P. M. Williams, E. R. M. Druffel, Oceanography 1, 14(1988).
7. J. I. Hedges et al., Org. Geochem. 31, 945 (2000).8. G. R. Harvey, D. A. Boran, L. A. Chesal, J. M. Tokar,Mar. Chem. 12, 119 (1983).
9. J. E. Brophy, D. J. Carlson, Deep-Sea Res. 36, 497(1989).
Table 2. Chemical composition of bacterially derived DOM in the glucose and glutamate experiments. Allare the mean of duplicate-bottle experiments, except for the data indicated by asterisks, which wereobtained from single bottles. The mean deviation of replicates was 0.9 �M for DOC, 0.2 �M for DON, 2for C/N ratio, and 1 to 2% of DOC, DON, THAS, and THAA compositions. The “uncharacterized” fractionin the glucose experiment is estimated as the difference between the total DOC and the DOC accountedfor as THNS�THAS�THAA, and between the total DON and the DON accounted for as THAA�THAS,except for the data after 1 year, in which THNS was not included (data in parenthesis). The “uncharac-terized” fraction in the glutamate experiment is based only on THAA, because THNS and THAS were notmeasured (indicated by “nm”).
Chemicalcomposition
Initial substrate
Glucose Glutamate
Incubation time(days)
Incubation time(days)
2 4 7 365 2 4 9 560
Concentration of the bulk DOM (�M)DOC 30 18 16 11 18 13 14 9.0DON 1.0 0.7 0.6 1.2 3.1 2.4 1.5 0.7
DOC composition (% as)THNS 2.5 4.9 5.9 nm nm nm nm nmTHAS 0.7 1.4 1.5 3.8 nm nm nm nmTHAA 2.5 4.3 3.7 2.5 13 18* 12 3.1Uncharacterized 94 89 89 (94) 87 82* 88 97
DON composition (% as)THAS 3.4 5.5 6.6 5.6 nm nm nm nmTHAA 22 29 27 6.4 15 31* 33 11Uncharacterized 75 66 67 88 85 69* 67 89
C:N molar ratioBulk 32 26 28 8.9 5.1 5.7 9.3 13Total characterized 7.5 7.9 9.2 (4.6) 3.5 3.1 3.3 3.6Uncharacterized 41 37 37 (10) 5.4 6.3* 12 14
THAS composition (mole %)GalN 20 26 31 33 nm nm nm nmGlcN 55 50 56 67 nm nm nm nmMA 26 24 12 0 nm nm nm nm
THAA composition (mole %)Acidic 26 27 21 30 26 12 17 28Basic 12 10 11 11 8 6 7 8Neutral 23 27 31 41 24 56 36 46Hydrophobic 38 36 37 18 41 27 40 18
R E P O R T S
www.sciencemag.org SCIENCE VOL 292 4 MAY 2001 91910. L. J. Tranvik, FEMS Microbiol. Ecol. 12, 177 (1994).11. K. Stoderegger, G. J. Herndl, Limnol. Oceanogr. 43,877 (1998).
12. An artificial seawater medium (0 � 1 �M C) wasprepared using precombusted salts (NaCl, KCl,MgSO4, CaCl2) with NaHCO3 and organic-free,deionized water (Milli-RO and Milli-Q UV Plus).The filtrate (�0.7 �m pore size GF/F) from seawa-ter samples was used as a natural inoculum (2%v/v) of marine bacteria. Based on the DOC contentin the Gulf of Mexico seawater inoculum, the finalconcentration of DOC in the inoculated mediumprior to the addition of glucose was 1 � 1 �M.Based on the DOC content in the Sagami Bayseawater inoculum, the final concentration of DOCin the inoculated medium prior to the addition ofglutamate was 2 � 1 �M.
13. A. Skoog, R. Benner, Limnol. Oceanogr. 42, 1803(1997).
14. P. Lindroth, K. Mopper, Anal. Chem. 51, 1667 (1979).15. H. Ogawa, N. Ogura, Nature 356, 696 (1992).16. H. Ogawa, R. Fukuda, I. Koike, Deep-Sea Res. I 46,1809 (1999).
17. THNS is the sum of seven neutral sugars (glucose,galactose, fucose, rhamnose, mannose, arabinose,and xylose), and THAS is the sum of three aminosugars [galactosamine (GalN), glucosamine (GlcN),and muramic acid (MA)], which were measured byHPLC after HCl hydrolysis (3 M, 5 hours, 100°C) (13,28). No samples had measurable mannosamine. MAwas not detected after 1 year. THAA is the sum of 17amino acids determined by HPLC (14) after vapor-phase hydrolysis (36). THAA composition is present-ed in Table 2 as four families of amino acids: acidic(aspartic acid, glutamic acid), basic (arginine, histi-dine, lysine), neutral (serine, glycine, threonine, ty-rosine), and hydrophobic (�-alanine, alanine, �-ami-nobutyric acid, methionine, phenylalanine, valine,isoleucine, leucine). The concentrations of individualamino acids are available as supplementary Webtables at www.sciencemag.org/cgi/content/full/292/5518/917/DC1
18. J. A. Fuhrman, R. L. Ferguson, Mar. Ecol. Prog. Ser. 33,237 (1986).
19. J. Rich, H. W. Ducklow, D. L. Kirchman, Limnol. Ocean-ogr. 41, 595 (1996)
20. N. Ogura, Mar. Biol. 13, 89 (1972).21. P. M. Williams, E. R. M. Druffel, Nature 330, 246(1987).
22. S. Opsahl, R. Benner, Nature 386, 480 (1997).23. R. T. Barber, Nature 220, 274 (1968).24. R. Benner, B. Biddanda, B. Black, M. D. McCarthy, Mar.Chem. 57, 243 (1997).
25. M. McCarthy, J. Hedges, R. Benner, Mar. Chem. 55,281 (1996).
26. U. Hubberten, R. J. Lara, G. Kattner, Mar. Chem. 45,121 (1994).
27. G. L. Cowie, J. I. Hedges, Limnol. Oceanogr. 37, 703(1992).
28. K. Kaiser, R. Benner, Anal. Chem. 72, 2566 (2000).29. F. C. Neidhardt, J. L. Ingraham, M. Schaechter,Physiology of the Bacterial Cell: A Molecular Ap-proach (Sinauer, Sunderland, MA, 1990), pp. 102–130.
30. P. G. Hatcher, E. C. Spiker, N. M. Szeverenyi, G. E.Maciel, Nature 305, 498 (1983).
31. A. W. Decho, Oceanogr. Mar. Biol. Annu. Rev. 28, 73(1990).
32. L. M. Proctor, J. A. Fuhrman, Nature 343, 60 (1990).33. T. Nagata, D. L. Kirchman, Mar. Ecol. Prog. Ser. 83,233 (1992).
34. R. M. W. Amon, R. Benner, Limnol. Oceanogr. 41, 41(1996).
35. P. J. O’Brien, D. Herschlag, Chem. Biol. 6, 91 (1999).36. A. Tsugita, T. Uchida, H. W. Mewes, T. Atake, J. Bio-chem. 102, 1593 (1987).
37. We thank Y. Fujimoto of the Ocean Research Insti-tute for nutrient analyses. H.O. acknowledges forfunding from the Ministry of Education, Science andCulture of Japan. R.B. acknowledges funding fromNSF. We thank J. Hedges and the Marine OrganicGeochemistry group of the University of Washingtonfor comments that improved the manuscript.
21 November 2000; accepted 21 March 2001
Requirement of PhospholipaseC�4 for the Zona
Pellucida–Induced AcrosomeReaction
Kiyoko Fukami,1* Kazuki Nakao,2 Takafumi Inoue,3
Yuki Kataoka,4 Manabu Kurokawa,5 Rafael A. Fissore,5
Kenji Nakamura,2 Motoya Katsuki,2 Katsuhiko Mikoshiba,3,6
Nobuaki Yoshida,4 Tadaomi Takenawa1
Several phospholipase C (PLC) isoforms have been found in male and femalemammalian gametes, and splicing isoforms of PLC�4 are predominantly ex-pressed in testis. Here we report that male mice in which the PLC�4 gene hadbeen disrupted either produced few small litters or were sterile. In vitro fer-tilization studies showed that insemination with PLC�4�/� sperm resulted insignificantly fewer eggs becoming activated and that the calcium transientsassociated with fertilization were absent or delayed. PLC�4�/� sperm wereunable to initiate the acrosome reaction, an exocytotic event required forfertilization and induced by interaction with the egg coat, the zona pellucida.These data demonstrate that PLC�4 functions in the acrosome reaction that isinduced by the zona pellucida during mammalian fertilization.
Spatial and temporal activation of phospho-inositide turnover enables eukaryotic cells toinduce various functions such as cell signal-ing, cytoskeletal remodeling, phagocytosis,membrane traffic, and ion channel activity (1,2). Phospholipase C (PLC) plays a crucialrole in this turnover by hydrolyzing phospha-tidylinositol-4,5-bisphosphate (PtdInsP2) togenerate two second messengers, inositol1,4,5-trisphosphate [Ins(1,4,5)P3] and diacyl-glycerol. Eleven PLC cDNAs have beencloned from mammalian cells, and they canbe divided into four types—�, �, �, andε—on the basis of sequence homology andactivation mechanisms (3). The delta type ofPLC is thought to be evolutionarily the oldestform in the mammalian PLC family, and itspleckstrin homology (PH) domain is knownto function in membrane association throughPtdInsP2. However, the physiological roleand mechanism(s) of regulation of PLC deltatypes has remained unclear.
To understand the physiological impor-tance of one of four isoforms of PLC�,PLC�4, we inactivated this gene by targeteddisruption of exons 2 to 5, which encode the
ATG translation start site (Fig. 1A) and thePH domain. Correct gene targeting of themutant mice was verified by Southern blotanalysis (Fig. 1B). Western-blot analysis ofbrain tissue revealed that neither 85-kDPLC�4 nor fragments of the protein wereexpressed in homozygous mutant mice (Fig.1C). Heterozygous PLC�4�/� mice appearedphenotypically normal and fertile, and inter-crosses between heterozygous mice producedpups with a Mendelian genetic distribution,indicating that disruption of this gene didnot result in embryonic lethality. Homo-zygous adult PLC�4�/� mice appearedhealthy, and histological examination showedno obvious abnormalities in the brain, liver,kidney, or heart. However, fertility of PLC�4homozygous mutant males was severely im-paired, whereas females seemed to be fertile.About 90.0% of intercrossed PLC�4�/� fe-males were fertile, and their average litter sizewas 7.6 pups. Similarly, 77.8% of PLC�4�/�
females became pregnant when mated withPLC�4�/� males, and their average litter sizewas 5.8 pups. Conversely, when PLC�4�/�
females were mated with PLC�4�/� males,only 35.2% of matings resulted in pregnancy,and the average litter size was 1.2 pups. There-fore, PLC�4 affects primarily male fertility.
Histochemical analysis of testicular sectionsrevealed that in PLC�4�/� mice, spermatogen-esis proceeded normally as indicated by thepresence and production of mature sperm (Fig.2, E and F). In wild-type testis, PLC�4 waslocalized by using a specific antibody (4) to theoutermost layer where the spermatogonia reside(Fig. 2, A and C), and it was also detected asa crescent-shaped domain in the developing
1Department of Biochemistry, 2Division of DNA Biol-ogy and Embryo Engineering, Center for ExperimentalMedicine, 3Department of Neurobiology, 4Division ofGene Expression and Regulation, The Institute ofMedical Science, The University of Tokyo, Tokyo 108-8039, Japan. 5Department of Veterinary and AnimalSciences, Paige Laboratory, University of Massachu-setts, Amherst, MA 01003, USA. 6Brain Science Insti-tute, Riken, Hirosawa, Wako, Saitama 351-0198,Japan.
*To whom correspondence should be addressed. E-mail: [email protected]
R E P O R T S
4 MAY 2001 VOL 292 SCIENCE www.sciencemag.org920
10. L. J. Tranvik, FEMS Microbiol. Ecol. 12, 177 (1994).11. K. Stoderegger, G. J. Herndl, Limnol. Oceanogr. 43,877 (1998).
12. An artificial seawater medium (0 � 1 �M C) wasprepared using precombusted salts (NaCl, KCl,MgSO4, CaCl2) with NaHCO3 and organic-free,deionized water (Milli-RO and Milli-Q UV Plus).The filtrate (�0.7 �m pore size GF/F) from seawa-ter samples was used as a natural inoculum (2%v/v) of marine bacteria. Based on the DOC contentin the Gulf of Mexico seawater inoculum, the finalconcentration of DOC in the inoculated mediumprior to the addition of glucose was 1 � 1 �M.Based on the DOC content in the Sagami Bayseawater inoculum, the final concentration of DOCin the inoculated medium prior to the addition ofglutamate was 2 � 1 �M.
13. A. Skoog, R. Benner, Limnol. Oceanogr. 42, 1803(1997).
14. P. Lindroth, K. Mopper, Anal. Chem. 51, 1667 (1979).15. H. Ogawa, N. Ogura, Nature 356, 696 (1992).16. H. Ogawa, R. Fukuda, I. Koike, Deep-Sea Res. I 46,1809 (1999).
17. THNS is the sum of seven neutral sugars (glucose,galactose, fucose, rhamnose, mannose, arabinose,and xylose), and THAS is the sum of three aminosugars [galactosamine (GalN), glucosamine (GlcN),and muramic acid (MA)], which were measured byHPLC after HCl hydrolysis (3 M, 5 hours, 100°C) (13,28). No samples had measurable mannosamine. MAwas not detected after 1 year. THAA is the sum of 17amino acids determined by HPLC (14) after vapor-phase hydrolysis (36). THAA composition is present-ed in Table 2 as four families of amino acids: acidic(aspartic acid, glutamic acid), basic (arginine, histi-dine, lysine), neutral (serine, glycine, threonine, ty-rosine), and hydrophobic (�-alanine, alanine, �-ami-nobutyric acid, methionine, phenylalanine, valine,isoleucine, leucine). The concentrations of individualamino acids are available as supplementary Webtables at www.sciencemag.org/cgi/content/full/292/5518/917/DC1
18. J. A. Fuhrman, R. L. Ferguson, Mar. Ecol. Prog. Ser. 33,237 (1986).
19. J. Rich, H. W. Ducklow, D. L. Kirchman, Limnol. Ocean-ogr. 41, 595 (1996)
20. N. Ogura, Mar. Biol. 13, 89 (1972).21. P. M. Williams, E. R. M. Druffel, Nature 330, 246(1987).
22. S. Opsahl, R. Benner, Nature 386, 480 (1997).23. R. T. Barber, Nature 220, 274 (1968).24. R. Benner, B. Biddanda, B. Black, M. D. McCarthy, Mar.Chem. 57, 243 (1997).
25. M. McCarthy, J. Hedges, R. Benner, Mar. Chem. 55,281 (1996).
26. U. Hubberten, R. J. Lara, G. Kattner, Mar. Chem. 45,121 (1994).
27. G. L. Cowie, J. I. Hedges, Limnol. Oceanogr. 37, 703(1992).
28. K. Kaiser, R. Benner, Anal. Chem. 72, 2566 (2000).29. F. C. Neidhardt, J. L. Ingraham, M. Schaechter,Physiology of the Bacterial Cell: A Molecular Ap-proach (Sinauer, Sunderland, MA, 1990), pp. 102–130.
30. P. G. Hatcher, E. C. Spiker, N. M. Szeverenyi, G. E.Maciel, Nature 305, 498 (1983).
31. A. W. Decho, Oceanogr. Mar. Biol. Annu. Rev. 28, 73(1990).
32. L. M. Proctor, J. A. Fuhrman, Nature 343, 60 (1990).33. T. Nagata, D. L. Kirchman, Mar. Ecol. Prog. Ser. 83,233 (1992).
34. R. M. W. Amon, R. Benner, Limnol. Oceanogr. 41, 41(1996).
35. P. J. O’Brien, D. Herschlag, Chem. Biol. 6, 91 (1999).36. A. Tsugita, T. Uchida, H. W. Mewes, T. Atake, J. Bio-chem. 102, 1593 (1987).
37. We thank Y. Fujimoto of the Ocean Research Insti-tute for nutrient analyses. H.O. acknowledges forfunding from the Ministry of Education, Science andCulture of Japan. R.B. acknowledges funding fromNSF. We thank J. Hedges and the Marine OrganicGeochemistry group of the University of Washingtonfor comments that improved the manuscript.
21 November 2000; accepted 21 March 2001
Requirement of PhospholipaseC�4 for the Zona
Pellucida–Induced AcrosomeReaction
Kiyoko Fukami,1* Kazuki Nakao,2 Takafumi Inoue,3
Yuki Kataoka,4 Manabu Kurokawa,5 Rafael A. Fissore,5
Kenji Nakamura,2 Motoya Katsuki,2 Katsuhiko Mikoshiba,3,6
Nobuaki Yoshida,4 Tadaomi Takenawa1
Several phospholipase C (PLC) isoforms have been found in male and femalemammalian gametes, and splicing isoforms of PLC�4 are predominantly ex-pressed in testis. Here we report that male mice in which the PLC�4 gene hadbeen disrupted either produced few small litters or were sterile. In vitro fer-tilization studies showed that insemination with PLC�4�/� sperm resulted insignificantly fewer eggs becoming activated and that the calcium transientsassociated with fertilization were absent or delayed. PLC�4�/� sperm wereunable to initiate the acrosome reaction, an exocytotic event required forfertilization and induced by interaction with the egg coat, the zona pellucida.These data demonstrate that PLC�4 functions in the acrosome reaction that isinduced by the zona pellucida during mammalian fertilization.
Spatial and temporal activation of phospho-inositide turnover enables eukaryotic cells toinduce various functions such as cell signal-ing, cytoskeletal remodeling, phagocytosis,membrane traffic, and ion channel activity (1,2). Phospholipase C (PLC) plays a crucialrole in this turnover by hydrolyzing phospha-tidylinositol-4,5-bisphosphate (PtdInsP2) togenerate two second messengers, inositol1,4,5-trisphosphate [Ins(1,4,5)P3] and diacyl-glycerol. Eleven PLC cDNAs have beencloned from mammalian cells, and they canbe divided into four types—�, �, �, andε—on the basis of sequence homology andactivation mechanisms (3). The delta type ofPLC is thought to be evolutionarily the oldestform in the mammalian PLC family, and itspleckstrin homology (PH) domain is knownto function in membrane association throughPtdInsP2. However, the physiological roleand mechanism(s) of regulation of PLC deltatypes has remained unclear.
To understand the physiological impor-tance of one of four isoforms of PLC�,PLC�4, we inactivated this gene by targeteddisruption of exons 2 to 5, which encode the
ATG translation start site (Fig. 1A) and thePH domain. Correct gene targeting of themutant mice was verified by Southern blotanalysis (Fig. 1B). Western-blot analysis ofbrain tissue revealed that neither 85-kDPLC�4 nor fragments of the protein wereexpressed in homozygous mutant mice (Fig.1C). Heterozygous PLC�4�/� mice appearedphenotypically normal and fertile, and inter-crosses between heterozygous mice producedpups with a Mendelian genetic distribution,indicating that disruption of this gene didnot result in embryonic lethality. Homo-zygous adult PLC�4�/� mice appearedhealthy, and histological examination showedno obvious abnormalities in the brain, liver,kidney, or heart. However, fertility of PLC�4homozygous mutant males was severely im-paired, whereas females seemed to be fertile.About 90.0% of intercrossed PLC�4�/� fe-males were fertile, and their average litter sizewas 7.6 pups. Similarly, 77.8% of PLC�4�/�
females became pregnant when mated withPLC�4�/� males, and their average litter sizewas 5.8 pups. Conversely, when PLC�4�/�
females were mated with PLC�4�/� males,only 35.2% of matings resulted in pregnancy,and the average litter size was 1.2 pups. There-fore, PLC�4 affects primarily male fertility.
Histochemical analysis of testicular sectionsrevealed that in PLC�4�/� mice, spermatogen-esis proceeded normally as indicated by thepresence and production of mature sperm (Fig.2, E and F). In wild-type testis, PLC�4 waslocalized by using a specific antibody (4) to theoutermost layer where the spermatogonia reside(Fig. 2, A and C), and it was also detected asa crescent-shaped domain in the developing
1Department of Biochemistry, 2Division of DNA Biol-ogy and Embryo Engineering, Center for ExperimentalMedicine, 3Department of Neurobiology, 4Division ofGene Expression and Regulation, The Institute ofMedical Science, The University of Tokyo, Tokyo 108-8039, Japan. 5Department of Veterinary and AnimalSciences, Paige Laboratory, University of Massachu-setts, Amherst, MA 01003, USA. 6Brain Science Insti-tute, Riken, Hirosawa, Wako, Saitama 351-0198,Japan.
*To whom correspondence should be addressed. E-mail: [email protected]
R E P O R T S
4 MAY 2001 VOL 292 SCIENCE www.sciencemag.org920
13
Bulk Chemical Characteristics of Dissolved Organic Matter in the OceanRonald Benner,* J. Dean Pakulski, Matthew McCarthy, John I. Hedges, Patrick G. Hatcher
Dissolved organic matter (DOM) is the largest reservoir of reduced carbon in the oceans. The nature of DOM is poorly understood, in part, because it has been difficult to isolate sufficient amounts of representative material for analysis. Tangential-flow ultrafiltration was shown to recover milligram amounts of >1000 daltons of DOM from seawater collected at three depths in the North Pacific Ocean. These isolates represented 22 to 33 percent of the total DOM and included essentially all colloidal material. The elemental, carbohydrate, and carbon-type (by 13C nuclear magnetic resonance) compositions of the isolates indicated that the relative abundance of polysaccharides was high (~50 percent) in surface water and decreased to ~25 percent in deeper samples. Polysaccharides thus appear to be more abundant and reactive components of seawater DOM than has been recognized.
Dissolved organic matter (DOM) in the oceans is important in the global car-bon cycle (1), supports heterotrophic
activity (2), and affects the penetration of light and exchange of gases at the sea surface (3). Despite its importance, relatively little is known about the composition and reactivity of marine DOM because of the lack of suit-able methods for its isolation from seawater. Direct biochemical analyses of DOM in sea-water typically account for less than 15% of the total mixture (4, 5), and many techniques that would provide more comprehensive structural information, such as nuclear mag-netic resonance (NMR) and infrared spectros-copy, require the isolation of DOM from the much more abundant salts in seawater. The conventional method for isolation has been adsorption of acidified DOM onto nonionic XAD resins (6). However, this method typi-cally recovers a small fraction (5 to 15%) of the total DOM in seawater, requires large manipulations of pH during isolation, and is selective for hydrophobic constituents.
In contrast, tangential�flow ultrafiltration concentrates organic molecules primarily on the basis of size rather than chemical proper-ties (7) and requires no pH adjustments that may change chemical associations and struc-tures. Ultrafiltration therefore appears to be a more appropriate method for isolating a rep-
resentative fraction of DOM than adsorption on XAD resins. In this report we describe the bulk chemical properties of DOM isolated by tangential�flow ultrafiltration from three depths in the open North Pacific Ocean.
Samples were collected during April 1991 from Station ALOHA (22°45´N, 158°00´W) located about 100 km north of Oahu, Ha-waii. Hydrographic and basic chemical and biological parameters have been monitored at this station since 1988 (8). We collected water samples in Niskin bottles fitted with Tefloncoated closure springs using a 24�bottle rosette. Samples for ultrafiltration (200 liters) were collected from three depths, 10, 765, and 4000 m, corresponding to the surface, oxygen-minimum, and deep waters (Table 1).
Immediately following collection, we pumped water samples through 0.2�μm pore size, prerinsed Nuclepore polycarbonate fil-ters and subsequently through 1000-dalton cutoff (~1-nm pore size) spiralwound poly-sulfone filters using an Amicon DC1OL ul-trafiltration system. Total processing time for each sample was ~12 hours. Dissolved or-ganic carbon (DOC) is operationally defined here as all organic carbon passing a 0.2�μm pore size filter and therefore includes all col-loids <0.2 μm. We measured concentrations of DOC by a high�temperature oxidation method (9) in which a Shimadzu TOC 5000 analyzer was used (10). Concentrations of DOC and volumes of water were recorded for the initial water, the ultrafiltered concentrate, and the ultrafiltrate so that a mass balance of DOC could be established (11). Most sea salts were removed from ultrafiltered concentrates by diafiltration, and the samples were stored frozen for transport to the laboratory. Samples were dried under vacuum in a Savant Speed-Vac concentrator.
The concentration of DOC in surface wa-ter (82 μM) was approximately two times as large as concentrations in oxygen-minimum and deep waters (Table 1). DOC profiles of this magnitude and shape have been observed at many ocean sites and interpreted to re-flect the presence of labile organic matter of planktonic origin in surface water that is absent from older water at depth. Mass bal-ance calculations indicate that all of the DOC in initial water samples was accounted for in the ultrafiltered concentrates (> 1000 daltons) and ultrafiltrates (<1000 daltons) (Table 1); thus, contamination and processing losses were minimal. We recovered 33, 25, and 22% of the total DOC from surface, oxygen�minimum, and deep waters (Table 1). The ob-served trend of a decrease in the >1000-dalton fraction from surface water to deep water sug-gests that material in the colloidal size range comprised an important part of the reactive components of DOM.
Our results on the size distribution of DOM are similar to those of Carlson et al. (11), who found that ~34% of the persulfate� oxidizable DOC (~88 μM) in North Atlantic surface waters was > 1000 daltons. However, a recent investigation by Sugimura and Suzu-ki (9) in the Northwestern Pacific Ocean indi-cated that ~85% of the total DOC (~290 μM) in surface waters was >1800 daltons. Similar-ly, these investigators found that ~85% of the total DOC (~95 μM) in Northwestern Pacific deep water (4000 m) was >1800 daltons (9). Such large differences between studies are be-yond the range expected for natural variabil-ity, especially for two samples from 4000�m depth in the North Pacific Ocean, and sug-gest that there are systematic biases in DOM measurement or characterization. Because of uncertainty about the accuracy of seawater DOC measurements (5, 9), we also indepen-dently determined the organic carbon content of the ultrafiltered DOM (UDOM) by flash combustion (~1100°C) of the dried powder in a Carlo Erba 1106 CHN analyzer of the type used to quantitatively combust a wide variety of carbonaceous substances. The weight per-centages of organic carbon measured were 10 to 25% lower than those calculated from the total DOC content (Shimadzu analyzer) and mass of the isolated samples (Table 1). Thus, we found no evidence for low DOC measure-ments that could be attributed to incomplete oxidation of the higher molecular weight or colloidal components of our DOM samples.
The atomic C/N values of the UDOM were lowest (15.3) in surface water and high-est (22.5) in oxygen-minimum water (Table 2). These values lie in the middle of the range of 10 to 25 determined for bulk seawater DOM with the use of wet oxidation meth-ods (4, 5). Humic substances isolated from
R. Benner and J. D. Pakulski, Marine Science Institute,University of Texas at Austin, Port Aransas, TX 78373.M. McCarthy and J. I. Hedges, School of Oceanography,University of Washington, Seattle, WA 98195.P. G. Hatcher, Fuel Science Program, The PennsylvaniaState University, University Park, PA 16802.
*To whom correspondence should be addressed.
Originally published 20 March 1992

14
the Pacific Ocean are carbon�rich [C/N ratio ≈34 (12)] relative to our UDOM samples; this difference reflects the bias of XAD resins against more polar nitrogen�containing DOM. Concentrations of dissolved organic nitrogen (DON) in the >1000�dalton size fraction (0.4 to 1.8 μM; from Tables 1 and 2) agree with concentrations determined recently for total DON (2 to 6 FM) in the North Pacific Ocean with the use of both high-temperature com-bustion (1100°C) and ultraviolet oxidation methods (13) and agree as well with aver-age concentrations of total DON (5 to 8 μM) reported for these same water samples (14). These measurements are at odds, however, with other recent estimates of DON concen-trations and C/N values for marine DOM. Suzuki and colleagues (9, 15) reported aver-age C/N values near 7 for the total DOM in surface and deep waters of the Northwestern Pacific Ocean and concentrations of higher molecular weight (> 5000 daltons) DON that were 20 to 70 times as large as our estimates for DON >1000 daltons. As discussed above, these large differences are beyond those ex-pected for natural variability.
Structural features of the isolated DOM were investigated by cross polarization magic angle spinning (CP/MAS) 13C NMR (16). The 13C NMR spectrum of the UDOM from sur-face water shows a dominant peak at 72 ppm and lesser peaks at 21, 40, 100, and 176 ppm (Fig. 1). Carbohydrates are the major family of biomolecules producing C–O resonances at 72 ppm and O–C–O resonances at 100 ppm. Unsubstituted alkyl carbons, such as methyl and methylene carbons, and amine carbons give rise to resonances between 0 and 50
ppm, and carboxyl, ester, and amide carbons produce resonances around 176 ppm.
Major compositional differences were ap-parent between UDOM from surface water and UDOM from oxygen�minimum and deep waters (Fig. 1). Integrated areas for C–O and O–C–O resonances indicate that there was a sharp decrease in the relative abundance of carbohydrate carbon from 54% in the UDOM from surface water to 29 and 25% in UDOM from oxygen-minimum and deep waters (Ta-ble 2). Surface�water UDOM had a threefold lower relative abundance of aromatic or ole-finic carbons (in 110 to 160 ppm) than UDOM from deeper waters (Table 2). On the basis of these data and the vertical distribution of ra-diocarbon in DOM in the North Pacific Ocean (17), which indicates that labile and refracto-ry components of DOM coexist in surface wa-ter, whereas refractory components dominate in deeper waters, it appears that high molecu-lar weight polysaccharides (> 1000 daltons) made up an important part of the labile DOM in surface water. Estimates of carbohydrate concentrations in the colloidal size fraction (1 to 200 nm) of DOM ranged from ~14 μM C in surface waters to ~2 μM C in deeper waters (Fig. 2).
The main structural features of the sur-face�water UDOM were very different from those of humic substances isolated by hydro-phobic adsorption from seawater. The UDOM from surface water was rich in carbohydrates, whereas XAD�isolated humic substances are rich in unsubstituted alkyl and carboxyl car-bons (18). Moreover, structural features of XAD�isolated DOM revealed by 1H- and 13C-NMR depict a material that is compositionally
invariant with oceanic environment (18) and depth (19); these characteristics suggest that the XAD�isolated DOM is composed primari-ly of the older, more refractory components of DOM. There are, however, some similarities between the structural features of UDOM and humic substances from deep water. Both of the isolated fractions contained a significant aromatic or olefinic component and similar carboxyl contents, but the deepwater UDOM sample was enriched in carbohydrate and de-pleted in unsubstituted alkyl carbon relative to deep-water humic substances (19).
We also determined the carbohydrate con-tent of the UDOM samples using a modified MBTH assay (20) to confirm the 13C�NMR carbohydrate estimates. In the modified MBTH assay hydrochloric acid was replaced with sulfuiric acid to more completely hydro-lyze resistant polysaccharides, such as cel-lulose and chitin (21). The modified MBTH assay indicated that carbohydrates accounted for 49, 18, and 19% of the total C in surface, oxygen�minimum, and deep�water UDOM samples. The similarity between these data and those determined by 13C�NMR confirms our estimate of carbohydrates in the UDOM samples and indicates that the modified
Table 1. Hydrographic data for samples collected at Station ALOHA (22º45.0’N, 158°0.O’W) and the concentrations of dissolved organic car-bon (DOC), percentages of DOC recovered using tangential-flow ultrafil-tration, and weight percentages of organic carbon (Wt%OC) in the recov-
ered isolates as determined by direct-injection, high-temperature catalytic oxidation (HTCO) and the dry weights of the recovered isolates and by flash combustion of dried powders in a CHN analyzer.
*% Initial DOC = 100 (DOCconcentrate + DOCultrafiltrate)(DOCinitial water )-1. †Sea salts were not completely removed during diafiltration resulting in weight percentages of organic carbon
that are lower than those expected (~45%) for pure organic matter.
Table 2. Atomic C/N ratios from elemental analysis and area percentages of the major 13C NMR peaks for DOM isolated by ultrafiltration. Functional group assignments are: C-C, carbon singly bonded to carbon; C-O, carbon singly bonded to oxygen; O-C-O, carbon singly bonded to two oxygens; C=C, carbon doubly bonded to carbon; O-C=O, carboxyl and ester carbon; C=O, carbonyl carbon.
Fig. 1. Conventional CP/MAS 13C NMR spectra of DOM isolated by ultrafiltration (>1000 daltons)from surface water (10 m), oxygen-minimum wa-ter (765 m), and deep water (4000 m) at 22º45’N, 158º00’W in the Pacific Ocean.
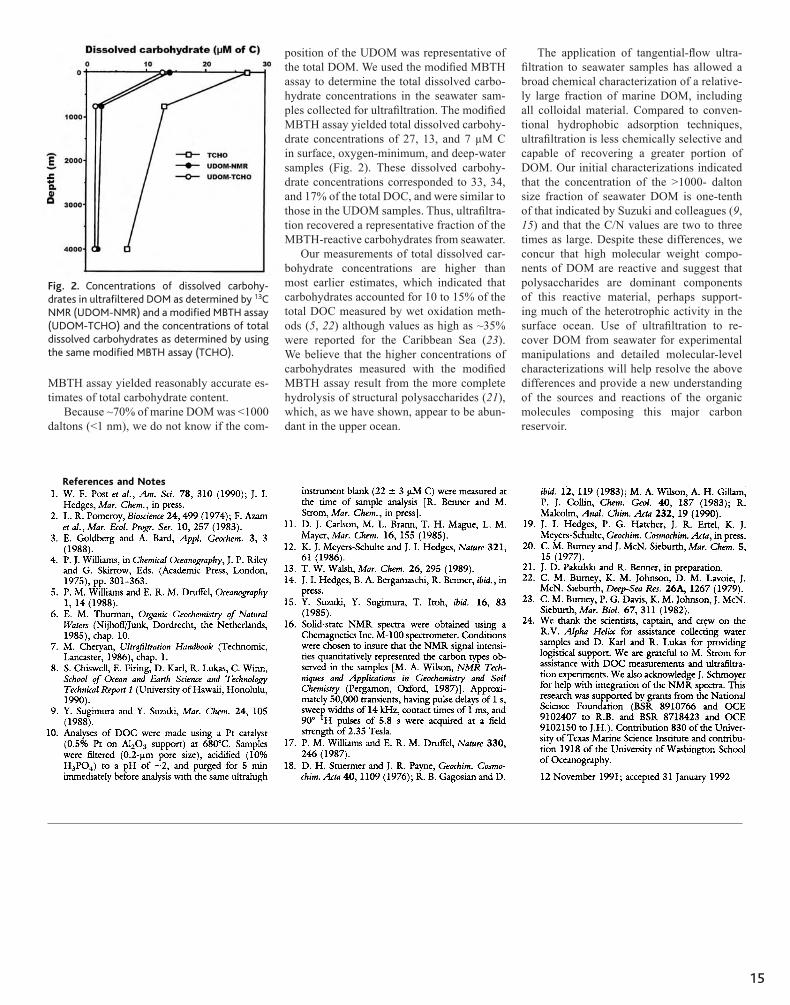
15
MBTH assay yielded reasonably accurate es-timates of total carbohydrate content.
Because ~70% of marine DOM was <1000 daltons (<1 nm), we do not know if the com-
position of the UDOM was representative of the total DOM. We used the modified MBTH assay to determine the total dissolved carbo-hydrate concentrations in the seawater sam-ples collected for ultrafiltration. The modified MBTH assay yielded total dissolved carbohy-drate concentrations of 27, 13, and 7 μM C in surface, oxygen-minimum, and deep-water samples (Fig. 2). These dissolved carbohy-drate concentrations corresponded to 33, 34, and 17% of the total DOC, and were similar to those in the UDOM samples. Thus, ultrafiltra-tion recovered a representative fraction of the MBTH-reactive carbohydrates from seawater.
Our measurements of total dissolved car-bohydrate concentrations are higher than most earlier estimates, which indicated that carbohydrates accounted for 10 to 15% of the total DOC measured by wet oxidation meth-ods (5, 22) although values as high as ~35% were reported for the Caribbean Sea (23). We believe that the higher concentrations of carbohydrates measured with the modified MBTH assay result from the more complete hydrolysis of structural polysaccharides (21), which, as we have shown, appear to be abun-dant in the upper ocean.
The application of tangential�flow ultra-filtration to seawater samples has allowed a broad chemical characterization of a relative-ly large fraction of marine DOM, including all colloidal material. Compared to conven-tional hydrophobic adsorption techniques, ultrafiltration is less chemically selective and capable of recovering a greater portion of DOM. Our initial characterizations indicated that the concentration of the >1000- dalton size fraction of seawater DOM is one�tenth of that indicated by Suzuki and colleagues (9, 15) and that the C/N values are two to three times as large. Despite these differences, we concur that high molecular weight compo-nents of DOM are reactive and suggest that polysaccharides are dominant components of this reactive material, perhaps support-ing much of the heterotrophic activity in the surface ocean. Use of ultrafiltration to re-cover DOM from seawater for experimental manipulations and detailed molecular-level characterizations will help resolve the above differences and provide a new understanding of the sources and reactions of the organic molecules composing this major carbon reservoir.
cells (28), whereas only glucosamine andgalactosamine were detected at the end of theincubation (Table 2). The glucosamine:galac-tosamine ratio (2 :1) in bacterially derivedDOM at the end of the incubation was similarto the ratio of these amino sugars in seawater(28).
Recent studies have identified specificcomponents of the cell envelopes of marinebacteria in DOM from the surface and deepocean (4, 5). In addition to this evidence for abacterial source of marine DOM, laboratorystudies with radiotracers and marine bacterianoted the production of refractory DOM fromsimple compounds (9–11). Results from ourstudy support these observations, and indi-cate that diagenetic processing by microor-ganisms is rapid and critical for shaping thecomposition and refractory nature of marineDOM.
The amino sugar muramic acid isuniquely found in the repeating disaccha-ride backbone of the bacterial cell wall
polymer commonly known as peptidogly-can, and it is therefore an excellent biomar-ker for peptidoglycan in DOM (28). In theglucose experiment, muramic acid C con-centrations of 35 to 89 nM were measuredduring the first week of incubation, andbased on a typical muramic acid content inpeptidoglycan (29), we estimate that pepti-doglycan accounted for �1% of the C and�7.5% of the N in DOM. Muramic acidconcentrations were below detection after 1year of incubation (Table 2), indicating thatpeptidoglycan was absent in the refractoryDOM derived from bacteria. This findingwas unexpected given recent observationsin marine DOM of high D/L enantiomerratios in specific amino acids that are foundin the peptide component of peptidoglycan(5). Overall, these results suggest that bac-terial degradation sufficiently alters thestructure of peptidoglycan so that its poly-saccharide component is no longer recog-nizable at the molecular level.
Our results are inconsistent with severalmechanisms that have been proposed forthe formation of refractory organic matterin the ocean. It is unlikely that abioticcondensation reactions or humification pro-cesses (8) were important for producingrefractory DOM in our study, because theincubations were conducted in the dark atlow temperature, concentrations of reac-tants were low, and the compositionalchanges were rapid (hours to days). Thus, itappears that biological processes were crit-ical for the formation of refractory DOM.Specific biochemical components of cellscan be selectively preserved during diagen-esis (30), but these are relatively minorconstituents of cells that should only slowlyaccumulate. Amino acids, neutral sugars,and amino sugars typically compose �70%of bacterial biomass (29), but these bio-chemicals were relatively minor compo-nents of bacterially derived DOM. It ap-pears that the selective preservation of un-usual biochemical components of cellscould not, by itself, account for the rapidformation and accumulation of bacteriallyderived DOM.
Components of bacterial cells are re-leased into the surrounding water as DOMthrough a variety of biological processes,including direct release (11, 31), viral lysis(32), and grazing (33). Exoenzyme activityis critical for the microbial utilization ofthis DOM, and it appears that enzymaticactivity plays an important role in the for-mation of refractory DOM that is of smallsize (34 ). It is possible that nonspecific orpromiscuous activities of enzymes, that oc-cur with much lower efficiency than prima-ry activities (35), occasionally producefragments from macromolecules that es-cape recognition by bacterial enzymes andmolecular-level chemical analyses. Giventhis scenario, the rate of formation of re-fractory DOM is dependent on the rate ofmicrobial activity. This relatively simplemechanism could be responsible for muchof the sequestration of fixed C in the ocean.
References and Notes1. R. Benner, J. D. Pakulski, M. McCarthy, J. I. Hedges,P. G. Hatcher, Science 255, 1561 (1992).
2. M. D. McCarthy, T. Pratum, J. Hedges, R. Benner,Nature 390, 150 (1997).
3. L. L. Clark, E. D. Ingall, R. Benner, Nature 393, 426(1998).
4. E. Tanoue, S. Nishiyama, M. Kamo, A. Tsugita,Geochim. Cosmochim. Acta 59, 2643 (1995).
5. M. D. McCarthy, J. I. Hedges, R. Benner, Science 281,231 (1998).
6. P. M. Williams, E. R. M. Druffel, Oceanography 1, 14(1988).
7. J. I. Hedges et al., Org. Geochem. 31, 945 (2000).8. G. R. Harvey, D. A. Boran, L. A. Chesal, J. M. Tokar,Mar. Chem. 12, 119 (1983).
9. J. E. Brophy, D. J. Carlson, Deep-Sea Res. 36, 497(1989).
Table 2. Chemical composition of bacterially derived DOM in the glucose and glutamate experiments. Allare the mean of duplicate-bottle experiments, except for the data indicated by asterisks, which wereobtained from single bottles. The mean deviation of replicates was 0.9 �M for DOC, 0.2 �M for DON, 2for C/N ratio, and 1 to 2% of DOC, DON, THAS, and THAA compositions. The “uncharacterized” fractionin the glucose experiment is estimated as the difference between the total DOC and the DOC accountedfor as THNS�THAS�THAA, and between the total DON and the DON accounted for as THAA�THAS,except for the data after 1 year, in which THNS was not included (data in parenthesis). The “uncharac-terized” fraction in the glutamate experiment is based only on THAA, because THNS and THAS were notmeasured (indicated by “nm”).
Chemicalcomposition
Initial substrate
Glucose Glutamate
Incubation time(days)
Incubation time(days)
2 4 7 365 2 4 9 560
Concentration of the bulk DOM (�M)DOC 30 18 16 11 18 13 14 9.0DON 1.0 0.7 0.6 1.2 3.1 2.4 1.5 0.7
DOC composition (% as)THNS 2.5 4.9 5.9 nm nm nm nm nmTHAS 0.7 1.4 1.5 3.8 nm nm nm nmTHAA 2.5 4.3 3.7 2.5 13 18* 12 3.1Uncharacterized 94 89 89 (94) 87 82* 88 97
DON composition (% as)THAS 3.4 5.5 6.6 5.6 nm nm nm nmTHAA 22 29 27 6.4 15 31* 33 11Uncharacterized 75 66 67 88 85 69* 67 89
C:N molar ratioBulk 32 26 28 8.9 5.1 5.7 9.3 13Total characterized 7.5 7.9 9.2 (4.6) 3.5 3.1 3.3 3.6Uncharacterized 41 37 37 (10) 5.4 6.3* 12 14
THAS composition (mole %)GalN 20 26 31 33 nm nm nm nmGlcN 55 50 56 67 nm nm nm nmMA 26 24 12 0 nm nm nm nm
THAA composition (mole %)Acidic 26 27 21 30 26 12 17 28Basic 12 10 11 11 8 6 7 8Neutral 23 27 31 41 24 56 36 46Hydrophobic 38 36 37 18 41 27 40 18
R E P O R T S
www.sciencemag.org SCIENCE VOL 292 4 MAY 2001 919
Fig. 2. Concentrations of dissolved carbohy-drates in ultrafiltered DOM as determined by 13C NMR (UDOM-NMR) and a modified MBTH assay(UDOM-TCHO) and the concentrations of total dissolved carbohydrates as determined by using the same modified MBTH assay (TCHO).
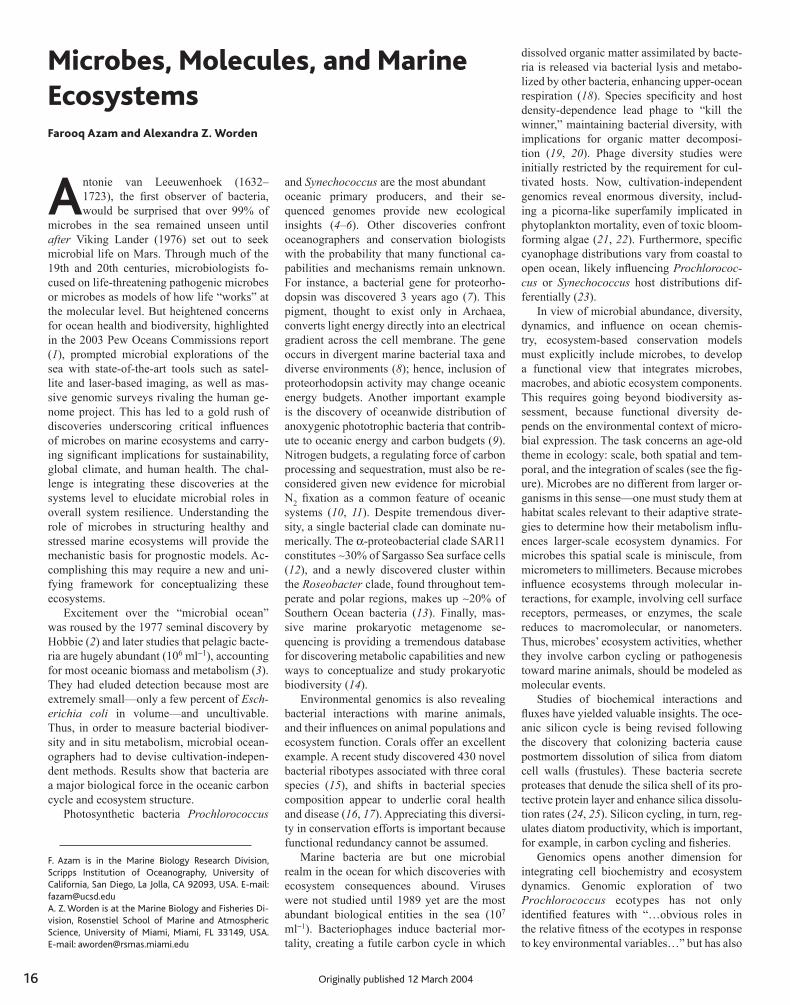
16
Antonie van Leeuwenhoek (1632–1723), the first observer of bacteria, would be surprised that over 99% of
microbes in the sea remained unseen until after Viking Lander (1976) set out to seek microbial life on Mars. Through much of the 19th and 20th centuries, microbiologists fo-cused on life-threatening pathogenic microbes or microbes as models of how life “works” at the molecular level. But heightened concerns for ocean health and biodiversity, highlighted in the 2003 Pew Oceans Commissions report (1), prompted microbial explorations of the sea with state-of-the-art tools such as satel-lite and laser-based imaging, as well as mas-sive genomic surveys rivaling the human ge-nome project. This has led to a gold rush of discoveries underscoring critical influences of microbes on marine ecosystems and carry-ing significant implications for sustainability, global climate, and human health. The chal-lenge is integrating these discoveries at the systems level to elucidate microbial roles in overall system resilience. Understanding the role of microbes in structuring healthy and stressed marine ecosystems will provide the mechanistic basis for prognostic models. Ac-complishing this may require a new and uni-fying framework for conceptualizing these ecosystems.
Excitement over the “microbial ocean” was roused by the 1977 seminal discovery by Hobbie (2) and later studies that pelagic bacte-ria are hugely abundant (106 ml−1), accounting for most oceanic biomass and metabolism (3). They had eluded detection because most are extremely small—only a few percent of Esch-erichia coli in volume—and uncultivable. Thus, in order to measure bacterial biodiver-sity and in situ metabolism, microbial ocean-ographers had to devise cultivation-indepen-dent methods. Results show that bacteria are a major biological force in the oceanic carbon cycle and ecosystem structure.
Photosynthetic bacteria Prochlorococcus
F. Azam is in the Marine Biology Research Division, Scripps Institution of Oceanography, University of California, San Diego, La Jolla, CA 92093, USA. E-mail: [email protected] A. Z. Worden is at the Marine Biology and Fisheries Di-vision, Rosenstiel School of Marine and Atmospheric Science, University of Miami, Miami, FL 33149, USA. E-mail: [email protected]
and Synechococcus are the most abundantoceanic primary producers, and their se-quenced genomes provide new ecological insights (4–6). Other discoveries confront oceanographers and conservation biologists with the probability that many functional ca-pabilities and mechanisms remain unknown. For instance, a bacterial gene for proteorho-dopsin was discovered 3 years ago (7). This pigment, thought to exist only in Archaea, converts light energy directly into an electrical gradient across the cell membrane. The gene occurs in divergent marine bacterial taxa and diverse environments (8); hence, inclusion of proteorhodopsin activity may change oceanic energy budgets. Another important example is the discovery of oceanwide distribution of anoxygenic phototrophic bacteria that contrib-ute to oceanic energy and carbon budgets (9). Nitrogen budgets, a regulating force of carbon processing and sequestration, must also be re-considered given new evidence for microbial N2 fixation as a common feature of oceanic systems (10, 11). Despite tremendous diver-sity, a single bacterial clade can dominate nu-merically. The α�proteobacterial clade SAR11 constitutes ∼30% of Sargasso Sea surface cells (12), and a newly discovered cluster within the Roseobacter clade, found throughout tem-perate and polar regions, makes up ∼20% of Southern Ocean bacteria (13). Finally, mas-sive marine prokaryotic metagenome se-quencing is providing a tremendous database for discovering metabolic capabilities and new ways to conceptualize and study prokaryotic biodiversity (14).
Environmental genomics is also revealing bacterial interactions with marine animals, and their influences on animal populations and ecosystem function. Corals offer an excellent example. A recent study discovered 430 novel bacterial ribotypes associated with three coral species (15), and shifts in bacterial species composition appear to underlie coral health and disease (16, 17). Appreciating this diversi-ty in conservation efforts is important because functional redundancy cannot be assumed.
Marine bacteria are but one microbial realm in the ocean for which discoveries with ecosystem consequences abound. Viruses were not studied until 1989 yet are the most abundant biological entities in the sea (107 ml−1). Bacteriophages induce bacterial mor-tality, creating a futile carbon cycle in which
dissolved organic matter assimilated by bacte-ria is released via bacterial lysis and metabo-lized by other bacteria, enhancing upper-ocean respiration (18). Species specificity and host density-dependence lead phage to “kill the winner,” maintaining bacterial diversity, with implications for organic matter decomposi-tion (19, 20). Phage diversity studies were initially restricted by the requirement for cul-tivated hosts. Now, cultivation-independent genomics reveal enormous diversity, includ-ing a picorna-like superfamily implicated in phytoplankton mortality, even of toxic bloom-forming algae (21, 22). Furthermore, specific cyanophage distributions vary from coastal to open ocean, likely influencing Prochlorococ-cus or Synechococcus host distributions dif-ferentially (23).
In view of microbial abundance, diversity, dynamics, and influence on ocean chemis-try, ecosystem-based conservation models must explicitly include microbes, to develop a functional view that integrates microbes, macrobes, and abiotic ecosystem components. This requires going beyond biodiversity as-sessment, because functional diversity de-pends on the environmental context of micro-bial expression. The task concerns an age-old theme in ecology: scale, both spatial and tem-poral, and the integration of scales (see the fig-ure). Microbes are no different from larger or-ganisms in this sense—one must study them at habitat scales relevant to their adaptive strate-gies to determine how their metabolism influ-ences larger-scale ecosystem dynamics. For microbes this spatial scale is miniscule, from micrometers to millimeters. Because microbes influence ecosystems through molecular in-teractions, for example, involving cell surface receptors, permeases, or enzymes, the scale reduces to macromolecular, or nanometers. Thus, microbes’ ecosystem activities, whether they involve carbon cycling or pathogenesis toward marine animals, should be modeled as molecular events.
Studies of biochemical interactions and fluxes have yielded valuable insights. The oce-anic silicon cycle is being revised following the discovery that colonizing bacteria cause postmortem dissolution of silica from diatom cell walls (frustules). These bacteria secrete proteases that denude the silica shell of its pro-tective protein layer and enhance silica dissolu-tion rates (24, 25). Silicon cycling, in turn, reg-ulates diatom productivity, which is important, for example, in carbon cycling and fisheries.
Genomics opens another dimension for integrating cell biochemistry and ecosystem dynamics. Genomic exploration of two Prochlorococcus ecotypes has not only identified features with “…obvious roles in the relative fitness of the ecotypes in response to key environmental variables…” but has also
Microbes, Molecules, and Marine EcosystemsFarooq Azam and Alexandra Z. Worden
Originally published 12 March 2004

17
inferred biochemical bases for ecotype-specific environmental impacts (5). The Si-licibacter pomeroyi genome is yielding eco-physiological insights into bacteria producing dimethyl sulfide (DMS), a volatile compound that influences cloud formation (26, 27). S. pomeroyi degrades dimethylsulfoniopropio-nate (DMSP) via several pathways, but only one leads to DMS; thus, the relative expres-sion of particular DMSP�degrading enzymes regulates climate. Overarching the microbial activities is the physical organization of or-ganic matter in seawater, allowing the visual-ization of ecosystems as molecular architec-tures. Seawater is structured with cross-linked polymers, colloids, and nano- and microgels, creating an organic matter continuum and a wealth of surfaces displaying activity and bio-diversity hot-spots (3). This structure provides a spatial context for microbial interactions and adaptations, and permits ecosystem analysis in terms of molecular architecture and biochemi-cal fluxes.
These discoveries illustrate that nanoscale biochemical bases of ecosystem function are tractable, informative, and indeed essential, if we are to develop mechanistic models of ocean-basin biogeochemical dynamics. Mi-crobial oceanography has made remarkable strides toward system inventory, exposing tre-mendous diversity of microbial capabilities, and spatial and temporal dynamics. Although they reveal the incredible capacity of microbes to interact with ocean systems, these studies do not address system structure or organiza-tional processes. Biosystems exhibit vari-ability at all organizational scales, from gene
expression to groups of diverse individuals, but all display molecular interconnectedness. Analysis of marine ecosystems as biochemical matrices is complex, but not unlike, for exam-ple, that of neurobiology and systems biology. Modeling efforts must incorporate interaction mechanisms and variability at all ecosystem scales, including the nanometer-to-millimeter realm of microbes and molecules. Such an analysis can now begin, but it will require a convergence of genomics and the nascent field of microscale biogeochemistry, addressing spatially explicit biochemical interactions and their ecosystem consequences. This approach will lead to new testable hypotheses and prog-nostic models.
We propose consideration of concepts that are driving systems biology with its goal of elucidating all significant molecular interac-tions underlying the structure and functioning of a cell or an organism. The approach can be extended to marine ecosystem analysis (“eco-systems biology”), in essence treating the eco-system as dynamic molecular architecture and appreciating real-time expression as the mech-anistic basis of ecosystem dynamics. Although the goal of treating organisms and the environ-ment as a molecular continuum is huge, the rate of progress in genomics and proteomics and its integration into oceanography—a field rich in computational talent—promises suc-cess. Ecosystems biology offers a framework for integrating genomic, biochemical, and en-vironmental data. This framework will also unify efforts for biodiversity conservation and conservation of desirable biogeochemical states of the ocean.
1624
deed essential, if we are to develop mecha-nistic models of ocean-basin biogeochemi-cal dynamics. Microbial oceanography hasmade remarkable strides toward system in-ventory, exposing tremendous diversity ofmicrobial capabilities, and spatial and tem-poral dynamics. Although they reveal theincredible capacity of microbes to interactwith ocean systems, these studies do notaddress system structure or organizationalprocesses. Biosystems exhibit variability atall organizational scales, from gene expres-sion to groups of diverse individuals, butall display molecular interconnectedness.Analysis of marine ecosystems as bio-chemical matrices is complex, but not un-like, for example, that of neurobiology andsystems biology. Modeling efforts must in-corporate interaction mechanisms and vari-ability at all ecosystem scales, includingthe nanometer-to-millimeter realm of mi-crobes and molecules. Such an analysis cannow begin, but it will require a conver-gence of genomics and the nascent field ofmicroscale biogeochemistry, addressingspatially explicit biochemical interactionsand their ecosystem consequences. Thisapproach will lead to new testable hypothe-ses and prognostic models.
We propose consideration of conceptsthat are driving systems biology with its
goal of elucidating all significant molec-ular interactions underlying the structureand functioning of a cell or an organism.The approach can be extended to marineecosystem analysis (“ecosystems biolo-gy”), in essence treating the ecosystemas dynamic molecular architecture andappreciating real-time expression as themechanistic basis of ecosystem dynam-ics. Although the goal of treating organ-isms and the environment as a molecularcontinuum is huge, the rate of progressin genomics and proteomics and its inte-gration into oceanography—a field richin computational talent—promises suc-cess. Ecosystems biology offers a frame-work for integrating genomic, biochemi-cal, and environmental data. This frame-work will also unify efforts for biodiver-sity conservation and conservation ofdesirable biogeochemical states of theocean.
References and Notes1. Pew Foundation Ocean Commissions report, www.
pewoceans.org/oceans/oceans_report.asp (2003).2. J. E. Hobbie et al., Appl. Environ. Microbiol. 33, 1225
(1977).3. F. Azam, Science 280, 694 (1998).4. A. Dufresne et al., Proc. Natl. Acad. Sci. U.S.A. 100,
10020 (2003).5. G. Rocap et al., Nature 424, 1042 (2003).6. B. Palenik et al., Nature 424, 1037 (2003).
7. O. Beja et al., Science 289, 1902 (2000).8. J. R. de la Torre et al., Proc. Natl. Acad. Sci. U.S.A. 100,
12830 (2003).9. Z. S. Kolber et al., Science 292, 2492 (2001).
10. D. G. Capone, J. P. Zehr, H. W. Paerl, B. Bergman, E. J.Carpenter, Science 276, 1221 (1997).
11. J. P. Zehr et al., Nature. 412, 635 (2001).12. R. M. Morris et al., Nature 420, 806 (2002).13. N. Seije, M. Simon, T. Brinkhoff, Nature, 427, 445
(2004).14. J. C. Venter et al., Science, published online 4 March
2004 (10.1126/science.1093857).15. F. Rohwer, V. Seguritan, F. Azam, N. Knowlton, Mar.
Ecol. Prog. Ser. 243, 1 (2002).16. K. Patterson et al., Proc. Natl. Acad. Sci. U.S.A. 99,
8725 (2002).17. J. Frias-Lopez, A. L. Zerkle, G. T. Bonheyo, B. W. Fouke,
Appl. Environ. Microbiol. 68, 2214 (2002).18. J. A. Fuhrman, Nature 399, 541 (1999).19. T. F. Thingstad, R. Lignell, Aquat. Microbiol. Ecol. 13, 19
(1997).20. J. A. Fuhrman, M. Schwalbach, Biol. Bull. 204, 192
(2003).21. M. Breitbart et al., Proc. Natl. Acad. Sci. U.S.A. 99,
14250 (2002).22. A. I. Culley, A. S. Lang, C. A. Suttle, Nature 424, 1054
(2003).23. M. B. Sullivan, J. Waterbury, S. W. Chisholm, Nature
424, 1047 (2003).24. K. Bidle, F. Azam, Nature 387, 508 (1999).25. K. Bidle, M. Manganelli, F. Azam, Science 298, 1980
(2002).26. J. M. Gonzalez et al., Int. J. Syst. Evol. Microbiol. 53,
1261 (2003).27. M. A. Moran, J. M. Gonzalez, R. P. Kiene, Geomicrobiol.
J. 20, 375 (2003).28. We thank T. Hollibaugh, J. Fuhrman, and C. Beardsley
for critical reading of the manuscript; V. Svetlicic, E.Balnois, and D. Kline for sharing unpublished images.Work supported by NSF (OCE132677) and NIH (RO1A146600).
The gastrointestinal tract of humanadults contains more than 400 differ-ent species of bacteria. Indeed, the to-
tal weight of microflora in the human guthas been estimated to be about 1 kg. Mostof these bacteria are commensals that co-exist peacefully with their host and remainharmless provided that they do not straybeyond the gut lumen. Some commensalsmay even confer health benefits upon theirhost by helping to digest dietary carbohy-drate and by maintaining the appropriatebalance among the different types of gutbacteria. The correct microbial balancehelps to stimulate gut immunity and to pre-vent colonization by pathogenic bacteriathat cause diarrhea and other intestinal dis-orders (1).
The intestinal epithelium provides abarrier against the invasion of host tissuesby both pathogenic and nonpathogenicbacteria (2). However, pathogenic bacteriaare able to breach the gut epithelium andthe host’s innate immune system in a num-ber of ways, in some cases destroying gutepithelial cells (3). In contrast to bacterialpathogens, commensals have been pre-sumed to reside in the gut lumen with lit-tle or no direct interaction with the epithe-lium. Recent studies, however, indicatethat gut commensals do interact with thegut epithelium and can trigger innate andadaptive immune responses. In addition,commensals can influence epithelial cellproliferation, for example, by injectingfactors into the gut epithelium that blockβ-catenin degradation (4). These microbesalso enhance the nuclear export of NF-κB,the transcription factor that controls theproduction of proinflammatory chemo-kines by gut epithelial cells (5). On page
1662 of this issue, Macpherson and Uhr(6) reveal that the gut mucosa—compris-ing the gut epithelium, connective tissuelayer (lamina propria), and gut-associatedlymphoid tissues (GALT)—has developedan elegant system for keeping commen-sals in check. They report that commen-sals are prevented from breaching the gutmucosal barrier by an immunoglobulin A(IgA) antibody–mediated mucosal im-mune response. This immune response istriggered by presentation of commensalantigens to B cells in GALT by intestinaldendritic cells (DCs).
Cells of the innate immune system,such as dendritic cells and macrophages,provide broad nonadaptive (innate) protec-tion against microorganisms that are newlyencountered by the host. Activation of in-nate host defense depends on specificrecognition of microbial signature mole-cules called pathogen-associated molecu-lar patterns (PAMPs) (7). In the gut mu-cosa, monocytes and particularly DCs inthe intraepithelial and subepithelial layersare specialized for detecting microbialpathogens. Both cell types recognizePAMPs through pattern-recognition recep-tors that are either secreted or expressed onthe immune cell surface (8). These mole-cules include the Toll-like receptor (TLR)family in animals and the disease resist-
I M M U N O L O G Y
Keeping the Gut Microfloraat Bay
Jean-Pierre Kraehenbuhl and Max Corbett
The authors are at the Swiss Institute forExperimental Cancer Research, CH1066 Epalinges,Switzerland. E-mail: [email protected]
12 MARCH 2004 VOL 303 SCIENCE www.sciencemag.org
P E R S P E C T I V E S
0312Compassff 3/5/04 2:26 PM Page 1624
PHO
TO C
RED
ITS:
(CO
RAL
REEF
) DAV
ID I.
KLI
NE;
(EPI
FLU
ORE
SCEN
CE
MIC
ROG
RAPH
) J. F
UH
RMA
N;
(ATO
MIC
FO
RCE
MIC
ROG
RAPH
) V. S
VET
LI I
& E
. BA
LNO
IS, P
UBL
ISH
ED IN
V. S
VET
LI I
ET A
L.. C
ROAT
CH
EM. A
CTA
79
, 107
(200
6); (
BIO
CH
EMIC
AL
PATH
WAY
S) ©
RO
CH
E D
IAG
NO
STIC
S G
mbH
1623
throughout temperate and polar regions,makes up ~20% of Southern Ocean bacte-ria (13). Finally, massive marine prokary-otic metagenome sequencing is providinga tremendous database for discoveringmetabolic capabilities and new ways toconceptualize and study prokaryotic bio-diversity (14).
Environmental genomics is also reveal-ing bacterial interactions with marine ani-mals, and their influences on animal popu-lations and ecosystem function. Corals of-fer an excellent example. A recent studydiscovered 430 novel bacterial ribotypesassociated with three coral species (15),and shifts in bacterial species composi-tion appear to underliecoral health and disease(16, 17). Appreciatingthis diversity in conser-vation efforts is impor-tant because functionalredundancy cannot beassumed.
Marine bacteria arebut one microbial realm inthe ocean for which dis-coveries with ecosystemconsequences abound.Viruses were not stud-ied until 1989 yet arethe most abundant bio-logical entities in thesea (107 ml−1). Bacterio-phages induce bacterialmortality, creating a fu-tile carbon cycle inwhich dissolved organicmatter assimilated bybacteria is released viabacterial lysis and me-tabolized by other bac-teria, enhancing upper-ocean respiration (18).Species specificity andhost density–dependence lead phage to“kill the winner,” maintaining bacterialdiversity, with implications for organicmatter decomposition (19, 20). Phage di-versity studies were initially restricted bythe requirement for cultivated hosts. Now,cultivation-independent genomics revealenormous diversity, including a picorna-like superfamily implicated in phyto-plankton mortality, even of toxic bloom–forming algae (21, 22). Furthermore, spe-cific cyanophage distributions vary fromcoastal to open ocean, likely influencingProchlorococcus or Synechococcus hostdistributions differentially (23).
In view of microbial abundance, diversi-ty, dynamics, and influence on ocean chem-istry, ecosystem-based conservation modelsmust explicitly include microbes, to devel-op a functional view that integrates mi-
crobes, macrobes, and abiotic ecosystemcomponents. This requires going beyondbiodiversity assessment, because functionaldiversity depends on the environmentalcontext of microbial expression. The taskconcerns an age-old theme in ecology:scale, both spatial and temporal, and the in-tegration of scales (see the figure).Microbes are no different from larger or-ganisms in this sense—one must studythem at habitat scales relevant to their adap-tive strategies to determine how their me-tabolism influences larger-scale ecosystemdynamics. For microbes this spatial scale isminiscule, from micrometers to millime-ters. Because microbes influence ecosys-
tems through molecular interactions, for ex-ample, involving cell surface receptors, per-meases, or enzymes, the scale reduces tomacromolecular, or nanometers. Thus, mi-crobes’ ecosystem activities, whether theyinvolve carbon cycling or pathogenesis to-ward marine animals, should be modeled asmolecular events.
Studies of biochemical interactions andfluxes have yielded valuable insights. Theoceanic silicon cycle is being revised fol-lowing the discovery that colonizing bacte-ria cause postmortem dissolution of silicafrom diatom cell walls (frustules). Thesebacteria secrete proteases that denude thesilica shell of its protective protein layerand enhance silica dissolution rates (24,25). Silicon cycling, in turn, regulates di-atom productivity, which is important, forexample, in carbon cycling and fisheries.
Genomics opens another dimension forintegrating cell biochemistry and ecosys-tem dynamics. Genomic exploration oftwo Prochlorococcus ecotypes has not on-ly identified features with “…obviousroles in the relative fitness of the ecotypesin response to key environmental vari-ables…” but has also inferred biochemi-cal bases for ecotype-specific environ-mental impacts (5). The Silicibacterpomeroyi genome is yielding ecophysio-logical insights into bacteria producing di-methyl sulfide (DMS), a volatile com-pound that influences cloud formation(26, 27). S. pomeroyi degrades dimethyl-sulfoniopropionate (DMSP) via several
pathways, but only one leads to DMS;thus, the relative expression of particularDMSP-degrading enzymes regulates cli-mate. Overarching the microbial activitiesis the physical organization of organicmatter in seawater, allowing the visualiza-tion of ecosystems as molecular architec-tures. Seawater is structured with cross-linked polymers, colloids, and nano- andmicrogels, creating an organic matter con-tinuum and a wealth of surfaces display-ing activity and biodiversity hot-spots (3).This structure provides a spatial contextfor microbial interactions and adaptations,and permits ecosystem analysis in termsof molecular architecture and biochemicalfluxes.
These discoveries illustrate thatnanoscale biochemical bases of ecosystemfunction are tractable, informative, and in-
Microbes in marine ecosystems. Highly abundant and diverse bacteria and viruses (green dots) interact withbiotic and abiotic ecosystem components at the molecular, or nanometer, scale yet critically influence the func-tioning of complex, large-scale marine ecosystems [e.g. endangered coral reefs (right)]. An atomic force micro-scope image of marine polysaccharides (top), a biochemical pathways chart (background) and genome map ofProchlorococcus provide examples of the context for analysis of complex marine ecosystems as dynamic mo-lecular architectures.
PHO
TO C
RED
ITS:
(CO
RAL
REEF
) D
.KLI
NE;
(EPI
FLU
ORE
SCEN
CE
MIC
ROG
RAPH
) J.
FUH
RMA
N;(
ATO
MIC
FO
RCE
MIC
ROG
RAPH
) V.S
VET
LIC
IC &
E.B
ALN
OIS
;(BI
OC
HEM
ICA
L PA
THW
AYS)
BO
EHRI
NG
ER M
AN
NH
EIM
www.sciencemag.org SCIENCE VOL 303 12 MARCH 2004
P E R S P E C T I V E S
0312Compassff 3/5/04 2:25 PM Page 1623
Originally published 12 March 2004

18
Major Bacterial Contribution toMarine Dissolved Organic
NitrogenMatthew D. McCarthy,* John I. Hedges, Ronald Benner
Next to N2 gas, the largest pool of reduced nitrogen in the ocean resides in theenormous reservoir of dissolved organic nitrogen (DON). The chemical identityof most of this material, and the mechanisms by which it is cycled, remainfundamental questions in contemporary oceanography. Amino acid enantio-meric ratios in the highmolecularweight fraction of DON from surface and deepwater in three ocean basins show substantial enrichment in D enantiomers offour amino acids. The magnitude and pattern of these D/L enrichments indicatethat peptidoglycan remnants derived from bacterial cell walls constitute amajor source of DON throughout the sea. These observations suggest thatstructural properties of specific bacterial biopolymers, and the mechanisms fortheir accumulation, are among the central controls on long-term cycling ofdissolved organic nitrogen in the sea.
Most of the surface ocean is characterized bylow to undetectable mineral nutrient concen-trations. Such oligotrophic regions are centralto global geochemical cycles, accounting foralmost 40% of global primary production (1).Recently, the accumulation and advected ex-port of dissolved organic matter (DOM) fromsuch environments has been recognized as amajor pathway for C flux in the upper ocean
(2), a process likely regulated in part by thelow levels of biologically available N (3). Yetthese same waters contain substantial concen-trations of fixed N in dissolved organic com-pounds (4). The apparent lower biologicalaccessibility of this large organic N reservoirthus represents both a major control on upperocean carbon cycles, and a corresponding “Npump” fundamental to closing oceanic Nbudgets (3, 4).
The chemical identity of DON is key tounderstanding the mechanisms by which it isformed and escapes remineralization. Al-though amino acids account for most N inorganisms, only a small fraction of seawater
DON can be identified as amino acid bycommon hydrolytic methods (5). The vastmajority of this dissolved nitrogenous mate-rial appears to be contained in amide func-tional groups (6), suggesting that most long-lived DON is hydrolysis-resistant or com-posed of recalcitrant nonprotein amide-con-taining biochemicals.
Amino acid enantiomeric ratios can pro-vide a powerful tool for characterizing nitro-genous materials (7 ). Early work identifiedelevated levels of D-aspartic acid and D-ala-nine in the open sea, indicating that D-aminoacids may serve as indicators for both DOMsources (8) and for abiotic transformationreactions (9). Limitations of earlier filtrationmethods, however, prevented living bacteriafrom being excluded as a principle source ofthese observations (8), and interpretation wasfurther complicated by substantial variabilityin the observed magnitude and distribution ofD/L ratios with methods then available (10).Recent application of large-scale tangential-flow ultrafiltration to ocean waters has al-lowed reproducible isolation of DOM fromseawater with essentially no contaminationby living organisms or particulate matter (11,12), in quantities sufficient to determine a fullrange of amino acid enantiomeric ratios. Wehave used this method to examine amino acidD/L ratios in the high molecular weight frac-tion of oceanic DOM from the central PacificOcean, the Gulf of Mexico, and the North Sea(13). These samples include surface andabyssal depths in two oligotrophic openocean basins, as well as a biologically dy-namic coastal region.
Recovery efficiencies of ultrafiltered DOM
M. D. McCarthy and J. I. Hedges, University of Wash-ington, School of Oceanography, Box 357940, Seattle,WA 98195, USA. R. Benner, University of Texas, Ma-rine Science Institute, Port Aransas, TX 78373, USA.
*To whom correspondence should be addressed.
Table 1. Bulk properties and D/L–amino acid ratios from a marine cyanobacte-rium and for UDOM from the Central Pacific, Gulf of Mexico, and North Sea (13).Bulk properties include ultrafiltered dissolved organic carbon (UDOC) and nitro-gen (UDON) concentrations, and atomic carbon/nitrogen ratios (C/N)a. UDOCand UDON concentrations are derived from C/N data, the dry weight recovered,and the volume filtered. D–amino acids for UDOM-hydrolyzable amino acids (14)
are expressed as simple enantiomeric ratios, not corrected for the racemizationblanks, which are shown for comparison. Sample collection depth is indicated inmeters. Asterisks indicate samples in which the D/L ratio could not be quantifiedreliably due to chromatographic mixtures (as indicated by GC-MS); ND (notdetected), samples in which the value was less than 1.5 � racemization blank. S.bacillaris, Synechococcus bacillaris (25).
Bulkproperties andD/L–aminoacid ratios
Blank S. bacillaris
Central Pacific Gulf of Mexico N. Sea
2 100 375 4000 m 10 2 400 m 2 m
DOC (�M) – – 82 85 53 45 95 97 58 76UDOC (�M) – – 22.2 22.2 10.6 8.08 21.1 9.73 1.26 10.1UDON (�M) – – 1.33 1.42 0.63 0.45 1.19 0.63 0.09 0.71(C/N)a – – 16.8 15.6 16.9 18.4 17.8 15.4 14.2 14.2
Asp 0.09 0.14 0.39 0.39 0.36 0.33 0.28 0.18 0.22 0.17Glu 0.06 0.09 0.23 0.17 0.20 0.19 0.16 0.13 0.14 0.12Ser 0.03 ND 0.19 0.19 0.28 0.18 0.21 0.18 0.28 0.15Thr 0.00 ND ND ND ND 0.15 ** ND 0.05 NDAla 0.03 0.38 0.52 0.54 0.47 0.49 0.53 0.47 0.61 0.37Tyr 0.04 ND ND 0.10 ** ** ND ND 0.10 NDMet 0.08 ND ND ND ** ND ND ND ND NDVal 0.02 ND ND 0.07 ND 0.06 ND ND 0.13 NDPhe 0.02 0.04 0.04 0.05 0.04 0.04 ** 0.11 0.04 **Leu 0.07 ND 0.12 0.13 0.12 ** ND 0.14 ** NDLys 0.04 0.07 ND 0.09 0.12 0.09 ND 0.08 ND ND
R E P O R T S
www.sciencemag.org SCIENCE VOL 281 10 JULY 1998 231
Major Bacterial Contribution to Marine Dissolved Organic NitrogenMatthew D. McCarthy,* John I. Hedges, Ronald Benner
Next to N2 gas, the largest pool of reduced nitrogen in the ocean resides in the enormous reservoir of dissolved organic nitrogen (DON). The chemical identity of most of this material, and the mechanisms by which it is cycled, remain fundamental questions in contemporary oceanography. Amino acid enantiomeric ratios in the high molecular weight fraction of DON from surface and deep water in three ocean basins show substantial enrichment in D enantiomers of four amino acids. The magnitude and pattern of these D/L enrichments indicate that peptidoglycan remnants derived from bacterial cell walls constitute a major source of DON throughout the sea. These observations suggest that structural properties of specific bacterial biopolymers, and the mechanisms for their accumulation, are among the central controls on long-term cycling of dissolved organic nitrogen in the sea.
Originally published 10 July 1998

19
(UDOM) are typically �20% in deep watersand �30% in surface waters (Table 1) (12),although very large sample sizes decreaserelative recoveries (13). Average C/N ratiosfor this sample set were 17.0 for surface and16.5 for deep water UDOM, respectively (Ta-ble 1). Hydrolyzable amino acids in these, aswell as similar samples, constitute 10 to 20%of total UDOM N (5, 6). Surface and deepUDOM samples show substantial and highlycharacteristic D/L–amino acid ratios for allthe sampled ocean basins (Table 1 and Fig.1). Alanine (Ala), aspartic acid (Asp), glu-tamic acid (Glu), and serine (Ser) consistent-ly have D/L ratios far above blank levels(Table 1 and Fig. 2) (14). Ala shows the mostpronounced enrichment, with D/L ratios near0.5, whereas Asp, Glu, and Ser ratios gener-ally fall between 0.2 and 0.4. No otherD–amino acids could be repeatably detectedabove blank levels (Fig. 1). The D/L ratios ofthese four were remarkably consistent be-tween widely separate locations, samplingtimes, and ocean depths (Fig. 1) and appear to
represent a fundamental signature of UDOMthroughout the ocean.
D–Amino acids are gradually produced inancient organic matrices by abiotic racemiza-tion and may also be formed by degradationreactions of specific protein L–amino acids(9). However, the amino acid D/L and molarsignatures in UDOM are not consistent witheither of these origins. Bada and Hoopes (9)suggested abiotic dehydration of Ser as themost likely explanation for the near racemicD/L-Ala ratios they observed in the deep Pa-cific. This mechanism should produce linkeddecreases in Ser and threonine (Thr) as wellas a concomitant buildup of �-amino butyricacid (Aba) (9). UDOM isolates, however,exhibit no increased D-Ala at depth and min-imal variation in mole percent Ser or Thr (5).Similarly, no Aba was detected by gas chro-matographic–mass spectral (GC-MS) analy-sis of any sample.
Although abiotic equilibration of enantio-meric forms is a well-known D–amino acidsource, stereochemical inversion rates at
ocean temperatures should be far too slow (8,15) to account for appreciable racemizationover average DOM residence times of 4000to 6000 years (16, 17). Even if D–amino acidsignatures represent a far older component ofUDOM, the observed highly selective patternof D enrichment remains inconsistent withabiotic generation. Although multiple factorsaffect geochemical racemization rates (18),relative rates among different amino acidsgenerally follow a regular succession (19).Ala in particular is among the slower aminoacids to racemize (20). At the observed AlaD/L ratio of �0.5, abiotically derived D/Lratios of both phenylalanine (Phe) and inparticular Asp (21) should be approachingtheir equilibrium D/L value of 1.0 (Fig. 2).However, in UDOM values of Asp are amongthe lowest observed D/L ratios, and D-Phewas near blank levels (Fig. 2). Moreover, theabsence of any depth trend in the D/L ratios ofany amino acid (Fig. 1) argues strongly thatthe stereoisomeric compositions of UDOMamino acids are not generated by aging or
Fig. 1 (left). UDOM D/L ratios for (A) Central Pacific, (B) Gulf of Mexico, and(C) North Sea at various depths for the four principle amino acids. Open barfor Gulf of Mexico represents the surface sample (10 m) independentlyprocessed with 0.2-�m cartridge filters (13). Dashed lines reflect averagevalues for all the other amino acids measured. D/L values in this figure havebeen adjusted for racemization blanks by subtracting molar quantitiesexpected from hydrolytic racemization from total molar quantities of D-acidmeasured. These estimates do not account for reverse racemization oforiginal D forms, and thus represent minimum ratios. Fig. 2 (above).Alternative D–amino acid sources: Comparison of the magnitudes and dis-tributions of D–amino acid ratios encountered in UDOM with those fromother potential sources. Hydrolysis: Average hydrolysis blank D/L ratios(hatched bars) are superimposed on overall average UDOM D/L ratios (solidbars). Average racemization blanks were D/L ratios produced from pure Lmixtures during hydrolysis. Abiotic racemization: Relative abiotic D/L ratios(dark bars), based on relative racemization rates for natural waters (20),were estimated to correspond with a hypothetical average “abiotic” UDOMD/L-Ala ratio of 0.5.
R E P O R T S
10 JULY 1998 VOL 281 SCIENCE www.sciencemag.org232Originally published 10 July 1998
Fig. 1. (left). UDOM D/L ratios for (A) Central Pacific, (B) Gulf of Mexico, and (C) North Sea at various depths for the four principle amino acids. Open bar for Gulf of Mexico represents the surface sample (10 m) independently processed with 0.2-μm cartridge filters (13). Dashed lines reflect average values for all the other amino acids measured. D/L values in this figure have been adjusted for racemization blanks by subtracting molar quantities expected from hydrolytic racemization from total molar quantities of d-acid measured. These estimates do not account for reverse racemization of original dforms, and thus represent minimum ratios.
Fig. 2. (above). Alternative d–amino acid sources: Comparison of the magnitudes and distributions of D–amino acid ratios encountered in UDOM with those from other potential sources. Hydrolysis: Average hydrolysis blank D/L ratios (hatched bars) are superimposed on overall average UDOM D/L ratios (solid bars). Average racemization blanks were D/L ratios produced from pure L mixtures during hydro-lysis. Abiotic racemization: Relative abiotic D/L ratios (dark bars), based on relative racemization rates for natural waters (20), were estimated to correspond with a hypothetical average “abiotic” UDOM D/L-Ala ratio of 0.5.
20
selective utilization of L–amino acids overtime, but instead represent an intrinsic bio-chemical signature of seawater DON.
The principal biochemical sources ofD–amino acids are peptidoglycans, the mainstructural component of bacterial cell walls.Peptidoglycans are heterogeneous polymerscomposed of an amino-sugar backbone cross-linked with peptide bridges. The bridging pep-tides are characterized by a number of unusualnonprotein amino acids and D–amino acids. Inparticular, the D-enantiomeric forms of Ala,Glu, and Asp are prevalent (22). D-Ala is themost abundant D–amino acid in most pepti-doglycans and the only one that is universallyincorporated (23). The enantiomeric patternsthat characterize UDOM thus closely matchthose characteristic of bacterial peptidoglycans.
Because free-living bacteria are abundant inocean water, direct contamination of DON iso-lates must be carefully excluded (8). OurUDOM isolation protocol was designed to re-move essentially all natural microorganisms,and its efficacy has been verified both by filterintercomparison and direct bacterial counts. Onaverage, �99% of oceanic bacteria are re-moved by the 0.1-�m pore size filters withwhich most samples were processed beforeUDOM isolation. In addition, the central Pacif-ic samples were directly examined by epifluo-rescence microscopy after passage through the0.1-�m pore size prefilter, and bacterial num-bers were below detection (12). Typical esti-mates for N per cell of oceanic bacteria (24)indicate that even a maximal limit of 10% oforiginal microbes passing the 0.1-�m pore sizefilter would contribute less than 1% to totalUDOM amino acids. The previously mentionedlack of any depth trend in UDOM D–aminoacid abundance, despite a corresponding 10-fold decrease in bacterial abundance (12), con-firms that the observed D–amino acids derivenot from concentrated bacteria, but from thevastly larger pool of nonliving DOM.
The observed high D/L ratios strongly sug-gest that peptidoglycans constitute a majorcomponent of UDOM N. Most characterizedoceanic water column bacteria are Gram-neg-ative, typified by relatively thin peptidogly-can layers (22). Although the specific bacte-rial sources of peptidoglycan in the open seaare unknown, the cell wall–enriched fractionof a cosmopolitan oceanic cyanobacterium,Synechococcus bacillaris, gives Ala D/L ra-tios of 0.38, in the same general range asUDOM values (Table 1) (25). This supportsprior evidence that cell wall material of ma-rine bacteria is compositionally similar to thatof terrestrial bacteria (26). The contrastingrelative amounts of other D–amino acids fromSynechococcus suggests, as would be expect-ed, that this bacterial species alone does notdominate UDOM sources.
Because of the inherent variability amongknown peptidoglycan structures (27) and the
poorly defined species compositions of marinebacterial communities, finite percentages ofpeptidoglycan in UDOM isolates cannot bequantified with certainty. However, the follow-ing rough estimate of relative N contributionscan be made using broad structural information.Ala represents the most useful source tracer,because it is a main component of proteins andhas the most consistent D/L ratios within studiedpeptidoglycans (22, 23). The D enantiomermakes up about 30% of total hydrolyzable Alain UDOM [percent D � D/(D�L), thus 30% D
is equivalent to a D/L ratio of �0.5], whereaspure peptidoglycans contain �40 to 50% D-Ala. On the basis of these D–amino acid con-tents and average structural features of commonpeptidoglycans and proteinacous materials, acalculation of the relative total N contributionsfrom these two biochemical types can be made.Such a calculation (28) indicates that pepti-doglycan accounts for a similar amount of thetotal N (45 to 80%) as is derived from hydro-lyzable protein. Thus, in terms of N, this onestructural biopolymer may be at least as abun-dant in UDOM as conventional proteinaceousmaterial. In fact, this could be a minimal esti-mate, because conventional hydrolytic methodsare optimized at near 100% for proteins (29)and might be substantially less efficient forpeptidoglycan residues in an environmentalmatrix. Methods that define “protein” on thebasis of total hydrolyzable amino acid yieldsfrom seawater DOM would also actually in-clude a component of peptidoglycan-derivedamino acid.
Such a large peptidoglycan component car-ries major implications regarding the chemicalcomposition of the high molecular weight frac-tion of marine DOM. For example, UDOM alsoshould be enriched in amino sugar, a majorcomponent of peptidoglycan. Such an enrich-ment is consistent with aldose-poor UDOMsugar composition (5), as well as the specificidentification of an amino sugar component bythermal desorbtion–mass spectrometry (30) andpyrolysis (31). In addition, comparison of aver-age amino acid compositions of UDOM (5)with those of planktonic sources (32) indicatesthat UDOM is measurably enriched in Ala, Glu,and Ser, consistent with an additional nonpro-teinaceous source for these specific amino ac-ids. Finally, evidence for an important pepti-doglycan component is supported by previouslymentioned observations (6) of a predominantamide component not quantifiable by conven-tional amino acid analysis.
Although UDOM alone accounts for a sub-stantial fraction of total oceanic DOM, the ex-tent to which these results apply to all dissolvednitrogenous material will be determined byoverall size-related compositional trends. Theextent of such size-related differences withinthe oceanic DOM pool are not fully known.However, comparisons of many properties ofUDOM and total DOM (for example, C/N ra-
tios, stable isotopic ratios, radiocarbon content,amino acid yields, and molecular-level signa-tures) indicate a high degree of overall compo-sitional similarity (5, 11, 12). Recent studies offiltered whole seawater from the surface ArcticOcean has yielded almost identical D–aminoacid distributions and ratios as those in ourUDOM isolates, yet from a distinctly separateocean region (33). Earlier identification of highD–amino acid concentrations in unfractionatedseawaters (8, 9), though more variable, is alsoconsistent with the presence of peptidoglycanstructural remnants in smaller size classes ofdissolved material.
Given that N from algae, as well as most ofthat from bacteria, is in the form of proteinscontaining no D–amino acids, the elevated D/Lratios in UDOM indicate that the high molec-ular weight nitrogenous material dissolved inseawater is enriched in bacterial cell wall ma-terial. Bacteria are widely recognized as majorconsumers of organic matter and in some oli-gotrophic ocean regions may also be the majorprimary producers (34). Thus, abundant poten-tial sources for bacterial cell-wall material like-ly exist throughout the water column. The ac-cumulation and environmental persistence ofthese materials may also be related in part tointrinsic structural properties. Structural poly-mers can display long-term geochemical stabil-ity (35). The interwoven polysaccharide matrixof peptidoglycan, coupled with the unusualpeptide substituents and structural variability,creates a heteropolymer resistant to many com-mon hydrolytic enzymes (36). In addition, lab-oratory experiments and the identification ofspecific bacterial membrane proteins in seawa-ter (37, 38) suggest that more labile biochemi-cals may also be shielded by close associationin a cell-wall matrix.
The high D/L-amino acid ratios found inUDOM indicate that a substantial fraction ofdissolved organic N in the sea is of bacterialorigin. This result challenges the common par-adigm that the enormous reservoir of oceanicdissolved material is predominantly derivedfrom algal sources. Central oceanic ecosystemsare characterized by intensive bacterial recy-cling of DOM, coupled with similarly dynamicbacterial removal by protozoans and viruses(39). These processes represent direct pathwaysfor introduction of bacterial cell wall structuresinto dissolved and colloidal seawater pools (38,40), where minor differences in bioreactivitymay result in substantial accumulation. Bacte-rial predation, coupled with the intrinsic struc-tural properties of bacterial cell wall material,may thus be among the major controls on thelong-term cycling of organic N in the sea.
References and Notes1. S. D. Killops and V. J. Killops, An Introductionto Organic Geochemistry, R. C. O. Gill, Ed. (LongmanGeochemistry Series, Longman, New York, ed. 1,1993).
2. C. A. Carlson, H. W. Ducklow, A. F. Michaels, Nature
R E P O R T S
www.sciencemag.org SCIENCE VOL 281 10 JULY 1998 233

21
371, 405 (1994); A. F. Michaels, N. R. Bates, K. O.Buesseler, C. A. Carlson, A. H. Knap, ibid. 372, 537(1994).
3. P. J. L. B. Williams, Mar. Chem. 51, 17 (1995).4. G. A. Jackson and P. M. Williams, Deep Sea Res. 32,223 (1985).
5. M. D. McCarthy, J. I. Hedges, R. Benner, Mar. Chem.55, 281 (1996).
6. M. D. McCarthy, J. I. Hedges, T. Pratum, R. Benner,Nature 390, 150 (1997).
7. K. Kvenvolden, Annu. Rev. Earth Planet. Sci. 3, 183(1975).
8. C. Lee and J. Bada, Limnol. Oceanogr. 22, 502 (1977).9. J. L. Bada and E. A. Hoopes, Nature 282, 822 (1979).10. In whole seawater hydrolysates from the central Pacific,Lee and Bada (8) found D/L ratios of Ala and Asp to besimilar in both surface and deep waters, ranging from0.05 to 0.16. They also reported, however, substantialdifferences in Asp D/L ratio between the Atlantic andPacific. In contrast, Bada and Hoopes (9), using similarisolation methods, reported D/L-Ala ratios between 0.4and 0.7 in surface Pacific waters, increasing to nearracemic values of 0.8 to 1.0 in the deep.
11. R. Benner, J. D. Pakulski, M. D. McCarthy, J. I. Hedges,P. G. Hatcher, Science 255, 1561 (1992).
12. R. Benner, B. Biddanda, B. Black, M. D. McCarthy, Mar.Chem. 57, 243 (1997).
13. Most samples were prefiltered with an Amicon DC10ultrafiltration system with a 0.1-�m pore size poly-sulfone hollow-fiber filter, before isolation of UDOM[1 nm � UDOM � 0.1 �m]. The first set of Gulf ofMexico isolates (27°N, 95°W) was prefiltered withNucleopore 0.2-�m cartridges as an alternate andindependent method. Central Pacific samples werecollected in April 1992 at 12°S, 135°W from 2 to4000 m. Gulf of Mexico samples were collected ontwo separate cruises. In August 1991, the 10-m sam-ple (1000 liters) was collected at 27°N, 95°W. In Julyof 1995, two very large integrated samples (4000�liters) were collected from 2 and 400 m at regularintervals on a transect between Corpus Christi, Texas,and Key West, Florida. The North Sea surface samplewas also integrated on a transect across the centralNorth Sea in April 1995. Such very large sample sizesare compositionally representative, but result in sub-stantial decreases in relative recovery (Table 1) dueto high concentration factors (11).
14. UDOM amino acid hydrolysis was conducted at150°C for 70 min, generally with the method ofCowie and Hedges (29). Individual D– and L–aminoacids were quantified as pentafluoropropyl isopropylesters by gas chromatography with flame ionizationdetection (41), and peak identities were verified byGC-MS. Analytical variability in D/L ratios of UDOMsamples was less than 15%. Racemization blankswere determined by multiple hydrolyses of pureL–amino acid mixtures, as well as protein standards.Enantiomeric ratios in commercially available D–ami-no acid–containing peptides could be repeatably de-termined to within 5%.
15. J. L. Bada and E. H. Mann, Earth Sci. Rev. 16, 21(1980).
16. P. M. Williams and E. R. M. Druffel, Nature 330, 246(1987).
17. P. H. Santschi et al., Geochim. Cosmochim. Acta 59,625 (1995).
18. R. Mitterer and N. Kriausakul, Org. Geochem. 7, 91(1984); R. W. L. Kimber and P. E. Hare, Geochim.Cosmochim. Acta. 56, 739 (1992).
19. J. L. Bada, in Chemistry and Biochemistry of the AminoAcids, G. C. Barrett, Ed. (Chapman & Hall, New York,1985), p. 684.
20. ����, in Kinetics of the Non-Biological Decompo-sition and Racemization of Aminos Acids in NaturalWaters, J. D. Hem, Ed. (American Chemical Society,Washington, DC, 1971), pp. 308–331.
21. G. A. Goodfriend, Nature 357, 399 (1992).22. H. J. Rogers, in Aspects of Microbiology [Van Nos-trand Reinhold, Wokingham, UK, 1983), vol. 7, pp.6–25.
23. J.-M. Ghuysen and G. D. Shockman, in Bacterial Mem-branes and Walls, L. Leive, Ed. (Dekker, New York,1973), vol. 1.
24. J. Fuhrman, in Primary Productivity and Biogeochemi-cal Cycles in the Sea (Plenum, New York, 1992), pp.361–383.
25. Insoluble structural and cell-wall material was con-centrated from lysed cells of the cosmopolitan cya-nobacterium S. bacillaris, as described (A. Biersmithand R. Benner, Mar. Chem., in press).
26. D. J. W. Moriarty, Oecologia 26, 317 (1977).27. K. H. Schleifer and O. Kandler, Bacteriol. Rev. 36, 407(1972).
28. Relative contributions of total UDOM N from pro-teinaceous material and peptidoglycan were esti-mated using the proportions of D- and L-Ala nec-essary to produce observed UDOM D/L ratios. AllD-Ala was assumed to derive from peptidoglycans,and L-Ala was assumed to come from a mixture ofpeptidoglycan and proteinaceous material. Relativeamino acid compositions in marine proteinaceoussources are largely invariant (32), and accordinglythe total proteinaceous N can be approximated as12 � (Ala-N). Similarly, an estimate of total pep-tidoglycan N can be derived from common pepti-doglycan architecture as roughly 5.7 � (D-Ala N),which includes N contribution from both aminosugar backbone and peptide interbridges (22). ForUDOM D/L ratios of 0.5 to 0.6 (equivalent to�30% D) and peptidoglycan D/L ratios of 0.7 to 1.0(equivalent to near 50% D), this calculation indi-cates that the peptidoglycan N is 45 to 80% aslarge as the proteinaceous N contribution.
29. G. L. Cowie and J. I. Hedges, Mar. Chem. 37, 223(1992).
30. J. J. Boon, V. Klap, T. Eglinton, Org. Geochem., inpress.
31. J. D. H. van Heemst, M. Baas, J. W. de Leeuw, R.Benner, in Organic Geochemistry, K. Oygard, Ed.(Falch Hurtigtrykk, Oslo, Norway, 1993), pp. 694–698.
32. G. L. Cowie and J. I. Hedges, Limnol. Oceanogr. 37,703 (1992).
33. H. P. Fitznar, J. M. Lobbes, G. Kattner, personalcommunication.
34. L. Campbell, H. A. Nolla, D. Vaulot, Limnol. Oceanogr.39, 954 (1994).
35. J. W. de Leuuw and C. Largeau, in Organic Geochem-istry, M. Engle and S. A. Macko, Eds. (Plenum, NewYork, 1993), pp. 23–72.
36. H. J. Rogers, Ann. N.Y. Acad. Sci. 235, 29 (1974).37. E. Tanoue, Mar. Chem. 51, 239 (1995).38. T. Nagata and D. L. Kirchman, Adv. Microb. Ecol. 15,81 (1997).
39. J. A. Fuhrman and R. T. Noble, Limnol. Oceanogr. 40,1236 (1995).
40. J. A. Fuhrman and C. A. Suttle, Oceanography 6, 51(1993).
41. M. H. Engel and P. E. Hare, in Chemistry and Biochem-istry of the Amino Acids, G. C. Barrett, Ed. (Chapman& Hall, New York, 1985), pp. 461–479.
42. We thank G. Cowie for inspiration and help withamino acid analysis, B. Black for help with sampleprocessing, H. P. Fitznar for sharing work in progress,C. Lee for valuable discussions and insight, and D.Bear for guidance and support.
31 March 1998; accepted 11 June 1998
The CO2 Balance ofUnproductive Aquatic
EcosystemsCarlos M. Duarte* and Susana Agustı
Community respiration (R) rates are scaled as the two-thirds power of the grossprimary production (P) rates of aquatic ecosystems, indicating that the role ofaquatic biota as carbon dioxide sources or sinks depends on its productivity.Unproductive aquatic ecosystems support a disproportionately higher respi-ration rate than that of productive aquatic ecosystems, tend to be heterotrophic(R � P), and act as carbon dioxide sources. The average P required for aquaticecosystems to become autotrophic (P � R) is over an order of magnitudegreater for marshes than for the open sea. Although four-fifths of the upperocean is expected to be net heterotrophic, this carbon demand can be balancedby the excess production over the remaining one-fifth of the ocean.
Aquatic ecosystems cover 70% of Earth’s sur-face (1) and contribute 45% of the global pri-mary production (2). Yet, the role of their biotain the global CO2 budget remains a subject ofdebate (3–5). Many freshwater ecosystems actas CO2 sources (6); in contrast, oceanic ecosys-tems are assumed to act as CO2 sinks (7, 8).This assumption has been challenged by calcu-lations suggesting that the coastal ocean may benet heterotrophic (9) and by the finding thatbacterial metabolism exceeds phytoplanktonproduction in unproductive waters (10), which
make up �30% of the ocean. These conclu-sions are based on indirect calculations andcontroversial assumptions (3). Here, we com-pare the gross primary production (P) and res-piration (R) rates of aquatic communities toelucidate whether the biota of aquatic ecosys-tems acts as net CO2 sources (R � P) or sinks(R � P). We compiled data obtained over thepast five decades from studies in which oxygenevolution was used as a surrogate for carbonfluxes (11).
Community metabolism varied by over fourorders of magnitude across aquatic ecosystems(Table 1). Marshes tended to be more produc-tive than other aquatic ecosystems, whereasopen sea communities showed the lowest pro-duction and respiration rates (Table 1). The
Centro de Estudios Avanzados de Blanes, ConsejoSuperior de Investigaciones Cientıficas, Camı de SantaBarbara s/n, 17300 Blanes, Girona, Spain.
*To whom correspondence should be addressed.
R E P O R T S
10 JULY 1998 VOL 281 SCIENCE www.sciencemag.org234

22
O C E A N O G R A P H Y
Dissolved Organic CarbonSupport of Respiration in the
Dark OceanJavier Arıstegui,1* Carlos M. Duarte,2 Susana Agustı,2
Marylo Doval,3 Xose A. Alvarez-Salgado,4 Dennis A. Hansell5
Recent evidence that dissolved organic car-bon (DOC) is a significant component of theorganic carbon flux below the photic layer ofthe ocean (1), together with verification ofhigh respiration rates in the dark ocean (2),suggests that the downward flux of DOC mayplay a major role in supporting respirationthere. Here we show, on the basis of exami-nation of the relation between DOC and ap-parent oxygen utilization (AOU), that theDOC flux supports �10% of the respirationin the dark ocean.
The contribution of DOC to pelagic res-piration below the surface mixed layer can beinferred from the relation between DOC andapparent oxygen utilization (AOU, �M O2),a variable quantifying the cumulative oxygenconsumption since a water parcel was last incontact with the atmosphere. However, as-sessments of DOC/AOU relations have beenlimited to specific regions of the ocean (3, 4 )and have not considered the global ocean. Weassembled a large data set (N � 9824) of
concurrent DOC and AOU observations col-lected in cruises conducted throughout theworld’s oceans (fig. S1, table S1) to examinethe relative contribution of DOC to AOUand, therefore, respiration in the dark ocean.AOU increased from an average (�SE)96.3 � 2.0 �M at the base of the surfacemixed layer (100 m) to 165.5 � 4.3 �M atthe bottom of the main thermocline (1000 m),with a parallel decline in the average DOCfrom 53.5 � 0.2 to 43.4 � 0.3 �M C (Fig. 1).In contrast, there is no significant decline in
DOC with increasing depth beyond 1000 mdepth (Fig. 1), indicating that DOC exportedwith overturning circulation plays a minorrole in supporting respiration in the oceaninterior (5). Assuming a molar respiratoryquotient of 0.69, the decline in DOC accountsfor 19.6 � 0.4% of the AOU within the top1000 m (Fig. 1). This estimate represents,however, an upper limit, because the correla-tion between DOC and AOU is partly due tomixing of DOC-rich warm surface waters
with DOC-poor cold thermocline waters (6 ).Removal of this effect by regressing DOCagainst AOU and water temperature indicatesthat DOC supports only 8.4 � 0.3% of therespiration in the mesopelagic waters.
These results confirm that DOC makes asmall but significant contribution toward themaintenance of respiratory processes in thedark ocean. DOC use accounts for only�10% of the AOU in mesopelagic waters,indicating that the bulk of the respirationwithin the mesopelagic zone is supported bythe flux of sinking POC. This estimate for thecontribution of DOC oxidation to globalAOU is supported by the independent find-ings that net DOC production accounts for�20% of net community production in thesurface ocean (7), that DOC export contrib-utes to 10 % of the export below 500 m (8),and that the total AOU in the deep ocean is inagreement with that expected from the flux ofsinking POC (9). It is the DOC accumulatingas a function of primary production in thesurface ocean, which is exported with over-turning circulation, that dominates the DOCfraction of AOU development. Our findingsindicate that the POC flux, which appears tobe severely underestimated by sediment trapsin the mesopelagic zone (10), is much greaterthan the DOC flux and supports the bulk(�90%) of the respiratory carbon demand inthe dark ocean.
References1. C. A. Carlson, H. W. Ducklow, A. F. Michaels, Nature371, 405 (1994).
2. P. A. del Giorgio, C. M. Duarte, Nature 420, 379(2002).
3. M. D. Doval, D. A. Hansell, Mar. Chem. 68, 249 (2000).4. E. T. Peltzer, N. A. Hayward, Deep Sea Res. Part II 43,155 (1996).
5. D. A. Hansell, C. A. Carlson, Nature 395, 263 (1998).6. X. A. Alvarez-Salgado, F. F. Perez, A. F. Rıos, M. D.Doval, Sci. Mar. 65, 1 (2001).
7. D. A. Hansell, C. A. Carlson, Global Biogeochem.Cycles 12, 443 (1998).
8. D. A. Hansell, in Biogeochemistry of Marine DissolvedOrganic Matter, D. A. Hansell, C. A. Carlson, Eds.(Academic, San Diego, CA, 2002), pp. 685–715.
9. R. A. Jahnke, Global Biogeochem. Cycles 10, 71(1996).
10. J. C. Scholten et al., Deep Sea Res. Part II 48, 243(2001).
Supporting Online Materialwww.sciencemag.org/cgi/content/full/298/5600/1967/DC1Fig. S1Table S1
1Facultad de Ciencias del Mar, Campus Universitariode Tafira, Universidad de las Palmas de Gran Canaria,35017 Las Palmas de Gran Canaria, Spain. 2IMEDEA(CSIC-UIB), Instituto Mediterraneo de Estudios Avan-zados, Miquel Marques 21, 07190 Esporles (IslasBaleares), Spain. 3CCCMM ( XUGA), Centro de Controlde Calidade do Medio Marino, Peirao de Vilaxoan s/n,Vilagarcıa de Arousa, Spain. 4IIM (CSIC), Instituto deInvestigacions Marinas, Eduardo Cabello 6, 36208Vigo, Spain. 5RSMAS, University of Miami, Miami, FL33149, USA.
*To whom correspondence should be addressed. E-mail: [email protected]
Fig. 1. The depth distribution of the average (mean � SE of data grouped by 100-m bins, N �9578) DOC (full circles) concentration and AOU (empty circles) in the ocean (A) and the relationbetween DOC and AOU in the ocean (B). The symbols represent mean � SE DOC concentrationsof data grouped by 10 �M AOU bins (N � 9824). The inset in (B) shows the relation for the rawdata (N � 9824), which is described, in the interval 0 � AOU � 150, by the fitted regressionequation DOC� 60.3 (�0.2)� 0.136 (�0.003) AOU (R 2� 0.28, P� 0.0001, N� 5541). Multipleregression analysis, also using water temperature (°C) as an independent variable, improves the fit,yielding the equation DOC � 48.0 (�0.2) � 0.81 (�0.01) T � 0.058 (�0.002) AOU (R2 � 0.69,P � 0.0001, N � 5371). The monotonic decrease of DOC for AOU � 225 corresponds to theoxygen minimum zones of the Arabian Sea, Indian Ocean, and equatorial Pacific Ocean.
B R E V I A
www.sciencemag.org SCIENCE VOL 298 6 DECEMBER 2002 1967
Dissolved Organic Carbon Support of Respiration in the Dark OceanJavier Arísteguí,1* Carlos M. Duarte,2 Susana Agustí,2 Marylo Doval,3 Xosé A. Álvarez-Salgado,4 Dennis A. Hansell5
O C E A N O G R A P H Y
Dissolved Organic CarbonSupport of Respiration in the
Dark OceanJavier Arıstegui,1* Carlos M. Duarte,2 Susana Agustı,2
Marylo Doval,3 Xose A. Alvarez-Salgado,4 Dennis A. Hansell5
Recent evidence that dissolved organic car-bon (DOC) is a significant component of theorganic carbon flux below the photic layer ofthe ocean (1), together with verification ofhigh respiration rates in the dark ocean (2),suggests that the downward flux of DOC mayplay a major role in supporting respirationthere. Here we show, on the basis of exami-nation of the relation between DOC and ap-parent oxygen utilization (AOU), that theDOC flux supports �10% of the respirationin the dark ocean.
The contribution of DOC to pelagic res-piration below the surface mixed layer can beinferred from the relation between DOC andapparent oxygen utilization (AOU, �M O2),a variable quantifying the cumulative oxygenconsumption since a water parcel was last incontact with the atmosphere. However, as-sessments of DOC/AOU relations have beenlimited to specific regions of the ocean (3, 4 )and have not considered the global ocean. Weassembled a large data set (N � 9824) of
concurrent DOC and AOU observations col-lected in cruises conducted throughout theworld’s oceans (fig. S1, table S1) to examinethe relative contribution of DOC to AOUand, therefore, respiration in the dark ocean.AOU increased from an average (�SE)96.3 � 2.0 �M at the base of the surfacemixed layer (100 m) to 165.5 � 4.3 �M atthe bottom of the main thermocline (1000 m),with a parallel decline in the average DOCfrom 53.5 � 0.2 to 43.4 � 0.3 �M C (Fig. 1).In contrast, there is no significant decline in
DOC with increasing depth beyond 1000 mdepth (Fig. 1), indicating that DOC exportedwith overturning circulation plays a minorrole in supporting respiration in the oceaninterior (5). Assuming a molar respiratoryquotient of 0.69, the decline in DOC accountsfor 19.6 � 0.4% of the AOU within the top1000 m (Fig. 1). This estimate represents,however, an upper limit, because the correla-tion between DOC and AOU is partly due tomixing of DOC-rich warm surface waters
with DOC-poor cold thermocline waters (6 ).Removal of this effect by regressing DOCagainst AOU and water temperature indicatesthat DOC supports only 8.4 � 0.3% of therespiration in the mesopelagic waters.
These results confirm that DOC makes asmall but significant contribution toward themaintenance of respiratory processes in thedark ocean. DOC use accounts for only�10% of the AOU in mesopelagic waters,indicating that the bulk of the respirationwithin the mesopelagic zone is supported bythe flux of sinking POC. This estimate for thecontribution of DOC oxidation to globalAOU is supported by the independent find-ings that net DOC production accounts for�20% of net community production in thesurface ocean (7), that DOC export contrib-utes to 10 % of the export below 500 m (8),and that the total AOU in the deep ocean is inagreement with that expected from the flux ofsinking POC (9). It is the DOC accumulatingas a function of primary production in thesurface ocean, which is exported with over-turning circulation, that dominates the DOCfraction of AOU development. Our findingsindicate that the POC flux, which appears tobe severely underestimated by sediment trapsin the mesopelagic zone (10), is much greaterthan the DOC flux and supports the bulk(�90%) of the respiratory carbon demand inthe dark ocean.
References1. C. A. Carlson, H. W. Ducklow, A. F. Michaels, Nature371, 405 (1994).
2. P. A. del Giorgio, C. M. Duarte, Nature 420, 379(2002).
3. M. D. Doval, D. A. Hansell, Mar. Chem. 68, 249 (2000).4. E. T. Peltzer, N. A. Hayward, Deep Sea Res. Part II 43,155 (1996).
5. D. A. Hansell, C. A. Carlson, Nature 395, 263 (1998).6. X. A. Alvarez-Salgado, F. F. Perez, A. F. Rıos, M. D.Doval, Sci. Mar. 65, 1 (2001).
7. D. A. Hansell, C. A. Carlson, Global Biogeochem.Cycles 12, 443 (1998).
8. D. A. Hansell, in Biogeochemistry of Marine DissolvedOrganic Matter, D. A. Hansell, C. A. Carlson, Eds.(Academic, San Diego, CA, 2002), pp. 685–715.
9. R. A. Jahnke, Global Biogeochem. Cycles 10, 71(1996).
10. J. C. Scholten et al., Deep Sea Res. Part II 48, 243(2001).
Supporting Online Materialwww.sciencemag.org/cgi/content/full/298/5600/1967/DC1Fig. S1Table S1
1Facultad de Ciencias del Mar, Campus Universitariode Tafira, Universidad de las Palmas de Gran Canaria,35017 Las Palmas de Gran Canaria, Spain. 2IMEDEA(CSIC-UIB), Instituto Mediterraneo de Estudios Avan-zados, Miquel Marques 21, 07190 Esporles (IslasBaleares), Spain. 3CCCMM ( XUGA), Centro de Controlde Calidade do Medio Marino, Peirao de Vilaxoan s/n,Vilagarcıa de Arousa, Spain. 4IIM (CSIC), Instituto deInvestigacions Marinas, Eduardo Cabello 6, 36208Vigo, Spain. 5RSMAS, University of Miami, Miami, FL33149, USA.
*To whom correspondence should be addressed. E-mail: [email protected]
Fig. 1. The depth distribution of the average (mean � SE of data grouped by 100-m bins, N �9578) DOC (full circles) concentration and AOU (empty circles) in the ocean (A) and the relationbetween DOC and AOU in the ocean (B). The symbols represent mean � SE DOC concentrationsof data grouped by 10 �M AOU bins (N � 9824). The inset in (B) shows the relation for the rawdata (N � 9824), which is described, in the interval 0 � AOU � 150, by the fitted regressionequation DOC� 60.3 (�0.2)� 0.136 (�0.003) AOU (R 2� 0.28, P� 0.0001, N� 5541). Multipleregression analysis, also using water temperature (°C) as an independent variable, improves the fit,yielding the equation DOC � 48.0 (�0.2) � 0.81 (�0.01) T � 0.058 (�0.002) AOU (R2 � 0.69,P � 0.0001, N � 5371). The monotonic decrease of DOC for AOU � 225 corresponds to theoxygen minimum zones of the Arabian Sea, Indian Ocean, and equatorial Pacific Ocean.
B R E V I A
www.sciencemag.org SCIENCE VOL 298 6 DECEMBER 2002 1967
Originally published 6 December 2002
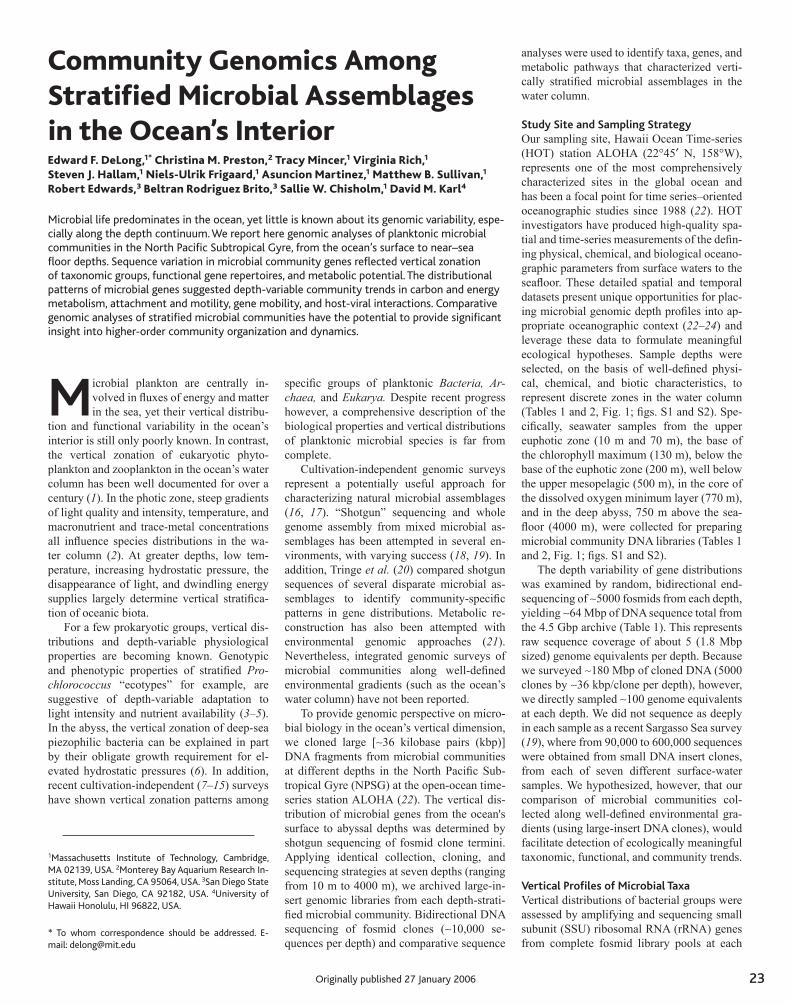
23
Microbial plankton are centrally in-volved in fluxes of energy and matter in the sea, yet their vertical distribu-
tion and functional variability in the ocean’s interior is still only poorly known. In contrast, the vertical zonation of eukaryotic phyto-plankton and zooplankton in the ocean’s water column has been well documented for over a century (1). In the photic zone, steep gradients of light quality and intensity, temperature, and macronutrient and trace-metal concentrations all influence species distributions in the wa-ter column (2). At greater depths, low tem-perature, increasing hydrostatic pressure, the disappearance of light, and dwindling energy supplies largely determine vertical stratifica-tion of oceanic biota.
For a few prokaryotic groups, vertical dis-tributions and depth-variable physiological properties are becoming known. Genotypic and phenotypic properties of stratified Pro-chlorococcus “ecotypes” for example, are suggestive of depth-variable adaptation to light intensity and nutrient availability (3–5). In the abyss, the vertical zonation of deep-sea piezophilic bacteria can be explained in part by their obligate growth requirement for el-evated hydrostatic pressures (6). In addition, recent cultivation-independent (7–15) surveys have shown vertical zonation patterns among
Community Genomics Among Stratified Microbial Assemblages in the Ocean’s InteriorEdward F. DeLong,1* Christina M. Preston,2 Tracy Mincer,1 Virginia Rich,1 Steven J. Hallam,1 Niels-Ulrik Frigaard,1 Asuncion Martinez,1 Matthew B. Sullivan,1 Robert Edwards,3 Beltran Rodriguez Brito,3 Sallie W. Chisholm,1 David M. Karl4
Microbial life predominates in the ocean, yet little is known about its genomic variability, espe-cially along the depth continuum. We report here genomic analyses of planktonic microbialcommunities in the North Pacific Subtropical Gyre, from the ocean’s surface to near–sea floor depths. Sequence variation in microbial community genes reflected vertical zonation of taxonomic groups, functional gene repertoires, and metabolic potential. The distributional patterns of microbial genes suggested depth-variable community trends in carbon and energy metabolism, attachment and motility, gene mobility, and host-viral interactions. Comparative genomic analyses of stratified microbial communities have the potential to provide significant insight into higher-order community organization and dynamics.
1Massachusetts Institute of Technology, Cambridge, MA 02139, USA. 2Monterey Bay Aquarium Research In-stitute, Moss Landing, CA 95064, USA. 3San Diego State University, San Diego, CA 92182, USA. 4University of Hawaii Honolulu, HI 96822, USA.
* To whom correspondence should be addressed. E-mail: [email protected]
specific groups of planktonic Bacteria, Ar-chaea, and Eukarya. Despite recent progress however, a comprehensive description of the biological properties and vertical distributions of planktonic microbial species is far from complete.
Cultivation-independent genomic surveys represent a potentially useful approach for characterizing natural microbial assemblages (16, 17). “Shotgun” sequencing and whole genome assembly from mixed microbial as-semblages has been attempted in several en-vironments, with varying success (18, 19). In addition, Tringe et al. (20) compared shotgun sequences of several disparate microbial as-semblages to identify community�specific patterns in gene distributions. Metabolic re-construction has also been attempted with environmental genomic approaches (21). Nevertheless, integrated genomic surveys of microbial communities along well�defined environmental gradients (such as the ocean’s water column) have not been reported.
To provide genomic perspective on micro-bial biology in the ocean’s vertical dimension, we cloned large [∼36 kilobase pairs (kbp)] DNA fragments from microbial communities at different depths in the North Pacific Sub-tropical Gyre (NPSG) at the open�ocean time�series station ALOHA (22). The vertical dis-tribution of microbial genes from the ocean's surface to abyssal depths was determined by shotgun sequencing of fosmid clone termini. Applying identical collection, cloning, and sequencing strategies at seven depths (ranging from 10 m to 4000 m), we archived large�in-sert genomic libraries from each depth-strati-fied microbial community. Bidirectional DNA sequencing of fosmid clones (∼10,000 se-quences per depth) and comparative sequence
analyses were used to identify taxa, genes, and metabolic pathways that characterized verti-cally stratified microbial assemblages in the water column.
Study Site and Sampling StrategyOur sampling site, Hawaii Ocean Time�series (HOT) station ALOHA (22°45′ N, 158°W), represents one of the most comprehensively characterized sites in the global ocean and has been a focal point for time series–oriented oceanographic studies since 1988 (22). HOT investigators have produced high-quality spa-tial and time�series measurements of the defin-ing physical, chemical, and biological oceano-graphic parameters from surface waters to the seafloor. These detailed spatial and temporal datasets present unique opportunities for plac-ing microbial genomic depth profiles into ap-propriate oceanographic context (22–24) and leverage these data to formulate meaningful ecological hypotheses. Sample depths were selected, on the basis of well�defined physi-cal, chemical, and biotic characteristics, to represent discrete zones in the water column (Tables 1 and 2, Fig. 1; figs. S1 and S2). Spe-cifically, seawater samples from the upper euphotic zone (10 m and 70 m), the base of the chlorophyll maximum (130 m), below the base of the euphotic zone (200 m), well below the upper mesopelagic (500 m), in the core of the dissolved oxygen minimum layer (770 m), and in the deep abyss, 750 m above the sea-floor (4000 m), were collected for preparing microbial community DNA libraries (Tables 1 and 2, Fig. 1; figs. S1 and S2).
The depth variability of gene distributions was examined by random, bidirectional end-sequencing of ∼5000 fosmids from each depth, yielding ∼64 Mbp of DNA sequence total from the 4.5 Gbp archive (Table 1). This represents raw sequence coverage of about 5 (1.8 Mbp sized) genome equivalents per depth. Because we surveyed ∼180 Mbp of cloned DNA (5000 clones by ∼36 kbp/clone per depth), however, we directly sampled ∼100 genome equivalents at each depth. We did not sequence as deeply in each sample as a recent Sargasso Sea survey (19), where from 90,000 to 600,000 sequences were obtained from small DNA insert clones, from each of seven different surface-water samples. We hypothesized, however, that our comparison of microbial communities col-lected along well�defined environmental gra-dients (using large�insert DNA clones), would facilitate detection of ecologically meaningful taxonomic, functional, and community trends.
Vertical Profiles of Microbial TaxaVertical distributions of bacterial groups were assessed by amplifying and sequencing small subunit (SSU) ribosomal RNA (rRNA) genes from complete fosmid library pools at each
Originally published 27 January 2006Originally published 6 December 2002

24
depth (Fig. 2; fig. S3). Bacterial phylogenetic distributions were generally consistent with previous polymerase chain reaction–based cultivation�independent rRNA surveys of ma-rine picoplankton (8, 15, 25). In surface-water samples, rRNA�containing fosmids included those from Prochlorococcus; Verrucomicro-biales; Flexibacteraceae; Gammaproteobac-teria (SAR92, OM60, SAR86 clades); Alpha-proteobacteria (SAR116, OM75 clades); and Deltaproteobacteria (OM27 clade) (Fig. 2). Bacterial groups from deeper waters included members of Deferribacteres; Planctomyce-taceae; Acidobacteriales; Gemmatamonada-ceae; Nitrospina; Alteromonadaeceae; and
SAR202, SAR11, and Agg47 planktonic bac-terial clades (Fig. 2; fig. S2). Large�insert DNA clones previously recovered from the marine environment (9, 10) also provide a good met-ric for taxonomic assessment of indigenous microbes. Accordingly, a relatively large pro-portion of our shotgun fosmid sequences most closely matched rRNA�containing bacterio-plankton artificial clones previously recovered from the marine environment (fig. S3).
Taxonomic bins of bacterial protein ho-mologs found in randomly sequenced fosmid ends (Fig. 2; fig. S4) also reflected distribu-tional patterns generally consistent with pre-vious surveys in the water column (8, 15).
Unexpectedly large amounts of phage DNA were recovered in clones, particularly in the photic zone. Also unexpected was a relatively high proportion of Betaproteobacteria-like sequences recovered at 130 m, most sharing highest similarity to protein homologs from Rhodoferax ferrireducens. As expected, repre-sentation of Prochlorococcus-like and Pelagi-bacter-like genomic sequences was high in the photic zone. At greater depths, higher propor-tions of Chloroflexi-like sequences, perhaps corresponding to the cooccurring SAR202 clade, were observed (Fig. 2). Planctomyce-tales�like genomic DNA sequences were also highly represented at greater depths.
All archaeal SSU rRNA–containing fos-mids were identified at each depth, quantified by macroarray hybridization, and their rRNAs sequenced (figs. S5 and S6). The general pat-terns of archaeal distribution we observed were consistent with previous field surveys (15, 25, 26). Recovery of “group II” plankton-ic Euryarchaeota genomic DNA was greatest in the upper water column and declined below the photic zone. This distribution corrobo-rates recent observations of ion-translocating photoproteins (called proteorhodopsins), now known to occur in group II Euryarchaeota in-habiting the photic zone (27). “Group III” Eu-ryarchaeota DNA was recovered at all depths,
È36 kbp/clone per depth), however, we directly
sampled È100 genome equivalents at each depth.
We did not sequence as deeply in each sample
as a recent Sargasso Sea survey (19), where from
90,000 to 600,000 sequences were obtained from
small DNA insert clones, from each of seven dif-
ferent surface-water samples. We hypothesized,
however, that our comparison of microbial com-
munities collected along well-defined environ-
mental gradients (using large-insert DNA clones),
would facilitate detection of ecologically meaning-
ful taxonomic, functional, and community trends.
Vertical Profiles of Microbial Taxa
Vertical distributions of bacterial groups were
assessed by amplifying and sequencing small
subunit (SSU) ribosomal RNA (rRNA) genes
from complete fosmid library pools at each
depth (Fig. 2; fig. S3). Bacterial phylogenetic
distributions were generally consistent with
previous polymerase chain reaction–based
cultivation-independent rRNA surveys of ma-
rine picoplankton (8, 15, 25). In surface-water
samples, rRNA-containing fosmids included
those from Prochlorococcus; Verrucomicro-
biales; Flexibacteraceae; Gammaproteobacteria
(SAR92, OM60, SAR86 clades); Alphaproteo-
bacteria (SAR116, OM75 clades); and Delta-
proteobacteria (OM27 clade) (Fig. 2). Bacterial
groups from deeper waters included members
of Deferribacteres; Planctomycetaceae; Acido-
bacteriales; Gemmatamonadaceae; Nitrospina;
Alteromonadaeceae; and SAR202, SAR11, and
Agg47 planktonic bacterial clades (Fig. 2; fig.
S2). Large-insert DNA clones previously recov-
ered from the marine environment (9, 10) also
provide a good metric for taxonomic assessment
of indigenous microbes. Accordingly, a relatively
large proportion of our shotgun fosmid sequences
most closely matched rRNA-containing bacte-
rioplankton artificial clones previously recovered
from the marine environment (fig. S3).
Taxonomic bins of bacterial protein homologs
found in randomly sequenced fosmid ends (Fig. 2;
fig. S4) also reflected distributional patterns
generally consistent with previous surveys in the
water column (8, 15). Unexpectedly large amounts
of phage DNA were recovered in clones, particu-
larly in the photic zone. Also unexpected was a
relatively high proportion of Betaproteobacteria-
like sequences recovered at 130 m, most sharing
highest similarity to protein homologs from
Rhodoferax ferrireducens. As expected, representa-
tion of Prochlorococcus-like and Pelagibacter-like
genomic sequences was high in the photic zone. At
greater depths, higher proportions of Chloroflexi-
like sequences, perhaps corresponding to the co-
occurring SAR202 clade, were observed (Fig. 2).
Planctomycetales-like genomic DNA sequences
were also highly represented at greater depths.
All archaeal SSU rRNA–containing fosmids
were identified at each depth, quantified by mac-
roarray hybridization, and their rRNAs sequenced
Table 1. HOT samples and fosmid libraries. Sample site, 22-45’ N, 158-W. All seawater sampleswere pre-filtered through a 1.6-mm glass fiber filter, and collected on a 0.22-mm filter. See (35) formethods.
Depth
(m)
Sample
date
Volume filtered
(liters)
Total fosmid
clones
Total DNA (Mbp)
Archived Sequenced
10 10/7/02 40 12,288 442 7.5470 10/7/02 40 12,672 456 11.03
130 10/6/02 40 13,536 487 6.28200 10/6/02 40 19,008 684 7.96
500 10/6/02 80 15,264 550 8.86770 12/21/03 240 11,520 415 11.18
4,000 12/21/03 670 41,472 1,493 11.10
Table 2. HOT sample oceanographic data. Samples described in Table 1.Oceanographic parameters were measured as specified at (49); values shownare those from the same CTD casts as the samples, where available. Values inparentheses are the mean T 1 SD of each core parameter during the periodOctober 1988 to December 2004, with the total number of measurementscollected for each parameter shown in brackets. The parameter abbreviationsare Temp., Temperature; Chl a, chlorophyll a; DOC, dissolved organic carbon;NþN, nitrate plus nitrite; DIP, dissolved inorganic phosphate; and DIC,
dissolved inorganic carbon. The estimated photon fluxes for upper watercolumn samples (assuming a surface irradiance of 32 mol quanta mj2 dj1
and a light extinction coefficient of 0.0425 mj1) were: 10 m 0 20.92 (65%of surface), 70 m 0 1.63 (5% of surface), 130 m 0 0.128 (0.4% of surface),200 m 0 0.07 (0.02% of surface). The mean surface mixed-layer during theOctober 2002 sampling was 61 m. Data are available at (50). *Biomassderived from particulate adenosine triphosphate (ATP) measurements as-suming a carbon:ATP ratio of 250. ND, Not determined.
Depth
(m)
Temp.
(-C)Salinity
Chl a
(mg/kg)
Biomass*
(mg/kg)
DOC
(mmol/kg)
N þ N
(nmol/kg)
DIP
(nmol/kg)
Oxygen
(mmol/kg)
DIC
(mmol/kg)
10 26.40(24.83 T 1.27)
[2,104]
35.08(35.05 T 0.21)
[1,611]
0.08(0.08 T 0.03)
[320]
7.21 T 2.68[78]
78(90.6 T 14.3)
[140]
1.0(2.6 T 3.7)
[126]
41.0(56.0 T 33.7)
[146]
204.6(209.3 T 4.5)
[348]
1,967.6(1,972.1 T 16.4)
[107]70 24.93
(23.58 T 1.00)[1,202]
35.21
(35.17 T 0.16)[1,084]
0.18
(0.15 T 0.05)[363]
8.51 T 3.22
[86]
79
(81.4 T 11.3)[79]
1.3
(14.7 T 60.3)[78]
16.0
(43.1 T 25.1)[104]
217.4
(215.8 T 5.4)[144]
1,981.8
(1,986.9 T 15.4)[84]
130 22.19
(21.37 T 0.96)[1,139]
35.31
(35.20 T 0.10)[980]
0.10
(0.15 T 0.06)[350]
5.03 T 2.30
[90]
69
(75.2 T 9.1)[86]
284.8
(282.9 T 270.2)[78]
66.2
(106.0 T 49.7)[68]
204.9
(206.6 T 6.2)[173]
2,026.5
(2,013.4 T 13.4)[69]
200 18.53(18.39 T 1.29)
[662]
35.04(34.96 T 0.18)
[576]
0.02(0.02 T 0.02)
[97]
1.66 T 0.24[2]
63(64.0 T 9.8)
[113]
1,161.9 T 762.5[7]
274.2 T 109.1[84]
198.8(197.6 T 7.1)
[190]
2,047.7(2,042.8 T 10.5)
[125]500 7.25
(7.22 T 0.44)[1,969]
34.07
(34.06 T 0.03)[1,769]
ND 0.48 T 0.23
[107]
47
(47.8 T 6.3)[112]
28,850
(28,460 T 2210)[326]
2,153
(2,051 T 175.7)[322]
118.0
(120.5 T 18.3)[505]
2197.3
(2,200.2 T 17.8)[134]
770 4.78(4.86 T 0.21)
[888]
34.32(34.32 T 0.04)
[773]
ND 0.29 T 0.16[107]
39.9(41.5 T 4.4)
[34]
41,890(40,940 T 500)
[137]
3,070(3,000 T 47.1)
[135]
32.3(27.9 T 4.1)
[275]
2323.8(2,324.3 T 6.1)
[34]4,000 1.46
(1.46 T 0.01)[262]
34.69
(34.69 T 0.00)[245]
ND ND 37.5
(42.3 T 4.9)[83]
36,560
(35,970 T 290)[108]
2,558
(2,507 T 19)[104]
147.8
(147.8 T 1.3)[210]
2325.5
(2,329.1 T 4.8)[28]
RESEARCH ARTICLES
www.sciencemag.org SCIENCE VOL 311 27 JANUARY 2006 497
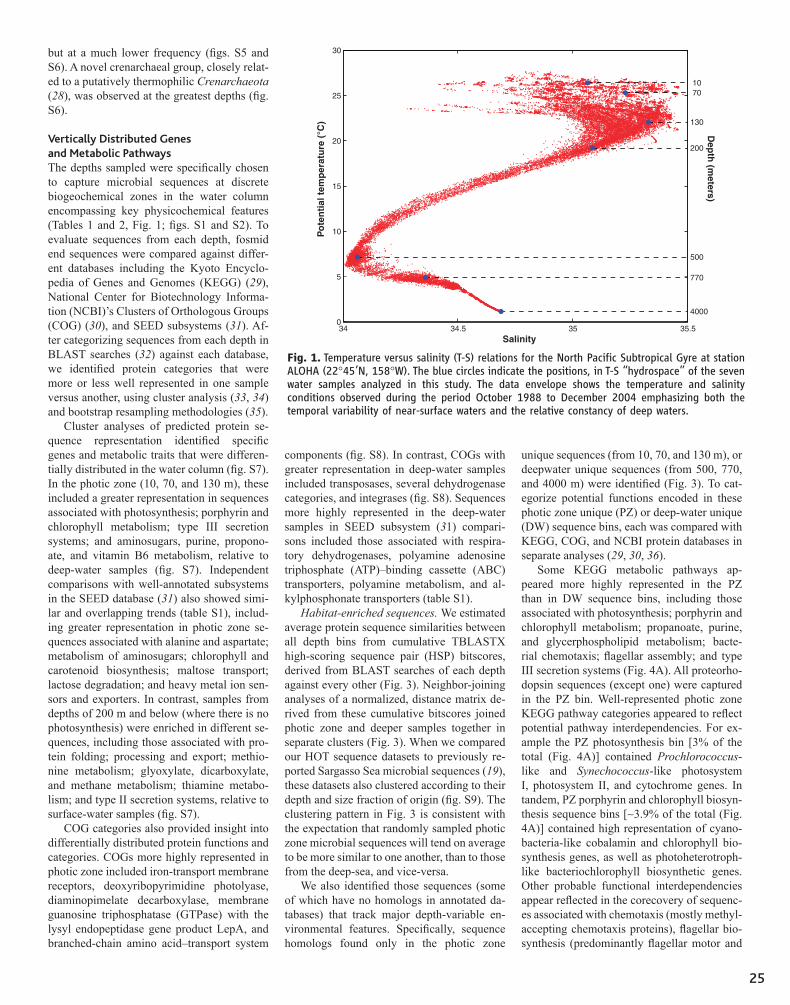
25
but at a much lower frequency (figs. S5 and S6). A novel crenarchaeal group, closely relat-ed to a putatively thermophilic Crenarchaeota (28), was observed at the greatest depths (fig. S6).
Vertically Distributed Genes and Metabolic PathwaysThe depths sampled were specifically chosen to capture microbial sequences at discrete biogeochemical zones in the water column encompassing key physicochemical features (Tables 1 and 2, Fig. 1; figs. S1 and S2). To evaluate sequences from each depth, fosmid end sequences were compared against differ-ent databases including the Kyoto Encyclo-pedia of Genes and Genomes (KEGG) (29), National Center for Biotechnology Informa-tion (NCBI)’s Clusters of Orthologous Groups (COG) (30), and SEED subsystems (31). Af-ter categorizing sequences from each depth in BLAST searches (32) against each database, we identified protein categories that were more or less well represented in one sample versus another, using cluster analysis (33, 34) and bootstrap resampling methodologies (35).
Cluster analyses of predicted protein se-quence representation identified specific genes and metabolic traits that were differen-tially distributed in the water column (fig. S7). In the photic zone (10, 70, and 130 m), these included a greater representation in sequences associated with photosynthesis; porphyrin and chlorophyll metabolism; type III secretion systems; and aminosugars, purine, propono-ate, and vitamin B6 metabolism, relative to deep�water samples (fig. S7). Independent comparisons with well-annotated subsystems in the SEED database (31) also showed simi-lar and overlapping trends (table S1), includ-ing greater representation in photic zone se-quences associated with alanine and aspartate; metabolism of aminosugars; chlorophyll and carotenoid biosynthesis; maltose transport; lactose degradation; and heavy metal ion sen-sors and exporters. In contrast, samples from depths of 200 m and below (where there is no photosynthesis) were enriched in different se-quences, including those associated with pro-tein folding; processing and export; methio-nine metabolism; glyoxylate, dicarboxylate, and methane metabolism; thiamine metabo-lism; and type II secretion systems, relative to surface�water samples (fig. S7).
COG categories also provided insight into differentially distributed protein functions and categories. COGs more highly represented in photic zone included iron-transport membrane receptors, deoxyribopyrimidine photolyase, diaminopimelate decarboxylase, membrane guanosine triphosphatase (GTPase) with the lysyl endopeptidase gene product LepA, and branched-chain amino acid–transport system
components (fig. S8). In contrast, COGs with greater representation in deep-water samples included transposases, several dehydrogenase categories, and integrases (fig. S8). Sequences more highly represented in the deep-water samples in SEED subsystem (31) compari-sons included those associated with respira-tory dehydrogenases, polyamine adenosine triphosphate (ATP)–binding cassette (ABC) transporters, polyamine metabolism, and al-kylphosphonate transporters (table S1).
Habitat-enriched sequences. We estimated average protein sequence similarities between all depth bins from cumulative TBLASTX high-scoring sequence pair (HSP) bitscores, derived from BLAST searches of each depth against every other (Fig. 3). Neighbor-joining analyses of a normalized, distance matrix de-rived from these cumulative bitscores joined photic zone and deeper samples together in separate clusters (Fig. 3). When we compared our HOT sequence datasets to previously re-ported Sargasso Sea microbial sequences (19), these datasets also clustered according to their depth and size fraction of origin (fig. S9). The clustering pattern in Fig. 3 is consistent with the expectation that randomly sampled photic zone microbial sequences will tend on average to be more similar to one another, than to those from the deep-sea, and vice-versa.
We also identified those sequences (some of which have no homologs in annotated da-tabases) that track major depth-variable en-vironmental features. Specifically, sequence homologs found only in the photic zone
unique sequences (from 10, 70, and 130 m), or deepwater unique sequences (from 500, 770, and 4000 m) were identified (Fig. 3). To cat-egorize potential functions encoded in these photic zone unique (PZ) or deep-water unique (DW) sequence bins, each was compared with KEGG, COG, and NCBI protein databases in separate analyses (29, 30, 36).
Some KEGG metabolic pathways ap-peared more highly represented in the PZ than in DW sequence bins, including those associated with photosynthesis; porphyrin and chlorophyll metabolism; propanoate, purine, and glycerphospholipid metabolism; bacte-rial chemotaxis; flagellar assembly; and type III secretion systems (Fig. 4A). All proteorho-dopsin sequences (except one) were captured in the PZ bin. Well-represented photic zone KEGG pathway categories appeared to reflect potential pathway interdependencies. For ex-ample the PZ photosynthesis bin [3% of the total (Fig. 4A)] contained Prochlorococcus-like and Synechococcus-like photosystem I, photosystem II, and cytochrome genes. In tandem, PZ porphyrin and chlorophyll biosyn-thesis sequence bins [∼3.9% of the total (Fig. 4A)] contained high representation of cyano-bacteria-like cobalamin and chlorophyll bio-synthesis genes, as well as photoheterotroph-like bacteriochlorophyll biosynthetic genes. Other probable functional interdependencies appear reflected in the corecovery of sequenc-es associated with chemotaxis (mostly methyl-accepting chemotaxis proteins), flagellar bio-synthesis (predominantly flagellar motor and
(figs. S5 and S6). The general patterns of archaeal
distribution we observed were consistent with pre-
vious field surveys (15, 25, 26). Recovery of ‘‘group
II’’ planktonic Euryarchaeota genomic DNA was
greatest in the upper water column and declined
below the photic zone. This distribution corrob-
orates recent observations of ion-translocating pho-
toproteins (called proteorhodopsins), now known
to occur in group II Euryarchaeota inhabiting the
photic zone (27). ‘‘Group III’’ EuryarchaeotaDNA
was recovered at all depths, but at a much lower
frequency (figs. S5 and S6). A novel crenarchaeal
group, closely related to a putatively thermophilic
Crenarchaeota (28), was observed at the greatest
depths (fig. S6).
Vertically Distributed Genesand Metabolic Pathways
The depths sampled were specifically chosen to
capture microbial sequences at discrete biogeo-
chemical zones in thewater column encompassing
key physicochemical features (Tables 1 and 2,
Fig. 1; figs. S1 and S2). To evaluate sequences
from each depth, fosmid end sequences were
compared against different databases including
the Kyoto Encyclopedia of Genes and Genomes
(KEGG) (29), National Center for Biotechnology
Information (NCBI)’s Clusters of Orthologous
Groups (COG) (30), and SEED subsystems (31).
After categorizing sequences from each depth in
BLAST searches (32) against each database, we
identified protein categories that were more or
less well represented in one sample versus an-
other, using cluster analysis (33, 34) and boot-
strap resampling methodologies (35).
Cluster analyses of predicted protein sequence
representation identified specific genes and meta-
bolic traits that were differentially distributed in
the water column (fig. S7). In the photic zone (10,
70, and 130 m), these included a greater
representation in sequences associated with pho-
tosynthesis; porphyrin and chlorophyll metabo-
lism; type III secretion systems; and aminosugars,
purine, proponoate, and vitamin B6 metabolism,
relative to deep-water samples (fig. S7). Indepen-
dent comparisons with well-annotated subsystems
in the SEED database (31) also showed similar
and overlapping trends (table S1), including
greater representation in photic zone sequences
associated with alanine and aspartate; metabolism
of aminosugars; chlorophyll and carotenoid
biosynthesis; maltose transport; lactose degrada-
tion; and heavy metal ion sensors and exporters.
In contrast, samples from depths of 200 m and
below (where there is no photosynthesis) were
enriched in different sequences, including those
associated with protein folding; processing and
export; methionine metabolism; glyoxylate, dicar-
boxylate, and methane metabolism; thiamine
metabolism; and type II secretion systems, relative
to surface-water samples (fig. S7).
COG categories also provided insight into
differentially distributed protein functions and
categories. COGsmore highly represented in photic
zone included iron-transport membrane receptors,
deoxyribopyrimidine photolyase, diaminopimelate
decarboxylase, membrane guanosine triphospha-
tase (GTPase) with the lysyl endopeptidase gene
product LepA, and branched-chain amino acid–
transport system components (fig. S8). In con-
trast, COGs with greater representation in
deep-water samples included transposases, sev-
eral dehydrogenase categories, and integrases
(fig. S8). Sequences more highly represented in
the deep-water samples in SEED subsystem (31)
comparisons included those associated with
respiratory dehydrogenases, polyamine adeno-
sine triphosphate (ATP)–binding cassette (ABC)
transporters, polyamine metabolism, and alkyl-
phosphonate transporters (table S1).
Habitat-enriched sequences. We estimated
average protein sequence similarities between all
depth bins from cumulative TBLASTX high-
scoring sequence pair (HSP) bitscores, derived
from BLAST searches of each depth against
every other (Fig. 3). Neighbor-joining analyses
of a normalized, distance matrix derived from
these cumulative bitscores joined photic zone
and deeper samples together in separate clusters
(Fig. 3). When we compared our HOT sequence
datasets to previously reported Sargasso Sea
microbial sequences (19), these datasets also
clustered according to their depth and size
fraction of origin (fig. S9). The clustering
pattern in Fig. 3 is consistent with the ex-
pectation that randomly sampled photic zone
microbial sequences will tend on average to be
more similar to one another, than to those from
the deep-sea, and vice-versa.
We also identified those sequences (some of
which have no homologs in annotated databases)
that track major depth-variable environmental
features. Specifically, sequence homologs found
only in the photic zone unique sequences (from
10, 70, and 130 m), or deepwater unique
sequences (from 500, 770, and 4000 m) were
identified (Fig. 3). To categorize potential
functions encoded in these photic zone unique
(PZ) or deep-water unique (DW) sequence
bins, each was compared with KEGG, COG,
and NCBI protein databases in separate analy-
ses (29, 30, 36).
Some KEGG metabolic pathways appeared
more highly represented in the PZ than in DW
sequence bins, including those associated with
photosynthesis; porphyrin and chlorophyll metab-
olism; propanoate, purine, and glycerphospholipid
metabolism; bacterial chemotaxis; flagellar assem-
bly; and type III secretion systems (Fig. 4A). All
proteorhodopsin sequences (except one) were
captured in the PZ bin. Well-represented photic
zone KEGG pathway categories appeared to re-
flect potential pathway interdependencies. For
example the PZ photosynthesis bin [3% of the
total (Fig. 4A)] contained Prochlorococcus-like
and Synechococcus-like photosystem I, photo-
system II, and cytochrome genes. In tandem,
PZ porphyrin and chlorophyll biosynthesis se-
quence bins [È3.9% of the total (Fig. 4A)] con-
tained high representation of cyanobacteria-like
cobalamin and chlorophyll biosynthesis genes, as
well as photoheterotroph-like bacteriochloro-
phyll biosynthetic genes. Other probable func-
tional interdependencies appear reflected in the
corecovery of sequences associated with che-
motaxis (mostly methyl-accepting chemotaxis
proteins), flagellar biosynthesis (predominant-
34 34.5 35 35.50
5
10
15
20
25
30
10
70
130
200
500
770
4000
Po
ten
tia
l te
mp
era
ture
(°C
)
De
pth
(me
ters
)
Salinity
Fig. 1. Temperature versus salinity (T-S) relations for the North Pacific Subtropical Gyre at stationALOHA (22-45’N, 158-W). The blue circles indicate the positions, in T-S ‘‘hydrospace’’ of the sevenwater samples analyzed in this study. The data envelope shows the temperature and salinityconditions observed during the period October 1988 to December 2004 emphasizing both thetemporal variability of near-surface waters and the relative constancy of deep waters.
RESEARCH ARTICLES
27 JANUARY 2006 VOL 311 SCIENCE www.sciencemag.org498
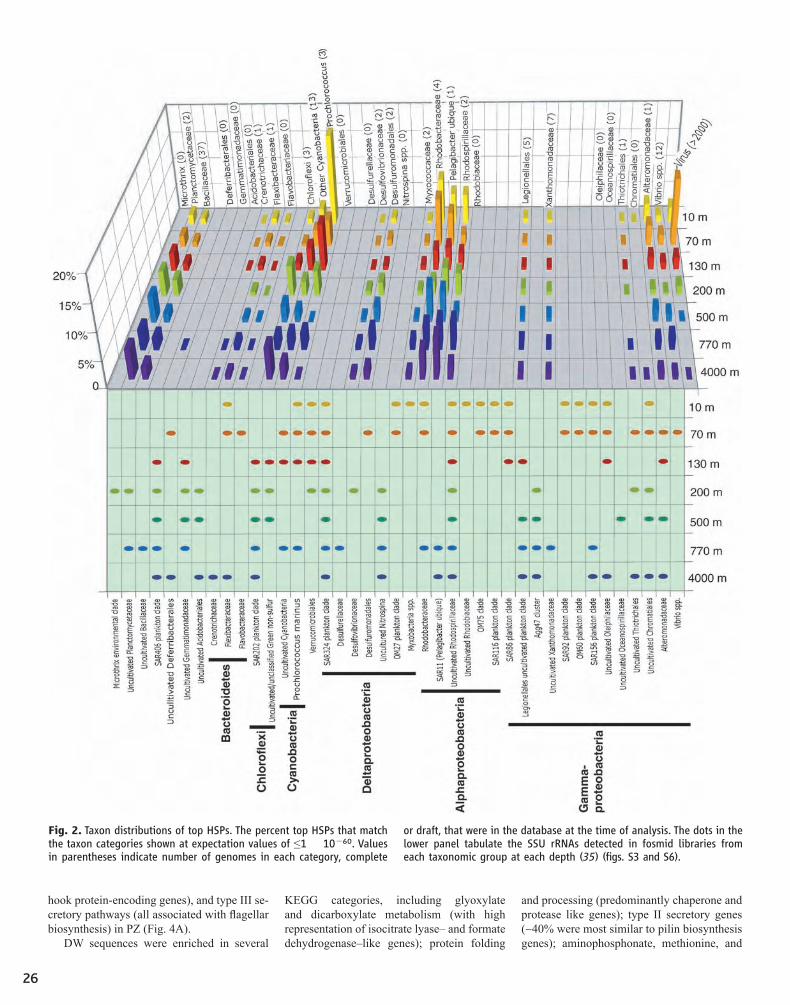
26
hook protein-encoding genes), and type III se-cretory pathways (all associated with flagellar biosynthesis) in PZ (Fig. 4A).
DW sequences were enriched in several
KEGG categories, including glyoxylate and dicarboxylate metabolism (with high representation of isocitrate lyase– and formate dehydrogenase–like genes); protein folding
and processing (predominantly chaperone and protease like genes); type II secretory genes (∼40% were most similar to pilin biosynthesis genes); aminophosphonate, methionine, and
ly flagellar motor and hook protein-encoding
genes), and type III secretory pathways (all
associated with flagellar biosynthesis) in PZ
(Fig. 4A).
DW sequences were enriched in several
KEGG categories, including glyoxylate and dicar-
boxylate metabolism (with high representation
of isocitrate lyase– and formate dehydrogenase–
like genes); protein folding and processing (pre-
dominantly chaperone and protease like genes);
type II secretory genes (È40% were most sim-
ilar to pilin biosynthesis genes); aminophospho-
Fig. 2. Taxon distributions of top HSPs. The percent top HSPs that matchthe taxon categories shown at expectation values of e1 � 10j60. Valuesin parentheses indicate number of genomes in each category, complete
or draft, that were in the database at the time of analysis. The dots in thelower panel tabulate the SSU rRNAs detected in fosmid libraries fromeach taxonomic group at each depth (35) (figs. S3 and S6).
RESEARCH ARTICLES
www.sciencemag.org SCIENCE VOL 311 27 JANUARY 2006 499

27
sulfur metabolism; butanoate metabolism; ion�coupled transporters; and other ABC transporter variants (Fig. 4B). The high representation in DW sequences of type II secretion system and pilin biosynthesis genes, polysaccharide, and antibiotic synthesis suggest a potentially greater role for surface-associated microbial processes in the deeper-water communities. Conversely, enrichment of bacterial motility and chemotaxis sequences in the photic zone indicates a potentially greater importance for mobility and response in these assemblages.
Similar differential patterns of sequence distribution were seen in COG categories (Fig. 4B). COGs enriched in the PZ sequence bin included photolyases, iron-transport outer membrane proteins, Na+�driven efflux pumps, ABC-type sugar-transport systems, hydro-lases and acyl transferases, and transaldol-ases. In deeper waters, transposases were the most enriched COG category (∼4.5% of the COG�categorized DW), increasing steadily in representation with depth from 500 m to their observed maximum at 4000 m (Fig. 4B; fig. S9). Transposases represented one of the single�most overrepresented COG cat-egories in deep waters, accounting for 1.2% of all fosmids sequenced from 4000 m (fig. S8). Preliminary analyses of the transposase variants and mate-pair sequences indicate that they represent a wide variety of differ-ent transposase families and originate from diverse microbial taxa. In contrast, other highly represented COG categories appeared to reflect specific taxon distribution and abundances. For example, the enrichment of transaldolases at 70 m (Fig. 4B; fig. S9) were
mostly derived from abundant cyanophage DNA that was recovered at that depth (see discussion below).
Sargasso Sea surface-water microbial se-quences (19) shared, as expected, many more homologous sequences with our photic zone sequences than those from the deep sea (fig. S10). There were 10 times as many PZ than DW sequences shared in common with Sar-gasso Sea samples 5 through 7 (19) (fig. S10). In contrast, PZ-like sequences were only three times higher in DW when compared with se-quences from Sargasso Sea sample 3 (fig. S10). The fact that Sargasso sample 3 was collected during a period of winter deep-water mixing likely contributes to this higher representation of DW�like homologs. Sargasso Sea homologs of our PZ sequence bin included, as expected, sequences associated with photosynthesis; amino acid transport; purine, pyrimidine and nitrogen metabolism; porphyrin and chloro-phyll metabolism; oxidative phosphorylation; glycolysis; and starch and sucrose metabolism (fig. S10).
Tentative taxonomic assignments of PZ or DW sequences (top HSPs from NCBI’s non-redundant protein database) were also tabu-lated (fig. S11). As expected, a high percent-age of Prochlorococcus-like sequences was found in PZ (∼5% of the total), and a greater representation of Deltaproteobacteria�like, Actinobacteria-like and Planctomycete-like sequences were recovered in DW. Unex-pectedly, the single most highly represented taxon category in PZ (∼21% of all identi-fied sequences in PZ) was derived from vi-ral sequences that were captured in fosmid clones (fig. S11).
Community Genomics and Host-Virus InteractionsViruses are ubiquitous and abundant compo-nents of marine plankton, and influence lateral gene transfer, genetic diversity, and bacterial mortality in the water column (37–40). The large number of viral DNA sequences in our dataset was unexpected (Fig. 5; fig. S12), be-cause we expected planktonic viruses to pass through our collection filters. Previous studies using a similar approach found only minimal contributions from viral sources (19, 40). The majority of viral DNA we captured in fosmid clone libraries apparently originates from rep-licating viruses within infected host cells (35). Viral DNA recovery was highest in the photic zone, with cyanophage-like sequences repre-senting 1 to 10% of all fosmid sequences (Fig. 5), and 60 to 80% of total virus sequences there. Below 200 m, viral DNA made up no more than 0.3% of all sequences at each depth. Most photic zone viral sequences shared high-est similarity to T7�like and T4�like cyano-phage of the Podoviridae and Myoviridae. This is consistent with previous studies (40–42), suggesting a widespread distribution of these phage in the ocean.
Analyses of 1107 fosmid mate pairs pro-vided further insight into the origins of the viral sequences. About 67% of the viruslike clones were most similar to cyanophage on at least one end, and half of these were highly similar to cyanophage at both termini. Many of the cyanophage clones showed apparent syn-teny with previously sequenced cyanophage genomes (fig. S12). About 11% of the cyano-phage paired-ends contained a host-derived cyanophage “signature” gene (43) on one ter-minus. The frequency and genetic-linkage of phage-encoded (but host-derived) genes we observed, including virus-derived genes in-volved in photosynthesis (psbA, psbD, hli), phosphate-scavenging genes (phoH, pstS), a cobalamin biosynthesis gene (cobS), and car-bon metabolism (transaldolase) supports their widespread distribution in natural viral popu-lations and their probable functional impor-tance to cyanophage replication (43, 44).
If we assume that the cyanophages’ DNA was derived from infected host cells in which phage were replicating, the percentage of cyanophage-infected cells was estimated to range between 1 and 12% (35). An apparent cyanophage infection maxima was observed at 70 m, coinciding with the peak virus:host ratio (Fig. 5). Although these estimates are tentative, they are consistent with previously reported ranges of phage-infected picoplank-ton cells in situ (38, 45).
About 0.5% of all sequences were likely prophage, as inferred from high sequence sim-ilarity to phage-related integrases and known
nate, methionine, and sulfur metabolism; buta-
noate metabolism; ion-coupled transporters;
and other ABC transporter variants (Fig. 4B).
The high representation in DW sequences of
type II secretion system and pilin biosynthesis
genes, polysaccharide, and antibiotic synthesis
suggest a potentially greater role for surface-
associated microbial processes in the deeper-
water communities. Conversely, enrichment of
bacterial motility and chemotaxis sequences in
the photic zone indicates a potentially greater
importance for mobility and response in these
assemblages.
Similar differential patterns of sequence
distribution were seen in COG categories (Fig.
4B). COGs enriched in the PZ sequence bin
included photolyases, iron-transport outer mem-
brane proteins, Naþ-driven efflux pumps, ABC-
type sugar-transport systems, hydrolases and
acyl transferases, and transaldolases. In deeper
waters, transposases were the most enriched
COG category (È4.5% of the COG-categorized
DW), increasing steadily in representation with
depth from 500 m to their observed maximum
at 4000 m (Fig. 4B; fig. S9). Transposases
represented one of the single-most overrepre-
sented COG categories in deep waters, ac-
counting for 1.2% of all fosmids sequenced
from 4000 m (fig. S8). Preliminary analyses
of the transposase variants and mate-pair se-
quences indicate that they represent a wide
variety of different transposase families and
originate from diverse microbial taxa. In con-
trast, other highly represented COG categories
appeared to reflect specific taxon distribution
and abundances. For example, the enrichment
of transaldolases at 70 m (Fig. 4B; fig. S9) were
mostly derived from abundant cyanophage DNA
that was recovered at that depth (see discus-
sion below).
Sargasso Sea surface-water microbial se-
quences (19) shared, as expected, many more
homologous sequences with our photic zone
sequences than those from the deep sea (fig.
S10). There were 10 times as many PZ than
DW sequences shared in common with Sar-
gasso Sea samples 5 through 7 (19) (fig. S10).
In contrast, PZ-like sequences were only three
times higher in DW when compared with se-
quences from Sargasso Sea sample 3 (fig. S10).
The fact that Sargasso sample 3 was collected
during a period of winter deep-water mixing
likely contributes to this higher representation
of DW-like homologs. Sargasso Sea homologs
of our PZ sequence bin included, as expected,
sequences associated with photosynthesis; ami-
no acid transport; purine, pyrimidine and
nitrogen metabolism; porphyrin and chloro-
phyll metabolism; oxidative phosphorylation;
glycolysis; and starch and sucrose metabolism
(fig. S10).
Tentative taxonomic assignments of PZ or
DW sequences (top HSPs from NCBI’s nonre-
dundant protein database) were also tabulated
(fig. S11). As expected, a high percentage of
Prochlorococcus-like sequences was found in
PZ (È5% of the total), and a greater represen-
tation of Deltaproteobacteria-like, Actinobacteria-
like and Planctomycete-like sequences were
recovered in DW. Unexpectedly, the single most
highly represented taxon category in PZ (È21%
of all identified sequences in PZ) was derived
from viral sequences that were captured in
fosmid clones (fig. S11).
Community Genomics andHost-Virus Interactions
Viruses are ubiquitous and abundant compo-
nents of marine plankton, and influence lateral
gene transfer, genetic diversity, and bacterial
mortality in the water column (37–40). The large
number of viral DNA sequences in our dataset
was unexpected (Fig. 5; fig. S12), because we
expected planktonic viruses to pass through
our collection filters. Previous studies using a
similar approach found only minimal contri-
butions from viral sources (19, 40). The majority
of viral DNA we captured in fosmid clone
libraries apparently originates from replicat-
ing viruses within infected host cells (35).
Viral DNA recovery was highest in the photic
zone, with cyanophage-like sequences repre-
senting 1 to 10% of all fosmid sequences (Fig.
5), and 60 to 80% of total virus sequences there.
Below 200 m, viral DNA made up no more
than 0.3% of all sequences at each depth.
Most photic zone viral sequences shared highest
similarity to T7-like and T4-like cyanophage of
the Podoviridae and Myoviridae. This is con-
sistent with previous studies (40–42), suggesting
a widespread distribution of these phage in the
ocean.
Analyses of 1107 fosmid mate pairs pro-
vided further insight into the origins of the viral
sequences. About 67% of the viruslike clones
were most similar to cyanophage on at least one
end, and half of these were highly similar to
cyanophage at both termini. Many of the
cyanophage clones showed apparent synteny
with previously sequenced cyanophage ge-
nomes (fig. S12). About 11% of the cyanophage
paired-ends contained a host-derived cyano-
phage ‘‘signature’’ gene (43) on one terminus.
The frequency and genetic-linkage of phage-
encoded (but host-derived) genes we observed,
including virus-derived genes involved in pho-
tosynthesis ( psbA, psbD, hli), phosphate-
scavenging genes (phoH, pstS), a cobalamin
biosynthesis gene (cobS), and carbon metabo-
lism (transaldolase) supports their widespread
distribution in natural viral populations and
their probable functional importance to cyano-
phage replication (43, 44).
If we assume that the cyanophages’ DNA was
derived from infected host cells in which phage
were replicating, the percentage of cyanophage-
infected cells was estimated to range between 1
and 12% (35). An apparent cyanophage infec-
tion maxima was observed at 70 m, coinciding
with the peak virus:host ratio (Fig. 5). Although
these estimates are tentative, they are consistent
with previously reported ranges of phage-
infected picoplankton cells in situ (38, 45).
About 0.5% of all sequences were likely
prophage, as inferred from high sequence sim-
ilarity to phage-related integrases and known
prophage genes (35). Paired-end analyses of
viral fosmids indicated that È2.5% may be
derived from prophage integrated into a variety
of host taxa. A few clones also appear to be
derived from temperate siphoviruses, and a
number of putative eukaryotic paired-end viral
sequences shared highest sequence identity with
homologs from herpes viruses, mimiviruses,
and algal viruses.
Fig. 3. Habitat-specificsequences in photic zoneversus deep-water communi-ties. The dendrogram showsa cluster analysis based oncumulative bitscores de-rived fromreciprocalTBLASTXcomparisons between alldepths. Only the branch-ing pattern resulting fromneighbor-joining analy-ses (not branch-lengths)are shown in the dendro-gram. The Venn diagramsdepict the percentage of se-quences that were presentonly in PZ sequences (n 0
12,713) or DW sequences(n 0 14,132), as deter-mined in reciprocal BLASTsearches of all sequences ineach depth versus everyother. The percentage outof the total PZ or DW sequence bins represented in each subset is shown. See SOM for methods (35).
RESEARCH ARTICLES
27 JANUARY 2006 VOL 311 SCIENCE www.sciencemag.org500
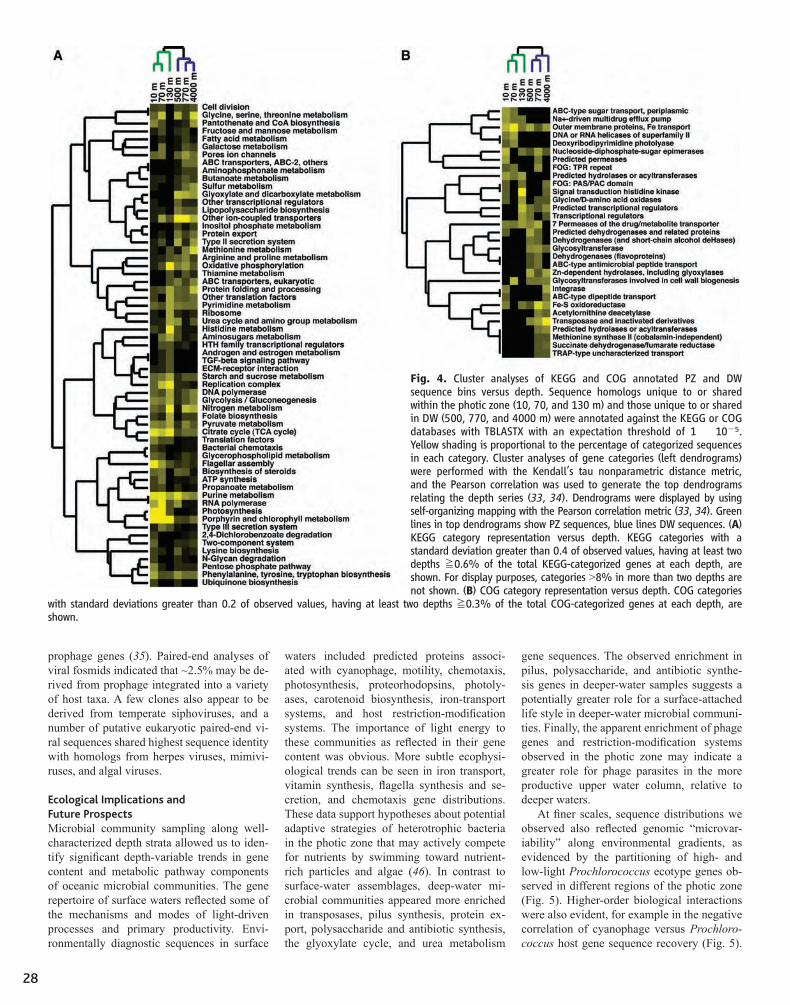
28
Ecological Implications andFuture Prospects
Microbial community sampling along well-
characterized depth strata allowed us to identify
significant depth-variable trends in gene content
and metabolic pathway components of oceanic
microbial communities. The gene repertoire of
surface waters reflected some of the mechanisms
and modes of light-driven processes and primary
productivity. Environmentally diagnostic sequences
in surface waters included predicted proteins as-
sociated with cyanophage, motility, chemotax-
is, photosynthesis, proteorhodopsins, photolyases,
carotenoid biosynthesis, iron-transport systems,
and host restriction-modification systems. The
importance of light energy to these communi-
ties as reflected in their gene content was ob-
vious. More subtle ecophysiological trends can
be seen in iron transport, vitamin synthesis,
flagella synthesis and secretion, and chemotaxis
gene distributions. These data support hypothe-
ses about potential adaptive strategies of het-
erotrophic bacteria in the photic zone that may
actively compete for nutrients by swimming
toward nutrient-rich particles and algae (46). In
contrast to surface-water assemblages, deep-
water microbial communities appeared more
enriched in transposases, pilus synthesis, protein
export, polysaccharide and antibiotic synthesis,
the glyoxylate cycle, and urea metabolism gene
sequences. The observed enrichment in pilus,
polysaccharide, and antibiotic synthesis genes
in deeper-water samples suggests a potentially
greater role for a surface-attached life style in
deeper-water microbial communities. Finally,
the apparent enrichment of phage genes and
restriction-modification systems observed in
the photic zone may indicate a greater role for
phage parasites in the more productive upper
water column, relative to deeper waters.
At finer scales, sequence distributions we
observed also reflected genomic ‘‘microvari-
ability’’ along environmental gradients, as
evidenced by the partitioning of high- and low-
light Prochlorococcus ecotype genes observed
in different regions of the photic zone (Fig. 5).
Higher-order biological interactions were also
evident, for example in the negative correlation
of cyanophage versus Prochlorococcus host gene
sequence recovery (Fig. 5). This relation be-
tween the abundance of host and cyanophage
DNA probably reflects specific mechanisms of
cyanophage replication in situ. These host-parasite
sequence correlations we saw demonstrate the po-
tential for observing community-level interspe-
cies interactions through environmental genomic
datasets.
Obviously, the abundance of specific taxa
will greatly influence the gene distributions ob-
served, as we saw, for example, in Prochlorococ-
cus gene distribution in the photic zone. Gene
sequence distributions can reflect more than just
relative abundance of specific taxa, however.
Fig. 4. Cluster analyses of KEGG and COG annotated PZ and DWsequence bins versus depth. Sequence homologs unique to or sharedwithin the photic zone (10, 70, and 130 m) and those unique to or sharedin DW (500, 770, and 4000 m) were annotated against the KEGG or COGdatabases with TBLASTX with an expectation threshold of 1 � 10j5.Yellow shading is proportional to the percentage of categorized sequencesin each category. Cluster analyses of gene categories (left dendrograms)were performed with the Kendall’s tau nonparametric distance metric,and the Pearson correlation was used to generate the top dendrogramsrelating the depth series (33, 34). Dendrograms were displayed by usingself-organizing mapping with the Pearson correlation metric (33, 34). Greenlines in top dendrograms show PZ sequences, blue lines DW sequences. (A)KEGG category representation versus depth. KEGG categories with astandard deviation greater than 0.4 of observed values, having at least twodepths R0.6% of the total KEGG-categorized genes at each depth, areshown. For display purposes, categories 98% in more than two depths arenot shown. (B) COG category representation versus depth. COG categories
with standard deviations greater than 0.2 of observed values, having at least two depths R0.3% of the total COG-categorized genes at each depth, areshown.
RESEARCH ARTICLES
www.sciencemag.org SCIENCE VOL 311 27 JANUARY 2006 501
prophage genes (35). Paired-end analyses of viral fosmids indicated that ∼2.5% may be de-rived from prophage integrated into a variety of host taxa. A few clones also appear to be derived from temperate siphoviruses, and a number of putative eukaryotic paired-end vi-ral sequences shared highest sequence identity with homologs from herpes viruses, mimivi-ruses, and algal viruses.
Ecological Implications and Future ProspectsMicrobial community sampling along well-characterized depth strata allowed us to iden-tify significant depth�variable trends in gene content and metabolic pathway components of oceanic microbial communities. The gene repertoire of surface waters reflected some of the mechanisms and modes of light-driven processes and primary productivity. Envi-ronmentally diagnostic sequences in surface
waters included predicted proteins associ-ated with cyanophage, motility, chemotaxis, photosynthesis, proteorhodopsins, photoly-ases, carotenoid biosynthesis, iron-transport systems, and host restriction�modification systems. The importance of light energy to these communities as reflected in their gene content was obvious. More subtle ecophysi-ological trends can be seen in iron transport, vitamin synthesis, flagella synthesis and se-cretion, and chemotaxis gene distributions. These data support hypotheses about potential adaptive strategies of heterotrophic bacteria in the photic zone that may actively compete for nutrients by swimming toward nutrient-rich particles and algae (46). In contrast to surface-water assemblages, deep-water mi-crobial communities appeared more enriched in transposases, pilus synthesis, protein ex-port, polysaccharide and antibiotic synthesis, the glyoxylate cycle, and urea metabolism
gene sequences. The observed enrichment in pilus, polysaccharide, and antibiotic synthe-sis genes in deeper-water samples suggests a potentially greater role for a surface-attached life style in deeper-water microbial communi-ties. Finally, the apparent enrichment of phage genes and restriction�modification systems observed in the photic zone may indicate a greater role for phage parasites in the more productive upper water column, relative to deeper waters.
At finer scales, sequence distributions we observed also reflected genomic “microvar-iability” along environmental gradients, as evidenced by the partitioning of high- and low-light Prochlorococcus ecotype genes ob-served in different regions of the photic zone (Fig. 5). Higher-order biological interactions were also evident, for example in the negative correlation of cyanophage versus Prochloro-coccus host gene sequence recovery (Fig. 5).
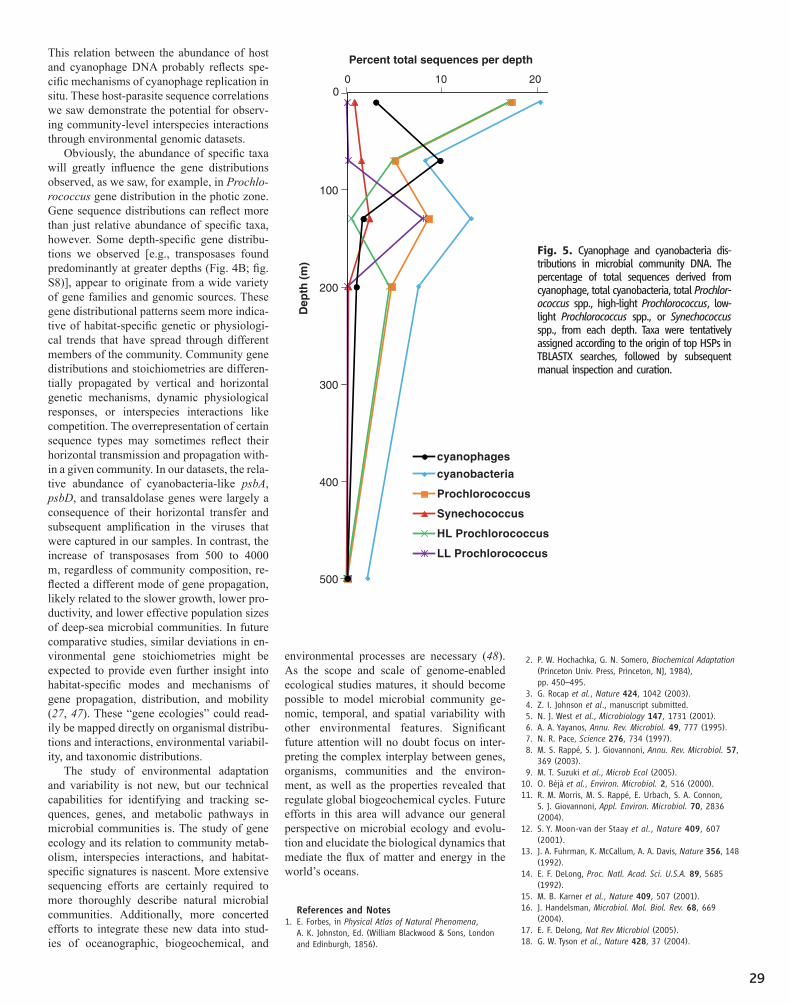
29
This relation between the abundance of host and cyanophage DNA probably reflects spe-cific mechanisms of cyanophage replication in situ. These host-parasite sequence correlations we saw demonstrate the potential for observ-ing community-level interspecies interactions through environmental genomic datasets.
Obviously, the abundance of specific taxa will greatly influence the gene distributions observed, as we saw, for example, in Prochlo-rococcus gene distribution in the photic zone. Gene sequence distributions can reflect more than just relative abundance of specific taxa, however. Some depth�specific gene distribu-tions we observed [e.g., transposases found predominantly at greater depths (Fig. 4B; fig. S8)], appear to originate from a wide variety of gene families and genomic sources. These gene distributional patterns seem more indica-tive of habitat�specific genetic or physiologi-cal trends that have spread through different members of the community. Community gene distributions and stoichiometries are differen-tially propagated by vertical and horizontal genetic mechanisms, dynamic physiological responses, or interspecies interactions like competition. The overrepresentation of certain sequence types may sometimes reflect their horizontal transmission and propagation with-in a given community. In our datasets, the rela-tive abundance of cyanobacteria-like psbA, psbD, and transaldolase genes were largely a consequence of their horizontal transfer and subsequent amplification in the viruses that were captured in our samples. In contrast, the increase of transposases from 500 to 4000 m, regardless of community composition, re-flected a different mode of gene propagation, likely related to the slower growth, lower pro-ductivity, and lower effective population sizes of deep-sea microbial communities. In future comparative studies, similar deviations in en-vironmental gene stoichiometries might be expected to provide even further insight into habitat�specific modes and mechanisms of gene propagation, distribution, and mobility (27, 47). These “gene ecologies” could read-ily be mapped directly on organismal distribu-tions and interactions, environmental variabil-ity, and taxonomic distributions.
The study of environmental adaptation and variability is not new, but our technical capabilities for identifying and tracking se-quences, genes, and metabolic pathways in microbial communities is. The study of gene ecology and its relation to community metab-olism, interspecies interactions, and habitat-specific signatures is nascent. More extensive sequencing efforts are certainly required to more thoroughly describe natural microbial communities. Additionally, more concerted efforts to integrate these new data into stud-ies of oceanographic, biogeochemical, and
environmental processes are necessary (48). As the scope and scale of genome-enabled ecological studies matures, it should become possible to model microbial community ge-nomic, temporal, and spatial variability with other environmental features. Significant future attention will no doubt focus on inter-preting the complex interplay between genes, organisms, communities and the environ-ment, as well as the properties revealed that regulate global biogeochemical cycles. Future efforts in this area will advance our general perspective on microbial ecology and evolu-tion and elucidate the biological dynamics that mediate the flux of matter and energy in the world’s oceans.
Some depth-specific gene distributions we ob-
served [e.g., transposases found predominantly
at greater depths (Fig. 4B; fig. S8)], appear to
originate from a wide variety of gene families
and genomic sources. These gene distributional
patterns seemmore indicative of habitat-specific
genetic or physiological trends that have spread
through different members of the community.
Community gene distributions and stoichiome-
tries are differentially propagated by vertical and
horizontal genetic mechanisms, dynamic physi-
ological responses, or interspecies interactions
like competition. The overrepresentation of
certain sequence types may sometimes reflect
their horizontal transmission and propagation
within a given community. In our datasets, the
relative abundance of cyanobacteria-like psbA,
psbD, and transaldolase genes were largely a
consequence of their horizontal transfer and
subsequent amplification in the viruses that
were captured in our samples. In contrast, the
increase of transposases from 500 to 4000 m,
regardless of community composition, re-
flected a different mode of gene propagation,
likely related to the slower growth, lower
productivity, and lower effective population
sizes of deep-sea microbial communities. In
future comparative studies, similar deviations
in environmental gene stoichiometries might
be expected to provide even further insight
into habitat-specific modes and mechanisms
of gene propagation, distribution, and mobil-
ity (27, 47). These ‘‘gene ecologies’’ could
readily be mapped directly on organismal
distributions and interactions, environmental
variability, and taxonomic distributions.
The study of environmental adaptation and
variability is not new, but our technical capa-
bilities for identifying and tracking sequences,
genes, and metabolic pathways in microbial
communities is. The study of gene ecology and
its relation to community metabolism, inter-
species interactions, and habitat-specific signa-
tures is nascent. More extensive sequencing
efforts are certainly required to more thoroughly
describe natural microbial communities. Addi-
tionally, more concerted efforts to integrate these
new data into studies of oceanographic, bio-
geochemical, and environmental processes are
necessary (48). As the scope and scale of genome-
enabled ecological studies matures, it should
become possible to model microbial community
genomic, temporal, and spatial variability with
other environmental features. Significant future
attention will no doubt focus on interpreting
the complex interplay between genes, orga-
nisms, communities and the environment, as
well as the properties revealed that regulate
global biogeochemical cycles. Future efforts
in this area will advance our general perspective
on microbial ecology and evolution and elu-
cidate the biological dynamics that mediate
the flux of matter and energy in the world’s
oceans.
References and Notes1. E. Forbes, in Physical Atlas of Natural Phenomena,
A. K. Johnston, Ed. (William Blackwood & Sons, London
and Edinburgh, 1856).
2. P. W. Hochachka, G. N. Somero, Biochemical Adaptation
(Princeton Univ. Press, Princeton, NJ, 1984),
pp. 450–495.
3. G. Rocap et al., Nature 424, 1042 (2003).
4. Z. I. Johnson et al., manuscript submitted.
5. N. J. West et al., Microbiology 147, 1731 (2001).
6. A. A. Yayanos, Annu. Rev. Microbiol. 49, 777 (1995).
7. N. R. Pace, Science 276, 734 (1997).
8. M. S. Rappe, S. J. Giovannoni, Annu. Rev. Microbiol. 57,
369 (2003).
9. M. T. Suzuki et al., Microb Ecol (2005).
10. O. Beja et al., Environ. Microbiol. 2, 516 (2000).
11. R. M. Morris, M. S. Rappe, E. Urbach, S. A. Connon,
S. J. Giovannoni, Appl. Environ. Microbiol. 70, 2836
(2004).
12. S. Y. Moon-van der Staay et al., Nature 409, 607
(2001).
13. J. A. Fuhrman, K. McCallum, A. A. Davis, Nature 356, 148
(1992).
14. E. F. DeLong, Proc. Natl. Acad. Sci. U.S.A. 89, 5685
(1992).
15. M. B. Karner et al., Nature 409, 507 (2001).
16. J. Handelsman, Microbiol. Mol. Biol. Rev. 68, 669
(2004).
17. E. F. Delong, Nat Rev Microbiol (2005).
18. G. W. Tyson et al., Nature 428, 37 (2004).
19. J. C. Venter et al., Science 304, 66 (2004).
20. S. G. Tringe et al., Science 308, 554 (2005).
21. S. J. Hallam et al., Science 305, 1457 (2004).
22. D. M. Karl, R. Lukas, Deep-Sea Res. II 43, 129
(1996).
23. D. M. Karl et al., Deep-Sea Res. II 48, 1449 (2001).
24. R. M. Letelier et al., Limnol. Oceanogr. 49, 508
(2004).
25. E. F. DeLong et al., Appl. Environ. Microbiol. 65, 5554
(1999).
26. A. Pernthaler et al., Appl. Environ. Microbiol. 68, 661
(2002).
27. N. U. Frigaard et al., Nature, in press.
28. S. M. Barns, C. F. Delwiche, J. D. Palmer, N. R. Pace, Proc.
Natl. Acad. Sci. U.S.A. 93, 9188 (1996).
29. M. Kanehisa et al., Nucleic Acids Res. 32, D277
(2004).
30. R. L. Tatusov et al., BMC Bioinformatics 4, 41 (2003).
31. R. Overbeek et al., Nucleic Acids Res. 33, 5691
(2005).
32. S. F. Altschul et al., J. Mol. Biol. 215, 403 (1990).
33. M. J. L. de Hoon et al., Bioinformatics 12, 1453
(2004).
34. M. B. Eisen, P. T. Spellman, P. O. Brown, Proc. Natl. Acad.
Sci. U.S.A. 94, 14863 (1998).
35. Materials and methods are available as supporting
material on Science Online.
36. K. D. Pruitt, T. Tatusova, D. R. Maglott, Nucleic Acids Res.
33, D501 (2005).
37. M. G. Weinbauer, FEMS Microbiol. Rev. 28, 127
(2004).
Fig. 5. Cyanophage and cyanobacteria dis-tributions in microbial community DNA. Thepercentage of total sequences derived fromcyanophage, total cyanobacteria, total Prochlor-ococcus spp., high-light Prochlorococcus, low-light Prochlorococcus spp., or Synechococcusspp., from each depth. Taxa were tentativelyassigned according to the origin of top HSPs inTBLASTX searches, followed by subsequentmanual inspection and curation.
0
100
200
300
400
500
0 10 20
cyanobacteria
Prochlorococcus
Synechococcus
HL Prochlorococcus
LL Prochlorococcus
cyanophages
Percent total sequences per depth
Dep
th (
m)
RESEARCH ARTICLES
27 JANUARY 2006 VOL 311 SCIENCE www.sciencemag.org502
30
38. J. Waterbury, F. Valois, Appl. Environ. Microbiol. 59, 3393
(1993).
39. M. B. Sullivan et al., Nature 424, 1047 (2003).
40. R. A. Edwards, F. Rohwer, Nat. Rev. Microbiol. 3, 504
(2005).
41. J. Filee, F. Tetart, C. A. Suttle, H. M. Krisch, Proc. Natl.
Acad. Sci. U.S.A. 102, 12471 (2005).
42. M. Breitbart, J. H. Miyake, F. Rohwer, FEMS Microbiol.
Lett. 236, 249 (2004).
43. M. B. Sullivan et al., PLoS Biol. 3, e144 (2005).
44. D. Lindell et al., Proc. Natl. Acad. Sci. U.S.A. 101, 11013
(2004).
45. M. G. Weinbauer, I. Brettar, M. G. Hofle, Limnol.
Oceanogr. 48, 1457 (2003).
46. F. Azam, Science 280, 694 (1998).
47. C. R. Woese, Microbiol. Mol. Biol. Rev. 68, 173 (2004).
48. E. F. DeLong, D. M. Karl, Nature 437, 336 (2005).
49. (http://hahana.soest.hawaii.edu/hot/parameters.html).
50. (http://hahana.soest.hawaii.edu/hot/hot-dogs).
51. This work was supported by a grant from the Gordon and
Betty Moore Foundation, NSF grants MCB-0084211,
MCB-0348001, and MCB-0509923 to E.F.D., and
OCE-0326616 to D.M.K., and sequencing support from
the U.S. Department of Energy Microbial Genomics
Program. We thank Dennis Ryan for help with scripting
and sequence analyses, the officers and crew of the R/V
Ka’imikai-O-Kanaloa and the HOT team for assistance
at sea, and L. Fujieki for help with oceanographic data
display. J. Chapman, A. Salamov, and P. Richardson of
the DOE Joint Genome Institute provided advice and
assistance in DNA sequencing and analyses. Sequences
have been deposited in GenBank with accession
numbers DU731018-DU796676 and DU800850-
DU800864 corresponding to fosmid end sequences,
and accession numbers DQ300508-DQ300926
corresponding to SSU rRNA gene sequences.
Supporting Online Materialwww.sciencemag.org/cgi/content/full/311/5760/496/DC1
Materials and Methods
Figs. S1 to S12
Table S1
References and Notes
16 September 2005; accepted 21 December 2005
10.1126/science.1120250
REPORTS
Pairing and Phase Separation in aPolarized Fermi Gas
Guthrie B. Partridge, Wenhui Li, Ramsey I. Kamar, Yean-an Liao, Randall G. Hulet*
We report the observation of pairing in a gas of atomic fermions with unequal numbers of twocomponents. Beyond a critical polarization, the gas separates into a phase that is consistent with asuperfluid paired core surrounded by a shell of normal unpaired fermions. The critical polarizationdiminishes with decreasing attractive interaction. For near-zero polarization, we measured theparameter b 0 –0.54 T 0.05, describing the universal energy of a strongly interacting paired Fermigas, and found good agreement with recent theory. These results are relevant to predictions ofexotic new phases of quark matter and of strongly magnetized superconductors.
Fermion pairing is the essential ingredient
in the Bardeen, Cooper, and Schrieffer
(BCS) theory of superconductivity. In
conventional superconductors, the chemical
potentials of the two spin states are equal.
There has been great interest, however, in the
consequences of mismatched chemical poten-
tials that may arise in several important sit-
uations, including, for example, magnetized
superconductors (1–3) and cold dense quark
matter at the core of neutron stars (4). A
chemical potential imbalance may be produced
by several mechanisms, including magneti-
zation in the case of superconductors, mass
asymmetry, or unequal numbers. Pairing is qual-
itatively altered by the Fermi energy mismatch,
and there has been considerable speculation
regarding the nature and relative stability of
various proposed exotic phases. In the Fulde-
Ferrel-Larkin-Ovchinnikov (FFLO) phase (2, 3),
pairs possess a nonzero center-of-mass momen-
tum that breaks translational invariance, whereas
the Sarma (1), or the breached pair (5), phase
is speculated to have gapless excitations. A
mixed phase has also been proposed (6–8) in
which regions of a paired BCS superfluid are
surrounded by an unpaired normal phase. Little
is known experimentally, however, because of
the difficulty in creating magnetized super-
conductors. Initial evidence for an FFLO phase
in a heavy-fermion superconductor has only
recently been reported (9, 10). Opportunities for
experimental investigation of exotic pairing
states have expanded dramatically with the
recent realization of the Bose-Einstein conden-
sate (BEC)–BCS crossover in a two spin state
mixture of ultracold atomic gases. Recent ex-
periments have demonstrated both superfluid-
ity (11–13) and pairing (14–17) in atomic Fermi
gases. We report the observation of pairing in a
polarized gas of 6Li atoms. Above an interaction-
dependent critical polarization, we observed a
phase separation that is consistent with a uni-
formly paired superfluid core surrounded by
an unpaired shell of the excess spin state. Be-
low the critical polarization, the spatial size of
the gas was in agreement with expectations
for a universal, strongly interacting paired Fermi
gas.
Our methods for producing a degenerate
gas of fermionic 6Li atoms (18, 19) and the
realization of the BEC-BCS crossover at a
Feshbach resonance (17) have been described
previously (20). An incoherent spin mixture
of the F 0 ½, mF0 ½ (state k1À) and the F 0 ½,
mF0 –½ (state k2À) sublevels (where F is the
total spin quantum number and mFis its projec-
tion) is created by radio frequency (rf) sweeps,
where the relative number of the two states can
be controlled by the rf power (20). The spin
mixture is created at a magnetic field of 754 G,
which is within the broad Feshbach resonance
located near 834 G (21, 22). The spin mixture is
evaporatively cooled by reducing the depth of
the optical trap that confines it, and the mag-
netic field is ramped adiabatically to a desired
field within the crossover region. States k1À andk2À are sequentially and independently imaged
in the trap by absorption (20). Analysis of
these images provides measurement of Niand
polarization P 0 (N1– N
2)/(N
1þ N
2), where
Niis the number of atoms in state kiÀ. We ex-
press the Fermi temperature, TF, in terms of
the majority spin state, state k1À, as kBTF0
Iw (6N1)1/3, where w 0 2p (u
r2uz)1/3 is the
mean harmonic frequency of the cylindrically
symmetric confining potential with radial and
axial frequencies urand u
z, respectively. For
P , 0, we find that N1, N
2, 105, giving T
F,
400 nK for our trap frequencies. Because of
decreasing evaporation efficiency with increas-
ing polarization, there is a correlation between
P and total atom number (fig. S1).
For fields on the low-field (BEC) side of
resonance, real two-body bound states exist, and
molecules are readily formed by three-body
recombination. For the case of P 0 0, a
molecular Bose-Einstein condensate (MBEC) is
observed to form with no detectable thermal
molecules (17). On the basis of an estimated
MBEC condensate fraction of 990%, we place
an upper limit on the temperature T G 0.1TFat a
field of 754 G (17). However, the gas is expected
to be cooled further during the adiabatic ramp for
final fields greater than 754 G (17). By using
similar experimental methods, we previously
measured the order parameter of the gas in the
BCS regime and found good agreement with T 0
0 BCS theory (17), indicating that the gas was
well below the critical temperature for pairing.
Images of states k1À and k2À at a field of
830 G are shown (Fig. 1) for relative numbers
RESEARCH ARTICLES
Department of Physics and Astronomy and Rice QuantumInstitute, Rice University, Houston, TX 77251, USA.
*To whom correspondence should be addressed. E-mail:[email protected]
www.sciencemag.org SCIENCE VOL 311 27 JANUARY 2006 503
Some depth-specific gene distributions we ob-
served [e.g., transposases found predominantly
at greater depths (Fig. 4B; fig. S8)], appear to
originate from a wide variety of gene families
and genomic sources. These gene distributional
patterns seemmore indicative of habitat-specific
genetic or physiological trends that have spread
through different members of the community.
Community gene distributions and stoichiome-
tries are differentially propagated by vertical and
horizontal genetic mechanisms, dynamic physi-
ological responses, or interspecies interactions
like competition. The overrepresentation of
certain sequence types may sometimes reflect
their horizontal transmission and propagation
within a given community. In our datasets, the
relative abundance of cyanobacteria-like psbA,
psbD, and transaldolase genes were largely a
consequence of their horizontal transfer and
subsequent amplification in the viruses that
were captured in our samples. In contrast, the
increase of transposases from 500 to 4000 m,
regardless of community composition, re-
flected a different mode of gene propagation,
likely related to the slower growth, lower
productivity, and lower effective population
sizes of deep-sea microbial communities. In
future comparative studies, similar deviations
in environmental gene stoichiometries might
be expected to provide even further insight
into habitat-specific modes and mechanisms
of gene propagation, distribution, and mobil-
ity (27, 47). These ‘‘gene ecologies’’ could
readily be mapped directly on organismal
distributions and interactions, environmental
variability, and taxonomic distributions.
The study of environmental adaptation and
variability is not new, but our technical capa-
bilities for identifying and tracking sequences,
genes, and metabolic pathways in microbial
communities is. The study of gene ecology and
its relation to community metabolism, inter-
species interactions, and habitat-specific signa-
tures is nascent. More extensive sequencing
efforts are certainly required to more thoroughly
describe natural microbial communities. Addi-
tionally, more concerted efforts to integrate these
new data into studies of oceanographic, bio-
geochemical, and environmental processes are
necessary (48). As the scope and scale of genome-
enabled ecological studies matures, it should
become possible to model microbial community
genomic, temporal, and spatial variability with
other environmental features. Significant future
attention will no doubt focus on interpreting
the complex interplay between genes, orga-
nisms, communities and the environment, as
well as the properties revealed that regulate
global biogeochemical cycles. Future efforts
in this area will advance our general perspective
on microbial ecology and evolution and elu-
cidate the biological dynamics that mediate
the flux of matter and energy in the world’s
oceans.
References and Notes1. E. Forbes, in Physical Atlas of Natural Phenomena,
A. K. Johnston, Ed. (William Blackwood & Sons, London
and Edinburgh, 1856).
2. P. W. Hochachka, G. N. Somero, Biochemical Adaptation
(Princeton Univ. Press, Princeton, NJ, 1984),
pp. 450–495.
3. G. Rocap et al., Nature 424, 1042 (2003).
4. Z. I. Johnson et al., manuscript submitted.
5. N. J. West et al., Microbiology 147, 1731 (2001).
6. A. A. Yayanos, Annu. Rev. Microbiol. 49, 777 (1995).
7. N. R. Pace, Science 276, 734 (1997).
8. M. S. Rappe, S. J. Giovannoni, Annu. Rev. Microbiol. 57,
369 (2003).
9. M. T. Suzuki et al., Microb Ecol (2005).
10. O. Beja et al., Environ. Microbiol. 2, 516 (2000).
11. R. M. Morris, M. S. Rappe, E. Urbach, S. A. Connon,
S. J. Giovannoni, Appl. Environ. Microbiol. 70, 2836
(2004).
12. S. Y. Moon-van der Staay et al., Nature 409, 607
(2001).
13. J. A. Fuhrman, K. McCallum, A. A. Davis, Nature 356, 148
(1992).
14. E. F. DeLong, Proc. Natl. Acad. Sci. U.S.A. 89, 5685
(1992).
15. M. B. Karner et al., Nature 409, 507 (2001).
16. J. Handelsman, Microbiol. Mol. Biol. Rev. 68, 669
(2004).
17. E. F. Delong, Nat Rev Microbiol (2005).
18. G. W. Tyson et al., Nature 428, 37 (2004).
19. J. C. Venter et al., Science 304, 66 (2004).
20. S. G. Tringe et al., Science 308, 554 (2005).
21. S. J. Hallam et al., Science 305, 1457 (2004).
22. D. M. Karl, R. Lukas, Deep-Sea Res. II 43, 129
(1996).
23. D. M. Karl et al., Deep-Sea Res. II 48, 1449 (2001).
24. R. M. Letelier et al., Limnol. Oceanogr. 49, 508
(2004).
25. E. F. DeLong et al., Appl. Environ. Microbiol. 65, 5554
(1999).
26. A. Pernthaler et al., Appl. Environ. Microbiol. 68, 661
(2002).
27. N. U. Frigaard et al., Nature, in press.
28. S. M. Barns, C. F. Delwiche, J. D. Palmer, N. R. Pace, Proc.
Natl. Acad. Sci. U.S.A. 93, 9188 (1996).
29. M. Kanehisa et al., Nucleic Acids Res. 32, D277
(2004).
30. R. L. Tatusov et al., BMC Bioinformatics 4, 41 (2003).
31. R. Overbeek et al., Nucleic Acids Res. 33, 5691
(2005).
32. S. F. Altschul et al., J. Mol. Biol. 215, 403 (1990).
33. M. J. L. de Hoon et al., Bioinformatics 12, 1453
(2004).
34. M. B. Eisen, P. T. Spellman, P. O. Brown, Proc. Natl. Acad.
Sci. U.S.A. 94, 14863 (1998).
35. Materials and methods are available as supporting
material on Science Online.
36. K. D. Pruitt, T. Tatusova, D. R. Maglott, Nucleic Acids Res.
33, D501 (2005).
37. M. G. Weinbauer, FEMS Microbiol. Rev. 28, 127
(2004).
Fig. 5. Cyanophage and cyanobacteria dis-tributions in microbial community DNA. Thepercentage of total sequences derived fromcyanophage, total cyanobacteria, total Prochlor-ococcus spp., high-light Prochlorococcus, low-light Prochlorococcus spp., or Synechococcusspp., from each depth. Taxa were tentativelyassigned according to the origin of top HSPs inTBLASTX searches, followed by subsequentmanual inspection and curation.
0
100
200
300
400
500
0 10 20
cyanobacteria
Prochlorococcus
Synechococcus
HL Prochlorococcus
LL Prochlorococcus
cyanophages
Percent total sequences per depth
Dep
th (
m)
RESEARCH ARTICLES
27 JANUARY 2006 VOL 311 SCIENCE www.sciencemag.org502
439, 847 (2006).

31
Molecular-level studies of organic compounds in marine sediments can provide a wealth of information
on the carbon cycle in past and present-day oceans as well as information on the deposi-tional setting and origin of organic matter. Of greatest utility are lipid biomarkers that are specific to individual or a restricted range of organisms and that are sufficiently refractory to be preserved in sediments. Three character-istic features of individual organic compounds are currently exploited by biogeochemists: precise molecular structure, absolute or rela-tive abundance, and stable carbon isotopic composition. A fourth feature, the radiocarbon content, has been added to the list (1). The 14C content provides a means to evaluate the source and fate of natural and anthropogenic organic compounds in the biogeosphere.
Organic materials from various sources and with different ages are deposited concur-rently in marine sediments. This is particularly the case near continents where fresh vascular plant debris, soil organic matter, and OC erod-ed from sedimentary rocks may be deposited together with autochthonous biomass synthe-sized in the water column. The construction
Variability in Radiocarbon Ages of Individual Organic Compounds from Marine SedimentsTimothy I. Eglinton,* Bryan C. Benitez-Nelson, Ann Pearson, Ann P. McNichol, James E. Bauer, Ellen R. M. Druffel
Organic carbon (OC) from multiple sources can be delivered contemporaneously to aquatic sediments. The influence of different OC inputs on carbon-14–based sediment chronologies is illustrated in the carbon-14 ages of purified, source-specific (biomarker) organic compounds from near-surface sediments underlying two contrasting marine systems, the Black Sea and the Arabian Sea. In the Black Sea, isotopic heterogeneity of n-alkanes indicated that OC was contributed from both fossil and contemporary sources. Compounds reflecting different source inputs to the Arabian Sea exhibit a 10,000-year range in conventional carbon-14 ages. Radiocarbon measurements of biomarkers of marine photoautotrophy enable sediment chronologies to be constructed independent of detrital OC influences.
of carbon budgets and sediment chronologies based on 14C measurements of total organic carbon (TOC) depends on being able to accu-rately quantify these inputs. The ages of spe-cific OC inputs and their influence on TOC 14C ages have remained elusive. Measurements of different compound classes in sediments have indicated that 14C contents are heterogeneous (2), but it is only at the biomarker level that these variations are fully expressed and can be attributed to specific inputs.
Here we present an assessment of radio-carbon ages measured in individual biomark-ers from two contrasting marine sedimentary systems. The Black Sea is a stratified anoxic marine basin, and the Arabian Sea is a highly productive system supported by intense sea-sonal upwelling. Organic carbon–rich sedi-ments accumulating in both seas are strongly influenced by terrigenous inputs. Numerous large rivers drain into the western Black Sea and affect the hydrography and geochemistry of this system (3), whereas eolian dust asso-ciated with seasonal monsoons is the primary mode of supply of continental OC to the Ara-bian Sea (4).
In the Black Sea, we studied laminated OC�rich (TOC, 5.5%) sediments at a depth of 4 to 7 cm recovered by a Mk�III box corer (BC4, station 2; 42°51′N, 31°57′E, at a water depth of 2129 m) during leg 134�9 of the 1988 R/V Knorr expedition. In the Arabian Sea, we studied a sediment sample (box core 6BC, depth of 2 to 4 cm; TOC, 6.7%) obtained from the Oman upwelling region in the Arabian Sea (17°48.7′N, 57°30.3′E, at a water depth of 747 m) during leg TN041 of the R/V T.G. Thompson expedition in 1994. We measured the natural 14C content of specific biomarker compounds chosen to reflect both autochtho-nous and allochthonous inputs (5) in order
to evaluate the magnitude and source of age variation in these components of sedimentary organic matter.
We selected a series of long chain (C37–39) alkenes (compounds i in Table 1), the domi-nant unsaturated hydrocarbons in the Black Sea lipid extract, for radiocarbon dating as biomarkers of marine photoautotrophy. These compounds are derived from prymnesiophyte algae, such as the coccolithophorid Emiliania huxleyi, a major phytoplankter and important contributor to sinking particulate matter in the contemporary Black Sea (6). An autochtho-nous origin for these compounds is supported by their δ13C values (Table 1), which are con-sistent with values for lipids from marine phy-toplankton (7). The similarity in both 13C val-ues and the conventional 14C ages (8) (Table 1) between the alkenes [average δ13C = −25.5 per mil; 950 years before the present (B.P.), respectively] and TOC (δ13C = −24.2 per mil; 880 years B.P.) suggests that modern photo-autotrophic biomass is a major component of the bulk OC in these sediments. The similarity in 14C ages between prymnesiophyte alkenes and TOC also suggests that, contrary to previ-ous assumptions (9), older detrital OC inputs have a minimal influence on the 14CTOC age of late Holocene Black Sea sediments. Con-version of conventional radiocarbon ages to reservoir-corrected ages for marine carbon requires that the reservoir age be accounted for before calibration against tree-ring records of atmospheric 14C abundance (10). The res-ervoir age describes the difference in 14C ac-tivity between atmospheric CO2 and surface-dissolved inorganic carbon (DIC) in marine systems resulting from the mixing of older waters from depth into the surface layer of the ocean. For a reservoir correction of 400 years (9), the alkenes yield a revised 14C age for the depth interval of 4 to 7 cm of 550 years B.P. and a calibrated (calendar) age of ∼1425 A.D., consistent with published 210Pb and 14C pro-files from abyssal Black Sea sediment cores. This age implies that sedimentation rates were 10 to 20 cm per thousand years during the late Holocene (9,11).
We assessed directly the allochthonous OC inputs from 14C measurements of individual C29 and C31 n-alkanes (compounds v and vi, respectively) (Fig. 1A). The chain length dis-tribution, odd over even carbon number pre-dominance (OEP), and δ13C compositions (Ta-ble 1) of these hydrocarbons are highly char-acteristic of leaf wax inputs from C3 vascular (land) plants (plants in which the first product of photosynthesis is a three-carbon acid) (12). The young conventional 14C ages for the C29 and C31 homologs relative to bulk OC (Fig. 2A) demonstrate that corrections for detrital contributions to Black Sea sediments should not necessarily invoke older OC inputs. In-
T. I. Eglinton, B. C. Benitez-Nelson, A. Pearson, Depart-ment of Marine Chemistry and Geochemistry, Woods Hole Oceanographic Institution, Woods Hole, MA 02543, USA. A. P. McNichol, National Ocean Sciences Accelerator Mass Spectrometry Facility, Woods Hole Oceano-graphic Institution, Woods Hole, MA 02543, USA. J. E. Bauer, School of Marine Science, College of Wil-liam and Mary, Gloucester Point, VA 23062, USA.E. R. M. Druffel, Department of Earth System Science, University of California, Irvine, CA 92697, USA.
*To whom correspondence should be addressed.
Originally published 8 August 1997
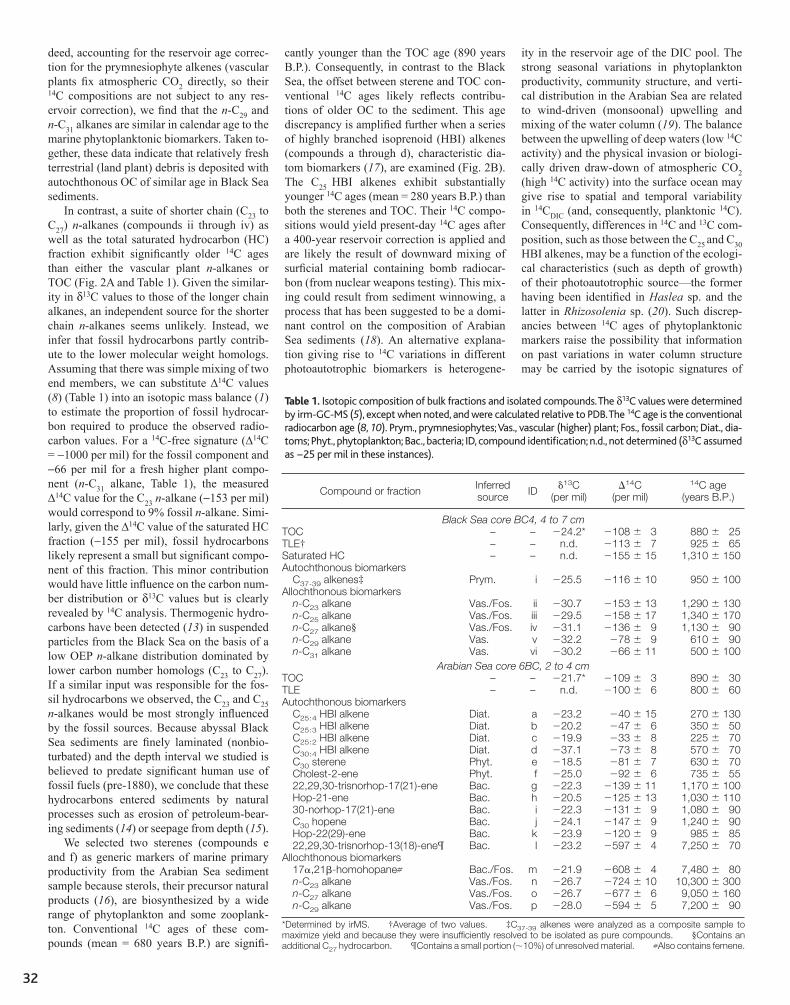
32
deed, accounting for the reservoir age correc-tion for the prymnesiophyte alkenes (vascular plants fix atmospheric CO2 directly, so their 14C compositions are not subject to any res-ervoir correction), we find that the n-C29 and n-C31 alkanes are similar in calendar age to the marine phytoplanktonic biomarkers. Taken to-gether, these data indicate that relatively fresh terrestrial (land plant) debris is deposited with autochthonous OC of similar age in Black Sea sediments.
In contrast, a suite of shorter chain (C23 to C27) n-alkanes (compounds ii through iv) as well as the total saturated hydrocarbon (HC) fraction exhibit significantly older 14C ages than either the vascular plant n-alkanes or TOC (Fig. 2A and Table 1). Given the similar-ity in δ13C values to those of the longer chain alkanes, an independent source for the shorter chain n-alkanes seems unlikely. Instead, we infer that fossil hydrocarbons partly contrib-ute to the lower molecular weight homologs. Assuming that there was simple mixing of two end members, we can substitute Δ14C values (8) (Table 1) into an isotopic mass balance (1) to estimate the proportion of fossil hydrocar-bon required to produce the observed radio-carbon values. For a 14C�free signature (Δ14C = −1000 per mil) for the fossil component and −66 per mil for a fresh higher plant compo-nent (n-C31 alkane, Table 1), the measured Δ14C value for the C23 n-alkane (−153 per mil) would correspond to 9% fossil n-alkane. Simi-larly, given the Δ14C value of the saturated HC fraction (−155 per mil), fossil hydrocarbons likely represent a small but significant compo-nent of this fraction. This minor contribution would have little influence on the carbon num-ber distribution or δ13C values but is clearly revealed by 14C analysis. Thermogenic hydro-carbons have been detected (13) in suspended particles from the Black Sea on the basis of a low OEP n-alkane distribution dominated by lower carbon number homologs (C23 to C27). If a similar input was responsible for the fos-sil hydrocarbons we observed, the C23 and C25 n�alkanes would be most strongly influenced by the fossil sources. Because abyssal Black Sea sediments are finely laminated (nonbio-turbated) and the depth interval we studied is believed to predate significant human use of fossil fuels (pre-1880), we conclude that these hydrocarbons entered sediments by natural processes such as erosion of petroleum-bear-ing sediments (14) or seepage from depth (15).
We selected two sterenes (compounds e and f) as generic markers of marine primary productivity from the Arabian Sea sediment sample because sterols, their precursor natural products (16), are biosynthesized by a wide range of phytoplankton and some zooplank-ton. Conventional 14C ages of these com-pounds (mean = 680 years B.P.) are signifi-
cantly younger than the TOC age (890 years B.P.). Consequently, in contrast to the Black Sea, the offset between sterene and TOC con-ventional 14C ages likely reflects contribu-tions of older OC to the sediment. This age discrepancy is amplified further when a series of highly branched isoprenoid (HBI) alkenes (compounds a through d), characteristic dia-tom biomarkers (17), are examined (Fig. 2B). The C25 HBI alkenes exhibit substantially younger 14C ages (mean = 280 years B.P.) than both the sterenes and TOC. Their 14C compo-sitions would yield present-day 14C ages after a 400�year reservoir correction is applied and are likely the result of downward mixing of surficial material containing bomb radiocar-bon (from nuclear weapons testing). This mix-ing could result from sediment winnowing, a process that has been suggested to be a domi-nant control on the composition of Arabian Sea sediments (18). An alternative explana-tion giving rise to 14C variations in different photoautotrophic biomarkers is heterogene-
ity in the reservoir age of the DIC pool. The strong seasonal variations in phytoplankton productivity, community structure, and verti-cal distribution in the Arabian Sea are related to wind-driven (monsoonal) upwelling and mixing of the water column (19). The balance between the upwelling of deep waters (low 14C activity) and the physical invasion or biologi-cally driven draw�down of atmospheric CO2 (high 14C activity) into the surface ocean may give rise to spatial and temporal variability in 14CDIC (and, consequently, planktonic 14C). Consequently, differences in 14C and 13C com-position, such as those between the C25 and C30 HBI alkenes, may be a function of the ecologi-cal characteristics (such as depth of growth) of their photoautotrophic source—the former having been identified in Haslea sp. and the latter in Rhizosolenia sp. (20). Such discrep-ancies between 14C ages of phytoplanktonic markers raise the possibility that information on past variations in water column structure may be carried by the isotopic signatures of
Table 1. Isotopic composition of bulk fractions and isolated compounds. The δ13C values were determined by irm-GC-MS (5), except when noted, and were calculated relative to PDB. The 14C age is the conventional radiocarbon age (8, 10). Prym., prymnesiophytes; Vas., vascular (higher) plant; Fos., fossil carbon; Diat., dia-toms; Phyt., phytoplankton; Bac., bacteria; ID, compound identification; n.d., not determined (δ13C assumed as −25 per mil in these instances).
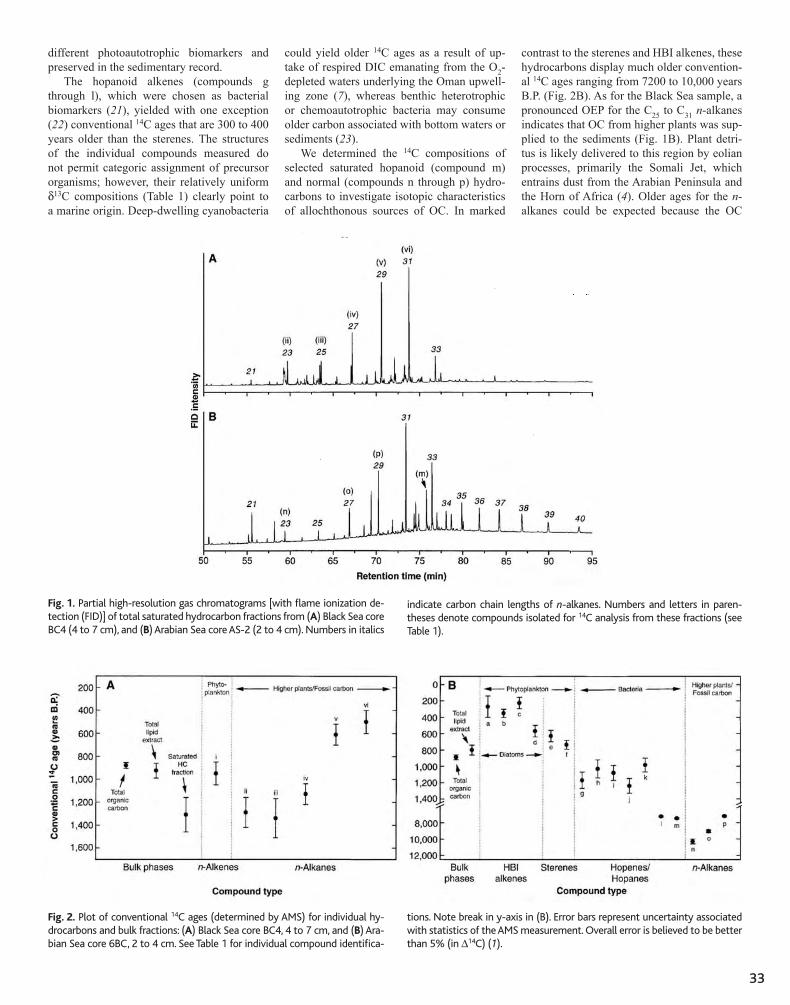
33
different photoautotrophic biomarkers and preserved in the sedimentary record.
The hopanoid alkenes (compounds g through l), which were chosen as bacterial biomarkers (21), yielded with one exception (22) conventional 14C ages that are 300 to 400 years older than the sterenes. The structures of the individual compounds measured do not permit categoric assignment of precursor organisms; however, their relatively uniform δ13C compositions (Table 1) clearly point to a marine origin. Deep�dwelling cyanobacteria
could yield older 14C ages as a result of up-take of respired DIC emanating from the O2-depleted waters underlying the Oman upwell-ing zone (7), whereas benthic heterotrophic or chemoautotrophic bacteria may consume older carbon associated with bottom waters or sediments (23).
We determined the 14C compositions of selected saturated hopanoid (compound m) and normal (compounds n through p) hydro-carbons to investigate isotopic characteristics of allochthonous sources of OC. In marked
Fig. 2. Plot of conventional 14C ages (determined by AMS) for individual hy-drocarbons and bulk fractions: (A) Black Sea core BC4, 4 to 7 cm, and (B) Ara-bian Sea core 6BC, 2 to 4 cm. See Table 1 for individual compound identifica-
Fig. 1. Partial high-resolution gas chromatograms [with flame ionization de-tection (FID)] of total saturated hydrocarbon fractions from (A) Black Sea core BC4 (4 to 7 cm), and (B) Arabian Sea core AS-2 (2 to 4 cm). Numbers in italics
contrast to the sterenes and HBI alkenes, these hydrocarbons display much older convention-al 14C ages ranging from 7200 to 10,000 years B.P. (Fig. 2B). As for the Black Sea sample, a pronounced OEP for the C25 to C31 n-alkanes indicates that OC from higher plants was sup-plied to the sediments (Fig. 1B). Plant detri-tus is likely delivered to this region by eolian processes, primarily the Somali Jet, which entrains dust from the Arabian Peninsula and the Horn of Africa (4). Older ages for the n-alkanes could be expected because the OC
tions. Note break in y-axis in (B). Error bars represent uncertainty associated with statistics of the AMS measurement. Overall error is believed to be better than 5% (in Δ14C) (1).
indicate carbon chain lengths of n-alkanes. Numbers and letters in paren-theses denote compounds isolated for 14C analysis from these fractions (see Table 1).
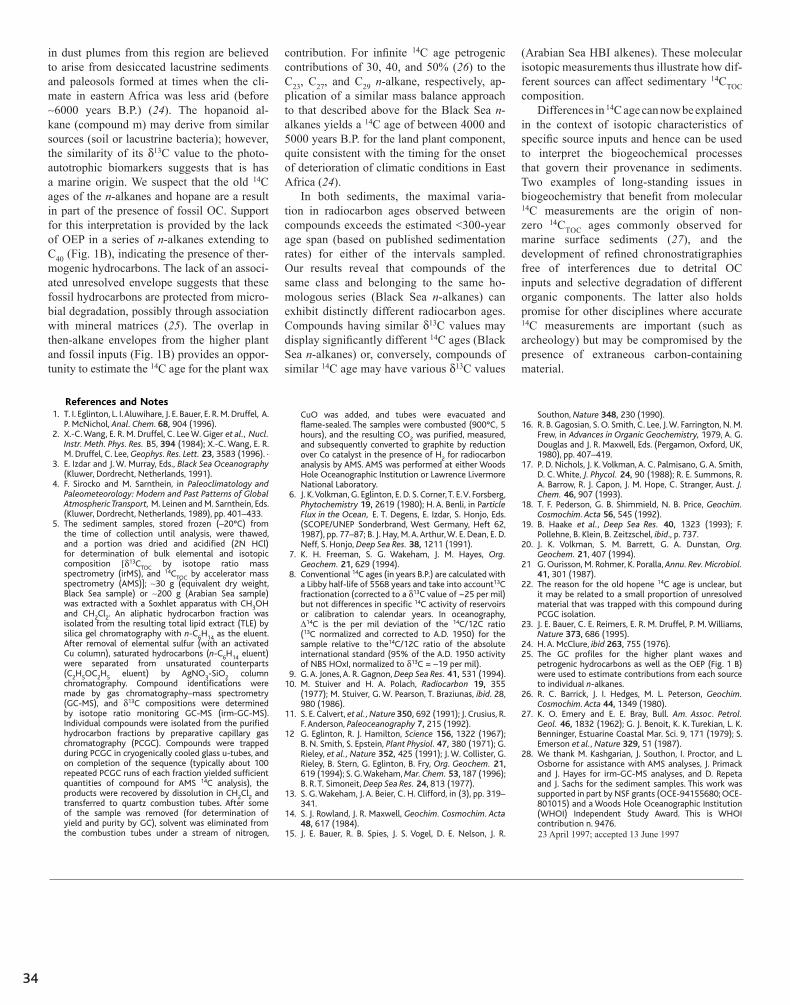
34
in dust plumes from this region are believed to arise from desiccated lacustrine sediments and paleosols formed at times when the cli-mate in eastern Africa was less arid (before ∼6000 years B.P.) (24). The hopanoid al-kane (compound m) may derive from similar sources (soil or lacustrine bacteria); however, the similarity of its δ13C value to the photo-autotrophic biomarkers suggests that is has a marine origin. We suspect that the old 14C ages of the n-alkanes and hopane are a result in part of the presence of fossil OC. Support for this interpretation is provided by the lack of OEP in a series of n-alkanes extending to C40 (Fig. 1B), indicating the presence of ther-mogenic hydrocarbons. The lack of an associ-ated unresolved envelope suggests that these fossil hydrocarbons are protected from micro-bial degradation, possibly through association with mineral matrices (25). The overlap in then-alkane envelopes from the higher plant and fossil inputs (Fig. 1B) provides an oppor-tunity to estimate the 14C age for the plant wax
cells (28), whereas only glucosamine andgalactosamine were detected at the end of theincubation (Table 2). The glucosamine:galac-tosamine ratio (2 :1) in bacterially derivedDOM at the end of the incubation was similarto the ratio of these amino sugars in seawater(28).
Recent studies have identified specificcomponents of the cell envelopes of marinebacteria in DOM from the surface and deepocean (4, 5). In addition to this evidence for abacterial source of marine DOM, laboratorystudies with radiotracers and marine bacterianoted the production of refractory DOM fromsimple compounds (9–11). Results from ourstudy support these observations, and indi-cate that diagenetic processing by microor-ganisms is rapid and critical for shaping thecomposition and refractory nature of marineDOM.
The amino sugar muramic acid isuniquely found in the repeating disaccha-ride backbone of the bacterial cell wall
polymer commonly known as peptidogly-can, and it is therefore an excellent biomar-ker for peptidoglycan in DOM (28). In theglucose experiment, muramic acid C con-centrations of 35 to 89 nM were measuredduring the first week of incubation, andbased on a typical muramic acid content inpeptidoglycan (29), we estimate that pepti-doglycan accounted for �1% of the C and�7.5% of the N in DOM. Muramic acidconcentrations were below detection after 1year of incubation (Table 2), indicating thatpeptidoglycan was absent in the refractoryDOM derived from bacteria. This findingwas unexpected given recent observationsin marine DOM of high D/L enantiomerratios in specific amino acids that are foundin the peptide component of peptidoglycan(5). Overall, these results suggest that bac-terial degradation sufficiently alters thestructure of peptidoglycan so that its poly-saccharide component is no longer recog-nizable at the molecular level.
Our results are inconsistent with severalmechanisms that have been proposed forthe formation of refractory organic matterin the ocean. It is unlikely that abioticcondensation reactions or humification pro-cesses (8) were important for producingrefractory DOM in our study, because theincubations were conducted in the dark atlow temperature, concentrations of reac-tants were low, and the compositionalchanges were rapid (hours to days). Thus, itappears that biological processes were crit-ical for the formation of refractory DOM.Specific biochemical components of cellscan be selectively preserved during diagen-esis (30), but these are relatively minorconstituents of cells that should only slowlyaccumulate. Amino acids, neutral sugars,and amino sugars typically compose �70%of bacterial biomass (29), but these bio-chemicals were relatively minor compo-nents of bacterially derived DOM. It ap-pears that the selective preservation of un-usual biochemical components of cellscould not, by itself, account for the rapidformation and accumulation of bacteriallyderived DOM.
Components of bacterial cells are re-leased into the surrounding water as DOMthrough a variety of biological processes,including direct release (11, 31), viral lysis(32), and grazing (33). Exoenzyme activityis critical for the microbial utilization ofthis DOM, and it appears that enzymaticactivity plays an important role in the for-mation of refractory DOM that is of smallsize (34 ). It is possible that nonspecific orpromiscuous activities of enzymes, that oc-cur with much lower efficiency than prima-ry activities (35), occasionally producefragments from macromolecules that es-cape recognition by bacterial enzymes andmolecular-level chemical analyses. Giventhis scenario, the rate of formation of re-fractory DOM is dependent on the rate ofmicrobial activity. This relatively simplemechanism could be responsible for muchof the sequestration of fixed C in the ocean.
References and Notes1. R. Benner, J. D. Pakulski, M. McCarthy, J. I. Hedges,P. G. Hatcher, Science 255, 1561 (1992).
2. M. D. McCarthy, T. Pratum, J. Hedges, R. Benner,Nature 390, 150 (1997).
3. L. L. Clark, E. D. Ingall, R. Benner, Nature 393, 426(1998).
4. E. Tanoue, S. Nishiyama, M. Kamo, A. Tsugita,Geochim. Cosmochim. Acta 59, 2643 (1995).
5. M. D. McCarthy, J. I. Hedges, R. Benner, Science 281,231 (1998).
6. P. M. Williams, E. R. M. Druffel, Oceanography 1, 14(1988).
7. J. I. Hedges et al., Org. Geochem. 31, 945 (2000).8. G. R. Harvey, D. A. Boran, L. A. Chesal, J. M. Tokar,Mar. Chem. 12, 119 (1983).
9. J. E. Brophy, D. J. Carlson, Deep-Sea Res. 36, 497(1989).
Table 2. Chemical composition of bacterially derived DOM in the glucose and glutamate experiments. Allare the mean of duplicate-bottle experiments, except for the data indicated by asterisks, which wereobtained from single bottles. The mean deviation of replicates was 0.9 �M for DOC, 0.2 �M for DON, 2for C/N ratio, and 1 to 2% of DOC, DON, THAS, and THAA compositions. The “uncharacterized” fractionin the glucose experiment is estimated as the difference between the total DOC and the DOC accountedfor as THNS�THAS�THAA, and between the total DON and the DON accounted for as THAA�THAS,except for the data after 1 year, in which THNS was not included (data in parenthesis). The “uncharac-terized” fraction in the glutamate experiment is based only on THAA, because THNS and THAS were notmeasured (indicated by “nm”).
Chemicalcomposition
Initial substrate
Glucose Glutamate
Incubation time(days)
Incubation time(days)
2 4 7 365 2 4 9 560
Concentration of the bulk DOM (�M)DOC 30 18 16 11 18 13 14 9.0DON 1.0 0.7 0.6 1.2 3.1 2.4 1.5 0.7
DOC composition (% as)THNS 2.5 4.9 5.9 nm nm nm nm nmTHAS 0.7 1.4 1.5 3.8 nm nm nm nmTHAA 2.5 4.3 3.7 2.5 13 18* 12 3.1Uncharacterized 94 89 89 (94) 87 82* 88 97
DON composition (% as)THAS 3.4 5.5 6.6 5.6 nm nm nm nmTHAA 22 29 27 6.4 15 31* 33 11Uncharacterized 75 66 67 88 85 69* 67 89
C:N molar ratioBulk 32 26 28 8.9 5.1 5.7 9.3 13Total characterized 7.5 7.9 9.2 (4.6) 3.5 3.1 3.3 3.6Uncharacterized 41 37 37 (10) 5.4 6.3* 12 14
THAS composition (mole %)GalN 20 26 31 33 nm nm nm nmGlcN 55 50 56 67 nm nm nm nmMA 26 24 12 0 nm nm nm nm
THAA composition (mole %)Acidic 26 27 21 30 26 12 17 28Basic 12 10 11 11 8 6 7 8Neutral 23 27 31 41 24 56 36 46Hydrophobic 38 36 37 18 41 27 40 18
R E P O R T S
www.sciencemag.org SCIENCE VOL 292 4 MAY 2001 919
1. T. I. Eglinton, L. I. Aluwihare, J. E. Bauer, E. R. M. Druffel, A. P. McNichol, Anal. Chem. 68, 904 (1996).
2. X.-C. Wang, E. R. M. Druffel, C. Lee W. Giger et al., Nucl. Instr. Meth. Phys. Res. B5, 394 (1984); X.-C. Wang, E. R. M. Druffel, C. Lee, Geophys. Res. Lett. 23, 3583 (1996). ·
3. E. Izdar and J. W. Murray, Eds., Black Sea Oceanography (Kluwer, Dordrecht, Netherlands, 1991).
4. F. Sirocko and M. Sarnthein, in Paleoclimatology and Paleometeorology: Modern and Past Patterns of Global Atmospheric Transport, M. Leinen and M. Sarnthein, Eds. (Kluwer, Dordrecht, Netherlands, 1989), pp. 401–433.
5. The sediment samples, stored frozen (–20°C) from the time of collection until analysis, were thawed, and a portion was dried and acidified (2N HCl) for determination of bulk elemental and isotopic composition [δ13CTOC by isotope ratio mass spectrometry (irMS), and 14CTOC by accelerator mass spectrometry (AMS)]; ∼30 g (equivalent dry weight, Black Sea sample) or ∼200 g (Arabian Sea sample) was extracted with a Soxhlet apparatus with CH3OH and CH2Cl2. An aliphatic hydrocarbon fraction was isolated from the resulting total lipid extract (TLE) by silica gel chromatography with n-C6H14 as the eluent. After removal of elemental sulfur (with an activated Cu column), saturated hydrocarbons (n-C6H14 eluent) were separated from unsaturated counterparts (C2H5OC2H5 eluent) by AgNO3-SiO2 column chromatography. Compound identifications were made by gas chromatography–mass spectrometry (GC-MS), and δ13C compositions were determined by isotope ratio monitoring GC-MS (irm-GC-MS). Individual compounds were isolated from the purified hydrocarbon fractions by preparative capillary gas chromatography (PCGC). Compounds were trapped during PCGC in cryogenically cooled glass u-tubes, and on completion of the sequence (typically about 100 repeated PCGC runs of each fraction yielded sufficient quantities of compound for AMS 14C analysis), the products were recovered by dissolution in CH2Cl2 and transferred to quartz combustion tubes. After some of the sample was removed (for determination of yield and purity by GC), solvent was eliminated from the combustion tubes under a stream of nitrogen,
contribution. For infinite 14C age petrogenic contributions of 30, 40, and 50% (26) to the C23, C27, and C29 n-alkane, respectively, ap-plication of a similar mass balance approach to that described above for the Black Sea n-alkanes yields a 14C age of between 4000 and 5000 years B.P. for the land plant component, quite consistent with the timing for the onset of deterioration of climatic conditions in East Africa (24).
In both sediments, the maximal varia-tion in radiocarbon ages observed between compounds exceeds the estimated <300�year age span (based on published sedimentation rates) for either of the intervals sampled. Our results reveal that compounds of the same class and belonging to the same ho-mologous series (Black Sea n-alkanes) can exhibit distinctly different radiocarbon ages. Compounds having similar δ13C values may display significantly different 14C ages (Black Sea n-alkanes) or, conversely, compounds of similar 14C age may have various δ13C values
CuO was added, and tubes were evacuated and flame-sealed. The samples were combusted (900°C, 5 hours), and the resulting CO2 was purified, measured, and subsequently converted to graphite by reduction over Co catalyst in the presence of H2 for radiocarbon analysis by AMS. AMS was performed at either Woods Hole Oceanographic Institution or Lawrence Livermore National Laboratory.
6. J. K. Volkman, G. Eglinton, E. D. S. Corner, T. E. V. Forsberg, Phytochemistry 19, 2619 (1980); H. A. Benli, in Particle Flux in the Ocean, E. T. Degens, E. Izdar, S. Honjo, Eds. (SCOPE/UNEP Sonderbrand, West Germany, Heft 62, 1987), pp. 77–87; B. J. Hay, M. A. Arthur, W. E. Dean, E. D. Neff, S. Honjo, Deep Sea Res. 38, 1211 (1991).
7. K. H. Freeman, S. G. Wakeham, J. M. Hayes, Org. Geochem. 21, 629 (1994).
8. Conventional 14C ages (in years B.P.) are calculated with a Libby half-life of 5568 years and take into account13C fractionation (corrected to a δ13C value of −25 per mil) but not differences in specific 14C activity of reservoirs or calibration to calendar years. In oceanography, Δ14C is the per mil deviation of the 14C/12C ratio (13C normalized and corrected to A.D. 1950) for the sample relative to the14C/12C ratio of the absolute international standard (95% of the A.D. 1950 activity of NBS HOxI, normalized to δ13C = –19 per mil).
9. G. A. Jones, A. R. Gagnon, Deep Sea Res. 41, 531 (1994). 10. M. Stuiver and H. A. Polach, Radiocarbon 19, 355
(1977); M. Stuiver, G. W. Pearson, T. Braziunas, ibid. 28, 980 (1986).
11. S. E. Calvert, et al., Nature 350, 692 (1991); J. Crusius, R. F. Anderson, Paleoceanography 7, 215 (1992).
12 G. Eglinton, R. J. Hamilton, Science 156, 1322 (1967); B. N. Smith, S. Epstein, Plant Physiol. 47, 380 (1971); G. Rieley, et al., Nature 352, 425 (1991); J. W. Collister, G. Rieley, B. Stern, G. Eglinton, B. Fry, Org. Geochem. 21, 619 (1994); S. G. Wakeham, Mar. Chem. 53, 187 (1996); B. R. T. Simoneit, Deep Sea Res. 24, 813 (1977).
13. S. G. Wakeham, J. A. Beier, C. H. Clifford, in (3), pp. 319–341.
14. S. J. Rowland, J. R. Maxwell, Geochim. Cosmochim. Acta 48, 617 (1984).
15. J. E. Bauer, R. B. Spies, J. S. Vogel, D. E. Nelson, J. R.
Southon, Nature 348, 230 (1990). 16. R. B. Gagosian, S. O. Smith, C. Lee, J. W. Farrington, N. M.
Frew, in Advances in Organic Geochemistry, 1979, A. G. Douglas and J. R. Maxwell, Eds. (Pergamon, Oxford, UK, 1980), pp. 407–419.
17. P. D. Nichols, J. K. Volkman, A. C. Palmisano, G. A. Smith, D. C. White, J. Phycol. 24, 90 (1988); R. E. Summons, R. A. Barrow, R. J. Capon, J. M. Hope, C. Stranger, Aust. J. Chem. 46, 907 (1993).
18. T. F. Pederson, G. B. Shimmield, N. B. Price, Geochim. Cosmochim. Acta 56, 545 (1992).
19. B. Haake et al., Deep Sea Res. 40, 1323 (1993); F. Pollehne, B. Klein, B. Zeitzschel, ibid., p. 737.
20. J. K. Volkman, S. M. Barrett, G. A. Dunstan, Org. Geochem. 21, 407 (1994).
21 G. Ourisson, M. Rohmer, K. Poralla, Annu. Rev. Microbiol. 41, 301 (1987).
22. The reason for the old hopene 14C age is unclear, but it may be related to a small proportion of unresolved material that was trapped with this compound during PCGC isolation.
23. J. E. Bauer, C. E. Reimers, E. R. M. Druffel, P. M. Williams, Nature 373, 686 (1995).
24. H. A. McClure, ibid 263, 755 (1976). 25. The GC profiles for the higher plant waxes and
petrogenic hydrocarbons as well as the OEP (Fig. 1 B) were used to estimate contributions from each source to individual n-alkanes.
26. R. C. Barrick, J. I. Hedges, M. L. Peterson, Geochim. Cosmochim. Acta 44, 1349 (1980).
27. K. O. Emery and E. E. Bray, Bull. Am. Assoc. Petrol. Geol. 46, 1832 (1962); G. J. Benoit, K. K. Turekian, L. K. Benninger, Estuarine Coastal Mar. Sci. 9, 171 (1979); S. Emerson et al., Nature 329, 51 (1987).
28. We thank M. Kashgarian, J. Southon, I. Proctor, and L. Osborne for assistance with AMS analyses, J. Primack and J. Hayes for irm-GC-MS analyses, and D. Repeta and J. Sachs for the sediment samples. This work was supported in part by NSF grants (OCE-94155680; OCE-801015) and a Woods Hole Oceanographic Institution (WHOI) Independent Study Award. This is WHOI contribution n. 9476.
(Arabian Sea HBI alkenes). These molecular isotopic measurements thus illustrate how dif-ferent sources can affect sedimentary 14CTOC composition.
Differences in 14C age can now be explained in the context of isotopic characteristics of specific source inputs and hence can be used to interpret the biogeochemical processes that govern their provenance in sediments. Two examples of long-standing issues in biogeochemistry that benefit from molecular 14C measurements are the origin of non-zero 14CTOC ages commonly observed for marine surface sediments (27), and the development of refined chronostratigraphies free of interferences due to detrital OC inputs and selective degradation of different organic components. The latter also holds promise for other disciplines where accurate 14C measurements are important (such as archeology) but may be compromised by the presence of extraneous carbon-containing material.
23 April 1997; accepted 13 June 1997
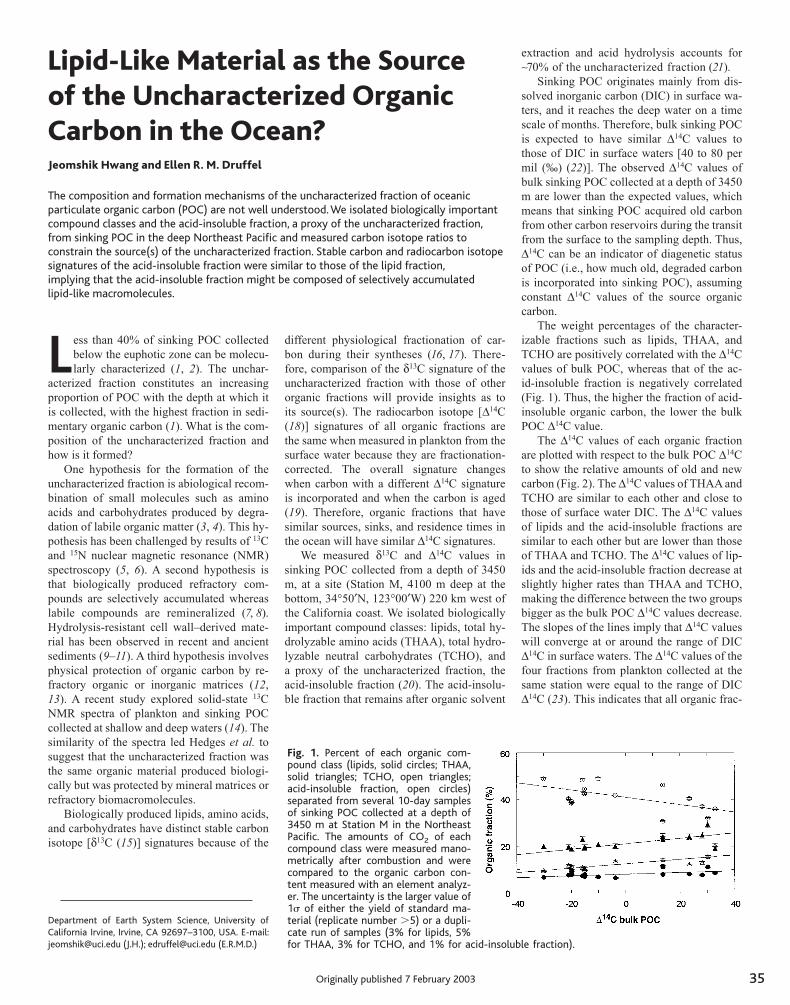
35
Less than 40% of sinking POC collected below the euphotic zone can be molecu-larly characterized (1, 2). The unchar-
acterized fraction constitutes an increasing proportion of POC with the depth at which it is collected, with the highest fraction in sedi-mentary organic carbon (1). What is the com-position of the uncharacterized fraction and how is it formed?
One hypothesis for the formation of the uncharacterized fraction is abiological recom-bination of small molecules such as amino acids and carbohydrates produced by degra-dation of labile organic matter (3, 4). This hy-pothesis has been challenged by results of 13C and 15N nuclear magnetic resonance (NMR) spectroscopy (5, 6). A second hypothesis is that biologically produced refractory com-pounds are selectively accumulated whereas labile compounds are remineralized (7, 8). Hydrolysis-resistant cell wall–derived mate-rial has been observed in recent and ancient sediments (9–11). A third hypothesis involves physical protection of organic carbon by re-fractory organic or inorganic matrices (12, 13). A recent study explored solid-state 13C NMR spectra of plankton and sinking POC collected at shallow and deep waters (14). The similarity of the spectra led Hedges et al. to suggest that the uncharacterized fraction was the same organic material produced biologi-cally but was protected by mineral matrices or refractory biomacromolecules.
Biologically produced lipids, amino acids, and carbohydrates have distinct stable carbon isotope [δ13C (15)] signatures because of the
Department of Earth System Science, University of California Irvine, Irvine, CA 92697–3100, USA. E-mail: [email protected] (J.H.); [email protected] (E.R.M.D.)
Lipid-Like Material as the Source of the Uncharacterized Organic Carbon in the Ocean?Jeomshik Hwang and Ellen R. M. Druffel
The composition and formation mechanisms of the uncharacterized fraction of oceanic particulate organic carbon (POC) are not well understood. We isolated biologically important compound classes and the acid-insoluble fraction, a proxy of the uncharacterized fraction, from sinking POC in the deep Northeast Pacific and measured carbon isotope ratios to constrain the source(s) of the uncharacterized fraction. Stable carbon and radiocarbon isotope signatures of the acid-insoluble fraction were similar to those of the lipid fraction, implying that the acid-insoluble fraction might be composed of selectively accumulated lipid-like macromolecules.
different physiological fractionation of car-bon during their syntheses (16, 17). There-fore, comparison of the δ13C signature of the uncharacterized fraction with those of other organic fractions will provide insights as to its source(s). The radiocarbon isotope [Δ14C (18)] signatures of all organic fractions are the same when measured in plankton from the surface water because they are fractionation-corrected. The overall signature changes when carbon with a different Δ14C signature is incorporated and when the carbon is aged (19). Therefore, organic fractions that have similar sources, sinks, and residence times in the ocean will have similar Δ14C signatures.
We measured δ13C and Δ14C values in sinking POC collected from a depth of 3450 m, at a site (Station M, 4100 m deep at the bottom, 34°50′N, 123°00′W) 220 km west of the California coast. We isolated biologically important compound classes: lipids, total hy-drolyzable amino acids (THAA), total hydro-lyzable neutral carbohydrates (TCHO), and a proxy of the uncharacterized fraction, the acid-insoluble fraction (20). The acid-insolu-ble fraction that remains after organic solvent
extraction and acid hydrolysis accounts for ∼70% of the uncharacterized fraction (21).
Sinking POC originates mainly from dis-solved inorganic carbon (DIC) in surface wa-ters, and it reaches the deep water on a time scale of months. Therefore, bulk sinking POC is expected to have similar Δ14C values to those of DIC in surface waters [40 to 80 per mil (‰) (22)]. The observed Δ14C values of bulk sinking POC collected at a depth of 3450 m are lower than the expected values, which means that sinking POC acquired old carbon from other carbon reservoirs during the transit from the surface to the sampling depth. Thus, Δ14C can be an indicator of diagenetic status of POC (i.e., how much old, degraded carbon is incorporated into sinking POC), assuming constant Δ14C values of the source organic carbon.
The weight percentages of the character-izable fractions such as lipids, THAA, and TCHO are positively correlated with the Δ14C values of bulk POC, whereas that of the ac-id-insoluble fraction is negatively correlated (Fig. 1). Thus, the higher the fraction of acid-insoluble organic carbon, the lower the bulk POC Δ14C value.
The Δ14C values of each organic fraction are plotted with respect to the bulk POC Δ14C to show the relative amounts of old and new carbon (Fig. 2). The Δ14C values of THAA and TCHO are similar to each other and close to those of surface water DIC. The Δ14C values of lipids and the acid-insoluble fractions are similar to each other but are lower than those of THAA and TCHO. The Δ14C values of lip-ids and the acid-insoluble fraction decrease at slightly higher rates than THAA and TCHO, making the difference between the two groups bigger as the bulk POC Δ14C values decrease. The slopes of the lines imply that Δ14C values will converge at or around the range of DIC Δ14C in surface waters. The Δ14C values of the four fractions from plankton collected at the same station were equal to the range of DIC Δ14C (23). This indicates that all organic frac-
is expected to have similar �14C values tothose of DIC in surface waters [40 to 80 permil (‰) (22)]. The observed �14C values ofbulk sinking POC collected at a depth of3450 m are lower than the expected values,which means that sinking POC acquired oldcarbon from other carbon reservoirs duringthe transit from the surface to the samplingdepth. Thus, �14C can be an indicator ofdiagenetic status of POC (i.e., how much old,degraded carbon is incorporated into sinkingPOC), assuming constant �14C values of thesource organic carbon.
The weight percentages of the character-
izable fractions such as lipids, THAA, andTCHO are positively correlated with the�14C values of bulk POC, whereas that of theacid-insoluble fraction is negatively correlat-ed (Fig. 1). Thus, the higher the fraction ofacid-insoluble organic carbon, the lower thebulk POC �14C value.
The �14C values of each organic fractionare plotted with respect to the bulk POC �14Cto show the relative amounts of old and newcarbon (Fig. 2). The �14C values of THAAand TCHO are similar to each other and closeto those of surface water DIC. The �14Cvalues of lipids and the acid-insoluble frac-
tions are similar to each other but are lowerthan those of THAA and TCHO. The �14Cvalues of lipids and the acid-insoluble frac-tion decrease at slightly higher rates thanTHAA and TCHO, making the differencebetween the two groups bigger as the bulkPOC �14C values decrease. The slopes of thelines imply that �14C values will converge ator around the range of DIC �14C in surfacewaters. The �14C values of the four fractionsfrom plankton collected at the same stationwere equal to the range of DIC �14C (23).This indicates that all organic fractions ofsinking POC originated from modern sourc-e(s) of carbon, but lipids and the acid-insol-uble fraction acquired more old carbon thandid THAA and TCHO.
The �13C values of lipids are 3 to 4‰lower than those of THAA and TCHO (Fig.3), as expected from physiological fraction-ation (16, 17 ), but approximately equal tothose of the acid-insoluble fraction. The dif-ferences in �13C between the organic frac-tions for each sample are constant eventhough �13C values in bulk POC samplesvary by 2.5‰.
The constant differences in �13C betweenthe acid-insoluble fraction and the other or-ganic fractions provide constraints on itssource(s). One possible scenario is that theacid-insoluble fraction is synthesized by thereaction between THAA and TCHO that aretightly bound with particles. However, thedifferences in �13C between the acid-insolu-ble fraction and THAA and TCHO (�4‰)argue against the degradation-recombinationhypothesis of amino acids and carbohydratesfor the formation of the acid-insoluble frac-tion. Two 13C-enriched fractions cannot com-bine to form a 13C-depleted fraction unlesskinetic fractionation occurs during the chem-ical reactions. If kinetic fractionation occurs,one would expect 13C to be enriched in re-maining THAA and TCHO (24). However,the �13C values of the compound fractionswere reported to remain constant for organiccarbon of detrital aggregates, sediment floc,and sediment (0 to 20 cm) at the same loca-tion, and Wang et al. concluded that �13Csignatures of each organic fraction were notaffected by decomposition processes of or-ganic matter (23).
The differences in �13C between the acid-insoluble fraction and THAA and TCHO ar-gue against nonselective mineral protectionas well. If the acid-insoluble fraction is sim-ply the same material produced biologicallyas lipids, THAA, and TCHO, with the onlydifference that they are protected by mineralmatrices, its isotopic signature should be sim-ilar to those of THAA and TCHO. Further-more, treatment of the acid-insoluble fractionof POC with an HCl-HF solution to dissolvethe mineral phases did not increase theextractable fraction of THAA and TCHO
Fig. 1. Percent of each organic com-pound class (lipids, solid circles; THAA,solid triangles; TCHO, open triangles;acid-insoluble fraction, open circles)separated from several 10-day samplesof sinking POC collected at a depth of3450 m at Station M in the NortheastPacific. The amounts of CO2 of eachcompound class were measured mano-metrically after combustion and werecompared to the organic carbon con-tent measured with an element analyz-er. The uncertainty is the larger value of1� of either the yield of standard ma-terial (replicate number �5) or a dupli-cate run of samples (3% for lipids, 5%for THAA, 3% for TCHO, and 1% for acid-insoluble fraction).
Fig. 2. The �14C values of eachorganic compound class (sym-bols are as defined in Fig. 1). Theblack arrow by the right y axisindicates the range of DIC �14Cvalues in surface waters at Sta-tion M. The �14C values areblank-corrected. We measured�14C of an amino acid standardsolution (mixture of 17 aminoacids), D-glucose powder, andcod liver oil by the same meth-ods as the samples. We com-pared these values with those ofunprocessed standards to calcu-late the �14C values of theblanks. The amounts of the blankwere measured manometrically by combining five or six blanks together. Blanks were higher forTHAA and TCHO, because there were more steps involved in their separation. The acid-insolublefraction was not blank-corrected because the blank was smaller than 0.01 mg (�0.7% of thesample). The uncertainty is the larger value of 1� of either standard material (replicate number�5)or duplicates of samples.
Fig. 3. The �13C values of each com-pound class (symbols are as defined inFig. 1). The �13C values are blank-cor-rected by the same method as �14C.The uncertainty is the larger value of 1�of either standard material or dupli-cates of samples.
R E P O R T S
7 FEBRUARY 2003 VOL 299 SCIENCE www.sciencemag.org882
Originally published 7 February 2003
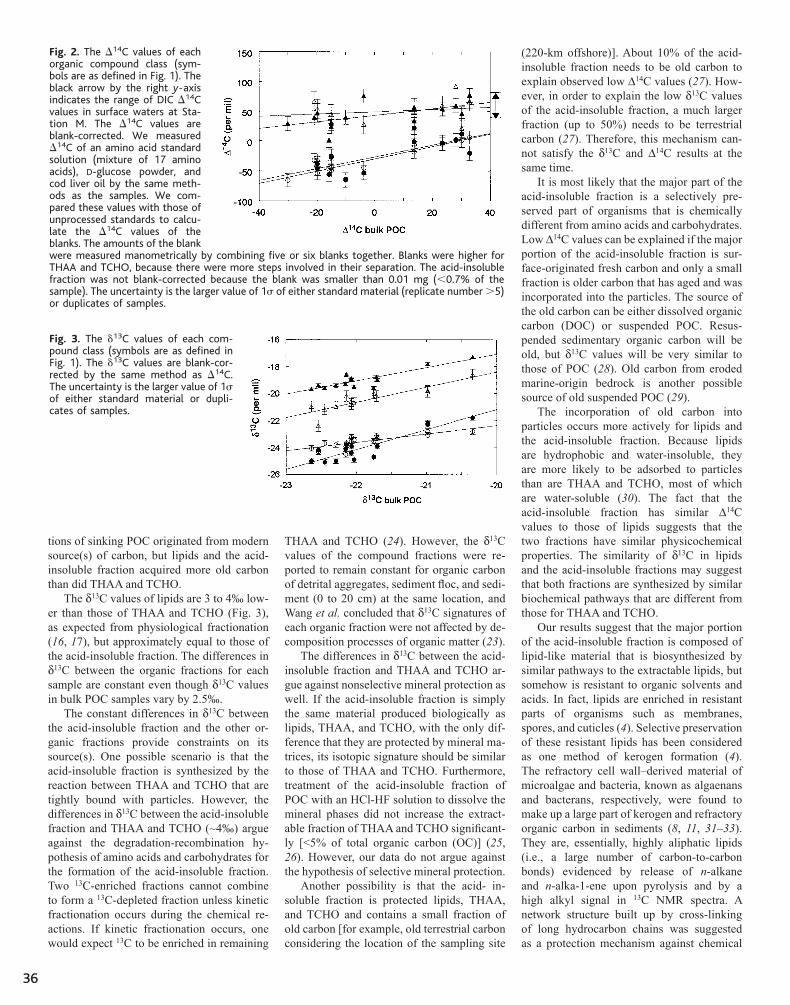
36
tions of sinking POC originated from modern source(s) of carbon, but lipids and the acid-insoluble fraction acquired more old carbon than did THAA and TCHO.
The δ13C values of lipids are 3 to 4‰ low-er than those of THAA and TCHO (Fig. 3), as expected from physiological fractionation (16, 17), but approximately equal to those of the acid-insoluble fraction. The differences in δ13C between the organic fractions for each sample are constant even though δ13C values in bulk POC samples vary by 2.5‰.
The constant differences in δ13C between the acid-insoluble fraction and the other or-ganic fractions provide constraints on its source(s). One possible scenario is that the acid-insoluble fraction is synthesized by the reaction between THAA and TCHO that are tightly bound with particles. However, the differences in δ13C between the acid-insoluble fraction and THAA and TCHO (∼4‰) argue against the degradation-recombination hy-pothesis of amino acids and carbohydrates for the formation of the acid-insoluble fraction. Two 13C-enriched fractions cannot combine to form a 13C-depleted fraction unless kinetic fractionation occurs during the chemical re-actions. If kinetic fractionation occurs, one would expect 13C to be enriched in remaining
THAA and TCHO (24). However, the δ13C values of the compound fractions were re-ported to remain constant for organic carbon of detrital aggregates, sediment floc, and sedi-ment (0 to 20 cm) at the same location, and Wang et al. concluded that δ13C signatures of each organic fraction were not affected by de-composition processes of organic matter (23).
The differences in δ13C between the acid-insoluble fraction and THAA and TCHO ar-gue against nonselective mineral protection as well. If the acid-insoluble fraction is simply the same material produced biologically as lipids, THAA, and TCHO, with the only dif-ference that they are protected by mineral ma-trices, its isotopic signature should be similar to those of THAA and TCHO. Furthermore, treatment of the acid-insoluble fraction of POC with an HCl�HF solution to dissolve the mineral phases did not increase the extract-able fraction of THAA and TCHO significant-ly [<5% of total organic carbon (OC)] (25, 26). However, our data do not argue against the hypothesis of selective mineral protection.
Another possibility is that the acid- in-soluble fraction is protected lipids, THAA, and TCHO and contains a small fraction of old carbon [for example, old terrestrial carbon considering the location of the sampling site
(220-km offshore)]. About 10% of the acid-insoluble fraction needs to be old carbon to explain observed low Δ14C values (27). How-ever, in order to explain the low δ13C values of the acid-insoluble fraction, a much larger fraction (up to 50%) needs to be terrestrial carbon (27). Therefore, this mechanism can-not satisfy the δ13C and Δ14C results at the same time.
It is most likely that the major part of the acid-insoluble fraction is a selectively pre-served part of organisms that is chemically different from amino acids and carbohydrates. Low Δ14C values can be explained if the major portion of the acid-insoluble fraction is sur-face-originated fresh carbon and only a small fraction is older carbon that has aged and was incorporated into the particles. The source of the old carbon can be either dissolved organic carbon (DOC) or suspended POC. Resus-pended sedimentary organic carbon will be old, but δ13C values will be very similar to those of POC (28). Old carbon from eroded marine-origin bedrock is another possible source of old suspended POC (29).
The incorporation of old carbon into particles occurs more actively for lipids and the acid-insoluble fraction. Because lipids are hydrophobic and water-insoluble, they are more likely to be adsorbed to particles than are THAA and TCHO, most of which are water-soluble (30). The fact that the acid-insoluble fraction has similar Δ14C values to those of lipids suggests that the two fractions have similar physicochemical properties. The similarity of δ13C in lipids and the acid-insoluble fractions may suggest that both fractions are synthesized by similar biochemical pathways that are different from those for THAA and TCHO.
Our results suggest that the major portion of the acid-insoluble fraction is composed of lipid-like material that is biosynthesized by similar pathways to the extractable lipids, but somehow is resistant to organic solvents and acids. In fact, lipids are enriched in resistant parts of organisms such as membranes, spores, and cuticles (4). Selective preservation of these resistant lipids has been considered as one method of kerogen formation (4). The refractory cell wall–derived material of microalgae and bacteria, known as algaenans and bacterans, respectively, were found to make up a large part of kerogen and refractory organic carbon in sediments (8, 11, 31–33). They are, essentially, highly aliphatic lipids (i.e., a large number of carbon-to-carbon bonds) evidenced by release of n-alkane and n-alka-1-ene upon pyrolysis and by a high alkyl signal in 13C NMR spectra. A network structure built up by cross-linking of long hydrocarbon chains was suggested as a protection mechanism against chemical
is expected to have similar �14C values tothose of DIC in surface waters [40 to 80 permil (‰) (22)]. The observed �14C values ofbulk sinking POC collected at a depth of3450 m are lower than the expected values,which means that sinking POC acquired oldcarbon from other carbon reservoirs duringthe transit from the surface to the samplingdepth. Thus, �14C can be an indicator ofdiagenetic status of POC (i.e., how much old,degraded carbon is incorporated into sinkingPOC), assuming constant �14C values of thesource organic carbon.
The weight percentages of the character-
izable fractions such as lipids, THAA, andTCHO are positively correlated with the�14C values of bulk POC, whereas that of theacid-insoluble fraction is negatively correlat-ed (Fig. 1). Thus, the higher the fraction ofacid-insoluble organic carbon, the lower thebulk POC �14C value.
The �14C values of each organic fractionare plotted with respect to the bulk POC �14Cto show the relative amounts of old and newcarbon (Fig. 2). The �14C values of THAAand TCHO are similar to each other and closeto those of surface water DIC. The �14Cvalues of lipids and the acid-insoluble frac-
tions are similar to each other but are lowerthan those of THAA and TCHO. The �14Cvalues of lipids and the acid-insoluble frac-tion decrease at slightly higher rates thanTHAA and TCHO, making the differencebetween the two groups bigger as the bulkPOC �14C values decrease. The slopes of thelines imply that �14C values will converge ator around the range of DIC �14C in surfacewaters. The �14C values of the four fractionsfrom plankton collected at the same stationwere equal to the range of DIC �14C (23).This indicates that all organic fractions ofsinking POC originated from modern sourc-e(s) of carbon, but lipids and the acid-insol-uble fraction acquired more old carbon thandid THAA and TCHO.
The �13C values of lipids are 3 to 4‰lower than those of THAA and TCHO (Fig.3), as expected from physiological fraction-ation (16, 17 ), but approximately equal tothose of the acid-insoluble fraction. The dif-ferences in �13C between the organic frac-tions for each sample are constant eventhough �13C values in bulk POC samplesvary by 2.5‰.
The constant differences in �13C betweenthe acid-insoluble fraction and the other or-ganic fractions provide constraints on itssource(s). One possible scenario is that theacid-insoluble fraction is synthesized by thereaction between THAA and TCHO that aretightly bound with particles. However, thedifferences in �13C between the acid-insolu-ble fraction and THAA and TCHO (�4‰)argue against the degradation-recombinationhypothesis of amino acids and carbohydratesfor the formation of the acid-insoluble frac-tion. Two 13C-enriched fractions cannot com-bine to form a 13C-depleted fraction unlesskinetic fractionation occurs during the chem-ical reactions. If kinetic fractionation occurs,one would expect 13C to be enriched in re-maining THAA and TCHO (24). However,the �13C values of the compound fractionswere reported to remain constant for organiccarbon of detrital aggregates, sediment floc,and sediment (0 to 20 cm) at the same loca-tion, and Wang et al. concluded that �13Csignatures of each organic fraction were notaffected by decomposition processes of or-ganic matter (23).
The differences in �13C between the acid-insoluble fraction and THAA and TCHO ar-gue against nonselective mineral protectionas well. If the acid-insoluble fraction is sim-ply the same material produced biologicallyas lipids, THAA, and TCHO, with the onlydifference that they are protected by mineralmatrices, its isotopic signature should be sim-ilar to those of THAA and TCHO. Further-more, treatment of the acid-insoluble fractionof POC with an HCl-HF solution to dissolvethe mineral phases did not increase theextractable fraction of THAA and TCHO
Fig. 1. Percent of each organic com-pound class (lipids, solid circles; THAA,solid triangles; TCHO, open triangles;acid-insoluble fraction, open circles)separated from several 10-day samplesof sinking POC collected at a depth of3450 m at Station M in the NortheastPacific. The amounts of CO2 of eachcompound class were measured mano-metrically after combustion and werecompared to the organic carbon con-tent measured with an element analyz-er. The uncertainty is the larger value of1� of either the yield of standard ma-terial (replicate number �5) or a dupli-cate run of samples (3% for lipids, 5%for THAA, 3% for TCHO, and 1% for acid-insoluble fraction).
Fig. 2. The �14C values of eachorganic compound class (sym-bols are as defined in Fig. 1). Theblack arrow by the right y axisindicates the range of DIC �14Cvalues in surface waters at Sta-tion M. The �14C values areblank-corrected. We measured�14C of an amino acid standardsolution (mixture of 17 aminoacids), D-glucose powder, andcod liver oil by the same meth-ods as the samples. We com-pared these values with those ofunprocessed standards to calcu-late the �14C values of theblanks. The amounts of the blankwere measured manometrically by combining five or six blanks together. Blanks were higher forTHAA and TCHO, because there were more steps involved in their separation. The acid-insolublefraction was not blank-corrected because the blank was smaller than 0.01 mg (�0.7% of thesample). The uncertainty is the larger value of 1� of either standard material (replicate number�5)or duplicates of samples.
Fig. 3. The �13C values of each com-pound class (symbols are as defined inFig. 1). The �13C values are blank-cor-rected by the same method as �14C.The uncertainty is the larger value of 1�of either standard material or dupli-cates of samples.
R E P O R T S
7 FEBRUARY 2003 VOL 299 SCIENCE www.sciencemag.org882
-

37
attack (9). Considering that the mechanisms of lipid synthesis are similar in all organisms (17), these refractory macromolecules might be expected to have similar δ13C signatures as those for the extractable lipids. The similarity of the nonhydrolyzable fraction and nonprotein alkyl carbon in chemical composition and abundance was observed in sediment from the continental margin of northwestern Mexico, and it was suggested that those components were compositionally similar to cell wall–derived algaenans (33). Even though these refractory lipid-like macromolecules have been studied only in
sediments, selective accumulation of the lipids is likely to occur in the water column as the POC sinks. Selective accumulation of the refractory lipid-like material in the water column was evidenced by the observation that alkanes accounted for increasing fractions of the pyrolyzates of sinking POC as depth increased in the Equatorial Pacific (34) and the Mediterranean Sea (35).
Even though results of the 13C NMR spec-troscopy and direct temperature-resolved mass spectrometry on the samples from the Equatorial Pacific do not support the predom-inance of lipid�like material in sinking POC
(14, 34), the composition of sinking POC might vary depending on the local environ-ment (36). The percentage of lipid in sinking POC in the Arabian Sea was twice as high as that in the Equatorial Pacific (14). Also, our sampling site can be influenced by laterally transported old carbon from the continental shelf or slope and from rivers in the California coast (37). Further study will be necessary to confirm if our observation is universal in the oceans. These results should provide impor-tant information to understand how organic carbon is preserved and removed from the carbon cycle in the ocean.
significantly [�5% of total organic carbon(OC)] (25, 26 ). However, our data do notargue against the hypothesis of selectivemineral protection.
Another possibility is that the acid-insoluble fraction is protected lipids, THAA,and TCHO and contains a small fraction of oldcarbon [for example, old terrestrial carbon con-sidering the location of the sampling site (220-km offshore)]. About 10% of the acid-insolublefraction needs to be old carbon to explain ob-served low �14C values (27). However, in or-der to explain the low �13C values of the acid-insoluble fraction, a much larger fraction (up to50%) needs to be terrestrial carbon (27). There-fore, this mechanism cannot satisfy the �13Cand �14C results at the same time.
It is most likely that the major part of theacid-insoluble fraction is a selectively pre-served part of organisms that is chemicallydifferent from amino acids and carbohy-drates. Low �14C values can be explained ifthe major portion of the acid-insoluble frac-tion is surface-originated fresh carbon andonly a small fraction is older carbon that hasaged and was incorporated into the particles.The source of the old carbon can be eitherdissolved organic carbon (DOC) or suspend-ed POC. Resuspended sedimentary organiccarbon will be old, but �13C values will bevery similar to those of POC (28). Old carbonfrom eroded marine-origin bedrock is anotherpossible source of old suspended POC (29).
The incorporation of old carbon into par-ticles occurs more actively for lipids and theacid-insoluble fraction. Because lipids arehydrophobic and water-insoluble, they aremore likely to be adsorbed to particles thanare THAA and TCHO, most of which arewater-soluble (30). The fact that the acid-insoluble fraction has similar �14C values tothose of lipids suggests that the two fractionshave similar physicochemical properties. Thesimilarity of �13C in lipids and the acid-insoluble fractions may suggest that bothfractions are synthesized by similar biochem-ical pathways that are different from those forTHAA and TCHO.
Our results suggest that the major portionof the acid-insoluble fraction is composed oflipid-like material that is biosynthesized bysimilar pathways to the extractable lipids, butsomehow is resistant to organic solvents andacids. In fact, lipids are enriched in resistantparts of organisms such as membranes,spores, and cuticles (4 ). Selective preserva-tion of these resistant lipids has been consid-ered as one method of kerogen formation (4).The refractory cell wall–derived material ofmicroalgae and bacteria, known as algaenansand bacterans, respectively, were found tomake up a large part of kerogen and refrac-tory organic carbon in sediments (8, 11, 31–33). They are, essentially, highly aliphaticlipids (i.e., a large number of carbon-to-car-
bon bonds) evidenced by release of n-alkaneand n-alka-1-ene upon pyrolysis and by ahigh alkyl signal in 13C NMR spectra. Anetwork structure built up by cross-linking oflong hydrocarbon chains was suggested as aprotection mechanism against chemical at-tack (9). Considering that the mechanisms oflipid synthesis are similar in all organisms(17 ), these refractory macromolecules mightbe expected to have similar �13C signaturesas those for the extractable lipids. The simi-larity of the nonhydrolyzable fraction andnonprotein alkyl carbon in chemical compo-sition and abundance was observed in sedi-ment from the continental margin of north-western Mexico, and it was suggested thatthose components were compositionally sim-ilar to cell wall–derived algaenans (33). Eventhough these refractory lipid-like macromol-ecules have been studied only in sediments,selective accumulation of the lipids is likelyto occur in the water column as the POCsinks. Selective accumulation of the refracto-ry lipid-like material in the water column wasevidenced by the observation that alkanesaccounted for increasing fractions of the py-rolyzates of sinking POC as depth increasedin the Equatorial Pacific (34 ) and the Medi-terranean Sea (35).
Even though results of the 13C NMR spec-troscopy and direct temperature-resolvedmass spectrometry on the samples from theEquatorial Pacific do not support the predom-inance of lipid-like material in sinking POC(14, 34 ), the composition of sinking POCmight vary depending on the local environ-ment (36 ). The percentage of lipid in sinkingPOC in the Arabian Sea was twice as high asthat in the Equatorial Pacific (14). Also, oursampling site can be influenced by laterallytransported old carbon from the continentalshelf or slope and from rivers in the Califor-nia coast (37 ). Further study will be neces-sary to confirm if our observation is universalin the oceans. These results should provideimportant information to understand how or-ganic carbon is preserved and removed fromthe carbon cycle in the ocean.
References and Notes1. S. G. Wakeham, C. Lee, J. I. Hedges, P. J. Hernes, M. L.Peterson, Geochim. Cosmochim. Acta 61, 5363(1997).
2. J. I. Hedges et al., Org. Geochem. 31, 945 (2000).3. J. I. Hedges, Geochim. Cosmochim. Acta 42, 69(1978).
4. B. P. Tissot, D. H. Welte, Petroleum Formation andOccurrence (Springer, Heidelberg, Germany, ed. 2,1984), part II, chap. 2.
5. H. Knicker, A. W. Scaroni, P. G. Hatcher, Org. Geo-chem. 24, 661 (1996).
6. M. McCarthy, T. Pratum, J. Hedges, R. Benner, Nature390, 150 (1997).
7. P. G. Hatcher, E. C. Spiker, N. M. Szeverenyi, G. E.Maciel, Nature 305, 498 (1983).
8. E. W. Tegelaar, J. W. de Leeuw, S. Derenne, C. Largeau,Geochim. Cosmochim. Acta 53, 3103 (1989).
9. J. W. de Leeuw, C. Largeau, in Organic Geochemistry:
Principles and Applications, M. H. Engel, S. A. Macko,Eds. (Plenum, New York, 1993), pp. 23–72.
10. C. Flaviano, F. Le Berre, S. Derenne, C. Largeau, J.Connan, Org. Geochem. 22, 759 (1994).
11. C. Largeau, J. W. de Leeuw, in Advances in MicrobialEcology, J. G. Jones, Ed. (Plenum, New York, 1995),vol. 14, pp. 77–117.
12. R. G. Keil, D. B. Montlucon, F. G. Prahl, J. I. Hedges,Nature 370, 549 (1994).
13. R. A. Armstrong, C. Lee, J. I. Hedges, S. Honjo, S. G.Wakeham, Deep-Sea Res. II 49, 219 (2002).
14. J. I. Hedges et al., Nature 409, 801 (2001).15. The stable carbon isotope ratio is expressed as arelative ratio to the Pee Dee Belemnite standard,given by �13C � [(13C/12C)sample/(13C/12C)standard– 1] � 1000.
16. E. T. Degens, M. Behrendt, B. Gotthardt, E. Reppmann,Deep-Sea Res. 15, 11 (1968).
17. M. J. DeNiro, S. Epstein, Science 197, 261 (1977).18. The �14C value is the per mil deviation of the 14C/12Cratio relative to a standard. It is normalized to a �13Cof –25‰ to remove isotopic fractionation effect. Thehalf-life of 14C is 5730 years. See (38).
19. E. R. M. Druffel, P. M. Williams, J. E. Bauer, J. R. Ertel,J. Geophys. Res. 97, 15639 (1992).
20. Sinking POC was collected in a sediment trapequipped with an automatic sequencer set to collectsamples at 10-day periods. The filtered POC (1 �mpore size) was dried at 50°C, ground, and stored in afreezer until analysis. The sample was cavitated withan ultrasonicator in a 2 :1 volume/volume mixture ofmethylene chloride:methanol, and then was centri-fuged. The extraction was repeated four times, andthe combined supernatant was used as the lipidextract. Roughly half (weighed) of the residue washydrolyzed for total hydrolyzable amino acids(THAA) (6 M HCl under N2 gas for 19 hours) and theother half for total hydrolyzable neutral carbohy-drates (TCHO) (2 hours in 72% H2SO4, then 3 hoursin 0.6 M H2SO4). The hydrolyzates were elutedthrough ion exchange columns for the separation ofTHAA and TCHO. The organic carbon left after THAAextraction was used for the acid-insoluble fraction.Each organic carbon extract was acidified with 1 mlof 3% H3PO4, dried under vacuum, and combusted at850°C for 2 hours with CuO and silver foil in a sealedtube. The resultant CO2 was graphitized at 600°C ona Co catalyst. The �14C measurements were per-formed at either the National Ocean Sciences Accel-erator Mass Spectrometry Facility (NOSAMS), WoodsHole Oceanographic Institution (WHOI), or the Cen-ter for Accelerator Mass Spectrometry (CAMS), Law-rence Livermore Laboratory (LLNL). For a detaileddescription of the method, see (23).
21. The percentage was calculated from the ratio of theacid-insoluble fraction to the uncharacterized frac-tion that is the difference between the total organiccarbon and the characterized fractions (lipids, THAA,and TCHO).
22. C. A. Masiello, E. R. M. Druffel, J. E. Bauer, Deep-SeaRes. II 45, 617 (1998).
23. X.-C. Wang, E. R. M. Druffel, S. Griffin, C. Lee, M.Kashgarian, Geochim. Cosmochim. Acta 62, 1365(1998).
24. Y. Qian, M. H. Engel, S. A. Macko, Chem. Geol. 101,201 (1992).
25. J. Hwang, unpublished data.26. After the extraction of lipid and acid-soluble frac-tions, the acid-insoluble fraction was treated withHCl-HF solution (5 ml of 1.5 M HCl and 5 ml of 50%HF) for 24 hours at room temperature, then wasdried completely to remove HF. The extraction oflipids and acid-soluble fractions was performed onthe demineralized fraction.
27. The fraction of old carbon was calculated by a mass-balance equation assuming that the acid-insolublefraction is composed of lipids, THAA, and TCHO.Weighted averages of the lipids, THAA, and TCHOare 40‰ and –20.3‰ for �14C and �13C, respec-tively. The observed values of the acid-insolublefraction are –23‰ and –23.5‰ for �14C and �13C,respectively. Assuming –500‰ and –27‰ for�14C and �13C of terrestrial carbon, respectively,the percentage of terrestrial carbon (f ) can becalculated by 40 � (1 – f ) � (–500) � f � –23
R E P O R T S
www.sciencemag.org SCIENCE VOL 299 7 FEBRUARY 2003 883
(f � 0.12 for �14C); –20.3 � (1 – f ) � (–27) �f � –23.5 (f � 0.48 for �13C).
28. R. M. Sherrell, M. P. Field, Y. Gao, Deep Sea Res. II 45,733 (1998).
29. C. A. Masiello, E. R. M. Druffel, Global Biogeochem.Cycles 15, 407 (2001).
30. S. M. Henrichs, Mar. Chem. 49, 127 (1995).31. T. Eglinton, Org. Geochem. 21, 721 (1994).32. A. Garcette-Lepecq, S. Derenne, C. Largeau, I. Boulou-bassi, A. Saliot, Org. Geochem. 31, 1663 (2000).
33. Y. Gelinas, J. A. Baldock, J. I. Hedges, Science 294, 145(2001).
34. E. C. Minor, S. G. Wakeham, C. Lee, Geochim. Cos-mochim. Acta, in preparation.
35. S. Peulve, J. W. de Leeuw, M.-A. Sicre, M. Baas, A.Saliot, Geochim. Cosmochim. Acta 60, 1239(1996).
36. X.-C. Wang, E. R. M. Druffel, Mar. Chem. 73, 65(2001).
37. K. L. Smith, R. S. Kaufmann, R. J. Baldwin, A. F.Carlucci, Limnol. Oceanogr. 46, 543 (2001).
38. M. Stuiver, H. A. Polach, Radiocarbon 19, 355(1977).
39. We thank S. Griffin for guidance in laboratory workand C. Masiello, X.-C. Wang, C. Lee, and A. Ingallsfor discussion on the experiments; K. Smith, J.Bauer, D. Wolgast, R. Baldwin, R. Glatts, F. Uhlman,R. Wilson, and the crews of the R/V New Horizon
for help with sample collection; S. Trumbore and S.Zheng for shared equipment; A. McNichol, R.Schneider, J. Hayes, and colleagues at NOSAMS,WHOI, and J. Southon and colleagues at CAMS,LLNL, for the �14C measurement; A. Gagnon forthe �13C measurement; M. McCarthy for discussionand review of the manuscript; and C. Lee, T.Komada, S. Beaupre, and an anonymous reviewerfor helpful comments on the manuscript. Support-ed by the Chemical Oceanography Program of NSFand the University of California Office of the Pres-ident (fellowship to J.H.).
17 September 2002; accepted 7 January 2003
Design and Chemical Synthesis ofa Homogeneous Polymer-Modified
Erythropoiesis ProteinGerd G. Kochendoerfer,1* Shiah-Yun Chen,1
Feng Mao,1 Sonya Cressman,1† Stacey Traviglia,1‡ Haiyan Shao,1
Christie L. Hunter,1§ Donald W. Low,1 E. Neil Cagle,1
Maia Carnevali,1 Vincent Gueriguian,1 Peter J. Keogh,1
Heather Porter,1 Stephen M. Stratton,1 M. Con Wiedeke,1
Jill Wilken,1 Jie Tang,1� Jay J. Levy,1¶ Les P. Miranda,1
Milan M. Crnogorac,1 Suresh Kalbag,1
Paolo Botti,1# Janice Schindler-Horvat,1 Laura Savatski,2
John W. Adamson,2 Ada Kung,1
Stephen B. H. Kent,1** James A. Bradburne1
We report the design and total chemical synthesis of “synthetic erythropoiesisprotein” (SEP), a 51-kilodalton protein-polymer construct consisting of a 166-amino–acid polypeptide chain and two covalently attached, branched, andmonodisperse polymer moieties that are negatively charged. The ability tocontrol the chemistry allowed us to synthesize a macromolecule of preciselydefined covalent structure. SEP was homogeneous as shown by high-resolutionanalytical techniques, with a mass of 50,825�10 daltons by electrospray massspectrometry, and with a pI of 5.0. In cell and animal assays for erythropoiesis,SEP displayed potent biological activity and had significantly prolonged dura-tion of action in vivo. These chemicalmethods are a powerful tool in the rationaldesign of protein constructs with potential therapeutic applications.
Optimal performance of protein pharmaceuticalsis primarily determined by an appropriate bal-ance among specificity, potency, and pharma-cokinetic properties. However, the inability toproduce homogeneous posttranslationally orchemically modified recombinant proteins hashampered their optimization to date. Both nat-ural and recombinantly produced glycopro-teins occur in multiple glycoforms, and this het-erogeneity is reflected in different potency andpharmacokinetic properties (1–5). Using con-ventional polymers such as polyethylene glycolfor modification of recombinant proteins intro-duces heterogeneity both in the polymers at-tached and in the attachment sites, with a conse-quent variability in biological properties (6–9).
We envisioned that recent advances in thetotal chemical synthesis of proteins (10–14)and in the chemical synthesis of monodispersepolymers (15) could be exploited to addressthis problem through the design and syn-
thesis of polymer-protein constructs of de-fined covalent structure. Such preciseatom-by-atom control of the covalent struc-ture provides a unique way to systematical-ly correlate molecular structure with func-tion and enables the fine-tuning of thebiological properties of a target protein ofpharmaceutical interest.
Here, we describe the design, total chem-ical synthesis, and biological activity of amonodisperse, polymer-modified macromol-ecule, synthetic erythropoiesis protein (SEP).SEP had comparable specific activity in vitro,but superior duration of action in vivo, rela-tive to human erythropoietin (Epo), a naturalglycoprotein hormone that regulates the pro-liferation, differentiation, and maturation oferythroid cells (16).
We designed SEP to be a potent effector ofthe Epo receptor and to have prolonged circula-tion lifetime. The target structure of SEP is
shown in Fig. 1. SEP contains a 166-amino-acidpolypeptide chain (Fig. 1A) similar to the se-quence of Epo (16) but differs significantly inthe number and type of attached polymers (17).In particular, two branched polymer moieties ofa precise length and bearing a total of eightnegative charges (Fig. 1B) were designed forsite-specific attachment through an oxime bondto two noncoded amino acid residues [Lys24
(Nε-levulinyl) and Lys126 (Nε-levulinyl)] thatwere incorporated into the polypeptide chain.These sites correspond to two of the four glyco-sylation sites found in Epo. Each branched pre-cision polymer was designed to have the follow-ing: (i) a chemoselective linker, (ii) a hydrophilicspacer consisting of one polymer repeat unit, (iii)a core structure with four branch points, (iv) alinear polymer with 12 repeat units attached toeach branch point, and (v) a negative charge–control unit at the end of each linear polymer.These precision polymer moieties were envi-sioned to give the SEP molecule a large hydro-dynamic radius and a net negative charge atphysiologic pH for optimal potency and pro-longed duration of action in vivo (18). We alsohoped that the precision polymers would en-hance stability by shielding the folded polypep-tide chain from attack by proteolytic enzymes,and that it would reduce immunogenicity, whileretaining full biological potency.
1Gryphon Therapeutics, 250 East Grand Avenue, Suite90, South San Francisco, CA 94080, USA. 2The BloodResearch Institute, Blood Center of Southeastern Wis-consin, 8727 Watertown Plank Road, Milwaukee, WI53226, USA.
*To whom correspondence should be addressed. E-mail: [email protected]†Present address: Department of Biochemistry andMolecular Biology, Faculty of Medicine, University ofBritish Columbia, 2146 Health Sciences Mall, Vancou-ver, BC V6T 1Z3, Canada.‡Present address: Diosynth RTP, Inc., 3000 WestonParkway, Cary, NC 27513, USA.§Present address: Applied Biosystems, 850 LincolnCentre Drive, Foster City, CA 94404, USA.�Present address: Celera Genomics, 180 Kimball Way,South San Francisco, CA 94080, USA.¶Present address: Midwest Biotech, 12690 Ford Drive,Fishers, IN 46038–1151, USA.#Present address: GeneProt Inc., 2 Pre-de-la-Fontaine,1217 Meyrin/Geneva, Switzerland.**Present address: Departments of Biochemistry &Molecular Biology, and The University of Chicago,Chicago, IL 60637, USA.
R E P O R T S
7 FEBRUARY 2003 VOL 299 SCIENCE www.sciencemag.org884
significantly [�5% of total organic carbon(OC)] (25, 26 ). However, our data do notargue against the hypothesis of selectivemineral protection.
Another possibility is that the acid-insoluble fraction is protected lipids, THAA,and TCHO and contains a small fraction of oldcarbon [for example, old terrestrial carbon con-sidering the location of the sampling site (220-km offshore)]. About 10% of the acid-insolublefraction needs to be old carbon to explain ob-served low �14C values (27). However, in or-der to explain the low �13C values of the acid-insoluble fraction, a much larger fraction (up to50%) needs to be terrestrial carbon (27). There-fore, this mechanism cannot satisfy the �13Cand �14C results at the same time.
It is most likely that the major part of theacid-insoluble fraction is a selectively pre-served part of organisms that is chemicallydifferent from amino acids and carbohy-drates. Low �14C values can be explained ifthe major portion of the acid-insoluble frac-tion is surface-originated fresh carbon andonly a small fraction is older carbon that hasaged and was incorporated into the particles.The source of the old carbon can be eitherdissolved organic carbon (DOC) or suspend-ed POC. Resuspended sedimentary organiccarbon will be old, but �13C values will bevery similar to those of POC (28). Old carbonfrom eroded marine-origin bedrock is anotherpossible source of old suspended POC (29).
The incorporation of old carbon into par-ticles occurs more actively for lipids and theacid-insoluble fraction. Because lipids arehydrophobic and water-insoluble, they aremore likely to be adsorbed to particles thanare THAA and TCHO, most of which arewater-soluble (30). The fact that the acid-insoluble fraction has similar �14C values tothose of lipids suggests that the two fractionshave similar physicochemical properties. Thesimilarity of �13C in lipids and the acid-insoluble fractions may suggest that bothfractions are synthesized by similar biochem-ical pathways that are different from those forTHAA and TCHO.
Our results suggest that the major portionof the acid-insoluble fraction is composed oflipid-like material that is biosynthesized bysimilar pathways to the extractable lipids, butsomehow is resistant to organic solvents andacids. In fact, lipids are enriched in resistantparts of organisms such as membranes,spores, and cuticles (4 ). Selective preserva-tion of these resistant lipids has been consid-ered as one method of kerogen formation (4).The refractory cell wall–derived material ofmicroalgae and bacteria, known as algaenansand bacterans, respectively, were found tomake up a large part of kerogen and refrac-tory organic carbon in sediments (8, 11, 31–33). They are, essentially, highly aliphaticlipids (i.e., a large number of carbon-to-car-
bon bonds) evidenced by release of n-alkaneand n-alka-1-ene upon pyrolysis and by ahigh alkyl signal in 13C NMR spectra. Anetwork structure built up by cross-linking oflong hydrocarbon chains was suggested as aprotection mechanism against chemical at-tack (9). Considering that the mechanisms oflipid synthesis are similar in all organisms(17 ), these refractory macromolecules mightbe expected to have similar �13C signaturesas those for the extractable lipids. The simi-larity of the nonhydrolyzable fraction andnonprotein alkyl carbon in chemical compo-sition and abundance was observed in sedi-ment from the continental margin of north-western Mexico, and it was suggested thatthose components were compositionally sim-ilar to cell wall–derived algaenans (33). Eventhough these refractory lipid-like macromol-ecules have been studied only in sediments,selective accumulation of the lipids is likelyto occur in the water column as the POCsinks. Selective accumulation of the refracto-ry lipid-like material in the water column wasevidenced by the observation that alkanesaccounted for increasing fractions of the py-rolyzates of sinking POC as depth increasedin the Equatorial Pacific (34 ) and the Medi-terranean Sea (35).
Even though results of the 13C NMR spec-troscopy and direct temperature-resolvedmass spectrometry on the samples from theEquatorial Pacific do not support the predom-inance of lipid-like material in sinking POC(14, 34 ), the composition of sinking POCmight vary depending on the local environ-ment (36 ). The percentage of lipid in sinkingPOC in the Arabian Sea was twice as high asthat in the Equatorial Pacific (14). Also, oursampling site can be influenced by laterallytransported old carbon from the continentalshelf or slope and from rivers in the Califor-nia coast (37 ). Further study will be neces-sary to confirm if our observation is universalin the oceans. These results should provideimportant information to understand how or-ganic carbon is preserved and removed fromthe carbon cycle in the ocean.
References and Notes1. S. G. Wakeham, C. Lee, J. I. Hedges, P. J. Hernes, M. L.Peterson, Geochim. Cosmochim. Acta 61, 5363(1997).
2. J. I. Hedges et al., Org. Geochem. 31, 945 (2000).3. J. I. Hedges, Geochim. Cosmochim. Acta 42, 69(1978).
4. B. P. Tissot, D. H. Welte, Petroleum Formation andOccurrence (Springer, Heidelberg, Germany, ed. 2,1984), part II, chap. 2.
5. H. Knicker, A. W. Scaroni, P. G. Hatcher, Org. Geo-chem. 24, 661 (1996).
6. M. McCarthy, T. Pratum, J. Hedges, R. Benner, Nature390, 150 (1997).
7. P. G. Hatcher, E. C. Spiker, N. M. Szeverenyi, G. E.Maciel, Nature 305, 498 (1983).
8. E. W. Tegelaar, J. W. de Leeuw, S. Derenne, C. Largeau,Geochim. Cosmochim. Acta 53, 3103 (1989).
9. J. W. de Leeuw, C. Largeau, in Organic Geochemistry:
Principles and Applications, M. H. Engel, S. A. Macko,Eds. (Plenum, New York, 1993), pp. 23–72.
10. C. Flaviano, F. Le Berre, S. Derenne, C. Largeau, J.Connan, Org. Geochem. 22, 759 (1994).
11. C. Largeau, J. W. de Leeuw, in Advances in MicrobialEcology, J. G. Jones, Ed. (Plenum, New York, 1995),vol. 14, pp. 77–117.
12. R. G. Keil, D. B. Montlucon, F. G. Prahl, J. I. Hedges,Nature 370, 549 (1994).
13. R. A. Armstrong, C. Lee, J. I. Hedges, S. Honjo, S. G.Wakeham, Deep-Sea Res. II 49, 219 (2002).
14. J. I. Hedges et al., Nature 409, 801 (2001).15. The stable carbon isotope ratio is expressed as arelative ratio to the Pee Dee Belemnite standard,given by �13C � [(13C/12C)sample/(13C/12C)standard– 1] � 1000.
16. E. T. Degens, M. Behrendt, B. Gotthardt, E. Reppmann,Deep-Sea Res. 15, 11 (1968).
17. M. J. DeNiro, S. Epstein, Science 197, 261 (1977).18. The �14C value is the per mil deviation of the 14C/12Cratio relative to a standard. It is normalized to a �13Cof –25‰ to remove isotopic fractionation effect. Thehalf-life of 14C is 5730 years. See (38).
19. E. R. M. Druffel, P. M. Williams, J. E. Bauer, J. R. Ertel,J. Geophys. Res. 97, 15639 (1992).
20. Sinking POC was collected in a sediment trapequipped with an automatic sequencer set to collectsamples at 10-day periods. The filtered POC (1 �mpore size) was dried at 50°C, ground, and stored in afreezer until analysis. The sample was cavitated withan ultrasonicator in a 2 :1 volume/volume mixture ofmethylene chloride:methanol, and then was centri-fuged. The extraction was repeated four times, andthe combined supernatant was used as the lipidextract. Roughly half (weighed) of the residue washydrolyzed for total hydrolyzable amino acids(THAA) (6 M HCl under N2 gas for 19 hours) and theother half for total hydrolyzable neutral carbohy-drates (TCHO) (2 hours in 72% H2SO4, then 3 hoursin 0.6 M H2SO4). The hydrolyzates were elutedthrough ion exchange columns for the separation ofTHAA and TCHO. The organic carbon left after THAAextraction was used for the acid-insoluble fraction.Each organic carbon extract was acidified with 1 mlof 3% H3PO4, dried under vacuum, and combusted at850°C for 2 hours with CuO and silver foil in a sealedtube. The resultant CO2 was graphitized at 600°C ona Co catalyst. The �14C measurements were per-formed at either the National Ocean Sciences Accel-erator Mass Spectrometry Facility (NOSAMS), WoodsHole Oceanographic Institution (WHOI), or the Cen-ter for Accelerator Mass Spectrometry (CAMS), Law-rence Livermore Laboratory (LLNL). For a detaileddescription of the method, see (23).
21. The percentage was calculated from the ratio of theacid-insoluble fraction to the uncharacterized frac-tion that is the difference between the total organiccarbon and the characterized fractions (lipids, THAA,and TCHO).
22. C. A. Masiello, E. R. M. Druffel, J. E. Bauer, Deep-SeaRes. II 45, 617 (1998).
23. X.-C. Wang, E. R. M. Druffel, S. Griffin, C. Lee, M.Kashgarian, Geochim. Cosmochim. Acta 62, 1365(1998).
24. Y. Qian, M. H. Engel, S. A. Macko, Chem. Geol. 101,201 (1992).
25. J. Hwang, unpublished data.26. After the extraction of lipid and acid-soluble frac-tions, the acid-insoluble fraction was treated withHCl-HF solution (5 ml of 1.5 M HCl and 5 ml of 50%HF) for 24 hours at room temperature, then wasdried completely to remove HF. The extraction oflipids and acid-soluble fractions was performed onthe demineralized fraction.
27. The fraction of old carbon was calculated by a mass-balance equation assuming that the acid-insolublefraction is composed of lipids, THAA, and TCHO.Weighted averages of the lipids, THAA, and TCHOare 40‰ and –20.3‰ for �14C and �13C, respec-tively. The observed values of the acid-insolublefraction are –23‰ and –23.5‰ for �14C and �13C,respectively. Assuming –500‰ and –27‰ for�14C and �13C of terrestrial carbon, respectively,the percentage of terrestrial carbon (f ) can becalculated by 40 � (1 – f ) � (–500) � f � –23
R E P O R T S
www.sciencemag.org SCIENCE VOL 299 7 FEBRUARY 2003 883
(f � 0.12 for �14C); –20.3 � (1 – f ) � (–27) �f � –23.5 (f � 0.48 for �13C).
28. R. M. Sherrell, M. P. Field, Y. Gao, Deep Sea Res. II 45,733 (1998).
29. C. A. Masiello, E. R. M. Druffel, Global Biogeochem.Cycles 15, 407 (2001).
30. S. M. Henrichs, Mar. Chem. 49, 127 (1995).31. T. Eglinton, Org. Geochem. 21, 721 (1994).32. A. Garcette-Lepecq, S. Derenne, C. Largeau, I. Boulou-bassi, A. Saliot, Org. Geochem. 31, 1663 (2000).
33. Y. Gelinas, J. A. Baldock, J. I. Hedges, Science 294, 145(2001).
34. E. C. Minor, S. G. Wakeham, C. Lee, Geochim. Cos-mochim. Acta, in preparation.
35. S. Peulve, J. W. de Leeuw, M.-A. Sicre, M. Baas, A.Saliot, Geochim. Cosmochim. Acta 60, 1239(1996).
36. X.-C. Wang, E. R. M. Druffel, Mar. Chem. 73, 65(2001).
37. K. L. Smith, R. S. Kaufmann, R. J. Baldwin, A. F.Carlucci, Limnol. Oceanogr. 46, 543 (2001).
38. M. Stuiver, H. A. Polach, Radiocarbon 19, 355(1977).
39. We thank S. Griffin for guidance in laboratory workand C. Masiello, X.-C. Wang, C. Lee, and A. Ingallsfor discussion on the experiments; K. Smith, J.Bauer, D. Wolgast, R. Baldwin, R. Glatts, F. Uhlman,R. Wilson, and the crews of the R/V New Horizon
for help with sample collection; S. Trumbore and S.Zheng for shared equipment; A. McNichol, R.Schneider, J. Hayes, and colleagues at NOSAMS,WHOI, and J. Southon and colleagues at CAMS,LLNL, for the �14C measurement; A. Gagnon forthe �13C measurement; M. McCarthy for discussionand review of the manuscript; and C. Lee, T.Komada, S. Beaupre, and an anonymous reviewerfor helpful comments on the manuscript. Support-ed by the Chemical Oceanography Program of NSFand the University of California Office of the Pres-ident (fellowship to J.H.).
17 September 2002; accepted 7 January 2003
Design and Chemical Synthesis ofa Homogeneous Polymer-Modified
Erythropoiesis ProteinGerd G. Kochendoerfer,1* Shiah-Yun Chen,1
Feng Mao,1 Sonya Cressman,1† Stacey Traviglia,1‡ Haiyan Shao,1
Christie L. Hunter,1§ Donald W. Low,1 E. Neil Cagle,1
Maia Carnevali,1 Vincent Gueriguian,1 Peter J. Keogh,1
Heather Porter,1 Stephen M. Stratton,1 M. Con Wiedeke,1
Jill Wilken,1 Jie Tang,1� Jay J. Levy,1¶ Les P. Miranda,1
Milan M. Crnogorac,1 Suresh Kalbag,1
Paolo Botti,1# Janice Schindler-Horvat,1 Laura Savatski,2
John W. Adamson,2 Ada Kung,1
Stephen B. H. Kent,1** James A. Bradburne1
We report the design and total chemical synthesis of “synthetic erythropoiesisprotein” (SEP), a 51-kilodalton protein-polymer construct consisting of a 166-amino–acid polypeptide chain and two covalently attached, branched, andmonodisperse polymer moieties that are negatively charged. The ability tocontrol the chemistry allowed us to synthesize a macromolecule of preciselydefined covalent structure. SEP was homogeneous as shown by high-resolutionanalytical techniques, with a mass of 50,825�10 daltons by electrospray massspectrometry, and with a pI of 5.0. In cell and animal assays for erythropoiesis,SEP displayed potent biological activity and had significantly prolonged dura-tion of action in vivo. These chemicalmethods are a powerful tool in the rationaldesign of protein constructs with potential therapeutic applications.
Optimal performance of protein pharmaceuticalsis primarily determined by an appropriate bal-ance among specificity, potency, and pharma-cokinetic properties. However, the inability toproduce homogeneous posttranslationally orchemically modified recombinant proteins hashampered their optimization to date. Both nat-ural and recombinantly produced glycopro-teins occur in multiple glycoforms, and this het-erogeneity is reflected in different potency andpharmacokinetic properties (1–5). Using con-ventional polymers such as polyethylene glycolfor modification of recombinant proteins intro-duces heterogeneity both in the polymers at-tached and in the attachment sites, with a conse-quent variability in biological properties (6–9).
We envisioned that recent advances in thetotal chemical synthesis of proteins (10–14)and in the chemical synthesis of monodispersepolymers (15) could be exploited to addressthis problem through the design and syn-
thesis of polymer-protein constructs of de-fined covalent structure. Such preciseatom-by-atom control of the covalent struc-ture provides a unique way to systematical-ly correlate molecular structure with func-tion and enables the fine-tuning of thebiological properties of a target protein ofpharmaceutical interest.
Here, we describe the design, total chem-ical synthesis, and biological activity of amonodisperse, polymer-modified macromol-ecule, synthetic erythropoiesis protein (SEP).SEP had comparable specific activity in vitro,but superior duration of action in vivo, rela-tive to human erythropoietin (Epo), a naturalglycoprotein hormone that regulates the pro-liferation, differentiation, and maturation oferythroid cells (16).
We designed SEP to be a potent effector ofthe Epo receptor and to have prolonged circula-tion lifetime. The target structure of SEP is
shown in Fig. 1. SEP contains a 166-amino-acidpolypeptide chain (Fig. 1A) similar to the se-quence of Epo (16) but differs significantly inthe number and type of attached polymers (17).In particular, two branched polymer moieties ofa precise length and bearing a total of eightnegative charges (Fig. 1B) were designed forsite-specific attachment through an oxime bondto two noncoded amino acid residues [Lys24
(Nε-levulinyl) and Lys126 (Nε-levulinyl)] thatwere incorporated into the polypeptide chain.These sites correspond to two of the four glyco-sylation sites found in Epo. Each branched pre-cision polymer was designed to have the follow-ing: (i) a chemoselective linker, (ii) a hydrophilicspacer consisting of one polymer repeat unit, (iii)a core structure with four branch points, (iv) alinear polymer with 12 repeat units attached toeach branch point, and (v) a negative charge–control unit at the end of each linear polymer.These precision polymer moieties were envi-sioned to give the SEP molecule a large hydro-dynamic radius and a net negative charge atphysiologic pH for optimal potency and pro-longed duration of action in vivo (18). We alsohoped that the precision polymers would en-hance stability by shielding the folded polypep-tide chain from attack by proteolytic enzymes,and that it would reduce immunogenicity, whileretaining full biological potency.
1Gryphon Therapeutics, 250 East Grand Avenue, Suite90, South San Francisco, CA 94080, USA. 2The BloodResearch Institute, Blood Center of Southeastern Wis-consin, 8727 Watertown Plank Road, Milwaukee, WI53226, USA.
*To whom correspondence should be addressed. E-mail: [email protected]†Present address: Department of Biochemistry andMolecular Biology, Faculty of Medicine, University ofBritish Columbia, 2146 Health Sciences Mall, Vancou-ver, BC V6T 1Z3, Canada.‡Present address: Diosynth RTP, Inc., 3000 WestonParkway, Cary, NC 27513, USA.§Present address: Applied Biosystems, 850 LincolnCentre Drive, Foster City, CA 94404, USA.�Present address: Celera Genomics, 180 Kimball Way,South San Francisco, CA 94080, USA.¶Present address: Midwest Biotech, 12690 Ford Drive,Fishers, IN 46038–1151, USA.#Present address: GeneProt Inc., 2 Pre-de-la-Fontaine,1217 Meyrin/Geneva, Switzerland.**Present address: Departments of Biochemistry &Molecular Biology, and The University of Chicago,Chicago, IL 60637, USA.
R E P O R T S
7 FEBRUARY 2003 VOL 299 SCIENCE www.sciencemag.org884
significantly [�5% of total organic carbon(OC)] (25, 26 ). However, our data do notargue against the hypothesis of selectivemineral protection.
Another possibility is that the acid-insoluble fraction is protected lipids, THAA,and TCHO and contains a small fraction of oldcarbon [for example, old terrestrial carbon con-sidering the location of the sampling site (220-km offshore)]. About 10% of the acid-insolublefraction needs to be old carbon to explain ob-served low �14C values (27). However, in or-der to explain the low �13C values of the acid-insoluble fraction, a much larger fraction (up to50%) needs to be terrestrial carbon (27). There-fore, this mechanism cannot satisfy the �13Cand �14C results at the same time.
It is most likely that the major part of theacid-insoluble fraction is a selectively pre-served part of organisms that is chemicallydifferent from amino acids and carbohy-drates. Low �14C values can be explained ifthe major portion of the acid-insoluble frac-tion is surface-originated fresh carbon andonly a small fraction is older carbon that hasaged and was incorporated into the particles.The source of the old carbon can be eitherdissolved organic carbon (DOC) or suspend-ed POC. Resuspended sedimentary organiccarbon will be old, but �13C values will bevery similar to those of POC (28). Old carbonfrom eroded marine-origin bedrock is anotherpossible source of old suspended POC (29).
The incorporation of old carbon into par-ticles occurs more actively for lipids and theacid-insoluble fraction. Because lipids arehydrophobic and water-insoluble, they aremore likely to be adsorbed to particles thanare THAA and TCHO, most of which arewater-soluble (30). The fact that the acid-insoluble fraction has similar �14C values tothose of lipids suggests that the two fractionshave similar physicochemical properties. Thesimilarity of �13C in lipids and the acid-insoluble fractions may suggest that bothfractions are synthesized by similar biochem-ical pathways that are different from those forTHAA and TCHO.
Our results suggest that the major portionof the acid-insoluble fraction is composed oflipid-like material that is biosynthesized bysimilar pathways to the extractable lipids, butsomehow is resistant to organic solvents andacids. In fact, lipids are enriched in resistantparts of organisms such as membranes,spores, and cuticles (4 ). Selective preserva-tion of these resistant lipids has been consid-ered as one method of kerogen formation (4).The refractory cell wall–derived material ofmicroalgae and bacteria, known as algaenansand bacterans, respectively, were found tomake up a large part of kerogen and refrac-tory organic carbon in sediments (8, 11, 31–33). They are, essentially, highly aliphaticlipids (i.e., a large number of carbon-to-car-
bon bonds) evidenced by release of n-alkaneand n-alka-1-ene upon pyrolysis and by ahigh alkyl signal in 13C NMR spectra. Anetwork structure built up by cross-linking oflong hydrocarbon chains was suggested as aprotection mechanism against chemical at-tack (9). Considering that the mechanisms oflipid synthesis are similar in all organisms(17 ), these refractory macromolecules mightbe expected to have similar �13C signaturesas those for the extractable lipids. The simi-larity of the nonhydrolyzable fraction andnonprotein alkyl carbon in chemical compo-sition and abundance was observed in sedi-ment from the continental margin of north-western Mexico, and it was suggested thatthose components were compositionally sim-ilar to cell wall–derived algaenans (33). Eventhough these refractory lipid-like macromol-ecules have been studied only in sediments,selective accumulation of the lipids is likelyto occur in the water column as the POCsinks. Selective accumulation of the refracto-ry lipid-like material in the water column wasevidenced by the observation that alkanesaccounted for increasing fractions of the py-rolyzates of sinking POC as depth increasedin the Equatorial Pacific (34 ) and the Medi-terranean Sea (35).
Even though results of the 13C NMR spec-troscopy and direct temperature-resolvedmass spectrometry on the samples from theEquatorial Pacific do not support the predom-inance of lipid-like material in sinking POC(14, 34 ), the composition of sinking POCmight vary depending on the local environ-ment (36 ). The percentage of lipid in sinkingPOC in the Arabian Sea was twice as high asthat in the Equatorial Pacific (14). Also, oursampling site can be influenced by laterallytransported old carbon from the continentalshelf or slope and from rivers in the Califor-nia coast (37 ). Further study will be neces-sary to confirm if our observation is universalin the oceans. These results should provideimportant information to understand how or-ganic carbon is preserved and removed fromthe carbon cycle in the ocean.
References and Notes1. S. G. Wakeham, C. Lee, J. I. Hedges, P. J. Hernes, M. L.Peterson, Geochim. Cosmochim. Acta 61, 5363(1997).
2. J. I. Hedges et al., Org. Geochem. 31, 945 (2000).3. J. I. Hedges, Geochim. Cosmochim. Acta 42, 69(1978).
4. B. P. Tissot, D. H. Welte, Petroleum Formation andOccurrence (Springer, Heidelberg, Germany, ed. 2,1984), part II, chap. 2.
5. H. Knicker, A. W. Scaroni, P. G. Hatcher, Org. Geo-chem. 24, 661 (1996).
6. M. McCarthy, T. Pratum, J. Hedges, R. Benner, Nature390, 150 (1997).
7. P. G. Hatcher, E. C. Spiker, N. M. Szeverenyi, G. E.Maciel, Nature 305, 498 (1983).
8. E. W. Tegelaar, J. W. de Leeuw, S. Derenne, C. Largeau,Geochim. Cosmochim. Acta 53, 3103 (1989).
9. J. W. de Leeuw, C. Largeau, in Organic Geochemistry:
Principles and Applications, M. H. Engel, S. A. Macko,Eds. (Plenum, New York, 1993), pp. 23–72.
10. C. Flaviano, F. Le Berre, S. Derenne, C. Largeau, J.Connan, Org. Geochem. 22, 759 (1994).
11. C. Largeau, J. W. de Leeuw, in Advances in MicrobialEcology, J. G. Jones, Ed. (Plenum, New York, 1995),vol. 14, pp. 77–117.
12. R. G. Keil, D. B. Montlucon, F. G. Prahl, J. I. Hedges,Nature 370, 549 (1994).
13. R. A. Armstrong, C. Lee, J. I. Hedges, S. Honjo, S. G.Wakeham, Deep-Sea Res. II 49, 219 (2002).
14. J. I. Hedges et al., Nature 409, 801 (2001).15. The stable carbon isotope ratio is expressed as arelative ratio to the Pee Dee Belemnite standard,given by �13C � [(13C/12C)sample/(13C/12C)standard– 1] � 1000.
16. E. T. Degens, M. Behrendt, B. Gotthardt, E. Reppmann,Deep-Sea Res. 15, 11 (1968).
17. M. J. DeNiro, S. Epstein, Science 197, 261 (1977).18. The �14C value is the per mil deviation of the 14C/12Cratio relative to a standard. It is normalized to a �13Cof –25‰ to remove isotopic fractionation effect. Thehalf-life of 14C is 5730 years. See (38).
19. E. R. M. Druffel, P. M. Williams, J. E. Bauer, J. R. Ertel,J. Geophys. Res. 97, 15639 (1992).
20. Sinking POC was collected in a sediment trapequipped with an automatic sequencer set to collectsamples at 10-day periods. The filtered POC (1 �mpore size) was dried at 50°C, ground, and stored in afreezer until analysis. The sample was cavitated withan ultrasonicator in a 2 :1 volume/volume mixture ofmethylene chloride:methanol, and then was centri-fuged. The extraction was repeated four times, andthe combined supernatant was used as the lipidextract. Roughly half (weighed) of the residue washydrolyzed for total hydrolyzable amino acids(THAA) (6 M HCl under N2 gas for 19 hours) and theother half for total hydrolyzable neutral carbohy-drates (TCHO) (2 hours in 72% H2SO4, then 3 hoursin 0.6 M H2SO4). The hydrolyzates were elutedthrough ion exchange columns for the separation ofTHAA and TCHO. The organic carbon left after THAAextraction was used for the acid-insoluble fraction.Each organic carbon extract was acidified with 1 mlof 3% H3PO4, dried under vacuum, and combusted at850°C for 2 hours with CuO and silver foil in a sealedtube. The resultant CO2 was graphitized at 600°C ona Co catalyst. The �14C measurements were per-formed at either the National Ocean Sciences Accel-erator Mass Spectrometry Facility (NOSAMS), WoodsHole Oceanographic Institution (WHOI), or the Cen-ter for Accelerator Mass Spectrometry (CAMS), Law-rence Livermore Laboratory (LLNL). For a detaileddescription of the method, see (23).
21. The percentage was calculated from the ratio of theacid-insoluble fraction to the uncharacterized frac-tion that is the difference between the total organiccarbon and the characterized fractions (lipids, THAA,and TCHO).
22. C. A. Masiello, E. R. M. Druffel, J. E. Bauer, Deep-SeaRes. II 45, 617 (1998).
23. X.-C. Wang, E. R. M. Druffel, S. Griffin, C. Lee, M.Kashgarian, Geochim. Cosmochim. Acta 62, 1365(1998).
24. Y. Qian, M. H. Engel, S. A. Macko, Chem. Geol. 101,201 (1992).
25. J. Hwang, unpublished data.26. After the extraction of lipid and acid-soluble frac-tions, the acid-insoluble fraction was treated withHCl-HF solution (5 ml of 1.5 M HCl and 5 ml of 50%HF) for 24 hours at room temperature, then wasdried completely to remove HF. The extraction oflipids and acid-soluble fractions was performed onthe demineralized fraction.
27. The fraction of old carbon was calculated by a mass-balance equation assuming that the acid-insolublefraction is composed of lipids, THAA, and TCHO.Weighted averages of the lipids, THAA, and TCHOare 40‰ and –20.3‰ for �14C and �13C, respec-tively. The observed values of the acid-insolublefraction are –23‰ and –23.5‰ for �14C and �13C,respectively. Assuming –500‰ and –27‰ for�14C and �13C of terrestrial carbon, respectively,the percentage of terrestrial carbon (f ) can becalculated by 40 � (1 – f ) � (–500) � f � –23
R E P O R T S
www.sciencemag.org SCIENCE VOL 299 7 FEBRUARY 2003 883
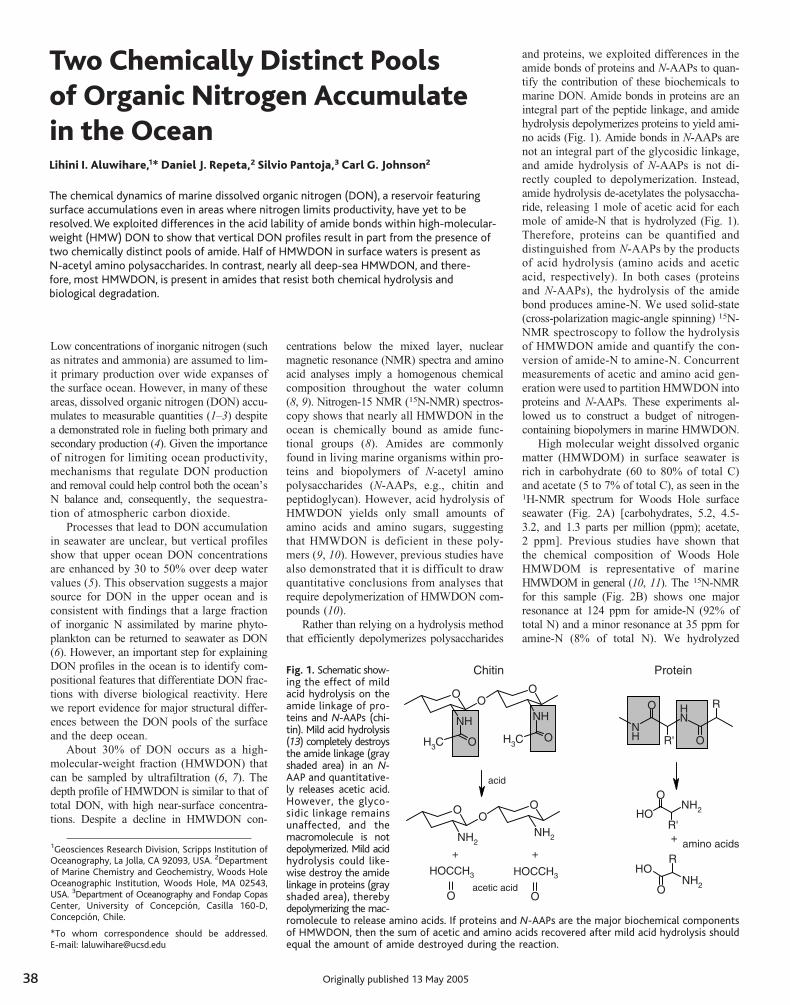
38
Two Chemically DistinctPools of Organic NitrogenAccumulate in the Ocean
Lihini I. Aluwihare,1* Daniel J. Repeta,2 Silvio Pantoja,3
Carl G. Johnson2
The chemical dynamics of marine dissolved organic nitrogen (DON), a reser-voir featuring surface accumulations even in areas where nitrogen limits pro-ductivity, have yet to be resolved. We exploited differences in the acid labilityof amide bonds within high-molecular-weight (HMW) DON to show that ver-tical DON profiles result in part from the presence of two chemically distinctpools of amide. Half of HMWDON in surface waters is present as N-acetylamino polysaccharides. In contrast, nearly all deep-sea HMWDON, and there-fore, most HMWDON, is present in amides that resist both chemical hydrolysisand biological degradation.
Low concentrations of inorganic nitrogen (such
as nitrates and ammonia) are assumed to lim-
it primary production over wide expanses of
the surface ocean. However, in many of these
areas, dissolved organic nitrogen (DON) accu-
mulates to measurable quantities (1–3) despite
a demonstrated role in fueling both primary and
secondary production (4). Given the importance
of nitrogen for limiting ocean productivity,
mechanisms that regulate DON production
and removal could help control both the ocean_s
N balance and, consequently, the sequestra-
tion of atmospheric carbon dioxide.
Processes that lead to DON accumulation
in seawater are unclear, but vertical profiles
show that upper ocean DON concentrations
are enhanced by 30 to 50% over deep water
values (5). This observation suggests a major
source for DON in the upper ocean and is
consistent with findings that a large fraction
of inorganic N assimilated by marine phyto-
plankton can be returned to seawater as DON
(6). However, an important step for explaining
DON profiles in the ocean is to identify com-
positional features that differentiate DON frac-
tions with diverse biological reactivity. Here
we report evidence for major structural differ-
ences between the DON pools of the surface
and the deep ocean.
About 30% of DON occurs as a high-
molecular-weight fraction (HMWDON) that
can be sampled by ultrafiltration (6, 7). The
depth profile of HMWDON is similar to that of
total DON, with high near-surface concentra-
tions. Despite a decline in HMWDON con-
centrations below the mixed layer, nuclear
magnetic resonance (NMR) spectra and amino
acid analyses imply a homogenous chemical
composition throughout the water column
(8, 9). Nitrogen-15 NMR (15N-NMR) spectros-
copy shows that nearly all HMWDON in the
ocean is chemically bound as amide func-
tional groups (8). Amides are commonly
found in living marine organisms within pro-
teins and biopolymers of N-acetyl amino
polysaccharides (N-AAPs, e.g., chitin and
peptidoglycan). However, acid hydrolysis of
HMWDON yields only small amounts of
amino acids and amino sugars, suggesting
that HMWDON is deficient in these poly-
mers (9, 10). However, previous studies have
also demonstrated that it is difficult to draw
quantitative conclusions from analyses that
require depolymerization of HMWDON com-
pounds (10).
Rather than relying on a hydrolysis method
that efficiently depolymerizes polysaccharides
and proteins, we exploited differences in the
amide bonds of proteins and N-AAPs to quan-
tify the contribution of these biochemicals to
marine DON. Amide bonds in proteins are an
integral part of the peptide linkage, and amide
hydrolysis depolymerizes proteins to yield ami-
no acids (Fig. 1). Amide bonds in N-AAPs are
not an integral part of the glycosidic linkage,
and amide hydrolysis of N-AAPs is not di-
rectly coupled to depolymerization. Instead,
amide hydrolysis de-acetylates the polysaccha-
ride, releasing 1 mole of acetic acid for each
mole of amide-N that is hydrolyzed (Fig. 1).
Therefore, proteins can be quantified and
distinguished from N-AAPs by the products
of acid hydrolysis (amino acids and acetic
acid, respectively). In both cases (proteins
and N-AAPs), the hydrolysis of the amide
bond produces amine-N. We used solid-state
(cross-polarization magic-angle spinning) 15N-
NMR spectroscopy to follow the hydrolysis
of HMWDON amide and quantify the con-
version of amide-N to amine-N. Concurrent
measurements of acetic and amino acid gen-
eration were used to partition HMWDON into
proteins and N-AAPs. These experiments al-
lowed us to construct a budget of nitrogen-
containing biopolymers in marine HMWDON.
High molecular weight dissolved organic
matter (HMWDOM) in surface seawater is
rich in carbohydrate (60 to 80% of total C)
and acetate (5 to 7% of total C), as seen in the1H-NMR spectrum for Woods Hole surface
seawater (Fig. 2A) Ecarbohydrates, 5.2, 4.5-
3.2, and 1.3 parts per million (ppm); acetate,
2 ppm^. Previous studies have shown that
the chemical composition of Woods Hole
HMWDOM is representative of marine
HMWDOM in general (10, 11). The 15N-NMR
for this sample (Fig. 2B) shows one major
resonance at 124 ppm for amide-N (92% of
total N) and a minor resonance at 35 ppm for
amine-N (8% of total N). We hydrolyzed
1Geosciences Research Division, Scripps Institution ofOceanography, La Jolla, CA 92093, USA. 2Departmentof Marine Chemistry and Geochemistry, Woods HoleOceanographic Institution, Woods Hole, MA 02543,USA. 3Department of Oceanography and Fondap CopasCenter, University of Concepcion, Casilla 160-D,Concepcion, Chile.
*To whom correspondence should be addressed.E-mail: [email protected]
Fig. 1. Schematic show-ing the effect of mildacid hydrolysis on theamide linkage of pro-teins and N-AAPs (chi-tin). Mild acid hydrolysis(13) completely destroysthe amide linkage (grayshaded area) in an N-AAP and quantitative-ly releases acetic acid.However, the glyco-sidic linkage remainsunaffected, and themacromolecule is notdepolymerized. Mild acidhydrolysis could like-wise destroy the amidelinkage in proteins (grayshaded area), therebydepolymerizing the mac-romolecule to release amino acids. If proteins and N-AAPs are the major biochemical componentsof HMWDON, then the sum of acetic and amino acids recovered after mild acid hydrolysis shouldequal the amount of amide destroyed during the reaction.
OO
O
HNHN
CH3
O CH3
O
OO
O
HN2HN
2
O
HCCOH3
O
OH HCC3
NH
NHO
O'R
R
HN2
OH
O
'R
OH
HN2
R
amino acids
O
dica
+ +
+
dicaciteca
Chitin Protein
R E P O R T S
www.sciencemag.org SCIENCE VOL 308 13 MAY 2005 1007Originally published 13 May 2005
Two Chemically Distinct Pools of Organic Nitrogen Accumulate in the OceanLihini I. Aluwihare,1* Daniel J. Repeta,2 Silvio Pantoja,3 Carl G. Johnson2
The chemical dynamics of marine dissolved organic nitrogen (DON), a reservoir featuring surface accumulations even in areas where nitrogen limits productivity, have yet to be resolved. We exploited differences in the acid lability of amide bonds within high-molecular-weight (HMW) DON to show that vertical DON profiles result in part from the presence of two chemically distinct pools of amide. Half of HMWDON in surface waters is present as N-acetyl amino polysaccharides. In contrast, nearly all deep-sea HMWDON, and there- fore, most HMWDON, is present in amides that resist both chemical hydrolysis and biological degradation.
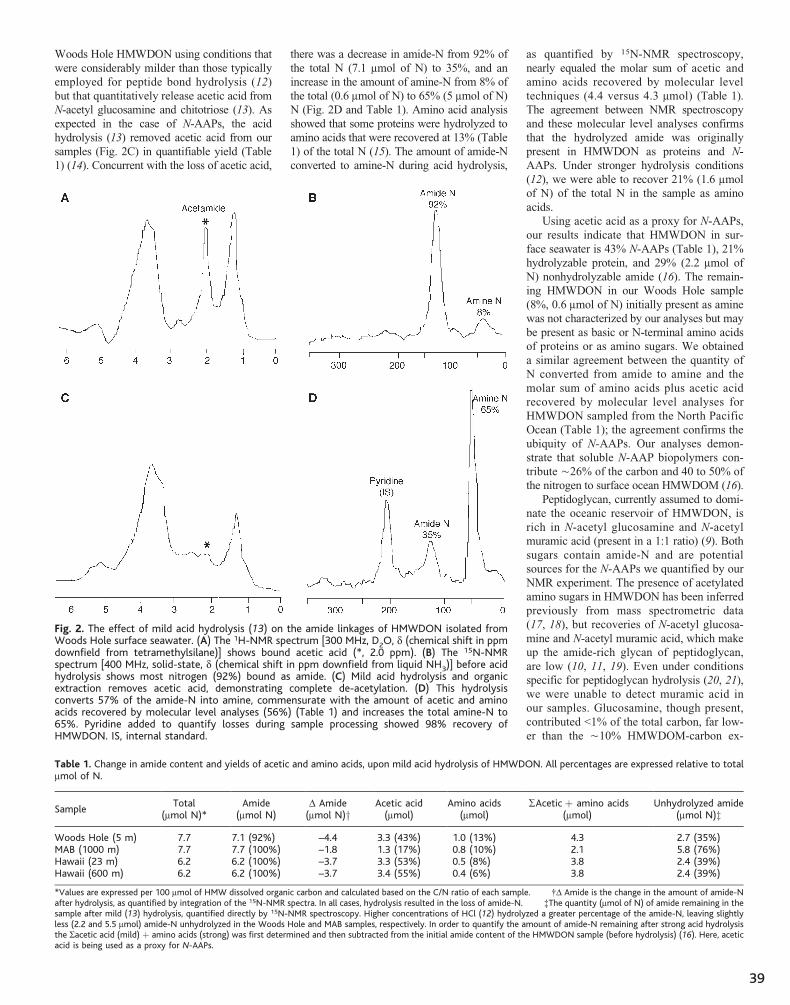
39Originally published 13 May 2005
Woods Hole HMWDON using conditions that
were considerably milder than those typically
employed for peptide bond hydrolysis (12)
but that quantitatively release acetic acid from
N-acetyl glucosamine and chitotriose (13). As
expected in the case of N-AAPs, the acid
hydrolysis (13) removed acetic acid from our
samples (Fig. 2C) in quantifiable yield (Table
1) (14). Concurrent with the loss of acetic acid,
there was a decrease in amide-N from 92% of
the total N (7.1 mmol of N) to 35%, and an
increase in the amount of amine-N from 8% of
the total (0.6 mmol of N) to 65% (5 mmol of N)
N (Fig. 2D and Table 1). Amino acid analysis
showed that some proteins were hydrolyzed to
amino acids that were recovered at 13% (Table
1) of the total N (15). The amount of amide-N
converted to amine-N during acid hydrolysis,
as quantified by 15N-NMR spectroscopy,
nearly equaled the molar sum of acetic and
amino acids recovered by molecular level
techniques (4.4 versus 4.3 mmol) (Table 1).
The agreement between NMR spectroscopy
and these molecular level analyses confirms
that the hydrolyzed amide was originally
present in HMWDON as proteins and N-
AAPs. Under stronger hydrolysis conditions
(12), we were able to recover 21% (1.6 mmol
of N) of the total N in the sample as amino
acids.
Using acetic acid as a proxy for N-AAPs,
our results indicate that HMWDON in sur-
face seawater is 43% N-AAPs (Table 1), 21%
hydrolyzable protein, and 29% (2.2 mmol of
N) nonhydrolyzable amide (16). The remain-
ing HMWDON in our Woods Hole sample
(8%, 0.6 mmol of N) initially present as amine
was not characterized by our analyses but may
be present as basic or N-terminal amino acids
of proteins or as amino sugars. We obtained
a similar agreement between the quantity of
N converted from amide to amine and the
molar sum of amino acids plus acetic acid
recovered by molecular level analyses for
HMWDON sampled from the North Pacific
Ocean (Table 1); the agreement confirms the
ubiquity of N-AAPs. Our analyses demon-
strate that soluble N-AAP biopolymers con-
tribute È26% of the carbon and 40 to 50% of
the nitrogen to surface ocean HMWDOM (16).
Peptidoglycan, currently assumed to domi-
nate the oceanic reservoir of HMWDON, is
rich in N-acetyl glucosamine and N-acetyl
muramic acid (present in a 1:1 ratio) (9). Both
sugars contain amide-N and are potential
sources for the N-AAPs we quantified by our
NMR experiment. The presence of acetylated
amino sugars in HMWDON has been inferred
previously from mass spectrometric data
(17, 18), but recoveries of N-acetyl glucosa-
mine and N-acetyl muramic acid, which make
up the amide-rich glycan of peptidoglycan,
are low (10, 11, 19). Even under conditions
specific for peptidoglycan hydrolysis (20, 21),
we were unable to detect muramic acid in
our samples. Glucosamine, though present,
contributed G1% of the total carbon, far low-
er than the È10% HMWDOM-carbon ex-
Fig. 2. The effect of mild acid hydrolysis (13) on the amide linkages of HMWDON isolated fromWoods Hole surface seawater. (A) The 1H-NMR spectrum [300 MHz, D2O, d (chemical shift in ppmdownfield from tetramethylsilane)] shows bound acetic acid (*, 2.0 ppm). (B) The 15N-NMRspectrum [400 MHz, solid-state, d (chemical shift in ppm downfield from liquid NH3)] before acidhydrolysis shows most nitrogen (92%) bound as amide. (C) Mild acid hydrolysis and organicextraction removes acetic acid, demonstrating complete de-acetylation. (D) This hydrolysisconverts 57% of the amide-N into amine, commensurate with the amount of acetic and aminoacids recovered by molecular level analyses (56%) (Table 1) and increases the total amine-N to65%. Pyridine added to quantify losses during sample processing showed 98% recovery ofHMWDON. IS, internal standard.
Table 1. Change in amide content and yields of acetic and amino acids, upon mild acid hydrolysis of HMWDON. All percentages are expressed relative to totalmmol of N.
SampleTotal
(mmol N)*Amide
(mmol N)D Amide(mmol N)y
Acetic acid(mmol)
Amino acids(mmol)
S Acetic þ amino acids(mmol)
Unhydrolyzed amide(mmol N)z
Woods Hole (5 m) 7.7 7.1 (92%) –4.4 3.3 (43%) 1.0 (13%) 4.3 2.7 (35%)MAB (1000 m) 7.7 7.7 (100%) –1.8 1.3 (17%) 0.8 (10%) 2.1 5.8 (76%)Hawaii (23 m) 6.2 6.2 (100%) –3.7 3.3 (53%) 0.5 (8%) 3.8 2.4 (39%)Hawaii (600 m) 6.2 6.2 (100%) –3.7 3.4 (55%) 0.4 (6%) 3.8 2.4 (39%)
*Values are expressed per 100 mmol of HMW dissolved organic carbon and calculated based on the C/N ratio of each sample. .D Amide is the change in the amount of amide-Nafter hydrolysis, as quantified by integration of the 15N-NMR spectra. In all cases, hydrolysis resulted in the loss of amide-N. -The quantity (mmol of N) of amide remaining in thesample after mild (13) hydrolysis, quantified directly by 15N-NMR spectroscopy. Higher concentrations of HCl (12) hydrolyzed a greater percentage of the amide-N, leaving slightlyless (2.2 and 5.5 mmol) amide-N unhydrolyzed in the Woods Hole and MAB samples, respectively. In order to quantify the amount of amide-N remaining after strong acid hydrolysisthe Sacetic acid (mild) þ amino acids (strong) was first determined and then subtracted from the initial amide content of the HMWDON sample (before hydrolysis) (16). Here, aceticacid is being used as a proxy for N-AAPs.
R E P O R T S
13 MAY 2005 VOL 308 SCIENCE www.sciencemag.org1008
∑
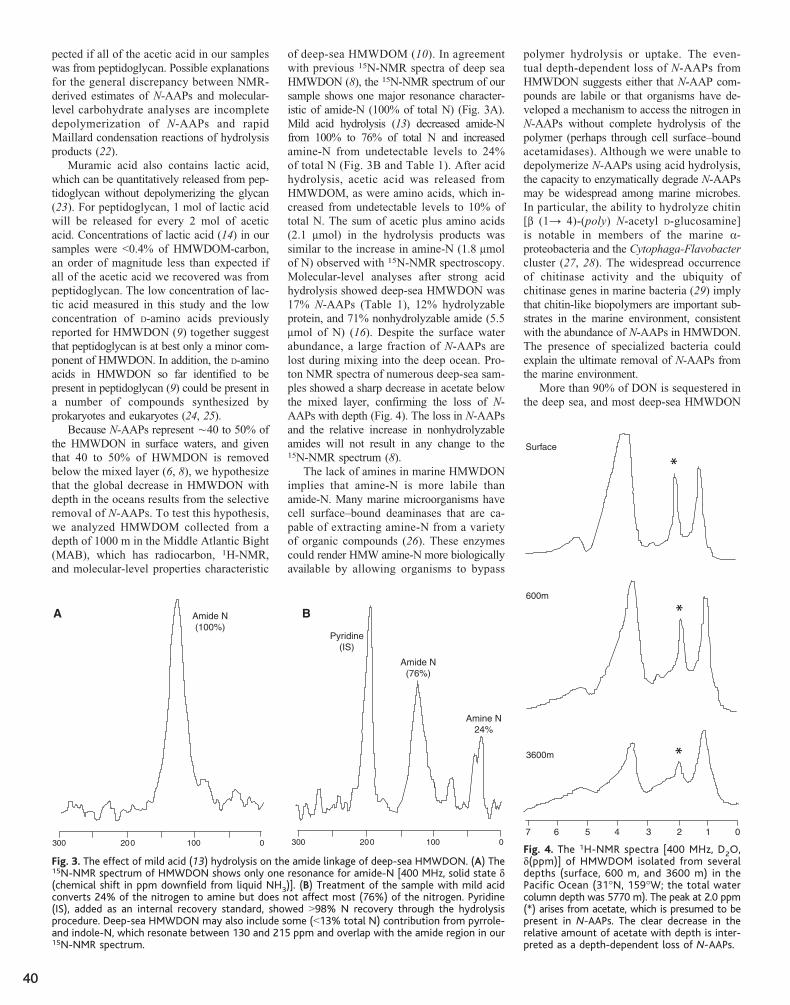
40
pected if all of the acetic acid in our samples
was from peptidoglycan. Possible explanations
for the general discrepancy between NMR-
derived estimates of N-AAPs and molecular-
level carbohydrate analyses are incomplete
depolymerization of N-AAPs and rapid
Maillard condensation reactions of hydrolysis
products (22).
Muramic acid also contains lactic acid,
which can be quantitatively released from pep-
tidoglycan without depolymerizing the glycan
(23). For peptidoglycan, 1 mol of lactic acid
will be released for every 2 mol of acetic
acid. Concentrations of lactic acid (14) in our
samples were G0.4% of HMWDOM-carbon,
an order of magnitude less than expected if
all of the acetic acid we recovered was from
peptidoglycan. The low concentration of lac-
tic acid measured in this study and the low
concentration of D-amino acids previously
reported for HMWDON (9) together suggest
that peptidoglycan is at best only a minor com-
ponent of HMWDON. In addition, the D-amino
acids in HMWDON so far identified to be
present in peptidoglycan (9) could be present in
a number of compounds synthesized by
prokaryotes and eukaryotes (24, 25).
Because N-AAPs represent È40 to 50% of
the HMWDON in surface waters, and given
that 40 to 50% of HWMDON is removed
below the mixed layer (6, 8), we hypothesize
that the global decrease in HMWDON with
depth in the oceans results from the selective
removal of N-AAPs. To test this hypothesis,
we analyzed HMWDOM collected from a
depth of 1000 m in the Middle Atlantic Bight
(MAB), which has radiocarbon, 1H-NMR,
and molecular-level properties characteristic
of deep-sea HMWDOM (10). In agreement
with previous 15N-NMR spectra of deep sea
HMWDON (8), the 15N-NMR spectrum of our
sample shows one major resonance character-
istic of amide-N (100% of total N) (Fig. 3A).
Mild acid hydrolysis (13) decreased amide-N
from 100% to 76% of total N and increased
amine-N from undetectable levels to 24%
of total N (Fig. 3B and Table 1). After acid
hydrolysis, acetic acid was released from
HMWDOM, as were amino acids, which in-
creased from undetectable levels to 10% of
total N. The sum of acetic plus amino acids
(2.1 mmol) in the hydrolysis products was
similar to the increase in amine-N (1.8 mmol
of N) observed with 15N-NMR spectroscopy.
Molecular-level analyses after strong acid
hydrolysis showed deep-sea HMWDON was
17% N-AAPs (Table 1), 12% hydrolyzable
protein, and 71% nonhydrolyzable amide (5.5
mmol of N) (16). Despite the surface water
abundance, a large fraction of N-AAPs are
lost during mixing into the deep ocean. Pro-
ton NMR spectra of numerous deep-sea sam-
ples showed a sharp decrease in acetate below
the mixed layer, confirming the loss of N-
AAPs with depth (Fig. 4). The loss in N-AAPs
and the relative increase in nonhydrolyzable
amides will not result in any change to the15N-NMR spectrum (8).
The lack of amines in marine HMWDON
implies that amine-N is more labile than
amide-N. Many marine microorganisms have
cell surface–bound deaminases that are ca-
pable of extracting amine-N from a variety
of organic compounds (26). These enzymes
could render HMW amine-N more biologically
available by allowing organisms to bypass
polymer hydrolysis or uptake. The even-
tual depth-dependent loss of N-AAPs from
HMWDON suggests either that N-AAP com-
pounds are labile or that organisms have de-
veloped a mechanism to access the nitrogen in
N-AAPs without complete hydrolysis of the
polymer (perhaps through cell surface–bound
acetamidases). Although we were unable to
depolymerize N-AAPs using acid hydrolysis,
the capacity to enzymatically degrade N-AAPs
may be widespread among marine microbes.
In particular, the ability to hydrolyze chitin
Eb (1Y 4)-(poly) N-acetyl D-glucosamine^
is notable in members of the marine a-proteobacteria and the Cytophaga-Flavobacter
cluster (27, 28). The widespread occurrence
of chitinase activity and the ubiquity of
chitinase genes in marine bacteria (29) imply
that chitin-like biopolymers are important sub-
strates in the marine environment, consistent
with the abundance of N-AAPs in HMWDON.
The presence of specialized bacteria could
explain the ultimate removal of N-AAPs from
the marine environment.
More than 90% of DON is sequestered in
the deep sea, and most deep-sea HMWDON
300 200 100 0 300 200 100 0
A BAmide N
(100%)
Amine N
24%
Amide N
(76%)
Pyridine
(IS)
Fig. 3. The effect of mild acid (13) hydrolysis on the amide linkage of deep-sea HMWDON. (A) The15N-NMR spectrum of HMWDON shows only one resonance for amide-N [400 MHz, solid state d(chemical shift in ppm downfield from liquid NH3)]. (B) Treatment of the sample with mild acidconverts 24% of the nitrogen to amine but does not affect most (76%) of the nitrogen. Pyridine(IS), added as an internal recovery standard, showed 998% N recovery through the hydrolysisprocedure. Deep-sea HMWDON may also include some (G13% total N) contribution from pyrrole-and indole-N, which resonate between 130 and 215 ppm and overlap with the amide region in our15N-NMR spectrum.
7 6 5 4 3 2 1 0
Surface
600m
3600m
Fig. 4. The 1H-NMR spectra [400 MHz, D2O,d(ppm)] of HMWDOM isolated from severaldepths (surface, 600 m, and 3600 m) in thePacific Ocean (31-N, 159-W; the total watercolumn depth was 5770 m). The peak at 2.0 ppm(*) arises from acetate, which is presumed to bepresent in N-AAPs. The clear decrease in therelative amount of acetate with depth is inter-preted as a depth-dependent loss of N-AAPs.
R E P O R T S
www.sciencemag.org SCIENCE VOL 308 13 MAY 2005 1009
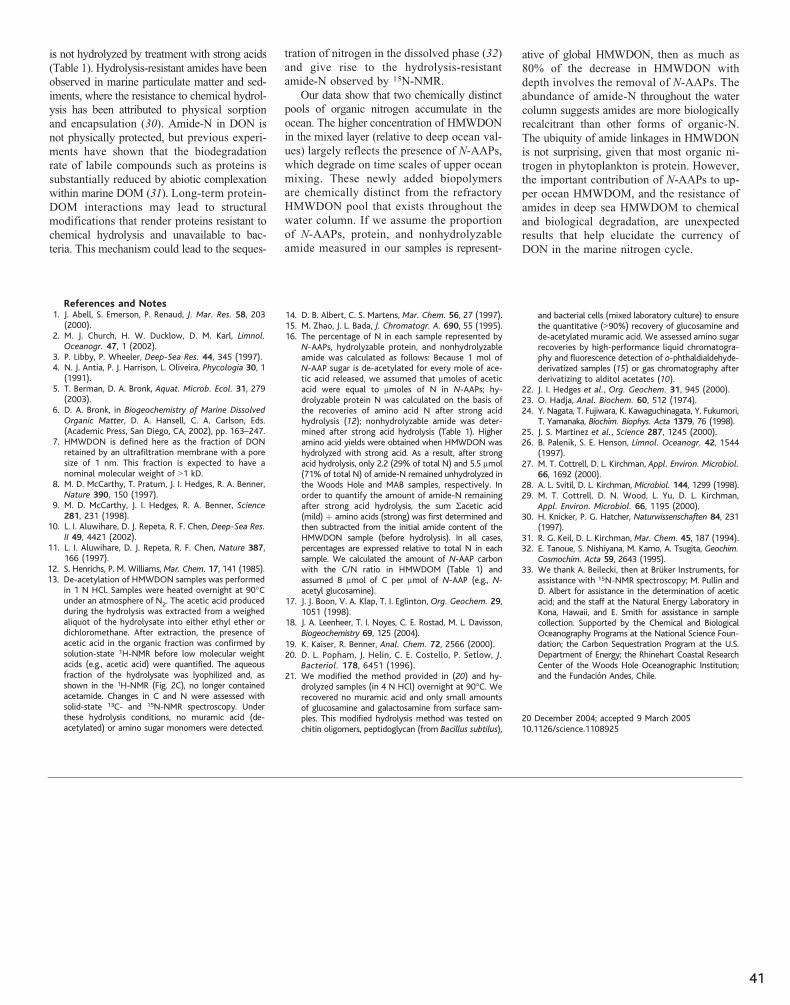
41
is not hydrolyzed by treatment with strong acids
(Table 1). Hydrolysis-resistant amides have been
observed in marine particulate matter and sed-
iments, where the resistance to chemical hydrol-
ysis has been attributed to physical sorption
and encapsulation (30). Amide-N in DON is
not physically protected, but previous experi-
ments have shown that the biodegradation
rate of labile compounds such as proteins is
substantially reduced by abiotic complexation
within marine DOM (31). Long-term protein-
DOM interactions may lead to structural
modifications that render proteins resistant to
chemical hydrolysis and unavailable to bac-
teria. This mechanism could lead to the seques-
tration of nitrogen in the dissolved phase (32)
and give rise to the hydrolysis-resistant
amide-N observed by 15N-NMR.
Our data show that two chemically distinct
pools of organic nitrogen accumulate in the
ocean. The higher concentration of HMWDON
in the mixed layer (relative to deep ocean val-
ues) largely reflects the presence of N-AAPs,
which degrade on time scales of upper ocean
mixing. These newly added biopolymers
are chemically distinct from the refractory
HMWDON pool that exists throughout the
water column. If we assume the proportion
of N-AAPs, protein, and nonhydrolyzable
amide measured in our samples is represent-
ative of global HMWDON, then as much as
80% of the decrease in HMWDON with
depth involves the removal of N-AAPs. The
abundance of amide-N throughout the water
column suggests amides are more biologically
recalcitrant than other forms of organic-N.
The ubiquity of amide linkages in HMWDON
is not surprising, given that most organic ni-
trogen in phytoplankton is protein. However,
the important contribution of N-AAPs to up-
per ocean HMWDOM, and the resistance of
amides in deep sea HMWDOM to chemical
and biological degradation, are unexpected
results that help elucidate the currency of
DON in the marine nitrogen cycle.
References and Notes1. J. Abell, S. Emerson, P. Renaud, J. Mar. Res. 58, 203
(2000).2. M. J. Church, H. W. Ducklow, D. M. Karl, Limnol.
Oceanogr. 47, 1 (2002).3. P. Libby, P. Wheeler, Deep-Sea Res. 44, 345 (1997).4. N. J. Antia, P. J. Harrison, L. Oliveira, Phycologia 30, 1
(1991).5. T. Berman, D. A. Bronk, Aquat. Microb. Ecol. 31, 279
(2003).6. D. A. Bronk, in Biogeochemistry of Marine Dissolved
Organic Matter, D. A. Hansell, C. A. Carlson, Eds.(Academic Press, San Diego, CA, 2002), pp. 163–247.
7. HMWDON is defined here as the fraction of DONretained by an ultrafiltration membrane with a poresize of 1 nm. This fraction is expected to have anominal molecular weight of 91 kD.
8. M. D. McCarthy, T. Pratum, J. I. Hedges, R. A. Benner,Nature 390, 150 (1997).
9. M. D. McCarthy, J. I. Hedges, R. A. Benner, Science281, 231 (1998).
10. L. I. Aluwihare, D. J. Repeta, R. F. Chen, Deep-Sea Res.II 49, 4421 (2002).
11. L. I. Aluwihare, D. J. Repeta, R. F. Chen, Nature 387,166 (1997).
12. S. Henrichs, P. M. Williams, Mar. Chem. 17, 141 (1985).13. De-acetylation of HMWDON samples was performed
in 1 N HCl. Samples were heated overnight at 90-Cunder an atmosphere of N2. The acetic acid producedduring the hydrolysis was extracted from a weighedaliquot of the hydrolysate into either ethyl ether ordichloromethane. After extraction, the presence ofacetic acid in the organic fraction was confirmed bysolution-state 1H-NMR before low molecular weightacids (e.g., acetic acid) were quantified. The aqueousfraction of the hydrolysate was lyophilized and, asshown in the 1H-NMR (Fig. 2C), no longer containedacetamide. Changes in C and N were assessed withsolid-state 13C- and 15N-NMR spectroscopy. Underthese hydrolysis conditions, no muramic acid (de-acetylated) or amino sugar monomers were detected.
14. D. B. Albert, C. S. Martens, Mar. Chem. 56, 27 (1997).15. M. Zhao, J. L. Bada, J. Chromatogr. A. 690, 55 (1995).16. The percentage of N in each sample represented by
N-AAPs, hydrolyzable protein, and nonhydrolyzableamide was calculated as follows: Because 1 mol ofN-AAP sugar is de-acetylated for every mole of ace-tic acid released, we assumed that mmoles of aceticacid were equal to mmoles of N in N-AAPs; hy-drolyzable protein N was calculated on the basis ofthe recoveries of amino acid N after strong acidhydrolysis (12); nonhydrolyzable amide was deter-mined after strong acid hydrolysis (Table 1). Higheramino acid yields were obtained when HMWDON washydrolyzed with strong acid. As a result, after strongacid hydrolysis, only 2.2 (29% of total N) and 5.5 mmol(71% of total N) of amide-N remained unhydrolyzed inthe Woods Hole and MAB samples, respectively. Inorder to quantify the amount of amide-N remainingafter strong acid hydrolysis, the sum Sacetic acid(mild) þ amino acids (strong) was first determined andthen subtracted from the initial amide content of theHMWDON sample (before hydrolysis). In all cases,percentages are expressed relative to total N in eachsample. We calculated the amount of N-AAP carbonwith the C/N ratio in HMWDOM (Table 1) andassumed 8 mmol of C per mmol of N-AAP (e.g., N-acetyl glucosamine).
17. J. J. Boon, V. A. Klap, T. I. Eglinton, Org. Geochem. 29,1051 (1998).
18. J. A. Leenheer, T. I. Noyes, C. E. Rostad, M. L. Davisson,Biogeochemistry 69, 125 (2004).
19. K. Kaiser, R. Benner, Anal. Chem. 72, 2566 (2000).20. D. L. Popham, J. Helin, C. E. Costello, P. Setlow, J.
Bacteriol. 178, 6451 (1996).21. We modified the method provided in (20) and hy-
drolyzed samples (in 4 N HCl) overnight at 90-C. Werecovered no muramic acid and only small amountsof glucosamine and galactosamine from surface sam-ples. This modified hydrolysis method was tested onchitin oligomers, peptidoglycan (from Bacillus subtilus),and bacterial cells (mixed laboratory culture) to ensurethe quantitative (990%) recovery of glucosamine andde-acetylated muramic acid. We assessed amino sugarrecoveries by high-performance liquid chromatogra-phy and fluorescence detection of o-phthaldialdehyde-derivatized samples (15) or gas chromatography afterderivatizing to alditol acetates (10).
22. J. I. Hedges et al., Org. Geochem. 31, 945 (2000).23. O. Hadja, Anal. Biochem. 60, 512 (1974).24. Y. Nagata, T. Fujiwara, K. Kawaguchinagata, Y. Fukumori,
T. Yamanaka, Biochim. Biophys. Acta 1379, 76 (1998).25. J. S. Martinez et al., Science 287, 1245 (2000).26. B. Palenik, S. E. Henson, Limnol. Oceanogr. 42, 1544
(1997).27. M. T. Cottrell, D. L. Kirchman, Appl. Environ. Microbiol.
66, 1692 (2000).28. A. L. Svitil, D. L. Kirchman, Microbiol. 144, 1299 (1998).29. M. T. Cottrell, D. N. Wood, L. Yu, D. L. Kirchman,
Appl. Environ. Microbiol. 66, 1195 (2000).30. H. Knicker, P. G. Hatcher, Naturwissenschaften 84, 231
(1997).31. R. G. Keil, D. L. Kirchman, Mar. Chem. 45, 187 (1994).32. E. Tanoue, S. Nishiyana, M. Kamo, A. Tsugita, Geochim.
Cosmochim. Acta 59, 2643 (1995).33. We thank A. Beilecki, then at Bruker Instruments, for
assistance with 15N-NMR spectroscopy; M. Pullin andD. Albert for assistance in the determination of aceticacid; and the staff at the Natural Energy Laboratory inKona, Hawaii, and E. Smith for assistance in samplecollection. Supported by the Chemical and BiologicalOceanography Programs at the National Science Foun-dation; the Carbon Sequestration Program at the U.S.Department of Energy; the Rhinehart Coastal ResearchCenter of the Woods Hole Oceanographic Institution;and the Fundacion Andes, Chile.
20 December 2004; accepted 9 March 200510.1126/science.1108925
Assessing Methane Emissions fromGlobal Space-Borne ObservationsC. Frankenberg,1 J. F. Meirink,2 M. van Weele,2 U. Platt,1 T. Wagner1
In the past two centuries, atmospheric methane has more than doubled andnow constitutes 20% of the anthropogenic climate forcing by greenhousegases. Yet its sources are not well quantified, introducing uncertainties in itsglobal budget. We retrieved the global methane distribution by using space-borne near-infrared absorption spectroscopy. In addition to the expectedlatitudinal gradient, we detected large-scale patterns of anthropogenic andnatural methane emissions. Furthermore, we observed unexpectedly highmethane concentrations over tropical rainforests, revealing that emissioninventories considerably underestimated methane sources in these regionsduring the time period of investigation (August through November 2003).
Methane (CH4) is, after carbon dioxide (CO
2),
the second most important anthropogenic
greenhouse gas (1). It also has an indirect
effect on climate through chemical feedbacks
(1, 2). More than 50% of present-day global
methane emissions are anthropogenic, the
largest contributors being fossil fuel produc-
tion, ruminants, rice cultivation, and waste
handling (3). The natural source strength of
CH4, mainly constituted by wetlands, is
particularly uncertain, because these emis-
sions vary considerably in time and space
(4, 5) and available ground-based measure-
ments are sparse, albeit precise, and limitedly
representative at larger scales. Better knowl-
1Institute of Environmental Physics, University ofHeidelberg, INF 229, 69120 Heidelberg, Germany.2Section of Atmospheric Composition, Royal Nether-lands Meteorological Institute, Post Office Box 201,3730 AE De Bilt, Netherlands.
R E P O R T S
13 MAY 2005 VOL 308 SCIENCE www.sciencemag.org1010

42
Chapter Two
To cite articles from Chapter Two of this booklet, please use the following format: [Author name(s)] in Microbial Carbon Pump in the Ocean, N. Jiao, F. Azam, S. Sanders, Eds. (Science/AAAS, Washington, DC, 2011), pp. xx-xx.
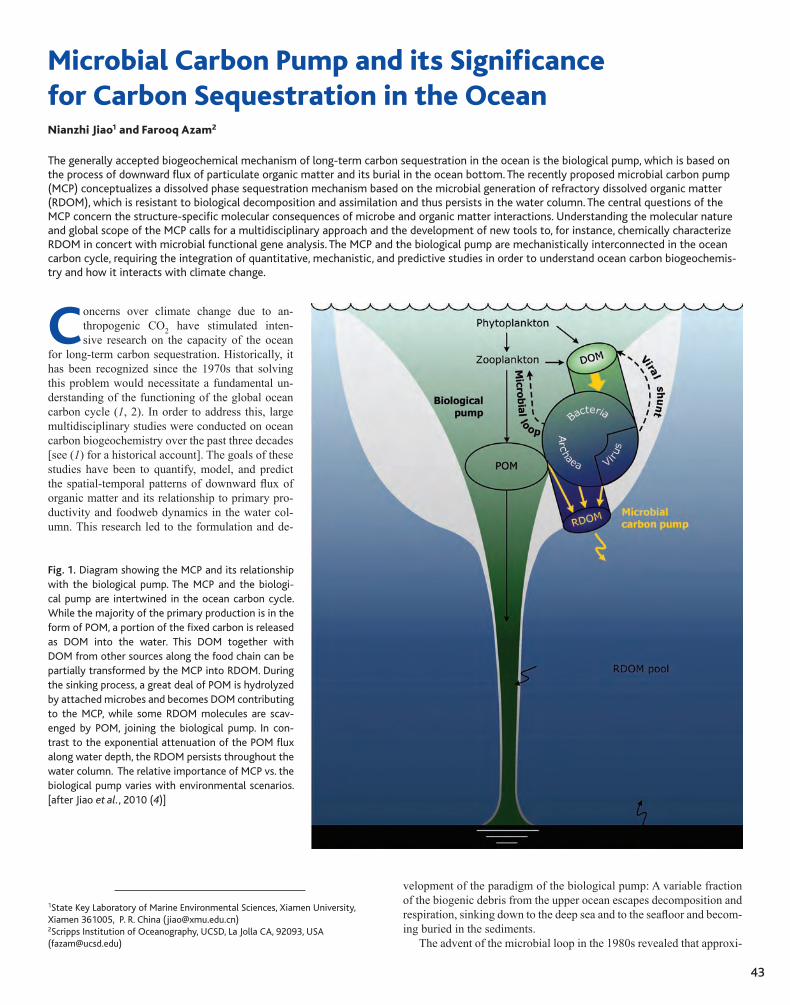
43
Concerns over climate change due to an-thropogenic CO2 have stimulated inten-sive research on the capacity of the ocean
for long-term carbon sequestration. Historically, it has been recognized since the 1970s that solving this problem would necessitate a fundamental un-derstanding of the functioning of the global ocean carbon cycle (1, 2). In order to address this, large multidisciplinary studies were conducted on ocean carbon biogeochemistry over the past three decades [see (1) for a historical account]. The goals of these studies have been to quantify, model, and predict the spatial�temporal patterns of downward flux of organic matter and its relationship to primary pro-ductivity and foodweb dynamics in the water col-umn. This research led to the formulation and de-
velopment of the paradigm of the biological pump: A variable fraction of the biogenic debris from the upper ocean escapes decomposition and respiration, sinking down to the deep sea and to the seafloor and becom-ing buried in the sediments.
The advent of the microbial loop in the 1980s revealed that approxi-
Fig. 1. Diagram showing the MCP and its relationship with the biological pump. The MCP and the biologi-cal pump are intertwined in the ocean carbon cycle. While the majority of the primary production is in the form of POM, a portion of the fixed carbon is released as DOM into the water. This DOM together with DOM from other sources along the food chain can be partially transformed by the MCP into RDOM. During the sinking process, a great deal of POM is hydrolyzed by attached microbes and becomes DOM contributing to the MCP, while some RDOM molecules are scav-enged by POM, joining the biological pump. In con-trast to the exponential attenuation of the POM flux along water depth, the RDOM persists throughout the water column. The relative importance of MCP vs. the biological pump varies with environmental scenarios. [after Jiao et al., 2010 (4)]
Microbial Carbon Pump and its Significance for Carbon Sequestration in the OceanNianzhi Jiao1 and Farooq Azam2
The generally accepted biogeochemical mechanism of long-term carbon sequestration in the ocean is the biological pump, which is based on the process of downward flux of particulate organic matter and its burial in the ocean bottom. The recently proposed microbial carbon pump (MCP) conceptualizes a dissolved phase sequestration mechanism based on the microbial generation of refractory dissolved organic matter (RDOM), which is resistant to biological decomposition and assimilation and thus persists in the water column. The central questions of the MCP concern the structure-specific molecular consequences of microbe and organic matter interactions. Understanding the molecular nature and global scope of the MCP calls for a multidisciplinary approach and the development of new tools to, for instance, chemically characterize RDOM in concert with microbial functional gene analysis. The MCP and the biological pump are mechanistically interconnected in the ocean carbon cycle, requiring the integration of quantitative, mechanistic, and predictive studies in order to understand ocean carbon biogeochemis-try and how it interacts with climate change.
1State Key Laboratory of Marine Environmental Sciences, Xiamen University, Xiamen 361005, P. R. China ([email protected])
2Scripps Institution of Oceanography, UCSD, La Jolla CA, 92093, USA ([email protected])
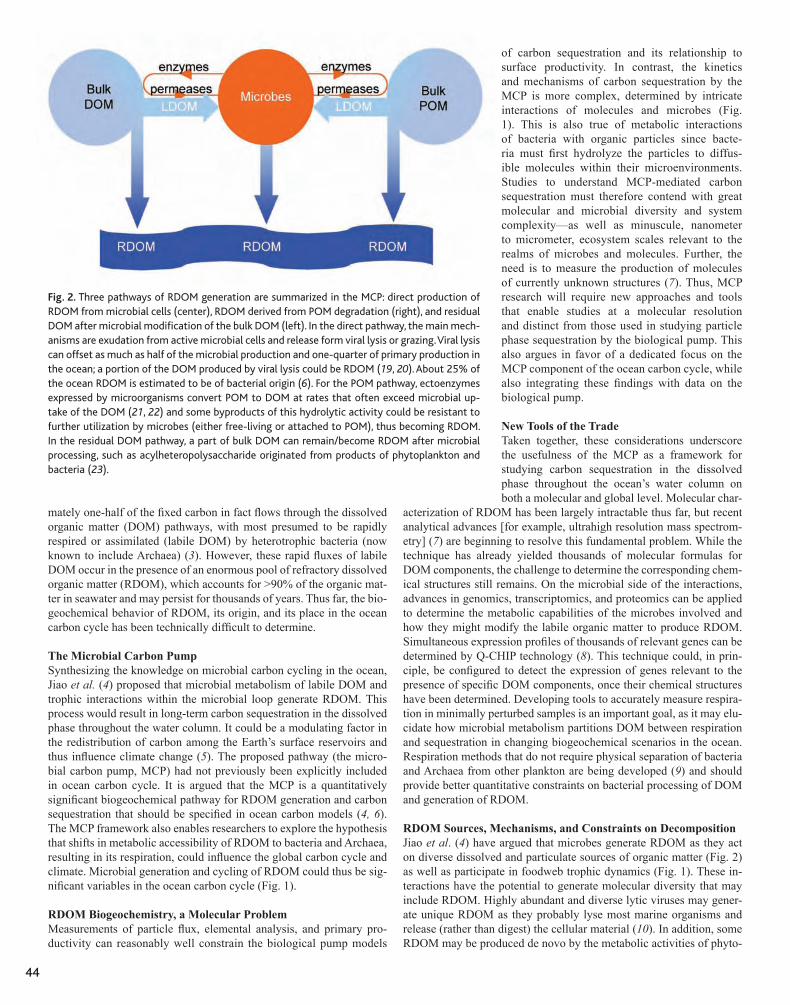
44
mately one�half of the fixed carbon in fact flows through the dissolved organic matter (DOM) pathways, with most presumed to be rapidly respired or assimilated (labile DOM) by heterotrophic bacteria (now known to include Archaea) (3). However, these rapid fluxes of labile DOM occur in the presence of an enormous pool of refractory dissolved organic matter (RDOM), which accounts for >90% of the organic mat-ter in seawater and may persist for thousands of years. Thus far, the bio-geochemical behavior of RDOM, its origin, and its place in the ocean carbon cycle has been technically difficult to determine.
The Microbial Carbon PumpSynthesizing the knowledge on microbial carbon cycling in the ocean, Jiao et al. (4) proposed that microbial metabolism of labile DOM and trophic interactions within the microbial loop generate RDOM. This process would result in long-term carbon sequestration in the dissolved phase throughout the water column. It could be a modulating factor in the redistribution of carbon among the Earth’s surface reservoirs and thus influence climate change (5). The proposed pathway (the micro-bial carbon pump, MCP) had not previously been explicitly included in ocean carbon cycle. It is argued that the MCP is a quantitatively significant biogeochemical pathway for RDOM generation and carbon sequestration that should be specified in ocean carbon models (4, 6). The MCP framework also enables researchers to explore the hypothesis that shifts in metabolic accessibility of RDOM to bacteria and Archaea, resulting in its respiration, could influence the global carbon cycle and climate. Microbial generation and cycling of RDOM could thus be sig-nificant variables in the ocean carbon cycle (Fig. 1).
RDOM Biogeochemistry, a Molecular ProblemMeasurements of particle flux, elemental analysis, and primary pro-ductivity can reasonably well constrain the biological pump models
of carbon sequestration and its relationship to surface productivity. In contrast, the kinetics and mechanisms of carbon sequestration by the MCP is more complex, determined by intricate interactions of molecules and microbes (Fig. 1). This is also true of metabolic interactions of bacteria with organic particles since bacte-ria must first hydrolyze the particles to diffus-ible molecules within their microenvironments. Studies to understand MCP-mediated carbon sequestration must therefore contend with great molecular and microbial diversity and system complexity—as well as minuscule, nanometer to micrometer, ecosystem scales relevant to the realms of microbes and molecules. Further, the need is to measure the production of molecules of currently unknown structures (7). Thus, MCP research will require new approaches and tools that enable studies at a molecular resolution and distinct from those used in studying particle phase sequestration by the biological pump. This also argues in favor of a dedicated focus on the MCP component of the ocean carbon cycle, while also integrating these findings with data on the biological pump.
New Tools of the TradeTaken together, these considerations underscore the usefulness of the MCP as a framework for studying carbon sequestration in the dissolved phase throughout the ocean’s water column on both a molecular and global level. Molecular char-
acterization of RDOM has been largely intractable thus far, but recent analytical advances [for example, ultrahigh resolution mass spectrom-etry] (7) are beginning to resolve this fundamental problem. While the technique has already yielded thousands of molecular formulas for DOM components, the challenge to determine the corresponding chem-ical structures still remains. On the microbial side of the interactions, advances in genomics, transcriptomics, and proteomics can be applied to determine the metabolic capabilities of the microbes involved and how they might modify the labile organic matter to produce RDOM. Simultaneous expression profiles of thousands of relevant genes can be determined by Q-CHIP technology (8). This technique could, in prin-ciple, be configured to detect the expression of genes relevant to the presence of specific DOM components, once their chemical structures have been determined. Developing tools to accurately measure respira-tion in minimally perturbed samples is an important goal, as it may elu-cidate how microbial metabolism partitions DOM between respiration and sequestration in changing biogeochemical scenarios in the ocean. Respiration methods that do not require physical separation of bacteria and Archaea from other plankton are being developed (9) and should provide better quantitative constraints on bacterial processing of DOM and generation of RDOM.
RDOM Sources, Mechanisms, and Constraints on DecompositionJiao et al. (4) have argued that microbes generate RDOM as they act on diverse dissolved and particulate sources of organic matter (Fig. 2) as well as participate in foodweb trophic dynamics (Fig. 1). These in-teractions have the potential to generate molecular diversity that may include RDOM. Highly abundant and diverse lytic viruses may gener-ate unique RDOM as they probably lyse most marine organisms and release (rather than digest) the cellular material (10). In addition, some RDOM may be produced de novo by the metabolic activities of phyto-
Fig. 2. Three pathways of RDOM generation are summarized in the MCP: direct production of RDOM from microbial cells (center), RDOM derived from POM degradation (right), and residual DOM after microbial modification of the bulk DOM (left). In the direct pathway, the main mech-anisms are exudation from active microbial cells and release form viral lysis or grazing. Viral lysis can offset as much as half of the microbial production and one-quarter of primary production in the ocean; a portion of the DOM produced by viral lysis could be RDOM (19, 20). About 25% of the ocean RDOM is estimated to be of bacterial origin (6). For the POM pathway, ectoenzymes expressed by microorganisms convert POM to DOM at rates that often exceed microbial up-take of the DOM (21, 22) and some byproducts of this hydrolytic activity could be resistant to further utilization by microbes (either free-living or attached to POM), thus becoming RDOM. In the residual DOM pathway, a part of bulk DOM can remain/become RDOM after microbial processing, such as acylheteropolysaccharide originated from products of phytoplankton and bacteria (23).

45
plankton or bacteria (mechanistically distinct from the bacteria acting on organic matter). New approaches are already emerging to quantify the overall contribution of microbes to RDOM generation (6) and fu-ture analyses need to identify the dominant pathways within the MCP and the necessary ecosystem conditions for RDOM formation. While MCP studies are mainly focused on the contribution of microbes to car-bon sequestration, other biotic and abiotic RDOM sources should also be taken into consideration when carbon budget and age are concerned. For example, the old DOM from seafloor seeps (11, 12) may not neces-sarily be all RDOM (13).
Understanding the MCP also challenges scientists to elucidate the mechanistic underpinnings of RDOM generation, which will be es-sential for developing refined models of carbon sequestration. There is good reason to believe that the mechanisms of RDOM generation will eventually be revealed at the biochemical level. For example, it was recently demonstrated that incomplete hydrolysis of organic mat-ter by bacterial ectohydrolases could lead to RDOM formation (14). Further, bacterial ectohydrolases have already been shown to be central to connecting the biological pump with the MCP, particularly through particle hydrolysis (15).
A question of great interest is why bacteria and Archaea do not me-tabolize RDOM. This question is critical for predicting long�term net carbon sequestration in the dissolved phase. Highlighting this long-standing question in the context of the MCP is stimulating research on whether the persistence of RDOM could be due to the extreme dilution of individual molecular species, making their utilization en-ergetically unfavorable for bacteria and Archaea (7). Another unan-swered question is whether there are structural constraints on RDOM decomposition. This should benefit from the development of model systems of known RDOM components (currently none is known) and bacteria.
Integration of MCP and Biological PumpThe MCP and the biological pump are mechanistically intertwined in the ocean carbon cycle, a fact that necessitates integrated research strategies. For example, bacteria act on sinking particles to cause quantitatively major particulate organic matter (POM) to DOM flux, some of which may become RDOM. Conversely, sinking particles can scavenge RDOM from seawater and carry it into the carbon sequestration process of the biological pump. The interconnection between the MCP and the biological pump is also apparent from the concept that organic matter cannot be neatly divided into DOM and POM, but instead exists as a continuum of small molecules to large sinking particles (16–18). Therefore, the realms of the MCP and the biological pump can overlap as microbes and other organisms interact with the organic matter continuum and among themselves to create overlapping yet distinctive patterns of carbon cycling and sequestration. This view of the organic matter continuum underscores a need for an integrated approach to further our understanding of the mechanistic and predictive nature of the carbon cycle. Further, a “cultural integration” of the biological pump community and the emergent MCP community could move us towards this goal.
FutureThe unfolding climate change scenarios will demand a quantitative, mechanistic, and predictive understanding of ocean carbon biogeo-chemistry to guide policy and advise the global society on adaptive measures. Explicit incorporation of the MCP into the concept and mod-els of the ocean carbon cycle will be essential and will require new emphasis on methods development and global ocean field programs. It is important that the MCP community collaborates closely with other geochemists and biogeochemists to develop an integrated view of the ocean carbon cycle and its response to climate change.
References and Notes1. E. A. Laws, P. G. Falkowski, W. O. Smith Jr, H. Ducklow, J. J. McCarthy,
Global Biogeochem. Cy. 14, 1231 (2000).2. K. L. Denman, M. A. Pena, in The changing ocean carbon cycle: a midterm
synthesis of the Joint Global Ocean Flux Study, R. B. Hanson, H. W. Ducklow, J. G. Field, Eds. (Cambridge Univ. Press, New York, 2000), pp. 469–490.
3. F. Azam et al., Mar. Ecol. Prog. Ser. 10, 257 (1983).4. N. Jiao et al., Nat. Rev. Microbiol. 8, 593 (2010).5. P. F. Sexton et al., Nature 471, 349 (2011).6. R. Benner, G. Herndl, in Microbial Carbon Pump in the Ocean, N. Jiao, F.
Azam, S. Sanders, Eds. (Science/AAAS, Washington, DC, 2011), pp. 46–48.7. G. Kattner, M. Simon, B.P. Koch, in Microbial Carbon Pump in the Ocean, N.
Jiao, F. Azam, S. Sanders, Eds. (Science/AAAS, Washington, DC, 2011), pp. 60–61.
8. J. D. Van Nostrand, J. Zhou, in Microbial Carbon Pump in the Ocean, N. Jiao, F. Azam, S. Sanders, Eds. (Science/AAAS, Washington, DC, 2011), pp. 64–65.
9. C. Robinson, N. Ramaiah, in Microbial Carbon Pump in the Ocean, N. Jiao, F. Azam, S. Sanders, Eds. (Science/AAAS, Washington, DC, 2011), pp. 52–53.
10. M. G. Weinbauer, F. Chen, S. W. Wilhelm, in Microbial Carbon Pump in the Ocean, N. Jiao, F. Azam, S. Sanders, Eds. (Science/AAAS, Washington, DC, 2011), pp. 54–56.
11. J. W. Pohlman, J. E. Bauer, W. F. Waite, C. L. Osburn, N. R. Chapman, Nat. Geosci. 4, 37 (2011).
12. M. D. McCarthy et al., Nat. Geosci. 4, 32 (2011).13. Not all fossil components of the DOM entering the water column
through seabed seeps are refractory; some are readily available for
microbial respiration and thus do not contribute to carbon sequestration. However, being much older than the biogenic DOM, they would increase the radiocarbon age of the DOM pool. Only that DOM which is resistent to microbial respiration/decompostion, whether biogenic or fossil in origin, can persist in the water column for a long time, constituting carbon sequestration.
14. H. Ogawa, Y. Amagai, I. Koike, K. Kaiser, R. Benner, Science 292, 917 (2001).15. D. C. Smith, M. Simon, A. L. Alldredge, F. Azam, Nature 359, 139 (1992).16. F. Azam, Science 280, 694 (1998).17. F. Azam, A. Z. Worden, Science 303, 1622 (2004).18. P. Verdugo et al., Mar. Chem. 92, 67 (2004).19. T. Nagata, D. L. Kirchman, in Mortality of Microbes in Aquatic Environments,
Microbial Biosystems: New Frontiers, Proceedings of the 8th International Symposium on Microbial Ecology C. R. Bell, M. Brylinsky, P. Johnson-Green, Eds. (Halifax, Canada, 1999), pp. 153–158.
20. K. E. Stoderegger, G. J. Herndl, Limnol. Oceanogr. 43, 877 (1998).21. M. Karner, G. J. Herndl, Mar. Biol. 113, 341 (1992).22. T. Nagata, H. Fukuda, R. Fukuda, I. Koike, Limnol. Oceanogr. 45, 426
(2000).23. D. J. Repeta, T. M. Quan, L. Aluwihare, A. Accardi, Geochim. Cosmochim.
Acta 66, 955 (2002).24. We thank the SCOR WG134 members, and all the authors and those
acknowledged in the Jiao et al., Nature Reviews Microbiology (2010) for discussions and comments. This work was supported by NSFC 91028001, SOA201105021 to N. Jiao, and grants from Gordon and Betty Moore foundation Marine Microbiology Initiative and the US NSF 0962721 to F. Azam. This document is based on work partially supported by the US NFS on Oceanic Research under grant number OCE-0938349.

46
About 660 petagrams (Pg; 1015 g) of dissolved organic carbon (DOC) resides in the global ocean, but the origin, formation, structure, and reactivity of this large reservoir of reduced car-
bon are largely unknown (1, 2). The vast majority of this dissolved organic matter (DOM), which includes DOC as well as other dissolved organic elements, is resistant to biodegradation and comprises carbon sequestered from the atmosphere over timescales of decades to millen-nia. The recognition that relatively small changes in the ocean reservoir of DOC can have significant impact on the atmospheric reservoir of CO2 (1, 2) has stimulated research on the mechanisms of production of semilabile and refractory DOM in the ocean. Heterotrophic bacte-ria process about half of net primary production and thereby play a dominant role in the microbial carbon pump (MCP) by altering and transforming labile forms of organic matter into refractory forms that persist in the ocean (3). This article provides a short review of bioassay experiments describing the transformation of labile to refractory DOM, the use of biomarkers to trace DOC of bacterial origin in the ocean, and the size of the ocean reservoirs of semilabile and refractory DOC produced by the MCP.
Microbial Transformations of Labile to Semilabile and Refractory DOM Early bioassay experiments demonstrating the microbial production of refractory DOM from labile substrates were conducted in natural seawater samples amended with simple 14C-labeled compounds, such as glucose and leucine (4). Rapid (between two to five days) transformations of labile substrates to semilabile and refractory forms of DOM were observed in surface and deep waters incubated in the dark for several months (4, 5). Dissolved humic substances were formed (6), and the molecular weight distribution of labeled DOM at the end of the incubations was similar to that of natural marine DOM suggesting the processes occurring in these laboratory experiments were similar to those in the ocean. It was demonstrated that bacterial capsular material is an important component of the DOM produced during these experiments (7). The yields of biorefractory DOM production from simple substrates ranged from 1 to 5% (4). These studies linked refractory DOM formation with microbial transformations, but they were not able to identify the specific microbial origins, chemical forms, or mechanisms of production of refractory DOM.
More recent bioassay experiments have added labile substrates, such as glucose and glutamate, as the sole carbon sources to artificial seawater inoculated with natural microbial assemblages. Bacteria rapidly used the added labile substrates and produced semilabile and refractory DOM that was chemically complex and included combined forms of neutral sugars, amino acids, and amino sugars (8). Bacteria shaped the composition of the DOM, and its refractory nature was demonstrated during long�term (1 to 1.5 yr) incubations. The DOM produced in these experiments was of similar composition and molecular weight distribution as natural marine DOM (9–11). Bacteria also release refractory forms of chromophoric DOM (CDOM) of varying molecular weight during the utilization of glucose (12, 13). Fluorescent components of the CDOM were resistant to photodegradation, and photochemical transformations of the DOM did not enhance its subsequent bioavailability. These experiments suggest that bacteria are a likely source of the fluorescent DOM maximum observed in the oxygen-minimum zone of the ocean (14).
The mechanisms of release of DOM from bacteria have been examined in bioassay experiments using labile substrates as sole carbon sources. The direct release of dissolved D/L�enantiomers of hydrolysable amino acids and amino sugars from bacteria was observed during exponential growth of bacterial cells (15). The bioavailability of the DOM released during cell growth was highly variable and included labile, semilabile, and refractory components. The release of dissolved amino acids from bacteria during viral lysis was observed using a model system comprising a bacterial strain and a strain�specific virus (16). Combined forms of amino acids were abundant in the lysate, and the nonprotein amino acid diaminopimelic acid, a unique component of the peptide bridge in peptidoglycan, was observed. A model system using glucose as the sole carbon source and a specific bacterium and its ciliate grazer was used to investigate the release of DOM from bacteria during grazing (17). The presence of the ciliate enhanced the production of bacterially derived DOM, but the grazing process did not appear to alter the chemical composition of the resulting DOM. The vast majority of molecular masses identified as refractory DOM at the end of the experiments were produced during the first two days of the incubation before the ciliate was added to the culture.
Taken together, these studies indicate that bacterially derived DOM is rapidly produced through direct release from growing cells, viral lysis, and protozoan grazing. Bacterially derived DOM ranges in bioavail-ability from labile to refractory. The rapid accumulation of DOM that is highly resistant to microbial degradation is both surprising and baffling. The bacterial transformation of labile to semilabile and refractory DOC occurs within hours to days at room temperature and in the dark (8). How does this happen? The exact mechanism is unclear, but the pro-cess is biologically mediated. Nonspecific enzyme activities could play
Bacterially Derived Dissolved Organic Matter in the Microbial Carbon PumpRonald Benner1* and Gerhard J. Herndl2
Most of the carbon fixed through photosynthesis is rapidly respired to CO2 by biota in the surface ocean, but a small fraction of this carbon is transformed into dissolved organic carbon (DOC) that persists for extended periods of time. Seawater bioassay experiments demonstrate that bacteria rapidly transform labile DOC to semilabile and refractory forms, suggesting enzymatic activity plays an important role in the transformation process. A fundamental understanding of this process has yet to be obtained, but the molecular signatures of the transformed DOC are observed throughout the ocean water column. Bacterial transformations in the microbial carbon pump (MCP) have sequestered about 10 Pg of semilabile DOC and about 155 Pg of refractory DOC in the global ocean. The annual production of semilabile and refractory DOC in the upper ocean MCP is estimated to be 0.74 to 2.23 Pg and 0.008 to 0.023 Pg, respectively. This sequestration of reduced carbon as semilabile and refractory DOC contributes to the regulation of greenhouse gases on decadal to millennial time scales and influences trace metal and nutrient availability.
1Department of Biological Sciences and Marine Science Program, University of South Carolina, Columbia, SC 29208, USA2Department of Marine Biology, University of Vienna, 1090 Vienna, Austria*To whom correspondence should be addressed. E-mail: [email protected]

47
Fig. 1. (A) Concentrations of total dissolved D-Aspartic acid (D-Asp), D-Glutamic acid (D-Glu), and D-Alanine (D-Ala) in the water column at the Hawaii Ocean Time Series Station Aloha (20). (B) Average concentrations of DOC derived from bacteria as calculated from the yields of total dissolved D-Asp, D-Glu, and D-Ala in the water column and the yields of these D-amino acids in bioassay experiments (20).
an important role in producing chemically complex and biologically refractory DOM (8). The existence of such a mechanism would suggest that semilabile and refractory DOM are produced largely in the upper ocean where most biological production and decomposition occur.
It is critical to link observations from laboratory experiments to the ocean carbon cycle, and the bioassay experiments provide this connection by demonstrating that semilabile and refractory DOM produced in the MCP include bacterial biomarkers such as the D�enantiomers of alanine (Ala), glutamic acid (Glu), and aspartic acid (Asp). These bacterial biomarkers can be used to trace the production, reactivity, abundance, and distribution of semilabile and refractory DOM in the ocean.
Tracing Bacterially Derived DOC and the MCP in the OceanThe contributions of bacteria to marine DOM has gained attention over the last decade following the observation that bacteria contribute to marine dissolved organic nitrogen based on the abundance of D�enantiomers of specific amino acids (D�Ala, D�Glu, D�Asp) in marine DOM (18). The L-enantiomers of amino acids are common to all organisms and are the building blocks of proteins, whereas specific D�enantiomers are synthesized by bacteria and incorporated into a variety of unusual cell wall and membrane molecules (19–21). The D�amino acids are ubiquitous in marine DOM and particulate organic matter and are most useful for tracing bacterial contributions because they can be measured directly in seawater without preconcentration, they are found in all marine bacteria and bacterially derived DOM, they occur in a variety of biochemical components of bacterial cells, and they are not known to occur in combined form in any marine organisms besides bacteria (15, 20, 22–25). Other bacterial biomarkers have been observed in DOM, including muramic acid (26), diaminopimelic acid (27), and short-chain 3-hydroxy fatty acids (28), further indicating the diversity of bacterially derived compounds in seawater DOM.
The concentrations and depth distribution of total dissolved D�Ala, D�Glu, and D�Asp in the water column at the Hawaii Ocean Time Series Station Aloha are shown in Fig. 1A. Concentrations of individual D�amino acids range from 4 to 12 nM in surface waters and decline by approximately 70% at a depth of 750 m. The D�amino acids removed in the upper 750 m are considered to be components of semilabile DOM
based on ventilation ages (years to decades) for these water masses (10). The concentrations of individual D�amino acids in deep waters (2500 and 4000 m) are low (1 to 4 nM) and relatively constant, indicating the refractory nature of bacterially derived DOM in the deep ocean (20). The yields of D�amino acids (D�Asp, D�Ala, D�Glu) can be used to estimate the bacterial contributions to DOC in the ocean (20). Based on these three D�amino acid biomarkers, the average concentrations of bacterially derived DOC in the water column at Station Aloha are shown in Fig. 1B. Concentrations of bacterially derived DOC range from ~7 to 25 μM, indicating the MCP is a major source of semilabile and refractory DOC in the ocean.
The Ocean Reservoir of Semilabile and Refractory DOC Derived from the MCP
The ocean reservoir of DOC is chemically complex and has multiple origins (29–32). The MCP contributes to the semilabile and refractory DOC reservoirs, and bacterial biomarkers provide an approach for tracing and quantifying the contributions of the MCP to marine DOC. The D�amino acid biomarkers have been used to estimate that about 25% of the DOC throughout the ocean water column is of bacterial origin (20). The global ocean reservoir of DOC is estimated to be approximately 660 Pg, with about 40 Pg in the form of semilabile DOC and the remaining 620 Pg in the form of refractory DOC (33). Based on these totals and the fraction of bacterially derived DOC in each reservoir, approximately 10 Pg of semilabile DOC and approximately 155 Pg of refractory DOC of bacterial origin reside in the global ocean (Fig. 2).
The rates of production of semilabile and refractory DOM in the MCP can be estimated from the annual rate of heterotrophic bacterial production in the upper ocean and the efficiency of DOC release from bacteria. This approach assumes that bacteria use, alter, and transform the fixed carbon derived from primary production that is not respired and remineralized to CO2 in the euphotic zone. Furthermore, it assumes that bacterial production, a measurable quantity, is representative of these activities. Bacterial production in the upper ocean is estimated to be approximately 15% of net primary production (34), or about 7.5 PgC y-1. If it is assumed that 10 to 30% of bacterial production is released as DOC in the MCP (35), this means that 0.75 to 2.25 Pg of DOC is produced annually in the upper ocean MCP. Bioassay
A B
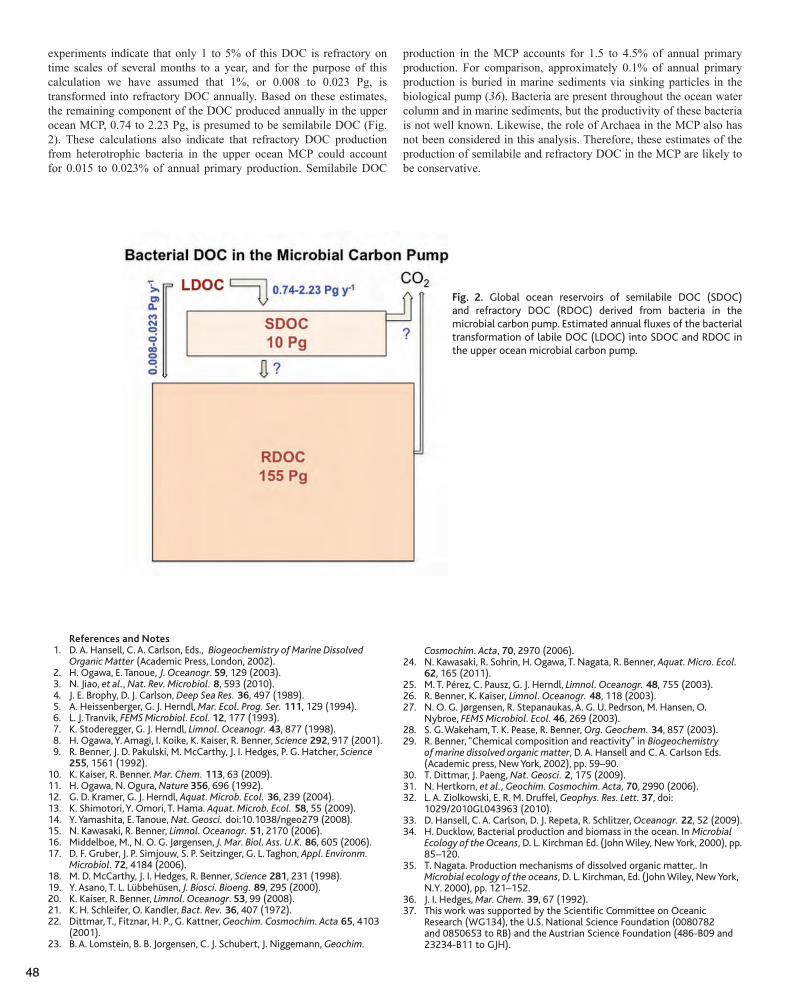
48
experiments indicate that only 1 to 5% of this DOC is refractory on time scales of several months to a year, and for the purpose of this calculation we have assumed that 1%, or 0.008 to 0.023 Pg, is transformed into refractory DOC annually. Based on these estimates, the remaining component of the DOC produced annually in the upper ocean MCP, 0.74 to 2.23 Pg, is presumed to be semilabile DOC (Fig. 2). These calculations also indicate that refractory DOC production from heterotrophic bacteria in the upper ocean MCP could account for 0.015 to 0.023% of annual primary production. Semilabile DOC
production in the MCP accounts for 1.5 to 4.5% of annual primary production. For comparison, approximately 0.1% of annual primary production is buried in marine sediments via sinking particles in the biological pump (36). Bacteria are present throughout the ocean water column and in marine sediments, but the productivity of these bacteria is not well known. Likewise, the role of Archaea in the MCP also has not been considered in this analysis. Therefore, these estimates of the production of semilabile and refractory DOC in the MCP are likely to be conservative.
References and Notes1. D. A. Hansell, C. A. Carlson, Eds., Biogeochemistry of Marine Dissolved
Organic Matter (Academic Press, London, 2002).2. H. Ogawa, E. Tanoue, J. Oceanogr. 59, 129 (2003).3. N. Jiao, et al., Nat. Rev. Microbiol. 8, 593 (2010). 4. J. E. Brophy, D. J. Carlson, Deep Sea Res. 36, 497 (1989).5. A. Heissenberger, G. J. Herndl, Mar. Ecol. Prog. Ser. 111, 129 (1994).6. L. J. Tranvik, FEMS Microbiol. Ecol. 12, 177 (1993). 7. K. Stoderegger, G. J. Herndl, Limnol. Oceanogr. 43, 877 (1998).8. H. Ogawa, Y. Amagi, I. Koike, K. Kaiser, R. Benner, Science 292, 917 (2001).9. R. Benner, J. D. Pakulski, M. McCarthy, J. I. Hedges, P. G. Hatcher, Science
255, 1561 (1992).10. K. Kaiser, R. Benner. Mar. Chem. 113, 63 (2009). 11. H. Ogawa, N. Ogura, Nature 356, 696 (1992).12. G. D. Kramer, G. J. Herndl, Aquat. Microb. Ecol. 36, 239 (2004).13. K. Shimotori, Y. Omori, T. Hama. Aquat. Microb. Ecol. 58, 55 (2009).14. Y. Yamashita, E. Tanoue, Nat. Geosci. doi:10.1038/ngeo279 (2008).15. N. Kawasaki, R. Benner, Limnol. Oceanogr. 51, 2170 (2006).16. Middelboe, M., N. O. G. Jørgensen, J. Mar. Biol. Ass. U.K. 86, 605 (2006).17. D. F. Gruber, J. P. Simjouw, S. P. Seitzinger, G. L. Taghon, Appl. Environm.
Microbiol. 72, 4184 (2006).18. M. D. McCarthy, J. I. Hedges, R. Benner, Science 281, 231 (1998).19. Y. Asano, T. L. Lübbehüsen, J. Biosci. Bioeng. 89, 295 (2000).20. K. Kaiser, R. Benner, Limnol. Oceanogr. 53, 99 (2008).21. K. H. Schleifer, O. Kandler, Bact. Rev. 36, 407 (1972).22. Dittmar, T., Fitznar, H. P., G. Kattner, Geochim. Cosmochim. Acta 65, 4103
(2001).23. B. A. Lomstein, B. B. Jorgensen, C. J. Schubert, J. Niggemann, Geochim.
Cosmochim. Acta, 70, 2970 (2006).24. N. Kawasaki, R. Sohrin, H. Ogawa, T. Nagata, R. Benner, Aquat. Micro. Ecol.
62, 165 (2011).25. M. T. Pérez, C. Pausz, G. J. Herndl, Limnol. Oceanogr. 48, 755 (2003). 26. R. Benner, K. Kaiser, Limnol. Oceanogr. 48, 118 (2003).27. N. O. G. Jørgensen, R. Stepanaukas, A. G. U. Pedrson, M. Hansen, O.
Nybroe, FEMS Microbiol. Ecol. 46, 269 (2003).28. S. G. Wakeham, T. K. Pease, R. Benner, Org. Geochem. 34, 857 (2003).29. R. Benner, “Chemical composition and reactivity” in Biogeochemistry
of marine dissolved organic matter, D. A. Hansell and C. A. Carlson Eds. (Academic press, New York, 2002), pp. 59–90.
30. T. Dittmar, J. Paeng, Nat. Geosci. 2, 175 (2009).31. N. Hertkorn, et al., Geochim. Cosmochim. Acta, 70, 2990 (2006).32. L. A. Ziolkowski, E. R. M. Druffel, Geophys. Res. Lett. 37, doi:
1029/2010GL043963 (2010).33. D. Hansell, C. A. Carlson, D. J. Repeta, R. Schlitzer, Oceanogr. 22, 52 (2009).34. H. Ducklow, Bacterial production and biomass in the ocean. In Microbial
Ecology of the Oceans, D. L. Kirchman Ed. (John Wiley, New York, 2000), pp. 85–120.
35. T. Nagata. Production mechanisms of dissolved organic matter,. In Microbial ecology of the oceans, D. L. Kirchman, Ed. (John Wiley, New York, N.Y. 2000), pp. 121–152.
36. J. I. Hedges, Mar. Chem. 39, 67 (1992).37. This work was supported by the Scientific Committee on Oceanic
Research (WG134), the U.S. National Science Foundation (0080782 and 0850653 to RB) and the Austrian Science Foundation (486-B09 and 23234-B11 to GJH).
Fig. 2. Global ocean reservoirs of semilabile DOC (SDOC) and refractory DOC (RDOC) derived from bacteria in the microbial carbon pump. Estimated annual fluxes of the bacterial transformation of labile DOC (LDOC) into SDOC and RDOC in the upper ocean microbial carbon pump.

49
Discovery of Photoheterotrophic Bacteria in the OceanIn 2000, two independent studies documented the widespread ability of marine bacteria to utilize light energy. In the first article, which appeared in the September 14 issue of Nature, Kolber et al. (1) reported the observation of distinct signals of bacteriochlorophyll a-containing microorganisms in the surface waters of the tropical Pacific. The recorded signals were linked with the presence of aerobic anoxygenic phototrophic (AAP) bacteria. These organisms contain bacteriochlorophyll a as the main light-harvesting pigment but, in contrast to purple nonsulfur photosynthetic bacteria, they are obligate aerobes requiring oxygen for their metabolism and growth (2, 3). Only one day later, Béjà et al. (4) announced in Science the discovery of a new rhodopsin gene in DNA samples recovered from Monterey Bay in California. Rhodopsins are well�known membrane proteins serving as photoreceptor molecules in Metazoa, including humans, or as proton pumps in halophilic Archaea, but until Béjà’s report they were not thought to be present in Proteobacteria. For this reason the newly discovered protein was termed proteorhodopsin (PR) to make a clear distinction from the only distantly related archaeal bacteriorhodopsins and visual rhodopsins (see box on right).
These and follow up studies (5–7) have attracted significant scientif-ic attention. The ability to use light energy challenged the classical view of marine bacteria as strictly heterotrophic organisms fully dependent on recycling dissolved organic matter (DOM) produced by photoautotro-phic phytoplankton (Fig. 1). An important turning point represented the identification of the PR gene in a SAR11 isolate, Pelagibacter ubique (8). The SAR11 clade represents the most abundant bacterial group inhabit-ing the upper ocean (9), which suggests that photoheterotrophy could be a common phenomenon.
Light Utilization in Photoheterotrophic BacteriaThe phototrophic competence of AAP and PR�containing bacteria, and the way they use light as an energy source, remains a matter of ongoing research. These organisms contain photochemically active reaction centers, but are not able to grow photoautotrophically, as they require a supply of organic carbon (3, 5, 10–12). Experiments with Erythrobacter sp. NAP1 and Dokdonia sp. MED134 revealed light�enhanced CO2 incorporation, however the activity was only weak, likely reflecting enhanced anaplerotic carboxylation activity (5, 11). In AAP bacteria, light has been shown to inhibit respiration and stimulate synthesis of ATP, which indicates that photophosphorylation replaces oxidative phosphorylation (12, 13). Physiological experiments conducted with heterologously expressed PR proteins demonstrated that light exposure
led to the formation of proton gradients across the membrane (4, 14), which also confirms that PR drives photophosphorylation and provides ATP for cellular metabolism. Thus, AAP and PR�containing bacteria are photoheterotrophic organisms, as they use light energy to supplement their primarily heterotrophic metabolism. The ability to use light energy could allow phototrophs to store more carbon (which would otherwise be respired) in their biomass. Indeed, light-enhanced biomass accumulation has been repeatedly confirmed in AAP bacteria (5, 15, 16), but in PR�containing organisms the situation is less clear. The first experiments showed no growth stimulation by light in Pelagibacter ubique (8). In contrast, later work with Dokdonia sp. MED134 and Vibrio sp. AND4 demonstrated enhanced growth and better survival under starvation conditions when the bacteria were exposed to light, indicating that PR provided energy for growth (17, 18).
Distibution of PhotoheterotrophsIn his pioneering paper, Kolber et al. (1) hypothesized that the abil-ity to utilize light might be beneficial especially in nutrient�poor en-vironments. The first quantification of PR�containing bacteria was attempted from the frequency of PR genes in metagenomic libraries. Using samples from the Mediterranean and Red Sea, it was estimated that PR genes were present in 13% of total bacteria (19). A more di-rect approach was used in the waters of the North Atlantic, applying quantitative polymerase chain reaction technique. It was found that PR�containing bacteria represented between 9 and 53% of total bacteria
Role of Photoheterotrophic Bacteria in the Marine Carbon CycleMichal Koblížek
Uncovering the ecological role of photoheterotrophic bacteria in the ocean is one of the main accomplishments of marine microbiology of the past decade. Marine photoheterotrophs include two main groups: Aerobic anoxygenic phototrophic (AAP) bacteria and proteorhodopsin (PR)-containing bacteria. These organisms make up large fractions of the microbial communities inhabiting the euphotic zone of world‘s oceans. In spite of similar metabolisms, AAP and PR-containing bacteria differ in their photochemistry, physiology, and ecology. The ability to use light energy appears to allow more economical utilization of dissolved organic matter, which implies that photoheterotrophic bacteria may play a unique role in the microbial carbon pump.
MARINE PHOTOHETEROTROPHIC ORGANISMS
Aerobic Anoxygenic Phototrophic (AAP) BacteriaThese organisms harvest light by bacteriochlorophylls and carotenoids. The excitation energy is transferred to pheophytin-quinone-type reaction centers, which drive the electron transport and ATP synthesis. In contrast to their close relatives, purple photosynthetic bacteria, AAP bacteria are strict aerobes. They do not form a compact phylogenetic group, being scattered among a number of clades of Alpha-, Beta-, and Gammaproteobacteria.
Proteorhodopsin-containing BacteriaProteorhodopsin is a pigment protein composed of the protein moiety, opsin, and a pigment cofactor, retinal. Proteorhodopsins are analogous to visual rhodopsins and bacteriorhodopsins found in Archaea. The absorption of light by retinal causes the translocation of protons across the membrane driving ATP synthesis (Photophosphorylation). PR genes were found in a number of species including Alpha� and Gammaproteobacteria, Flavobacteria, Actinobacteria, and Archaea.
Institute of Microbiology CAS, Opatovický mlýn, 379 81 Trebon, Czech Republic
E-mail: [email protected]
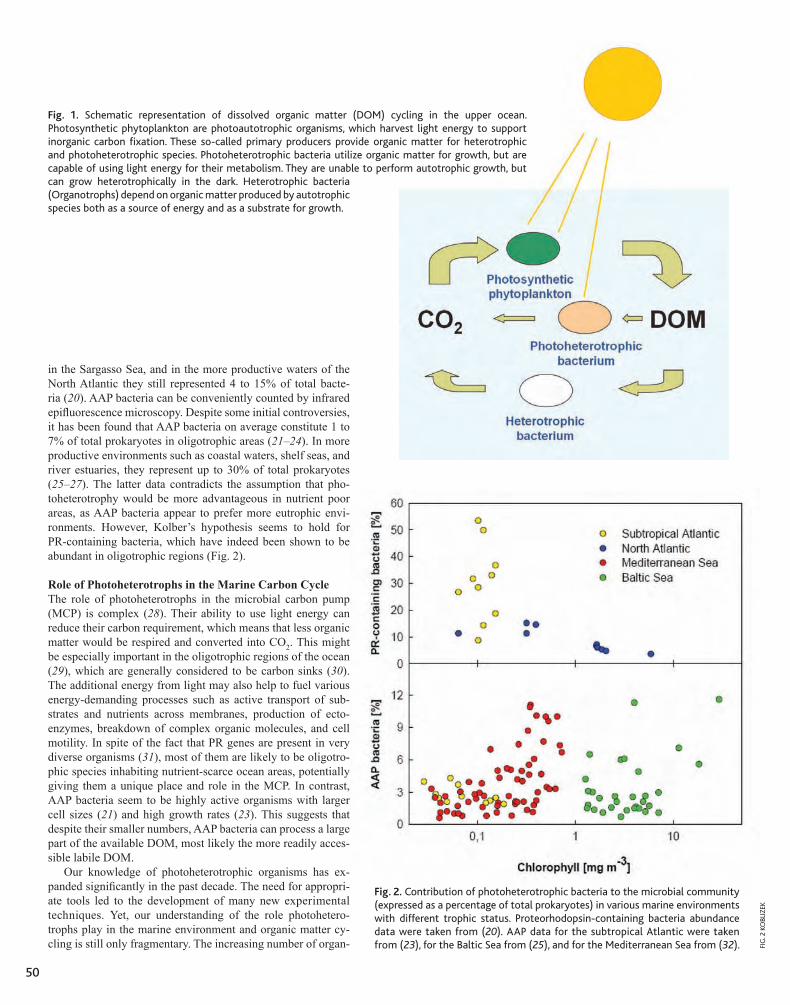
50
in the Sargasso Sea, and in the more productive waters of the North Atlantic they still represented 4 to 15% of total bacte-ria (20). AAP bacteria can be conveniently counted by infrared epifluorescence microscopy. Despite some initial controversies, it has been found that AAP bacteria on average constitute 1 to 7% of total prokaryotes in oligotrophic areas (21–24). In more productive environments such as coastal waters, shelf seas, and river estuaries, they represent up to 30% of total prokaryotes (25–27). The latter data contradicts the assumption that pho-toheterotrophy would be more advantageous in nutrient poor areas, as AAP bacteria appear to prefer more eutrophic envi-ronments. However, Kolber’s hypothesis seems to hold for PR�containing bacteria, which have indeed been shown to be abundant in oligotrophic regions (Fig. 2).
Role of Photoheterotrophs in the Marine Carbon CycleThe role of photoheterotrophs in the microbial carbon pump (MCP) is complex (28). Their ability to use light energy can reduce their carbon requirement, which means that less organic matter would be respired and converted into CO2. This might be especially important in the oligotrophic regions of the ocean (29), which are generally considered to be carbon sinks (30). The additional energy from light may also help to fuel various energy-demanding processes such as active transport of sub-strates and nutrients across membranes, production of ecto-enzymes, breakdown of complex organic molecules, and cell motility. In spite of the fact that PR genes are present in very diverse organisms (31), most of them are likely to be oligotro-phic species inhabiting nutrient-scarce ocean areas, potentially giving them a unique place and role in the MCP. In contrast, AAP bacteria seem to be highly active organisms with larger cell sizes (21) and high growth rates (23). This suggests that despite their smaller numbers, AAP bacteria can process a large part of the available DOM, most likely the more readily acces-sible labile DOM.
Our knowledge of photoheterotrophic organisms has ex-panded significantly in the past decade. The need for appropri-ate tools led to the development of many new experimental techniques. Yet, our understanding of the role photohetero-trophs play in the marine environment and organic matter cy-cling is still only fragmentary. The increasing number of organ-
Fig. 1. Schematic representation of dissolved organic matter (DOM) cycling in the upper ocean. Photosynthetic phytoplankton are photoautotrophic organisms, which harvest light energy to support inorganic carbon fixation. These so-called primary producers provide organic matter for heterotrophic and photoheterotrophic species. Photoheterotrophic bacteria utilize organic matter for growth, but are capable of using light energy for their metabolism. They are unable to perform autotrophic growth, but can grow heterotrophically in the dark. Heterotrophic bacteria (Organotrophs) depend on organic matter produced by autotrophic species both as a source of energy and as a substrate for growth.
Fig. 2. Contribution of photoheterotrophic bacteria to the microbial community (expressed as a percentage of total prokaryotes) in various marine environments with different trophic status. Proteorhodopsin-containing bacteria abundance data were taken from (20). AAP data for the subtropical Atlantic were taken from (23), for the Baltic Sea from (25), and for the Mediterranean Sea from (32). FI
G. 2
KO
BLIZ
EK

51
isms available in laboratory cultures makes it possible to design better experiments, which, in combination with genomic data, can provide important insights into cell metabolism and photobiology. Field studies should focus on environmental factors driving the distribution and ac-
tivity of photoheterotrophic species. Manipulation and enrichment ex-periments can be especially beneficial in elucidating the main bottom�up and top-down factors shaping the natural microbial populations and establishing the role these organisms play in the marine carbon cycle.
References and Notes1. Z.S. Kolber, C.L. Van Dover, R.A. Niederman, P.G. Falkowski, Nature 407,
177 (2000).2. T. Shiba, U. Simidu, N. Taga, Appl. Environ. Microbiol. 38, 43 (1979).3. V.V. Yurkov, J.T. Csotonyi, in The Purple Phototrophic Bacteria, Advances
in Photosynthesis and Respiration volume 28, Hunter, C.N., Daldal, F., Thurnauer, M.C. and Beatty, J.T. Eds. (Springer Verlag, Dordrecht, The Netherlands, 2009), pp. 31–55.
4. O. Béjà et al., Science 289, 1902 (2000).5. Z.S. Kolber et al., Science 292, 2492 (2001).6. O. Béjà, E.N. Spudich, J.L. Spudich, M. Leclerc, E.F. DeLong, Nature 411, 786
(2001).7. Béjà, O. et al., Nature 415, 630 (2002).8. S.J. Giovannoni et al., Nature 438, 82 (2005).9. R.M. Morris et al., Nature 420, 806 (2002).
10. B.M. Fuchs et al., Proc. Natl. Acad. Sci. USA 104, 2891 (2007).11. J.M. González et al., Proc. Natl. Acad. Sci. USA 105, 8724 (2008).12. M. Koblížek, J. Mlcoušková, Z Kolber, J. Kopecký, Arch. Microbiol. 192, 41
(2010).13. K. Okamura, F. Mitsumori, O. Ito, K.-I. Takamiya, M. Nishimura, J. Bacteriol.
168, 1142 (1986).14. A. Martinez, A.S. Bradley, J.R. Waldbauer, R.E. Summons, E.F. DeLong, Proc.
Natl. Acad. Sci. USA 104, 5590 (2007).15. Y. Shioi, Plant Cell Physiol. 27, 567 (1986).16. V.V. Yurkov, H. van Gemerden, Arch. Microbiol. 159, 84 (1993).17. L. Gómez-Consarnau et al., Nature 445, 210 (2007).
18. L. Gómez-Consarnau et al., PLoS Biol 8, e1000358, 10.1371/journal.pbio.1000358 (2010).
19. G. Sabehi et al., PLoS Biol. 3, e173, 10.1371/journal.pbio.0030273 (2005).20. B.J. Campbell, L.A. Waidner, M.T. Cottrell, D.L. Kirchman, Environ. Microbiol.
10, 99 (2008).21. M.E. Sieracki, I.C. Gilg, E.C. Thier, N.J. Poulton, R. Goericke, Limnol.
Oceanogr. 51, 38 (2006).22. M.T. Cottrell, A. Mannino, D.L. Kirchman. Appl. Env. Microbiol. 72, 557
(2006). 23. M. Koblížek, M. Mašín, J. Ras, A.J. Poulton, O. Prášil, Environ. Microbiol. 9,
2401 (2007).24. N. Jiao et al., Environ. Microbiol. 9, 3091 (2007).25. M. Mašín et al., Aquat. Microbial. Ecol. 45, 247 (2006).26. Y. Zhang, N. Jiao, FEMS Microbiol. Ecol. 61, 459 (2007).27. M.T. Cottrell, J. Ras, D.L. Kirchman, ISME J. 4, 945 (2010).28. N. Jiao et al., Nat. Rev. Microbiol. 8, 593 (2010).29. N. Jiao et al., ISME J. 4, 595 (2010).30. P.A. del Giorgio, C.M. Duarte, Nature 420, 379 (2002).31. J.C. Venter et al., Science 304, 66 (2004).32. E. Hojerová, personal communication33. This work was supported by GACR project P501/10/0221, AV CR project
M200200903, project Algatech (CZ.1.05/2.1.00/03.0110), and the Institutional Research Concept AV0Z50200510. M.K. thanks Prof. Nianzhi Jiao and Dr. Isabel Ferrera for constructive comments, and Dr. Matthew T. Cottrell for kindly providing the PR abundance data.
52
The downward flux of organic carbon from the surface ocean to depth via passive sinking of particles, active transport by ani-mals, and mixing of dissolved organic matter (DOM) is known as
the biological carbon pump (BCP). The microbial carbon pump (MCP) is a conceptual component of the BCP, used to describe the microbial production of refractory DOM (RDOM) which can be stored for mil-lennia in the deep sea, rather than being respired to dissolved inorganic carbon and returned to the atmosphere (1). Heterotrophic bacteria and Archaea generate RDOM through degradation and transformation of particulate and dissolved organic matter, exudation, and cell lysis (2, 3). In addition to assimilation and transformation of recently produced DOM, prokaryotes also degrade ‘older’ DOM (4) derived from pho-tochemically transformed upwelled DOM (5, 6) and potentially from methane seeps (7). Hence, understanding the magnitude and variabil-ity of the production and respiration of bacteria and Archaea is impor-tant not only for quantifying the efficiency of the BCP (8) and the role of prokaryotes in regulating carbon fluxes (9), but also for constraining the flow of DOM through the MCP.
The composition and lability of DOM affect the prokaryotic carbon demand [PrCD = prokaryotic production (PrP) + prokaryotic respira-tion (PrR)] and the prokaryotic growth efficiency (PrGE = PrP/PrCD, the proportion of the prokaryotic carbon demand used for prokaryotic production). PrGE is influenced by the availability of organic and inor-ganic substrates as well as the energetic costs of growth in a particular environment, and so tends to be low at times of nutrient limitation or environmental stress and higher during increased primary productivity and supply of nutrients (8, 10).
The direct measurement of PrP and PrR and calculation of PrCD and PrGE is technically and interpretatively challenging. This is due to uncertainties associated with factors such as the pre-incubation sepa-ration of the heterotrophic bacterioplankton fraction from the rest of the plankton community, the different incubation times required for PrR and PrP measurements, the effect of light on PrP and PrR, the quantification of prokaryotic excretion of DOM, and the conversion factors used to derive rates of carbon production and respiration from radiolabeled thymidine or leucine incorporation and oxygen consump-tion (8,9). Large uncertainties in PrGE contribute significantly to the
mismatch between measurements of mesopelagic microbial metabolic activity and estimates of the influx of organic carbon that could sup-port this microbial activity (11).
Recent methodological developments have the potential to reduce uncertainties in PrR and PrP determinations. For example, measure-ments of in vivo electron transport system activity estimated from the reduction of the tetrazolium salt INT are linearly related to in situ rates of respiration, and avoid problems associated with pre�incubation fil-tration and relatively long incubation times (24 hours) (12). Addition-ally, single cell assays that measure incorporation of selected organic compounds by specific prokaryotic groups compare and contrast the components of DOM taken up by bacteria and Archaea (13). Includ-ing these assays in time series studies can elucidate the influence of environmental factors such as light on PrP (14, 15).
Climate change will likely affect precipitation, river flow, ice melt, atmospheric deposition, and the timing and strength of along-shore winds that stimulate coastal upwelling, and so may significantly change the supply of inorganic and organic substrates to marine pro-karyotes. Concomitant increases in sea surface temperature and de-creases in pH and carbonate ion concentration could lead to changes in phytoplankton and zooplankton community structure, subsequently impacting foodweb�derived DOC (16). In short-term experiments, prokaryotic turnover of phytoplankton-derived polysaccharides was increased at the lower pH levels projected to occur with a doubling of atmospheric CO2, with the potential to reduce carbon export and en-hance respiratory CO2 production (17). Field studies and inorganic and organic nutrient bioassay experiments show PrR and PrGE in coastal regions to be either mainly controlled by the DOC pool or colimited by organic and inorganic nutrients (18–20). Climate-driven increases in DOC supply may also impact the plankton community photosynthesis to respiration (P:R) ratio. When released from organic carbon limita-tion, heterotrophic prokaryotes can outcompete phytoplankton for in-organic nutrients, thereby decreasing the overall P:R ratio, increasing the proportion of DOC that is respired, and decreasing the amount that is sequestered (21).
This review aims to highlight our incomplete understanding for the causes of variability in the PrGE and respiratory potential of heterotro-phic bacteria and Archaea. As new research supports the pivotal role of these microbes in the present and future ocean (22, 23), the lack of routine measurements of PrP and PrR in relation to phylogenetic composition, as well as to DOM characterization and assimilation po-tential, becomes increasingly difficult to defend.
Microbial Heterotrophic Metabolic Rates Constrain the Microbial Carbon PumpCarol Robinson1* and Nagappa Ramaiah2
The respiration of dissolved organic matter by heterotrophic bacteria and Archaea represents the largest sink in the global marine biological carbon cycle, an important constraint on organic carbon supply, and the major driver of global elemental nutrient cycles. Direct measurement of heterotrophic production and respiration is difficult. However, the recent development of methods involving in vivo electron transport system activity, bioassay uptake of specific prokaryotic substrates, and nutrient addition incubations are poised to discern the complex interactions between metabolic rate, community structure, and organic and inorganic nutrient availability. In a changing global environment, it is important to understand how increasing sea surface temperature, melting sea ice, ocean acidification, variable dust deposition, and upwelling intensity will impact the metabolism of Bacteria and Archaea and so the balance between carbon sequestration and carbon dioxide evasion to the atmosphere. Continued and improved measures of prokaryotic production and respiration are vital components of this endeavor.
1School of Environmental Sciences, University of East Anglia, Norwich NR4 7TJ, U.K. 2National Institute of Oceanography, Dona Paula 403004, Goa, India *To whom correspondence should be addressed. E-mail: [email protected]

53
References and Notes1. N. Jiao et al., Nat. Rev. Microbiol. 8, 593 (2010).2. T. Nagata, in Microbial Ecology of the Oceans D.L. Kirchman Ed. (John
Wiley & Sons, Inc. New York, ed. 1. 2000), pp. 121–152.3. D. F. Gruber, J. P. Simjouw, S. P. Seitzinger, and G. L. Taghon, Appl. Environ.
Microbiol. 72, 4184 (2006).4. J. Cherrier, J. E. Bauer, E. R. M. Druffel, R. B. Coffin, J. P. Chanton, Limnol.
Oceanogr. 44, 730 (1999).5. R. Benner, B. Biddanda, Limnol. Oceanogr. 43, 1373 (1998).6. I. Obernosterer, B. Reitner, G. J. Herndl, Limnol. Oceanogr. 44, 1645
(1999).7. J. W. Pohlman, J. E. Bauer, W. F. Waite, C. L. Osburn, N. R. Chapman, Nat.
Geosci. 4, 37 (2011).8. C. Robinson, in Microbial Ecology of the Oceans D.L. Kirchman Ed. (John
Wiley & Sons, Inc. ed. 2. 2008), pp. 299–334.9. J. M. Gasol et al., Aquat. Microb. Ecol. 53, 21 (2008).
10. P. A. del Giorgio, J. J. Cole, in Microbial Ecology of the Oceans D. L. Kirchman Ed. (John Wiley & Sons, Inc. New York ed. 1. 2000), pp. 289–325.
11. A. B. Burd et al., Deep Sea Res. II 57, 1557 (2010). 12. S. Martinez-García, E. Fernández, M. Aranguren-Gassis, E. Teira, Limnol.
Oceanogr. Methods 7, 459 (2009).
13. D.L. Kirchman, H. Elifantz, A. I. Dittel, R. R. Malmstrom, M. T. Cottrell, Limnol. Oceanogr. 52, 495 (2007).
14. M. J. Church, H. W. Ducklow, D.A. Karl, Appl. Environ. Microbiol. 70, 4079 (2004).
15. T. R. A. Straza, D. L. Kirchman, Aquat. Microb. Ecol. 62, 267(2011).16. O. Hoegh-Guldberg, J. F. Bruno, Science 328, 1523 (2010).17. J. Piontek, M. Lunau, N. Handel, C. Borchard, M. Wurst, A. Engel,
Biogeosciences 7, 1615 (2010).18. J. K. Apple, P.A. del Giorgio, ISME J. 1, 729 (2007).19. L. Alonso-Sáez et al., Limnol. Oceanogr. 52, 533 (2007).20. S. Martinez-García et al., Aquat. Microb. Ecol. 416, 17 (2010).21. T. F. Thingstad et al., Nature 455, 387 (2008).22. J. Arístegui, J. M. Gasol, C. M. Duarte, G. J. Herndl, Limnol. Oceanogr. 54,
1501 (2009).23. D. L. Kirchman, X. A. G. Moran, H. W. Ducklow, Nat. Rev. Microbiol. 7, 451
(2009).24. We thank G. Herndl for constructive comments and suggestions. This
work was supported by the Scientific Committee on Oceanic Research (WG134), The Royal Society (to CR), and the National Institute of Oceanography, India (to NR).
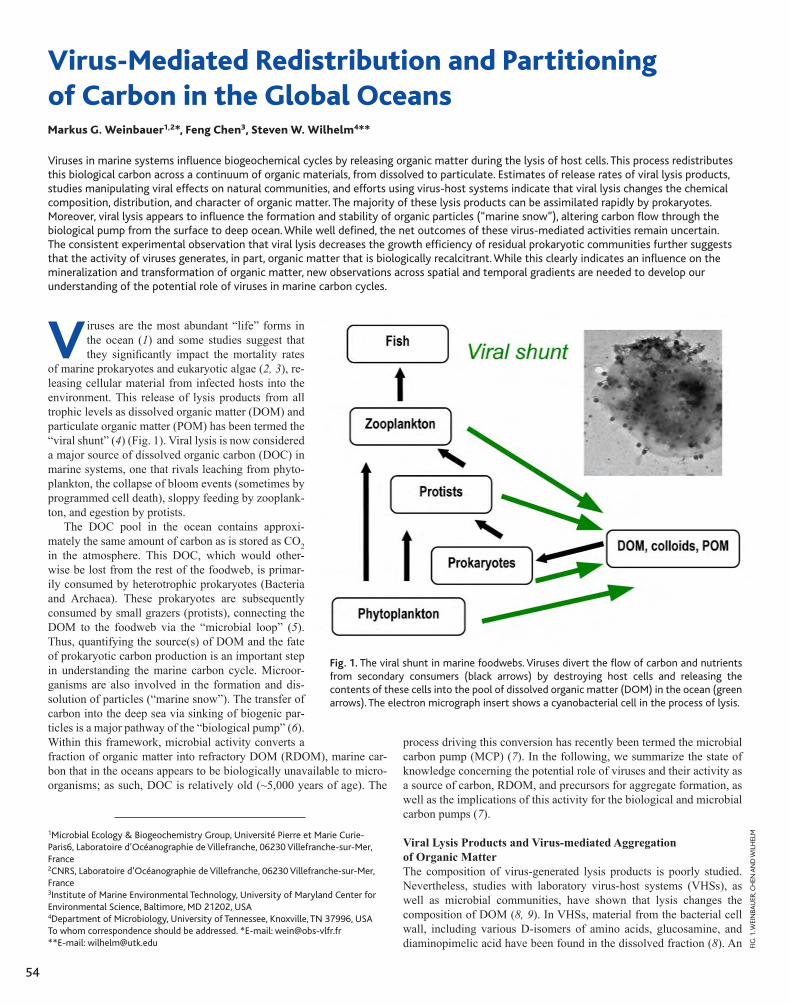
54
V iruses are the most abundant “life” forms in the ocean (1) and some studies suggest that they significantly impact the mortality rates
of marine prokaryotes and eukaryotic algae (2, 3), re-leasing cellular material from infected hosts into the environment. This release of lysis products from all trophic levels as dissolved organic matter (DOM) and particulate organic matter (POM) has been termed the “viral shunt” (4) (Fig. 1). Viral lysis is now considered a major source of dissolved organic carbon (DOC) in marine systems, one that rivals leaching from phyto-plankton, the collapse of bloom events (sometimes by programmed cell death), sloppy feeding by zooplank-ton, and egestion by protists.
The DOC pool in the ocean contains approxi-mately the same amount of carbon as is stored as CO2 in the atmosphere. This DOC, which would other-wise be lost from the rest of the foodweb, is primar-ily consumed by heterotrophic prokaryotes (Bacteria and Archaea). These prokaryotes are subsequently consumed by small grazers (protists), connecting the DOM to the foodweb via the “microbial loop” (5). Thus, quantifying the source(s) of DOM and the fate of prokaryotic carbon production is an important step in understanding the marine carbon cycle. Microor-ganisms are also involved in the formation and dis-solution of particles (“marine snow”). The transfer of carbon into the deep sea via sinking of biogenic par-ticles is a major pathway of the “biological pump” (6). Within this framework, microbial activity converts a fraction of organic matter into refractory DOM (RDOM), marine car-bon that in the oceans appears to be biologically unavailable to micro-organisms; as such, DOC is relatively old (~5,000 years of age). The
process driving this conversion has recently been termed the microbial carbon pump (MCP) (7). In the following, we summarize the state of knowledge concerning the potential role of viruses and their activity as a source of carbon, RDOM, and precursors for aggregate formation, as well as the implications of this activity for the biological and microbial carbon pumps (7).
Viral Lysis Products and Virus-mediated Aggregation of Organic Matter The composition of virus-generated lysis products is poorly studied. Nevertheless, studies with laboratory virus�host systems (VHSs), as well as microbial communities, have shown that lysis changes the composition of DOM (8, 9). In VHSs, material from the bacterial cell wall, including various D�isomers of amino acids, glucosamine, and diaminopimelic acid have been found in the dissolved fraction (8). An
Virus-Mediated Redistribution and Partitioning of Carbon in the Global OceansMarkus G. Weinbauer1,2*, Feng Chen3, Steven W. Wilhelm4**
Viruses in marine systems influence biogeochemical cycles by releasing organic matter during the lysis of host cells. This process redistributes this biological carbon across a continuum of organic materials, from dissolved to particulate. Estimates of release rates of viral lysis products, studies manipulating viral effects on natural communities, and efforts using virus-host systems indicate that viral lysis changes the chemical composition, distribution, and character of organic matter. The majority of these lysis products can be assimilated rapidly by prokaryotes. Moreover, viral lysis appears to influence the formation and stability of organic particles (“marine snow”), altering carbon flow through the biological pump from the surface to deep ocean. While well defined, the net outcomes of these virus-mediated activities remain uncertain. The consistent experimental observation that viral lysis decreases the growth efficiency of residual prokaryotic communities further suggests that the activity of viruses generates, in part, organic matter that is biologically recalcitrant. While this clearly indicates an influence on the mineralization and transformation of organic matter, new observations across spatial and temporal gradients are needed to develop our understanding of the potential role of viruses in marine carbon cycles.
1Microbial Ecology & Biogeochemistry Group, Université Pierre et Marie Curie-Paris6, Laboratoire d’Océanographie de Villefranche, 06230 Villefranche-sur-Mer, France2CNRS, Laboratoire d’Océanographie de Villefranche, 06230 Villefranche-sur-Mer, France3Institute of Marine Environmental Technology, University of Maryland Center for Environmental Science, Baltimore, MD 21202, USA4Department of Microbiology, University of Tennessee, Knoxville, TN 37996, USATo whom correspondence should be addressed. *E-mail: [email protected]**E-mail: [email protected]
Fig. 1. The viral shunt in marine foodwebs. Viruses divert the flow of carbon and nutrients from secondary consumers (black arrows) by destroying host cells and releasing the contents of these cells into the pool of dissolved organic matter (DOM) in the ocean (green arrows). The electron micrograph insert shows a cyanobacterial cell in the process of lysis.
FIG
. 1. W
EIN
BAU
ER, C
HEN
AN
D W
ILH
ELM
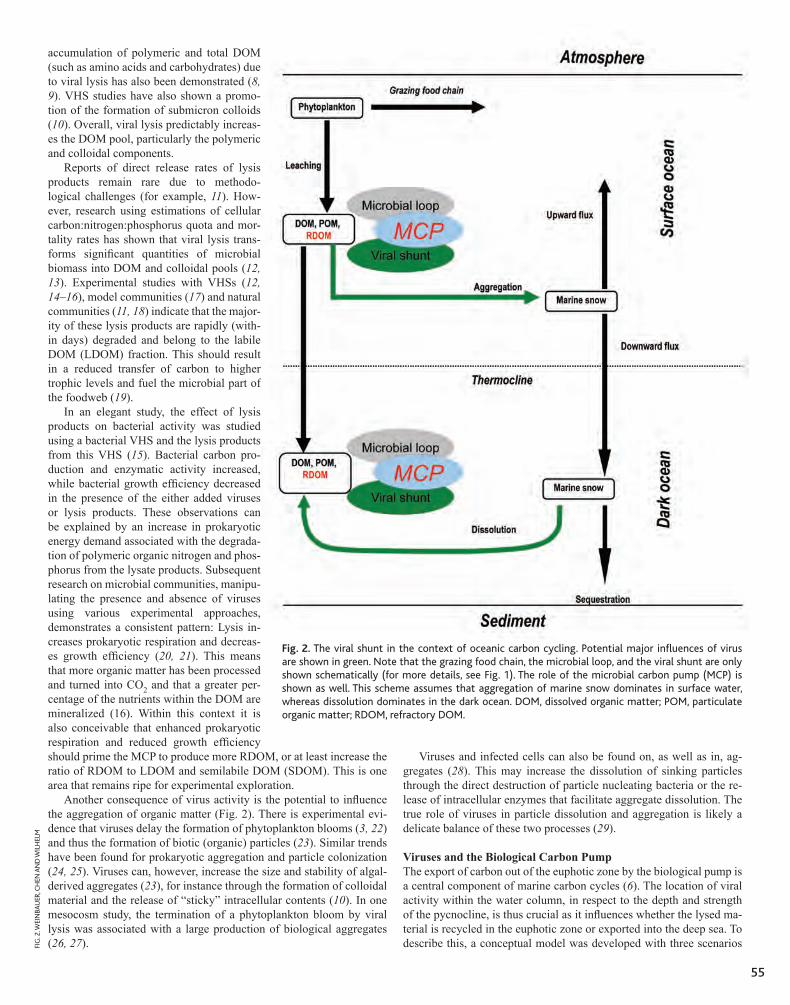
55
accumulation of polymeric and total DOM (such as amino acids and carbohydrates) due to viral lysis has also been demonstrated (8, 9). VHS studies have also shown a promo-tion of the formation of submicron colloids (10). Overall, viral lysis predictably increas-es the DOM pool, particularly the polymeric and colloidal components.
Reports of direct release rates of lysis products remain rare due to methodo-logical challenges (for example, 11). How-ever, research using estimations of cellular carbon:nitrogen:phosphorus quota and mor-tality rates has shown that viral lysis trans-forms significant quantities of microbial biomass into DOM and colloidal pools (12, 13). Experimental studies with VHSs (12, 14–16), model communities (17) and natural communities (11, 18) indicate that the major-ity of these lysis products are rapidly (with-in days) degraded and belong to the labile DOM (LDOM) fraction. This should result in a reduced transfer of carbon to higher trophic levels and fuel the microbial part of the foodweb (19).
In an elegant study, the effect of lysis products on bacterial activity was studied using a bacterial VHS and the lysis products from this VHS (15). Bacterial carbon pro-duction and enzymatic activity increased, while bacterial growth efficiency decreased in the presence of the either added viruses or lysis products. These observations can be explained by an increase in prokaryotic energy demand associated with the degrada-tion of polymeric organic nitrogen and phos-phorus from the lysate products. Subsequent research on microbial communities, manipu-lating the presence and absence of viruses using various experimental approaches, demonstrates a consistent pattern: Lysis in-creases prokaryotic respiration and decreas-es growth efficiency (20, 21). This means that more organic matter has been processed and turned into CO2 and that a greater per-centage of the nutrients within the DOM are mineralized (16). Within this context it is also conceivable that enhanced prokaryotic respiration and reduced growth efficiency should prime the MCP to produce more RDOM, or at least increase the ratio of RDOM to LDOM and semilabile DOM (SDOM). This is one area that remains ripe for experimental exploration.
Another consequence of virus activity is the potential to influence the aggregation of organic matter (Fig. 2). There is experimental evi-dence that viruses delay the formation of phytoplankton blooms (3, 22) and thus the formation of biotic (organic) particles (23). Similar trends have been found for prokaryotic aggregation and particle colonization (24, 25). Viruses can, however, increase the size and stability of algal�derived aggregates (23), for instance through the formation of colloidal material and the release of “sticky” intracellular contents (10). In one mesocosm study, the termination of a phytoplankton bloom by viral lysis was associated with a large production of biological aggregates (26, 27).
Viruses and infected cells can also be found on, as well as in, ag-gregates (28). This may increase the dissolution of sinking particles through the direct destruction of particle nucleating bacteria or the re-lease of intracellular enzymes that facilitate aggregate dissolution. The true role of viruses in particle dissolution and aggregation is likely a delicate balance of these two processes (29).
Viruses and the Biological Carbon PumpThe export of carbon out of the euphotic zone by the biological pump is a central component of marine carbon cycles (6). The location of viral activity within the water column, in respect to the depth and strength of the pycnocline, is thus crucial as it influences whether the lysed ma-terial is recycled in the euphotic zone or exported into the deep sea. To describe this, a conceptual model was developed with three scenarios
Fig. 2. The viral shunt in the context of oceanic carbon cycling. Potential major influences of virus are shown in green. Note that the grazing food chain, the microbial loop, and the viral shunt are only shown schematically (for more details, see Fig. 1). The role of the microbial carbon pump (MCP) is shown as well. This scheme assumes that aggregation of marine snow dominates in surface water, whereas dissolution dominates in the dark ocean. DOM, dissolved organic matter; POM, particulate organic matter; RDOM, refractory DOM.
FIG
. 2. W
EIN
BAU
ER, C
HEN
AN
D W
ILH
ELM
56
for infected cells of the bloom-forming alga Heterosigma akashiwo and viruses that infect them (30). In scenario 1, when stratification is strong or the pycnocline is deep, cells lyse above the pycnocline and lysis products remain in the mixed layer. In scenario 2, when stratification is weak and waters are shallow, infected cells will reach the benthos before lysis and lysis products remain at the sediment-water interface. In scenario 3, cells are also not retained by the pycnocline and lysis products are subject to processes in the deeper water column. The exact fate and quantity of primary production shunted into the DOM and col-loidal pool will depend on the actual scenario in play.
In addition to the location of viral infection in the water column, the following mechanisms may influence the biological pump: (i) The conversion of cellular material into the dissolved and colloidal forms should increase the retention time of carbon and nutrients in surface water and thus reduce export; (ii) Aggregation driven by lysis products will increase carbon export unless this aggregation also increases the buoyancy of particles (for example, by retaining gases from metab-olism) and thus the retention time in the euphotic zone; (iii) Nutrient (nitrogen, phosphorus, and iron) release within lysis products may act as a feedback mechanism and stimulate primary production with unpredictable consequences for the biological pump; and (iv) If viral lysis stimulates the microbial loop and reduces carbon transfer to high-er trophic levels, less carbon is available for zooplankton-mediated particle formation (for example, fecal pellets or larvacean houses); this would shift aggregation to one based on phytoplankton-derived materials.
Since these mechanisms are difficult to disentangle (and others yet might not be recognized), it is still not possible to assess whether the net effect of viral activity is to prime or short-circuit the biological pump
(31). Indeed, research during the last two decades has revealed that virus activity depends strongly on spatial and temporal scales (even in the deep sea) (32, 33). Thus, the role of viruses within the MCP and the biological pump is potentially environment and condition specific.
Viruses and the Microbial Carbon Pump Functionally there now also appears to be a “horizontal” component (the pumping of biomass into the RDOM pool) within microbial carbon cycles, which, at some level, is undoubtedly influenced by the viral shunt (7). In the euphotic zone, viral lysis of picocyanobacteria and autotrophic eukaryotic plankton will contribute, in addition to bacterial cell lysates, to the DOM and subsequently RDOM pools (and finally export). Since representative cyanobacterial VHSs are available for the euphotic zone, they may serve as good models for understanding the dispersal of virus-mediated lysis products in the natural environment.
In the deep ocean (where most of the recalcitrant carbon is found), significant viral activity has been reported for benthic and pelagic sys-tems (33, 34). Viral lysis of Bacteria and Archaea (which become more abundant in the dark ocean) should produce mainly LDOM. Since this material will be consumed rapidly (and potentially help sustain high prokaryotic production in the deep sea), lysis may increase the ratio of RDOM to LDOM and SDOM. In a similar manner to the conversion of some LDOM and SDOM into RDOM by prokaryotic activity (35), viral lysis in the deep sea should also promote RDOM production directly in the environment where long term storage occurs. Since RDOM is resistant to microbial utilization, is stored in the ocean for millennia, and accounts for more than 95% of the total DOC pool (7), alterations of RDOM dynamics within the microbial carbon pump by viral activity will undoubtedly influence the global carbon cycle.
References and Notes1. Ø. Bergh, K. Y. Børsheim, G. Bratbak, M. Heldal, Nature 340, 467 (1989).2. L. M. Proctor, J. A. Fuhrman, Nature 343, 60 (1990).3. C. A. Suttle, A. M. Chan, M. T. Cottrell, Nature 347, 467 (1990).4. S. W. Wilhelm, C. A. Suttle, Bioscience 49, 781 (1999).5. F. Azam et al., Mar. Ecol. Prog. Ser. 10, 257 (1983).6. R. W. Eppley, B. J. Peterson, Nature 282, 677 (1979).7. N. Jiao et al., Nat. Rev. Microbiol. 8, 593 (2010).8. M. Middelboe, N. O. G. Jorgensen, J. Mar. Biol. Ass. UK 86, 605 (2006).9. M. G. Weinbauer, P. Peduzzi, Mar. Ecol. Prog. Ser. 127, 245 (1995).
10. A. Shibata, K. Kogure, I. Koike, K. Ohwada, Mar. Ecol. Prog. Ser. 155, 303 (1997).
11. L. Poorvin, J. M. Rinta-Kanto, D. A. Hutchins, S. W. Wilhelm, Limnol. Oceanogr. 49, 1734 (2004).
12. C. J. Gobler, D. A. Hutchins, N. S. Fisher, E. M. Cosper, S. Sañudo-Wilhelm, Limnol. Oceanogr. 42, 1492 (1997).
13. S. W. Wilhelm, M. G. Weinbauer, C. A. Suttle, W. H. Jeffrey, Limnol. Oceanogr. 43, 586 (1998).
14. G. Bratbak, A. Jacobson, M. Heldal, Aquat. Microb. Ecol. 16, 11 (1998).15. M. Middelboe, N. O. G. Jørgensen, N. Kroer, Appl. Environ. Microbiol. 62,
1991 (1996).16. M. Middelboe, L. Riemann, C. F. Steward, W. Hannsen, O. Nybroe, Aquat.
Microb. Ecol. 33, 1 (2003).17. J. Haaber, M. Middelboe, ISME J. 3, 430 (2009).18. R. T. Noble, J. A. Fuhrman, Aquat. Microb. Ecol. 20, 1 (1999).
19. J. A. Fuhrman, Nature 399, 541 (1999).20. M. Middelboe, P. G. Lyck, Aquat. Microb. Ecol. 27, 187 (2002).21. C. Motegi et al., Limnol. Oceanogr. 54, 1901 (2009).22. C. A. Suttle, Mar. Ecol. Prog. Ser. 87, 105 (1992).23. P. Peduzzi, M. G. Weinbauer, Limnol. Oceanogr. 38, 1562 (1993).24. A. Malits, M. G. Weinbauer, Aquat. Microb. Ecol. 54, 243 (2009).25. L. Riemann, H.-P. Grossart, Microb. Ecol. 56, 505 (2008).26. C. Brussaard, B. Kuipers, M. Veldhuis, Harmful Algae 4, 894 (2005).27. C. Brussaard, X. Mari, J. D. L. van Bleijswijk, M. Veldhuis, Harmful Algae 4,
875 (2005).28. L. M. Proctor, J. A. Fuhrman, Mar. Ecol. Prog. Ser. 69, 133 (1991).29. M. G. Weinbauer et al., Aquat. Microb. Ecol. 57, 321 (2009).30. J. E. Lawrence, C. A. Suttle, Aquat. Microb. Ecol. 37, 1 (2004).31. C. P. Brussaard et al., ISME J. 2, 575 (2008).32. J. M. Rowe et al., Aquat. Microb. Ecol. 52, 233 (2008).33. M. G. Weinbauer, I. Brettar, M. G. Höfle, Limnol. Oceanogr. 48, 1457
(2003).34. R. Danovaro et al., Nature 454, 1084 (2008).35. H. Ogawa, Y. Amagai, I. Koike, K. Kaiser, R. Benner, Science 292, 917 (2001).36. The authors thank C.A. Suttle for his mentorship. They also appreciate
the thorough comments of G. Bratbak. They also acknowledge the French Science Ministry (ANR-AQUAPHAGE, N°ANR 07 BDIV 015-06; ANR-MAORY; N° ANR 07 BLAN 016) for support to MGW, NSF(OCE) 0825405 and 1061352 for support to SWW and the SCOR Working Group 134.

57
Dissolved organic carbon (DOC) represents the largest pool of reduced carbon in the ocean with a global inventory of approxi-mately 662 petagrams of carbon (PgC) (1). The pool contains
a myriad of organic molecules, comprising broad fractions of variable lability that turn over on time scales from minutes to millennia (2, 3). Of the approximately 50 PgC y-1 of global net primary production, greater than 50% is partitioned as DOC to be processed through the microbial foodweb (3, 4). The majority of the newly produced DOC is rapidly remineralized by heterotrophic bacterioplankton within ocean’s surface layer (5). However, about 20% of the annual global ocean net com-munity production (~1.8 PgC y-1) escapes degradation long enough to be exported from the euphotic zone through overturning circulation of the water column. Once exported, the dissolved organic matter (DOM) and its remineralization byproducts travel by isopycnal pathways into the ocean’s interior (1, 6–9). Figure 1 provides evidence of export with deep water formation in the North Atlantic, where mid-latitude, warm, DOC�enriched surface waters are transported with surface currents to high latitude (Fig. 1A), at which point deep water formation transports the DOC deep into the interior (Fig. 1, B and C) where it slowly declines during southward flow. Additional processes such as the solubilization of sinking particles (10) and DOC release from vertically migrating zooplankton (11) result in further DOC introduction into the subsurface layers. Factors that regulate persistence of exported DOC include inor-ganic nutrients required by heterotrophic microbes (12, 13), the quality of the exported DOM (14, 15), the microbial community structure (16, 17), and the expression of proteins involved in cell growth optimization (18).
The mechanisms of production that result in DOC compounds that persist from months to millennia are not well described, but both abiotic and biotic processes have been shown to transform DOM to molecular forms that resist rapid microbial degradation. Abiotic processes include adsorption of labile DOC to colloidal material (19, 20), modification of chemical bond structure by ultraviolet light exposure (19–21), and the formation of compounds like melanoidins via condensation reactions (22). Biotic sources of resistant DOM may include direct exudation from phytoplankton [for example, as acylheteropolysaccharides (14),
DOC Persistence and Its Fate After Export Within the Ocean InteriorCraig A. Carlson1*, Dennis A. Hansell2, and Christian Tamburini3,4
Biotic and abiotic processing of organic matter originally created through photosynthesis can lead to its accumulation as dissolved organic matter (DOM) in surface waters of the ocean. Components of this dissolved material are resistant to microbial remineralization, persisting long enough to be entrained during ventilation of the ocean interior, and resulting in carbon export to great ocean depths. Upon downward mix-ing to mesopelagic waters (from >150 to ~1000 m), the exported DOM is susceptible to removal on both short (weeks) and long (years) time scales, with remineralization by deep microbial populations playing an important role. Recent work indicates that specific lineages of subsur-face bacterioplankton respond to these export events, remineralizing the same DOM that had been largely resistant to microbial degradation at the sea surface. Free-living (unattached) microbial populations are structured vertically, with that structure defined by unique metabolic capabilities that are important when considering the fate of exported DOM and its lability.
1Dept. Ecology, Evolution, and Marine Biology, University of California, Santa Bar-bara, CA 93106-9610, USA2Rosenstiel School of Marine and Atmospheric Science, University of Miami, Miami, FL 33149, USA3Université de la Méditerranée, LMGEM, Centre d'Océanologie de Marseille, Case 901, 13288 Marseille Cedex 9, France4CNRS/INSU, UMR 6117, LMGEM, Case 901, 13288 Marseille Cedex 9, France*To whom correspondence should be addressed. E-mail: [email protected]
Fig. 1. Meridional distributions of mean dissolved organic carbon (DOC) concentrations for (A) the euphotic zone (0 to 100 m), (B) the mesopelagic zone (100 to 1000 m), and (C) the bathypelagic zone (1000 to 3000 m) within the North Atlantic Basin. Surface waters elevated in DOC at low latitudes are transported to the north with surface circulation. The surface concentrations decrease with overturning circulation, thereby increasing concentrations at depth in the north. Over time, with flow of those deep waters to the south, the exported DOC concentrations decline. Mean DOC concentrations were determined by integrating DOC stocks within each depth horizon for each hydrostation and normalizing to the depth of each depth horizon. Filled circles, open triangles, and open squares are DOC values from the Climate Variability and Predictability (CLIVAR) program's transect lines A16, A22, and A20, respectively. Note scales of the y-axes change between panels. Adapted from (37).

58
bacterially derived cell wall material (23–26), liposome-like colloids produced via microzooplankton grazing (27), and the release of me-tabolites (28)]. The preferential removal of specific sugars and amino acids can also transform DOM to recalcitrance (29–32).
The production of refractory DOM compounds via heterotrophic microbial processes has been termed the microbial carbon pump (MCP) (33). In this conceptual model, a fraction of the bioavailable organic compounds processed by heterotrophic microbes is shunted to a bio-logically refractory form of organic matter. Experiments with marine microbes have shown that a portion of model biolabile organic com-pounds are transformed to products that persist for periods of months to years (34, 35). Other studies have identified bacterial biomarkers (D�enantiomer amino acids) in the high molecular weight fraction of oceanic DOM, lending support to the hypothesis that some portion of
the refractory DOM pool is of heterotrophic prokaryotic origin (24, 25). It is estimated that approximately 23% of the bulk oceanic DOC pool (~155 PgC) (36) is derived via the MCP.
The accumulation of DOC is most pronounced in surface waters of the well�stratified subtropical gyres, reaching concentrations >80 μmol C kg-1 (1, 37) (Fig. 2). This accumulation is unambiguous evidence for its resistance to decay. However, DOM that is persistent at one geo-graphical location or depth horizon can be bioavailable at another. For example, of the 1.8 PgC of DOM exported from the euphotic zone, only ~0.2 PgC survives to depths greater than 500 m (1). Some meso-pelagic bacterial lineages undergo productivity pulses during or shortly following water column overturn events, presumably due to the deliv-ery of surface�derived DOM (17, 38, 39) (Fig. 3). The remineraliza-tion of exported DOC accounts for up to half the oxygen utilized in the
Fig. 3. Contours of plot of SAR11 subclade II cell densities (E8 L-1) in the surface 300 m from 2003 through 2005 at the Bermuda Atlantic Time-series Study site. The white dashed line represents, mixed layer depth and is used to examine distribution patterns in the context of mixing and stratification. The data reported in this figure demonstrate a response of mesopelagic subclade of the bacterioplankton SAR11
during or shortly following deep convective overturn. This response is presumed in part to result from the delivery of surface derived organic matter (i.e., DOC flux) into the mesopelagic during mixing. A portion of the DOC that persisted in the surface waters appears to become available to the organisms in the mespelagic zone triggering biomass production. Adapted from (39).
Fig. 2. Distributions of DOC (μmol C kg-1) at 30 m. Meridional and zonal lines of data are observed values, while the background field is modeled [see (1) for details]. Adapted from (1).
59
mesopelagic zone (7, 40, 41). At >1000 m, DOC removal occurs at much slower rates, accounting for < 20% of oxygen consumption (37, 42).
The response of deep microbial lineages to exported DOC indicates that microbial processes in the ocean’s interior are capable of metaboliz-ing some of these persistent polymeric compounds. Microbial diversity in oceanic systems is high, although there remains uncertainty with re-gard to how much of this diversity is functionally significant (16, 43, 44). Vertical partitioning of major prokaryotic groups, particularly be-tween the euphotic and aphotic regions of the oceanic water column, is well documented (16, 17, 38, 39, 45, 46) and presumably linked to gra-dients in the character and quantity of DOM as well as to the availability of inorganic nutrients. Genomic and transcriptomic data demonstrate the potential for marine bacterioplankton to utilize a range of DOM tar-gets (28, 47–49). DeLong et al. (2006) identified a greater number of genes, putatively involved in polysaccharide degradation, in deep mi-crobial populations compared to those found in the surface populations (16). The genes associated with the deep microbial assemblages are better suggestive of a surface-attached lifestyle capable of degrading recalcitrant pools of organic matter (16, 28).
Specific groups of heterotrophic prokaryotes have been shown to re-spond differently to the quality and quantity of organic substrates (38, 49–54). Thus, organic compounds resistant to microbial degradation at one depth horizon may serve as substrates for deeper population of heterotrophic microbes. For example, D�enantiomeric amino acids de-rived from the peptidoglycan of bacterioplankton cell walls have been observed to persist within the DOM pool (24, 25). However, there is a
significant increase in the uptake ratio of D�aspartic acid by microbes in the meso- and bathypelagic realms of the North Atlantic (55, 56), indicating that deep microbes more readily utilize D�amino acids. These deep-sea piezophilic microorganisms display metabolic capabilities that allow them to thrive under cold and high-pressure conditions (57). Some piezophiles are capable of degrading complex organic matter (58) by modifying their gene structure and protein regulation (59). For exam-ple, in Photobacterium profundum SS9 the metabolic pathways used to degrade polymers such as chitin, pullulan, and cellulose are controlled by pressure: upregulation of proteins occurs above 28 MPa and down-regulation below 0.1 MPa. Cell�specific ectoenzymatic activities are greater in deep waters compared to the surface (60–64), providing ad-ditional evidence that deep-sea microorganisms are adapted to degrade more refractory pools of organic matter (65), under in situ pressure and temperature (61, 63).
The production of refractory DOM can be important in ocean carbon sequestration. First, DOM that persists in the surface ocean long enough for its eventual mixing to greater ocean depths represents a carbon-rich export term, contributing to 20% of the biological carbon pump (1, 6, 7, 66). Second, a fraction of this exported DOM can persist for centuries to millennia, thus the carbon remains stored in an organic form and un-available for exchange with the atmosphere as CO2. The degree to which the MCP shunts carbon to long-term storage as organic matter, versus brief storage associated with export and rapid, deep remineralization, is unknown. Resolving these fates and identifying causative mechanisms and controls of the MCP remain important challenges.
References and Notes1. D. A. Hansell, C. A. Carlson, D. J. Repeta, R. Shlitzer, Oceanogr. 22, 202
(2009).2. D. Kirchman, Limnol. Oceanogr. 28, 858 (1983).3. C. A. Carlson, in Biogeochemistry of Marine Dissolved Organic Matter, D. A.
Hansell, C. A. Carlson, Eds. (Academic Press, San Diego, 2002), pp. 911–151.4. T. Nagata, in Microbial Ecology of the Oceans, D. L. Kirchman, Ed. (Wiley-
Liss, New York, 2000), pp. 121–152.5. F. Azam, D. C. Smith, Å. Hagström, Microb. Ecol. 28, 167 (1993).6. G. Copin-Montégut, B. Avril, Deep Sea Res. 40, 1963 (1993).7. C. A. Carlson, H. W. Ducklow, A. F. Michaels, Nature 371, 405 (1994).8. M. Canals et al., Nature 444, 354 (2006).9. J. Martín, J. C. Miguel, A. Khripounoff, Geophys. Res. Lett. 37, 13604 (2010).
10. D. Smith, M. Simon, A. L. Alldredge, F. Azam, Nature 359, 139 (1992).11. D.K. Steinberg et al., Deep Sea Res. I 47, 137 (2000).12. J. B. Cotner, J. W. Ammerman, E. R. Peele, E. Bentzen, Aquat. Microb. Ecol.
13, 141 (1997).13. T. F. Thingstad, A. Hagstrom, F. Rassoulzadegan, Limnol. Oceanogr. 42, 398
(1997).14. L. I. Aluwihare, D. J. Repeta, R. F. Chen, Nature 387, 166 (1997).15. R. H. Benner, in Biogeochemistry of Marine Dissolved Organic Matter, D. A.
Hansell, C. A. Carlson, Eds. (Academic Press, San Diego, 2002), pp. 59–90.16. E. F. DeLong et al., Science 311, 496 (2006).17. A. H. Treusch et al., ISME J. 3, 1148 (2009).18. S. M. Sowell et al., ISME J. 3, 931–105 (2008).19. R. G. Keil, D. L. Kirchman, Mar. Chem. 45, 187 (1994).20. T. Naganuma et al., Mar. Ecol. Prog. Ser. 135, 309 (1996).21. R. Benner, B. Biddanda, Limnol. Oceanogr. 43, 1373 (1998).22. L. C. Maillard, Compt. Rend. 154, 66 (1912).23. E. Tanoue, S. Nishiyama, M. Kamo, A. Tsugita, Geochim. Cosmochim. Acta
59, 2643 (1995).24. M. D. McCarthy, J. I. Hedges, R. Benner, Science 281, 231 (1998).25. R. Benner, K. Kaiser, Limnol. Oceanogr. 48, 118 (2003).26. K. Kaiser, R. Benner, Limnol. Oceanogr. 53, 1192 (2008).27. T. Nagata, D. L. Kirchman, Arch. Hydrobiol. 35, 99 (1992).28. E. B. Kujawinski, Annu. Rev. Mar. Sci. 3, 567 (2011).29. G. L. Cowie, J. I. Hedges, Nature 369, 304 (1994).30. R. M. W. Amon, R. Benner, Limnol. Oceanogr. 41, 41 (1996).31. A. Skoog, R. Benner, Limnol. Oceanogr. 42, 1803 (1997).32. S. J. Goldberg, C. A. Carlson, D. A. Hansell, N. B. Nelson, D. A. Siegel, Deep
Sea Res. I 56, 672 (2009).33. N. Jiao, et al., Nat. Rev. Microbiol. 8, 593 (2010).34. H. Ogawa, Y. Amagai, I. Koike, K. Kaiser, R. Benner, Science 292, 917 (2001).35. C. Lønborg, X. A. Álvarez-Salgado, K. Davidson, A. Miller, Est. Coast. Shelf
Sci. 82, 682 (2009).
36. R. Benner, G. Herndl, Molecular Carbon Pump in the Ocean, N. Jiao, F. Azam, S. Sanders, Eds. (Science/AAAS, Washington DC, 2011), pp. 46–48.
37. C. A. Carlson et al., Deep Sea Res. II 57, 1433 (2010).38. R. M. Morris et al., Limnol. Oceanogr. 50, 1687 (2005).39. C. A. Carlson et al., ISME J. 3, 283 (2009).40. M. D. Doval, D. A. Hansell, Mar. Chem. 68, 249 (2000).41. D. A. Hansell, in Biogeochemistry of Marine Dissolved Organic Matter, D. A.
Hansell, C. A. Carlson, Eds. (Academic Press, San Diego, 2002), pp. 685–716.42. J. Arístequi, S. Agusti, J. J. Middelburg, C. M. Duarte, in Respiration in Aquatic
Systems, P. del Giorgio, P. J. L. Williams, Eds. (Oxford Press, Oxford, 2005), pp. 181–205.
43. M. S. Rappé, S. J. Giovannoni, Annu. Rev. Microbiol. 57, 369 (2003).44. J. C. Venter, et al., Science 304, 66 (2004).45. S. J. Giovannoni, M. S. Rappé, K. Vergin, N. Adair, Proc. Natl. Acad. Sci. U.S.A.
93, 7979 (1996).46. K. G. Field et al., Appl. Environ. Microbiol. 63, 63 (1997).47. S. J. Giovannoni et al., Science 309, 1242 (2005).48. R. S. Poretsky, S. Sun, X. Mou, M. A. Moran, Environ. Microbiol. 12, 616
(2010).49. J. McCarren et al., Proc. Natl. Acad. Sci. U.S.A. 107, 16420 (2010).50. M. T. Cottrell, D. L. Kirchman, Appl. Environ. Microbiol. 66, 1692 (2000).51. C. A. Carlson et al., Limnol. Oceanogr. 49, 1073 (2004).52. C. Arnosti, S. Durkin, W. H. Jeffrey, Aquat. Microb. Ecol. 38, 135 (2005).53. R. R. Malmstrom, M. T. Cottrell, H. Elifantz, D. L. Kirchman, Appl. Environ.
Microbiol. 71, 2979 (2005).54. A. D. Steen, K. Ziervogel, C. Arnosti, Org. Geochem. 41, 1019 (2010).55. M. T. Pérez, C. Pausz, G. J. Herndl, Limnol. Oceanogr. 48, 755 (2003).56. E. Teira, H. van Aken, C. Veth, G. J. Herndl, Limnol. Oceanogr. 51, 60 (2006).57. C. Tamburini, J. Garcin, A. Bianchi, Aquat. Microb. Ecol. 32, 209 (2003).58. A. Vezzi S. et al., Science 307, 1459 (2005).59. F. Lauro, D. Bartlett, Extremophiles 12, 15 (2007).60. H. G. Hoppe, S. Ullrich, Aquat. Microb. Ecol. 19, 139 (1999).61. C. Tamburini, J. Garcin, M. Ragot, A. Bianchi, Deep Sea Res. II 49, 2109 (2002).62. R. Zaccone et al., J. Geophys. Res. 108, 8117 (2003).63. C. Tamburini et al., Deep Sea Res. II 56, 700 (2009).64. F. Baltar, J. Arístegui, J. M. Gasol, G. J. Herndl, Aquat. Microb. Ecol. 60, 227
(2010).65. H. G. Hoppe, C. Arnosti, G. J. Herndl, in Enzymes in the Environment: Activity,
Ecology and Applications, R. G. Burns, R. P. Dick, Eds. (Marcel Dekker, New York, 2002), pp. 73–108.
66. C. S. Hopkinson, J. J. Vallino, Nature 433, 142 (2005).67. This work was supported by Scientific Committee on Oceanic Research
(WG134) and NSF (OCE) 0801991, 0850857 to CAC; 0752972 to DAH and CAC; and ANR-POTES, ANR-05-BLAN-0161-01 to CT.

60
Most of the dissolved organic matter (DOM) produced in sur-face waters, such as labile proteins, carbohydrates, and lipids, is mineralized by microbial activity,
and the remaining material is transformed into semilabile DOM and finally refractory DOM (1), a process in which the microbial carbon pump (MCP) plays an important role (2). The molecular composition of labile DOM is modi-fied rapidly during decay, creating a material for which chemical structures are largely unknown and currently indeterminable. The decay pro-cess results in a large variety of compounds with completely new chemical structures, which ex-ist in predominantly dissolved, but also particu-late, forms. These transformations are mediated by microbial, viral, and photochemical activity, and proceed continuously over periods from days to months and beyond to decades and hun-dreds of years. Dissolved organic carbon (DOC) in the deep ocean therefore has an average age of 4,000 to 6,000 years (3).
A puzzling and still unanswered question is why this DOM resists biotic and abiotic decom-position and why it is unavailable to heterotro-phic prokaryotes. Without knowing the molec-ular structures it is impossible to successfully tackle this question. However, it is also important to examine whether the prokaryotes in the ocean, and in particular in the dark ocean where the refractory DOM accumulates, have the genetic repertoire and appro-priate conditions to express the suitable genes encoding enzymes that can cleave and decompose the DOM molecular structures. Appropriate metagenomic and metatranscriptomic methods are now available to do this (4, 5, 6). In contrast, tools for the structural characterization of DOM in the ocean are limited by a number of factors: (i) Analyses thus far have essentially been restricted to carbohydrates, amino acids, amino-sugars, and lipids (7), compounds that represent only 10 to 20% of DOM in the near�surface and even less in the deep ocean; (ii) Because only a minor portion of these molecules exist as monomers, they are usually analyzed only after considerable chemical treatment (for example, hy-
drolysis) and thus the chemical structures in which they were originally embedded remain unknown; (iii) Data are often obtained following
isolation and fractionation of DOM using, for example, solid�phase ex-traction and ultrafiltration, but resulting fractions represent only a small portion of total DOM (~25% for ultrafiltration and ~40% for solid� phase extraction).
Successful molecular characterization of DOM using ultrahigh res-olution mass spectrometry (Fourier transform ion cyclotron resonance mass spectrometry; FT�ICR MS) represents a significant advance in the field, and progress has also been made applying collision induced dis-sociation FT�ICR MS (8). To date several thousand molecular formulas have been identified (Fig. 1) and a number of these may act as potential markers of DOM sources and modification processes. The occurrence of pseudohomologous series (addition/removal of CH2, H2, O2, or H2O to/from a given molecular formula) shows that there are regular pat-terns within the strong complexity of the molecular formulas of DOM (Fig. 2). Approximately one third of the detectable formulas are present in all marine samples and most likely represent a common refractory background in DOM (9).
The Problem: Why Microbes Cannot Decompose Refractory Deep-sea DOMIt has been previously argued that concentrations of individual DOM
Molecular Characterization of Dissolved Organic Matter and Constraints for Prokaryotic UtilizationGerhard Kattner1*, Meinhard Simon2, Boris P. Koch1,3
The chemical structures of marine dissolved organic matter (DOM) are largely unknown. However, ultrahigh resolution mass spectrometry recently allowed the identification of thousands of different molecular formulas and revealed that DOM is composed of a huge number of relatively small molecules (200 to 800 Da). Despite this success in dissecting marine DOM molecules, it remains unclear how biomolecules are transformed into refractory DOM and how the microbial carbon pump (MCP) contributes to this process. Besides a potential general resistance of DOM to prokaryotic attack, the low concentration of individual DOM constituents in the deep ocean may prevent energy-efficient microbial DOM consumption, even though bacteria have the genetic repertoire to exploit a high variety of molecular DOM structures. Further improvements in analytical and genomic technologies that will aid in the elucidation of DOM molecule structure, source, and degradation pathways should reveal the role refractory DOM and the MCP play in the global carbon cycle.
1Alfred Wegener Institute for Polar and Marine Research, Ecological Chemistry, Am Handelshafen 12, D-27570 Bremerhaven, Germany2Institute for Chemistry and Biology of the Marine Environment, University of Oldenburg, Carl-von-Ossietzky-Str. 9-11, D-26111 Oldenburg, Germany3University of Applied Sciences, An der Karlstadt 8, D-27568 Bremerhaven, Germany*To whom correspondence should be addressed. E-mail: [email protected]
Fig. 1. Different mass arrays of an ultrahigh resolution FT-ICR mass spectrum (electrospray ioniza-tion, negative mode) of a marine dissolved organic matter (DOM) sample that was extracted using a solid-phase process [sorbent PPL (17)]. From the exact masses, molecular formulas can be calcu-lated for thousands of peaks in each sample.
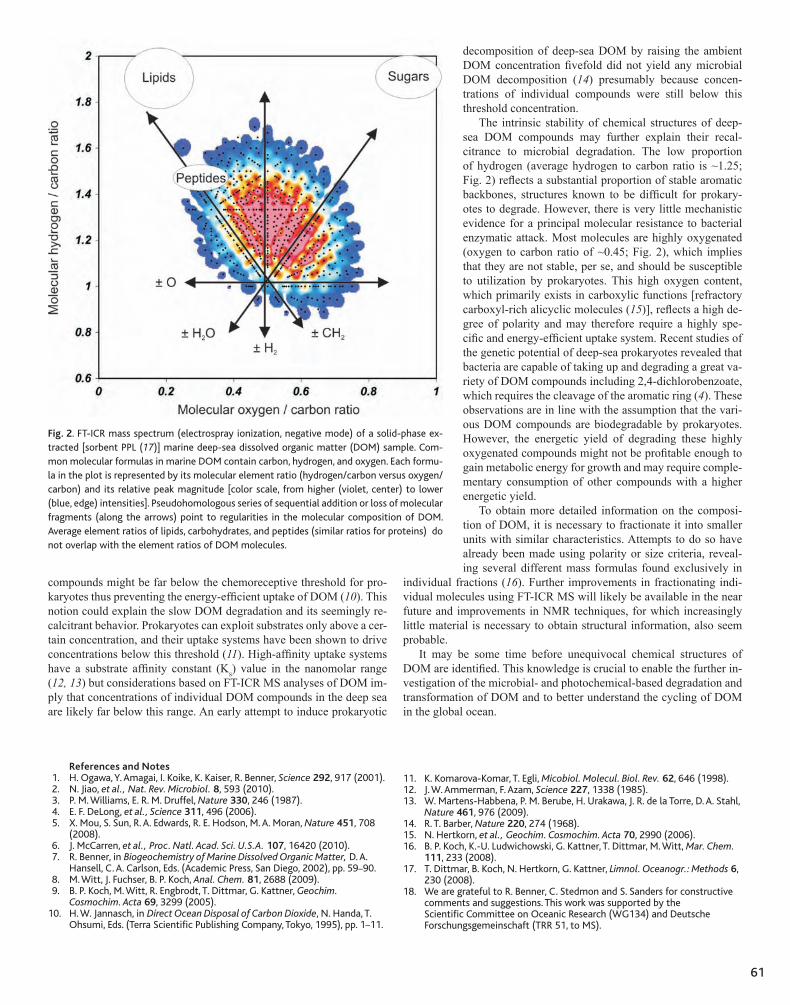
61
compounds might be far below the chemoreceptive threshold for pro-karyotes thus preventing the energy�efficient uptake of DOM (10). This notion could explain the slow DOM degradation and its seemingly re-calcitrant behavior. Prokaryotes can exploit substrates only above a cer-tain concentration, and their uptake systems have been shown to drive concentrations below this threshold (11). High�affinity uptake systems have a substrate affinity constant (Ks) value in the nanomolar range (12, 13) but considerations based on FT�ICR MS analyses of DOM im-ply that concentrations of individual DOM compounds in the deep sea are likely far below this range. An early attempt to induce prokaryotic
decomposition of deep�sea DOM by raising the ambient DOM concentration fivefold did not yield any microbial DOM decomposition (14) presumably because concen-trations of individual compounds were still below this threshold concentration.
The intrinsic stability of chemical structures of deep-sea DOM compounds may further explain their recal-citrance to microbial degradation. The low proportion of hydrogen (average hydrogen to carbon ratio is ~1.25; Fig. 2) reflects a substantial proportion of stable aromatic backbones, structures known to be difficult for prokary-otes to degrade. However, there is very little mechanistic evidence for a principal molecular resistance to bacterial enzymatic attack. Most molecules are highly oxygenated (oxygen to carbon ratio of ~0.45; Fig. 2), which implies that they are not stable, per se, and should be susceptible to utilization by prokaryotes. This high oxygen content, which primarily exists in carboxylic functions [refractory carboxyl-rich alicyclic molecules (15)], reflects a high de-gree of polarity and may therefore require a highly spe-cific and energy�efficient uptake system. Recent studies of the genetic potential of deep-sea prokaryotes revealed that bacteria are capable of taking up and degrading a great va-riety of DOM compounds including 2,4�dichlorobenzoate, which requires the cleavage of the aromatic ring (4). These observations are in line with the assumption that the vari-ous DOM compounds are biodegradable by prokaryotes. However, the energetic yield of degrading these highly oxygenated compounds might not be profitable enough to gain metabolic energy for growth and may require comple-mentary consumption of other compounds with a higher energetic yield.
To obtain more detailed information on the composi-tion of DOM, it is necessary to fractionate it into smaller units with similar characteristics. Attempts to do so have already been made using polarity or size criteria, reveal-ing several different mass formulas found exclusively in
individual fractions (16). Further improvements in fractionating indi-vidual molecules using FT�ICR MS will likely be available in the near future and improvements in NMR techniques, for which increasingly little material is necessary to obtain structural information, also seem probable.
It may be some time before unequivocal chemical structures of DOM are identified. This knowledge is crucial to enable the further in-vestigation of the microbial- and photochemical-based degradation and transformation of DOM and to better understand the cycling of DOM in the global ocean.
References and Notes 1. H. Ogawa, Y. Amagai, I. Koike, K. Kaiser, R. Benner, Science 292, 917 (2001). 2. N. Jiao, et al., Nat. Rev. Microbiol. 8, 593 (2010). 3. P. M. Williams, E. R. M. Druffel, Nature 330, 246 (1987). 4. E. F. DeLong, et al., Science 311, 496 (2006). 5. X. Mou, S. Sun, R. A. Edwards, R. E. Hodson, M. A. Moran, Nature 451, 708
(2008). 6. J. McCarren, et al., Proc. Natl. Acad. Sci. U.S.A. 107, 16420 (2010). 7. R. Benner, in Biogeochemistry of Marine Dissolved Organic Matter, D. A.
Hansell, C. A. Carlson, Eds. (Academic Press, San Diego, 2002), pp. 59–90. 8. M. Witt, J. Fuchser, B. P. Koch, Anal. Chem. 81, 2688 (2009). 9. B. P. Koch, M. Witt, R. Engbrodt, T. Dittmar, G. Kattner, Geochim.
Cosmochim. Acta 69, 3299 (2005).10. H. W. Jannasch, in Direct Ocean Disposal of Carbon Dioxide, N. Handa, T.
Ohsumi, Eds. (Terra Scientific Publishing Company, Tokyo, 1995), pp. 1–11.
11. K. Komarova-Komar, T. Egli, Micobiol. Molecul. Biol. Rev. 62, 646 (1998). 12. J. W. Ammerman, F. Azam, Science 227, 1338 (1985). 13. W. Martens-Habbena, P. M. Berube, H. Urakawa, J. R. de la Torre, D. A. Stahl,
Nature 461, 976 (2009).14. R. T. Barber, Nature 220, 274 (1968).15. N. Hertkorn, et al., Geochim. Cosmochim. Acta 70, 2990 (2006).16. B. P. Koch, K.-U. Ludwichowski, G. Kattner, T. Dittmar, M. Witt, Mar. Chem.
111, 233 (2008).17. T. Dittmar, B. Koch, N. Hertkorn, G. Kattner, Limnol. Oceanogr.: Methods 6,
230 (2008).18. We are grateful to R. Benner, C. Stedmon and S. Sanders for constructive
comments and suggestions. This work was supported by the Scientific Committee on Oceanic Research (WG134) and Deutsche Forschungsgemeinschaft (TRR 51, to MS).
Fig. 2. FT-ICR mass spectrum (electrospray ionization, negative mode) of a solid-phase ex-tracted [sorbent PPL (17)] marine deep-sea dissolved organic matter (DOM) sample. Com-mon molecular formulas in marine DOM contain carbon, hydrogen, and oxygen. Each formu-la in the plot is represented by its molecular element ratio (hydrogen/carbon versus oxygen/carbon) and its relative peak magnitude [color scale, from higher (violet, center) to lower (blue, edge) intensities]. Pseudohomologous series of sequential addition or loss of molecular fragments (along the arrows) point to regularities in the molecular composition of DOM. Average element ratios of lipids, carbohydrates, and peptides (similar ratios for proteins) do not overlap with the element ratios of DOM molecules.
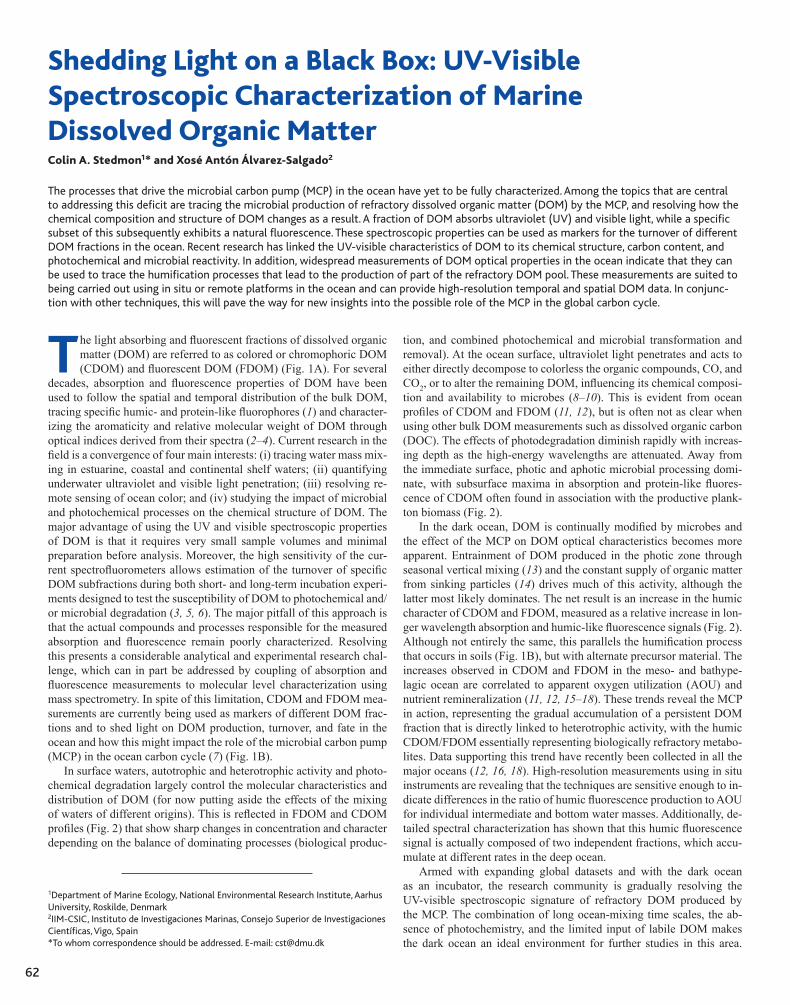
62
The light absorbing and fluorescent fractions of dissolved organic matter (DOM) are referred to as colored or chromophoric DOM (CDOM) and fluorescent DOM (FDOM) (Fig. 1A). For several
decades, absorption and fluorescence properties of DOM have been used to follow the spatial and temporal distribution of the bulk DOM, tracing specific humic� and protein�like fluorophores (1) and character-izing the aromaticity and relative molecular weight of DOM through optical indices derived from their spectra (2–4). Current research in the field is a convergence of four main interests: (i) tracing water mass mix-ing in estuarine, coastal and continental shelf waters; (ii) quantifying underwater ultraviolet and visible light penetration; (iii) resolving re-mote sensing of ocean color; and (iv) studying the impact of microbial and photochemical processes on the chemical structure of DOM. The major advantage of using the UV and visible spectroscopic properties of DOM is that it requires very small sample volumes and minimal preparation before analysis. Moreover, the high sensitivity of the cur-rent spectrofluorometers allows estimation of the turnover of specific DOM subfractions during both short� and long�term incubation experi-ments designed to test the susceptibility of DOM to photochemical and/or microbial degradation (3, 5, 6). The major pitfall of this approach is that the actual compounds and processes responsible for the measured absorption and fluorescence remain poorly characterized. Resolving this presents a considerable analytical and experimental research chal-lenge, which can in part be addressed by coupling of absorption and fluorescence measurements to molecular level characterization using mass spectrometry. In spite of this limitation, CDOM and FDOM mea-surements are currently being used as markers of different DOM frac-tions and to shed light on DOM production, turnover, and fate in the ocean and how this might impact the role of the microbial carbon pump (MCP) in the ocean carbon cycle (7) (Fig. 1B).
In surface waters, autotrophic and heterotrophic activity and photo-chemical degradation largely control the molecular characteristics and distribution of DOM (for now putting aside the effects of the mixing of waters of different origins). This is reflected in FDOM and CDOM profiles (Fig. 2) that show sharp changes in concentration and character depending on the balance of dominating processes (biological produc-
tion, and combined photochemical and microbial transformation and removal). At the ocean surface, ultraviolet light penetrates and acts to either directly decompose to colorless the organic compounds, CO, and CO2, or to alter the remaining DOM, influencing its chemical composi-tion and availability to microbes (8–10). This is evident from ocean profiles of CDOM and FDOM (11, 12), but is often not as clear when using other bulk DOM measurements such as dissolved organic carbon (DOC). The effects of photodegradation diminish rapidly with increas-ing depth as the high-energy wavelengths are attenuated. Away from the immediate surface, photic and aphotic microbial processing domi-nate, with subsurface maxima in absorption and protein�like fluores-cence of CDOM often found in association with the productive plank-ton biomass (Fig. 2).
In the dark ocean, DOM is continually modified by microbes and the effect of the MCP on DOM optical characteristics becomes more apparent. Entrainment of DOM produced in the photic zone through seasonal vertical mixing (13) and the constant supply of organic matter from sinking particles (14) drives much of this activity, although the latter most likely dominates. The net result is an increase in the humic character of CDOM and FDOM, measured as a relative increase in lon-ger wavelength absorption and humic�like fluorescence signals (Fig. 2). Although not entirely the same, this parallels the humification process that occurs in soils (Fig. 1B), but with alternate precursor material. The increases observed in CDOM and FDOM in the meso� and bathype-lagic ocean are correlated to apparent oxygen utilization (AOU) and nutrient remineralization (11, 12, 15–18). These trends reveal the MCP in action, representing the gradual accumulation of a persistent DOM fraction that is directly linked to heterotrophic activity, with the humic CDOM/FDOM essentially representing biologically refractory metabo-lites. Data supporting this trend have recently been collected in all the major oceans (12, 16, 18). High-resolution measurements using in situ instruments are revealing that the techniques are sensitive enough to in-dicate differences in the ratio of humic fluorescence production to AOU for individual intermediate and bottom water masses. Additionally, de-tailed spectral characterization has shown that this humic fluorescence signal is actually composed of two independent fractions, which accu-mulate at different rates in the deep ocean.
Armed with expanding global datasets and with the dark ocean as an incubator, the research community is gradually resolving the UV�visible spectroscopic signature of refractory DOM produced by the MCP. The combination of long ocean-mixing time scales, the ab-sence of photochemistry, and the limited input of labile DOM makes the dark ocean an ideal environment for further studies in this area.
Shedding Light on a Black Box: UV-Visible Spectroscopic Characterization of Marine Dissolved Organic MatterColin A. Stedmon1* and Xosé Antón Álvarez-Salgado2
The processes that drive the microbial carbon pump (MCP) in the ocean have yet to be fully characterized. Among the topics that are central to addressing this deficit are tracing the microbial production of refractory dissolved organic matter (DOM) by the MCP, and resolving how the chemical composition and structure of DOM changes as a result. A fraction of DOM absorbs ultraviolet (UV) and visible light, while a specific subset of this subsequently exhibits a natural fluorescence. These spectroscopic properties can be used as markers for the turnover of different DOM fractions in the ocean. Recent research has linked the UV-visible characteristics of DOM to its chemical structure, carbon content, and photochemical and microbial reactivity. In addition, widespread measurements of DOM optical properties in the ocean indicate that they can be used to trace the humification processes that lead to the production of part of the refractory DOM pool. These measurements are suited to being carried out using in situ or remote platforms in the ocean and can provide high-resolution temporal and spatial DOM data. In conjunc-tion with other techniques, this will pave the way for new insights into the possible role of the MCP in the global carbon cycle.
1Department of Marine Ecology, National Environmental Research Institute, Aarhus University, Roskilde, Denmark2IIM-CSIC, Instituto de Investigaciones Marinas, Consejo Superior de Investigaciones Científicas, Vigo, Spain*To whom correspondence should be addressed. E-mail: [email protected]

63
Fig 1. (A) Colored and fluorescent DOM (CDOM and FDOM, respectively) together represent a subfraction of the total DOM pool. Part of DOM does not absorb UV and visible light and is largely characterized as mono-meric and polymeric aliphatic compounds such as carbo-hydrates, lipids, and aliphatic amino acids. The presence of conjugated double bonds (polyenes) results in absorp-tion of UV and visible light. The presence of aromatic rings often also results in fluorescence. The large arrow indicates increasing aromaticity, conjugation, and carbon to hydrogen (C/H) ratio. Examples of CDOM absorption spectra and excitation-emission matrices are shown over the CDOM and FDOM domains, respectively. Structure of tryptophan, a natural amino acid, and vanillin, a con-stituent of lignin, are shown as examples of fluorescent CDOM. The grey lines indicate the position of their re-spective fluorescence excitation-emission peaks. (B) Soils of the sea: The processing of organic matter (particulate and dissolved, colored and colorless) by the microbial carbon pump (MCP) (7) not only results in formation of refractory DOM (RDOM) but also an alteration of the remaining organic matter, often referred to as humifica-tion and in principle similar to what occurs in soils. Dur-ing processing by the MCP, colorless or weakly colored bioavailable DOM (BDOM) and particulate organic mate-rial (POM) is transformed into colored refractory CDOM. The large arrow indicates that during this process both the carbon-specific absorption and apparent fluorescence quantum yield increase.
Fig 2. Generalized vertical distribution of the quantity and quality of DOM in the ocean. Idealized vertical pro-files of dissolved organic carbon (DOC) concentration, fluorescence intensity of amino acids (FDOM AA-like), and humic organic matter (Humic-like), and the concen-tration (solid line) and character (dotted line) of colored dissolved organic matter (CDOM). CDOM character is depicted as the slope of the absorption spectrum in the UV-visible wave-length range.
Additional widespread sampling, experimentation, and method-ological refinements linking UV�visible spectroscopic character of DOM to molecular level characterization (19) and carbon content (20) stand to pave the way for enhancing the utility of these optical measurements. In conjunction with the technological advances in op-
tical instrumentation, this will lead to the development of improved in situ instruments measuring fluorescence or absorption at specific wavelengths or spectral bands with high spatial and temporal resolu-tion, and designed to be routinely deployed on moorings, gliders, and profiling instrumentation.
References and Notes1. P. G. Coble, Chem. Rev. 107, 402 (2007).2. J. L. Weishaar, et al., Environ. Sci. Technol., 37, 4702 (2003).3. J. Helms, et al., Limnol. Oceanogr. 53, 955 (2008).4. S. A. Green, N. V. Blough, Limnol. Oceanogr. 39, 1903 (1994).5. C. A. Stedmon, S.S. Markager, Limnol. Oceanogr. 50, 1415 (2005).6. M. Nieto-Cid, X. A. Álvarez-Salgado, F. F. Perez, Limnol. Oceanogr. 51, 1391
(2006).7. N. Jiao, et al., Nat. Rev. Microbiol. 8, 593 (2010).8. R. J. Kieber, L. H. Hydro, P. J. Seaton, Limnol. Oceanogr. 42, 1454 (1997).9. M. A. Moran, R. G. Zepp, Limnol. Oceanogr. 42, 1307 (1997).
10. R. Benner, B. Biddanda, Limnol. Oceanogr. 43, 1373 (1998).11. K. Hayase, N. Shinozuka, Mar. Chem. 48, 283 (1995).12. N. B. Nelson, D. A. Siegel, C. A. Carlson, C. M. Swan, Geophy. Res. Lett. 37,
L03610 (2010).13. D. A. Hansell, C. A. Carlson, D. J. Repeta, R. Schlitzer, Oceanography 22, 52
(2009).
14. J. Arístegui, J. M. Gasol, C. M. Duarte, G. J. Herndl, Limnol. Oceanogr. 54, 1501 (2009).
15. R. F. Chen, J. L. Bada, Mar. Chem. 37, 191 (1992).16. Y. Yamashita, E. Tanoue, Nat. Geo. doi:10.1038/ngeo279 (2008).17. Y. Yamashita, A. Tsukasaki, T. Nishida, E. Tanoue, Mar. Chem. 106, 498
(2007).18. L. W. Cooper, et al., J. Geophys. Res. 110, G02013 (2005).19. G. Kattner, M. Simon, B. P. Koch, Molecular Carbon Pump in the Ocean
(2011), pp. 60–61.20. C. G. Fischot, R. Benner, Geophys. Res. Lett. 38, L03610 (2011).21. This work was supported by the Scientific Committee on Oceanic Research
(WG134), the Danish Council for Strategic Research (10-093903), the Galician General Direction for R+D+i (07MMA002402PR), and the Spanish Ministry of Science and Innovation (MALASPINA, grant number CSD2008–00077). M. J. Pazó helped with illustrations. Discussions with G. Kattner and R. Benner have contributed to improve the manuscript.

64
Application of Functional Gene Arrays (GeoChips) in Monitoring Carbon CyclingJoy D. Van Nostrand and Jizhong Zhou*
Functional gene arrays (FGAs) provide a way, through in-depth genomic analysis, to link environmental processes with microbial communities. They comprise probes for a wide range of genes involved in functional processes of interest (e.g., carbon degradation, C- and N-fixation, metal resistance) from many different microorganisms, both cultured and uncultured. The most comprehensive FGA reported to date is the GeoChip 3.0, which includes approximately 28,000 probes covering approximately 57,000 gene variants from 292 functional gene families involved in carbon, nitrogen, phosphorus and sulfur cycling, energy metabolism, antibiotic resistance, metal resistance, and organic contaminant degradation. This technology has been used successfully to examine the effects of environmental change on microbial communities. This article provides an overview of GeoChip development and utilization with an emphasis on studies examining various aspects of carbon cycling.
DNA microarrays can overcome many of the limitations of other molecular techniques such as the need for polymerase chain reaction (PCR) amplification steps, which restricts the number
of genes that can be detected due to limitations in primer availability and coverage. Microarrays provide information on the functional abilities of microbial communities and can also provide phylogenetic information at a higher resolution than other 16S rRNA�based methods and with fewer sampling errors. GeoChip provides a species�strain level of resolution (1) while 16S rRNA gene�based sequencing only provides a genus-species level of resolution (Zhili He, personal communication). They are less time-consuming and often cheaper to use than other methods, and have the ability to provide more accurate comparisons since they can interrogate multiple samples using the same set of probes (2). One disadvantage, however, is the inability of arrays to interrogate novel sequences.
GeoChip Functional Gene ArraysFunctional gene arrays (FGAs) are composed of probes for microbial genes involved in functional processes, such as nitrification or carbon degradation (3–5). The most comprehensive FGAs are the GeoChip ar-rays, which contains probes for thousands of functional genes (4, 5). The first reported FGA used PCR amplicon probes and demonstrated that such arrays are an effective tool for genomic studies of microbi-al communities (3). Later versions use oligonucleotide probes (1, 6), which, although less sensitive, provide higher specificity since they are easily customized to afford a more targeted probe design (7).
The GeoChip has gone through several development iterations, from the first proof�of�concept array to the current version 4.0, with the ultimate goal of providing a comprehensive probe set with high speci-ficity and able to distinguish between highly homologous genes (4, 5). GeoChip 4.0 uses the Nimblegen array format, covering 410 functional gene families including probes for carbon, nitrogen, phosphorus, and sulfur cycling, metal resistance and reduction, virulence genes, stress response, and bacterial phage genes.
GeoChip DevelopmentProbe design. Gene regions selected for targeting on an array should encode the catalytic or active sites of proteins key to the functions of interest. To find these, public DNA databases are searched for suitable genes using broad search terms. Seed sequences from only those genes that have had protein identity and function experimentally determined
are used to confirm sequence identity for all downloaded sequences us-ing HMMER alignment (8). Probes (50-mer) are then designed using CommOligo software (9) based on experimentally determined criteria (sequence homology, continuous stretch length, and free energy) (10), and screened against the GenBank database to ensure specificity.
Target preparation and hybridization. The use of high quality nucleic acid starting material to query microarrays is extremely im-portant. Purified DNA should have absorbance ratios of A260:A280 > 1.8 and A260:A230 > 1.7. The A260:A230 ratio has the most influence on hybridization success (11). Whole community genome amplifica-tion (WCGA) can increase the amount of DNA available using a small quantity of initial DNA (1 to 100 ng) and provide a sensitive (10 fg detection limit) and representative amplification (12). To examine ac-tivity, RNA can be used. Stable isotope probing is another means to evaluate activity, by hybridizing 13C�DNA after incubation with a 13C-labeled carbon source, such as biphenyl (13). Nucleic acids are then labeled with cyanine dye, purified, dried, and resuspended in a hybrid-ization buffer. GeoChips are hybridized at 42 to 50°C and 40 to 50% formamide (4, 14, 15).
Issues in Microarray ApplicationSensitivity. The current sensitivity for oligonucleotide arrays using en-vironmental samples is approximately 50 to 100 ng (107 cells) (1, 6, 16) or ~5% of the microbial community (16), providing coverage of only the most dominant community members. Several strategies can be used to increase sensitivity, including (i) amplifying target DNA or RNA (12, 17), (ii) increasing probe length (7, 18) [although this also decreases specificity (19)], (iii) increasing probe concentration per spot (19), (iv) decreasing hybridization buffer volume (20), (v) mixing dur-ing hybridization (21), (vi) alternate labeling (7), and (vii) reducing ozone concentrations (22).
Specificity. Specificity is especially important since so many en-vironmental microorganisms remain uncharacterized. Strategies to in-crease specificity include (i) modifying probe design criteria (4, 18) or (ii) increasing hybridization stringency by elevating temperature or formamide concentration.
Quantitation. There is a correlation between signal intensity and DNA concentration, indicating that microarrays can provide quantita-tive information. Oligonucleotide probes (50�mer) have been shown to maintain a linear relationship (r=0.98–0.99) over a concentration range of 8 to 1000 ng (1), while RNA has a linear response over the range of 50 to 100 ng (17).
Application of the GeoChipGeoChips have been used to examine a variety of microbial communi-ties at contaminated sites (1, 4, 6, 12, 15, 23, 24), in marine environ-ments (25), and in soils (2).
Institute for Environmental Genomics and Dept. of Botany and Microbiology, University of Oklahoma, Norman, OK USA
*To whom correspondence should be addressed. E-mail: [email protected]

65
Insights into carbon cycling. The latest GeoChips (versions 3.0 and 4.0) include coverage of many genes that are useful for studying the microbial carbon pump (26). GeoChip version 3.0 contains probes for 41 genes involved in carbon cycling, including four CO2 fixation genes and 25 genes involved in carbon degradation (labile to refrac-tory), methanogenesis, two for methane oxidation, acetogenesis, and another eight miscellaneous enzymes. GeoChip 4.0 has expanded gene coverage to include those for bacterial lysis by viruses, which may be involved in the release of dissolved organic carbon in the oceans (26). Genes for carbon fixation and degradation in algae and other microbial eukaryotes will be included in future versions.
While not directly examining carbon pumps, several GeoChip stud-ies have provided insights into carbon cycling in the marine environ-ment. GeoChip analysis has indicated that carbon fixation, methane oxidation, and methanogenesis may be occurring in deep-sea basalts, activities that had not previously been associated with this environment (14). In a study examining deep sea hydrothermal vent microbial com-munities, GeoChips detected RuBisCO genes that perform an impor-tant initial step in carbon fixation from photosynthetic microorganisms, supporting the assertion that organisms able to grow by acquiring geo-thermal radiation may live in environments lacking light, such as this one (27). In addition, detection of a large number of genes involved in the Calvin Benson Bassham cycle suggested that autotrophic microor-ganisms within the hydrothermal vent communities may principally use
this cycle rather than the Krebs cycle, providing a greater insight into carbon cycling occurring in the deep ocean (27).
Previous research focusing on the effects of elevated CO2 levels in soil communities may lend some insight into how climate change can affect the global carbon cycle, including carbon pumps in the ocean. In one study, results of GeoChip 3.0 analysis following a ten�year exposure of grassland to elevated CO2 indicated that there were both overall changes in the soil microbial community’s functional structure and composition (as evidenced by distinct clustering of ambient and elevated CO2 samples in detrended correspondence analysis) as well as a significant increase in carbon fixation (28).
SummaryGeoChip arrays have garnered a great deal of attention and have been demonstrated to be useful for studying microbial ecology, link-ing microbial communities with geochemical cycling, and addressing high-level ecological questions pertaining to global climate change and ecological theory. The GeoChip provides sensitive, specific, and potentially quantitative information regarding microbial communi-ties. However, many technical, experimental, and data analysis chal-lenges remain, including a need to improve the sensitivity and quan-titative accuracy of the arrays and to develop bioinformatic tools and techniques to analyze, evaluate, and interpret the vast amounts of data being generated.
References and Notes 1. S. M. Tiquia, et al., Biotechniques. 36, 1 (2004).2. J. Zhou, S. Kang, C. W. Schadt, and C. T. Garten, Jr., Proc. Natl. Acad. Sci.
U.S.A. 105, 7768 (2008).3. L. Wu, et al., Appl. Environ. Microbiol. 67, 5780 (2001).4. Z. He, et al., ISME J. 1, 67 (2007).5. Z. He, et al., ISME J. 4, 1167 (2010).6. S. K. Rhee, et al., Appl. Environ. Microbiol. 70, 4303 (2004).7. V. J. Denef, et al., Environ. Micrbiol. 5, 933 (2003).8. S. R. Eddy, Bioinformatics. 14, 755 (1998).9. X. Li, Z. He, J. Zhou, Nucleic Acids Res. 33, 6114 (2005).
10. Z. He, L.-Y. Wu, X.-Y. Li, M. W. Fields, J.-Z. Zhou, Appl. Environ. Microbiol. 71, 3753 (2005).
11. J. Ning, et al., Appl. Microbiol. Biotechnol. 82, 983 (2009).12. L.Wu, X. Liu, C. W. Schadt, J. Zhou, Appl. Environ. Microbiol. 72,
4931 (2006).13. M. B. Leigh, et al., ISME J. 1, 134 (2007).14. O. U. Mason, et al., ISME J. 3, 231 (2009).15. P. J. Waldron, et al., Environ. Sci. Technol. 43, 3529 (2009).16. L. Bodrossy, et al., Environ. Microbiol. 5, 566 (2003).17. H. Gao, et al., Appl. Environ. Microbiol. 73, 563 (2007).
18. Z. He, L. Wu, M. W. Fields, J. Zhou, Appl. Environ. Microbiol. 71, 5154 (2005).
19. A. Relógio, C. Schwager, A. Richter, W. Ansorge, J. Valcárcel, Nucleic Acids Res. 30, e51 (2002).
20. L. Wu, et al., Environ. Sci. Technol. 38, 6775 (2004).21. C. J. Schaupp, G. Jiang, T. G. Myers, M. A. Wilson, BioTechniques. 38, 117
(2005).22. W. Branham, et al., BMC Biotechnol. 7, 8 (2007).23. J. Xiong, et al., Appl. Environ. Microbiol. (2010), doi:10.1128/AEM.00500-10.24. T. C. Hazen, et al., Science. 330, 204 (2010).25. N. E. Kimes, J. D. Van Nostrand, E. Weil, J. Zhou, P. J. Morris, Environ.
Microbiol. 12, 541 (2010).26. N. Jiao, et al., Nat. Rev. Microbiol. 8, 593 (2010).27. F. Wang, et al., Proc. Natl. Acad. Sci. U.S.A. 106, 4840 (2009).28. Z. He, et al., Ecol. Lett. 13, 564 (2010).29. This work was supported by ENIGMA (DE-AC02-05CH11231),
Environmental Remediation Science Program, Oklahoma Applied Research Support, Oklahoma Center for the Advancement of Science and Technology, Oklahoma Bioenergy Center, the State of Oklahoma (AR062-034).

66
Modeling dissolved organic carbon (DOC) degradation remains challenging due to factors including the complex nature of DOC, the variety of microorganisms using different meta-
bolic pathways necessary for DOC breakdown, and the various oceanic physicochemical conditions that regulate bacterial metabolism. In this review, we identify those variables (for example, DOC concentration and bacterial biomass) relevant to accurately model bacterial-driven DOC pathways and forcing factors (forces external to the system, act-ing upon it, for example, temperature and depth).
The Multi�G model represents DOC degradation using DOC con-centration as a single variable. DOC concentration decay is assumed to be at a constant rate and is therefore represented by first order kinetics (Eq. 1, Table 1) (1, 2). Multi�G�based models do not include specific biological activity (Fig. 1A), even though bacteria are recognized as the main agents of DOC degradation (3). A more accurate representation of DOC dynamics requires the inclusion of more detailed information about bacterial metabolism (4). The Monod model is an example of the next generation of model, which includes bacterial biomass as a vari-able (Eq. 2, Table 1). This model is the most widely used in ecosystem studies, taking into account bacterial population growth as a result of DOC consumption (5–7). It assumes that assimilated DOC is instanta-neously converted to bacterial biomass with constant bacterial growth efficiency (BGE), and that the complementary proportion (1�BGE) is used for bacterial respiration (Fig. 1B). Although the predicted results obtained when applying the Monod model agree well with experimen-tal observations (8), certain parameters such as BGE vary widely as a function of DOC chemical characteristics (9) and environmental con-ditions [temperature (10), and depth (8)]. This model fails, however, when DOC availability changes suddenly, making it inappropriate for modeling natural ecosystems that are subject to frequent environmental variations (11).
Variability in DOC and nutrient quality and availability may have some effects on the physiological status of bacterial communities (12). These effects on bacterial stoichiometry have been modeled using the Droop equations, where, for example, carbon and phosphorus (13), or carbon, nitrogen, and phosphorus (14), are limiting. According to this model, population growth depends on a pool of internal nutrients inside
the bacterial cells (Fig. 1C; Eq. 3, Table 1), such as an internal reserve of organic carbon that allows cells to survive periods of starvation. This can also be taken into account using the dynamic energy budget (DEB) model (15), where population growth resulting from DOC consumption is modeled using at least two bacterial variables, the reserve and the structure of the cell (Fig. 1D; Eq. 4, Table 1). The DEB model is also appropriate for handling variable resource environments and variable bacterial stoichiometry because it can be extended to deal with systems using several substrates (15) (Fig. 1E). Furthermore, DEB considers the concept of maintenance that reflects the fact that bacteria use intracel-lular DOC not only for growth but also for physiological activities that do not produce new biomass (osmotic regulation, maintenance of intra-cellular pH, macromolecule turnover) (16, 17). The importance of such considerations in changing environments has been demonstrated in ex-periments in which bacteria are exposed to episodic inputs of labile DOC (LDOC), where DOC utilization for maintenance is detectable during starvation (11). Maintenance cannot be neglected, since bacte-rial survival under starvation conditions is a fundamental aspect of bac-terial existence and something bacteria experience often (17). In some studies of marine DOC cycling, maintenance modeling is restricted to the respiration process (RB in Eq. 3, Table 1) (13, 16, 18). These models may prove useful for estimating the contribution from bacteria to the biological carbon pump, but not to the microbial carbon pump (MCP), since the latter assesses the role of microbial processes in refractory DOC (RDOC) generation and in carbon storage in the ocean (19). By contrast, in the DEB model, maintenance activity incorporates not only respiration, but also a set of processes which can include RDOC pro-duction (Fig. 1D). This RDOC contributes to the total RDOC in the ocean. Since the DEB model accounts for this RDOC production ex-plicitly, its use is relevant for connecting the biological carbon pump and the MCP.
Although RDOC production by marine bacteria has been studied both under controlled experimental conditions (20–22) and in situ (23), mechanisms of this production are still unresolved. Only a few models include bacterially derived DOC at either a microbial level (11, 20, 24) or at an ecosystem level (25). A study based on pure cultures indicated that bacterial RDOC production may occur as a stress response when LDOC availability is low; this can be represented using the DEB model where, in the case of starvation, maintenance costs are mainly paid not by bacterial reserve, but rather by bacterial structure, leading to the pro-duction of RDOC (20).
In order to extrapolate how long-term changes (e.g. warming) in-fluence DOC dynamics and organic carbon storage in marine waters,
Toward a Mechanistic Approach to Modeling Bacterial DOC Pathways: A ReviewMarie Eichinger1, 2*, Jean-Christophe Poggiale1, 2, and Richard Sempéré1, 2
Dissolved organic carbon (DOC) can be mineralized into CO2 through bacterial respiration, reenter the trophic chain if bacterial biomass is grazed, or be partly stored in a recalcitrant form for millennia in the deep ocean by bacterial production during DOC degradation. This review compares mathematical models used to represent these pathways in the context of the current knowledge of bacterial metabolism, and examines how they may be related to the biological carbon pump and the microbial carbon pump. In view of the ever-changing environments in which bacteria exist, the authors propose that models of DOC degradation should be based on data from experiments in which bacteria are subjected to external constraints, such as DOC availability, temperature, and ocean depth. Further, the need for combining experimental and mechanistic modeling approaches to advance our understanding of the factors that affect oceanic DOC cycling and organic carbon storage is discussed.
1Université de la Méditerranée, LMGEM, Centre d’Océanologie de Marseille, Case 901, 13288 Marseille Cedex 9, France2CNRS/INSU, UMR 6117, LMGEM, Case 901, 13288 Marseille Cedex 9, France*To whom correspondence should be addressed. E-mail: [email protected]
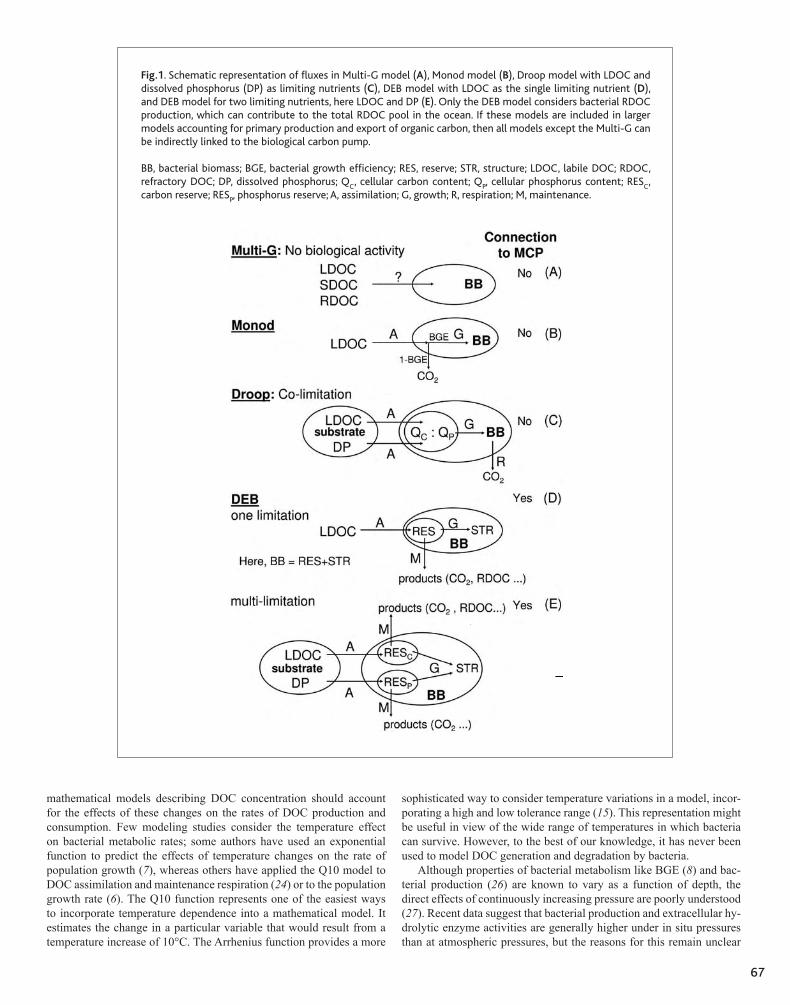
67
mathematical models describing DOC concentration should account for the effects of these changes on the rates of DOC production and consumption. Few modeling studies consider the temperature effect on bacterial metabolic rates; some authors have used an exponential function to predict the effects of temperature changes on the rate of population growth (7), whereas others have applied the Q10 model to DOC assimilation and maintenance respiration (24) or to the population growth rate (6). The Q10 function represents one of the easiest ways to incorporate temperature dependence into a mathematical model. It estimates the change in a particular variable that would result from a temperature increase of 10°C. The Arrhenius function provides a more
sophisticated way to consider temperature variations in a model, incor-porating a high and low tolerance range (15). This representation might be useful in view of the wide range of temperatures in which bacteria can survive. However, to the best of our knowledge, it has never been used to model DOC generation and degradation by bacteria.
Although properties of bacterial metabolism like BGE (8) and bac-terial production (26) are known to vary as a function of depth, the direct effects of continuously increasing pressure are poorly understood (27). Recent data suggest that bacterial production and extracellular hy-drolytic enzyme activities are generally higher under in situ pressures than at atmospheric pressures, but the reasons for this remain unclear
Fig.1. Schematic representation of fluxes in Multi-G model (A), Monod model (B), Droop model with LDOC and dissolved phosphorus (DP) as limiting nutrients (C), DEB model with LDOC as the single limiting nutrient (D), and DEB model for two limiting nutrients, here LDOC and DP (E). Only the DEB model considers bacterial RDOC production, which can contribute to the total RDOC pool in the ocean. If these models are included in larger models accounting for primary production and export of organic carbon, then all models except the Multi-G can be indirectly linked to the biological carbon pump.
BB, bacterial biomass; BGE, bacterial growth efficiency; RES, reserve; STR, structure; LDOC, labile DOC; RDOC, refractory DOC; DP, dissolved phosphorus; QC, cellular carbon content; QP, cellular phosphorus content; RESC, carbon reserve; RESP, phosphorus reserve; A, assimilation; G, growth; R, respiration; M, maintenance.

68
(28). In view of the number of bacteria present at depth, this issue needs to be more thoroughly investigated. Similarly, insufficient information on the effects of pH on bacteria�driven DOC degradation precludes its inclusion in current models. There is some evidence that lower pH in-creases bacterial production and degradation, but bacterial respiration and BGE have not yet been studied with respect to ocean acidification
(3). Changes in seawater chemistry due to ocean warming and acidifi-cation are expected to enhance microbial activity and channel a greater fraction of the fixed carbon into DOC (29, 30), thus potentially increas-ing the importance of the MCP in the oceanic carbon flow. The rele-vance of the MCP in carbon cycling and storage, and how these changes might affect it should also be investigated using appropriate models.
Table 1. Equations of each model described in the review. t, time; LDOC, labile DOC; SDOC, semilabile DOC; RDOC, refractory DOC; BB, bacterial biomass, Bc, bacterial biomass in carbon, Vmax maximum LDOC uptake rate; K, half-saturation constant.
References and Notes1. C. S. J. Hopkinson, J. J. Vallino, A. Nolin, Deep Sea Res. II 49, 4461 (2002).2. Y. Yamanaka, E. Tajika, Global Biogeochem. Cycles 11, 599 (1997).3. J. Liu, M. G. Weinbauer, C. Maier, M. Dai, J. P. Gattuso, Aquat. Microb. Ecol.
61, 291 (2010).4. F. Talin, C. Tolla, C. Rabouille, J. C. Poggiale, Acta Biotheor. 51, 295 (2003).5. T. R. Anderson, P. J. l. B. Williams, Global Biogeochem. Cycles 13, 337
(1999).6. J. Bendtsen, C. Lundsgaard, M. Middelboe, D. Archer, Global Biogeoch.
Cycles 16, Art. No. 1127 (2002).7. R. C. Tian, A. F. Vézina, D. Deibel, R. Rivkin, Global Biogeochem. Cycles 17
(2003).8. M. Eichinger, J. C. Poggiale, F. Van Wambeke, D. Lefèvre, R. Sempéré, Aquat.
Microb. Ecol. 43, 139 (2006).9. R. M. W. Amon, R. Benner, Limnol. Oceanogr. 41, 41 (1996).
10. R. B. Rivkin, L. Legendre, Science 291, 2398 (2001).11. M. Eichinger et al., Biogeosciences 7, 1861 (2010).12. C. A. Carlson et al., Aquat. Microb. Ecol. 30, 19 (2002).13. E. K. Hall, C. Neuhauser, J. B. Cotner, ISME J. 2, 471 (2008).14. T. F. Thingstad, Mar. Ecol. Prog. Ser. 35, 99 (1987).15. S. A. L. M. Kooijman, Dynamic energy budget theory for metabolic
organisation (Cambridge University Press, Cambridge, ed. 3, 2010).16. R. Cajal-Medrano, H. Maske, Aquat. Microb. Ecol. 38, 125 (2005).17. R. Y. Morita, Bacteria in oligotrophic environment: starvation - survival
lifestyle (Chapman & Hall, New York, 1997)18. J. G. Baretta-Bekker, B. Riemann, J. W. Baretta, E. Koch Rasmussen, Mar.
Ecol. Prog. Ser. 106, 187 (1994).19. N. Jiao et al., Nat. Rev. Microbiol. 8, 593 (2010).20. M. Eichinger et al., Aquat. Microb. Ecol. 56, 41 (2009).21. D. F. Gruber, J. P. Simjouw, S. P. Seitzinger, G. L. Taghon, Appl. Environ.
Microb. 72, 4184 (2006).22. H. Ogawa, Y. Amagai, I. Koike, K. Kaiser, R. Benner, Science 292, 917 (2001).23. K. Kaiser, R. Benner, Limnol. Oceanogr. 53, 99 (2008).24. L. Polimene, J. I. Allen, M. Zavatarelli, Aquat. Microb. Ecol. 43, 127 (2006).25. L. Polimene et al., J. Geophys. Res. Oceans 112,
doi:10.1029/2006JC003529 (2007).26. T. Reinthaler et al., Limnol. Oceanogr. 51, 1262 (2006).27. C. Tamburini et al., Deep Sea Res. II 56, 1533 (2009).28. T. Nagata et al., Deep Sea Res. II 57 1519 (2010).29. J. Raven et al., Ocean acidification due to increasing atmospheric carbon
dioxide. (The Royal Society, London, 12, 2005).30. U. Riebesell et al., Nature 450, 545 (2007).31. Acknowledgements: The authors are grateful to members of the SCOR
Working Group on the "Microbial Carbon Pump in the Ocean" for help-ful discussions. Special thanks to N. Jiao, F. Azam, R. Benner, and G. Herndl for fruitful comments on the manuscript. This work was sup-ported by the French CNRS/INSU and Université de la Méditerranée.

ScienceCareers.org
An exceptional career requires insightful planning and management. That’s where Science Careers comes in. From job search to career enhancement, Science Careers has the tools and resources to help you achieve your goals. Get yourself on the right track today and get a real career plan that works. Visit ScienceCareers.org.
Get a Career Plan that Works.
Napkin_full.indd 1 2/15/11 3:38 PM