Embed Size (px)
DESCRIPTION
Supplemental Figure 1. Supplemental Figure 1. Levels of nitrate, carbohydrates and metabolites involved in nitrate assimilation, and the medium pH. - PowerPoint PPT Presentation
Citation preview

Supplemental Figure 1. Levels of nitrate, carbohydrates and metabolites involved in nitrate assimilation, and the medium pH.
Starch and the sum of Glucose, Fructose and Sucrose are expressed as µmole hexose equivalents per gram fresh weight (µmoles HEq gFW-1). Seedlings were grown in liquid culture with full nutrients including 0.5% sucrose in continuous light for 7 days, and then for a further 2 days on full nutrient medium, or on low N medium quickly leading to N starvation (see Materials and Methods). Samples were taken two days later from seedlings on full medium and seedlings on N-deficient medium, and from seedlings that had been incubated on N-deficient medium for 2 days before adding 3 mM KNO3 for 30 min, 3 h and (see Figures 4 and 5) 8 and 24 h. Control N-deficient seedlings were provided with 3mM KCl for 30 min, 3, 8 and 24 h. Metabolite levels in N-starved seedlings prior to NO 3
- addition are shown as cross-hatched bars, those of KNO3-fed ones as gray bars, the KCl controls as white bars, and those of N-replete seedlings as black bars.
Supplemental Figure 1
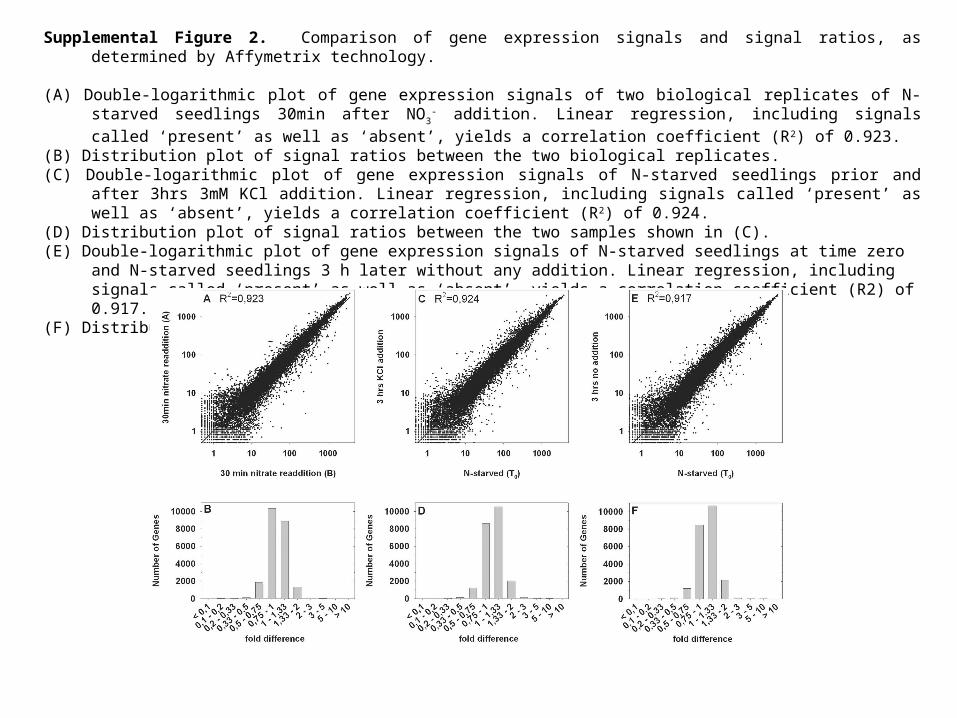
Supplemental Figure 2. Comparison of gene expression signals and signal ratios, as determined by Affymetrix technology. (A) Double-logarithmic plot of gene expression signals of two biological replicates of N-starved seedlings 30min after NO 3
- addition.
Linear regression, including signals called ‘present’ as well as ‘absent’, yields a correlation coefficient (R 2) of 0.923.(B) Distribution plot of signal ratios between the two biological replicates.(C) Double-logarithmic plot of gene expression signals of N-starved seedlings prior and after 3hrs 3mM KCl addition. Linear regression,
including signals called ‘present’ as well as ‘absent’, yields a correlation coefficient (R2) of 0.924.(D) Distribution plot of signal ratios between the two samples shown in (C).(E) Double-logarithmic plot of gene expression signals of N-starved seedlings at time zero and N-starved seedlings 3 h later without any
addition. Linear regression, including signals called ‘present’ as well as ‘absent’, yields a correlation coefficient (R2) of 0.917.(F) Distribution plot of signal ratios between the two samples shown in (E).
Supplemental Figure 2
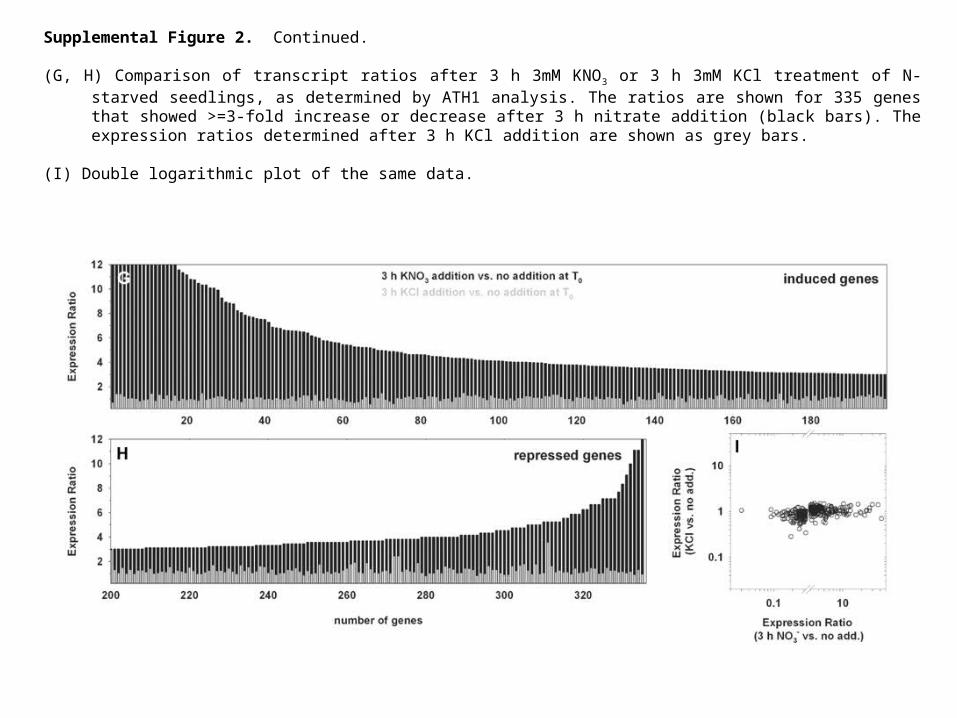
Supplemental Figure 2. Continued. (G, H) Comparison of transcript ratios after 3 h 3mM KNO3 or 3 h 3mM KCl treatment of N-starved seedlings, as determined by ATH1
analysis. The ratios are shown for 335 genes that showed >=3-fold increase or decrease after 3 h nitrate addition (black bars). The expression ratios determined after 3 h KCl addition are shown as grey bars.
(I) Double logarithmic plot of the same data.
Supplemental Figure 2. continued
2°M
etabo
lismL
ipid
s
Tetrapyrrole
Fermentation
Nucleotides
Light ReactionsStarch
Amino Acids
C-1 Metab.
Cellw
all
Carbonic anhydrases
Ascorbate, Glutathione
minor CHO
S-misc
N-misc
Waxes
S-misc
Terpenes
Flavonoids
Phenolpropanoids
Sucrose
GlnProArgmiscHyp
ValLeumisc
SerGlyCysmisc
PheTyrTrpmisc
HisAsnThrIleMet
GlnProArgmiscHyp
ValLeumisc
SerGlyCysmisc
PheTyrTrpmisc
HisAsnThrIleMet
Pectin-esterases
Raffin
ose
Treh
alose
Su
gar
alcoh
ol
Myo
-Ins
Misc.
Callo
se
Misc.-
kinases
XETs,Expansins
UDP-sugar metab.Celluloseand
hemicell. synth.
Cell wall breakdown
Hemi-cellose
Pectin lyases, polygalacturonases
TAGPhospho-and galacto-lipids
Sterols and sulpholipid
Lipid breakdown
GD
SL
lipisaes
lipases
(lyso)phospholipases
beta oxidation
FA synth.Desaturation
Syn-thesis
Break-down
Syn-thesis
Break-down
Glyco
lysis
Glu
cone
ogen
esis
Glyoxylate cycle
Other organic acid
trans-formations
OPP
TCA
Amino acid synthesis Amino acid breakdown
GABA metab
AspAT
Ala AT
Branched chain AA
Syn
thesis
Bre
akd
ow
n
Salvage
Phosphotransferpyrophosphases
Deoxy-nucleotide
SO4
NH4 release
NO3reductionNH4assimilation
Mitochondrial electron transport and ATP synthesis
Photo-respiration
Calvin cycle
Cell wall proteins
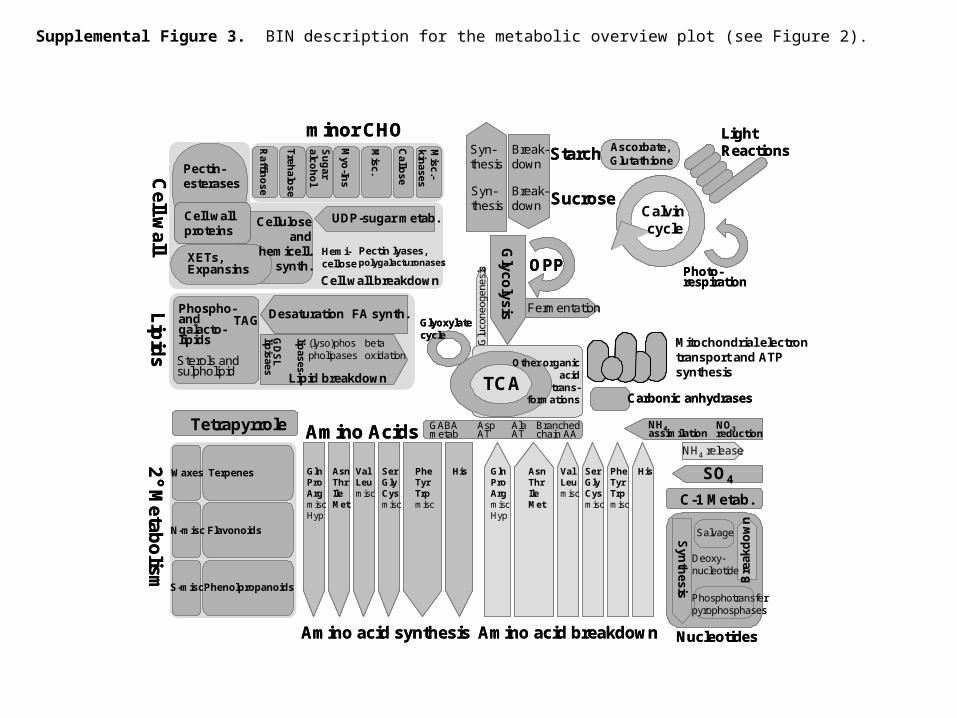
Supplemental Figure 3. BIN description for the metabolic overview plot (see Figure 2).
Supplemental Figure 3
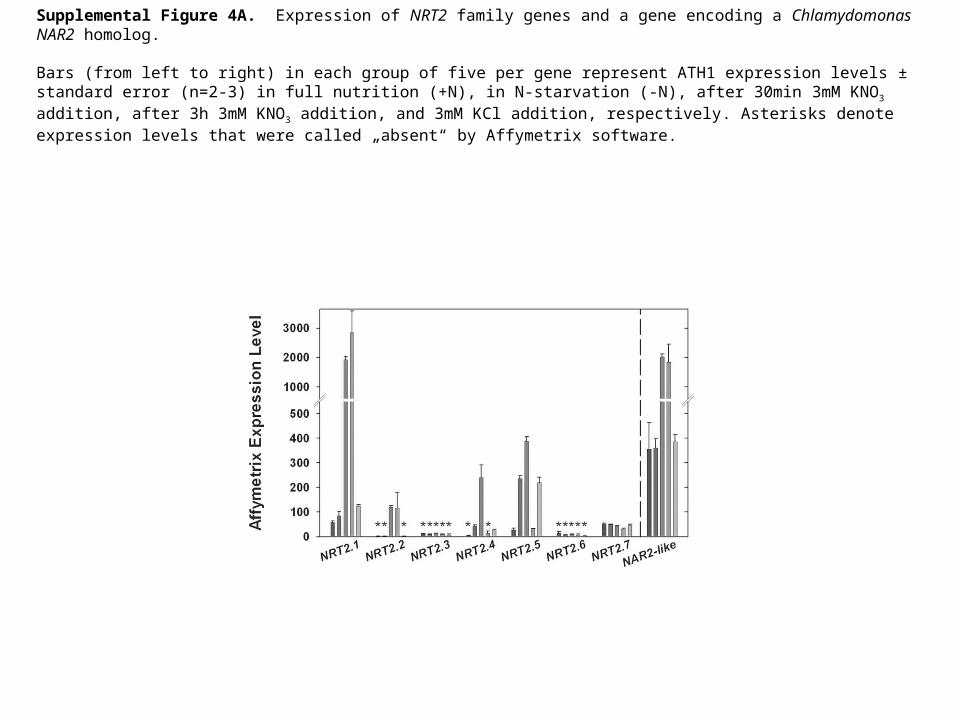
Supplemental Figure 4A. Expression of NRT2 family genes and a gene encoding a Chlamydomonas NAR2 homolog.
Bars (from left to right) in each group of five per gene represent ATH1 expression levels ± standard error (n=2-3) in full nutrition (+N), in N-starvation (-N), after 30min 3mM KNO3 addition, after 3h 3mM KNO3 addition, and 3mM KCl addition, respectively. Asterisks denote expression levels that were called „absent“ by Affymetrix software.
Supplemental Figure 4A
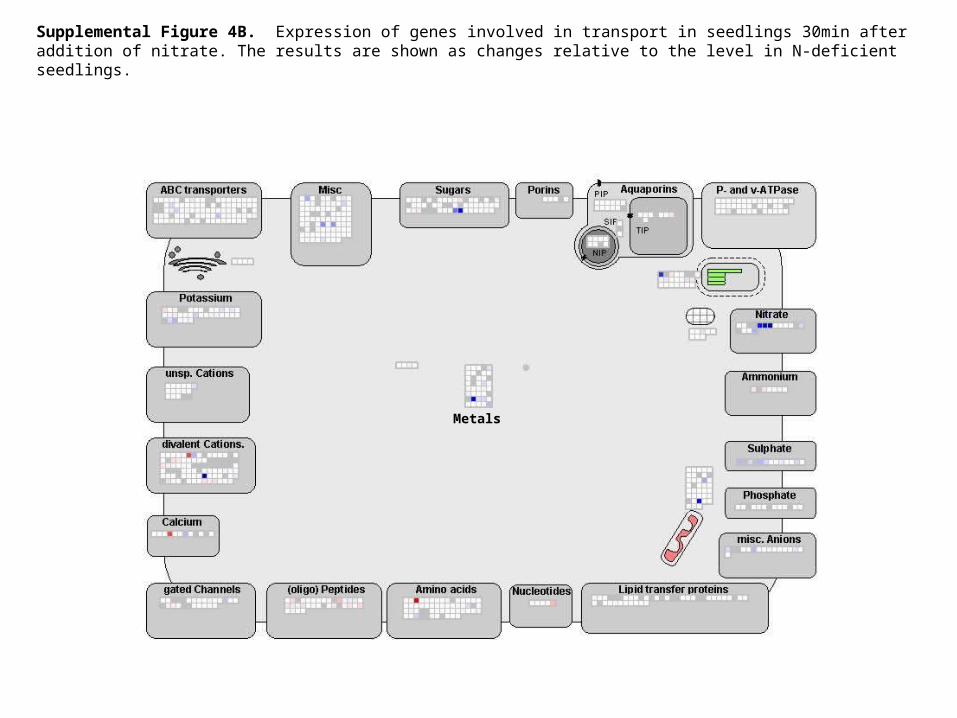
Supplemental Figure 4B. Expression of genes involved in transport in seedlings 30min after addition of nitrate. The results are shown as changes relative to the level in N-deficient seedlings.
Metals
Supplemental Figure 4B
Metals
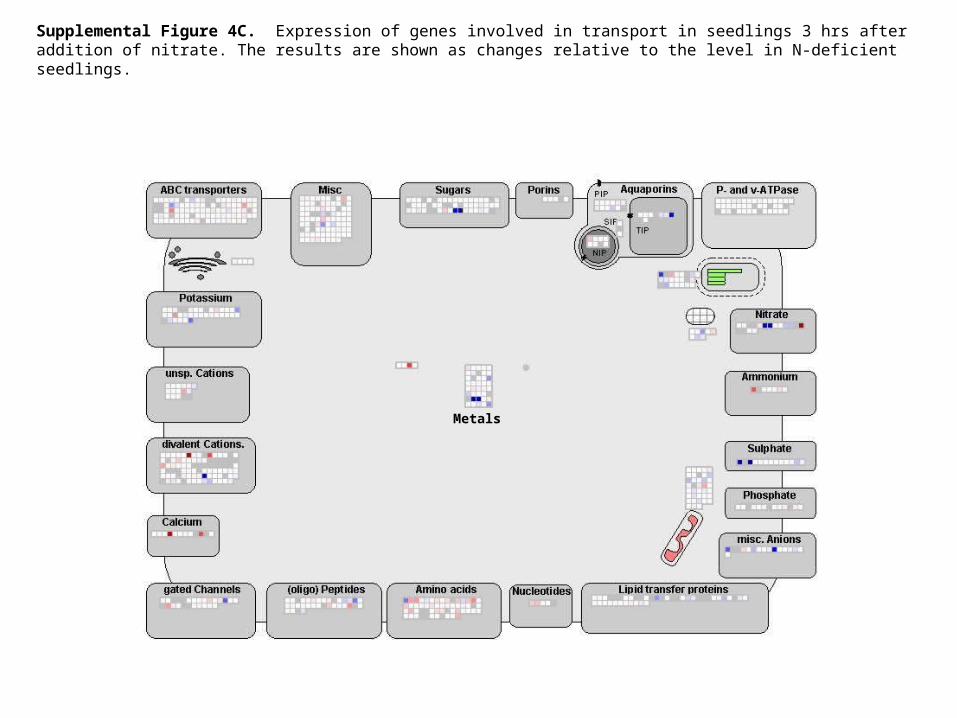
Supplemental Figure 4C. Expression of genes involved in transport in seedlings 3 hrs after addition of nitrate. The results are shown as changes relative to the level in N-deficient seedlings.
Supplemental Figure 4C
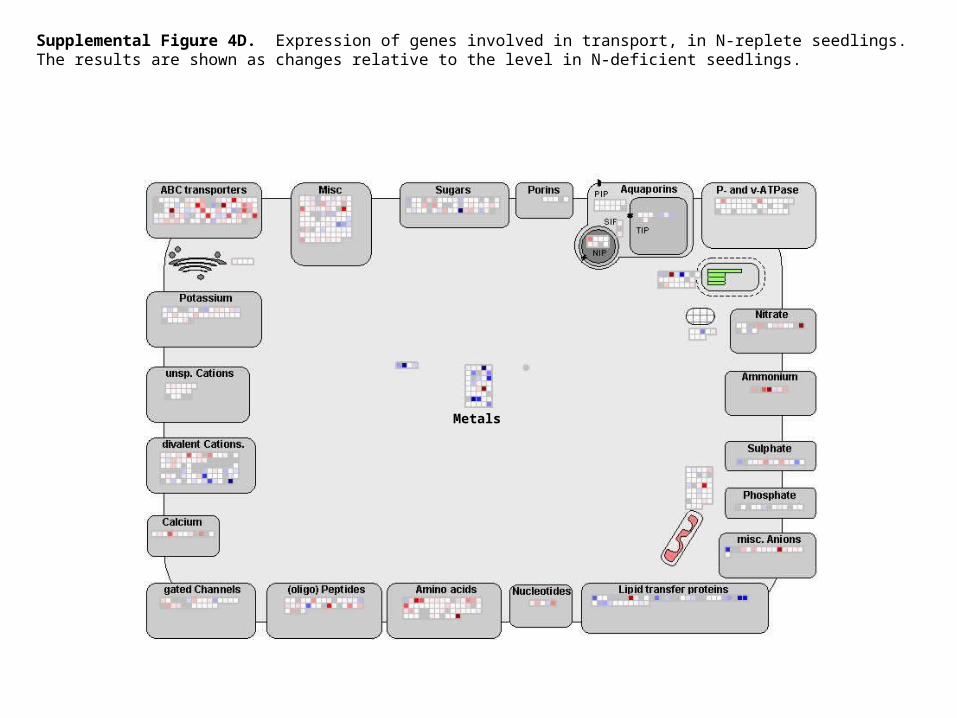
Supplemental Figure 4D. Expression of genes involved in transport, in N-replete seedlings. The results are shown as changes relative to the level in N-deficient seedlings.
Metals
Supplemental Figure 4D
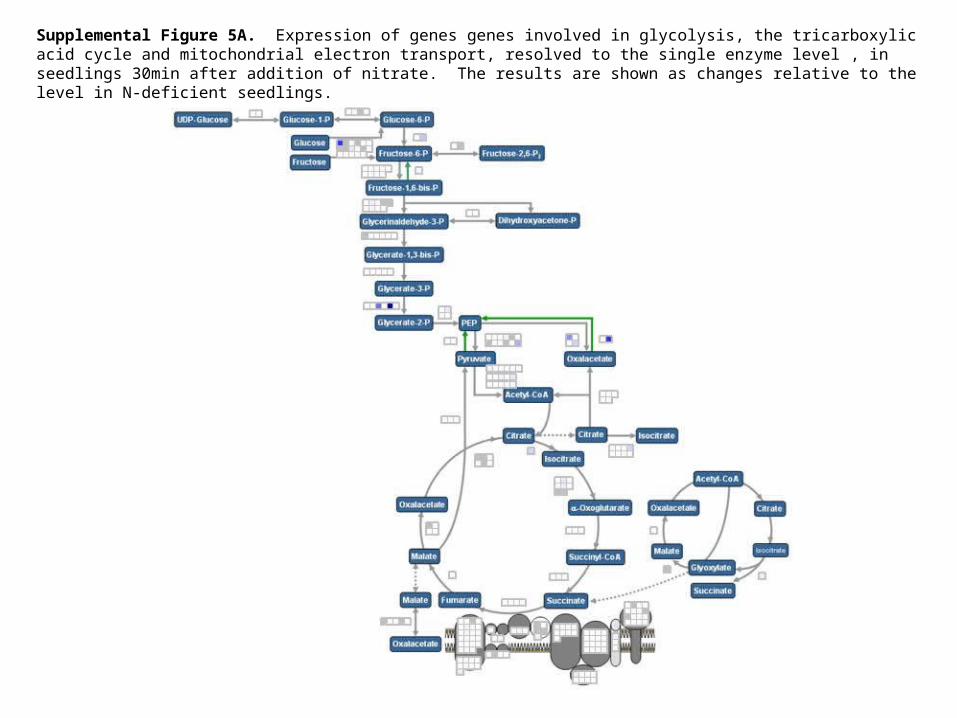
Supplemental Figure 5A. Expression of genes genes involved in glycolysis, the tricarboxylic acid cycle and mitochondrial electron transport, resolved to the single enzyme level , in seedlings 30min after addition of nitrate. The results are shown as changes relative to the level in N-deficient seedlings.
Supplemental Figure 5A
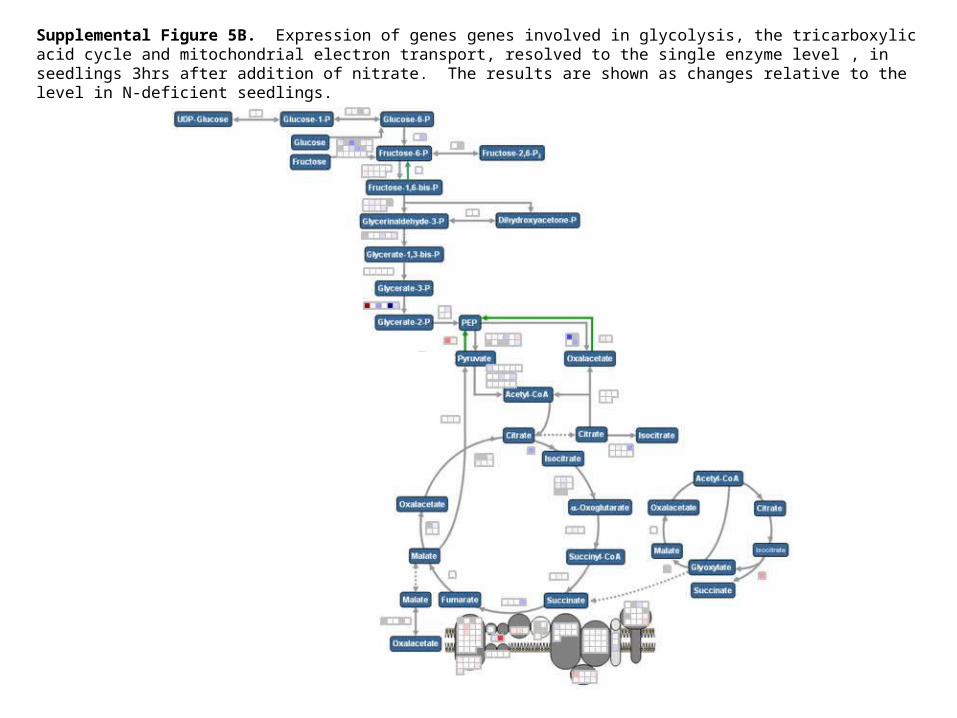
Supplemental Figure 5B. Expression of genes genes involved in glycolysis, the tricarboxylic acid cycle and mitochondrial electron transport, resolved to the single enzyme level , in seedlings 3hrs after addition of nitrate. The results are shown as changes relative to the level in N-deficient seedlings.
Supplemental Figure 5B
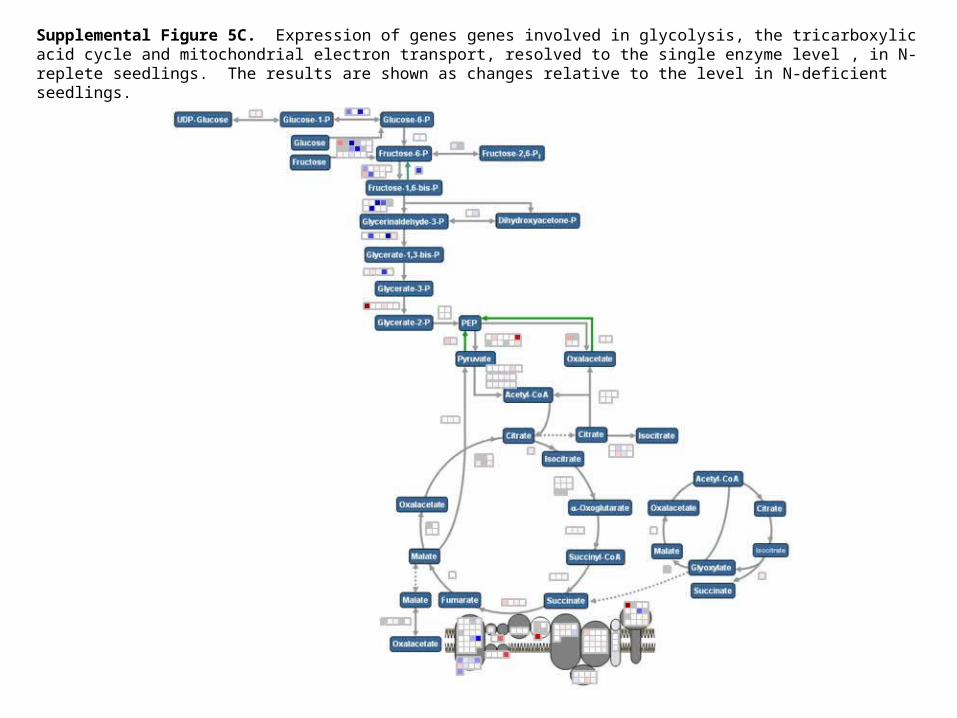
Supplemental Figure 5C. Expression of genes genes involved in glycolysis, the tricarboxylic acid cycle and mitochondrial electron transport, resolved to the single enzyme level , in N-replete seedlings. The results are shown as changes relative to the level in N-deficient seedlings.
Supplemental Figure 5C
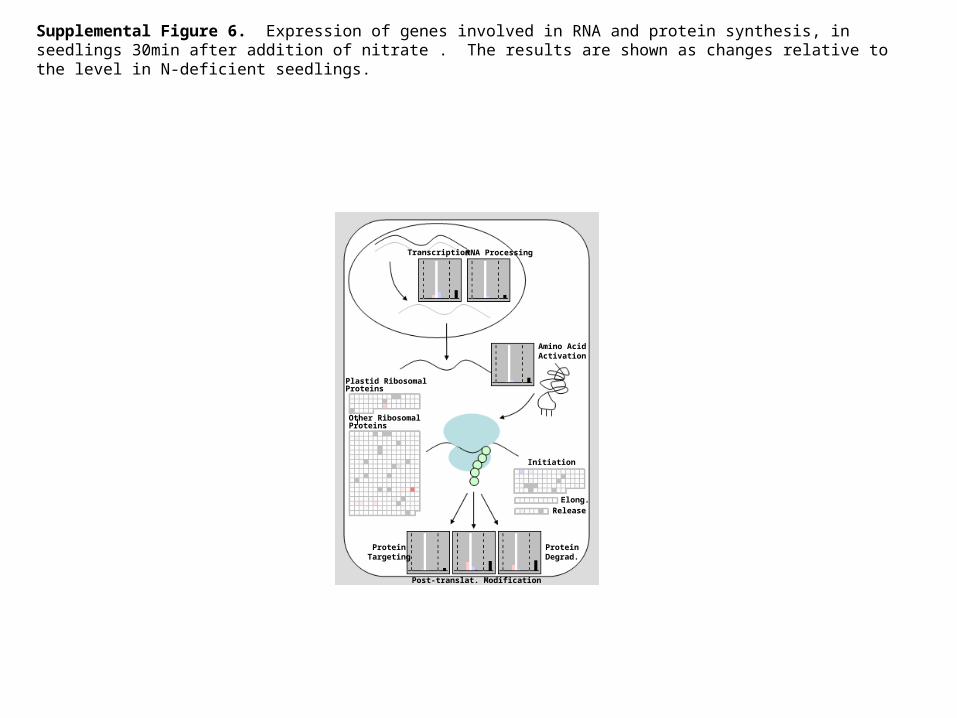
Supplemental Figure 6. Expression of genes involved in RNA and protein synthesis, in seedlings 30min after addition of nitrate . The results are shown as changes relative to the level in N-deficient seedlings.
Supplemental Figure 6
Transcription RNA Processing
Amino AcidActivation
Initiation
Elong.Release
ProteinDegrad.
ProteinTargeting
Other RibosomalProteins
Plastid RibosomalProteins
Post-translat. Modification
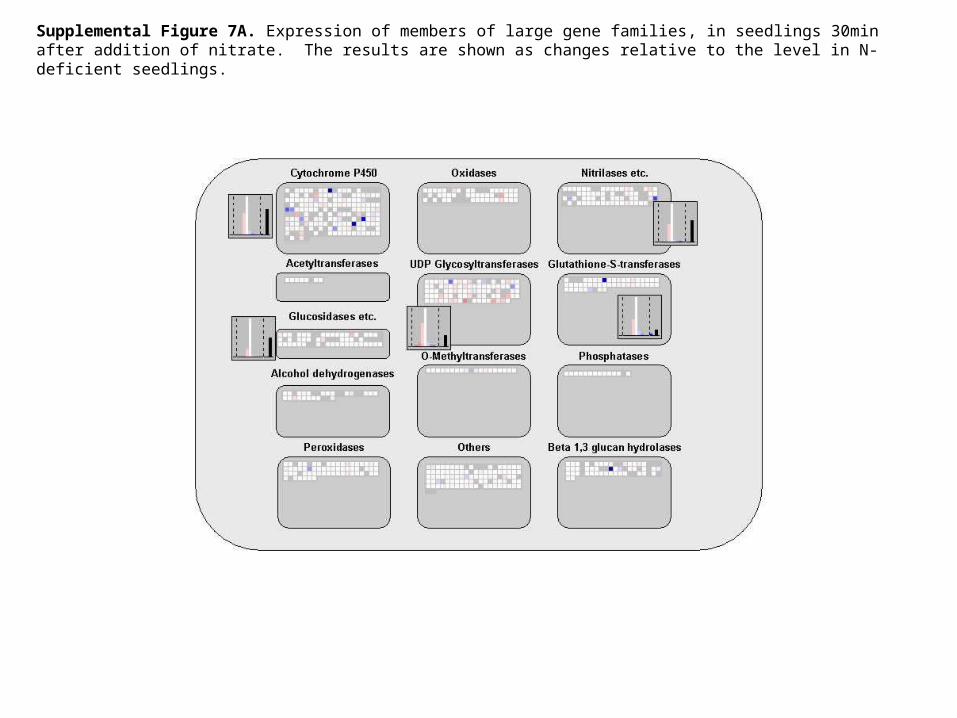
Supplemental Figure 7A. Expression of members of large gene families, in seedlings 30min after addition of nitrate. The results are shown as changes relative to the level in N-deficient seedlings.
Supplemental Figure 7A
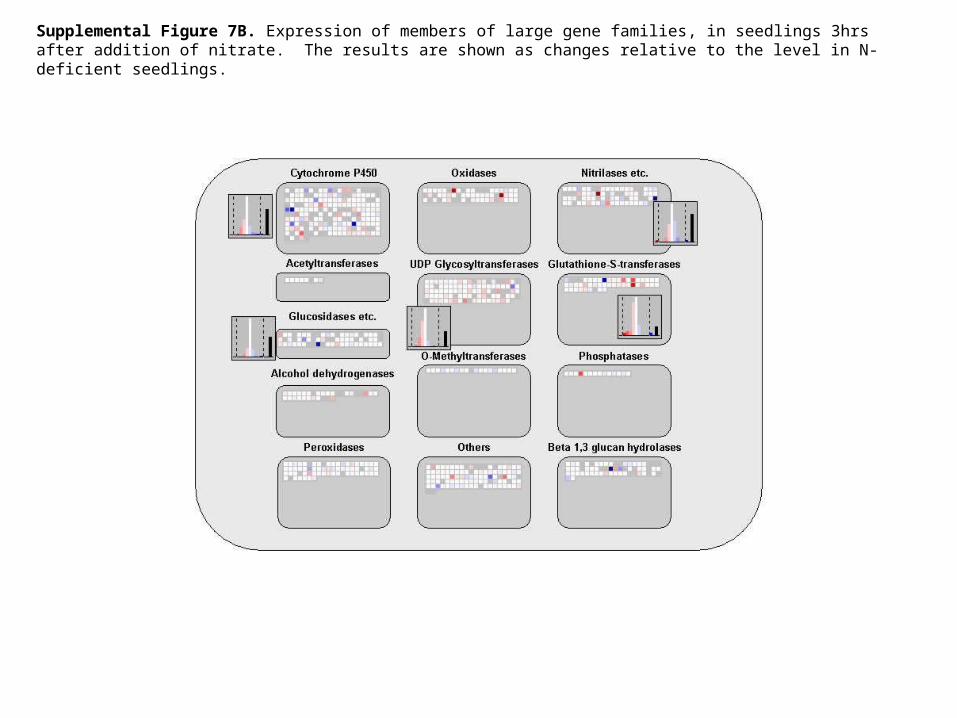
Supplemental Figure 7B. Expression of members of large gene families, in seedlings 3hrs after addition of nitrate. The results are shown as changes relative to the level in N-deficient seedlings.
Supplemental Figure 7B
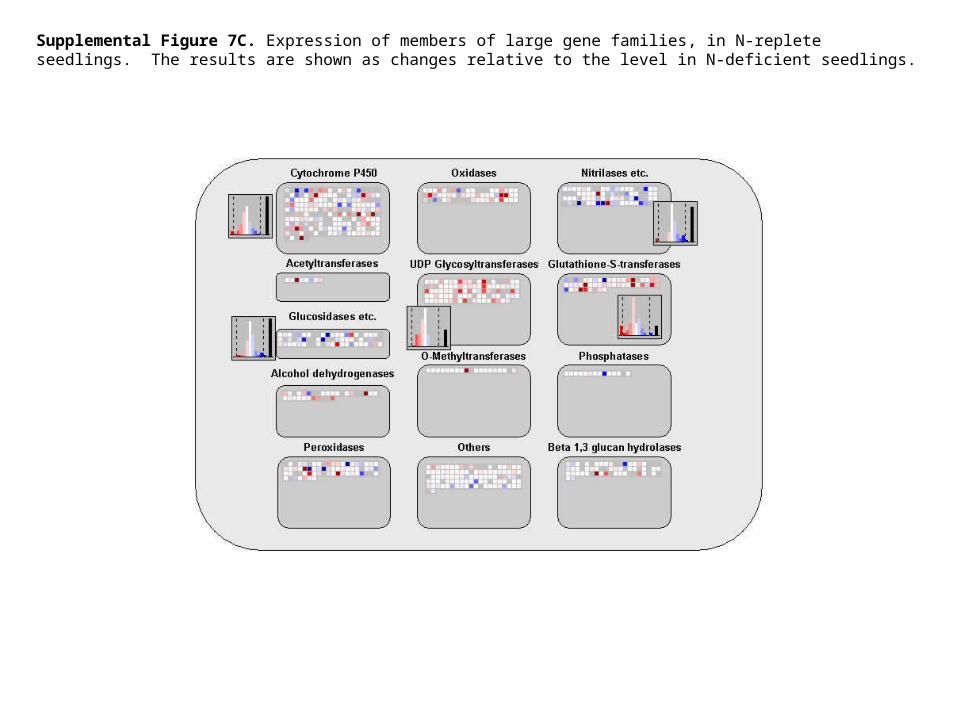
Supplemental Figure 7C. Expression of members of large gene families, in N-replete seedlings. The results are shown as changes relative to the level in N-deficient seedlings.
Supplemental Figure 7C
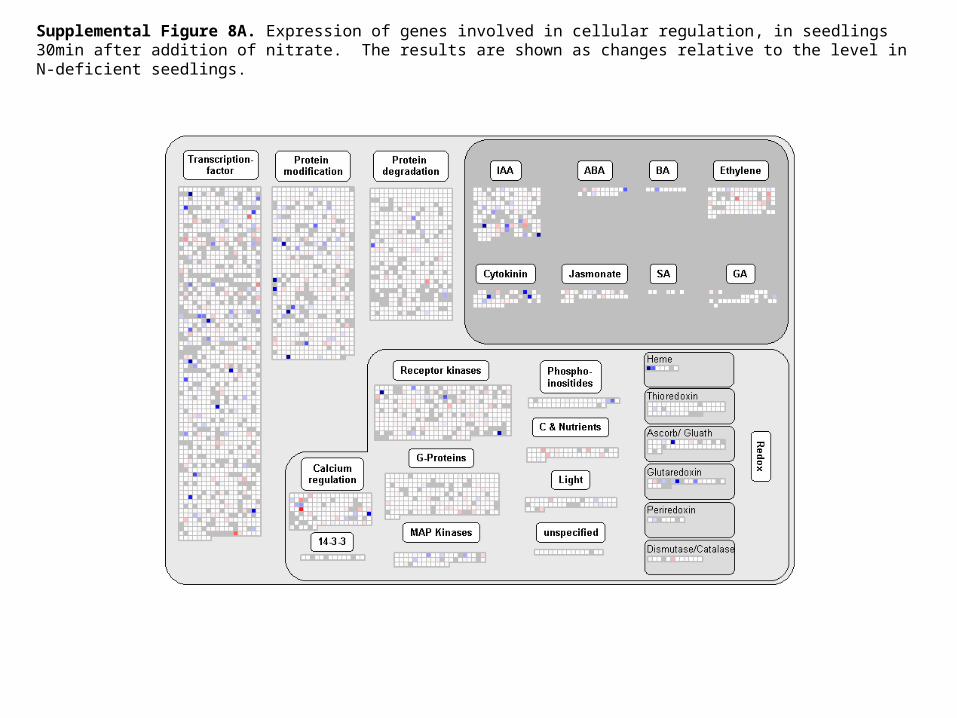
Supplemental Figure 8A. Expression of genes involved in cellular regulation, in seedlings 30min after addition of nitrate. The results are shown as changes relative to the level in N-deficient seedlings.
Supplemental Figure 8A
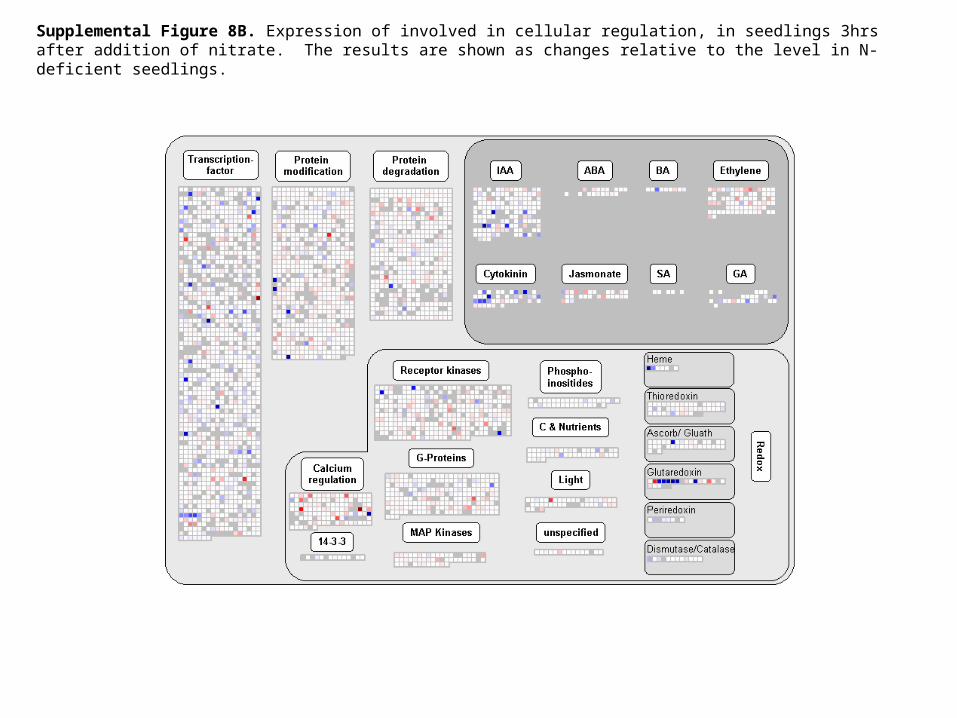
Supplemental Figure 8B. Expression of involved in cellular regulation, in seedlings 3hrs after addition of nitrate. The results are shown as changes relative to the level in N-deficient seedlings.
Supplemental Figure 8B
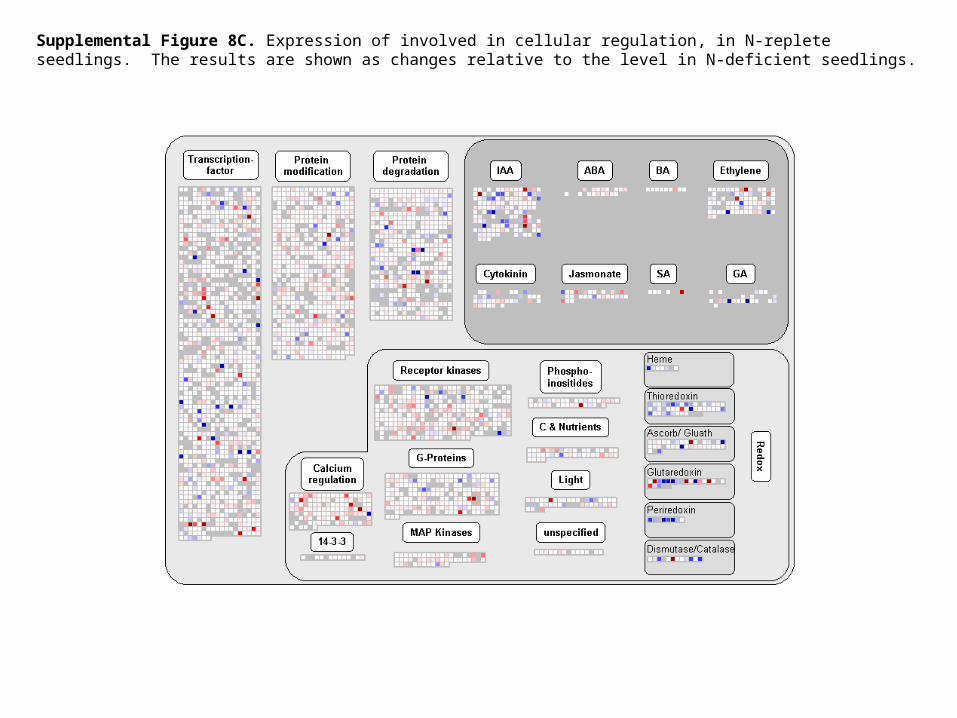
Supplemental Figure 8C. Expression of involved in cellular regulation, in N-replete seedlings. The results are shown as changes relative to the level in N-deficient seedlings.
Supplemental Figure 8C
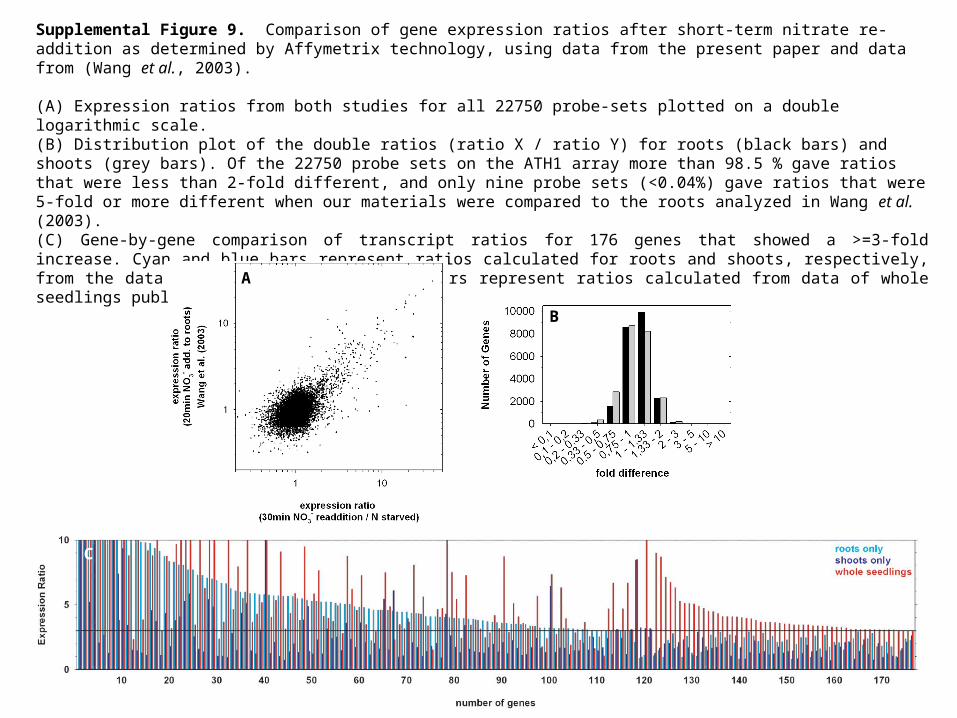
Supplemental Figure 9. Comparison of gene expression ratios after short-term nitrate re-addition as determined by Affymetrix technology, using data from the present paper and data from (Wang et al., 2003). (A) Expression ratios from both studies for all 22750 probe-sets plotted on a double logarithmic scale.(B) Distribution plot of the double ratios (ratio X / ratio Y) for roots (black bars) and shoots (grey bars). Of the 22750 probe sets on the ATH1 array more than 98.5 % gave ratios that were less than 2-fold different, and only nine probe sets (<0.04%) gave ratios that were 5-fold or more different when our materials were compared to the roots analyzed in Wang et al. (2003).(C) Gene-by-gene comparison of transcript ratios for 176 genes that showed a >=3-fold increase. Cyan and blue bars represent ratios calculated for roots and shoots, respectively, from the data of Wang et al., (2003). Red bars represent ratios calculated from data of whole seedlings published in the present paper.
Supplemental Figure 9
A
B
C
Supplemental Figure 10A.Supplemental Figure 10A
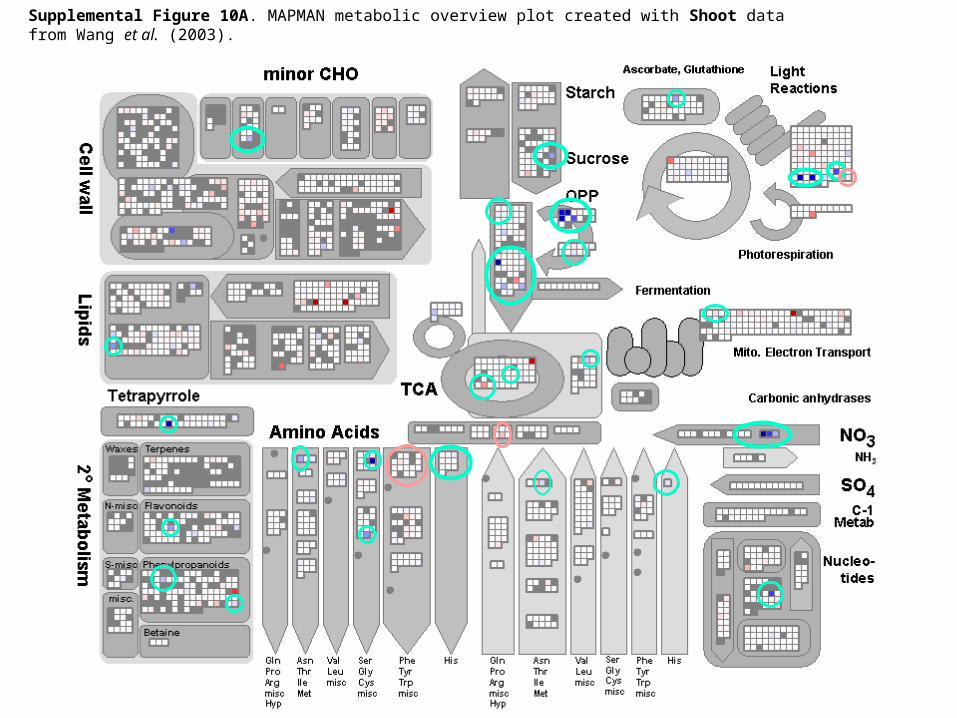
Supplemental Figure 10A. MAPMAN metabolic overview plot created with Shoot data from Wang et al. (2003).
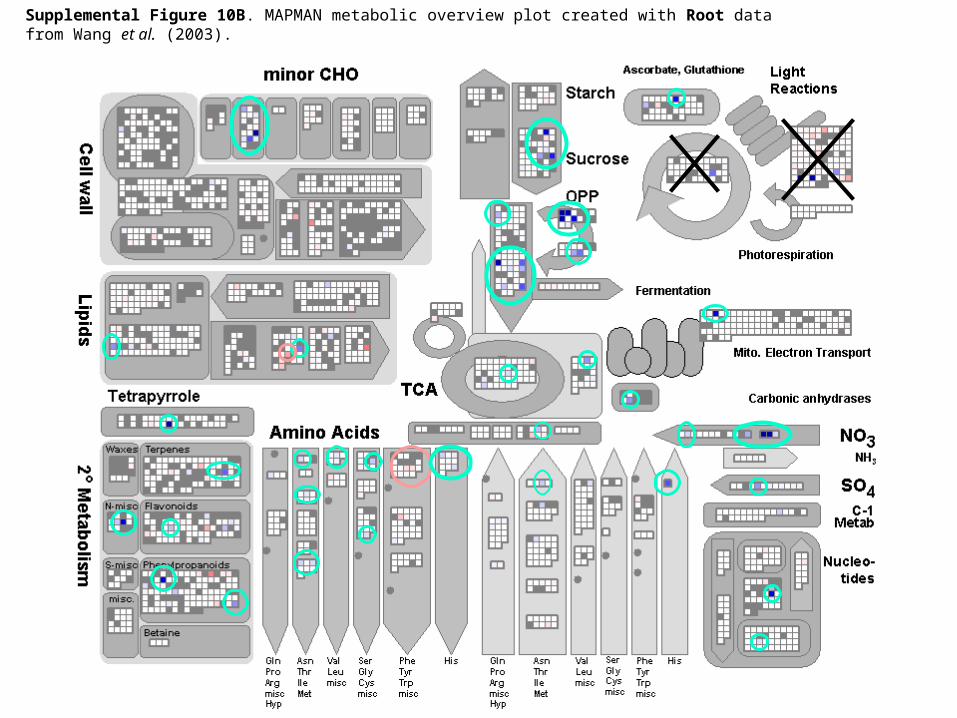
Supplemental Figure 10B. MAPMAN metabolic overview plot created with Root data from Wang et al. (2003).
Supplemental Figure 10B
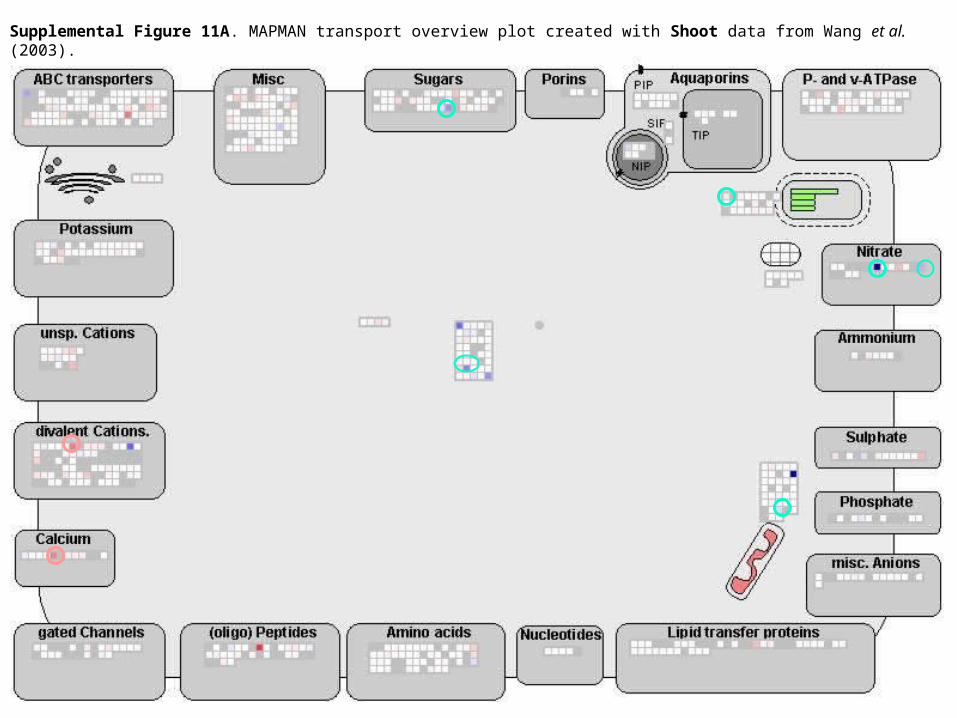
Supplemental Figure 11A. MAPMAN transport overview plot created with Shoot data from Wang et al. (2003).
Supplemental Figure 11A
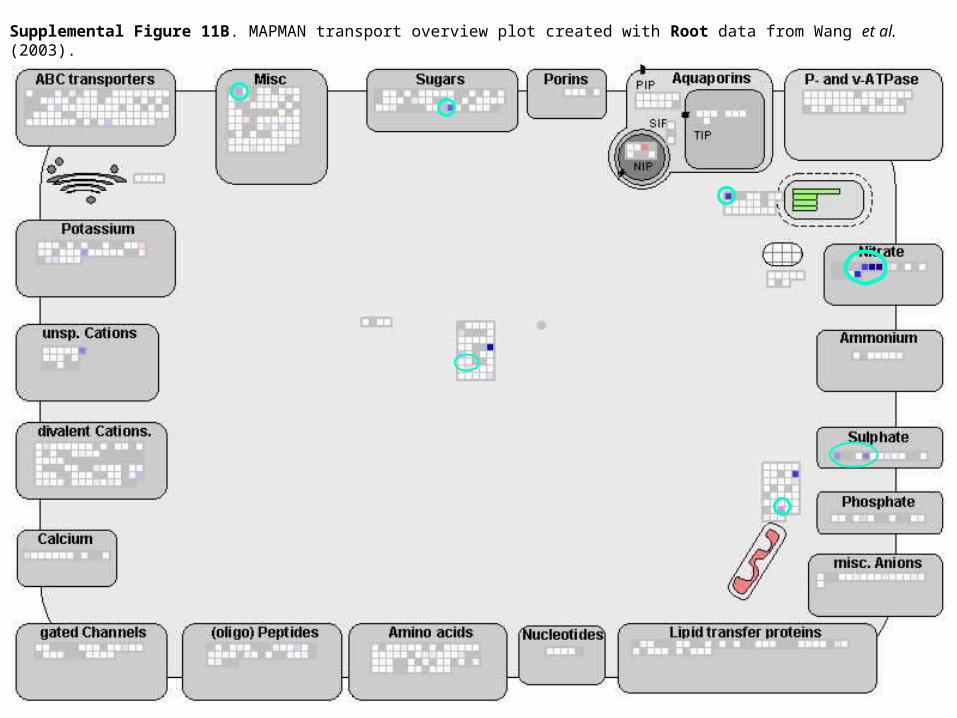
Supplemental Figure 11B. MAPMAN transport overview plot created with Root data from Wang et al. (2003).
Supplemental Figure 11B
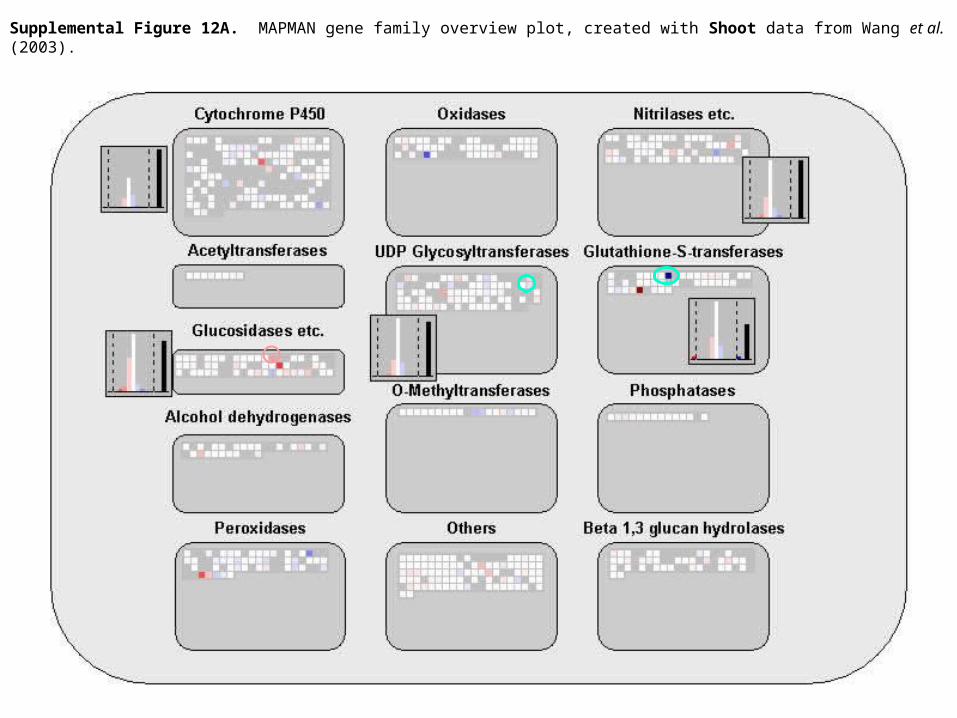
Supplemental Figure 12A. MAPMAN gene family overview plot, created with Shoot data from Wang et al. (2003).
Supplemental Figure 12A
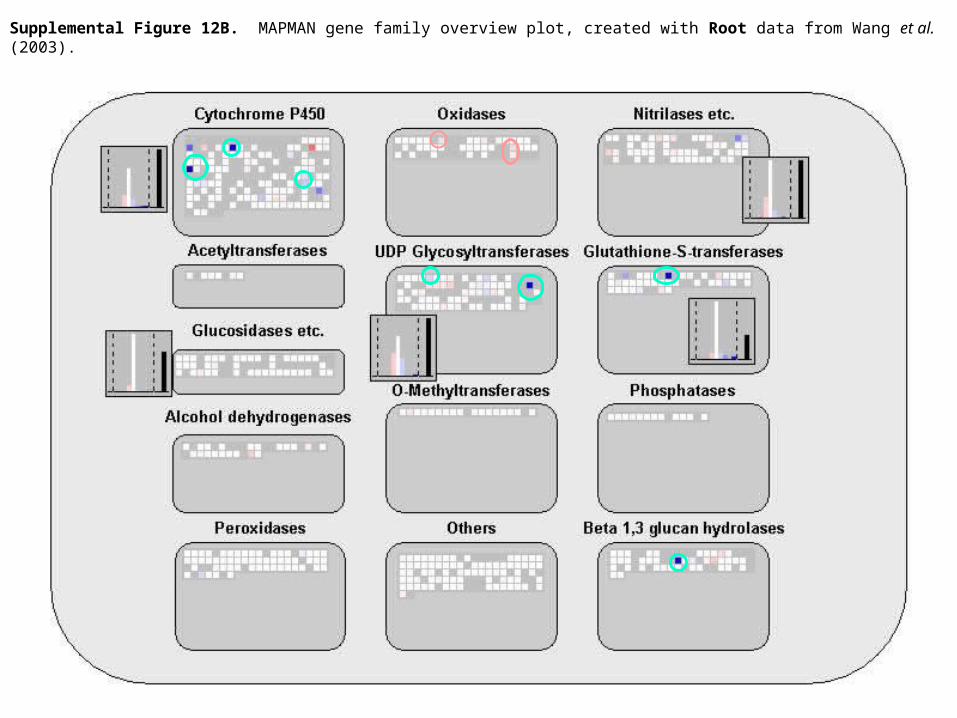
Supplemental Figure 12B. MAPMAN gene family overview plot, created with Root data from Wang et al. (2003).
Supplemental Figure 12B