Embed Size (px)
Citation preview
Immunity, Volume 36
Supplemental Information
Human Epidermal Langerhans Cells Maintain
Immune Homeostasis in Skin by Activating
Skin Resident Regulatory T Cells
Julien Seneschal, Rachael A. Clark, Ahmed Gehad, Clare M. Baecher-Allan, and
Thomas S. Kupper
Supplemental Experimental Procedures
Supporting Figures
Figure S1. Purification of isolated LC, Dermal DC and skin resident memory T cells
Figure S2. Surface molecule expression by isolated LC and Dermal DC
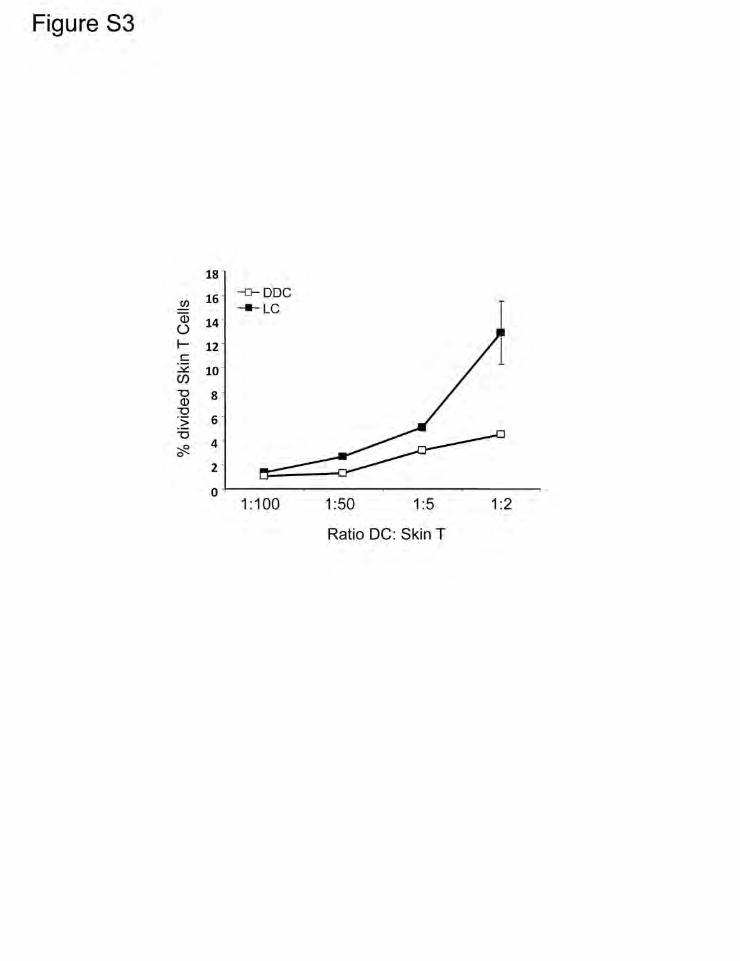
Figure S3. LC are powerful inducers of skin resident memory T cells proliferation.
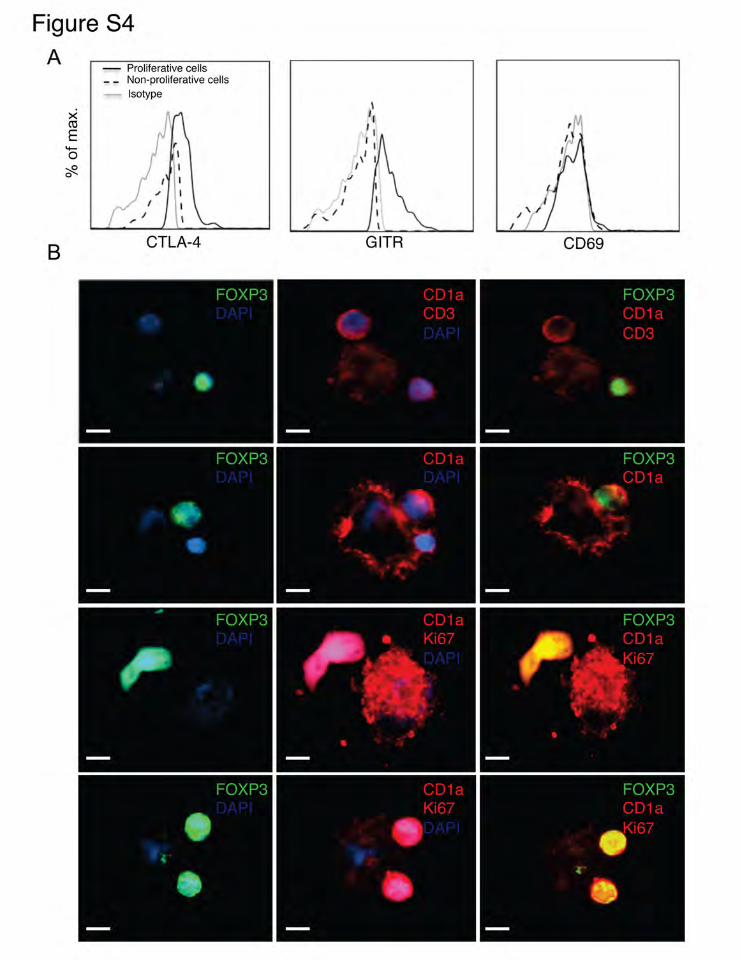
Figure S4. LC induce proliferation of skin resident memory Treg cells .
Figure S5. Proliferating skin resident memory Treg cells are found close to LC either
in the papillary dermis and in the epidermis
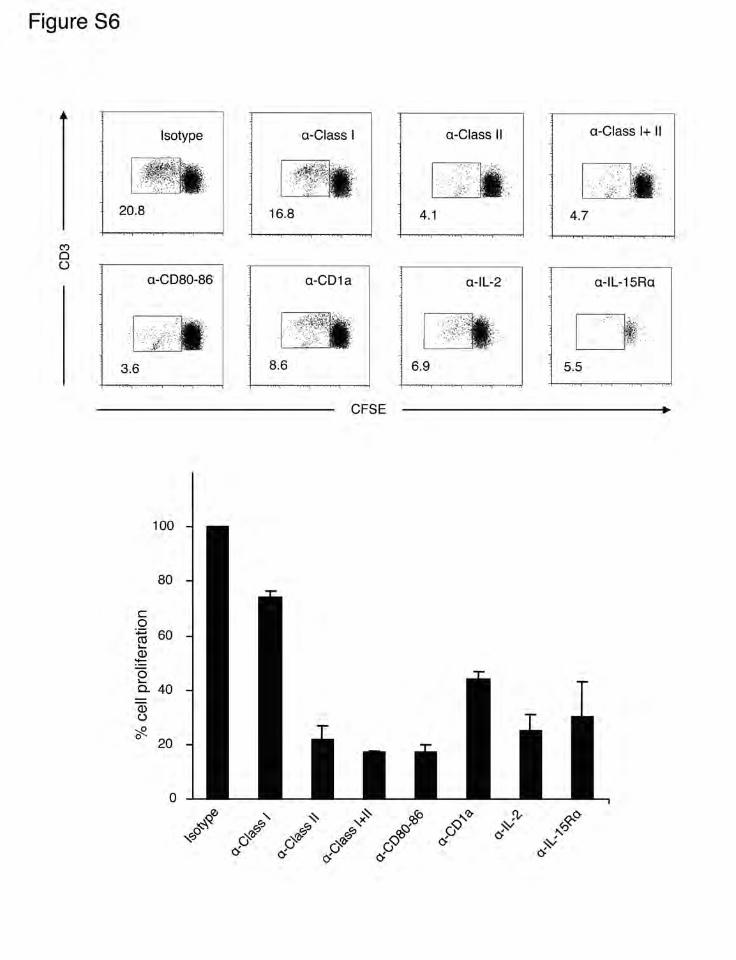
Figure S6. Expansion of skin resident memory T cells, in the presence of C.albicans,
involves MHC class II, CD80/86 ligation, IL-2, IL-15 and partially CD1a
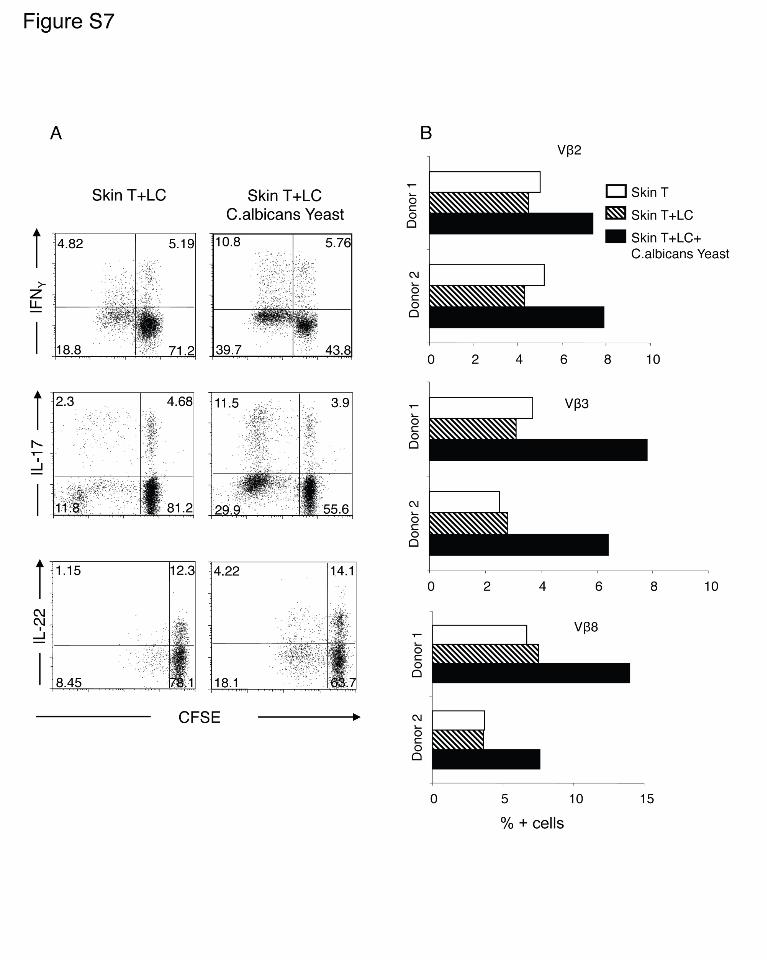
Figure S7. Proliferating skin resident memory Treg cells produce neither IL-17, IFNγ,
nor IL-22, while in the presence of C.albicans, expanded skin resident Tem cells
produce effector cytokines and contain a TCR-biased T cells.
Supporting Table
Table S1. Antibodies used for flow cytometry and immunofluorescence

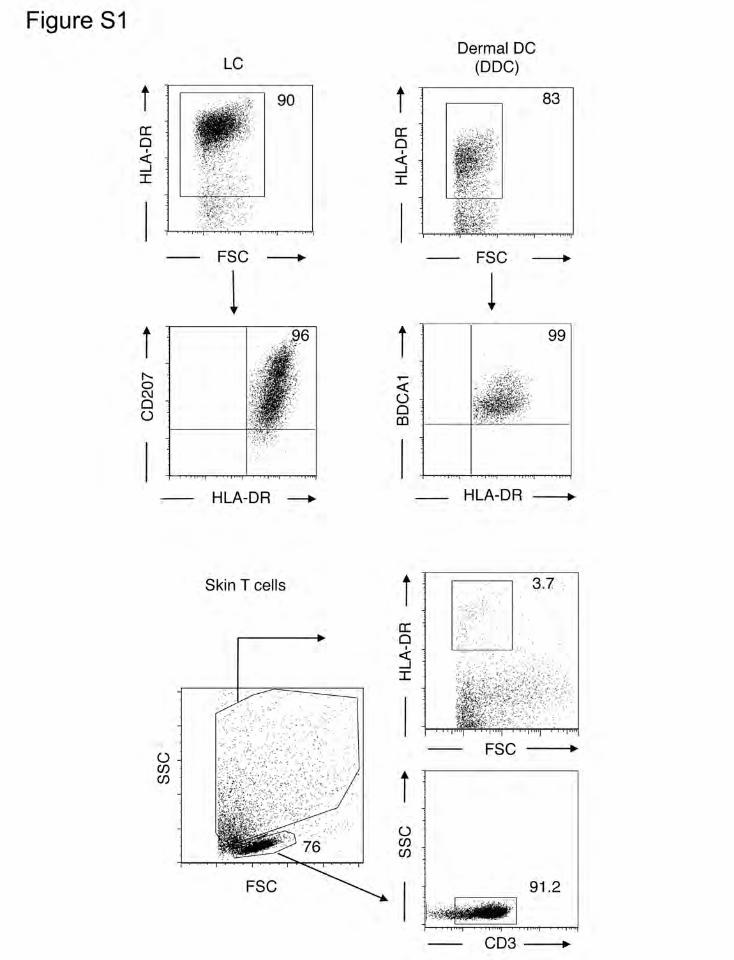
Figure S1. Purification of isolated LC, Dermal DC and Skin resident T cells. LC,
Dermal DC and T cells were isolated as described in Materials and Methods.
Numbers represent percentage of gated cells.
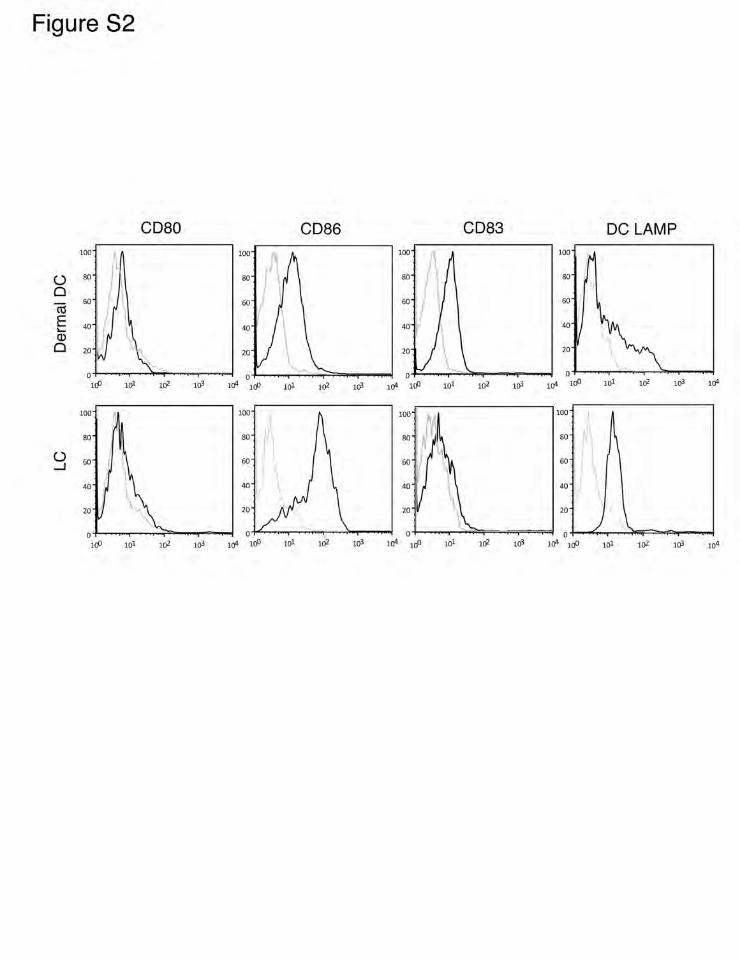
Figure S2. Surface molecule expression by isolated LC and Dermal DC. Flow
cytometry analysis of surface molecules on epidermal LC and dermal DC (DDC).
HLA-DR+CD207+ cells from epidermis and HLA-DRhiBDCA1+ cells from dermis were
analysed for expression of CD80, CD86, CD83, DC-LAMP. Grey lines indicate
isotype controls. Data are representative of two independent experiments.
Figure S3. LC are powerful inducers of skin resident memory T cells
proliferation. Proliferation of CFSE labeled skin resident memory T cells, stimulated
for 6 days with skin DDC or LC at different ratio. The graph shows means +/- SD.
Data are representative of three independent experiments.
Figure S4. LC induce proliferation of skin resident memory Treg cells. (A) Skin
resident memory T cells proliferating in the presence of autologous LC express
CTLA-4, GITR and are negative for CD69. Flow cytometry analysis of surface
molecules on CD3+ T cells. Proliferative (solid line) and non proliferative (dashed
line) T cells were analyzed for expression of CTLA-4, GITR and CD69. Grey lines
indicate isotype controls. (B) LC and skin resident memory T cells co-cultured for 6
days were stained on a slide using anti-CD1a (red), ant-CD3 (red), anti-Ki67 (red)
and anti-FoxP3 (green) monoclonal antibodies and counterstained with DAPI (blue).
Immunofluorescence analysis on slide shows CD1a positive LC and FoxP3/CD3
double positive skin resident memory Treg cells aggregates. FoxP3+ (green) Treg
cells co-expressing Ki67 (yellow overlay) are found in connection with LC (red).
Figure S5. Proliferating skin resident memory Treg cells are found close to LC
either in the papillary dermis and in the epidermis. (A) Immunofluorescence on
skin section shows expression of FoxP3 (green) and CD25 (red) either in epidermis
(left panel) and in dermis (right panel). Skin resident memory Treg cells expressing
FoxP3, are positive for CD25 resulting in a yellow overlay (B) Left panel,
immunofluorescence on skin section shows expression of FoxP3 (green), nuclear
staining Ki67 (red) and CD3 (red). FoxP3+ skin resident memory Treg cells
expressing Ki67 result in a yellow overlay. Right panel: immunofluorescence, on the
same skin section than left panel, showing interaction between CD1a+ LC (red) and
FoxP3+ skin resident memory Treg cells (green). (C) Upper panel left:
Immunofluorescence shows FoxP3+ (green) and CD3+ (red) skin resident memory
Treg cells, lower panel left: interaction between CD1a+ LC (red) and Foxp3+ skin
resident memory Treg cells (green) within the epidermis. Middle panel: Proliferating
Foxp3+ skin resident memory Treg cells (green) and Ki67+ (red) were found within
the epidermis resulting in a yellow overlay. Right panel: Proliferating Ki67+ Foxp3+
skin resident memory Treg cells interact with CD1a+ LC (red) within the epidermis.
(D) Immunofluorescence shows BDCA1+ Dermal DC (green) located in the papillary
dermis close to FoxP3+ (green) KI67- skin resident memory Treg cells in a resting
state.
Figure S6. Expansion of skin resident memory T cells, in the presence of
C.albicans, involves MHC class II, CD80/86 ligation, IL-2, IL-15 and partially
CD1a. Proliferation of CFSE labeled skin resident memory T cells, stimulated with
autologous LC in the presence of C.albicans. Indicated neutralizing antibodies or
isotype-matched, non-reactive antibodies as control were added. Proliferation of
CD3+ skin resident memory T cells measured by CFSE dilution. Numbers represent
the percent of divided cells for one representative donor. The graph shows means +/-
SD. Data are representative of 4 independent experiments.
Figure S7. Proliferating skin resident memory Treg cells produce neither IL-17,
IFNγ, nor IL-22, while in the presence of C.albicans, expanded skin resident
Tem cells produce effector cytokines and contain TCR-biased T cells. (A)
CFSE labeled skin resident memory T cells co-cultured with autologous LC in the
presence or the absence of C.albicans were isolated and re-stimulated with PMA,
Ionomycin in the presence of Brefeldin during 4h and subsequently analyzed for the
production of indicated cytokines by flow cytometry. Numbers in quadrant indicate
percentage of gated cells in each. Data are representative of 4 independent
experiments. (B) T cells were isolated at day 0 or at day 6 from co-culture with
autologous LC in the presence or the absence of C.albicans and analyzed for the
percentage of cells expressing the indicated V expression by flow cytometry. Data
are representative of two independent donors.
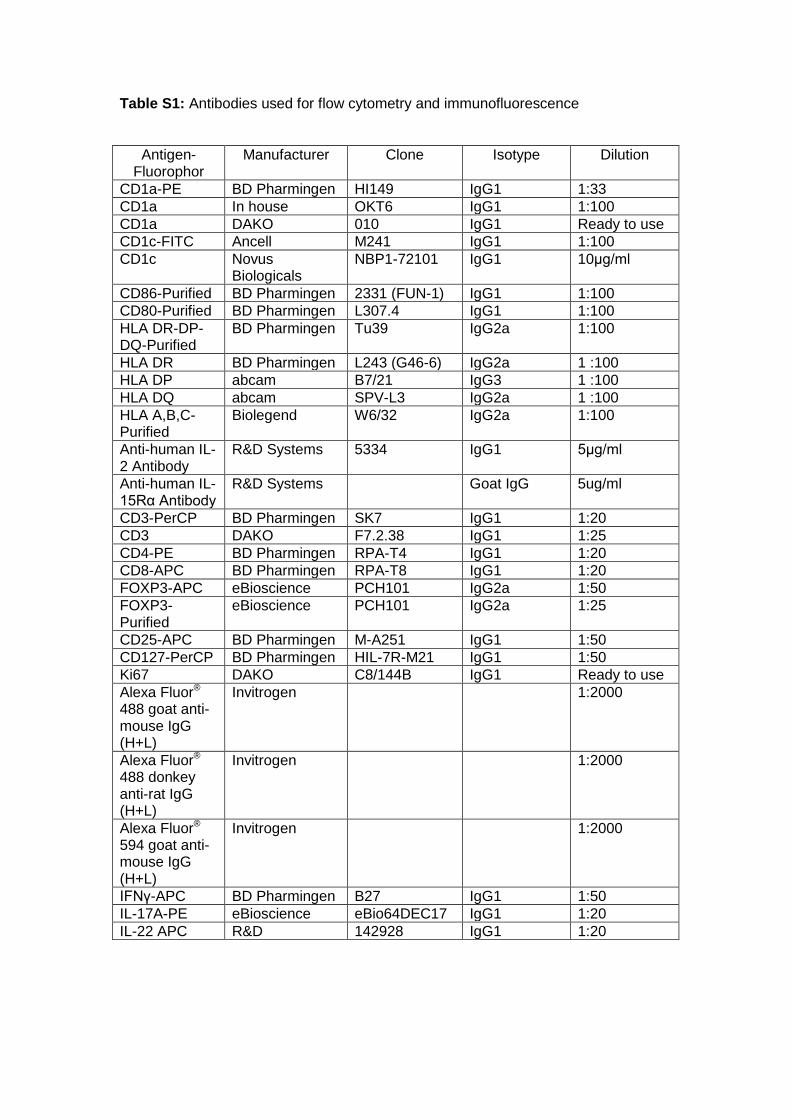
Table S1: Antibodies used for flow cytometry and immunofluorescence
Antigen-Fluorophor
Manufacturer Clone Isotype Dilution
CD1a-PE BD Pharmingen HI149 IgG1 1:33
CD1a In house OKT6 IgG1 1:100
CD1a DAKO 010 IgG1 Ready to use
CD1c-FITC Ancell M241 IgG1 1:100
CD1c Novus Biologicals
NBP1-72101 IgG1 10μg/ml
CD86-Purified BD Pharmingen 2331 (FUN-1) IgG1 1:100
CD80-Purified BD Pharmingen L307.4 IgG1 1:100
HLA DR-DP-DQ-Purified
BD Pharmingen Tu39 IgG2a 1:100
HLA DR BD Pharmingen L243 (G46-6) IgG2a 1 :100
HLA DP abcam B7/21 IgG3 1 :100
HLA DQ abcam SPV-L3 IgG2a 1 :100
HLA A,B,C-Purified
Biolegend W6/32 IgG2a 1:100
Anti-human IL-2 Antibody
R&D Systems 5334 IgG1 5μg/ml
Anti-human IL-15Rα Antibody
R&D Systems Goat IgG 5ug/ml
CD3-PerCP BD Pharmingen SK7 IgG1 1:20
CD3 DAKO F7.2.38 IgG1 1:25
CD4-PE BD Pharmingen RPA-T4 IgG1 1:20
CD8-APC BD Pharmingen RPA-T8 IgG1 1:20
FOXP3-APC eBioscience PCH101 IgG2a 1:50
FOXP3-Purified
eBioscience PCH101 IgG2a 1:25
CD25-APC BD Pharmingen M-A251 IgG1 1:50
CD127-PerCP BD Pharmingen HIL-7R-M21 IgG1 1:50
Ki67 DAKO C8/144B IgG1 Ready to use
Alexa Fluor® 488 goat anti-mouse IgG (H+L)
Invitrogen 1:2000
Alexa Fluor® 488 donkey anti-rat IgG (H+L)
Invitrogen 1:2000
Alexa Fluor® 594 goat anti-mouse IgG (H+L)
Invitrogen 1:2000
IFNγ-APC BD Pharmingen B27 IgG1 1:50
IL-17A-PE eBioscience eBio64DEC17 IgG1 1:20
IL-22 APC R&D 142928 IgG1 1:20
Supplemental Experimental Procedures
Immunofluorescence
immunofluorescence study in Figure S2, cells (105) were allowed to adhere for 10
min at RT onto poly-L-lysine-coated slides. Then cells were fixed by dipping slides in
PBS containing 4% formaldehyde for 15 min. Slides were rinsed in cool running
water and washed in Tris-buffered saline, pH 7.4, before incubation with primary
antibodies and then incubated appropriate secondary antibodies: Alexa Fluor® 488-
conjugated anti-mouse or rat or Alex-Fluor® 594-conjugated anti-mouse. Additional
negative controls were performed by adding isotype mouse antibodies as primary
antibodies. After subsequent washing, the sections were mounted with Prolong Gold
antifade reagent with DAPI (Invitrogen) and covered with cover slip.
Immunofluoresecence reactivity was viewed on an Olympus BX51/52 system
microscope coupled to a Cytovision System (applied Imaging).
Cytokine Analysis
Skin resident T cells (5X10⁴/well) were stimulated with autologous LC (2.5X10⁴/well)
in 96-well plates for 6 days in the presence or the absence of heat-killed C.albicans
(5X10⁴). On day 6, proliferating T cells were re-stimulated with 50ng/ml PMA and 750
ng/ml ionomycin (Sigma) for 4h in the presence of 10μg/ml Brefeldin A. Cells were
stained for surface markers, fixed, permeabilized, stained with anticytokine
antibodies, and examined by flow cytometry.
TCR diversity analysis of T cells
T cells were isolated after 6 days of co-culture with LC and examined by flow
cytometry for Vβ expression and CD3. Vβ staining was performed using the IOtest
Beta Mark TCR Vβ Repertoire kit (Beckman Coulter) as per manufacturer’s
instructions.

![Clinical & Cellular Skelton et al., Immunology migration into the graft, restriction of their Vβ-TCR repertoire [3], ... purified via positive T cell isolation kit using magnetic](https://img.pdfslide.net/doc/110x75/5ab499c17f8b9a7c5b8bf547/clinical-cellular-skelton-et-al-immunology-migration-into-the-graft-restriction.jpg)


![IMMUNOGLOBULINE E T CELL RECEPTOR T. Strachan e A.P. … · B cell antigen receptor tetramero [ IgH 2 + IgL 2 (Ig oppure Ig )] T cell receptor (TCR) eterodimero TCR /TCR TCR /TCR](https://img.pdfslide.net/doc/110x75/5c017b5c09d3f26f1e8cc6a0/immunoglobuline-e-t-cell-receptor-t-strachan-e-ap-b-cell-antigen-receptor.jpg)