Embed Size (px)
Citation preview

Supplementary appendixThis appendix formed part of the original submission and has been peer reviewed. We post it as supplied by the authors.
Supplement to: Lalonde E, Ishkanian AS, Sykes J, et al. Tumour genomic and microenvironmental heterogeneity for integrated prediction of 5-year biochemical recurrence of prostate cancer: a retrospective cohort study. Lancet Oncol 2014; published online Nov 13. http://dx.doi.org/10.1016/S1470-2045(14)71021-6.

Page 1 of 130
Supplementary Appendix
Tumour genomic and microenvironmental heterogeneity for integrated prediction of 5-year
biochemical recurrence of prostate cancer: a retrospective cohort study
Lalonde E*, Ishkanian AS*, Sykes J, et al. Lancet Oncology, November 2014.
Supplementary Methods..................................................................................................................................................... 4
Toronto image-guided radiotherapy (IGRT) cohort (Training Set).................................................................................. 4
Measurement of Focal Tumour Hypoxia in IGRT Cohort (HP20 index) ......................................................................... 4
aCGH analysis .................................................................................................................................................................. 4
MSKCC radical prostatectomy (RadP) cohort (Validation Set)....................................................................................... 5
Cambridge RadP cohort (Validation Set) ......................................................................................................................... 5
RNA hypoxia signatures .................................................................................................................................................. 6
Statistical methods ........................................................................................................................................................... 6
Cohort comparison ........................................................................................................................................................... 6
Univariate CNA prognosis ............................................................................................................................................... 7
Unsupervised hierarchical clustering ............................................................................................................................... 7
Percent genome alteration (PGA)..................................................................................................................................... 7
Interaction between percent genome alteration and hypoxia ........................................................................................... 7
100-loci DNA signature ................................................................................................................................................... 7
Prediction of metastasis .................................................................................................................................................... 8
Comparison of prognostic variables for biochemical recurrence ..................................................................................... 8
Comparison of genomic prognostic signatures ................................................................................................................ 8
Supplementary Files ......................................................................................................................................................... 10
Supplementary Tables ...................................................................................................................................................... 11
Table S1. Clinical characteristics of Toronto-IGRT cohort compared to MSKCC cohort. ............................................ 11
Table S2. Clinical characteristics of Toronto-IGRT cohort compared to Cambridge cohort. ........................................ 12
Table S3. CNAs (a) and genes involved in CNAs (b) per cohort. .................................................................................. 13
Table S4. Genetic differences between Subtypes 2 and 3. ............................................................................................. 14
Table S5. Enrichment of clinical variables across Subtypes in the Toronto-IGRT cohort. ............................................ 15
Table S6. Enrichment of clinical variables across Subtypes in the MSKCC cohort. ..................................................... 16
Table S7. Enrichment of clinical variables in Subtypes with patients from the Toronto-IGRT and MSKCC cohorts. . 17
Table S8. Multivariate Cox proportional hazard model for the genomic Subtypes in the pooled Toronto-IGRT and
MSKCC cohorts for low-intermediate risk patients. ...................................................................................................... 18
Table S9. Cox proportional hazard model for overall survival in the Toronto-IGRT cohort. ........................................ 19
Table S10. Multivariate Cox proportional hazard model for PGA in each cohort. ........................................................ 20
Table S11. C-index analysis of PGA and clinical variables. .......................................................................................... 21
Table S12. RNA hypoxia signatures used in this study. ................................................................................................ 22
Table S13. Prognosis of combined PGA and RNA hypoxia scores in the RadP cohorts. .............................................. 23
Table S14. C-index analysis of PGA and hypoxia in the pooled full RadP cohorts. ...................................................... 24

Page 2 of 130
Table S15. Sensitivity analysis of hypoxic measurements, alone and with an interaction with time, in the IGRT cohort.
........................................................................................................................................................................................ 25
Table S16. The prognostic effect of PGA in low vs. high hypoxia patients in the Toronto-IGRT cohort. ................... 26
Table S17. C-index analysis of PGA and hypoxia in the Toronto-IGRT cohort. ........................................................... 27
Table S18. C-index analysis of 100-loci DNA signature and clinical variables. ........................................................... 28
Table S19. Cox proportional hazard model for the CNA signature in the MSKCC cohort. .......................................... 29
Table S20. Cox proportional hazard model for the CNA signature in the Cambridge cohort. ....................................... 30
Table S21. RNA signatures used in prognostic signature comparison. .......................................................................... 31
Table S22. The prognostic effect of PGA estimated from the CNA-signature in the Full RadP cohort. ....................... 32
Table S23. Five-year survival rates for patients grouped by various biomarkers. ......................................................... 33
Supplementary Figures .................................................................................................................................................... 34
Figure S1. Workflow of analyses and cohorts used throughout the manuscript. ........................................................... 34
Figure S2. Prognostic impact of clinical variables within each cohort. ......................................................................... 36
Figure S3. Comparison of biochemical recurrence and overall survival between cohorts. ............................................ 39
Figure S4. Comparison of number of genes in CNAs between the training (Toronto-IGRT) and validation (MSKCC)
cohorts. ........................................................................................................................................................................... 40
Figure S5. The top 30 most recurrent cytoband regions involved in copy number aberrations in each cohort. ............. 42
Figure S6. Copy number profile of cohorts .................................................................................................................... 43
Figure S7. Prognostic CNAs in patient biopsies. ........................................................................................................... 44
Figure S8. Genomic overview of Toronto-IGRT training cohort................................................................................... 45
Figure S9. Copy number profiles of prostate cancer in the low-high risk patients. ....................................................... 47
Figure S10. Genomic Subtypes are prognostic. ............................................................................................................. 49
Figure S11. PGA comparison between patients with deletions of CHD1. ..................................................................... 50
Figure S12. PGA operating point analysis. .................................................................................................................... 51
Figure S13. PGA is prognostic for general and early failure in the two independent RadP cohorts. ............................. 52
Figure S14. Classification of metastatic Toronto-IGRT and MSKCC patients by PGA. ............................................... 54
Figure S15. PGA differs significantly between patients of each genomic Subtype. ...................................................... 55
Figure S16. Tumour hypoxia estimates based on the Buffa RNA signature in the pooled RadP patients. .................... 56
Figure S17. Tumour hypoxia estimates based on the West RNA signature in the pooled RadP patients. ..................... 57
Figure S18. Tumour hypoxia estimates based on the Winter RNA signature in the pooled RadP patients. .................. 58
Figure S19. Hypoxia signature scores vs. PGA in the pooled RadP cohorts. ................................................................. 59
Figure S20. The prognostic effect of PGA and hypoxia in the pooled RadP cohorts. ................................................... 60
Figure S21. Direct intra-tumour hypoxia measurements in the IGRT cohort ................................................................ 62
Figure S22. Genomic profile of patients ranked according to increasing hypoxia. ........................................................ 63
Figure S23. Percentage of hypoxic measurements (HP20) as a function of clinical and genetic variables ................... 64
Figure S24. Supervised learning approach to biomarker development .......................................................................... 66
Figure S25. Classification abilities of the 100-loci DNA signature (“RF”) or clinical variables in the RadP cohorts. .. 68
Figure S26. The 100-loci DNA signature is prognostic in two individual cohorts. ....................................................... 70
Figure S27. The Signature Risk Score is associated with clinical variables. ................................................................. 71
Figure S28. CNA-signature within Gleason score patient sub-groups. .......................................................................... 72
Figure S29. CNA-signature within T-category patient sub-groups. ............................................................................... 73

Page 3 of 130
Figure S30. CNA-signature within PSA patient sub-groups. ......................................................................................... 74
Figure S31. CNA-signature at 18 months within each clinical risk group. .................................................................... 75
Figure S32. Classification of metastatic MSKCC patients. ............................................................................................ 76
Figure S33. Signature plurality analysis. ........................................................................................................................ 77
Figure S34. Signature comparison to previously published RNA signatures for 18-month biochemical recurrence-free
survival. .......................................................................................................................................................................... 78
Figure S35. Low-recurrence genes are important for prognosis. ................................................................................... 79
Figure S36. Comparison of our CNA-signature to various known prognostic CNA biomarkers. ................................. 80
Figure S37. Relative importance of the 100 signature loci. ........................................................................................... 81
Figure S38: Functional analysis of CNA-signature. ....................................................................................................... 82
Figure S39. Global PGA vs. signature-estimated PGA. ................................................................................................. 84
Figure S40. Example of clinical stratification of patients based on the PGA-Hypoxia index. ....................................... 86
Figure S41. Example of clinical stratification of patients based on the 100-loci DNA signature. ................................. 89
References .......................................................................................................................................................................... 92
Supplementary Files ........................................................................................................................................... …… ...... 95
Supplementary File 1. Full clinical annotation of Toronto-IGRT cohort.......................................................................95
Supplementary File 4. Annotation of 276 genes in the 100-loci DNA signature…………………………………….101
Supplementary File 5. Clinical characteristics and prognostic indices of Cambridge cohort…………………...……117

Supplementary MethodsSupplementary files are available at labs.oicr.on.ca/boutros-lab/publications
Toronto image-guided radiotherapy (IGRT) cohort (Training Set)A cohort of 247 men with histologically confirmed adenocarcinoma of the prostate were studied in a prospective clinicalstudy as previously described, which was approved by the University Health Network Research Ethics Board and registered(NCT00160979) in accordance with the criteria outlined by the International Committee of Medical Journal Editors.1 Informedconsent was obtained for all patients. Briefly, from 1996-2006, flash-frozen, pre-treatment biopsies were derived from thosepatients who had chosen radical IGRT for primary treatment. The clinical target volume (CTV) encompassed the prostate glandalone. The planning target volume (PTV) was defined by a 10 mm margin around the CTV except posteriorly where the marginwas 7 mm. All patients were treated with 6-field conformal or intensity modulated radiotherapy using fiducial gold seeds fordaily set-up and quality assurance to preclude geographical misses.
There was sufficient tumour in the biopsies of 142 of these patients to permit microdissection. Of these 142 patients, 126patients had information pertaining to long-term biochemical outcome and were treated with image-guided radiotherapy (IGRT).The final cohort therefore included 126 patients, of which 55 have had biochemical relapse (BCR) (Table S1; appendix p 11).Patients were followed at 6 month intervals after completing treatment with clinical examination and PSA tests. Additional testsand the management of patients with recurrent disease were at the discretion of the treating physician. The median follow-up ofsurviving patients is 7.8 years following the end of treatment. The clinical information for each patient is provided in Supple-mentary File 1.
Measurement of focal tumour hypoxia in IGRT cohort (HP20 index)Intra-glandular measurements of pO2 to define individual prostate cancer hypoxia was measured pre-radiotherapy for all patientsin the IGRT cohort using an ultrasound-guided transrectal needle-piezoelectrode technique, as previously described.2 Briefly,forty to eighty individual oxygen readings were obtained along 2 to 4 linear measurement tracks 1.5 to 2 cm in length throughregions of the prostate likely to contain tumour (based on real-time Doppler ultrasound, digital rectal examination, and previousdiagnostic biopsies). Tumour biopsies were taken directly parallel to this probe and one was fixed in formalin and another oneflash-frozen in liquid nitrogen for genomic studies, as previously described.1,3 The flash frozen biopsies used for aCGH analyseswere therefore obtained from the same spatial locale as the pO2 measurements.
A sensitivity analysis was performed assessing the prognostic ability of various hypoxic thresholds. We compared the percentageof pO2 oxygen measurements less than 5, 10, and 20 mm Hg (i.e. HP5, HP10, and HP20, respectively) in terms prognosticeffect. In this sensitivity analysis (Table S15; appendix p 25), we looked at all patients with hypoxic information (n = 247, i.e. allpatients from the Milosevic et al. study), and the subset of patients used in this study (n = 126, with two patients missing hypoxicreadings). We used Cox proportional hazard regression to model the effect of each hypoxic threshold alone, and in combinationwith time, which was previously shown to be significant.2 Based on this analysis, HP20 showed the most promise as a prognosticindicator and was selected as the independent variable for all analyses investigating relationships between genomic instabilityand hypoxia in the IGRT cohort.
aCGH analysisFrozen biopsies were embedded in optimum cutting temperature (OCT) at -80◦C and cut into 10 µm sections for manual mi-crodissection and preparation of DNA samples as previously described.1 Briefly, 300 ng of tumour and reference DNA weredifferentially labeled with Cyanine 3-dCTP and Cyanine 5-dCTP (Perkin Elmer Life Sciences). Reference DNA was obtainedfrom a healthy human male DNA (i.e. diploid). The samples were then applied onto whole genome tiling arrays containing26,819 bacterial artificial chromosome (BAC)-derived amplified fragment pools spotted in duplicate on aldehyde coated glassslides (SMRT v.2, BC Cancer Research Centre Array Facility, Vancouver). The log2 ratios of the Cyanine 3 to Cyanine 5 intensi-ties for each spot were calculated. Data were filtered based on both standard deviations of replicate spots (data points with greaterthan 0.075 standard deviation were removed) and signal to noise ratio (data points with a signal to noise ratio less than 3 wereremoved). The raw data and normalized gene-matrix has been deposited on NCBI’s Gene Expression Omnibus with accessionnumber GSE41120.
Page 4 of 130
The resulting dataset was normalized using a stepwise normalization procedure.4 The genomic positions of clones are mapped tothe NCBI’s Genome Build 36.1, released in March 2006. Areas of aberrant copy number were identified using a robust HiddenMarkov Model and classified as either loss, neutral, or gain for all probes processed.5 The liftOver tool from UCSC (versiondated 2011-11-27) was used to map the copy number segments to the hg19 human genome build. Fragments overlapping cen-tromeres, telomeres, or other gaps in the hg18 build were trimmed conservatively (regions were shortened rather than elongated).To generate contiguous CNA regions, probe-based CNA calls were collapsed with neighbouring probes within the same chromo-some with the same copy number. CNA regions with only one supporting probe were removed. In addition, any CNAs foundentirely within centromeres or telomeres, as defined by the UCSC ‘gap’ table, were removed. CNA regions were intersected witha merged and collapsed version of the RefSeq gene annotation (GRCh37/hg19) to generate gene-based CNA calls. This gene listwas further filtered to match the published gene list from the radical prostatectomy (RadP) cohort (n = 17603, Supplementary File2). TMPRSS2-ERG fusion status (see ‘erg_acgh’ column in Supplementary File 1) was defined by any deletion in the genomicregion between the 3’ end of ERG (chr21:39751950) and the 5’ end of TMPRSS2 (chr21:42879992), as previously described.6
MSKCC radical prostatectomy (RadP) cohort (Validation Set)To validate results derived from the IGRT cohort, a second cohort of CaP patients treated by radical prostatectomy at the MemorialSloan Kettering Cancer Center (MSKCC) was downloaded from the Cancer Genomics cBioPortal.7,8 We selected 154 clinically-staged T1-T4N0M0 primary tumours and classified patients as low, intermediate and high-risk, according to NCCN guidelines.9
Patients with salvage RadP were excluded. Patient DNA had been hybridized to Agilent’s 244k platform generating ∼244,000tumour to normal DNA intensity ratios. The normal samples used in this study were matched DNA when available or elsepooled normal DNA. To obtain gene-based calls for each patient, we downloaded the output of RAE, as described in the originalpublication.7 CNA calls were collapsed from {-2, -1, 0, 1, 2} to {-1, 0, 1} to match the dynamic range of the IGRT cohort (Supple-mentary File 2). To calculate PGA (see below), we also downloaded normalized and segmented data (.seg file) from cBioPortal.The segmented data consisted of regions of similar copy number status and a log-ratio. Thresholds of <-0.2 and >0.2 wereused to define deletions and amplifications, respectively, consistent with the cBio portal methodology. Again, the copy numberfragments were mapped to the hg19 human reference build using the liftOver tool, and filtered as above for the IGRT cohort.As with the IGRT cohort, TMPRSS2-ERG fusion status was defined by any deletion in the genomic region between the 3’ endof ERG (chr21:39751950) and the 5’ end of TMPRSS2 (chr21:42879992). The median follow-up time for this cohort was 4.6years, with 37 of 154 patients experiencing BCR (Table S1; appendix p 11). Given 37 events in this cohort and a 0.05 probabilityof a type I error, we have power of 0.56 and 0.92 to detect a hazard ratio of 2.0 and 3.0, respectively.
Cambridge RadP cohort (Validation Set)To further validate our prognostic indices, we obtained a second RadP cohort consisting of 117 low-high risk men treated in theUK (unpublished data; Ross-Adams et al.). Ethical approval for the use of samples and data collection was granted by the localResearch Ethics Committee under ProMPT (Prostate Mechanisms for Progression and Treatment) ’Diagnosis, investigation andtreatment of prostate disease’ (MREC 01/4/061). The Cambridge cohort comprises matched tumour and benign tissues from 117men with histologically-confirmed prostate cancer at radical prostatectomy. Samples were prepared as previously described, andthe minimum inclusion threshold for the percentage of tumour in samples was 40%.10 Comprehensive clinical (diagnostic) datawere collected, including pre-operative and follow-up PSA, TNM staging, and Gleason score (Table S2; appendix p 12). Theaverage age was 61 years (range 41-73). The median time to biochemical relapse is 2.8 years, and as such we focus on 18 monthbRFR for this cohort when used alone. Given 26 events in this cohort and a 0.05 probability of a type I error, we have power of0.42 and 0.80 to detect a hazard ratio of 2.0 and 3.0, respectively.
Total genomic DNA and mRNA RNA was extracted from each tumour and benign tissue core (Qiagen AllPrep). Copy num-ber variation was assayed with Illumina HumanOmni2.5-8 bead chip arrays (Aros Applied Biotechnology, Aarhus, Denmark)and pre-processed using OncoSNP.11 OncoSNP ranks the copy number calls from 1 (most confident, typically larger) to 5 (leastconfident, typically smaller); see https://sites.google.com/site/oncosnp/user-guide/interpreting-oncosnp-output for details. Weaccepted copy number calls of rank 3 or less in order to include both broad and focal CNAs. Expression profiling was per-formed on Illumina HT12 arrays. Bead level data were pre-processed to remove spatial artifacts, log2-transformed and quantilenormalized using the beadarray package in Bioconductor prior to analysis.12 The ComBAT method, as implemented in the svaBioconductor package (v3.2.1), was used to address batch effects in the expression data.13 To collapse the expression data to
Page 5 of 130

gene level, the probe with the largest inter-quartile range was used to represent each gene. The scores for each of the prognosticindices for the Cambridge cohort are supplied in Supplementary File 5.
RNA hypoxia signaturesTo evaluate hypoxia in the MSKCC and Cambridge cohorts, we used three previously published mRNA signatures for hypoxia(Table S12).14-16 The gene signatures were applied to 108/154 MSKCC patients and 110/117 Cambridge patients with mRNAdata available. To generate hypoxia scores, each gene in each patient was evaluated against the median gene abundance for thesame gene within the cohort. Patients with abundance greater than the median received a gene score of 1, and patients with abun-dance lower than the median received a gene score of -1. The hypoxia RNA score for a patient (p) is the sum of the gene-scoresfor each gene (g) in a signature with (sig.size) genes:
RNA Hypoxia Scorep =sig.size
∑g=1
f (x) ={
1, if genegp > median(g)−1, if genegp < median(g)
}
The RNA Hypoxia Scores were median dichotomized to define low- or high-hypoxia tumours. This was repeated for all threehypoxia signatures. These signatures have not been evaluated in prostate cancer. Validation in prostate cancer is required toillustrate that they are indeed measuring tumour hypoxia. Nonetheless, we use these promising signatures as a proxy for tumourhypoxia for the first time in prostate cancer, which is later validated by our results from the IGRT cohort, in which we have directintra-glandular hypoxia measurements at the site of biopsy.
Statistical methodsClinical risk groups were determined using the NCCN classification system.9 The primary outcome was time to biochemicalfailure (BCR) as defined by Roach et al.17 to be a PSA rise of at least 2 ng/mL above post-radiation nadir value for IGRT pa-tients, and for RadP patients as two consecutive PSA concentration values > 0.2 or triggered salvage radiotherapy.18 Five-yearbiochemical relapse-free rates (RFR) rates were calculated using the Kaplan-Meier method. Additionally, 18-month relapse-freerates were compared to evaluate risk of prostate cancer specific mortality.19 Cox proportional hazard models were fit when pos-sible, adjusting for Gleason score and PSA levels. T category was not prognostic within the low-intermediate risk patients in anycohort, and was thus not used in the models, except when using all risk groups where PSA, T category, and Gleason scores wereall included (Tables S1-S2; appendix pp 11-12). Proportional hazard assumptions were tested with the R function cox.zph. If avariable failed these assumptions, the variable was either stratified (e.g. for PSA) or a log-rank test was used.
Receive operator characteristic (ROC) and C-index analyses were performed with the survivalROC (v1.0.3) and Hmisc (3.14-4)packages, respectively. We used the survivalROC package to perform ROC analysis while accounting for data censoring, usingNearest Neighbour Estimation with default parameters at a prediction time of 18 months and 5 years.27 In the univariate setting,the biomarkers were used as the predictor variable for ROC and C-index analyses. In the multivariate setting, we use the outputof coxph models which include both the biomarker of interest and relevant clinical factors(PSA and Gleason score for low-intmodels, and PSA, Gleason score, and T category for full models). All statistical analyses were done in the open source R softwareversions 3.0.2 using the survival package version 2.37-4. A two-sided p-value of 0.05 was used to assess statistical significanceand the Benjamini-Hochberg false-discovery rate (FDR) method) or the Bonferroni correction was applied to correct for multipletesting, where appropriate.20
Cohort comparisonWe use several subsets of the validation cohorts in our analyses. To clinically match the IGRT/training cohort, we focus on thepatients with low or intermediate risk disease (’Low+Int’, n=124 for MSKCC and n=86 for Cambridge). To increase powerand to verify prognosis in a more diverse cohort, we also consider the full cohort which consists of an additional 30 high-riskMSKCC patients, 26 high-risk Cambridge patients, and 5 Cambridge patients with unknown classification (’Full’, n=271). Fi-nally, to evaluate the RNA hypoxia signature14-16 (above) and to compare our DNA-based signature to prognostic RNA indices(below), we consider the subset of 271 RadP patients with information on both mRNA and CNA (n=108 for MSKCC and n=110for Cambridge).
The distribution of clinical variables the IGRT and the low+int RadP cohorts were compared with χ2 tests for each valida-
Page 6 of 130

tion cohort separately (Tables S1-S2; appendix pp 11-12). In addition, the number of CNAs and the number of genes involved inregions of CNAs were compared between the IGRT and each of the low+int and full MSKCC cohorts. The t-test, Mann-Whitneytest and F-test were used to determine whether the two cohorts differed in terms of mean, median and standard deviation, respec-tively, for the number of CNAs or genes in CNAs per patient (Table S3, Figure S4; appendix pp 13, 40-41).
Univariate CNA prognosisCNA recurrence, defined as the percentage of patients within a cohort harbouring a CNA in a specific gene, was calculated forthe Toronto-IGRT and MSKCC cohorts alone and combined. Each gene with at least 10% recurrence within a cohort, or 5%recurrence across both cohorts, was assessed for prognosis using a Cox proportional hazard model, with adjustments for clinicalvariables. This analysis was repeated for each cohort separately, and both cohorts combined (see Supplementary File 3). If thenumber of gains and deletions in a gene were both above the minimum recurrence threshold, a multi-level factor was used forthe gene (copy neutral as the reference group, compared to gains and deletions separately). If only one type of CNA (i.e. gain ordeletion) was above the threshold, patients with the other CNA type were grouped with the copy neutral patients. Finally, if bothCNA types were each below the recurrence threshold, but together were above the threshold, patients with gains and deletionswere grouped together and compared to copy-neutral patients (i.e. CNAs vs. no CNAs). Multiple testing correction was appliedwith the false-discovery method.
Unsupervised hierarchical clusteringTo find the optimal number of subtypes, the R package ConsensusClusterPlus21 (v1.8.1) was used with 80% subsampling of pa-tients from the Toronto-IGRT cohort for 1000 iterations, with the maximum number of subtypes set to 15. Ward clustering withJaccard distance22 was used to cluster the genomic profiles of the patients (Figure S8A; appendix p 45). ConsensusClusterPlusalso determines the subtype assignment for each patient. The genomic profile of a subtype is defined as the median CN of eachgene in the patients assigned to that subtype, rounded to the nearest integer copy number. Patients from the MSKCC cohort wereassigned to the subtype which had the most similar CN profile (based on the Jaccard distance metric; Figures S9A-B; appendix p47). The distribution of several variables of interest was compared across the four subtypes. For the categorical variables (Glea-son score, T category, discretized hypoxia, ERG, and risk group), a deviance test was conducted with a Poisson regression modelto determine whether there was a statistically significant interaction between each variable and the clustering. For the continuousvariables (PSA, PGA), we conducted a Kruskal-Wallis test to compare the distribution of each variable across the four subtypes.These tests were repeated for both Toronto-IGRT and MSKCC cohorts combined and for each cohort separately (Tables S5-S7;appendix pp 15-17).
Percent genome alteration (PGA)Percentage Genome Alteration was calculated in the following way: each region of copy number alteration was identified anddefined by length of gain or loss in base pairs. The cumulative number of base pairs altered was calculated by adding all regionsof alteration per patient. The total number of base pairs altered was divided by the number of base pairs covered on the array toprovide a proportion of each patients genome altered. PGA does not account for the strand of CNAs, and thus the denominator isapproximately 3 billion base pairs (vs. 6 billion), depending on the platform used. PGA was treated as both a continuous variableand dichotomized at the Toronto-IGRT cohort upper tertile for presentation in Kaplan-Meier curve analyses. Mann-Whitney orKruskal-Wallis tests were used to compare the PGA of patients grouped according to clinical variables and genomic subtypes.
Interaction between percent genome alteration and hypoxiaA Cox proportional hazard regression model with an interaction term between PGA and hypoxia was used to test for a synergisticeffect between the two variables. Both variables were median dichotomized to define patients with low vs. high values. Forhypoxia, we used three previously published RNA signatures in the RadP cohorts (Table S12; appendix p 22)14-16 and HP20(which is a direct measurement of intra-tumour pO2, see above) in the Toronto-IGRT cohort.
100-loci DNA signatureA random forest23 with 1 million trees was trained with the Toronto-IGRT cohort and validated with the RadP cohorts usingthe R package randomForest (v4.6.7) (Figure S24; appendix pp 66-67). Given copy number status per patient (-1, 0, or 1), therandom forest predicts the occurrence of biochemical relapse for each patient. To eliminate redundancy, neighbouring genes withidentical copy numbers across all patients from both cohorts were collapsed into a single feature. This reduced our feature set
Page 7 of 130

by approximately 3-fold, resulting in 5,355 collapsed features. Signature sizes of 3, 5, 10, 30, 50, 75, 100, 300, 500 and 1000features were tested with a leave-one-out cross-validation approach in the IGRT cohort. To select which genes to include in asignature (i.e. attempt to find the most informative genes in predicting BCR) a binomial logistic regression model was fit to eachfeature and features were selected by p-value. The optimal gene signature size (100 features) was used to train the entire Toronto-IGRT cohort and was validated with both RadP cohorts. Variable importance was assessed using the change in Gini score andby the variable importance information generated from random forest training. The gene signature is obtained by mapping theselected collapsed features back to individual genes. The Signature Risk Score is the predicted score from the random forest (i.e.the proportion of trees that voted ‘yes’, where a ‘yes’ vote means the tree predicts that the patient will have biochemical relapse).
A bootstrap analysis was performed to evaluate how the identified signature compares to an empirical null distribution, as pre-viously described.24,25 A null distribution was created by generating by 1 million random sets of 100 features (sampled fromthe 5,355 collapsed regions) and repeating the random forest training and classification with the IGRT and pooled RadP cohorts,respectively. For each random gene set, the AUC and c-index of that model in the pooled RadP cohorts were obtained.
Prediction of metastasisWe examined the potential of the 100-loci DNA signature in predicting metastasis in the MSKCC cohort. The Cambridge cohortwas excluded as metastasis information was not available. Since the time to metastasis is unknown for the MSKCC cohort, resultsregarding prognosis for metastasis are preliminary. For receiver operator characteristic (ROC) analysis, all patients were used andthe the area under the ROC curve (AUC) was assessed with the pROC package, which does not take censored information intoaccount.26 Given that median time to follow-up is 4.6 years in the MSKCC cohort, additional patients will eventually experiencemetastasis. Thus, we will be better suited to understand the model’s ability to predict metastasis in the future. To evaluate theaccuracy of classification for metastasis, only patients with at least five-years of follow-up time, or a reported metastatic eventwere considered (n = 74, of a possible total of 154). A Mann-Whitney U test was used to compare scores of patients with andwithout metastasis.
Comparison of prognostic variables for biochemical relapseThe prognostic ability of the random forest signature, PGA, and clinical variables were compared with a ROC analysis, and inparticular the AUCs of each variable(s). The R package survivalROC (v1.0.3) was used to create ROC curves while accountingfor data censoring, using Nearest Neighbour Estimation with default parameters at a prediction time of 5 years.27 A permutationanalysis was used to assign p-values to pairs of AUCs by randomly scrambling sample-signature score pairings per marker 5000times, and building a distribution of the differences in AUC. A p-value was obtained based on the z-score for the difference inAUCs from the unscrambled sample-signature pairs. In addition, to assess the goodness of fit for models with vs. without PGA,the difference of deviances for models with only the signature or the genomic subtypes, to models combined with PGA wascompared to a χ2 distribution, with one degree of freedom.
Comparison of genomic prognostic signaturesWe compared the AUC of our 100-loci DNA signature to 23 previously published RNA-based prognostic signatures for BCRin prostate cancer (Table S21; appendix p 31). To enable a fair comparison between the DNA and RNA signatures, we trainedthe RNA signatures with random forests, and tested their performance on the same subset of the MSKCC cohort. In total,108 MSKCC patients with localized disease have mRNA and CNA information. To train the models with the RNA signatures,the GenomeDX prostate cancer database was used, which contains genome-wide mRNA abundance values from microarraysfor primary tumour samples from the Mayo Clinic28,29, Cleveland Clinic30, Thomas Jefferson University31, New York Univer-sity, Moffit Cancer Center, Erasmus Medical Center32, Institute of Cancer Research33, and MSKCC7. All patients from theGenomeDX database except for the MSKCC patients were used to train two models for each signature: one using only low andintermediate risk patients, and another using low- to high-risk patients, including some patients with node-positive disease. Thisresults in a training set of 293 patients for the low-intermediate risk patient models, and of 1299 patients for the full-cohort patientmodels.
The methodology for the low-intermediate risk cohort and the low-high risk cohort are the same, with each model producing aset of predictions scores and AUCs, implemented in R (version 2.15.3). Every patient sample is normalized using SCAN at theprobe selection region (PSR) level (v1.0.0, customized for the HuEx arrays).34 Each gene in the signatures is summarized by
Page 8 of 130

taking the median expression of any PSR which falls within an exon of the gene. In the rare event that no PSR and exon overlap,intronic PSRs are used instead. If no PSR is found within the gene’s genomic region, the gene is not included in the remodeledsignature.
All samples, excluding MSKCC, are used for training a random forest classifier (randomForest package v 4.6-7) to predict bio-chemical relapse. Tuning of the classifier’s parameters is done using a 5 by 5 grid search of the mtry and nodesize parameters.The best tuning parameters are selected after a 10-fold cross validation performance evaluation. Each tuned model was appliedto the MSKCC patients to produce a risk score between 0 - 1 for the patient’s likelihood of biochemical progression. In additionto the genomic models, a clinical model was created using pre-treatment PSA, T category, and diagnostic Gleason score. Againa random forest model was used and tuned in a similar way as described above. The scores of the models were evaluated fortheir ability to predict biochemical relapse using survivalROC.27 AUCs were calculated for prediction times of 5 years and 18months using survivalROC v1.0.3. Confidence intervals were estimated via 500 bootstrapping iterations. The AUCs for the 23RNA signatures were compared to the AUC of our 100-loci DNA signature, using the 108 MSKCC patients with both mRNAand DNA information (Figure 4C-D and Figure S34; appendix p 78).
Page 9 of 130

Supplementary Files
Supplementary File 1. Full clinical annotation of the Toronto-IGRT cohort. See pages 95-100. We have made the original excelfile available from NCBI’s Gene Expression Omnibus with accession number GSE41120 and at http://labs.oicr.on.ca/boutros-lab/publications.
Supplementary File 2. Gene-based CNA calls for the Toronto-IGRT and MSKCC cohorts after pre-processing. The datafor the MSKCC cohort was downloaded from the cBio portal, filtered to match the Toronto-IGRT gene list, and to select onlyprimary tumours from patients with localized disease and no adjuvant treatment (n = 154). The rows represent genes, the columnsare patients. Values are ternarized to -1, 0, 1, representing deletions, neutral, and amplification states, respectively. All genomicpositions refer to the GRCh37 (hg19). Access data here: http://labs.oicr.on.ca/boutros-lab/publications/, and for the Toronto co-hort only from NCBI’s Gene Expression Omnibus with accession number GSE41120.
Supplementary File 3. Univariate prognostic impact of each gene per cohort. A multivariate Cox proportional hazard modelwas fit for all genes with CNAs in 10% or more of the cohort, adjusting for clinical variables. For the Toronto-IGRT cohort(first tab), Gleason score and PSA (stratified at 10ng/mL) were included in the Cox proportional hazard model. For the MSKCCcohort and the combined cohorts (second and third tab, respectively), all patients were used, and thus T-category (T3 vs. T1-2)was included in the model, in addition to Gleason score and PSA. Multiple testing correction was applied with the Benjamini-Hochberg false-discovery rate correction (see q-value column). All genomic positions refer to the GRCh37 (hg19). Access datahere: http://labs.oicr.on.ca/boutros-lab/publications/.
Supplementary File 4. Complete annotation of the CNA signature involving 276 genes. Annotations include genomic positions(relative to GRCh37/hg19), prognostic information and frequency of CNAs (gains and deletions combined) in each genomicsubtype. For the prognostic information, the Toronto-IGRT and MSKCC cohorts were combined, including high risk MSKCCpatients. See ‘Univariate CNA prognosis’ section in the Supplementary methods. View data on pages 101-116 and access datahere: http://labs.oicr.on.ca/boutros-lab/publications/
Supplementary File 5. Annotations and scores for the Cambridge cohort. The clinical annotation (first tab), the PGA perpatient (second tab), the RNA hypoxia scores (third tab), and the CNA matrix for the 100-loci DNA signature (fourth tab) areprovided. View data on pages 117-130 and access data here: http://labs.oicr.on.ca/boutros-lab/publications/
Page 10 of 130

Supplementary Tables
Table S1. Clinical characteristics of Toronto-IGRT cohort compared to MSKCC cohort.
Clinical characteristics of localized prostate cancer patients treated by image-guided radiation therapy (IGRT; n=126) or radicalprostatectomy (RadP; low- to intermediate-risk n = 124; low- to high-risk n = 154). Shown are the hazard ratios and significance(Wald p-values) for the effect of the clinical prognostic factors (PSA, GS, T-category) for 5-year bRFR following either IGRT(for Toronto-IGRT cohort) or RadP (for MSKCC cohort) for T1-3N0M0 clinically-staged prostate cancers. Differences betweenthe two cohorts in these clinical variables are also shown with χ2 tests or two-sided Mann-Whitney U-tests. The use of theclinical factors in multivariate models is also stated for models using only the low- to intermediate-risk patients (low-int model)and for the models including all patients (full model). Of note, when considering only the low and intermediate risk RadPpatients, the IGRT cohort had significantly more patients with T2 and GS7 tumours and higher PSA (along with a longer medianfollow-up and an increased number of events compared to the RadP cohort).
Toronto-IGRT cohort MSKCC Cohort Difference between MSKCC Cohort Comparison used inLow-Int Risk cohorts Low-High Risk statistical models
N (%) N (%) p (test) N (%)T-category
T1 45 (36%) 68 (55%) 79 (51%) low-int model: NAT2 81 (64%) 56 (45%) 0.0036 66 (43%) full model: T3 vs. T1-T2T3 0 (0%) 0 (0%) (χ2) 9 (5.8%)
HR (T2 vs. T1) 0.82 0.79p 0.60 0.66 < 0.0001 (log-rank)
Gleason Score5 0 (0%) 2 (1.6%) 2 (1.3%)6 31 (25%) 78 (63%) 82 (53%) low-int model: 7 vs. 5-67 95 (75%) 44 (35%) < 0.0001 53 (34%) full model: 8-9 vs. 5-68 0 (0%) 0 (0%) (χ2) 11 (7.1%) and 7 vs. 5-69 0 (0%) 0 (0%) 6 (3.9%)
HR (7 vs. 6) 1.0 2.77 (7 vs. 5-6)p 0.95 0.053 < 0.0001 (log-rank)
Pre-treatment PSA (ng/mL)Median 7.8 5.9 13.6 All models: PSA isRange 0.9 - 19 1.2 - 19 < 0.0001 1.2-306 stratified at 10ng/mL
HR (continuous) 1.2 1.1 (Mann-Whitney-U) 1.01p 0.0012 0.41 0.00030
Biochemical RecurrenceNo 71 (56%) 105(85%) < 0.0001 116 (75%) NAYes 55 (55%) 19 (15%) (χ2) 37 (25%)
Median follow-up time 7.8 years 4.8 years p = 0.51 (log-rank) 4.8 years NAMedian time to BCR 6.8 years 4.4 years p = 0.14 (log-rank) 4.5 years Response variableNCCN classificationLow-risk 19 (15%) 58 (47%) < 0.0001 58 (38%)Intermediate-risk 107 (85%) 66 (53%) (χ2) 66 (43%)High-risk 0 (0%) 0 (0%) 30 (19%)
Metastasis 11 3 p = 0.058 (χ2) 11 NADeaths 12 7 p = 0.36 (χ2) 11 NA
Page 11 of 130

Table S2. Clinical characteristics of Toronto-IGRT cohort compared to Cambridge cohort.
Clinical characteristics of loclized prostate cancer patients treated by image-guided radiation therapy (IGRT; n=126) or radicalprostatectomy (Cambridge; low-int n = 86; full n = 117). Shown are the hazard ratios and significance (Wald p-values) for theeffect of the clinical prognostic factors (PSA, GS, T-category) for bRFR following either IGRT (Toronto-IGRT cohort, 5-yearbRFR) or RadP (Cambridge cohort, 18-month bRFR) for T1-3N0M0 clinically-staged prostate cancers. Differences between thetwo cohorts in these clinical variables are also shown with χ2 tests or two-sided Mann-Whitney U-tests. The use of the clinicalfactors in multivariate models is also stated for models using only the low- to intermediate-risk patients (low-int model) and forthe models including all patients (full model).
Toronto-IGRT cohort Cambridge Cohort Difference between Cambridge Cohort Comparison used inLow-Int Risk cohorts Low-High Risk statistical models
N (%) N (%) p (test) N (%)T-category
T1 45 (36%) 56 (65%) 67 (57%) low-int model: NAT2 81 (64%) 30 (35%) < 0.0001 35 (30%) full model: T3 vs. T1-T2T3 0 (0%) 0 (0%) (χ2) 15 (13%)
HR (T2 vs. T1) 0.82 2.3p 0.60 0.21 0.021 (log-rank)
Gleason Score5 0 (0%) 0 (0%) 0 (0%)6 31 (25%) 24 (28%) 28 (24%) low-int model: 7 vs. 5-67 95 (75%) 62 (72%) 0.70 73 (62%) full model: 8-9 vs. 5-68 0 (0%) 0 (0%) (χ2) 11 (9.4%) and 7 vs. 5-69 0 (0%) 0 (0%) 1 (0.85%)NA 0 (0%) 0 (0%) 4 (3.4%)
HR (7 vs. 6) 1.0 3.2p 0.95 0.29 0.10 (log-rank)
Pre-treatment PSA (ng/mL)Median 7.8 8.0 7.9 All models: PSA isRange 0.9 - 19 3.5 - 18 0.46 3.2-23.7 stratified at 10ng/mL
HR (continuous) 1.2 1.3 (Mann-Whitney-U) 1.1p 0.0012 0.19 0.16
Biochemical RecurrenceNo 71 (56%) 71(83%) 0.00013 91 (78%) NAYes 55 (55%) 15 (17%) (χ2) 26 (22%)
Median time to BCR 6.8 years 2.8 years p = 0.32 (log-rank) 2.8 years Response variableNCCN classificationLow-risk 19 (15%) 16 (19%) 0.62 16 (14%)Intermediate-risk 107 (85%) 70 (81%) (χ2) 70 (60%)High-risk 0 (0%) 0 (0%) 26 (22%)NA 0 (0%) 0 (0%) 5 (4.3%)
Page 12 of 130

Table S3. CNAs (a) and genes involved in CNAs (b) per cohort.
Events were compared at the CNA level (a) and at the gene-CNA level (b) for the Toronto-IGRT and MSKCC cohorts. Quartilesand Mann-Whitney U p-values are shown for each cohort and event-type. Differences in the median number of CNAs perpatient are observed between cohorts but these differences are not present when comparing the frequencies of genes within CNAregions.
aMinimum 25% Median 75% Maximum Mann-Whitney P
IGRT 0 9 17 30 193 0.0013MSKCC 1 10 30 55 257
bMinimum 25% Median 75% Maximum Mann-Whitney P
IGRT 0 122.5 751.5 1606.5 8077 0.14MSKCC 0 172.3 530 930.5 7114
Page 13 of 130

Table S4. Genetic differences between Subtypes 2 and 3.
The top 6/8 differential regions (χ2 test, q < 0.05) are shown. In Subtype-2, gain of 8q (including c-MYC as the top hit), gainof 3q, deletion of chromosome 13, and a deletion within 1q are more frequent. In contrast, in Subytpe-3, 16q deletion is morecommonly observed. The χ2 test-statistic and q-value are shown for representative genes in each region, and the additionalnumber of genes from the region is noted (+X genes).
Subtype-2 Subtype-3 Genes involvedFreqeuncy Freqeuncy q (χ2)
Region Event (%) (%) Additional significant genes in regionMYC, EFR3A, GSDMC, OC90, ANXA13, HAS2, NOV, ENPP2,
8q Gain 92 13 ZHX2, KLHL38, KCNQ3, TG, LRRC6, PHF20L1, TMEM71χ2 = 29.4, p = < 0.0001+366 genesFOXO1, SLC25A15, LHFP, MRPS31, COG6, C13orf23,
13q Loss 69 16 STOML3, FREM2, NHLRC3χ2 = 14.4, p = 0.0021+67 genesITGB5, MYLK, UMPS, KALRN, ROPN1, MUC13, HEG1,
3q Gain 42 0 CLSTN2, CCDC14χ2 = 13.6, p = 0.0033+291 genesKPNA5, PLN, ROS1, TSPYL1, TSPYL4, DSE, RWDD1, GOPC,NUS1, FAM26D, ZUFSP, FAM162B, GPRC6A, RFX6, SLC35F1,
6q Loss 58 6.5 VGLL2, FAM26E, DCBLD1, RSPH4A, C6orf204, FAM26Fχ2 = 15.4, p = 0.0014+78 genesCYBA, MVD, IL17C, ZC3H18, KLHDC4, JPH3
16q Loss 23 74 ZCCHC14, FBXO31χ2 = 12.8, p = 0.0050+236 genes
1q Loss 46 3.2 KCNK1, NVL, DISC1, CNIH4, KIAA1383, SUSD4, SIPA1L2,PCNXL2, WDR26, C1orf57, KIAA1804, CNIH3, C1orf65χ2 = 12.5, p = 0.012+76 genes
Page 14 of 130

Table S5. Enrichment of clinical variables across Subtypes in the Toronto-IGRT cohort.
The rows of significant variables are in bold. The values in the Subtype columns depend on the type of variable. For continuousvariables (PSA, PGA, and HP20), the median is shown. For binary variables (HP20 dichotomized and TMPRSS2-ERG), theproportion of patients with the event are shown. For categorical variables (Gleason score, T category and Risk group), the modeis shown. To determine whether any variable was enriched in a Subtype, a Kruskall-Wallis test was used for the continuousvariables, and a deviance test was used for the categorical and binary variables. The number of degrees of freedom (df) in eachtest are shown.
Subtype-1 Subtype-2 Subtype-3 Subtype-4 Statistic df p-valueGleason Score 7 7 7 7 0.54 3 0.91
T-status T2 T2 T2 T2 0.24 3 0.97PSA 8.6 9.3 8.6 8.9 1.9 3 0.60PGA 16 14 8.0 1.9 88 3 < 0.0001
HP20 0.81 0.70 0.76 0.73 1.4 3 0.70Risk group Intermediate Intermediate Intermediate Intermediate 1.5 3 0.69
TMPRSS2-ERG 0.20 0.17 0.35 0.19 2.4 3 0.49
Page 15 of 130

Table S6. Enrichment of clinical variables across Subtypes in the MSKCC cohort.
The rows of significant variables are in bold. The values in the Subtype columns depend on the type of variable. For continuousvariables (PSA and PGA), the median is shown. For binary variables (TMPRSS2-ERG), the proportion of patients with the eventare shown. For categorical variables (Gleason score, T category, and Risk group), the mode is shown. To determine whether anyvariable was enriched in a Subtype, a Kruskall-Wallis test was used for the continuous variables, and a deviance test was usedfor the categorical and binary variables. The number of degrees of freedom (df) in each test are shown.
Subtype-1 Subtype-2 Subtype-3 Subtype-4 Statistic df p-valueGleason Score 6 7 6 6 12 12 0.48
T-status T2 T2 T2 T2 7.4 6 0.29PSA 13 23 18 12 8.5 3 0.037PGA 8.8 12 8.9 2.1 55 3 < 0.0001
Risk group Intermediate Intermediate High Intermediate 13 6 0.043TMPRSS2-ERG 0.33 0.39 0.39 0.27 2.4 3 0.49
Page 16 of 130

Table S7. Enrichment of clinical variables in Subtypes with patients from the Toronto-IGRT and MSKCC cohorts.
The rows of significant variables are in bold. The values in the Subtype columns depend on the type of variable. For continuousvariables (PSA and PGA), the median is shown. For binary variables (TMPRSS2-ERG), the proportion of patients with the eventare shown. For categorical variables (Gleason score, T category, and Risk group), the mode is shown. To determine whether anyvariable was enriched in a Subtype, a Kruskall-Wallis test was used for the continuous variables, and a deviance test was usedfor the categorical and binary variables. The number of degrees of freedom (df) in each test are shown.
Subtype-1 Subtype-2 Subtype-3 Subtype-4 Statistic df p-valueGleason Score 7 7 7 7 23 12 0.029
T-status T2 T2 T1 T1 11 6 0.096PSA 10 16 14 10 15 3 0.0014PGA 13 13 8.7 2.1 250 3 < 0.0001
Risk group Intermediate Intermediate Intermediate Intermediate 16 6 0.011TMPRSS2-ERG 0.17 0.24 0.32 0.24 4.3 3 0.23
Page 17 of 130

Table S8. Multivariate Cox proportional hazard model for the genomic Subtypes in the pooled Toronto-IGRT and MSKCC cohorts forlow-intermediate risk patients.
a: A multivariate Cox proportional hazard model was fit using low- to intermediate-risk patients from both cohorts, with theSubtypes as the main predictor of bRFR, and Gleason score and PSA as clinical covariates. Subtype-4 is used as the referencegroup for the Subtype variable, as it has the best prognosis. PSA is stratified at 10 ng/mL since it fails the proportional hazardAZsassumption.
b: A second model with the addition of continuous PGA as the only change was also fit. Likelihood-ratio test revealsthat the model without PGA is the best fit for the data (p = 0.054).
aHR Lower 95% CI Upper 95% CI p-value
Subtype-1 3.3 1.3 8.4 0.015Subtype-2 4.5 2.0 10 2.8×10⁻⁴
Subtype-3 5.2 2.4 11 < 0.0001Gleason Score 7 vs. 5-6 1.4 0.69 2.4 0.38
bHR Lower 95% CI Upper 95% CI p-value
Subtype-1 1.5 0.41 5.5 0.53Subtype-2 2.6 0.99 6.8 0.052Subtype-3 4.0 1.8 8.9 6.1×10⁻⁴
Gleason Score 7 vs. 5-6 1.4 0.72 2.8 0.31PGA (continuous, for a 1.6 1.0 2.4 0.03310% increase in PGA)
Page 18 of 130
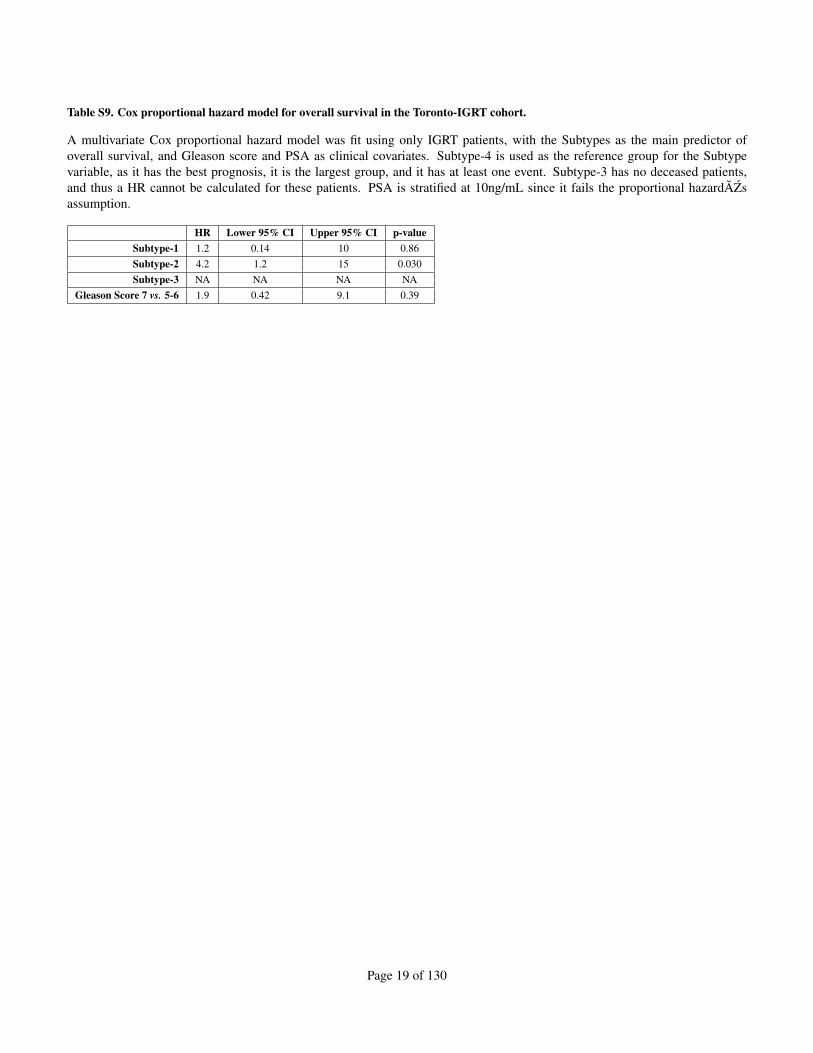
Table S9. Cox proportional hazard model for overall survival in the Toronto-IGRT cohort.
A multivariate Cox proportional hazard model was fit using only IGRT patients, with the Subtypes as the main predictor ofoverall survival, and Gleason score and PSA as clinical covariates. Subtype-4 is used as the reference group for the Subtypevariable, as it has the best prognosis, it is the largest group, and it has at least one event. Subtype-3 has no deceased patients,and thus a HR cannot be calculated for these patients. PSA is stratified at 10ng/mL since it fails the proportional hazardAZsassumption.
HR Lower 95% CI Upper 95% CI p-valueSubtype-1 1.2 0.14 10 0.86Subtype-2 4.2 1.2 15 0.030Subtype-3 NA NA NA NA
Gleason Score 7 vs. 5-6 1.9 0.42 9.1 0.39
Page 19 of 130

Table S10. Multivariate Cox proportional hazard model for PGA in each cohort.
a: Multivariate Cox Proportional hazard models were fit to patients from all risk groups in each cohort, modeling continuousPGA (modeled in 1% increments) as a predictor for bRFR, and adjusting for PSA, Gleason score and T category (T category forMSKCC and Cambridge cohorts). PSA is stratified at 10ng/mL since it fails the proportional hazardAZs assumption. Five-yearbRFR is used for the Toronto-IGRT and MSKCC cohorts, and 18-month bRFR is used for the Cambridge cohort.
b: Models above are repeated for dichotomized PGA at the upper tertile of the Toronto-IGRT cohort (7.49%).
aToronto-IGRT MSKCC (Full cohort) Cambridge (Full cohort)
Lower Upper Lower Upper Lower UpperHR 95% CI 95% CI p-value HR 95% CI 95% CI p-value HR 95% CI 95% CI p-value
Percent Genome Altered 1.06 1.03 1.09 1.9×10⁻⁴ 1.05 0.997 1.10 0.065 1.08 1.02 1.14 0.0012(continuous 1% increments)Gleason Score 7 vs. 5-6 1.1 0.46 2.8 0.81 2.9 1.2 6.9 0.017 5.3 0.68 41 0.11Gleason Score 8-9 vs. 5-6 NA NA NA NA 3.6 2.1 12 2.8×10⁻⁴ 5.8 0.58 58 0.13T3 vs. T1-2 NA NA NA NA 5.1 2.1 12 2.8×10⁻⁴ 2.4 0.69 8.3 0.17
bToronto-IGRT MSKCC (Full cohort) Cambridge (Full cohort)
Lower Upper Lower Upper Lower UpperHR 95% CI 95% CI p-value HR 95% CI 95% CI p-value HR 95% CI 95% CI p-value
Percent Genome Altered 4.5 2.1 9.8 1.3×10⁻⁴ 3.4 1.6 7.2 0.0011 3.2 1.1 9.0 0.029(≥ 7.49 vs. <7.49)Gleason Score 7 vs. 5-6 0.74 0.30 1.8 0.49 3.1 1.3 7.4 0.012 6.3 0.82 49 0.077Gleason Score 8-9 vs. 5-6 NA NA NA NA 3.9 1.4 11 0.011 6.1 0.61 61 0.12T3 vs. T1-2 NA NA NA NA 4.7 1.9 11 7.2×10⁻⁴ 2.3 0.65 8.2 0.19
Page 20 of 130

Table S11. C-index analysis of PGA and clinical variables.
The C-index was calculated for the binary (dichotomized at 7.49%) and continuous version of percent genome alteration (PGA)with or without clinical variables in the IGRT cohort (a), the low+int MSKCC cohort (b), the full MSKCC cohort (c), and thefull Cambridge cohort (d). Five-year bRFR is used for the Toronto-IGRT and MSKCC cohorts, and 18-month bRFR is used forthe Cambridge cohort.PGA = Percentage Genome Alteration; NCCN = National Comprehensive Cancer Network; GS = Gleason Score
aC-index Lower 95% CI Upper 95% CI p
PGA ≥ 7.49 vs. <7.49 0.67 0.58 0.76 0.00012PGA continuous 0.72 0.64 0.81 < 0.0001
NCCN group 0.52 0.46 0.58 0.49PGA and NCCN 0.68 0.59 0.77 < 0.0001
GS, T-category, and PSA 0.49 0.39 0.60 0.90PGA and GS/T/PSA 0.63 0.52 0.75 0.021
bC-index Lower 95% CI Upper 95% CI p
PGA ≥ 7.49 vs. <7.49 0.64 0.52 0.77 0.023PGA continuous 0.61 0.44 0.78 0.18
NCCN group 0.62 0.51 0.73 0.032PGA and NCCN 0.71 0.60 0.83 0.00013
GS, T-category, and PSA 0.62 0.48 0.76 0.090PGA and GS/T/PSA 0.79 0.70 0.88 < 0.0001
cC-index Lower 95% CI Upper 95% CI p
PGA ≥ 7.49 vs. <7.49 0.64 0.56 0.72 0.00071PGA continuous 0.60 0.48 0.72 0.087
NCCN group 0.65 0.71 0.59 < 0.0001PGA and NCCN 0.77 0.69 0.84 < 0.0001
GS, T-category, and PSA 0.69 0.60 0.78 < 0.0001PGA and GS/T/PSA 0.76 0.68 0.83 < 0.0001
dC-index Lower 95% CI Upper 95% CI p
PGA ≥ 7.49 vs. <7.49 0.60 0.50 0.70 0.045PGA continuous 0.65 0.53 0.78 0.016
NCCN group 0.64 0.53 0.75 0.013PGA and NCCN 0.69 0.56 0.81 0.0037
GS, T-category, and PSA 0.73 0.62 0.84 < 0.0001PGA and GS/T/PSA 0.72 0.61 0.84 < 0.0001
Page 21 of 130

Table S12. RNA hypoxia signatures used in this study.
Descriptions of the three previously published RNA signatures for hypoxia that were tested in our prostate cancer cohorts. Thenumber of genes in each signature is shown along with the cancer types in which the signatures were found to be prognostic inthe original publications.
Signature Number Cancer type Referencename of genesBuffa 52 Head and neck, lung, Buffa F.M. et al. Large meta-analysis of multiple cancers reveals
and breast cancers a common, compact and highly prognostic hypoxia metagene.Brit. J. Cancer 2010; 102: 428-35.
West 26 Laryngeal cancer Eustace A.et al. A 26-gene hypoxia signature predictsbenefit from hypoxia-modifying therapy in laryngeal cancer but
not bladder cancer.Clin. Cancer Res. 2013; 19: 4879-88.
Winter 99 Head and neck and Winter S.C. et al. Relation of a hypoxia metagene derived frombreast cancers head and neck cancer to prognosis of multiple cancers.
Cancer Res. 2007; 67: 3441-9.
Page 22 of 130

Table S13. Prognosis of combined PGA and RNA hypoxia scores in the RadP cohorts
Cox proportional hazard models were fit using PGA and binary RNA hypoxia scores for the Buffa (a), West (b), and Winter (c)RNA hypoxia signatures. Both PGA and RNA hypoxia scores are median dichotomized, where patients with a score above themedian ("+") are compared to patients with a score below the median ("-"). The full MSKCC and Cambridge cohorts were used(228 patients with mRNA abundance information).
aHR 95% CI 95% CI p-value
PGA+ Hypoxia+ 2.3 1.1 4.8 0.031PGA+ Hypoxia- 1.5 0.61 3.6 0.39PGA- Hypoxia+ 0.53 0.18 1.5 0.24
bHR 95% CI 95% CI p-value
PGA+ Hypoxia+ 5.3 1.8 16 0.0027PGA+ Hypoxia- 3.8 1.3 12 0.018PGA- Hypoxia+ 2.5 0.80 7.8 0.12
cHR 95% CI 95% CI p-value
PGA+ Hypoxia+ 2.6 1.1 5.9 0.025PGA+ Hypoxia- 1.6 0.65 3.8 0.32PGA- Hypoxia+ 0.66 0.24 1.8 0.43
Page 23 of 130

Table S14. C-index analysis of PGA and hypoxia in the pooled full RadP cohorts.
The c-index of various Cox proportional hazard models were determined using different combinations of PGA and hypoxia forthe Buffa (a), West (b), and Winter (c). When binary variables are used, patients are stratified by the median PGA value (3.84%)and the median RNA Signature Score.
aC-index Lower 95% CI Upper 95% CI p
Hypoxia (continuous) 0.50 0.41 0.58 0.98Hypoxia (binary) 0.53 0.46 0.61 0.38
Hypoxia + PGA (continuous) 0.67 0.58 0.75 < 0.0001Hypoxia x PGA (continuous) 0.68 0.59 0.76 < 0.0001
Hypoxia + PGA (binary) 0.62 0.54 0.71 0.0036Hypoxia x PGA (binary) 0.65 0.57 0.73 0.00015
bC-index Lower 95% CI Upper 95% CI p
Hypoxia (continuous) 0.57 0.48 0.65 0.10Hypoxia (binary) 0.57 0.49 0.64 0.063
Hypoxia + PGA (continuous) 0.67 0.59 0.75 < 0.0001Hypoxia x PGA (continuous) 0.67 0.59 0.75 < 0.0001
Hypoxia + PGA (binary) 0.65 0.58 0.73 < 0.0001Hypoxia x PGA (binary) 0.65 0.58 0.73 < 0.0001
cC-index Lower 95% CI Upper 95% CI p
Hypoxia (continuous) 0.53 0.45 0.60 0.48Hypoxia (binary) 0.54 0.46 0.61 0.33
Hypoxia + PGA (continuous) 0.65 0.56 0.74 0.00076Hypoxia x PGA (continuous) 0.65 0.57 0.74 0.00049
Hypoxia + PGA (binary) 0.64 0.55 0.73 0.0019Hypoxia x PGA (binary) 0.66 0.58 0.74 < 0.0001
Page 24 of 130

Table S15. Sensitivity analysis of hypoxic measurements, alone and with an interaction with time, in the Toronto-IGRT cohort.
The percentage of intra-glandular pO2 measurements below 5%, 10%, and 20% (i.e. HP5, HP10, and HP20, respectively) aremodeled as a continuous variable, alone and with an interaction with time. Overall, intra-glandular pO2 measurements areprognostic, and have a significant interaction with time. Additionally, HP20 shows the most promise for prognosis in prostatecancer. We considered the full patient cohort reported in a previous study2 (a; n = 247), and the subset of these patients used inthis study (b; n = 126 however two patients have no hypoxic measurements).
aVariable HR Lower 95% CI Upper 95% CI p-valueHP5 1.02 0.999 1.03 0.0646HP5 x time 1.00 0.999 1.00 0.0046HP10 1.03 1.00 1.05 0.0117HP10 x time 1.00 0.999 1.00 0.008HP20 1.04 1.01 1.07 0.0022HP20 x time 0.999 1.00 1.00 0.0002
bVariable HR Lower 95% CI Upper 95% CI p-valueHP5 1.01 0.994 1.03 0.174HP5 x time 1.00 0.999 1.00 0.0242HP10 1.02 0.995 1.04 0.130HP10 x time 1.00 0.999 1.00 0.0334HP20 1.03 0.998 1.06 0.0720HP20 x time 1.00 0.999 1.00 0.0367
Page 25 of 130

Table S16. The prognostic effect of PGA and hypoxia in the Toronto-IGRT cohort.
A Cox proportional hazard model was fit with median dichotomized PGA and hypoxia, including an interaction term. The PGAthreshold is the median of the Toronto-IGRT cohort (3.84%) and the hypoxia threshold is the median HP20 value (81.3%).a: There is a significant interaction between PGA and hypoxia on bRFR in the Toronto-IGRT patients.b: Modeling patients with low or high PGA separately shows that the effect of hypoxia on bRFR in differs between these groupsof patients.
aHR Lower 95% CI Upper 95% CI p-value
PGA ≥ 3.84 vs. PGA < 3.84 1.2 0.55 2.7 0.63HP20 ≥ 81.3 vs. HP20 < 81.3 0.71 0.31 1.6 0.42PGA x HP20 3.8 1.2 12 0.019
bHR Lower 95% CI Upper 95% CI p-value
Effect of hypoxia in low PGA 0.9 0.35 2.3 0.82Effect of hypoxia in high PGA 2.5 1.1 5.4 0.024
Page 26 of 130

Table S17. C-index analysis of PGA and hypoxia in the Toronto-IGRT cohort.
The c-index of various Cox proportional hazard models were determined using different combinations of PGA and hypoxia.When binary variables are used, patients are stratified by the median PGA value (3.84%) and the median HP20 value (81.3%).
C-index Lower 95% CI Upper 95% CI pHypoxia (continuous) 0.54 0.46 0.63 0.27
Hypoxia (binary) 0.57 0.49 0.65 0.069Hypoxia + PGA (continuous) 0.67 0.59 0.75 < 0.0001Hypoxia x PGA (continuous) 0.69 0.60 0.77 < 0.0001
Hypoxia + PGA (binary) 0.67 0.60 0.75 < 0.0001Hypoxia x PGA (binary) 0.67 0.59 0.75 < 0.0001
Page 27 of 130
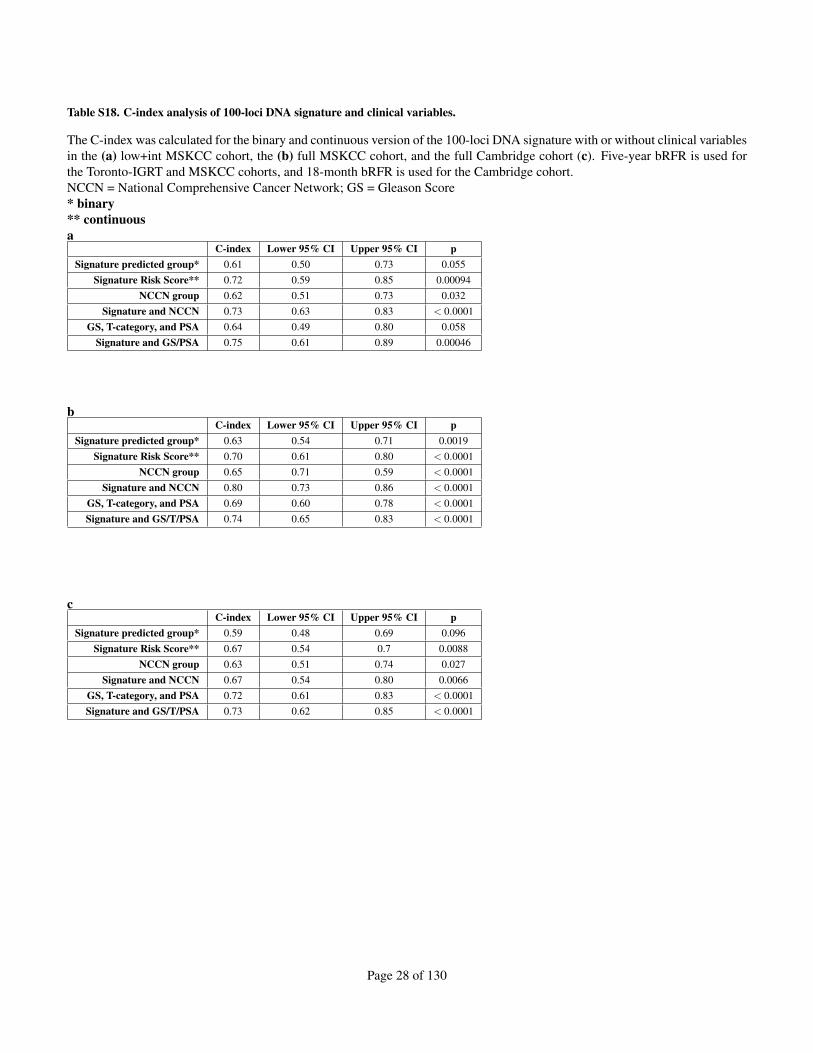
Table S18. C-index analysis of 100-loci DNA signature and clinical variables.
The C-index was calculated for the binary and continuous version of the 100-loci DNA signature with or without clinical variablesin the (a) low+int MSKCC cohort, the (b) full MSKCC cohort, and the full Cambridge cohort (c). Five-year bRFR is used forthe Toronto-IGRT and MSKCC cohorts, and 18-month bRFR is used for the Cambridge cohort.NCCN = National Comprehensive Cancer Network; GS = Gleason Score* binary** continuousa
C-index Lower 95% CI Upper 95% CI pSignature predicted group* 0.61 0.50 0.73 0.055
Signature Risk Score** 0.72 0.59 0.85 0.00094NCCN group 0.62 0.51 0.73 0.032
Signature and NCCN 0.73 0.63 0.83 < 0.0001GS, T-category, and PSA 0.64 0.49 0.80 0.058
Signature and GS/PSA 0.75 0.61 0.89 0.00046
bC-index Lower 95% CI Upper 95% CI p
Signature predicted group* 0.63 0.54 0.71 0.0019Signature Risk Score** 0.70 0.61 0.80 < 0.0001
NCCN group 0.65 0.71 0.59 < 0.0001Signature and NCCN 0.80 0.73 0.86 < 0.0001
GS, T-category, and PSA 0.69 0.60 0.78 < 0.0001Signature and GS/T/PSA 0.74 0.65 0.83 < 0.0001
cC-index Lower 95% CI Upper 95% CI p
Signature predicted group* 0.59 0.48 0.69 0.096Signature Risk Score** 0.67 0.54 0.7 0.0088
NCCN group 0.63 0.51 0.74 0.027Signature and NCCN 0.67 0.54 0.80 0.0066
GS, T-category, and PSA 0.72 0.61 0.83 < 0.0001Signature and GS/T/PSA 0.73 0.62 0.85 < 0.0001
Page 28 of 130

Table S19. Cox proportional hazard model for the CNA signature in the MSKCC cohort.
a: A multivariate Cox proportional hazard model was fit using the low-int MSKCC cohort, with the predicted random forestgroup as the main predictor of bRFR, and Gleason score as a clinical covariate. PSA is stratified at 10 ng/mL since it fails theproportional hazards assumption.
b: A multivariate Cox proportional hazard model was fit using the full MSKCC cohort, with the predicted random forestgroup as the main predictor of bRFR, and Gleason score, T category and PSA as clinical covariates. PSA is stratified at 10ng/mL since it fails the proportional hazardAZs assumption.
c: A second model was fit to the full MSKCC cohort with the addition of continuous PGA as the only change. Alikelihood-ratio test revealed that the model without PGA fits the data better (p = 0.054), supporting the exclusion of PGA in themultivariate Cox model.
aHR Lower 95% CI Upper 95% CI p-value
CNA Signature Risk Score 6.1 2.0 19 0.0015Gleason Score 7 vs. 6 3.3 1.1 9.8 0.029
bHR Lower 95% CI Upper 95% CI p-value
CNA Signature Risk Score 2.8 1.4 6.0 0.0060Gleason Score 7 vs. 5-6 2.6 1.1 6.4 0.033Gleason Score 8-9 vs. 5-6 4.2 1.6 11 0.0045T3 vs. T1-2 3.7 1.5 9.4 0.0047
cHR Lower 95% CI Upper 95% CI p-value
CNA Signature Risk Score 2.5 1.0 5.9 0.042Gleason Score 7 vs. 5-6 2.7 1.1 6.5 0.042Gleason Score 8-9 vs. 5-6 4.0 1.5 11 0.0073T3 vs. T1-2 3.9 1.6 9.9 0.0036PGA (continuous, for a 1.0 0.96 1.1 0.5510% increase in PGA)
Page 29 of 130

Table S20. Cox proportional hazard model for the CNA signature in the Cambridge cohort.
A multivariate Cox proportional hazard model was fit using the full Cambridge cohort, with the predicted random forest groupas the main predictor of 18-month bRFR, and Gleason score, T category and PSA as clinical covariates. PSA is stratified at 10ng/mL.
HR Lower 95% CI Upper 95% CI p-valueCNA Signature Risk Score 2.9 1.0 8.2 0.046Gleason Score 7 vs. 5-6 5.5 0.72 42 0.099Gleason Score 8-9 vs. 5-6 7.2 0.74 70 0.895T3 vs. T1-2 3.2 0.95 11 0.061
Page 30 of 130

Table S21. RNA signatures used in prognostic signature comparison.
Signatures are annotated by author, institution, and year. The number of genes in the signature is also indicated.
Author Year Institution Genes ReferenceSingh 2002 Harvard 29 Singh D, Febbo PG, Ross K, et al. Gene expression correlates of clinical prostate
cancer behavior. Cancer Cell 2002; 1(2):203-9.Singh 2002 Harvard 5 Singh D, Febbo PG, Ross K, et al. Gene expression correlates of clinical prostate
cancer behavior. Cancer Cell 2002; 1(2):203-9.Glinsky 2004 Sidney Kimmel Cancer Center 5 Glinsky GV, Glinskii AB, Stephenson AJ, et al. Gene expression profiling predicts
clinical outcome of prostate cancer. J Clin Invest 2004; 113(6):913-23.Glinsky 2004 Sidney Kimmel Cancer Center 4 Glinsky GV, Glinskii AB, Stephenson AJ, et al. Gene expression profiling predicts
clinical outcome of prostate cancer. J Clin Invest 2004; 113(6):913-23.Glinsky 2004 Sidney Kimmel Cancer Center 5 Glinsky GV, Glinskii AB, Stephenson AJ, et al. Gene expression profiling predicts
clinical outcome of prostate cancer. J Clin Invest 2004; 113(6):913-23.Glinsky 2005 MSKCC 11 Glinsky GV, Berezovska O and Glinskii AB. Microarray analysis identifies a death
-from-cancer signature predicting therapy failure in patients with multipletypes of cancer. J Clin Invest 2005; 115(6): 1503-21.
LaPointe 2004 Stanford/Hopkins 29 Lapointe J, Li, C, Higgins HP, et al. Gene expression profiling identifies clinicallyrelevant subtypes of prostate cancer. Proc Natl Acad Sci U S A 2004; 101(3): 811-6.
Varambally 2005 MSKCC/Univ. Michigan 23 Varambally S, Yu J, Laxman B, et al. Integrative genomic and proteomic analysis of prostatecancer reveals signature of metastatic progression. Cancer Cell 2005; 8(5): 393-406.
Stephenson 2005 MSKCC 10 Stephenson AJ, Smith A, Kattan MW, et al. Integration of gene expression profilingand clinical variables to predict prostate carcinoma recurrence after radical prostatectomy.
Cancer 2005; 104(2): 290-8.Bismar 2006 Dana Farber 12 Bismar TA, Demichellis F, Riva A, et al. Defining aggressive prostate cancer
using a 12-gene model. Neoplasia 2006; 8(1): 59-68.Bibikova 2007 UC San Diego 31 Bibikova M, Chudin E, Arsanjani A, et al. Expression signatures that is correlated
with Gleason score and relapse in prostate cancer. Genomics 2007; 89(6): 666-72.Ramaswamy 2003 Dana Farber and MIT 17 Ramaswarmy S, Ross KN, Lander ES, et al. A molecular signature of metastasis
in primary solid tumours. Nat Genet 2002; 33: 49-54.Saal 2007 Cold Spring Harbour 246 Saal LH, Johansson P, Holm K, et al. Poor prognosis in carcinoma is associated
with a gene expression signature of aberrant PTEN tumor suppressor pathwayactivity. Proc Natl Acad Sci U S A 2007; 104(18):7564-9.
Yu 2007 Univ. Michigan 87 Yu J, Yu J, Rhodes DR, et al. A polycomb repression signature in metastaticprostate cancer predicts cancer outcome. Cancer Res 2007; 67(22): 10657-63.
Yu 2007 Univ. Michigan 14 Yu J, Yu J, Rhodes DR, et al. A polycomb repression signature in metastaticprostate cancer predicts cancer outcome. Cancer Res 2007; 67(22): 10657-63.
Cuzick 2011 Scott and White/King’s College 157 Cuzick J, Swanson GP, Fisher G, et al. Prognostic value of an RNA expressionsignature derived from cell cycle proliferation genes in patients with prostate
cancer: a retrospective study. Lancet Oncol 2011; 12(3): 245-55.Genomic 2011 Genomic Health 17 Knezevic D, Goddard A, Natraj N, et al. Analytical validation of the OncotypeDXHealth prostate cancer assay - a clinical RT-PCR assay optimized for prostate needle
biopsies. BMC Genomics, 14(1), 690.(2013).Long 2010 Emory/Sunnybrook, CA 12 Long Q, Johnson BA, Osunkoya AO, et al. Protein-coding and microRNA biomarkers
of recurrence of prostate cancer following radical prostatectomy.Am J Pathol2011; 179(1): 46-54.
Talantov 2010 Garvin Institute, AUS 3 Talantov D, Jatkoe TA, Bohm M, et al. Gene based prediction of clinically localizedprostate cancer progression after radical prostatectomy. J Urology 2010; 184(4): 1521-8.
Wu 2013 Massachusetts General Hospital and 32 Wu CL, Schroeder BE, Ma XJ, et al. Development and validation of a 32-gene prognosticHarvard Medical School index for prostate cancer progression. Proc Natl Acad Sci U S A 2013; 110(15): 6121-6.
Irshad 2013 Columbia University Medical Center 3 Irshad S, Bansal M, Castillo-Martin M, et al. A molecular signature predictive ofindolent prostate cancer. Sci Transl Med 2013; 202 (5): 202ra122.
Irshad 2013 Columbia University Medical Center 19 Irshad S, Bansal M, Castillo-Martin M, et al. A molecular signature predictive ofindolent prostate cancer. Sci Transl Med 2013; 202 (5): 202ra122.
Agell 2012 Hospital del Mar-Mar Health Park 12 Agell L, Hernandez S, Nonell L, et al. A 12-gene expression signature is associatedBarcelona with aggressive histological in prostate cancer. Am J Pathol 2012; 181(5): 1585-1594.
Page 31 of 130
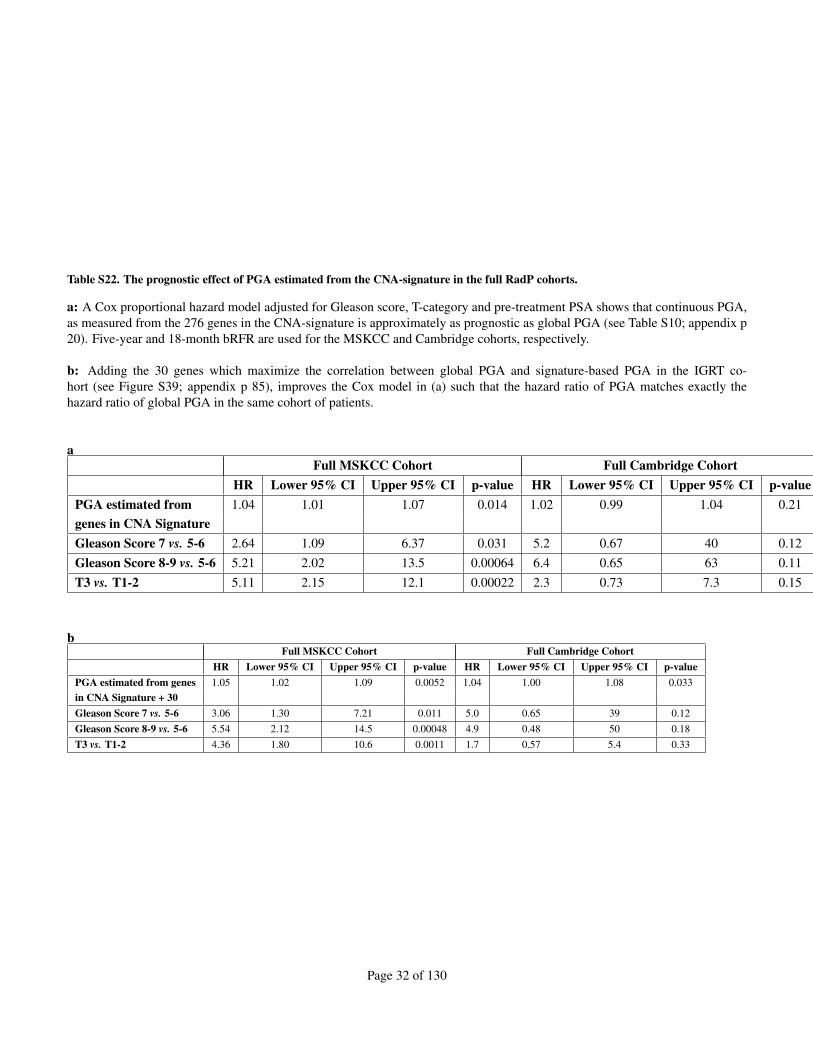
Table S22. The prognostic effect of PGA estimated from the CNA-signature in the full RadP cohorts.
a: A Cox proportional hazard model adjusted for Gleason score, T-category and pre-treatment PSA shows that continuous PGA,as measured from the 276 genes in the CNA-signature is approximately as prognostic as global PGA (see Table S10; appendix p20). Five-year and 18-month bRFR are used for the MSKCC and Cambridge cohorts, respectively.
b: Adding the 30 genes which maximize the correlation between global PGA and signature-based PGA in the IGRT co-hort (see Figure S39; appendix p 85), improves the Cox model in (a) such that the hazard ratio of PGA matches exactly thehazard ratio of global PGA in the same cohort of patients.
aFull MSKCC Cohort Full Cambridge Cohort
HR Lower 95% CI Upper 95% CI p-value HR Lower 95% CI Upper 95% CI p-valuePGA estimated from 1.04 1.01 1.07 0.014 1.02 0.99 1.04 0.21genes in CNA SignatureGleason Score 7 vs. 5-6 2.64 1.09 6.37 0.031 5.2 0.67 40 0.12Gleason Score 8-9 vs. 5-6 5.21 2.02 13.5 0.00064 6.4 0.65 63 0.11T3 vs. T1-2 5.11 2.15 12.1 0.00022 2.3 0.73 7.3 0.15
bFull MSKCC Cohort Full Cambridge Cohort
HR Lower 95% CI Upper 95% CI p-value HR Lower 95% CI Upper 95% CI p-valuePGA estimated from genes 1.05 1.02 1.09 0.0052 1.04 1.00 1.08 0.033in CNA Signature + 30Gleason Score 7 vs. 5-6 3.06 1.30 7.21 0.011 5.0 0.65 39 0.12Gleason Score 8-9 vs. 5-6 5.54 2.12 14.5 0.00048 4.9 0.48 50 0.18T3 vs. T1-2 4.36 1.80 10.6 0.0011 1.7 0.57 5.4 0.33
Page 32 of 130

Table S23. Five-year survival rates for patients grouped by various biomarkers.
Five-year biochemical relapse-free rates (bRFR) for various groups of patients based on the developed markers, except for theCambridge cohort where 18-month bRFR was used. For the Hypoxia-PGA values in the RadP cohorts, the median values of theBuffa, West, and Winter signatures are indicated.
IGRT MSKCC MSKCC Cambridge Full IGRT+MSKCC Pooled RadP Pooled RadP(%) Low-Int (%) Full (%) (18mo bRFR %) Full (%) Low-Int (%) Full (%)
Subtype-1 52 100 80 - 55 - -Subtype-2 47 75 59 - 52 - -Subtype-3 51 62 55 - 50 - -Subtype-4 90 89 80 - 84 - -
PGA ≥ 7.49 52 54 38 57 46 56 41PGA < 7.49 83 91 83 87 83 85 78
Hypoxia+ PGA+ 49 - 65 71 - 73 61Hypoxia+ PGA- 86 - 92 90 - 90 85Hypoxia- PGA+ 67 - 69 77 - 70 62Hypoxia- PGA- 93 - 83 92 - 89 78
Signature+ - 58 45 67 - 62 48Signature- - 90 81 86 - 85 77
Signature+ with PGA - 59 48 64 85 77Signature- with PGA - 90 80 86 59 48
Page 33 of 130

Page 34 of 130
Supplementary Figures

Page 35 of 130
c
Figure S1. Workflow of analyses and cohorts used throughout the manuscript. Overview of the
datasets used and the bioinformatic processing of the CNA data
a, The CNA data from the Toronto-IGRT training cohort were derived from pre-treatment biopsies (n =
126) and signatures were validated in the MSKCC cBioPortal database and Cambridge cohorts using
clinically-staged localized RadP specimen (n = 154 and n = 117, respectively), when appropriate. The
Toronto-IGRT cohort has biopsies that were spatially-matched to simultaneous hypoxia measurements for
each patient. In the RadP cohorts, we used three previously published RNA signatures for hypoxia14-16
.
b, We derived four novel treatment-independent signatures of outcome in clinically-staged localized CaP.
In general, prognostic indices were developed in the Toronto-IGRT cohort, and tested in the RadP cohorts
(MSKCC and Cambridge). Our four prognostic indices are: 1) four genomic subtypes discovered by
unsupervised clustering; 2) the percentage of the genome altered (PGA; see Supplementary Methods) as a
proxy for genomic instability; 3) a combined PGA-hypoxia index; and 4) a CNA gene signature developed
with a random forest (a supervised machine learning approach).
c, A guide indicating where tables and figures for each survival analysis in each cohort is located. Main
figures and tables are listed in red, and supplementary material in blue.
F = Figure; T = Table; S = Supplementary

Page 36 of 130
a
Toronto-IGRT cohort:
b
MSKCC low-int cohort:
c
MSKCC full cohort:

Page 37 of 130
d
Cambridge low-int cohort:
e
Cambridge full cohort:
f
MSKCC-Cambridge pooled low-int cohort:

Page 38 of 130
g
MSKCC-Cambridge pooled full cohort:
Figure S2. Prognostic impact of clinical variables within each cohort. Log-rank tests were used to
determine the prognostic impact of for Gleason score (left), T category (middle) and PSA (right) in the
a, Toronto-IGRT,
b, MSKCC low-int cohort,
c, MSKCC full cohort,
d, Cambridge low-int cohort
e, Cambridge full cohort
f, MSKCC-Cambridge pooled low-int cohort
g, MSKCC-Cambridge pooled full cohort

Page 39 of 130
a b
Figure S3. Comparison of biochemical recurrence and overall survival between cohorts. a, No difference in BCR rates between Toronto-IGRT, MSKCC low-int, and Cambridge low-int cohorts
(log-rank test)
b, No difference in overall survival rates between IGRT and MSKCC (all risk groups) cohort (log-rank
test). Information on overall survival is not available for the Cambridge cohort.

Page 40 of 130
a b
e
Gleason 6 patients Gleason 7 patients c d
Low-risk Intermediate-risk f

Page 41 of 130
g
Figure S4. Comparison of number of CNAs and number of genes in CNAs between the training
(Toronto- IGRT) and validation (MSKCC) cohorts. The differences in means are tested by the Student's
t-test, the differences in medians by the Mann-Whitney test, and the differences in standard deviation by the
F-test. For complete statistics, see also Table S3 (appendix p 13). All risk groups for the MSKCC cohort
are used unless stated otherwise.
a, Number of genes in regions of CNAs per patient per cohort.
b, Number of patients with a CNA in each gene, per cohort.
c, Number of genes in regions of CNAs per cohort in Gleason 6 patients.
d, Number of genes in regions of CNAs per cohort in Gleason 7 patients.
e, Number of genes in regions of CNAs per cohort in low-risk patients.
f, Number of genes in regions of CNAs per cohort in intermediate-risk patients.
g, Statistical summary of a-f; comparison of mean, median, and standard deviation (“stdev”) of genes in
CNAs per cohort, across different sub-groups. The dots represent the difference between the Toronto-IGRT
cohort and MSKCC cohort (Toronto - MSKCC). Background colour represents the significance level of
each test (Bonferroni-adjusted p-values).

Page 42 of 130
a b
Figure S5. The top 30 most recurrent cytoband regions involved in copy number aberrations in each
cohort. Cytobands are sorted by recurrence within each cohort. The chromosome of each region is
indicated by the coloured box after the gene name.
a, Toronto- IGRT training cohort.
b, MSKCC validation cohort

Page 43 of 130
Figure S6. Copy number profile of cohorts. The profiles are composed of the fraction of patients from
the cohort with a copy number aberration in each gene on chromosomes 1-22. Top panel labelled ‘All’
shows the two cohorts combined. Patients from all risk groups are used. The purple vertical lines indicate
key genes in regions recurrent CNAs.
CHD1 MAP3K7 NKX3-1 MYC PTEN CDKN1B RB1 CDH1 TP53 ERG

Page 44 of 130
Figure S7. Prognostic CNAs in patient biopsies. Biopsy-derived CNAs (loss, neutral or gain) in putative
prognostic genes for 126 low- and intermediate-risk CaP patients treated with IGRT (individual patients are
individual rows). There is no relationship between any single gene and PGA (see black bars on right). No
single gene is found in the majority of patients.

Page 45 of 130
a

Page 46 of 130
b
Figure S8. Genomic overview of Toronto-IGRT training cohort.
a, CNA profile of the Toronto-IGRT cohort showing prognostic clinical covariates. PGA is dichotomized at
the 7.49%, which is the upper tertile from the Toronto-IGRT cohort (see text). Each column represents a
gene, sorted according to chromosomal positions for chromosomes 1-22. Ward’s clustering with the
Jaccard distance metric was applied to cluster the rows (patients) with consensus clustering (see
Supplementary Methods).
b, Most recurrent genes involved in copy number aberrations per genomic Subtype based on the Toronto-
IGRT cohort only. The x-axis represents the fraction of the subtype which contains a CNA in each denoted
gene. The chromosome of each gene is indicated by the coloured box after the gene name.

Page 47 of 130
a
b
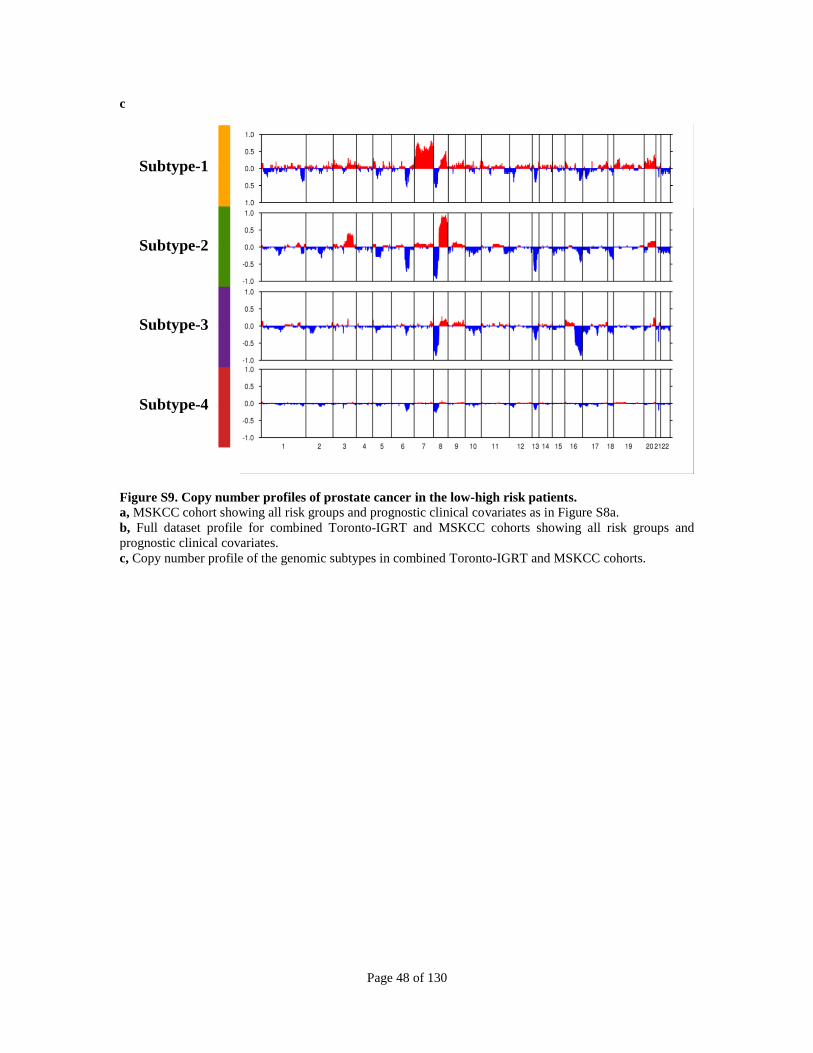
Page 48 of 130
c
Figure S9. Copy number profiles of prostate cancer in the low-high risk patients.
a, MSKCC cohort showing all risk groups and prognostic clinical covariates as in Figure S8a.
b, Full dataset profile for combined Toronto-IGRT and MSKCC cohorts showing all risk groups and
prognostic clinical covariates.
c, Copy number profile of the genomic subtypes in combined Toronto-IGRT and MSKCC cohorts.
Subtype-1
Subtype-2
Subtype-3
Subtype-4

Page 49 of 130
a b
Figure S10. Genoonly.
Figure S10. Genomic Subtypes are prognostic. Genomic subtypes have significantly different
biochemical relapse rates (log-rank test) when considering a) all patients from Toronto-IGRT and MSKCC,
including high-risk patients, b) low-int patients from Toronto-IGRT and MSKCC at 18-months, c) Toronto-
IGRT patients only, d) and, MSKCC patients only.
c d

Page 50 of 130
Figure S11. PGA comparison between patients with deletions of CHD1.
PGA differs significantly between patients with or without a deletion in CHD1, in both the Toronto-IGRT
and MSKCC cohorts. P values from two-sided Mann-Whitney-U tests. The grey line indicates the median
PGA value for the Toronto-IGRT cohort (3.84).

Page 51 of 130
a b
c
Figure S12. PGA operating point analysis.
a, PGA thresholds from 0% to 20% in 0.1% increments were tested for prognosis in all three cohorts. The
vertical lines indicate the median (3.84%) and upper tertile (7.49%) PGA values for the Toronto-IGRT
cohort. The horizontal line is HR = 1. Multivariate Cox proportional hazard models adjusting for Gleason
score and pre-treatment PSA were fit for each PGA threshold in each cohort separately. The low+int
MSKCC and Cambridge cohorts were used.
b, ROC analysis for low-int patients using each cohort alone, and the three cohorts pooled together.
c, ROC analysis for all patients using each cohort alone, and all three pooled together.

Page 52 of 130
a b
c d

Page 53 of 130
e f
g h
Figure S13. PGA is prognostic for general and early failure in the two independent RadP cohorts.
The following patient subgroups are stratified based on the upper tertile PGA value from the Toronto-IGRT
cohort:
a, MSKCC low- to intermediate-risk patients at 5 years
b, MSKCC low- to intermediate-risk at 18 months.
c, MSKCC low- to high-risk at 5 years
d, MSKCC low- to high-risk at 18 months
e, Cambridge low- to high-risk patients at 5 years
f, Cambridge low- to high-risk patients at 18 months
g, Low- to intermediate-risk RadP patients from both MSKCC and Cambridge at 18 months See main
Figure 3B for 5-year curve.
h, RadP patients from all risk groups from both MSKCC and Cambridge at 5 years. See main Figure 3C for
18-month curve.

Page 54 of 130
Figure S14. Classification of metastatic Toronto-IGRT and MSKCC patients by PGA. Toronto-IGRT
patients and MSKCC patients (all risk) that were censored prior to five years and without event are
removed (n = 100; n = 180 remaining). The PGA threshold used to classify metastatic patients was the
upper tertile from the Toronto-IGRT cohort (7.49%, see text), which is the same threshold used for bRFR
predictions. A two-sided Mann-Whitney-U test was used to calculate the difference in median PGA
between patients that did not (‘No’) or did (‘Yes’) develop metastasis by five years.

Page 55 of 130
Figure S15. PGA differs significantly between patients of each genomic Subtype. The cohorts (first
Toronto-IGRT followed by MSKCC) are ordered within each Subtype. P values are determined by
Kruskal-Wallis tests. The combined statistic refers to pooling the two cohorts together.

Page 56 of 130
a b
c d
Figure S16. Tumour hypoxia estimates based on the Buffa RNA signature in pooled RadP patients.
The gene signature was applied to the 108 MSKCC and 110 Cambridge RadP patients with mRNA and
CNA information (includes all risk groups).
No association was found between the hypoxia signature score and T-category (a), Gleason scores (b), or
pre-treatment PSA groups (c). P-values are based on Mann-Whitney U tests.
d, Patients are dichotomized by the median Hypoxia Signature Score of the 52 genes (see appendix p 6 for
details). Patients with scores above the median are considered positive (Signature +) for the hypoxic
signature.
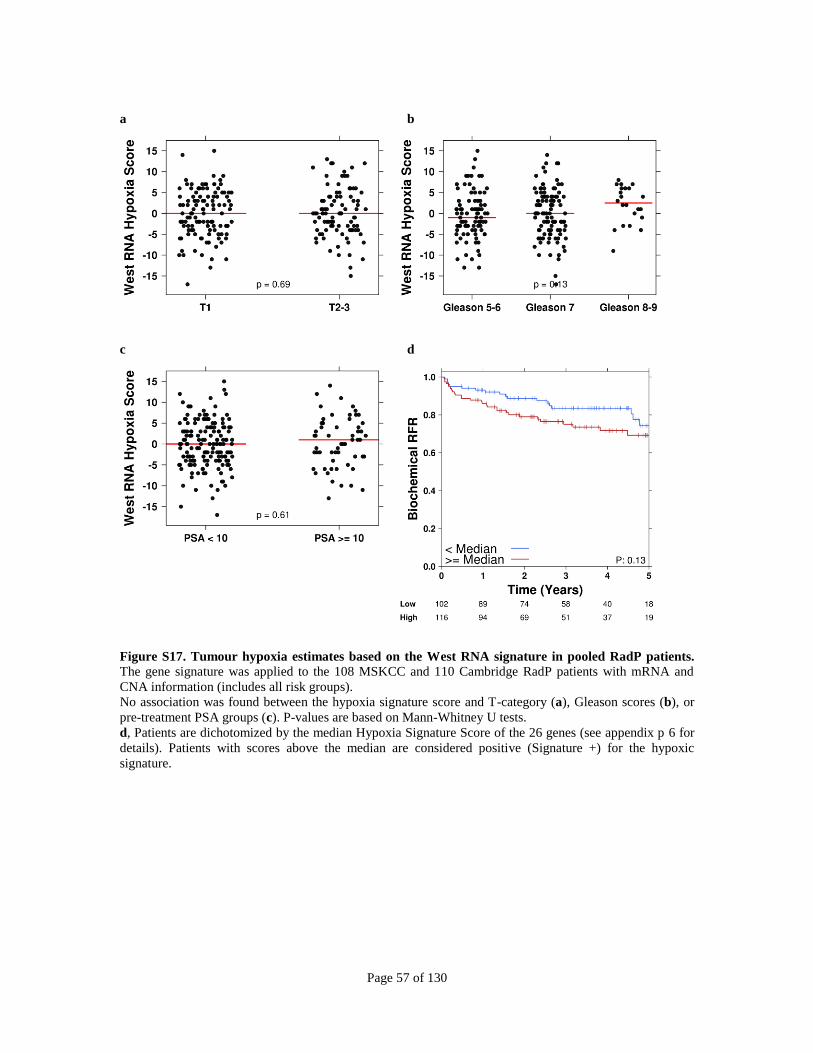
Page 57 of 130
a b
c d
Figure S17. Tumour hypoxia estimates based on the West RNA signature in pooled RadP patients.
The gene signature was applied to the 108 MSKCC and 110 Cambridge RadP patients with mRNA and
CNA information (includes all risk groups).
No association was found between the hypoxia signature score and T-category (a), Gleason scores (b), or
pre-treatment PSA groups (c). P-values are based on Mann-Whitney U tests.
d, Patients are dichotomized by the median Hypoxia Signature Score of the 26 genes (see appendix p 6 for
details). Patients with scores above the median are considered positive (Signature +) for the hypoxic
signature.

Page 58 of 130
a b
c d
Figure S18. Tumour hypoxia estimates based on the Winter RNA signature in pooled RadP patients.
The gene signature was applied to the 108 MSKCC and 110 Cambridge RadP patients with mRNA and
CNA information (includes all risk groups).
No association was found between the hypoxia signature score and T-category (a), Gleason scores (b), or
pre-treatment PSA groups (c). P-values are based on Mann-Whitney U tests.
d, Patients are dichotomized by the median Hypoxia Signature Score of the 99 genes (see appendix p 6 for
details). Patients with scores above the median are considered positive (Signature +) for the hypoxic
signature.
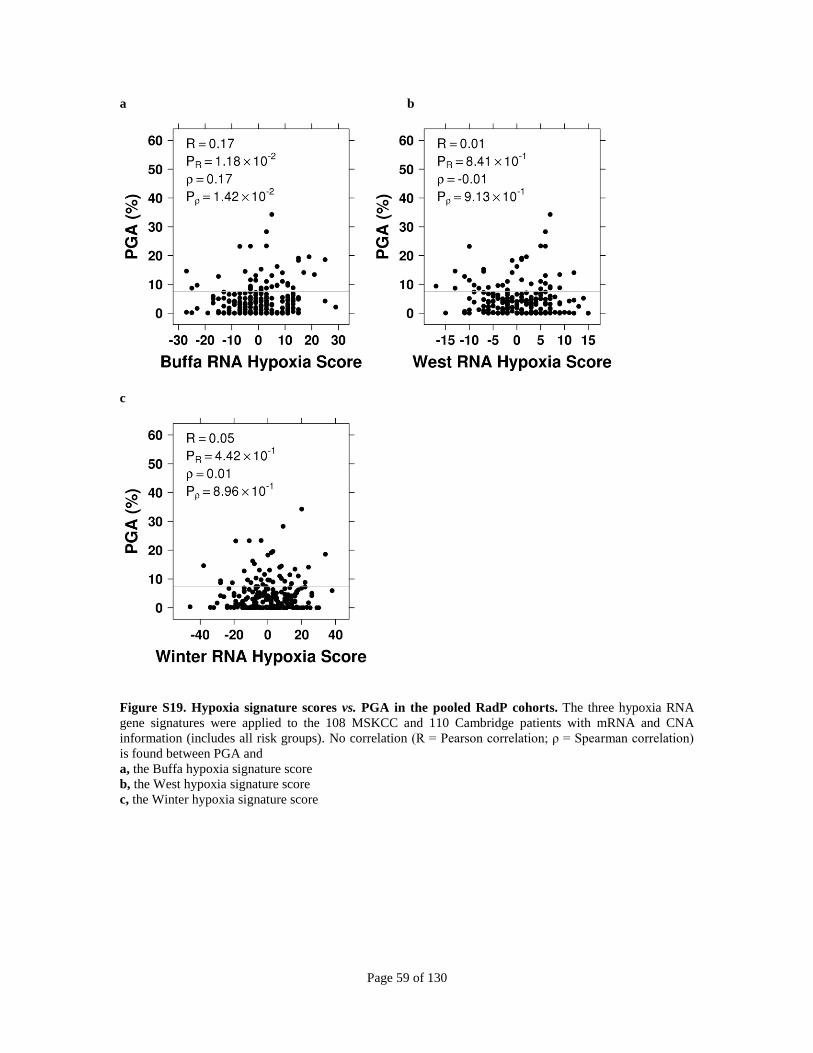
Page 59 of 130
a b
c
Figure S19. Hypoxia signature scores vs. PGA in the pooled RadP cohorts. The three hypoxia RNA
gene signatures were applied to the 108 MSKCC and 110 Cambridge patients with mRNA and CNA
information (includes all risk groups). No correlation (R = Pearson correlation; ρ = Spearman correlation)
is found between PGA and
a, the Buffa hypoxia signature score
b, the West hypoxia signature score
c, the Winter hypoxia signature score
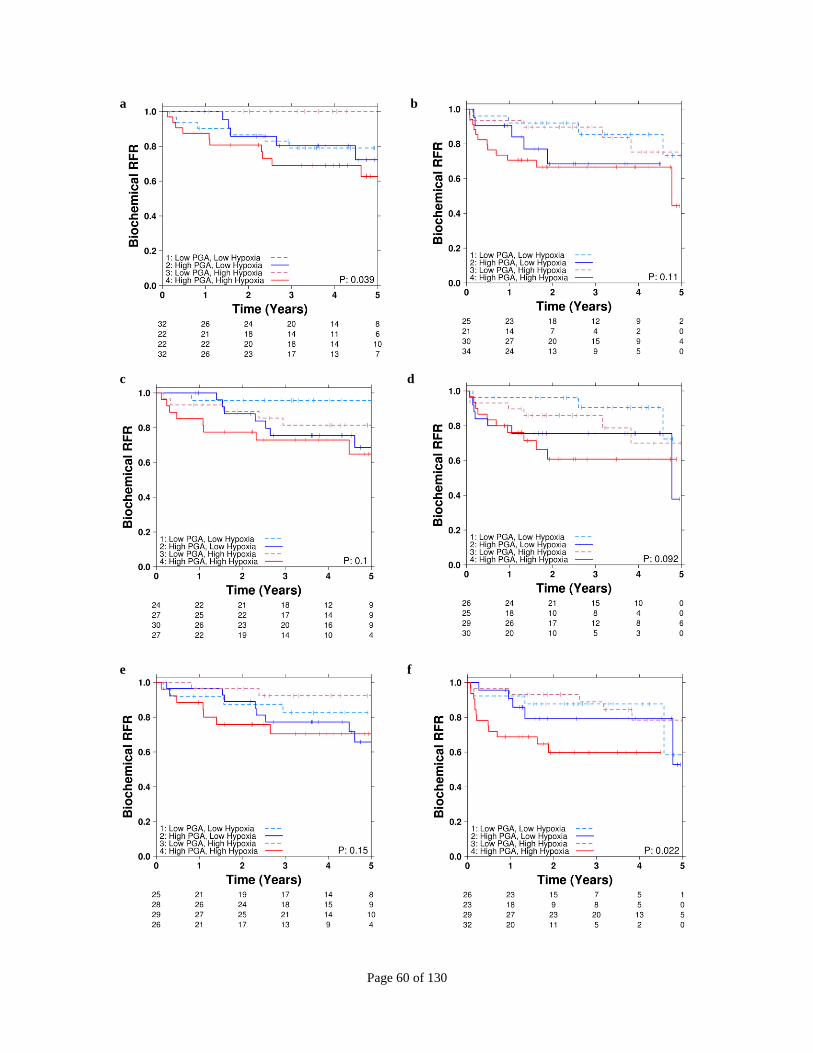
Page 60 of 130
a b
c d
e f

Page 61 of 130
Figure S20. The prognostic effect of PGA and hypoxia in the pooled RadP cohorts. a, The Buffa signature applied to the full MSKCC cohort
b, The Buffa signature applied to the full Cambridge cohort
c, The West signature applied to the full MSKCC cohort
d, The West signature applied to the full Cambridge cohort
e, The Winter signature applied to the full MSKCC cohort
f, The Winter signature applied to the full Cambridge cohort

Page 62 of 130
Figure S21. Direct intra-tumour hypoxia measurements in the IGRT cohort. Patients with high
hypoxia (i.e. HP20 greater than the median HP20) have moderately worse prognosis than patients with low
hypoxia.

Page 63 of 130
Figure S22. Genomic profile of patients ranked according to increasing hypoxia. The hypoxia metric,
HP20, is based on the percentage of oxygen measurements less than 20 mm Hg (appendix p 4) determined
from pre-treatment biopsies of the IGRT cohort (n=126). The median HP20 value was 81•3% with a range
of 0% to 100%. There is no correlation between our genomic subtypes and HP20 (p=0•70, Kruskal-Wallis
test).

Page 64 of 130
a
b
c

Page 65 of 130
d, e,
f,
Figure S23. Percentage of hypoxic measurements (HP20) as a function of clinical and genetic
variables. No association was found between HP20 and
a, T- category (T1 or T2); Mann-Whitney-U test, p = 0.83
b, Pre-treatment PSA (>10ng/mL or <10ng/mL); Mann-Whitney-U test, p = 0.29
c, Gleason score (6 or 7); Mann-Whitney-U test, p = 0.42
d, Genomic subtypes, Kruskal-Wallis test, p = 0.70
e, Individual genes; A Mann-Whitney-U test was applied to genes with at least one CNA, comparing the
median HP20 in patients with vs. without CNAs. No significant genes remained after multiple testing
correction (FDR).
f, Percent genome alteration (PGA). Both Pearson (R) and Spearman (ρ) correlations between PGA and
HP20 as continuous variables are shown.

Page 66 of 130

Page 67 of 130
Figure S24. Supervised learning approach to biomarker development. The IGRT cohort was used to
build the model. Genes were first ordered univariately according to their ability to model patient BCR
status. With a leave-one-out cross-validation (LOOCV) approach, 9 difference signature sizes (3, 5, 10, 50,
75, 100, 300, 500, and 1000) were trained and tested within the IGRT cohort. The signature size with the
best accuracy after cross-validation was selected. The top genes were then re-evaluated using the entire
IGRT cohort (i.e. no held out samples) and tested on the RadP cohorts (only MSKCC cohort is shown).

Page 68 of 130
a b
c d
Figure S25. Classification abilities of the 100-loci DNA signature (“RF”) or clinical variables in the
RadP cohorts. Area under the receiver operator curve (AUC) was calculated using the survivalROC
package to account for censored events. The p-values for the improvement of the CNA signature over other
classifiers were determined by 5,000 permutations of patient-score pairs for each variable and z-test
comparing the true difference in AUC to this distribution. The 100-loci signature was compared to standard
clinical variables in the following cohorts:
a, Low- to intermediate-risk MSKCC patients only. The bootstrap analysis shows that the CNA signature
has superior discrimination potential compared to NCCN (p=0.00036), pre-treatment PSA (p<0.0001,
biopsy-based Gleason score (p=0.00052), and T category (p=0.00021).
b, Low- to high-risk MSKCC patients only. Based on the bootstrap analysis, the CNA signature has
superior discrimination potential compared to NCCN (p=0.012), pre-treatment PSA (p=0.00038), biopsy-
based Gleason score (p=0.00027), and T category (p<0.0001).
c, Low- to high-risk Cambridge patients only. Based on the bootstrap analysis, there is no evidence that the
CNA signature has superior discrimination potential compared to NCCN (p=0.39), pre-treatment PSA
(p=0.18), biopsy-based Gleason score (p=0.79), and T category (p<0.41).
d, Low- to high-risk pooled RadP patients (MSKCC and Cambridge). Based on the bootstrap analysis, the

Page 69 of 130
CNA signature has superior discrimination potential compared to NCCN (p=0.051), pre-treatment PSA
(p=0.0061), biopsy-based Gleason score (p=0.0066), and T category (p=0.00093).

Page 70 of 130
a b
c
Figure S26. The 100-loci DNA signature is prognostic in two individual cohorts. The signature is
significantly associated with patient prognosis in a multivariate analysis including standard clinical risk
factors in the MSKCC low-int cohort at 5 years (a), in the MSKCC full cohort at 18 months (b), and in the
Cambridge full cohort at 18 months (c).

Page 71 of 130
Figure S27. The Signature Risk Score is associated with clinical variables. The Signature risk scores
from the pooled RadP cohorts varies significantly between patients with different Gleason scores and
different NCCN risk groups but not between patients with different clinical T-categories or pre-treatment
PSA values. Significance is based on two-sided Kruskal-Wallis tests.

Page 72 of 130
Figure S28. CNA-signature within Gleason score patient sub-groups. The CNA-signature is efficient at
stratifying RadP patients from both cohorts at risk of biochemical recurrence within 18-months when
considering only patients with a Gleason score less than 7, equal to 7, and greater than 7.

Page 73 of 130
Figure S29. CNA-signature within T-category patient sub-groups The CNA-signature is efficient at
stratifying RadP patients from both cohorts at risk of biochemical recurrence within 18-months when
considering only patients with a T status of T1 or T3, but not T2.

Page 74 of 130
Figure S30. CNA-signature within PSA patient sub-groups. The CNA-signature is efficient at
stratifying RadP patients from both cohorts at risk of biochemical recurrence within 18-months when
considering only patients with PSA concentration < 10ng/mL, but not between 10-20ng/mL or greater than
20ng/mL.

Page 75 of 130
Figure S31. CNA-signature at 18 months within each clinical risk group.
The CNA-signature is efficient at stratifying RadP patients from both cohorts at risk of biochemical
recurrence within 18-months when considering only patients with high-risk disease but not low- or
intermediate-risk.
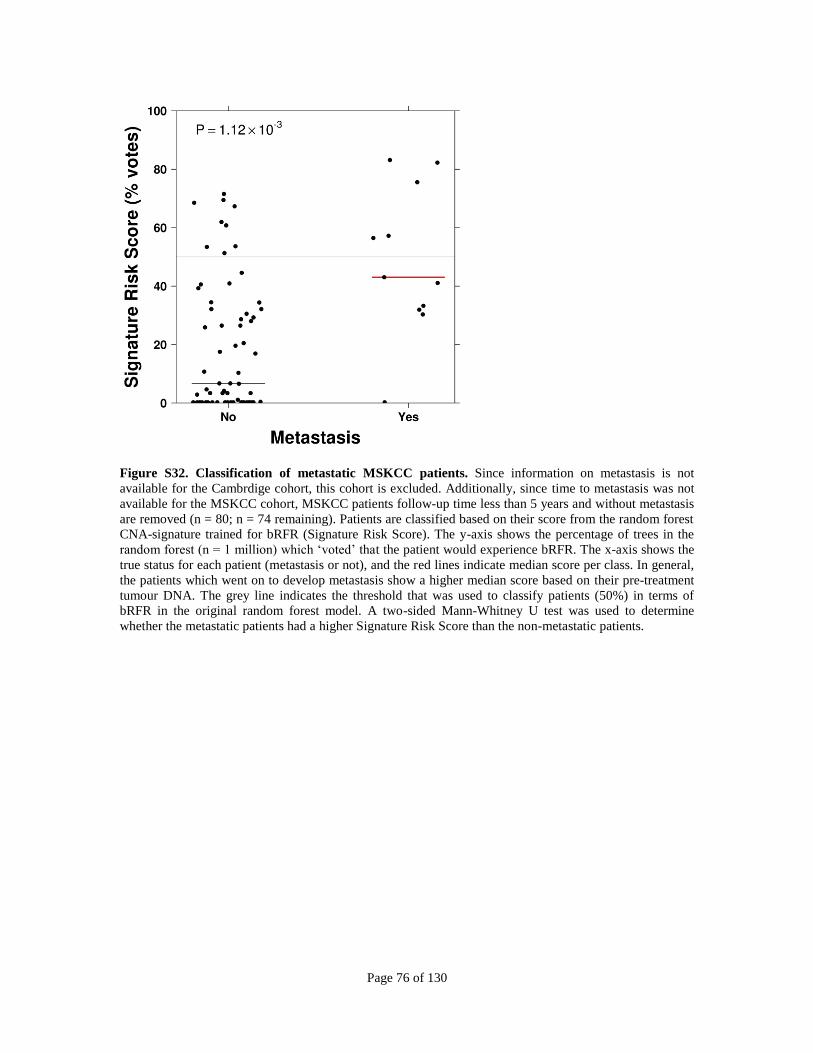
Page 76 of 130
Figure S32. Classification of metastatic MSKCC patients. Since information on metastasis is not
available for the Cambrdige cohort, this cohort is excluded. Additionally, since time to metastasis was not
available for the MSKCC cohort, MSKCC patients follow-up time less than 5 years and without metastasis
are removed (n = 80; n = 74 remaining). Patients are classified based on their score from the random forest
CNA-signature trained for bRFR (Signature Risk Score). The y-axis shows the percentage of trees in the
random forest (n = 1 million) which ‘voted’ that the patient would experience bRFR. The x-axis shows the
true status for each patient (metastasis or not), and the red lines indicate median score per class. In general,
the patients which went on to develop metastasis show a higher median score based on their pre-treatment
tumour DNA. The grey line indicates the threshold that was used to classify patients (50%) in terms of
bRFR in the original random forest model. A two-sided Mann-Whitney U test was used to determine
whether the metastatic patients had a higher Signature Risk Score than the non-metastatic patients.

Page 77 of 130
a b
Figure S33. Signature plurality analysis. Based on 1 million permutations with signatures of 100
randomly selected regions, our 100-loci DNA signature (indicated with the vertical black line) ranks in the
top 3% of tested signatures for the pooled RadP patients based on C-index (a) and AUC (b). Prognosis was
tested for 5-year biochemical recurrence.

Page 78 of 130
a b
Figure S34. Signature comparison to previously published RNA signatures for 18-month biochemical
recurrence-free survival. We compared the 18-month AUC of our signature (‘CNA_RF’) to 23 previously
published RNA signatures (see Supplementary Table S21, appendix p 31). Signatures are annotated by
author first name of the original publication, and where there are multiple signatures per paper, only the
best ranking signature is shown. We used the 108 MSKCC patients with both mRNA and CNA information
(all risk groups) in order to use a common validation cohort across all signatures. The clinical model is
based on clinical Gleason score, clinical tumour stage (T) and pre-treatment PSA. Our signature, trained on
126 low- to intermediate-risk patients, consistently ranks amongst the top signatures compared to:
a, the RNA signatures trained on 293 low- to intermediate-risk patients
b, the RNA signatures trained on 1299 low- to high-risk patients

Page 79 of 130
a
b
Figure S35. Low-recurrence genes are important for prognosis. Many genes in the CNA-signature have
low-recurrence
a, CNA recurrence of the top 30 genes in the CNA-signatures based on Gini score.
b, Patients with at least n (x-axis) genes involved in CNAs within the signature.

Page 80 of 130
Figure S36. Comparison of the CNA-signature to various known prognostic single CNA biomarkers. HRs are based on 5-year survival and are adjusted for Gleason score and PSA (stratified at 10ng/mL), and
are shown by the circles, with the extent of the horizontal lines illustrating the 95% confidence intervals.
Here, the MSKCC cohort was restricted to the low- and intermediate-risk patients only to match the clinical
distribution of the IGRT cohort. Our CNA signature outperforms known univariate prognostic CNA
markers in the MSKCC cohort. The Combined cohort refers to the Toronto-IGRT and low-int MSKCC
cohorts pooled together.

Page 81 of 130
Figure S37. Relative importance of the 100 signature loci. Higher importance scores (based on random
forest Gini scores) represent features (loci) that are better at distinguishing patients with vs. without
biochemical relapse, in the context of the model. Not all chromosomes were informative: only 14 of 22
chromosomes are represented in the signature (p < 0•0001, two-tailed chi-squared test).

Page 82 of 130
a
b
c

Page 83 of 130
Figure S38: Functional analysis of the CNA-signature. a, using 276 signature genes
b, repeated but excluding duplicate gene family members from a single CNA region. For example, in (a)
LIPF and LIPK are both included and in the same CNA/signature region, but in (b), only of them is
included. The signature genes were compared to all other genes used in the aCGH analyses (n = 17,603).
Background shading refers to p-value, and the yellow spots represent -fold enrichment of CNA-signature
genes in the pathway compared to chance.
c, The Signature Risk Score varies significantly across the four genomic subtypes in the full MSKCC
cohort (Kruskal-Wallis test). The red lines indicate the median score per subtype.
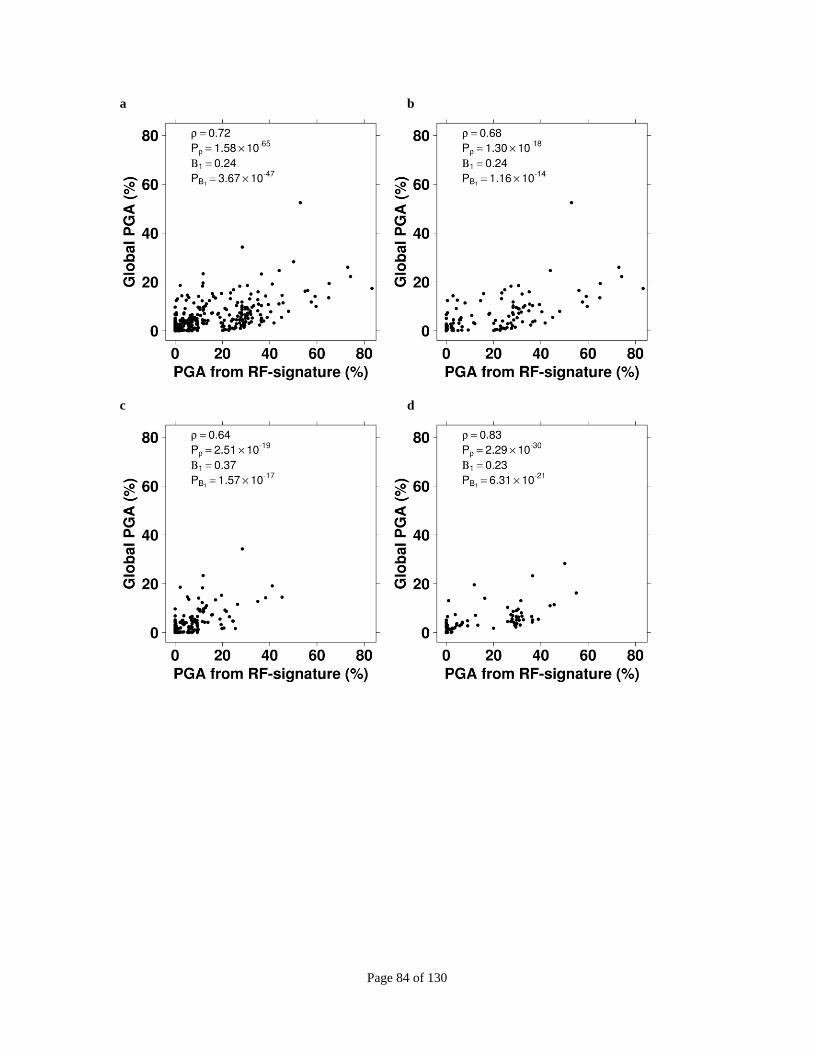
Page 84 of 130
a b
c d
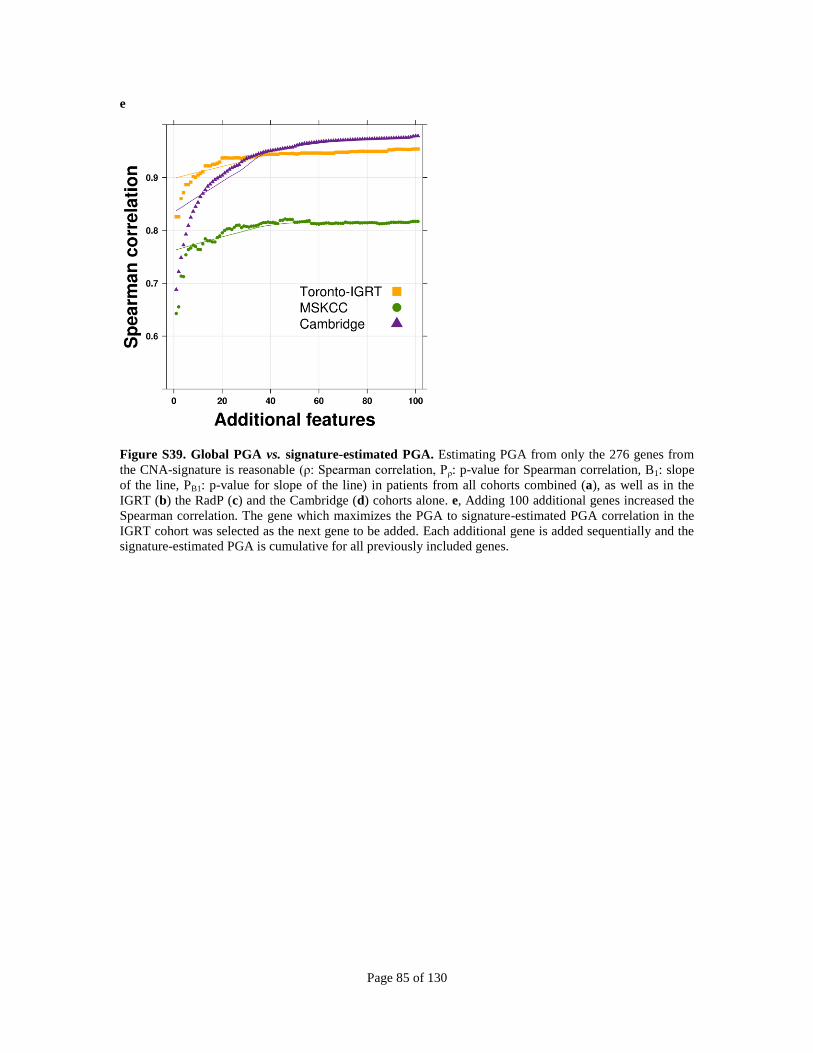
Page 85 of 130
e
Figure S39. Global PGA vs. signature-estimated PGA. Estimating PGA from only the 276 genes from
the CNA-signature is reasonable (ρ: Spearman correlation, Pρ: p-value for Spearman correlation, B1: slope
of the line, PB1: p-value for slope of the line) in patients from all cohorts combined (a), as well as in the
IGRT (b) the RadP (c) and the Cambridge (d) cohorts alone. e, Adding 100 additional genes increased the
Spearman correlation. The gene which maximizes the PGA to signature-estimated PGA correlation in the
IGRT cohort was selected as the next gene to be added. Each additional gene is added sequentially and the
signature-estimated PGA is cumulative for all previously included genes.
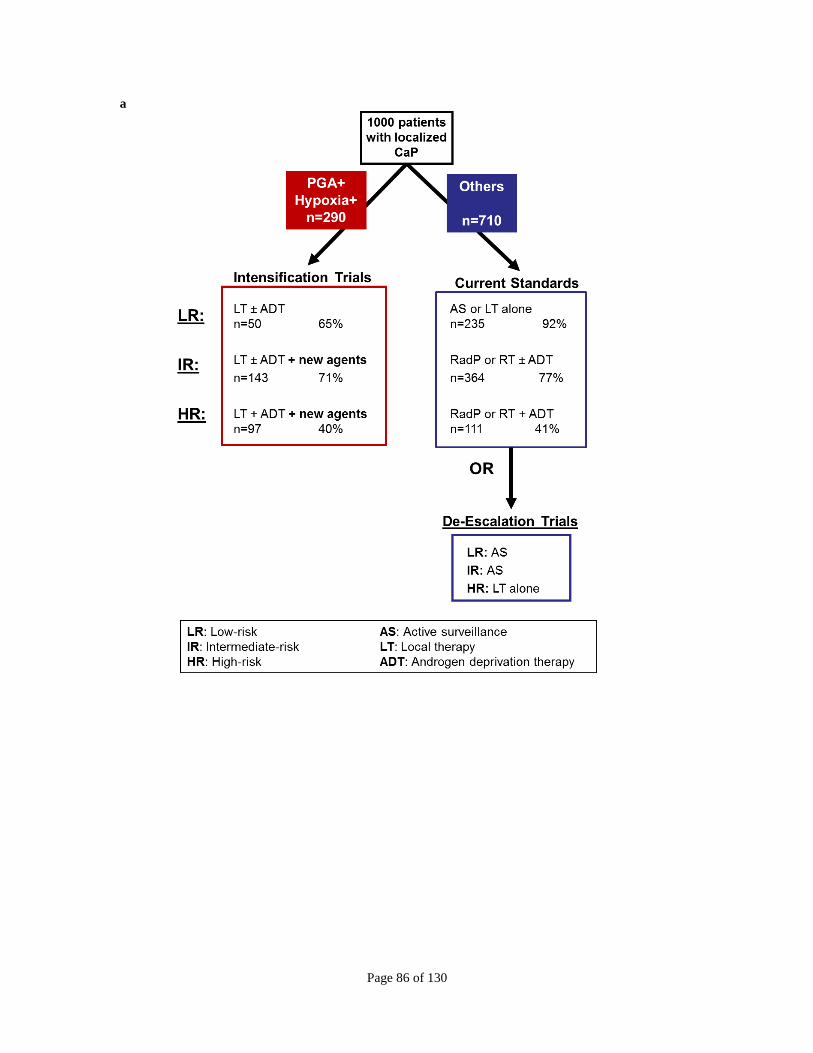
Page 86 of 130
a

Page 87 of 130
b
Figure S40. Example of clinical stratification of patients based on the PGA-Hypoxia index.
a, An overview of how clinical management could change for patients of all risk groups based on assessing
PGA and hypoxia status at the time of diagnosis. For each subgroup, the proposed treatment, the sample
size, and the 5-year bRFR rate is shown. Of 1000 patients, 360 patients would be placed into intensification
trials, and the remainder could opt for current protocols or be placed into treatment de-escalation trials. See
part b for a proposed clinical trial for low-int patients.
b, A proposed prospective randomized clinical trial of low-intermediate risk patients stratified by the PGA-
Hypoxia index. Patients will first be stratified by their PGA and Hypoxia status (“PGA+ Hypoxia+” vs. all
other combinations (“Others”)). The primary outcome is comparing PGA+ Hypoxia+ patients treated with
additional therapy (ADT and new agents, see below) to PGA+ Hypoxia+ patients treated with local therapy
alone (“Intensification Trial” arm). We are aiming for a HR 0.45 for the patients with additional treatment,
as ADT alone has a HR of 0.59.35,36
Two secondary outcomes will also be evaluated. First, we will assess
the efficacy of the signature by comparing Sig+ to Sig- patients treated with local therapy only. Based on
the pooled RadP cohorts of our study, we expect a HR of 3.4 for the PGA+ Hypoxia+ patients (or 0.29 for
the remaining patients; see Figure 4). Finally, in a separate single-arm de-escalation study, we will
determine whether patient without high PGA and high hypoxia can be effectively managed with active
surveillance. Generally at 5-years, 30% of patients with localized disease managed with active surveillance

Page 88 of 130
have progressed37
; here, we aim to decrease this percentage to 15% of patients. An alpha of 0.05 is used for
each of the primary and secondary analyses. Patients will be randomly distributed to each group; “Other”
patients have 67% chance of receiving active surveillance compared to local therapy, and PGA+Hypoxia+
patients have equal probability of receiving local therapy alone, or local therapy, ADT and new therapeutic
agents. Examples of new agents that could be tested in this trial include Enzalutamide, Abiraterone, PARP
inhibitors, and Metformin.
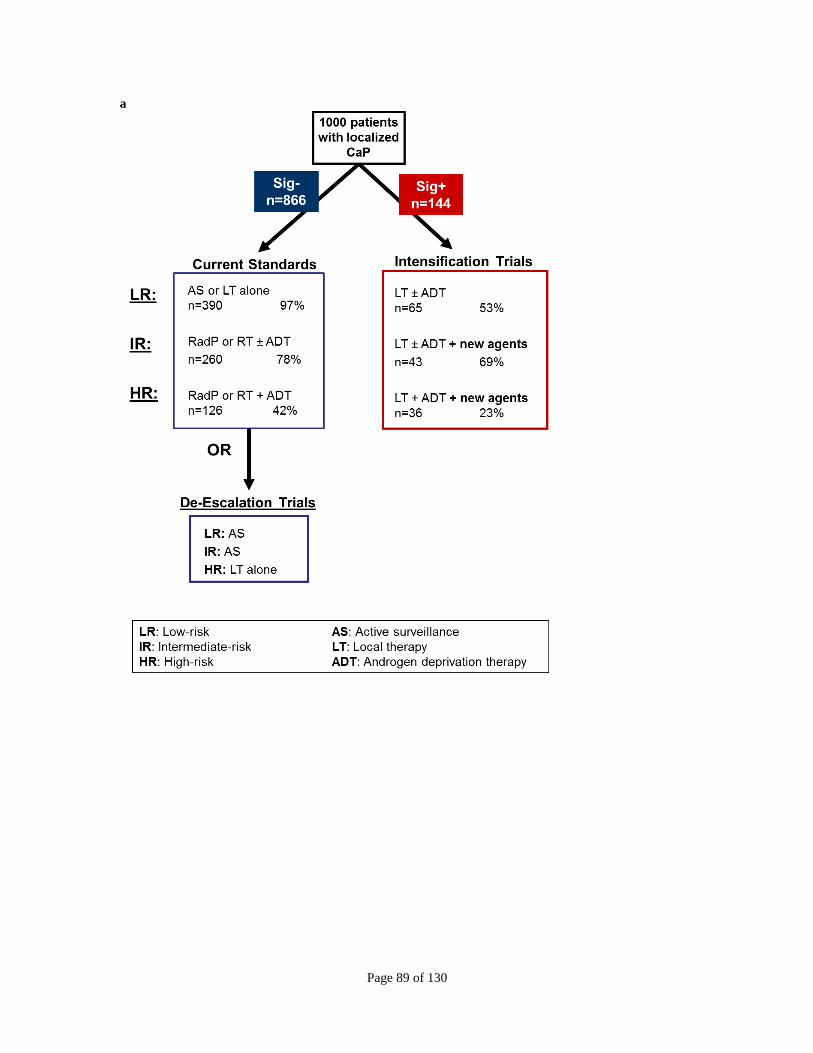
Page 89 of 130
a

Page 90 of 130
b
Figure S41. Example of clinical stratification of patients based on the 100-loci DNA signature.
a, An overview of how clinical management could change for patients of all risk groups based on the 100-
loci DNA signature. For each subgroup, the proposed treatment, the sample size, and the 5-year bRFR rate
is shown. Of 1000 patients, 144 patients would be placed into intensification trials, and the remainder could
opt for current protocols or be placed into treatment de-escalation trials. See part b for a proposed clinical
trial for low-int patients.
b, A proposed prospective randomized clinical trial of low-intermediate risk patients stratified by the 100-
loci DNA signature. Patients will first be stratified by the DNA signature (“Sig-” vs. “Sig+”). The primary
outcome is comparing Sig+ patients treated with additional therapy (ADT and new agents, see below) to
Sig+ patients treated with local therapy alone (“Intensification Trial” arm). We are aiming for a HR 0.45
for the patients with additional treatment, as ADT alone has a HR of 0.59.35,36
Two secondary outcomes
will also be evaluated. First, we will assess the efficacy of the signature by comparing Sig+ to Sig- patients
treated with local therapy only. Based on the pooled RadP cohorts of our study, we expect a HR of 2.72 for
the Sig+ patients (or 0.37 for the Sig- patients; see Figure 5). Finally, in a separate single-arm de-escalation
study, we will determine whether Sig- can be effectively managed with active surveillance. Generally at 5-
years, 30% of patients with localized disease managed with active surveillance have progressed37
; here, we
aim to decrease this percentage to 15% of patients. An alpha of 0.05 is used for each of the primary and
secondary analyses. Patients will be randomly distributed to each group; Sig- patients have 67% chance of

Page 91 of 130
receiving active surveillance compared to local therapy, and Sig+ patients have equal probability of
receiving local therapy alone, or local therapy, ADT and new therapeutic agents. Examples of new agents
that could be tested in this trial include Enzalutamide, Abiraterone, PARP inhibitors, statins, and Protein
Kinase C inhibitors.
References
1. Ishkanian AS, Mallof CA, Ho J, Meng A, Albert M, Syed A, et al. High-resolution array CGH identifies novel regionsof genomic alteration in intermediate-risk prostate cancer. Prostate 2009; 69: 1091-100.
2. Milosevic M, Warde P, Menard C, Chung P, Toi A, Ishkanian AS, et al. Tumor hypoxia predicts biochemical failure fol-lowing radiotherapy for clinically localized prostate cancer. Clin. Cancer Res. 2012; 18: 2108-14.
3. Locke JA, Zafarana G, Ishkanian AS, Milosevic M, Thoms J, Have CL, et al. NKX3.1 haploinsufficiency is prognosticfor prostate cancer relapse following surgery or image-guided radiotherapy. Clin. Cancer Res. 2012; 18: 308-16.
4. Khojasteh M, Lam WL, Ward RK, MacAulay C. A stepwise framework for the normalization of array CGH data. BMCBioinformatics 2005; 6: 274.
5. Shah SP, Xuan X, DeLeeuw RJ, Khojasteh M, Lam WL, Ng R, et al. Integrating copy number polymorphisms into arrayCGH analysis using a robust HMM. Bioinformatics 2006; 22: e431-9.
6. Dal Pra A, Lalonde E, Sykes J, Warde F, Ishkanian AS, Meng A, et al. TMPRSS2-ERG status is not prognostic follow-ing prostate cancer radiotherapy: Implications for fusion status and DSB repair. Clin. Cancer Res. 2013; 19: 5202-9.
7. Taylor BS, Schultz N, Hieronymus H, Gopalan A, Xiao Y, Carver BS, et al. Integrative genomic profiling of human prostatecancer. Cancer Cell 2010; 18: 11-22.
8. Cerami E, Gao J, Dosgrusoz U, Gross BE, Sumer SO, Aksoy BU, et al. The cBio Cancer Genomics Portal: An openplatform for exploring multidimensional cancer genomics data. Cancer Discov. 2012; 2: 401.
9. Mohler JL, Bahnson RR, Boston B, Busby JE, D’Amico AV, Eastham JA, et al. Prostate Cancer, Version 3.2012 FeaturedUpdates to the NCCN Guidelines. J Natl Compr Canc Netw 2012; 10: 1081-7.
10. Warren AY, Whitaker HC, Haynes B, Sangan T, McDuffus LA, Kay JD, et al. Method for sampling tissue for researchwhich preserves pathological data in radical prostatectomy. Prostate 2013; 73: 194-202.
11. Yau C, Mouradov D, Jorissen RN, Colella S, Ghazala M, Steers G, et al. A statistical approach for detecting genomicaberrations in heterogeneous tumor samples from single nucleotide polymorphism genotyping data. Genome Biol 2010; 11: R92.
12. Dunning MJ, Smith ML, Ritchie ME, Tavare S. et al. beadarray: R classes and methods for Illumina bead-based data.Bioinformatics 2007; 23: 2183-2184.
13. Johnson WE, Li C, Rabinovic A, Tavare S. Adjusting batch effects in microarray expression data using empirical Bayesmethods. Biostatistics 2007; 8: 118-127.
14. Eustace A, Mani N, Span PN, Joely JI, Taylor J, Betts GNJ, et al. A 26-gene hypoxia signature predicts benefit fromhypoxia-modifying therapy in laryngeal cancer but not bladder cancer. Clin. Cancer Res. 2013; 19: 4879-88.
15. Buffa FM, Harris AL, West CM, CJ Miller. Large meta-analysis of multiple cancers reveals a common, compact andhighly prognostic hypoxia metagene. Brit. J. Cancer 2010; 102: 428-35.
16. Winter SC, Buffa FM, Silva P, Crispin Miller, Valentine HR, Turley H, et al. Relation of a hypoxia metagene derivedfrom head and neck cancer to prognosis of multiple cancers. Cancer Res. 2007; 67: 3441-9.
17. Roach M, Hanks G, Thames HJ, Schellhammer P, Shipley WU, Sokol GH, et al. Defining biochemical failure follow-
Page 92 of 130

ing radiotherapy with or without hormonal therapy in men with clinically localized prostate cancer: recommendations of theRTOG-ASTRO Phoenix Consensus Conference. Int J Radiat Oncol Biol Phys 2006; 65: 965-74.
18. Mottet N, Bastian PJ, Bellmunt J, van den Bergh, RCN, Bolla M, van Casteren, NJ, et al.. Guidelines on prostate can-cer. Uroweb 2014. Available at:http://www.uroweb.org/gls/pdf/09%20Prostate%20Cancer_LRLV2.pdf. Accessed June 20 2014.
19. Buyyounouski MK, Pickles T, Kestin LL, Allison R, Williams SG. Validating the interval to biochemical failure for theidentification of potentially lethal prostate cancer. J Clin Oncol 2012; 30: 1857-63.
20. Benjamini Y, Hochberg Y. Controlling the false discovery rate: a practical and powerful approach to multiple testing. JRoy Stat Soc B 1995; 57: 289-300.
21. Monti S, Tamayo P, Mesirov J, Golub T. Consensus clustering: A resampling-based method for class discovery and vi-sualization of gene expression microarray data. Mach Learn 2003; 52: 91-118.
22. Jaccard P. Etude comparative de la distribution florale dans une portion des Alpes et des Jura. Bulletin de la Societe Vaudoisedes Sciences Naturelles 1901; 37: 547-79.
23. Breiman L. Random forest. Mach Learn 2001; 45: 5-32.
24. Boutros PC, Lau SK, Pintilie M, Shepherd FA, Der SD, Tsao MS, et al. Prognostic gene signatures for non-small-celllung cancer. Proc Natl Acad Sci U S A 2009; 106: 2824-8.
25. Starmans MHW, Fung G, Steck H, Wouters BG, Lambin P. A simple but highly effective approach to evaluate the prog-nostic performance of gene expression signatures. PLoS One 2011; 6: e28320.
26. Robin X, Turck N, Hainard A, Tiberti N, Lisacek F, Sanchez JC, et al. pROC: an open-source package for R and S+ toanalyze and compare ROC curves. BMC Bioinformatics 2011; 12: 77.
27. Heagerty PJ, Lumley T, Pepe MS. Time-dependent ROC curves for censored survival data and a diagnostic marker. Biomet-rics 2004; 56: 337-44.
28. Erho N, Crisan A, Vergara IA, Mitra AP, Ghadessi M, Buerki C, et al. Discovery and validation of a prostate cancergenomic classifier that predicts early metastasis following radical prostatectomy. PLoS One 2013; 8: e66855.
29. Karnes JR, Bergstralh EJ, Davicioni E, Ghadessi M, Buerki C, Mitra AP, et al. Validation of a genomic classifier thatpredicts metastasis following radical prostatectomy in an at risk patient population. J Urol 2013; 190: 2047-53.
30. Magi-Galluzzi C, Li J, Stephenson AJ, et al. Independent validation of a genomic classifier in an at risk population ofmen conservatively managed after radical prostatectomy. Presented at SUO Annual Meeting, Bethesda, 2013.
31. Den R, Feng FY, Showalter TN, et al. The Decipher prostate cancer classifier predicts biochemical failure in patientsfollowing post-operative radiation therapy. Presented at SUO Annual Meeting, Bethesda, 2013.
32. Boormans JL, Korsten H, Ziel-van der Made AJ, van Leenders GJ, de vos CV, Jenster G, et al. Identification of TDRD1 as adirect target gene of ERG in primary prostate cancer. Int J Cancer (2013); 133: 335-45.
33. Jhavar S, Brewer D, Edwards S, Kote-Jarai Z, Attard G, Clark J, et al. Integration of ERG gene mapping and gene-expressionprofiling identifies distinct categories of human prostate cancer. BJU Int 2009; 103: 1256-69.
Page 93 of 130

34. Piccolo SR, Withers MR, Francis OE, Bild AH, Johnson WE. Multiplatform single-sample estimates of transcriptionalactivation. Proc Natl Acad Sci U S A 2013; 110: 17778-83.
35. Zumsteg ZS, Spratt DE, Pei X, Yamada Y, Kalikstein A, Kuk D, et al. Short-term Androgen-Deprivation Therapy Im-proves Prostate Cancer-Specific Mortality in Intermediate-Risk Prostate Cancer Patients Undergoing Dose-Escalated ExternalBeam Radiation Therapy. International Journal of Radiation Oncology, Biology, Physics 2013; 85(4): 1012-7.
36. Jones CU, Hunt D, McGowan DG, Amin MB, Chetner MP, Bruner DW, et al. Radiotherapy and Short-Term AndrogenDeprivation for Localized Prostate Cancer. New Engl J Med 2011; 365(2): 107-18.
37. Klotz L, Zhang L, Lam A, Nam R, Mamedov A, Loblaw A. Clinical Results of Long-Term Follow-Up of a Large, Ac-tive Surveillance Cohort With Localized Prostate Cancer. J Clin Oncol 2010; 28(1): 126-31.
Page 94 of 130

Page 95 of 130
aCGH.id GS PSA TCat Gleason.1 Gleason.2 BREvent BRtime Event SurvTime
18488 7 10.60000038 T1c 4 3 0 28.03 Alive 2.3618489 7 14.80000019 T2a 3 4 1 103.23 Alive 8.8818490 7 10.5 T1c 3 4 0 47.8 Alive 7.0118491 7 7.300000191 T2a 3 4 0 9.73 Alive 0.8118493 6 7.699999809 T2a 3 3 1 22.9 Alive 5.6618494 6 7.699999809 T2c 3 3 0 41.82 Alive 6.5351633 6 7.300000191 T2b 3 3 1 52.44 Alive 4.3751635 7 5.900000095 T2a 3 4 0 140.42 Alive 11.751636 7 6.699999809 T2a 3 4 1 102.57 Alive 1051638 7 8 T2a 3 4 1 51.65 Alive 12.2268240 7 7.800000191 T2a 4 3 0 124.42 Alive 10.3768241 7 6.400000095 T2a 4 3 0 85.78 Alive 7.1575976 7 4.400000095 T2a 4 3 0 25.59 Dead 2.5775980 7 5.599999905 T2b 3 4 1 94.13 Alive 10.3976014 6 12.69999981 T2a 3 3 1 55.52 Alive 10.7576015 7 8.199999809 T2b 3 4 0 88.45 Alive 9.8776016 7 10 T2a 3 4 0 138.94 Alive 11.676018 7 13.60000038 T2b 4 3 1 22.11 Dead 776141 7 10.69999981 T1c 4 3 1 4.86 Alive 9.676143 7 10.5 T2a 3 4 1 81.09 Alive 6.7676144 7 17.79999924 T2a 4 3 1 92.03 Alive 11.276145 7 9 T1c 3 4 0 80.82 Alive 4.6676146 7 6.099999905 T1c 3 4 0 136.77 Alive 11.4480327 7 2.099999905 T2a 4 3 0 90.38 Alive 7.5480329 7 13.39999962 T1c 3 4 1 33.31 Dead 6.87
103015 7 8.199999809 T2a 3 4 0 36.11 Alive 3.01103016 7 9.300000191 T2a 4 3 1 92.06 Alive 9.39103136 7 4.699999809 T2a 4 3 0 50.43 Alive 4.24103139 7 1.600000024 T1c 4 3 0 108.72 Alive 9.08103140 7 5.599999905 T2b 4 3 1 80.66 Alive 8.05103142 7 6 T2b 3 4 0 11.47 Dead 0.96103391 6 5.099999905 T2b 3 3 1 55.62 Alive 10.65103393 6 10.69999981 T2a 3 3 1 105.5 Alive 9.6103394 6 13.10000038 T1c 3 3 1 36.53 Alive 9.04103395 7 17.29999924 T1c 4 3 1 17.02 Dead 1.91103398 7 16.70000076 T1c 3 4 1 20.17 Alive 6.42103399 7 7.800000191 T2b 3 4 1 48.76 Alive 6.63112774 7 8.600000382 T2a 4 3 0 56.9 Alive 4.86112775 7 7.199999809 T1c 3 4 0 112.79 Alive 8.88113116 7 8.800000191 T2a 3 4 0 105.27 Alive 8.8113117 6 8.100000382 T2a 3 3 0 57.76 Dead 4.81113118 6 9.399999619 T1c 3 3 1 45.57 Alive 8.82113119 7 5.599999905 T2a 3 4 1 51.19 Alive 9.34113121 7 5.400000095 T2a 3 4 0 106.38 Alive 8.37113126 6 8.899999619 T2a 3 3 0 17.58 Alive 1.46113127 6 4.199999809 T1c 3 3 0 75.27 Alive 6.27113129 7 8.399999619 T1c 3 4 1 51.81 Alive 8.95113130 6 2.700000048 T2a 3 3 0 104.54 Alive 8.74113131 7 9.300000191 T2a 3 4 0 106.02 Alive 8.86113141 7 5.199999809 T2a 3 4 0 99.52 Alive 8.32

Page 96 of 130
113144 6 4.900000095 T2a 3 3 1 51.68 Alive 9.02113145 7 3.799999952 T2b 4 3 1 14.09 Alive 2.06113256 7 4.099999905 T2a 3 4 0 120.45 Alive 10.04113257 6 5.699999809 T1c 3 3 0 112.76 Alive 9.42113258 7 7.5 T2a 3 4 0 111.77 Alive 9.32113259 7 2.700000048 T2a 3 4 0 96 Alive 8.53113260 7 7.300000191 T2a 3 4 1 90.88 Alive 9.47113271 7 12.69999981 T2b 3 4 1 74.55 Alive 9.3113272 7 10.19999981 T2b 3 4 1 98.7 Alive 9.54113273 7 5.800000191 T2a 4 3 0 84.63 Alive 7.07113274 6 6.300000191 T1c 3 3 0 92.06 Alive 7.67113275 6 7 T2b 3 3 1 100.77 Alive 9.43118052 7 8.699999809 T1c 3 4 0 89.5 Alive 7.47118056 7 7.699999809 T2b 3 4 0 103.1 Alive 8.6118095 7 5.099999905 T1c 4 3 0 87.3 Alive 7.29118096 7 13 T1c 4 3 0 81.61 Alive 6.8118097 7 8.100000382 T1c 3 4 0 75.5 Alive 6.31118099 6 4.699999809 T2a 3 3 1 70.97 Alive 6.57118232 6 0.899999976 T1c 3 3 0 39.82 Alive 0.94118233 7 5.800000191 T1c 4 3 0 81.09 Alive 6.77118234 6 3.5 T1c 3 3 0 21.78 Alive 1.84118235 7 7.800000191 T1c 3 4 0 36.37 Alive 4.36118237 7 3.299999952 T2b 3 4 1 51.48 Alive 7.35118251 7 14.10000038 T2b 4 3 1 53.13 Alive 6.59118281 6 11.19999981 T1c 3 3 1 105.53 Alive 6.75118481 7 3.799999952 T2a 3 4 0 84.24 Alive 7.04118482 7 8.600000382 T2c 3 4 1 45.08 Alive 7.85118484 6 7.199999809 T2a 3 3 0 93.41 Alive 7.8118485 7 10 T2a 4 3 1 59.11 Alive 7.89118486 6 4.5 T2a 3 3 1 61.5 Alive 8.51118935 6 8 T2a 3 3 1 64.53 Alive 7.21118937 7 18.70000076 T2b 4 3 1 4.07 Alive 3.92118938 7 13.19999981 T2c 3 4 1 77.57 Alive 7.04118939 7 7.199999809 T1c 3 4 0 47.08 Alive 4.27118940 7 13 T2c 3 4 0 47.15 Alive 5.15122303 7 2.099999905 T2a 3 4 0 112.43 Alive 9.42122307 7 7.5 T1c 3 4 1 44.29 Alive 5.72122309 7 5.400000095 T2a 3 4 0 70.24 Alive 5.89122310 7 6.099999905 T2a 3 4 0 117.32 Alive 9.79122311 7 5 T1c 3 4 0 27.66 Alive 2.31122312 7 13.80000019 T2a 3 4 0 114.63 Alive 9.59122313 7 19 T2a 3 4 1 33.51 Alive 6.26122315 7 10.30000019 T1c 3 4 1 31.54 Alive 5.82122316 7 5.300000191 T2a 3 4 0 69.03 Alive 5.85122317 6 7.800000191 T2a 3 3 0 19.35 Alive 5.17122318 7 9.800000191 T2b 4 3 0 53.88 Dead 4.49122319 7 5.099999905 T1c 4 3 0 75.93 Alive 6.38122320 7 7.699999809 T1c 4 3 0 74.84 Alive 6.25122321 6 7.800000191 T2b 3 3 0 65.22 Dead 5.62122322 6 8 T1c 3 3 0 74.09 Alive 6.21122323 6 13.60000038 T2b 3 3 0 123.11 Alive 10.27

Page 97 of 130
122403 7 9 T1c 3 4 0 115.42 Alive 9.64122405 7 10 T1c 3 4 0 100.4 Alive 8.37122408 7 6.300000191 T2a 3 4 1 47.38 Alive 11.53122410 7 8.399999619 T2b 4 3 0 76.06 Alive 6.34122494 7 12.39999962 T2a 3 4 0 15.31 Alive 1.28122497 7 16.40999985 T2B 3 4 1 103.33 Alive 11.62122498 7 11.39999962 T1c 3 4 1 69.98 Alive 11.12122499 7 3.400000095 T1c 3 4 1 72.15 Dead 8.53122651 7 4.900000095 T1c 4 3 0 85.98 Dead 5.99122652 6 8 T1c 3 3 1 67.29 Alive 10.57122653 7 11.89999962 T2a 3 4 1 102.51 Dead 8.96122655 7 11.39999962 T2a 3 4 0 88.05 Dead 7.34122657 6 16 T1c 3 3 1 103.72 Alive 12.05122659 7 4 T2a 3 4 1 127.18 Alive 11.76122661 7 12.89999962 T2a 4 3 1 13.73 Alive 3.78122663 7 10 T2b 3 4 0 133.88 Alive 11.17122664 7 5.300000191 T2a 3 4 0 77.7 Alive 5.19122665 7 8.029999733 T1C 3 4 1 42.19 Alive 7.31122667 6 6.900000095 T1c 3 3 0 44.35 Alive 3.72136642 7 4.300000191 T2a 3 4 0 78 Alive 6.52136643 7 6.099999905 T1c 3 4 1 72.35 Alive 12.14136645 7 9.699999809 T1b 4 3 1 77.18 Alive 9.43136646 6 13.69999981 T1c 3 3 0 105.56 Alive 8.84136650 7 10.39999962 T1c 4 3 1 37.62 Alive 6.86136801 7 6.800000191 T2a 4 3 0 70.51 Alive 8.49
Page 98 of 130
LNMet BoneMet OtherMets age HP20 cluster erg_aCGH
Not applicable Not applicable Not applicable 58.75 0.9167 2 0Not applicable Not applicable Not applicable 68.92 0.7619 4 0Not applicable Not applicable Not applicable 82.56 0.3214 3 1Not applicable Not applicable Not applicable 75.27 0.7381 3 0Not applicable Not applicable Not applicable 79.02 0.9524 2 0Not applicable Not applicable Not applicable 75.2 0.869 3 0Not applicable Not applicable Not applicable 68.07 0.9286 1 0Not applicable Not applicable Not applicable 67.34 1 4 1Not applicable Not applicable Not applicable 74.78 0.2857 2 1Not applicable No Not applicable 77.35 1 3 0Not applicable Not applicable Not applicable 70.3 0.9762 3 1Not applicable Not applicable Not applicable 72.55 0.7143 4 0Not applicable Not applicable Not applicable 70.95 0.8333 4 0Not applicable Not applicable Not applicable 75.54 0.2619 4 0Not applicable Not applicable Not applicable 76.63 0.0682 4 0Not applicable Not applicable Not applicable 74.7 0.9286 4 1Not applicable Not applicable Not applicable 70.44 0.9286 4 1Yes Yes Not applicable 75.29 0.9762 1 0Yes Yes Yes 73.76 0.9762 3 0Not applicable Not applicable Not applicable 60.61 0.881 4 1Not applicable Not applicable Not applicable 75.05 0.5476 4 0Not applicable Not applicable Not applicable 71.74 0.5946 4 0Not applicable Not applicable Not applicable 67.85 0.7857 4 0Not applicable Not applicable Not applicable 76.65 0.9286 4 0Yes Yes Yes 57.31 0.6923 2 0Not applicable Not applicable Not applicable 68.94 0.5 2 0No Indeterminate Not applicable 67.18 1 4 0No Not applicable Not applicable 57.63 0.8571 4 0Not applicable Not applicable Not applicable 63.42 0 4 0Not applicable No Not applicable 64.12 0.9762 4 0Not applicable Not applicable Not applicable 74.88 0.9048 2 0Not applicable Not applicable Not applicable 74.3 0.1212 3 1Not applicable Not applicable Not applicable 60.43 0.7857 4 1No No Not applicable 73.79 0.9524 4 0Not applicable Yes Not applicable 69.39 0.8571 2 1Yes No Not applicable 75.94 0.7778 4 0Not applicable Not applicable Not applicable 73.93 0.6905 3 1Not applicable Not applicable Not applicable 69.5 0.7143 1 0Not applicable Not applicable Not applicable 63.52 0.631 3 0Not applicable Not applicable Not applicable 70.67 0.7529 3 1Not applicable Not applicable Not applicable 69.54 0.5333 4 0Not applicable Not applicable Not applicable 72.82 0.7262 3 0Not applicable Not applicable Not applicable 69.96 0.6905 4 0Not applicable Not applicable Not applicable 71.3 0.9167 4 0Not applicable Not applicable Not applicable 66.96 0.369 1 0Not applicable Not applicable Not applicable 69.85 0.6429 4 1Not applicable Not applicable Not applicable 65.89 0.869 1 0Not applicable Not applicable Not applicable 65.24 0.7831 3 0Not applicable Not applicable Not applicable 75.66 0.5952 4 0Not applicable Not applicable Not applicable 60.72 0.8621 4 0

Page 99 of 130
No No No 69.75 0.25 2 0Not applicable Not applicable Not applicable 69.02 0.8313 3 0Not applicable Not applicable Not applicable 70.8 0.9615 4 0Not applicable Not applicable Not applicable 70.09 0.7381 4 0Not applicable Not applicable Not applicable 74.62 0.881 4 0Not applicable Not applicable Not applicable 61.63 0.35 4 0Yes No Not applicable 71.38 0 4 0Yes Yes Not applicable 61.47 1 4 0No No No 73.11 0.6667 4 0Not applicable Not applicable Not applicable 70.75 0.8571 4 0Not applicable Not applicable Not applicable 70.41 0.7738 4 0Not applicable Not applicable Not applicable 70.78 0.9524 4 0Not applicable Not applicable Not applicable 69.83 0.7976 3 1Not applicable Not applicable Not applicable 69.4 0.1905 4 1Not applicable Not applicable Not applicable 56.77 0.9643 4 0No No Not applicable 72.41 0.75 1 0Not applicable Not applicable Not applicable 67.8 0.9048 1 0Not applicable Not applicable Not applicable 74.35 0.9405 1 0Not applicable Not applicable Not applicable 74.78 0.7024 4 1Not applicable Not applicable Not applicable 61.54 0.1071 4 0Not applicable Not applicable Not applicable 71.23 0.8929 3 0No Not applicable Not applicable 71.87 0.9762 2 0Yes No Not applicable 60.96 1 4 0Not applicable Not applicable Not applicable 76.45 0.9643 1 1Not applicable Not applicable Not applicable 77.59 0.3452 4 0Not applicable Not applicable Not applicable 68.61 0.9762 2 0Yes No Not applicable 73.82 0.4133 1 0Not applicable Not applicable Not applicable 72.05 0.8929 2 0No No Not applicable 71.77 0.2976 2 0Not applicable Not applicable Not applicable 75.18 0.4048 4 0Not applicable Not applicable Not applicable 75.33 0.5595 4 0No Yes Not applicable 73.67 0.8333 3 0Not applicable Not applicable Not applicable 71.92 1 4 0Not applicable Not applicable Not applicable 77.63 0.7976 1 0Not applicable Not applicable Not applicable 66.26 0.9167 1 1Not applicable Not applicable Not applicable 81.25 1 1 0Not applicable Not applicable Not applicable 80.65 0.9286 1 0Not applicable Not applicable Not applicable 72.49 0.5714 4 1Not applicable Not applicable No 69.95 0.7381 4 1Not applicable Not applicable Not applicable 74.67 0.631 4 0Not applicable Not applicable Not applicable 55.43 0.9773 4 0Not applicable Not applicable Not applicable 65.26 0.6905 2 0No No Not applicable 71.58 1 3 0Not applicable Not applicable Not applicable 75.93 0.75 4 0Not applicable Not applicable Not applicable 80.49 0.7381 3 0Not applicable Not applicable Not applicable 76.03 0.119 4 1Not applicable Not applicable Not applicable 79.41 0.75 4 0Not applicable Not applicable Not applicable 75.78 0.7262 4 0Not applicable Not applicable Not applicable 70.41 0.8333 4 0Not applicable Not applicable Not applicable 66.86 0.9365 2 0Not applicable Not applicable Not applicable 63.71 0.4762 4 0

Page 100 of 130
Not applicable Not applicable Not applicable 71.46 0.7143 4 0Not applicable Not applicable Not applicable 70.29 0.381 4 1No Indeterminate Suspicious 74.15 0.9286 4 0No Not applicable Not applicable 73.54 0.9524 4 0Not applicable Not applicable Not applicable 76.96 0.9286 4 0Not applicable Not applicable Not applicable 77.58 NA 3 0Not applicable Not applicable Not applicable 65.9 0.2286 4 0Inconclusive Not applicable Not applicable 63.81 0.6905 4 0Not applicable Not applicable Not applicable 77.94 0.9048 4 0Not applicable Not applicable Not applicable 73.06 0.8571 4 0No Not applicable Not applicable 76.14 0.9762 4 1Not applicable Not applicable Not applicable 63.45 0.3571 2 0No Not applicable Not applicable 70.84 0.9762 4 0Not applicable Not applicable Not applicable 68.53 0.6667 1 1No Yes Yes 74.06 0.8293 2 0Not applicable Not applicable Not applicable 61.96 0.9048 4 0Not applicable Not applicable Not applicable 72.42 0.8889 4 0No No Not applicable 65.34 NA 2 1Not applicable Not applicable Not applicable 79.53 0.9524 4 0Not applicable Not applicable Not applicable 75.92 0.631 2 0Not applicable Not applicable Not applicable 71.15 0.9286 4 1Not applicable Not applicable Not applicable 75.74 0.7143 3 1Not applicable Not applicable Not applicable 75.12 1 4 0Not applicable Not applicable Not applicable 82.29 0.9762 4 0Not applicable Not applicable Not applicable 74 1 4 0

Page 101 of 130
Collapsed feature Frequency of a CNA in:Symbol EntrezID Chromosome Start End in CNA-signature Subtype-1 Subtype-2 Subtype-3 Subtype-4
GFRA2 2675 8 21549529 21646346 1 0.5 0.885 0.871 0.26
CLDN23 137075 8 8559665 8561617 2 0.4 0.846 0.742 0.202MFHAS1 9258 8 8641998 8751131 2 0.4 0.846 0.742 0.202ERI1 90459 8 8860313 8890849 2 0.4 0.846 0.742 0.202ANKRD22 118932 10 90579658 90611732 3 0.15 0.192 0.258 0.104STAMBPL1 57559 10 90640025 90683244 4 0.15 0.192 0.258 0.098ACTA2 59 10 90694830 90751147 4 0.15 0.192 0.258 0.098FAS 355 10 90750287 90775542 4 0.15 0.192 0.258 0.098RNLS 55328 10 90033620 90343082 5 0.15 0.192 0.258 0.116FAM19A5 25817 22 48972117 49147744 6 0.3 0.154 0.258 0.029SLC6A19 340024 5 1201709 1225230 7 0.4 0.115 0.226 0.023SLC6A18 348932 5 1225469 1246304 7 0.4 0.115 0.226 0.023TERT 7015 5 1253286 1295162 7 0.4 0.115 0.226 0.023CLPTM1L 81037 5 1317999 1345002 8 0.4 0.115 0.226 0.029SLC6A3 6531 5 1392904 1445543 9 0.4 0.115 0.226 0.023NKD2 85409 5 1009167 1038925 10 0.4 0.115 0.226 0.029SLC12A7 10723 5 1050488 1112172 10 0.4 0.115 0.226 0.029TBC1D22A 25771 22 47158517 47571342 11 0.3 0.154 0.226 0.029PPP1R3B 79660 8 8993763 9009152 12 0.4 0.846 0.742 0.208ZDHHC11 79844 5 795719 851101 13 0.4 0.154 0.194 0.029BRD9 65980 5 863849 892939 13 0.4 0.154 0.194 0.029TRIP13 9319 5 892968 918164 14 0.4 0.154 0.226 0.035PRAGMIN 157285 8 8175257 8239257 15 0.35 0.846 0.742 0.202SPAG11B 10407 8 7305275 7321192 16 0.35 0.577 0.419 0.121DEFB104A 140596 8 7327829 7698764 16 0.35 0.577 0.419 0.121DEFB104B 503618 8 7327829 7698764 16 0.35 0.577 0.419 0.121DEFB106A 245909 8 7340025 7686575 16 0.35 0.577 0.419 0.121DEFB106B 503841 8 7340025 7686575 16 0.35 0.577 0.419 0.121DEFB105A 245908 8 7345242 7681360 16 0.35 0.577 0.419 0.121DEFB105B 504180 8 7345242 7681360 16 0.35 0.577 0.419 0.121DEFB107A 245910 8 7353367 7673238 16 0.35 0.577 0.419 0.121DEFB107B 503614 8 7353367 7673238 16 0.35 0.577 0.419 0.121SPAG11A 653423 8 7705401 7721319 16 0.35 0.577 0.419 0.121DEFB4 1673 8 7752198 7754237 16 0.35 0.577 0.419 0.121PDCD6 10016 5 271735 315089 17 0.4 0.154 0.226 0.046

Page 102 of 130
AHRR 57491 5 304290 438405 17 0.4 0.154 0.226 0.046C5orf55 116349 5 441642 443258 17 0.4 0.154 0.226 0.046EXOC3 11336 5 443333 467409 18 0.4 0.154 0.226 0.064SLC9A3 6550 5 473333 524549 19 0.4 0.154 0.226 0.046CEP72 55722 5 612404 653666 20 0.4 0.154 0.194 0.035TPPP 11076 5 659976 693510 20 0.4 0.154 0.194 0.035TUBGCP3 10426 13 113139327 113242481 21 0.35 0.192 0.194 0.04C8orf79 57604 8 12869772 12887284 22 0.45 0.731 0.677 0.173LONRF1 91694 8 12579405 12612992 23 0.35 0.769 0.645 0.185LIPJ 142910 10 90346518 90366733 24 0.15 0.192 0.258 0.098LIPF 8513 10 90424145 90438572 24 0.15 0.192 0.258 0.098LIPK 643414 10 90484300 90512513 24 0.15 0.192 0.258 0.098LIPN 643418 10 90521162 90537999 24 0.15 0.192 0.258 0.098CH25H 9023 10 90965693 90967071 25 0.15 0.192 0.258 0.092ZBED4 9889 22 50247496 50283726 26 0.2 0.154 0.194 0.017BRD1 23774 22 50166936 50218452 27 0.25 0.154 0.194 0.017ALG12 79087 22 50296853 50312106 28 0.2 0.154 0.161 0.017CRELD2 79174 22 50312282 50321186 28 0.2 0.154 0.161 0.017PIM3 415116 22 50354142 50357720 28 0.2 0.154 0.161 0.017IL17REL 400935 22 50432941 50451055 28 0.2 0.154 0.161 0.017MLC1 23209 22 50497819 50523781 28 0.2 0.154 0.161 0.017TNKS 8658 8 9413444 9639856 29 0.4 0.846 0.742 0.202LSM14B 149986 20 60697516 60710434 30 0.4 0.269 0.194 0.035PSMA7 5688 20 60711790 60718474 30 0.4 0.269 0.194 0.035SS18L1 26039 20 60718821 60757566 30 0.4 0.269 0.194 0.035GTPBP5 26164 20 60758080 60777810 30 0.4 0.269 0.194 0.035PTPRT 11122 20 40701391 41818557 31 0.2 0.192 0.097 0.017ANKRD10 55608 13 111530886 111567416 32 0.2 0.192 0.097 0.023MGMT 4255 10 131265453 131565783 33 0.3 0.077 0.258 0.035EBF3 253738 10 131633495 131762091 33 0.3 0.077 0.258 0.035GLRX3 10539 10 131934638 131978646 33 0.3 0.077 0.258 0.035CTSB 1508 8 11700033 11725646 34 0.4 0.846 0.677 0.202DEFB137 613210 8 11831445 11832108 34 0.4 0.846 0.677 0.202DEFB136 613209 8 11839829 11842099 34 0.4 0.846 0.677 0.202DEFB134 613211 8 11851488 11853760 34 0.4 0.846 0.677 0.202PREX1 57580 20 47240792 47444420 35 0.2 0.231 0.065 0.006LOC389257 389257 5 191625 195468 36 0.35 0.154 0.226 0.04

Page 103 of 130
CCDC127 133957 5 204874 218297 36 0.35 0.154 0.226 0.04SDHA 6389 5 218355 256814 36 0.35 0.154 0.226 0.04C13orf35 400165 13 113301357 113338811 37 0.35 0.192 0.194 0.046ATP11A 23250 13 113344642 113541482 37 0.35 0.192 0.194 0.046MCF2L 23263 13 113656027 113754053 37 0.35 0.192 0.194 0.046GLT8D4 727936 3 72937384 73024522 38 0.1 0.115 0.097 0.116SSPO 23145 7 149473130 149531053 39 0.75 0.115 0.065 0.017DEFB103A 55894 8 7286415 7740180 40 0.35 0.577 0.419 0.133DEFB103B 414325 8 7286490 7740105 40 0.35 0.577 0.419 0.133BECN1 8678 17 40962149 40976310 41 0.15 0.077 0.065 0.023PSME3 10197 17 40985422 40995777 41 0.15 0.077 0.065 0.023AOC2 314 17 40996608 41002724 41 0.15 0.077 0.065 0.023AOC3 8639 17 41003200 41010140 41 0.15 0.077 0.065 0.023G6PC 2538 17 41052814 41065386 41 0.15 0.077 0.065 0.023ZNF862 643641 7 149535508 149564568 42 0.8 0.115 0.065 0.017ATP6V0E2 155066 7 149570056 149577787 43 0.55 0.038 0.065 0.012CHRNA6 8973 8 42607779 42623929 44 0.35 0.462 0.419 0.087DNAH2 146754 17 7623038 7737058 45 0.35 0.077 0.226 0.075KDM6B 23135 17 7743234 7758118 45 0.35 0.077 0.226 0.075TMEM88 92162 17 7758383 7759417 45 0.35 0.077 0.226 0.075LSMD1 84316 17 7760002 7761172 45 0.35 0.077 0.226 0.075CYB5D1 124637 17 7761063 7765600 45 0.35 0.077 0.226 0.075CHD3 1107 17 7792168 7816075 45 0.35 0.077 0.226 0.075KCNAB3 9196 17 7826026 7832753 45 0.35 0.077 0.226 0.075TRAPPC1 58485 17 7833662 7835267 45 0.35 0.077 0.226 0.075CNTROB 116840 17 7835441 7853237 45 0.35 0.077 0.226 0.075GUCY2D 3000 17 7905987 7923658 46 0.35 0.077 0.194 0.075ALOX15B 247 17 7942357 7952451 47 0.3 0.077 0.194 0.081ALOX12B 242 17 7975953 7991021 48 0.25 0.077 0.194 0.075ALOXE3 59344 17 7999217 8021860 49 0.25 0.077 0.194 0.069HES7 84667 17 8023907 8027410 49 0.25 0.077 0.194 0.069PER1 5187 17 8043787 8055753 49 0.25 0.077 0.194 0.069VAMP2 6844 17 8062464 8066293 49 0.25 0.077 0.194 0.069TMEM107 84314 17 8076296 8079714 49 0.25 0.077 0.194 0.069C17orf59 54785 17 8091650 8093564 49 0.25 0.077 0.194 0.069AURKB 9212 17 8108048 8113883 49 0.25 0.077 0.194 0.069C17orf68 80169 17 8128138 8151413 49 0.25 0.077 0.194 0.069

Page 104 of 130
PFAS 5198 17 8152595 8173809 50 0.25 0.077 0.161 0.064SLC25A35 399512 17 8191081 8198170 50 0.25 0.077 0.161 0.064RANGRF 29098 17 8191968 8193409 50 0.25 0.077 0.161 0.064C8orf40 114926 8 42396938 42408140 51 0.35 0.538 0.419 0.087POLB 5423 8 42195972 42229331 52 0.35 0.577 0.452 0.11DKK4 27121 8 42231585 42234674 52 0.35 0.577 0.452 0.11VDAC3 7419 8 42249278 42263455 53 0.35 0.577 0.452 0.104SLC20A2 6575 8 42273992 42397068 53 0.35 0.577 0.452 0.104AP3M2 10947 8 42010463 42028701 54 0.4 0.577 0.484 0.116PLAT 5327 8 42032235 42065194 54 0.4 0.577 0.484 0.116LOC153328 153328 5 135170364 135224326 55 0.25 0.231 0.065 0.023IL9 3578 5 135227934 135231516 55 0.25 0.231 0.065 0.023FBXL21 26223 5 135266005 135277367 55 0.25 0.231 0.065 0.023LECT2 3950 5 135282599 135290723 55 0.25 0.231 0.065 0.023MTMR9 66036 8 11141999 11185654 56 0.4 0.846 0.677 0.22AMAC1L2 83650 8 11188494 11189695 56 0.4 0.846 0.677 0.22HTR3A 3359 11 113845796 113861034 57 0.25 0.231 0.129 0.04ZBTB16 7704 11 113930430 114121397 57 0.25 0.231 0.129 0.04NNMT 4837 11 114166534 114183238 57 0.25 0.231 0.129 0.04C11orf71 54494 11 114262169 114271139 57 0.25 0.231 0.129 0.04RBM7 10179 11 114271383 114279635 57 0.25 0.231 0.129 0.04REXO2 25996 11 114310107 114321000 57 0.25 0.231 0.129 0.04FAM55A 120400 11 114392436 114430580 57 0.25 0.231 0.129 0.04FAM55D 54827 11 114441312 114466484 57 0.25 0.231 0.129 0.04PSG11 5680 19 43511808 43530631 58 0.15 0.077 0.097 0.017PSG2 5670 19 43568361 43586893 58 0.15 0.077 0.097 0.017BUD13 84811 11 116618885 116643714 59 0.2 0.269 0.065 0.029ZNF259 8882 11 116649275 116658739 59 0.2 0.269 0.065 0.029APOA5 116519 11 116660085 116663136 59 0.2 0.269 0.065 0.029APOA4 337 11 116691417 116694011 59 0.2 0.269 0.065 0.029APOC3 345 11 116700623 116703787 59 0.2 0.269 0.065 0.029APOA1 335 11 116706468 116708338 59 0.2 0.269 0.065 0.029KIAA0999 23387 11 116714117 116968993 60 0.2 0.269 0.065 0.035PAFAH1B2 5049 11 117014999 117047131 60 0.2 0.269 0.065 0.035SIDT2 51092 11 117049938 117068161 60 0.2 0.269 0.065 0.035TAGLN 6876 11 117070039 117075508 60 0.2 0.269 0.065 0.035PCSK7 9159 11 117075787 117102811 60 0.2 0.269 0.065 0.035

Page 105 of 130
RNF214 257160 11 117103451 117156404 60 0.2 0.269 0.065 0.035BACE1 23621 11 117156401 117166386 60 0.2 0.269 0.065 0.035CEP164 22897 11 117198570 117283982 60 0.2 0.269 0.065 0.035DSCAML1 57453 11 117298488 117667976 60 0.2 0.269 0.065 0.035FXYD2 486 11 117690789 117698807 60 0.2 0.269 0.065 0.035FXYD6 53826 11 117707690 117747746 61 0.2 0.269 0.065 0.035GATA4 2626 8 11561716 11617509 62 0.4 0.846 0.677 0.208NEIL2 252969 8 11627171 11644854 62 0.4 0.846 0.677 0.208FDFT1 2222 8 11660189 11696818 62 0.4 0.846 0.677 0.208ZNF618 114991 9 116638561 116818875 63 0.15 0.115 0.129 0.017AMBP 259 9 116822407 116840752 63 0.15 0.115 0.129 0.017KIF12 113220 9 116853917 116861337 63 0.15 0.115 0.129 0.017COL27A1 85301 9 116918230 117072975 63 0.15 0.115 0.129 0.017ZNF334 55713 20 45129706 45142194 64 0.2 0.231 0.032 0.006SLC13A3 64849 20 45186461 45280100 64 0.2 0.231 0.032 0.006TP53RK 112858 20 45313003 45318276 64 0.2 0.231 0.032 0.006SLC2A10 81031 20 45338278 45364985 64 0.2 0.231 0.032 0.006EYA2 2139 20 45523262 45817492 64 0.2 0.231 0.032 0.006ZMYND8 23613 20 45838380 45985474 64 0.2 0.231 0.032 0.006NCOA3 8202 20 46130600 46285621 65 0.2 0.231 0.032 0.012SULF2 55959 20 46286149 46415360 66 0.2 0.231 0.032 0.006MAFB 9935 20 39314516 39317876 67 0.2 0.192 0.065 0.012RP11-631M21.2 347688 10 92827 95178 68 0.1 0.115 0.129 0.012ZMYND11 10771 10 181423 300577 69 0.1 0.115 0.129 0.029DIP2C 22982 10 320129 735608 70 0.1 0.154 0.129 0.035LARP5 23185 10 855483 931702 71 0.1 0.115 0.129 0.029GTPBP4 23560 10 1034348 1063708 71 0.1 0.115 0.129 0.029IDI2 91734 10 1064846 1071799 71 0.1 0.115 0.129 0.029IDI1 3422 10 1085963 1095061 71 0.1 0.115 0.129 0.029WDR37 22884 10 1102775 1178237 71 0.1 0.115 0.129 0.029ADARB2 105 10 1223252 1779670 72 0.1 0.154 0.129 0.04NCRNA00168 642394 10 1568824 1599179 73 0.1 0.115 0.129 0.029LPCAT1 79888 5 1461541 1524076 74 0.4 0.115 0.226 0.012DEFB130 245940 8 11921897 12175825 75 0.4 0.808 0.677 0.202ZNF705D 728957 8 11946846 11973025 75 0.4 0.808 0.677 0.202DUB3 377630 8 11994676 11996269 76 0.3 0.538 0.387 0.064FAM86B1 85002 8 12039612 12051624 76 0.3 0.538 0.387 0.064

Page 106 of 130
TAF4 6874 20 60549853 60640866 77 0.45 0.269 0.194 0.035SLC7A5 8140 16 87863628 87903100 78 0.4 0.269 0.742 0.04CA5A 763 16 87921624 87970112 78 0.4 0.269 0.742 0.04NRG3 10718 10 83637442 84746935 79 0.05 0.154 0.129 0.035TOP1 7150 20 39657461 39753126 80 0.2 0.154 0.065 0.012PLCG1 5335 20 39766160 39804357 80 0.2 0.154 0.065 0.012ZHX3 23051 20 39807088 39928739 80 0.2 0.154 0.065 0.012LPIN3 64900 20 39969559 39989222 80 0.2 0.154 0.065 0.012EMILIN3 90187 20 39988605 39995498 80 0.2 0.154 0.065 0.012CHD6 84181 20 40031169 40247133 80 0.2 0.154 0.065 0.012SFRS6 6431 20 42086503 42092244 81 0.2 0.192 0.032 0.012L3MBTL 26013 20 42136319 42170535 81 0.2 0.192 0.032 0.012SGK2 10110 20 42193754 42214273 82 0.2 0.192 0.032 0.006IFT52 51098 20 42219578 42275862 83 0.2 0.192 0.032 0.012MYBL2 4605 20 42295708 42345122 83 0.2 0.192 0.032 0.012GTSF1L 149699 20 42354800 42355642 84 0.2 0.192 0.032 0.006TOX2 84969 20 42544781 42698254 84 0.2 0.192 0.032 0.006SLC12A5 57468 20 44650328 44688789 85 0.2 0.192 0.032 0.006NCOA5 57727 20 44689625 44718580 85 0.2 0.192 0.032 0.006CD40 958 20 44746905 44758384 85 0.2 0.192 0.032 0.006CDH22 64405 20 44802375 44880334 85 0.2 0.192 0.032 0.006SLC35C2 51006 20 44978176 44993064 85 0.2 0.192 0.032 0.006ELMO2 63916 20 44994689 45035271 85 0.2 0.192 0.032 0.006ARFGEF2 10564 20 47538274 47653230 86 0.2 0.192 0.032 0.006MOV10L1 54456 22 50528434 50600116 87 0.25 0.154 0.161 0.017PANX2 56666 22 50609159 50618724 88 0.25 0.192 0.161 0.023TRABD 80305 22 50624359 50638027 89 0.25 0.154 0.161 0.023RP3-402G11.5 83642 22 50639407 50656045 89 0.25 0.154 0.161 0.023TUBGCP6 85378 22 50656117 50683400 89 0.25 0.154 0.161 0.023HDAC10 83933 22 50683612 50689834 89 0.25 0.154 0.161 0.023MAPK12 6300 22 50691330 50700089 89 0.25 0.154 0.161 0.023MAPK11 5600 22 50702141 50708779 89 0.25 0.154 0.161 0.023PLXNB2 23654 22 50713407 50746001 89 0.25 0.154 0.161 0.023FAM116B 414918 22 50750391 50765489 89 0.25 0.154 0.161 0.023SAPS2 9701 22 50781745 50883518 89 0.25 0.154 0.161 0.023SBF1 6305 22 50883430 50913464 90 0.25 0.154 0.161 0.017ADM2 79924 22 50919984 50924866 90 0.25 0.154 0.161 0.017
Page 107 of 130
MIOX 55586 22 50925212 50928750 90 0.25 0.154 0.161 0.017LMF2 91289 22 50941375 50946135 90 0.25 0.154 0.161 0.017NCAPH2 29781 22 50946644 50958191 90 0.25 0.154 0.161 0.017SCO2 9997 22 50961996 50964033 90 0.25 0.154 0.161 0.017TYMP 1890 22 50964181 50968514 90 0.25 0.154 0.161 0.017ODF3B 440836 22 50968837 50971008 90 0.25 0.154 0.161 0.017KLHDC7B 113730 22 50986461 50989452 90 0.25 0.154 0.161 0.017CPT1B 1375 22 51007289 51016894 90 0.25 0.154 0.161 0.017CHKB 1120 22 51017386 51021428 90 0.25 0.154 0.161 0.017MAPK8IP2 23542 22 51041561 51049979 90 0.25 0.154 0.161 0.017ARSA 410 22 51061181 51066601 90 0.25 0.154 0.161 0.017C20orf85 128602 20 56725982 56736183 91 0.45 0.269 0.194 0.029RAB22A 57403 20 56884770 56942563 91 0.45 0.269 0.194 0.029VAPB 9217 20 56964174 57026156 91 0.45 0.269 0.194 0.029APCDD1L 164284 20 57034425 57089949 91 0.45 0.269 0.194 0.029STX16 8675 20 57226308 57254582 91 0.45 0.269 0.194 0.029NPEPL1 79716 20 57267861 57290900 91 0.45 0.269 0.194 0.029HRH3 11255 20 60790016 60795323 92 0.4 0.269 0.161 0.035OSBPL2 9885 20 60813579 60871269 92 0.4 0.269 0.161 0.035ADRM1 11047 20 60878026 60883918 92 0.4 0.269 0.161 0.035LAMA5 3911 20 60884120 60942368 92 0.4 0.269 0.161 0.035RPS21 6227 20 60962120 60963576 92 0.4 0.269 0.161 0.035CABLES2 81928 20 60963685 60982339 92 0.4 0.269 0.161 0.035C20orf151 140893 20 60985292 61002629 92 0.4 0.269 0.161 0.035GATA5 140628 20 61038552 61051026 92 0.4 0.269 0.161 0.035C20orf200 253868 20 61141437 61148768 92 0.4 0.269 0.161 0.035C20orf166 128826 20 61147659 61167971 92 0.4 0.269 0.161 0.035SLCO4A1 28231 20 61273796 61303647 92 0.4 0.269 0.161 0.035NTSR1 4923 20 61340188 61394123 93 0.4 0.269 0.161 0.04C20orf20 55257 20 61427804 61431945 93 0.4 0.269 0.161 0.04OGFR 11054 20 61436176 61445352 93 0.4 0.269 0.161 0.04COL9A3 1299 20 61448413 61472511 93 0.4 0.269 0.161 0.04TCFL5 10732 20 61472466 61493115 93 0.4 0.269 0.161 0.04DIDO1 11083 20 61518566 61557903 93 0.4 0.269 0.161 0.04GNAS 2778 20 57466425 57486250 94 0.45 0.269 0.194 0.029TH1L 51497 20 57556310 57570188 94 0.45 0.269 0.194 0.029CTSZ 1522 20 57570241 57582309 94 0.45 0.269 0.194 0.029

Page 108 of 130
TUBB1 81027 20 57594308 57601709 94 0.45 0.269 0.194 0.029ATP5E 514 20 57603732 57607422 94 0.45 0.269 0.194 0.029SLMO2 51012 20 57608199 57617901 94 0.45 0.269 0.194 0.029BANP 54971 16 88003623 88110924 95 0.4 0.269 0.742 0.035ZFPM1 161882 16 88520013 88601574 95 0.4 0.269 0.742 0.035ZC3H18 124245 16 88636788 88698372 96 0.4 0.231 0.742 0.035IL17C 27189 16 88705000 88706882 96 0.4 0.231 0.742 0.035CYBA 1535 16 88709696 88717492 96 0.4 0.231 0.742 0.035MVD 4597 16 88718347 88729495 96 0.4 0.231 0.742 0.035SNAI3 333929 16 88744089 88752882 97 0.4 0.231 0.71 0.035RNF166 115992 16 88762902 88772829 97 0.4 0.231 0.71 0.035C16orf84 348180 16 88772890 88781786 97 0.4 0.231 0.71 0.035ZFAT 57623 8 135490030 135725292 98 0.5 0.885 0.194 0.035KHDRBS3 10656 8 136469715 136659848 99 0.5 0.885 0.194 0.023TPRG1L 127262 1 3541555 3546694 100 0.25 0.077 0.161 0.023WDR8 49856 1 3547330 3566671 100 0.25 0.077 0.161 0.023TP73 7161 1 3569128 3652765 100 0.25 0.077 0.161 0.023KIAA0495 57212 1 3652547 3663937 100 0.25 0.077 0.161 0.023CCDC27 148870 1 3668964 3688209 100 0.25 0.077 0.161 0.023

Page 109 of 130
Prognosis in IGRT + RadP (all risk groups) cohorts, adjusted for clinical variablesGains Dels Neutral HR lower95 upper95 WaldP q
1 121 158 3.017 1.742 5.226 8.15E-005 0.00385683
1 103 176 3.261 1.929 5.512 1.02E-005 0.0010708061 103 176 3.261 1.929 5.512 1.02E-005 0.0010708061 103 176 3.261 1.929 5.512 1.02E-005 0.0010708060 40 240 1.849 1 3.416 0.049841115 0.2003156810 39 241 1.87 1.011 3.457 0.045944049 0.1907886530 39 241 1.87 1.011 3.457 0.045944049 0.1907886530 39 241 1.87 1.011 3.457 0.045944049 0.1907886530 43 237 1.828 0.999 3.343 0.050312658 0.2011513187 18 255 3.126296301 1.506382915 6.488209915 0.002214972 0.02918424420 4 256 2.573 1.269 5.217 0.008792171 0.07017362520 4 256 2.573 1.269 5.217 0.008792171 0.07017362520 4 256 2.573 1.269 5.217 0.008792171 0.07017362520 5 255 3.155 1.662 5.987 0.000439947 0.01099864320 4 256 2.573 1.269 5.217 0.008792171 0.07017362520 6 254 2.696980273 1.33320354 5.455808043 0.005780339 0.05210000520 5 255 2.978 1.571 5.646 0.000825451 0.0161122896 18 256 2.872607122 1.383730622 5.963495749 0.004633789 0.0459282631 104 175 3.208 1.9 5.417 1.30E-005 0.00125306719 4 257 1.851 0.846 4.049 0.12327712 0.35868547819 4 257 1.851 0.846 4.049 0.12327712 0.35868547822 5 253 2.927 1.564 5.477 0.00078046 0.0153845821 102 177 3.317 1.96 5.613 7.98E-006 0.0009490550 56 224 2.17 1.21 3.89 0.00932704 0.0733291150 56 224 2.17 1.21 3.89 0.00932704 0.0733291150 56 224 2.17 1.21 3.89 0.00932704 0.0733291150 56 224 2.17 1.21 3.89 0.00932704 0.0733291150 56 224 2.17 1.21 3.89 0.00932704 0.0733291150 56 224 2.17 1.21 3.89 0.00932704 0.0733291150 56 224 2.17 1.21 3.89 0.00932704 0.0733291150 56 224 2.17 1.21 3.89 0.00932704 0.0733291150 56 224 2.17 1.21 3.89 0.00932704 0.0733291150 56 224 2.17 1.21 3.89 0.00932704 0.0733291150 56 224 2.17 1.21 3.89 0.00932704 0.07332911522 7 251 2.747227671 1.382479093 5.459221708 0.003922206 0.04068363

Page 110 of 130
22 7 251 2.747227671 1.382479093 5.459221708 0.003922206 0.0406836322 7 251 2.747227671 1.382479093 5.459221708 0.003922206 0.0406836322 10 248 2.719770046 1.368197922 5.406490528 0.004313538 0.04392235322 7 251 2.747227671 1.382479093 5.459221708 0.003922206 0.0406836319 5 256 1.944 0.956 3.953 0.066230693 0.24554736419 5 256 1.944 0.956 3.953 0.066230693 0.24554736413 18 249 1.805205923 0.842751801 3.866818703 0.128567159 0.3671589381 94 185 3.037 1.817 5.076 2.25E-005 0.0018032681 94 185 3.006 1.796 5.032 2.81E-005 0.0021108450 40 240 2.073 1.132 3.794 0.018153439 0.1076305120 40 240 2.073 1.132 3.794 0.018153439 0.1076305120 40 240 2.073 1.132 3.794 0.018153439 0.1076305120 39 241 1.917 1.037 3.544 0.037765525 0.1702026580 38 242 1.94 1.049 3.588 0.034610377 0.1615181524 15 261 2.65 1.177 5.967 0.018611672 0.1099262695 15 260 3.147 1.553 6.38 0.001470892 0.0218893683 15 262 2.65 1.177 5.967 0.018611672 0.1099262693 15 262 2.65 1.177 5.967 0.018611672 0.1099262693 15 262 2.65 1.177 5.967 0.018611672 0.1099262693 15 262 2.65 1.177 5.967 0.018611672 0.1099262693 15 262 2.65 1.177 5.967 0.018611672 0.1099262691 103 176 3.05 1.816 5.123 2.51E-005 0.00197468125 3 252 2.453 1.264 4.762 0.008024266 0.06524408325 3 252 2.453 1.264 4.762 0.008024266 0.06524408325 3 252 2.453 1.264 4.762 0.008024266 0.06524408325 3 252 2.453 1.264 4.762 0.008024266 0.06524408313 4 263 3.568 1.701 7.482 0.000761286 0.0150403066 17 257 2.101573572 0.983912779 4.488824183 0.055101002 0.21549498910 14 256 3.637383104 1.752336412 7.55023736 0.000529443 0.01177608810 14 256 3.637383104 1.752336412 7.55023736 0.000529443 0.01177608810 14 256 3.637383104 1.752336412 7.55023736 0.000529443 0.0117760881 100 179 2.994 1.78 5.035 3.58E-005 0.0025208341 101 178 3.148 1.865 5.312 1.75E-005 0.0015672611 101 178 3.148 1.865 5.312 1.75E-005 0.0015672611 101 178 3.148 1.865 5.312 1.75E-005 0.00156726111 3 266 3.778 1.743 8.186 0.000756023 0.01495311521 6 253 2.864576494 1.435726747 5.715431928 0.002824804 0.033757656
Page 111 of 130
21 6 253 2.864576494 1.435726747 5.715431928 0.002824804 0.03375765621 6 253 2.864576494 1.435726747 5.715431928 0.002824804 0.03375765613 19 248 1.627455758 0.757232818 3.497751528 0.212179603 0.49855785613 19 248 1.627455758 0.757232818 3.497751528 0.212179603 0.49855785613 19 248 1.627455758 0.757232818 3.497751528 0.212179603 0.4985578560 31 249 2.164 1.085 4.316 0.028458774 0.13969387322 2 256 2.264 1.089 4.707 0.028643653 0.1400984211 57 222 2.111 1.176 3.786 0.01225242 0.0873501171 57 222 2.111 1.176 3.786 0.01225242 0.0873501172 14 264 1.117 0.44 2.841 0.815646199 12 13 265 0.938 0.337 2.611 0.902438671 12 13 265 0.938 0.337 2.611 0.902438671 12 13 265 0.938 0.337 2.611 0.902438671 12 13 265 0.938 0.337 2.611 0.902438671 122 3 255 2.264 1.089 4.707 0.028643653 0.14009842114 2 264 2.439 1.081 5.502 0.031694683 0.15129023610 46 224 2.352178054 1.329373245 4.161917367 0.003304941 0.0374127871 36 243 3.542 1.981 6.332 1.99E-005 0.0016514641 36 243 3.542 1.981 6.332 1.99E-005 0.0016514641 36 243 3.542 1.981 6.332 1.99E-005 0.0016514641 36 243 3.542 1.981 6.332 1.99E-005 0.0016514641 36 243 3.542 1.981 6.332 1.99E-005 0.0016514641 36 243 3.542 1.981 6.332 1.99E-005 0.0016514641 36 243 3.542 1.981 6.332 1.99E-005 0.0016514641 36 243 3.542 1.981 6.332 1.99E-005 0.0016514641 36 243 3.542 1.981 6.332 1.99E-005 0.0016514641 35 244 3.664 2.045 6.562 1.26E-005 0.0012530671 35 244 3.459 1.922 6.224 3.49E-005 0.0024644632 32 246 4.084 2.265 7.363 2.89E-006 0.0004345581 32 247 4.084 2.265 7.363 2.89E-006 0.0004345581 32 247 4.084 2.265 7.363 2.89E-006 0.0004345581 32 247 4.084 2.265 7.363 2.89E-006 0.0004345581 31 248 3.992 2.188 7.284 6.41E-006 0.0007782121 31 248 3.992 2.188 7.284 6.41E-006 0.0007782121 31 248 3.992 2.188 7.284 6.41E-006 0.0007782121 31 248 3.992 2.188 7.284 6.41E-006 0.0007782121 31 248 3.992 2.188 7.284 6.41E-006 0.000778212
Page 112 of 130
1 29 250 3.88 2.093 7.194 1.67E-005 0.0015189291 29 250 3.88 2.093 7.194 1.67E-005 0.0015189291 29 250 3.88 2.093 7.194 1.67E-005 0.00151892910 48 222 2.430976901 1.386718129 4.261607727 0.001925598 0.02634919510 54 216 2.362021019 1.354953634 4.117589821 0.002435359 0.03111003410 54 216 2.362021019 1.354953634 4.117589821 0.002435359 0.03111003410 53 217 2.391001548 1.370197422 4.172309995 0.002149884 0.0284330710 53 217 2.391001548 1.370197422 4.172309995 0.002149884 0.0284330710 57 213 2.39782493 1.385814137 4.148871225 0.001769766 0.02488274210 57 213 2.39782493 1.385814137 4.148871225 0.001769766 0.02488274210 10 260 3.060604532 1.278608895 7.326165289 0.012010108 0.08642539410 10 260 3.060604532 1.278608895 7.326165289 0.012010108 0.08642539410 10 260 3.060604532 1.278608895 7.326165289 0.012010108 0.08642539410 10 260 3.060604532 1.278608895 7.326165289 0.012010108 0.0864253941 103 176 3.059 1.815 5.156 2.68E-005 0.0020532991 103 176 3.059 1.815 5.156 2.68E-005 0.0020532994 20 256 3.907 1.992 7.662 7.31E-005 0.0034957964 20 256 3.907 1.992 7.662 7.31E-005 0.0034957964 20 256 3.907 1.992 7.662 7.31E-005 0.0034957964 20 256 3.907 1.992 7.662 7.31E-005 0.0034957964 20 256 3.907 1.992 7.662 7.31E-005 0.0034957964 20 256 3.907 1.992 7.662 7.31E-005 0.0034957964 20 256 3.907 1.992 7.662 7.31E-005 0.0034957964 20 256 3.907 1.992 7.662 7.31E-005 0.0034957964 7 269 2.751 0.958 7.905 0.060183815 0.2309947244 7 269 2.751 0.958 7.905 0.060183815 0.2309947243 17 260 3.451 1.667 7.146 0.000850251 0.0163216623 17 260 3.451 1.667 7.146 0.000850251 0.0163216623 17 260 3.451 1.667 7.146 0.000850251 0.0163216623 17 260 3.451 1.667 7.146 0.000850251 0.0163216623 17 260 3.451 1.667 7.146 0.000850251 0.0163216623 17 260 3.451 1.667 7.146 0.000850251 0.0163216623 18 259 3.156 1.525 6.53 0.0019534 0.0263491953 18 259 3.156 1.525 6.53 0.0019534 0.0263491953 18 259 3.156 1.525 6.53 0.0019534 0.0263491953 18 259 3.156 1.525 6.53 0.0019534 0.0263491953 18 259 3.156 1.525 6.53 0.0019534 0.026349195

Page 113 of 130
3 18 259 3.156 1.525 6.53 0.0019534 0.0263491953 18 259 3.156 1.525 6.53 0.0019534 0.0263491953 18 259 3.156 1.525 6.53 0.0019534 0.0263491953 18 259 3.156 1.525 6.53 0.0019534 0.0263491953 18 259 3.156 1.525 6.53 0.0019534 0.0263491953 18 259 3.156 1.525 6.53 0.0019534 0.0263491951 101 178 2.943 1.752 4.944 4.51E-005 0.0027564021 101 178 2.943 1.752 4.944 4.51E-005 0.0027564021 101 178 2.943 1.752 4.944 4.51E-005 0.00275640213 1 266 1.669 0.646 4.313 0.290452656 0.60122743513 1 266 1.669 0.646 4.313 0.290452656 0.60122743513 1 266 1.669 0.646 4.313 0.290452656 0.60122743513 1 266 1.669 0.646 4.313 0.290452656 0.60122743510 3 267 3.344 1.481 7.551 0.00367289 0.03914499210 3 267 3.344 1.481 7.551 0.00367289 0.03914499210 3 267 3.344 1.481 7.551 0.00367289 0.03914499210 3 267 3.344 1.481 7.551 0.00367289 0.03914499210 3 267 3.344 1.481 7.551 0.00367289 0.03914499210 3 267 3.344 1.481 7.551 0.00367289 0.03914499211 3 266 3.086 1.378 6.912 0.00616517 0.05486627410 3 267 3.344 1.481 7.551 0.00367289 0.03914499210 4 266 3.349 1.478 7.589 0.003774081 0.0395682824 7 269 2.341 0.832 6.585 0.106946658 0.3278529634 12 264 2.507 1.069 5.878 0.034547782 0.1613115664 15 261 2.717 1.269 5.817 0.010090322 0.0773269234 13 263 1.824 0.763 4.357 0.176405845 0.4478973164 13 263 1.824 0.763 4.357 0.176405845 0.4478973164 13 263 1.824 0.763 4.357 0.176405845 0.4478973164 13 263 1.824 0.763 4.357 0.176405845 0.4478973164 13 263 1.824 0.763 4.357 0.176405845 0.4478973164 16 260 1.439 0.614 3.374 0.40246243 0.7304945984 12 264 2.507 1.069 5.878 0.034547782 0.16131156618 4 258 3.062 1.508 6.215 0.001951532 0.0263491951 98 181 2.663 1.591 4.456 0.00019347 0.0066734261 98 181 2.663 1.591 4.456 0.00019347 0.0066734260 43 237 2.545 1.405 4.609 0.002047897 0.0273350870 43 237 2.545 1.405 4.609 0.002047897 0.027335087
Page 114 of 130
26 3 251 2.332 1.201 4.528 0.012355749 0.0873501173 54 223 2.256 1.315 3.87 0.003145692 0.0358766083 54 223 2.256 1.315 3.87 0.003145692 0.0358766081 18 261 2.998 1.399 6.427 0.004768834 0.04700211610 3 267 3.349 1.478 7.589 0.003774081 0.03956828210 4 266 3.349 1.478 7.589 0.003774081 0.03956828210 4 266 3.349 1.478 7.589 0.003774081 0.03956828210 4 266 3.349 1.478 7.589 0.003774081 0.03956828210 4 266 3.349 1.478 7.589 0.003774081 0.03956828210 4 266 3.349 1.478 7.589 0.003774081 0.03956828210 4 266 3.344 1.481 7.551 0.00367289 0.03914499210 4 266 3.344 1.481 7.551 0.00367289 0.03914499210 3 267 3.344 1.481 7.551 0.00367289 0.03914499211 3 266 3.086 1.378 6.912 0.00616517 0.05486627411 3 266 3.086 1.378 6.912 0.00616517 0.05486627410 3 267 3.344 1.481 7.551 0.00367289 0.03914499210 3 267 3.344 1.481 7.551 0.00367289 0.03914499210 2 268 3.344 1.481 7.551 0.00367289 0.03914499210 2 268 3.344 1.481 7.551 0.00367289 0.03914499210 3 267 3.344 1.481 7.551 0.00367289 0.03914499210 3 267 3.344 1.481 7.551 0.00367289 0.03914499210 3 267 3.344 1.481 7.551 0.00367289 0.03914499210 3 267 3.344 1.481 7.551 0.00367289 0.03914499210 2 268 3.344 1.481 7.551 0.00367289 0.0391449923 16 261 2.239 0.994 5.047 0.051816454 0.2055261483 18 259 1.891 0.842 4.246 0.122677911 0.3572963723 17 260 2.056 0.917 4.614 0.080331367 0.2755286973 17 260 2.056 0.917 4.614 0.080331367 0.2755286973 17 260 2.056 0.917 4.614 0.080331367 0.2755286973 17 260 2.056 0.917 4.614 0.080331367 0.2755286973 17 260 2.056 0.917 4.614 0.080331367 0.2755286973 17 260 2.056 0.917 4.614 0.080331367 0.2755286973 17 260 2.056 0.917 4.614 0.080331367 0.2755286973 17 260 2.056 0.917 4.614 0.080331367 0.2755286973 17 260 2.056 0.917 4.614 0.080331367 0.2755286973 16 261 2.239 0.994 5.047 0.051816454 0.2055261483 16 261 2.239 0.994 5.047 0.051816454 0.205526148

Page 115 of 130
3 16 261 2.239 0.994 5.047 0.051816454 0.2055261483 16 261 2.239 0.994 5.047 0.051816454 0.2055261483 16 261 2.239 0.994 5.047 0.051816454 0.2055261483 16 261 2.239 0.994 5.047 0.051816454 0.2055261483 16 261 2.239 0.994 5.047 0.051816454 0.2055261483 16 261 2.239 0.994 5.047 0.051816454 0.2055261483 16 261 2.239 0.994 5.047 0.051816454 0.2055261483 16 261 2.239 0.994 5.047 0.051816454 0.2055261483 16 261 2.239 0.994 5.047 0.051816454 0.2055261483 16 261 2.239 0.994 5.047 0.051816454 0.2055261483 16 261 2.239 0.994 5.047 0.051816454 0.20552614824 4 252 2.557 1.31 4.993 0.005961387 0.05329522824 4 252 2.557 1.31 4.993 0.005961387 0.05329522824 4 252 2.557 1.31 4.993 0.005961387 0.05329522824 4 252 2.557 1.31 4.993 0.005961387 0.05329522824 4 252 2.557 1.31 4.993 0.005961387 0.05329522824 4 252 2.557 1.31 4.993 0.005961387 0.05329522824 3 253 2.293 1.16 4.532 0.016942245 0.10308825824 3 253 2.293 1.16 4.532 0.016942245 0.10308825824 3 253 2.293 1.16 4.532 0.016942245 0.10308825824 3 253 2.293 1.16 4.532 0.016942245 0.10308825824 3 253 2.293 1.16 4.532 0.016942245 0.10308825824 3 253 2.293 1.16 4.532 0.016942245 0.10308825824 3 253 2.293 1.16 4.532 0.016942245 0.10308825824 3 253 2.293 1.16 4.532 0.016942245 0.10308825824 3 253 2.293 1.16 4.532 0.016942245 0.10308825824 3 253 2.293 1.16 4.532 0.016942245 0.10308825824 3 253 2.293 1.16 4.532 0.016942245 0.10308825824 4 252 2.293 1.16 4.532 0.016942245 0.10308825824 4 252 2.293 1.16 4.532 0.016942245 0.10308825824 4 252 2.293 1.16 4.532 0.016942245 0.10308825824 4 252 2.293 1.16 4.532 0.016942245 0.10308825824 4 252 2.293 1.16 4.532 0.016942245 0.10308825824 4 252 2.293 1.16 4.532 0.016942245 0.10308825824 4 252 2.557 1.31 4.993 0.005961387 0.05329522824 4 252 2.557 1.31 4.993 0.005961387 0.05329522824 4 252 2.557 1.31 4.993 0.005961387 0.053295228

Page 116 of 130
24 4 252 2.557 1.31 4.993 0.005961387 0.05329522824 4 252 2.557 1.31 4.993 0.005961387 0.05329522824 4 252 2.557 1.31 4.993 0.005961387 0.0532952283 53 224 2.138 1.238 3.693 0.006430588 0.0565140513 53 224 2.138 1.238 3.693 0.006430588 0.0565140513 52 225 2.163 1.252 3.736 0.005685175 0.0516463843 52 225 2.163 1.252 3.736 0.005685175 0.0516463843 52 225 2.163 1.252 3.736 0.005685175 0.0516463843 51 226 2.266 1.316 3.904 0.00319532 0.0362651273 50 227 2.317 1.342 3.999 0.002558986 0.0322119833 50 227 2.317 1.342 3.999 0.002558986 0.0322119833 50 227 2.317 1.342 3.999 0.002558986 0.03221198345 5 230 2.115 1.183 3.782 0.011471059 0.08396051945 4 231 2.48 1.368 4.496 0.002763421 0.03322711813 3 264 1.566 0.611 4.015 0.350359866 0.67278114113 3 264 1.566 0.611 4.015 0.350359866 0.67278114113 3 264 1.566 0.611 4.015 0.350359866 0.67278114113 3 264 1.566 0.611 4.015 0.350359866 0.67278114113 3 264 1.566 0.611 4.015 0.350359866 0.672781141

Page 117 of 130
SampleID Date of diag Clinical Stage NCCN Risk Grade1 Grade2TB08.0262 06-10-2007 69 8.3 G4+3=7 T2 NxMx intermediate 12-03-2008 10.00% 7 3 4TB08.0311 11-03-2008 69 15.3 T1c NxMx NA 02-04-2008 45.00% 7 3 4TB08.0327 19-12-2007 57 4.8 G3+4=7 T3a N0M0 high 10-04-2008 60.00% 7 3 4TB08.0341 20-02-2008 58 4.3 G3+3=6 T1c NxMx low 21-04-2008 30.00% 7 3 4TB08.0501 14-04-2008 64 20.5 G4+5=9 T1c NxMx high 02-06-2008 25.00% 7 3 4TB08.0519 29-05-2008 55 9.8 G3+4=7 T3 NxMx high 11-06-2008 88.00% 9 5 4TB08.0533 16-04-2008 65 5.8 G3+3=6 T1c NxMx low 18-06-2008 40.00% 7 3 4TB08.0588 11-05-2007 55 13.9 G3+3=6 T2 NxMx intermediate 16-07-2008 40.00% 7 3 4TB08.0589 09-07-2008 66 5.17 G3+4=7 T2 NxMx intermediate 16-07-2008 67.00% 9 5 4TB08.0598 01-03-2008 65 8.8 G3+4=7 T1c NxMx intermediate 18-07-2008 8.00% 7 3 4TB08.0618 30-06-2008 57 6 G3+3=6 T1c NxMx low 28-07-2008 5.00% 6 3 3TB08.0667 16-06-2008 57 7.8 G4+4=8 T1c NxMx high 31-07-2008 20.00% 6 3 3TB08.0689 21-11-2007 51 8.8 G3+3=6 T1/T2 NA 06-08-2008 70.00% 6 3 3TB08.0691 17-10-2007 69 9.4 T2a/T3a NxMx high 07-08-2008 70.00% 7 3 4TB08.0719 01-02-2008 62 6.5 G3+3=6 T1c NxMx low 14-08-2008 10.00% 6 3 3TB08.0763 28-07-2008 61 14.5 G3+3=6 T1c NxMx intermediate 21-08-2008 8.00% 7 3 4TB08.0816 12-02-2008 63 9.8 G3+3=6 T3 N0Mx high 27-08-2008 100.00% 7 3 4TB08.0817 23-05-2008 62 10.4 G3+4=7 T2b NxMx intermediate 27-08-2008 100.00% 7 3 4TB08.0848 16-06-2008 63 4.9 G3+4=7 T3a N0M0 high 28-08-2008 10.00% 7 4 3TB08.0872 19-06-2008 63 7.5 G3+4=7 T2a N0M0 intermediate 04-09-2008 80.00% 6 3 3TB08.0877 22-05-2008 61 8.7 G3+3=6 T1c NxMx low 05-09-2008 33.00% 6 3 3TB08.0927 04-08-2008 59 9.3 G3+3=6 T1c NxMx low 29-09-2008 10.00% 6 3 3TB08.0949 UNKNOWN 67 3.2 G4+4=8 T1c N0M0 high 06-10-2008 21.00% 7 4 3TB08.0973 27-08-2008 68 6.4 G3+3=6 T1c NxMx low 16-10-2008 33.00% 7 3 4TB08.0986 22-09-2008 56 15.5 G3+3=6 T2b NxMx intermediate 22-10-2008 7 3 4TB08.0987 22-09-2008 54 12 G3+4=7 T2a N0M0 intermediate 22-10-2008 58.00% 7 3 4TB08.0997 28-07-2008 62 7 G4+3=7 T2 NxMX intermediate 23-10-2008 64.00% 7 4 3TB08.1015 23-06-2008 63 8 G4+3=7 T2 N0M0 intermediate 29-10-2008 42.00% 8 3 5TB08.1019 29-09-2008 59 5 G3+3=6 T1c NxMx low 30-01-2008 33.00% 7 3 4TB08.1026 16-02-2004 61 3.6 G3+4=7 T1c N0Mx intermediate 03-11-2008 12.00% 7 3 4TB08.1044 03-06-2008 71 7.9 G3+3=6 T1c N0Mx low 05-11-2008 7 3 4TB08.1053 24-07-2008 71 17 T1c NxMx NA 07-11-2008 0.00% 7 3 4TB08.1063 30-07-2008 67 5.8 G4+3=7 T3a N0M0 high 12-11-2008 0.00% 7 4 3TB08.1083 13-10-2008 64 7.3 G3+3=6 T1c NxMx low 24-11-2008 25.00% 6 3 3
Age at diag
PSA at diag
TRUS Gleason
Date of RRP/tissue collection
% Positive Cores
Path Grade
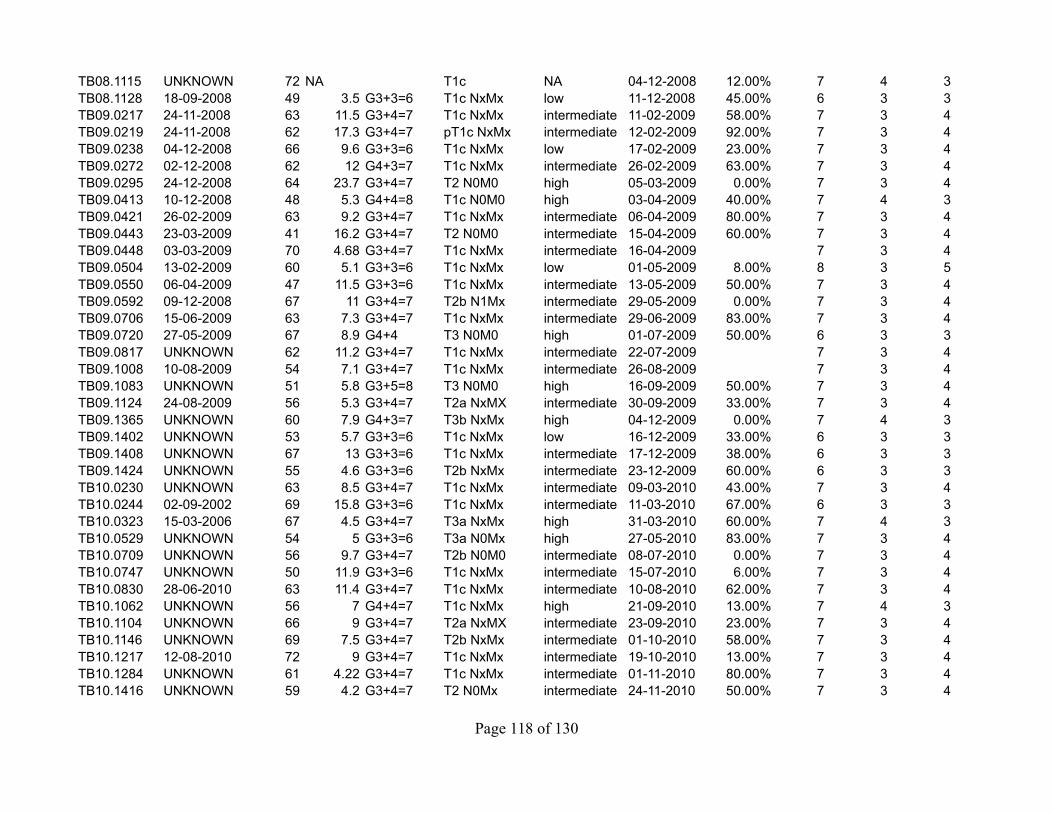
Page 118 of 130
TB08.1115 UNKNOWN 72 NA T1c NA 04-12-2008 12.00% 7 4 3TB08.1128 18-09-2008 49 3.5 G3+3=6 T1c NxMx low 11-12-2008 45.00% 6 3 3TB09.0217 24-11-2008 63 11.5 G3+4=7 T1c NxMx intermediate 11-02-2009 58.00% 7 3 4TB09.0219 24-11-2008 62 17.3 G3+4=7 pT1c NxMx intermediate 12-02-2009 92.00% 7 3 4TB09.0238 04-12-2008 66 9.6 G3+3=6 T1c NxMx low 17-02-2009 23.00% 7 3 4TB09.0272 02-12-2008 62 12 G4+3=7 T1c NxMx intermediate 26-02-2009 63.00% 7 3 4TB09.0295 24-12-2008 64 23.7 G3+4=7 T2 N0M0 high 05-03-2009 0.00% 7 3 4TB09.0413 10-12-2008 48 5.3 G4+4=8 T1c N0M0 high 03-04-2009 40.00% 7 4 3TB09.0421 26-02-2009 63 9.2 G3+4=7 T1c NxMx intermediate 06-04-2009 80.00% 7 3 4TB09.0443 23-03-2009 41 16.2 G3+4=7 T2 N0M0 intermediate 15-04-2009 60.00% 7 3 4TB09.0448 03-03-2009 70 4.68 G3+4=7 T1c NxMx intermediate 16-04-2009 7 3 4TB09.0504 13-02-2009 60 5.1 G3+3=6 T1c NxMx low 01-05-2009 8.00% 8 3 5TB09.0550 06-04-2009 47 11.5 G3+3=6 T1c NxMx intermediate 13-05-2009 50.00% 7 3 4TB09.0592 09-12-2008 67 11 G3+4=7 T2b N1Mx intermediate 29-05-2009 0.00% 7 3 4TB09.0706 15-06-2009 63 7.3 G3+4=7 T1c NxMx intermediate 29-06-2009 83.00% 7 3 4TB09.0720 27-05-2009 67 8.9 G4+4 T3 N0M0 high 01-07-2009 50.00% 6 3 3TB09.0817 UNKNOWN 62 11.2 G3+4=7 T1c NxMx intermediate 22-07-2009 7 3 4TB09.1008 10-08-2009 54 7.1 G3+4=7 T1c NxMx intermediate 26-08-2009 7 3 4TB09.1083 UNKNOWN 51 5.8 G3+5=8 T3 N0M0 high 16-09-2009 50.00% 7 3 4TB09.1124 24-08-2009 56 5.3 G3+4=7 T2a NxMX intermediate 30-09-2009 33.00% 7 3 4TB09.1365 UNKNOWN 60 7.9 G4+3=7 T3b NxMx high 04-12-2009 0.00% 7 4 3TB09.1402 UNKNOWN 53 5.7 G3+3=6 T1c NxMx low 16-12-2009 33.00% 6 3 3TB09.1408 UNKNOWN 67 13 G3+3=6 T1c NxMx intermediate 17-12-2009 38.00% 6 3 3TB09.1424 UNKNOWN 55 4.6 G3+3=6 T2b NxMx intermediate 23-12-2009 60.00% 6 3 3TB10.0230 UNKNOWN 63 8.5 G3+4=7 T1c NxMx intermediate 09-03-2010 43.00% 7 3 4TB10.0244 02-09-2002 69 15.8 G3+3=6 T1c NxMx intermediate 11-03-2010 67.00% 6 3 3TB10.0323 15-03-2006 67 4.5 G3+4=7 T3a NxMx high 31-03-2010 60.00% 7 4 3TB10.0529 UNKNOWN 54 5 G3+3=6 T3a N0Mx high 27-05-2010 83.00% 7 3 4TB10.0709 UNKNOWN 56 9.7 G3+4=7 T2b N0M0 intermediate 08-07-2010 0.00% 7 3 4TB10.0747 UNKNOWN 50 11.9 G3+3=6 T1c NxMx intermediate 15-07-2010 6.00% 7 3 4TB10.0830 28-06-2010 63 11.4 G3+4=7 T1c NxMx intermediate 10-08-2010 62.00% 7 3 4TB10.1062 UNKNOWN 56 7 G4+4=7 T1c NxMx high 21-09-2010 13.00% 7 4 3TB10.1104 UNKNOWN 66 9 G3+4=7 T2a NxMX intermediate 23-09-2010 23.00% 7 3 4TB10.1146 UNKNOWN 69 7.5 G3+4=7 T2b NxMx intermediate 01-10-2010 58.00% 7 3 4TB10.1217 12-08-2010 72 9 G3+4=7 T1c NxMx intermediate 19-10-2010 13.00% 7 3 4TB10.1284 UNKNOWN 61 4.22 G3+4=7 T1c NxMx intermediate 01-11-2010 80.00% 7 3 4TB10.1416 UNKNOWN 59 4.2 G3+4=7 T2 N0Mx intermediate 24-11-2010 50.00% 7 3 4
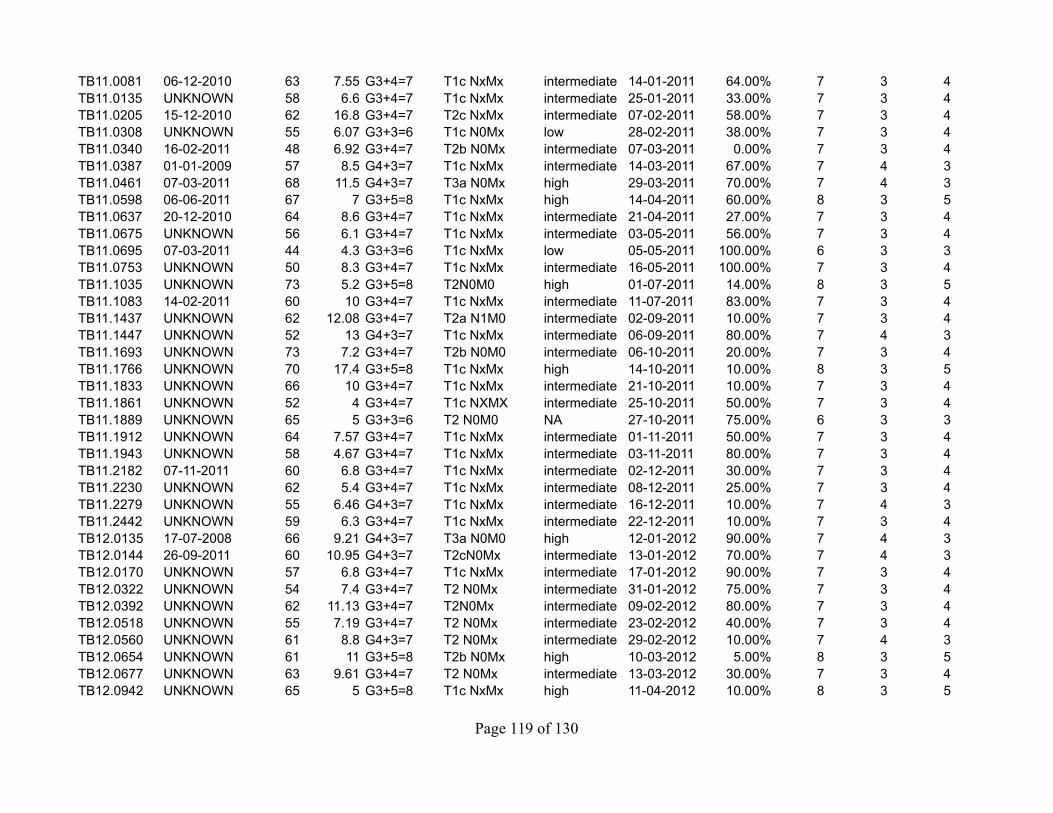
Page 119 of 130
TB11.0081 06-12-2010 63 7.55 G3+4=7 T1c NxMx intermediate 14-01-2011 64.00% 7 3 4TB11.0135 UNKNOWN 58 6.6 G3+4=7 T1c NxMx intermediate 25-01-2011 33.00% 7 3 4TB11.0205 15-12-2010 62 16.8 G3+4=7 T2c NxMx intermediate 07-02-2011 58.00% 7 3 4TB11.0308 UNKNOWN 55 6.07 G3+3=6 T1c N0Mx low 28-02-2011 38.00% 7 3 4TB11.0340 16-02-2011 48 6.92 G3+4=7 T2b N0Mx intermediate 07-03-2011 0.00% 7 3 4TB11.0387 01-01-2009 57 8.5 G4+3=7 T1c NxMx intermediate 14-03-2011 67.00% 7 4 3TB11.0461 07-03-2011 68 11.5 G4+3=7 T3a N0Mx high 29-03-2011 70.00% 7 4 3TB11.0598 06-06-2011 67 7 G3+5=8 T1c NxMx high 14-04-2011 60.00% 8 3 5TB11.0637 20-12-2010 64 8.6 G3+4=7 T1c NxMx intermediate 21-04-2011 27.00% 7 3 4TB11.0675 UNKNOWN 56 6.1 G3+4=7 T1c NxMx intermediate 03-05-2011 56.00% 7 3 4TB11.0695 07-03-2011 44 4.3 G3+3=6 T1c NxMx low 05-05-2011 100.00% 6 3 3TB11.0753 UNKNOWN 50 8.3 G3+4=7 T1c NxMx intermediate 16-05-2011 100.00% 7 3 4TB11.1035 UNKNOWN 73 5.2 G3+5=8 T2N0M0 high 01-07-2011 14.00% 8 3 5TB11.1083 14-02-2011 60 10 G3+4=7 T1c NxMx intermediate 11-07-2011 83.00% 7 3 4TB11.1437 UNKNOWN 62 12.08 G3+4=7 T2a N1M0 intermediate 02-09-2011 10.00% 7 3 4TB11.1447 UNKNOWN 52 13 G4+3=7 T1c NxMx intermediate 06-09-2011 80.00% 7 4 3TB11.1693 UNKNOWN 73 7.2 G3+4=7 T2b N0M0 intermediate 06-10-2011 20.00% 7 3 4TB11.1766 UNKNOWN 70 17.4 G3+5=8 T1c NxMx high 14-10-2011 10.00% 8 3 5TB11.1833 UNKNOWN 66 10 G3+4=7 T1c NxMx intermediate 21-10-2011 10.00% 7 3 4TB11.1861 UNKNOWN 52 4 G3+4=7 T1c NXMX intermediate 25-10-2011 50.00% 7 3 4TB11.1889 UNKNOWN 65 5 G3+3=6 T2 N0M0 NA 27-10-2011 75.00% 6 3 3TB11.1912 UNKNOWN 64 7.57 G3+4=7 T1c NxMx intermediate 01-11-2011 50.00% 7 3 4TB11.1943 UNKNOWN 58 4.67 G3+4=7 T1c NxMx intermediate 03-11-2011 80.00% 7 3 4TB11.2182 07-11-2011 60 6.8 G3+4=7 T1c NxMx intermediate 02-12-2011 30.00% 7 3 4TB11.2230 UNKNOWN 62 5.4 G3+4=7 T1c NxMx intermediate 08-12-2011 25.00% 7 3 4TB11.2279 UNKNOWN 55 6.46 G4+3=7 T1c NxMx intermediate 16-12-2011 10.00% 7 4 3TB11.2442 UNKNOWN 59 6.3 G3+4=7 T1c NxMx intermediate 22-12-2011 10.00% 7 3 4TB12.0135 17-07-2008 66 9.21 G4+3=7 T3a N0M0 high 12-01-2012 90.00% 7 4 3TB12.0144 26-09-2011 60 10.95 G4+3=7 T2cN0Mx intermediate 13-01-2012 70.00% 7 4 3TB12.0170 UNKNOWN 57 6.8 G3+4=7 T1c NxMx intermediate 17-01-2012 90.00% 7 3 4TB12.0322 UNKNOWN 54 7.4 G3+4=7 T2 N0Mx intermediate 31-01-2012 75.00% 7 3 4TB12.0392 UNKNOWN 62 11.13 G3+4=7 T2N0Mx intermediate 09-02-2012 80.00% 7 3 4TB12.0518 UNKNOWN 55 7.19 G3+4=7 T2 N0Mx intermediate 23-02-2012 40.00% 7 3 4TB12.0560 UNKNOWN 61 8.8 G4+3=7 T2 N0Mx intermediate 29-02-2012 10.00% 7 4 3TB12.0654 UNKNOWN 61 11 G3+5=8 T2b N0Mx high 10-03-2012 5.00% 8 3 5TB12.0677 UNKNOWN 63 9.61 G3+4=7 T2 N0Mx intermediate 13-03-2012 30.00% 7 3 4TB12.0942 UNKNOWN 65 5 G3+5=8 T1c NxMx high 11-04-2012 10.00% 8 3 5

Page 120 of 130
TB12.1231 UNKNOWN 62 6.87 G3+4=7 T3a N0Mx high 09-05-2012 65.00% 7 3 4TB12.1408 UNKNOWN 65 4.6 G3+4=7 T2 NxMX intermediate 22-05-2012 15.00% 7 3 4TB12.1447 UNKNOWN 54 13.6 G3+4=7 T2 N0M0 intermediate 24-05-2012 30.00% 7 4 3TB12.1498 UNKNOWN 61 7.63 G3+4=7 T1c NxMx intermediate 29-05-2012 50.00% 7 3 4TB12.1505 UNKNOWN 67 7.8 G4+3=7 T3a N0Mx high 29-05-2012 100.00% 7 4 3TB12.1843 UNKNOWN 56 13.89 G4+3=7 T2 N0Mx intermediate 24-08-2012 30.00% 7 4 3TB12.1852 UNKNOWN 62 18 G4+3=7 T1c NxMx intermediate 06-07-2012 40.00% 7 4 3TB12.2315 UNKNOWN 50 8.05 G3+4=7 T1c NxMx intermediate 16-08-2012 70.00% 7 3 4TB12.2336 UNKNOWN 58 9.08 G3+4=7 T1c NxMx intermediate 21-08-2012 55.00% 7 3 4

Page 121 of 130
Date of BCR PSA at BCR Death Age at deathmulti-focal 01-12-2013 23-08-2013 0.01 N N/A N/A N N/A N/Amulti-focal 28-01-2011 01-08-2013 0.1 N N/A N/A N N/A N/Auni-focal 01-12-2013 23-08-2013 0.01 N N/A N/A N N/A N/Amulti-focal 01-12-2013 01-08-2013 0.19 Y 18-10-2008 0.25 N N/A N/Amulti-focal 01-12-2013 23-08-2013 0.02 N N/A N/A N N/A N/Auni-focal 01-12-2013 12-04-2013 0.04 Y 04-07-2008 9.8 N N/A N/Amulti-focal 01-12-2013 02-08-2013 0.02 N N/A N/A N N/A N/Amulti-focal 01-12-2013 05-08-2013 0.04 Y 09-02-2013 0.3 N N/A N/Amulti-focal 01-12-2013 20-10-2008 49.2 Y 08-09-2008 16.2 Y 26-09-2009 67multi-focal 01-12-2013 01-08-2013 0.01 N N/A N/A N N/A N/Amulti-focal 01-12-2013 29-01-2013 0.05 N N/A N/A N N/A N/Amulti-focal 01-12-2013 27-01-2012 0.05 N N/A N/A N N/A N/Amulti-focal 28-01-2011 05-10-2010 0.1 N N/A N/A N N/A N/Amulti-focal 01-12-2013 23-08-2013 0.02 Y 16-04-2009 0.11 N N/A N/Amulti-focal 01-12-2013 02-08-2013 0.01 N N/A N/A N N/A N/Amulti-focal 01-12-2013 04-08-2013 0.1 N N/A N/A N N/A N/Amulti-focal 01-12-2013 24-05-2012 0.1 N N/A N/A N N/A N/Auni-focal 01-12-2013 23-08-2013 0.11 N N/A N/A N N/A N/Auni-focal 01-12-2013 24-05-2012 0.02 N N/A N/A N N/A N/Amulti-focal 01-12-2013 26-06-2012 0.02 N N/A N/A N N/A N/Amulti-focal 01-12-2013 01-10-2012 0.02 N N/A N/A N N/A N/Amulti-focal 01-12-2013 05-08-2013 0.01 N N/A N/A N N/A N/Amulti-focal 01-12-2013 23-08-2013 0.04 N N/A N/A N N/A N/Amulti-focal 01-12-2013 23-08-2013 0.02 N N/A N/A N N/A N/Amulti-focal 01-12-2013 04-08-2013 0.02 N N/A N/A N N/A N/Auni-focal 01-12-2013 02-08-2013 0 N N/A N/A N N/A N/Amulti-focal 01-12-2013 17-09-2012 0.1 N N/A N/A N N/A N/Auni-focal 28-01-2010 13-10-2010 0.1 Y 13-10-2009 0.06 N N/A N/Amulti-focal 01-12-2013 23-08-2013 0.02 N N/A N/A N N/A N/Amulti-focal 01-12-2013 14-08-2013 0.11 Y 14-08-2013 0.11 N N/A N/Amulti-focal 01-12-2013 01-02-2012 0.02 N N/A N/A N N/A N/Amulti-focal 01-12-2013 23-08-2013 0.01 N N/A N/A N N/A N/Amulti-focal 01-12-2013 23-08-2013 5.8 Y 13-01-2012 1.9 N N/A N/Amulti-focal 01-12-2013 01-08-2013 0.01 N N/A N/A N N/A N/A
Number Of Tumours
Date of update
Date final PSA
Final PSA
Biochem Relapse
Date of death

Page 122 of 130
multi-focal 01-12-2013 02-09-2013 0.02 N N/A N/A N N/A N/Amulti-focal 01-12-2013 29-01-2013 0.05 N N/A N/A N N/A N/Amulti-focal 14-12-2010 24-05-2012 5.24 Y 03-02-2010 0.32 N N/A N/Amulti-focal 14-12-2010 04-08-2013 0.11 Y 15-06-2010 0.12 N N/A N/Amulti-focal 28-01-2011 05-08-2013 0 N N/A N/A N N/A N/Amulti-focal 01-12-2013 23-08-2013 0.02 N N/A N/A N N/A N/Amulti-focal 01-12-2013 09-02-2013 0.13 Y 07-05-2009 0.04 N N/A N/Amulti-focal 28-01-2011 23-08-2013 0.2 Y 29-01-2013 0.3 N N/A N/Auni-focal 01-12-2013 01-10-2013 0.02 N N/A N/A N N/A N/Amulti-focal 01-12-2013 08-09-2010 0.1 N N/A N/A N N/A N/Amulti-focal 01-12-2013 23-08-2013 0.04 N N/A N/A N N/A N/Auni-focal 01-12-2013 23-08-2013 0.03 N N/A N/A N N/A N/Auni-focal 01-12-2013 02-08-2013 0 N N/A N/A N N/A N/Amulti-focal 01-12-2013 23-08-2013 0.01 N N/A N/A N N/A N/Amulti-focal 01-12-2013 01-08-2013 0.03 N N/A N/A N N/A N/Amulti-focal 01-12-2013 06-09-2013 0.02 N N/A N/A N N/A N/A
01-12-2013 21-05-2012 0.02 N N/A N/A UNKNOWUNKNOWN N/A01-12-2013 12-11-2012 0.01 N N/A N/A UNKNOWUNKNOWN N/A
multi-focal 23-08-2013 0.05 N N/A N/A UNKNOWN N/Amulti-focal 01-12-2013 31-07-2013 0.02 Y 20-10-2010 0.08 UNKNOWUNKNOWN N/Amulti-focal 01-12-2013 28-05-2012 0.02 N N/A N/A UNKNOWUNKNOWN N/Amulti-focal 01-12-2013 23-08-2013 0.1 N N/A N/A UNKNOWUNKNOWN N/Amulti-focal 01-12-2013 01-10-2013 0.02 Y 25-07-2012 0.09 UNKNOWUNKNOWN N/Amulti-focal 01-12-2013 04-07-2012 0.02 N N/A N/A UNKNOWUNKNOWN N/Auni-focal 01-12-2013 30-07-2013 0.01 N N/A N/A UNKNOWUNKNOWN N/Amulti-focal 01-12-2013 23-08-2013 0.02 N N/A N/A UNKNOWUNKNOWN N/Auni-focal 01-12-2013 23-08-2013 0.27 Y 01-08-2011 1.7 UNKNOWUNKNOWN N/Amulti-focal 01-12-2013 07-09-2013 0.02 N N/A N/A UNKNOWUNKNOWN N/Amulti-focal 01-12-2013 10-09-2013 0.02 N N/A N/A UNKNOWUNKNOWN N/Amulti-focal 01-12-2013 11-07-2013 0.02 N N/A N/A UNKNOWUNKNOWN N/Amulti-focal 01-12-2013 26-06-2012 0.02 N N/A N/A UNKNOWUNKNOWN N/Amulti-focal 01-12-2013 05-08-2013 0.04 Y 15-03-2011 0.12 UNKNOWUNKNOWN N/Amulti-focal 01-12-2013 23-08-2013 0.02 N N/A N/A UNKNOWUNKNOWN N/Amulti-focal 01-12-2013 29-01-2013 0.02 N N/A N/A UNKNOWUNKNOWN N/Amulti-focal 01-12-2013 15-08-2013 0.01 N N/A N/A UNKNOWUNKNOWN N/Amulti-focal 21-08-2013 0.02 N N/A N/A UNKNOWUNKNOWN N/A
01-12-2013 28-07-2013 0.03 N N/A N/A UNKNOWUNKNOWN N/A

Page 123 of 130
multi-focal 01-12-2013 08-08-2013 0.1 N N/A N/A UNKNOWUNKNOWN N/Amulti-focal 01-12-2013 23-08-2013 0.02 N N/A N/A UNKNOWUNKNOWN N/Amulti-focal 01-12-2013 31-07-2013 0.01 Y 21-04-2011 0.37 UNKNOWUNKNOWN N/Amulti-focal 01-12-2013 02-02-2013 0.01 N N/A N/A UNKNOWUNKNOWN N/Auni-focal 01-12-2013 23-08-2013 0.03 N N/A N/A UNKNOWUNKNOWN N/Amulti-focal 01-12-2013 05-10-2013 0.04 Y 29-01-2013 0.16 UNKNOWUNKNOWN N/Amulti-focal 01-12-2013 23-08-2013 0.02 Y 21-05-2011 0.43 UNKNOWUNKNOWN N/Amulti-focal 01-12-2013 23-08-2013 0.6 Y 20-07-2011 0.36 UNKNOWUNKNOWN N/Amulti-focal 01-12-2013 23-08-2013 0.1 Y 08-07-2011 0.07 UNKNOWUNKNOWN N/Amulti-focal 01-12-2013 02-08-2013 0 N N/A N/A UNKNOWUNKNOWN N/A
01-12-2013 04-08-2013 0.02 N N/A N/A UNKNOWUNKNOWN N/Amulti-focal 01-12-2013 23-08-2012 0.01 N N/A N/A UNKNOWUNKNOWN N/Amulti-focal 01-12-2013 23-08-2013 0.2 N N/A N/A UNKNOWUNKNOWN N/Amulti-focal 01-12-2013 17-05-2013 0.02 N N/A N/A N/A
01-12-2013 11-11-2013 0.02 N N/A N/A UNKNOWUNKNOWN N/A01-12-2013 04-02-2013 0.01 N N/A N/A UNKNOWUNKNOWN N/A
13-01-2013 0.02 N N/A N/A UNKNOWUNKNOWN N/A01-12-2013 23-08-2013 0.1 N N/A N/A UNKNOWUNKNOWN N/A01-12-2013 02-02-2013 0.1 N N/A N/A UNKNOWUNKNOWN N/A01-12-2013 02-09-2013 0.02 N N/A N/A UNKNOWUNKNOWN N/A01-12-2013 01-02-2013 0.02 N N/A N/A UNKNOWUNKNOWN N/A01-12-2013 23-08-2013 0.02 N N/A N/A UNKNOWUNKNOWN N/A01-12-2013 09-08-2013 0.02 N N/A N/A UNKNOWUNKNOWN N/A01-12-2013 23-08-2013 0.11 N N/A 0.11 UNKNOWUNKNOWN N/A01-12-2013 25-02-2013 0.02 N N/A N/A UNKNOWUNKNOWN N/A01-12-2013 23-09-2013 0.02 N N/A N/A UNKNOWUNKNOWN N/A01-12-2013 22-08-2013 0.04 N N/A N/A UNKNOWUNKNOWN N/A01-12-2013 17-07-2013 0.02 Y 10-02-2012 0.08 UNKNOWUNKNOWN N/A01-12-2013 11-05-2012 0.02 Y 10-02-2012 0.28 UNKNOWUNKNOWN N/A01-12-2013 23-08-2013 0.2 N N/A N/A UNKNOWUNKNOWN N/A01-12-2013 26-08-2013 0.02 N N/A N/A UNKNOWUNKNOWN N/A01-12-2013 23-08-2013 0.04 N N/A N/A UNKNOWUNKNOWN N/A01-12-2013 19-10-2012 0.02 N N/A N/A UNKNOWUNKNOWN N/A01-12-2013 13-10-2013 0.14 Y 13-10-2013 0.14 UNKNOWUNKNOWN N/A01-12-2013 11-05-2012 0.03 Y 11-05-2012 0.03 UNKNOWUNKNOWN N/A01-12-2013 23-08-2013 0.02 N N/A N/A UNKNOWUNKNOWN N/A01-12-2013 07-02-2013 0.02 N N/A N/A UNKNOWUNKNOWN N/A

Page 124 of 130
01-12-2013 16-08-2013 0.1 N N/A N/A UNKNOWUNKNOWN N/A01-12-2013 08-04-2013 0.02 N N/A N/A UNKNOWUNKNOWN N/A01-12-2013 05-11-2013 0.1 Y 22-06-2012 1.26 UNKNOWUNKNOWN N/A01-12-2013 04-09-2013 0.02 N N/A N/A UNKNOWUNKNOWN N/A01-12-2013 09-08-2013 0.03 N N/A N/A UNKNOWUNKNOWN N/A01-12-2013 10-08-2013 0.02 N N/A N/A UNKNOWUNKNOWN N/A01-12-2013 24-05-2013 0.02 N N/A N/A UNKNOWUNKNOWN N/A01-12-2013 06-09-2013 0.02 N N/A N/A UNKNOWUNKNOWN N/A01-12-2013 05-07-2013 0.02 N N/A N/A UNKNOWUNKNOWN N/A
Page 125 of 130
SampleID PGATB08.0262 0.002838023TB08.0311 1.996110164TB08.0327 0TB08.0341 5.12453545TB08.0501 0TB08.0519 13.06535682TB08.0533 0.387111588TB08.0588 2.264131675TB08.0589 0TB08.0598 0.022449004TB08.0618 2.944587809TB08.0667 5.642008267TB08.0689 0.007645739TB08.0691 2.79385028TB08.0719 0.002838023TB08.0763 8.08283358TB08.0816 0.002838023TB08.0817 0TB08.0848 4.298216575TB08.0872 0.014777217TB08.0877 1.127496621TB08.0927 0.020900988TB08.0949 13.07116447TB08.0973 6.545301912TB08.0986 0.081767152TB08.0987 0.219688595TB08.0997 5.460582406TB08.1015 16.22274811TB08.1019 0TB08.1026 4.12549235TB08.1044 0.008869712TB08.1053 0.164835239TB08.1063 0.002838023TB08.1083 0.009851012TB08.1115 4.497789459TB08.1128 0.002838023TB09.0217 0.281761032TB09.0219 0.024385806TB09.0238 0.00567558TB09.0272 1.67126306TB09.0295 3.569692019TB09.0413 0TB09.0421 6.577554705TB09.0443 0.002838023TB09.0448 0.007598802TB09.0504 0.142900461TB09.0550 3.103510958TB09.0592 1.157068682TB09.0706 0.636084068TB09.0720 0.11048063

Page 126 of 130
TB09.0817 8.958077955TB09.1008 0.246451835TB09.1083 9.589386481TB09.1124 3.888808761TB09.1365 3.127873439TB09.1402 5.113436065TB09.1408 1.798644919TB09.1424 6.551077708TB10.0230 1.826024857TB10.0244 4.843905951TB10.0323 23.26734475TB10.0529 0TB10.0709 2.771036889TB10.0747 11.00035729TB10.0830 5.182917049TB10.1062 28.27974056TB10.1104 0.002838023TB10.1146 0.002838023TB10.1217 0.002838023TB10.1284 7.355598422TB10.1416 1.212765645TB11.0081 0.047969568TB11.0135 0TB11.0205 3.744659676TB11.0308 3.642574303TB11.0340 0.242772392TB11.0387 6.968553405TB11.0461 6.325495438TB11.0598 10.3319282TB11.0637 3.944891464TB11.0675 2.203740074TB11.0695 0.002838023TB11.0753 8.685648084TB11.1035 19.57781644TB11.1083 2.783375905TB11.1437 4.967638355TB11.1447 3.081494345TB11.1693 0.457948148TB11.1766 0.035895225TB11.1833 3.888692171TB11.1861 6.703413522TB11.1889 0TB11.1912 1.81488262TB11.1943 5.071423016TB11.2182 0.058431725TB11.2230 6.351869928TB11.2279 0.056410867TB11.2442 7.347788942TB12.0135 0.06311522TB12.0144 11.43721735TB12.0170 1.978780665

Page 127 of 130
TB12.0322 5.260243774TB12.0392 0.002838023TB12.0518 1.431648291TB12.0560 4.51667052TB12.0654 3.035534098TB12.0677 0.28985181TB12.0942 3.00979999TB12.1231 3.563973229TB12.1408 4.046058204TB12.1447 0.09706207TB12.1498 7.072714061TB12.1505 14.06089411TB12.1843 23.19969727TB12.1852 3.418987596TB12.2315 0.002838023TB12.2336 4.204575797
Page 128 of 130
Sample Buffa.scores West.scores Winter.scoresTB08.0262 -3 4 15TB08.0311 -1 0 -3TB08.0327 1 0 3TB08.0341 -1 -2 5TB08.0519 -1 6 1TB08.0533 9 6 9TB08.0588 -5 -6 -19TB08.0589 -9 -2 -3TB08.0598 -1 6 1TB08.0618 -9 -2 -13TB08.0667 11 8 17TB08.0689 9 0 3TB08.0691 3 0 -1TB08.0719 -3 0 15TB08.0763 1 -2 -3TB08.0816 7 -2 7TB08.0848 -11 -2 -3TB08.0872 -3 -4 7TB08.0877 1 -10 -17TB08.0927 -7 -4 21TB08.0949 5 6 -5TB08.0987 -1 -2 3TB08.0997 9 -4 -9TB08.1015 7 0 -9TB08.1019 -3 0 3TB08.1026 1 -6 -5TB08.1044 7 2 5TB08.1053 -7 -6 -5TB08.1063 -1 6 29TB08.1083 -11 -4 3TB08.1115 11 2 -3TB09.0217 -7 8 17TB09.0219 11 2 -13TB09.0238 1 -4 7TB09.0295 3 -2 1TB09.0413 5 0 9TB09.0421 -9 -2 -1TB09.0443 11 12 17TB09.0448 1 2 25TB09.0504 -7 -2 23TB09.0550 3 6 5TB09.0592 -7 -6 -7TB09.0720 7 -4 -1TB09.0817 -3 -6 3TB09.1008 -7 4 -1TB09.1083 7 -4 1TB09.1124 -7 -2 -7TB09.1365 -3 0 5TB09.1402 -5 -10 5TB09.1408 -11 -2 11

Page 129 of 130
TB09.1424 -11 0 -7TB10.0230 9 -4 -7TB10.0244 15 6 -5TB10.0323 -3 6 -11TB10.0529 -13 -4 -11TB10.0709 1 -2 5TB10.0747 3 -2 7TB10.0830 5 14 17TB10.1062 3 6 9TB10.1104 9 2 17TB10.1146 -3 -4 -9TB10.1217 3 2 -3TB10.1284 1 6 -1TB10.1416 -5 -8 -15TB11.0081 1 0 -7TB11.0135 -5 -6 -5TB11.0205 -9 -6 3TB11.0308 -3 2 3TB11.0340 3 4 -5TB11.0387 -5 4 13TB11.0461 -1 -4 3TB11.0598 11 6 -7TB11.0637 -1 4 11TB11.0675 -5 -6 -15TB11.0695 -7 -2 -7TB11.0753 3 -8 -21TB11.1035 19 2 3TB11.1083 5 -2 1TB11.1437 15 4 3TB11.1447 5 2 13TB11.1693 -5 4 -9TB11.1766 -5 4 11TB11.1833 -1 2 -5TB11.1861 1 -6 -23TB11.1889 5 0 -13TB11.1912 13 0 -7TB11.1943 3 -4 5TB11.2182 -7 -6 -5TB11.2230 -1 -2 -11TB11.2279 -9 4 -1TB11.2442 -3 -2 -7TB12.0135 3 4 7TB12.0144 -1 -10 13TB12.0170 -5 -2 -3TB12.0322 -7 -4 -5TB12.0392 5 0 -15TB12.0518 3 -2 -19TB12.0560 13 12 11TB12.0654 -5 2 -1TB12.0677 7 10 13TB12.0942 -7 4 -9
Page 130 of 130
TB12.1231 -3 6 5TB12.1408 -11 0 -17TB12.1447 1 0 -7TB12.1498 1 2 -7TB12.1505 9 12 7TB12.1843 -7 -10 -19TB12.1852 -5 4 1TB12.2315 -1 -10 -9TB12.2336 -9 -2 -1


![Supplementary appendix - thelancet.com et al., Lancet Neurology 2018, Appendix Page . 2. of . 27. 30) NCL [Neurological Centre of Latium (Gruppo NEUROMED)] Centro Studi Clinici Malattia](https://img.pdfslide.net/doc/110x75/5b1ee74d7f8b9a36678c20d2/supplementary-appendix-et-al-lancet-neurology-2018-appendix-page-2-of-.jpg)