Embed Size (px)
DESCRIPTION
Supplementary Fig. S1. A. B. SAS-S. SAS cisPt R. SAS-S. SAS cisPt R. G 2. G 1. Glut3(%). Glut3(%). Glut3(%). Glut3(%). G 2. G 1. G 1. G 2. G 4. G 3. CD133(%). CD133(%). mem Grp78(%). mem Grp78(%). G 1. G 2. SAS cisPt R. SAS-S. SAS cisPt R. SAS-S. G1 : - PowerPoint PPT Presentation
Citation preview
Supplementary Fig. S1
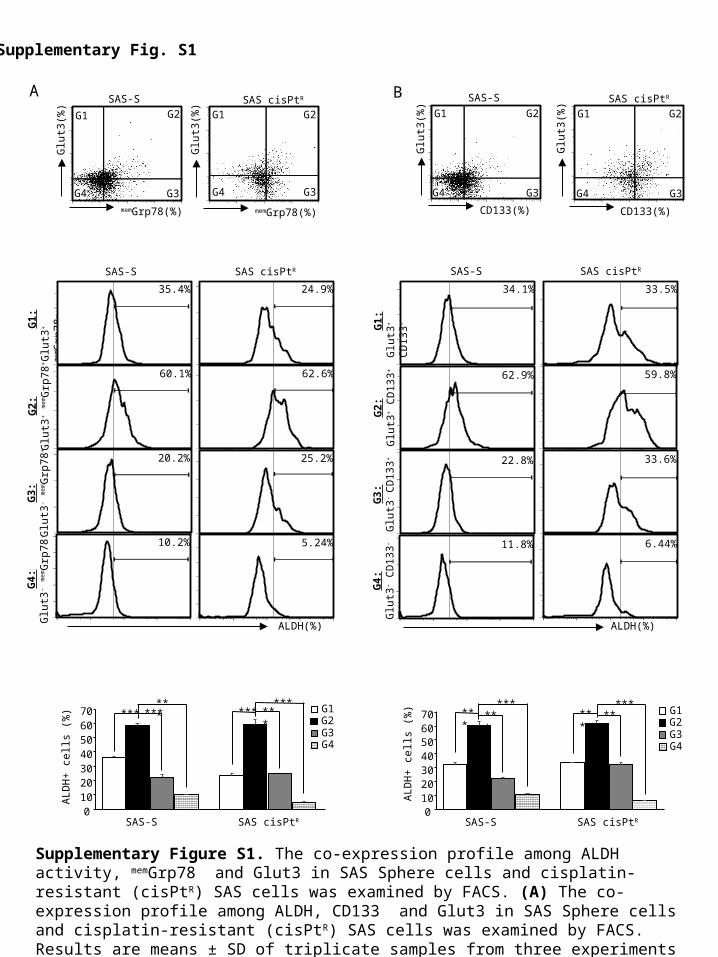
Supplementary Figure S1. The co-expression profile among ALDH activity, memGrp78 and Glut3 in SAS Sphere cells and cisplatin-resistant (cisPtR) SAS cells was examined by FACS. (A) The co-expression profile among ALDH, CD133 and Glut3 in SAS Sphere cells and cisplatin-resistant (cisPtR) SAS cells was examined by FACS. Results are means ± SD of triplicate samples from three experiments (***, p < 0.001) (B).
A
ALD
H+
cel
ls (
%)
SAS-S
memGrp78(%)
Glu
t3(%
)
SAS cisPtR
memGrp78(%)
Glu
t3(%
)
B SAS-S
CD133(%)
Glu
t3(%
)
SAS cisPtR
CD133(%)
Glu
t3(%
)
G1 G2
G3G4
G1 G2
G3G4
G1:
Glu
t3+ m
emG
rp78
-
SAS cisPtRSAS-S
35.4%
60.1%
20.2%
10.2%
24.9%
62.6%
25.2%
5.24%
G1 G2
G3G4
G1 G2
G3G4
SAS cisPtRSAS-S
34.1%
62.9%
22.8%
11.8%
33.5%
59.8%
33.6%
6.44%
G1G2G3G4
010203040506070
*********
*********
SAS cisPtRSAS-S0
10203040506070
************
******
SAS cisPtRSAS-S
G1G2G3G4
ALD
H+
cel
ls (
%)
ALDH(%) ALDH(%)
G2:
Glu
t3+ m
emG
rp78
+
G3:
Glu
t3- m
emG
rp78
+
G4:
Glu
t3- m
emG
rp78
-
G1:
Glu
t3+ C
D13
3-
G2:
Glu
t3+ C
D13
3+
G3:
Glu
t3- C
D13
3+
G4:
Glu
t3- C
D13
3-
Supplementary Fig. S2
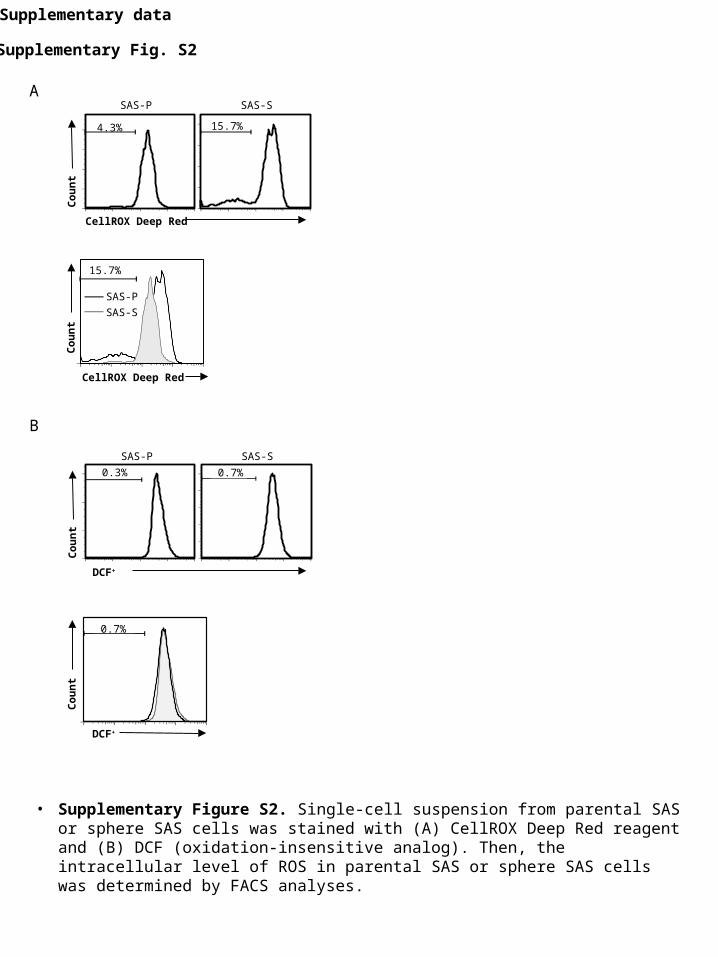
• Supplementary Figure S2. Single-cell suspension from parental SAS or sphere SAS cells was stained with (A) CellROX Deep Red reagent and (B) DCF (oxidation-insensitive analog). Then, the intracellular level of ROS in parental SAS or sphere SAS cells was determined by FACS analyses.
Supplementary data
A
CellROX Deep Red
Co
un
t
SAS-P SAS-S
15.7%
SAS-P
SAS-S
Co
un
t
15.7%4.3%
CellROX Deep Red
0.7%
Co
un
t DCF+
B
DCF+
Co
un
t
SAS-P SAS-S
0.7%0.3%
Supplementary Fig. S3
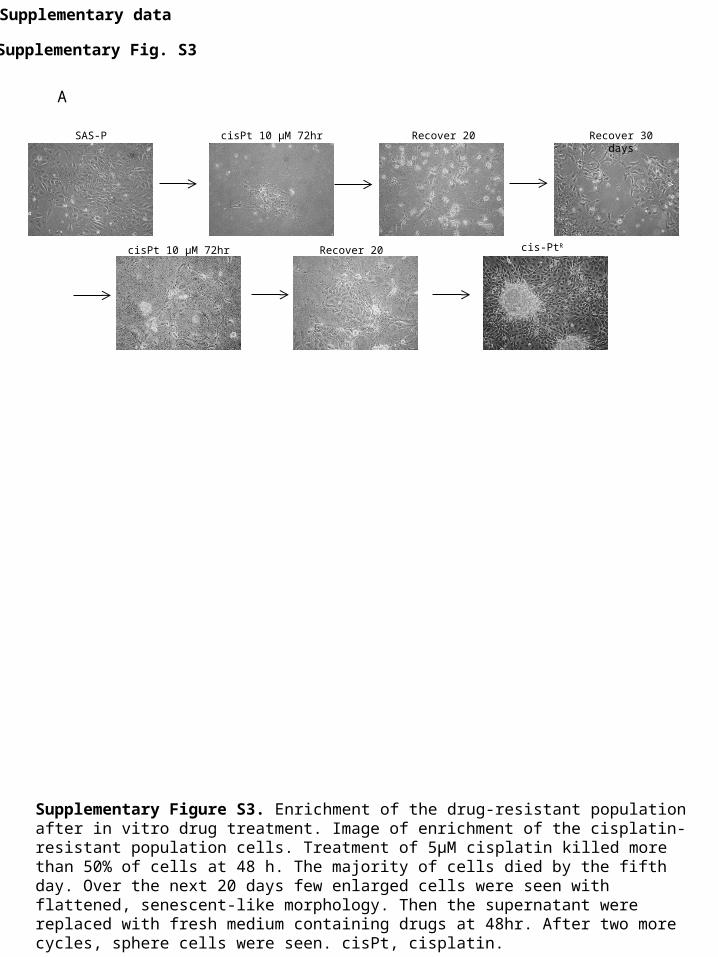
Supplementary Figure S3. Enrichment of the drug-resistant population after in vitro drug treatment. Image of enrichment of the cisplatin-resistant population cells. Treatment of 5µM cisplatin killed more than 50% of cells at 48 h. The majority of cells died by the fifth day. Over the next 20 days few enlarged cells were seen with flattened, senescent-like morphology. Then the supernatant were replaced with fresh medium containing drugs at 48hr. After two more cycles, sphere cells were seen. cisPt, cisplatin.
Supplementary data
cis-PtR cisPt 10 µM 72hr Recover 20 days
cisPt 10 µM 72hrSAS-P Recover 20 days Recover 30 days
A
Supplementary Fig. S4
Supplementary data
A
control H2O2 Arsenic
ROSLow
B SAS-S
RO
SL
ow
RO
SM
ed
iR
OS
Hig
h
0102030405060
% S
pher
e-fo
rmat
ion
effic
ienc
y
ROSLow
ROSMedi
ROSHigh
******
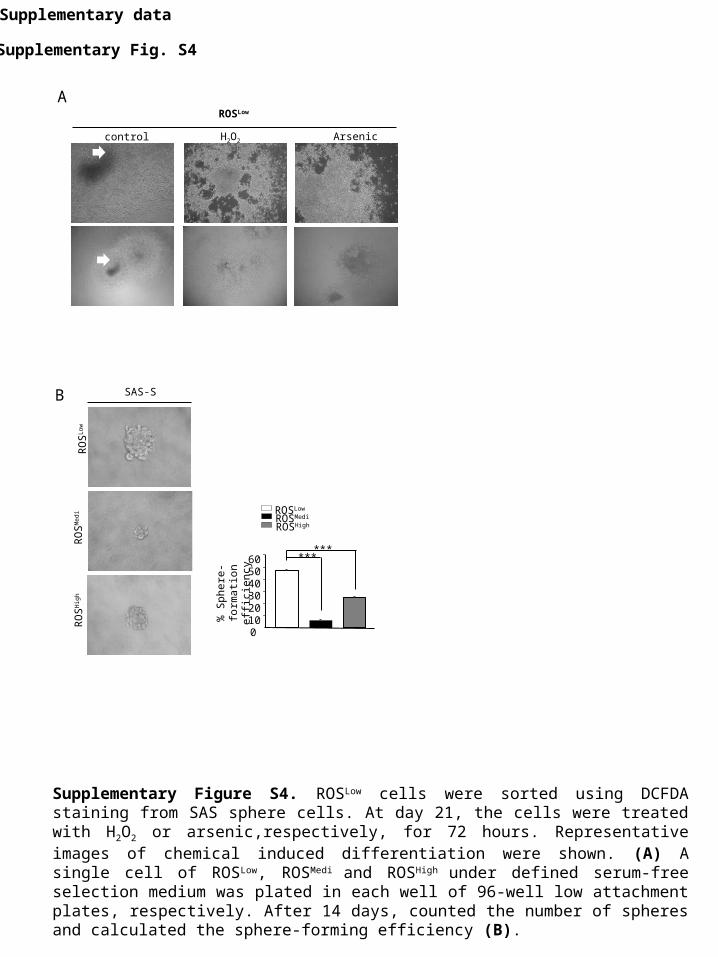
Supplementary Figure S4. ROSLow cells were sorted using DCFDA staining from SAS sphere cells. At day 21, the cells were treated with H2O2 or arsenic,respectively, for 72 hours. Representative images of chemical induced differentiation were shown. (A) A single cell of ROSLow, ROSMedi and ROSHigh under defined serum-free selection medium was plated in each well of 96-well low attachment plates, respectively. After 14 days, counted the number of spheres and calculated the sphere-forming efficiency (B).
Supplementary Fig. S5
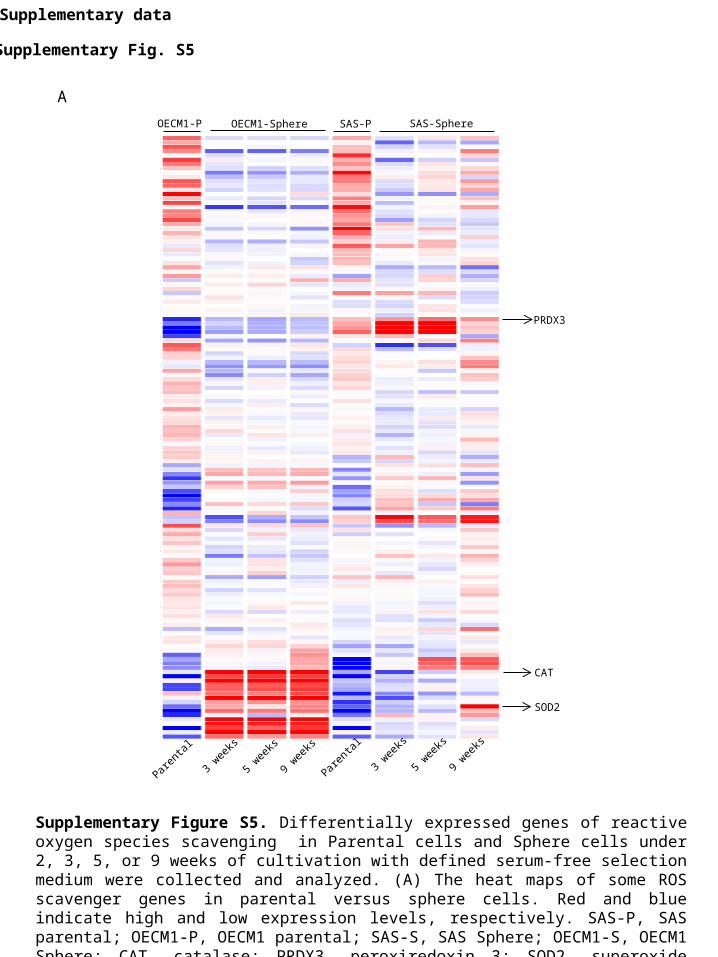
Supplementary Figure S5. Differentially expressed genes of reactive oxygen species scavenging in Parental cells and Sphere cells under 2, 3, 5, or 9 weeks of cultivation with defined serum-free selection medium were collected and analyzed. (A) The heat maps of some ROS scavenger genes in parental versus sphere cells. Red and blue indicate high and low expression levels, respectively. SAS-P, SAS parental; OECM1-P, OECM1 parental; SAS-S, SAS Sphere; OECM1-S, OECM1 Sphere; CAT, catalase; PRDX3, peroxiredoxin 3; SOD2, superoxide dismutase 2.
Supplementary data
A
OECM1-P
SOD2
CAT
PRDX3
SAS-P SAS-SphereOECM1-Sphere
Paren
tal
3 wee
ks
5 wee
ks
9 wee
ks
Paren
tal
3 wee
ks
5 wee
ks
9 wee
ks
B
Supplementary Fig. S6
Supplementary data
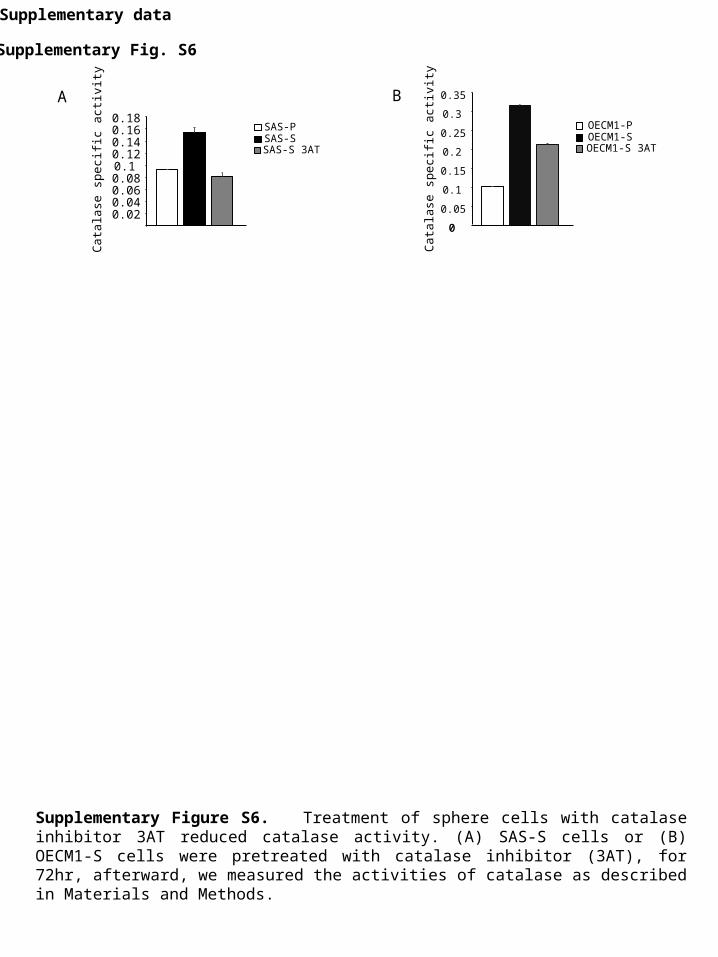
Supplementary Figure S6. Treatment of sphere cells with catalase inhibitor 3AT reduced catalase activity. (A) SAS-S cells or (B) OECM1-S cells were pretreated with catalase inhibitor (3AT), for 72hr, afterward, we measured the activities of catalase as described in Materials and Methods.
A
SAS-PSAS-SSAS-S 3AT
Cat
ala
se s
pec
ific
act
ivity
0.020.040.060.080.10.120.140.160.18
00
0.05
0.1
0.15
0.2
0.25
0.3
0.35
Cat
ala
se s
pec
ific
act
ivity
OECM1-POECM1-SOECM1-S 3AT
5.7%7.6%
6.8%8.3%
1.5%
21.8%13.0%
SAS-SControl cisPt
2ME 2ME +cisPt
3AT + cisPt3AT
3AT + 2ME + cisPt
Co
un
t DCFDA
B
6.4% 18.2%
7.0%
68.5%
5.6 12.8%
5.6%
76.0%
SAS-SControl cisPt
2ME 2ME + cisPt
3AT + cisPt3AT
3AT + 2ME + cisPt10.0% 42.9%
11.9%
35.2%
3.5% 8.1%
4.3%
84.1%
4.2% 14.9%
7.0%
74.0%
5.6% 20.8%
13.1%
60.5%
5.3% 17.3%
9.7%
67.6%
Pro
pid
ium
io
did
e(P
I)+
AnnexinV
Supplementary Fig. S7
Supplementary data
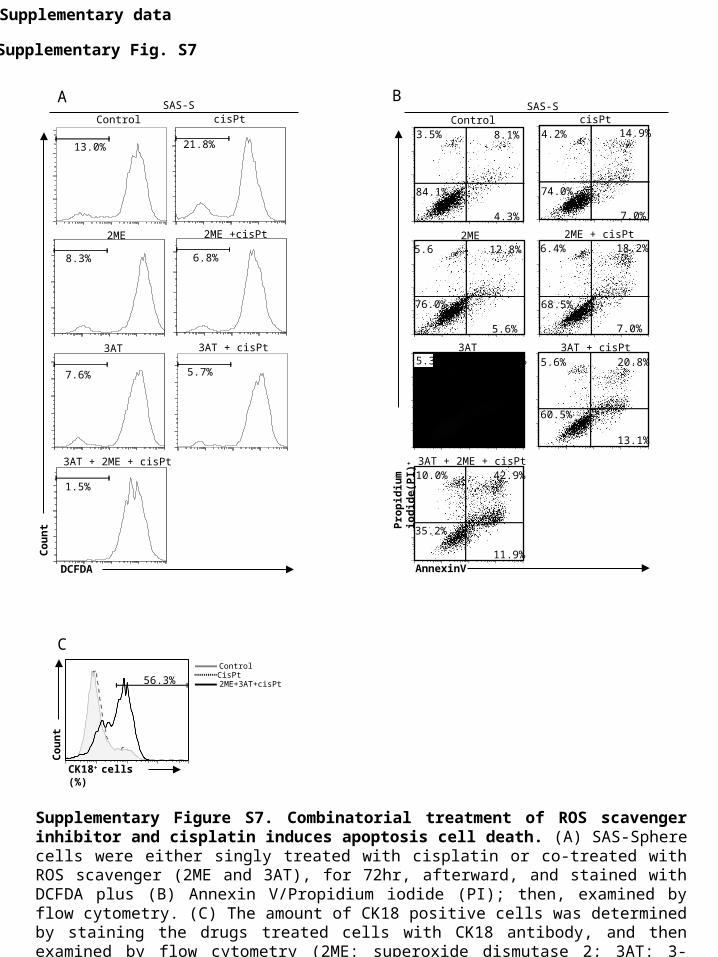
Supplementary Figure S7. Combinatorial treatment of ROS scavenger inhibitor and cisplatin induces apoptosis cell death. (A) SAS-Sphere cells were either singly treated with cisplatin or co-treated with ROS scavenger (2ME and 3AT), for 72hr, afterward, and stained with DCFDA plus (B) Annexin V/Propidium iodide (PI); then, examined by flow cytometry. (C) The amount of CK18 positive cells was determined by staining the drugs treated cells with CK18 antibody, and then examined by flow cytometry (2ME: superoxide dismutase 2; 3AT: 3-Amino-1,2,4-triazole).
A
Co
un
t
56.3% 2ME+3AT+cisPt
ControlCisPt
CK18+ cells (%)
C
B
Supplementary Fig. S8
Supplementary data
A
CD44(%)
45.9% 28.0% 33.5%
25.7% 32.9%
shLuc
shSOD2#1 shSOD2#2
shCAT#1 shCAT#2
Co
un
t
C
D
Sph
ere
No
shLu
csh
SO
D2
shC
AT
SAS-S
02468101214161820
SAS-S
shLucshCAT#1shCAT#2shSOD2#1shSOD2#2
0510152025303540
SAS-S
shLucshCAT#1shCAT#2shSOD2#1shSOD2#2
05101520253035404550
SAS-S
shLucshCAT#1shCAT#2shSOD2#1shSOD2#2
RO
SL
ow c
ells
(%
)
Ck1
8 ce
lls (
%)
CD
44 c
ells
(%
)
Col
ony
No
shLu
csh
SO
D2
shC
AT
SAS-S
0
10
20
30
40
50
60
70
shLucshCATshSOD2
0
5
10
15
20
25
30
shLucshCATshSOD2
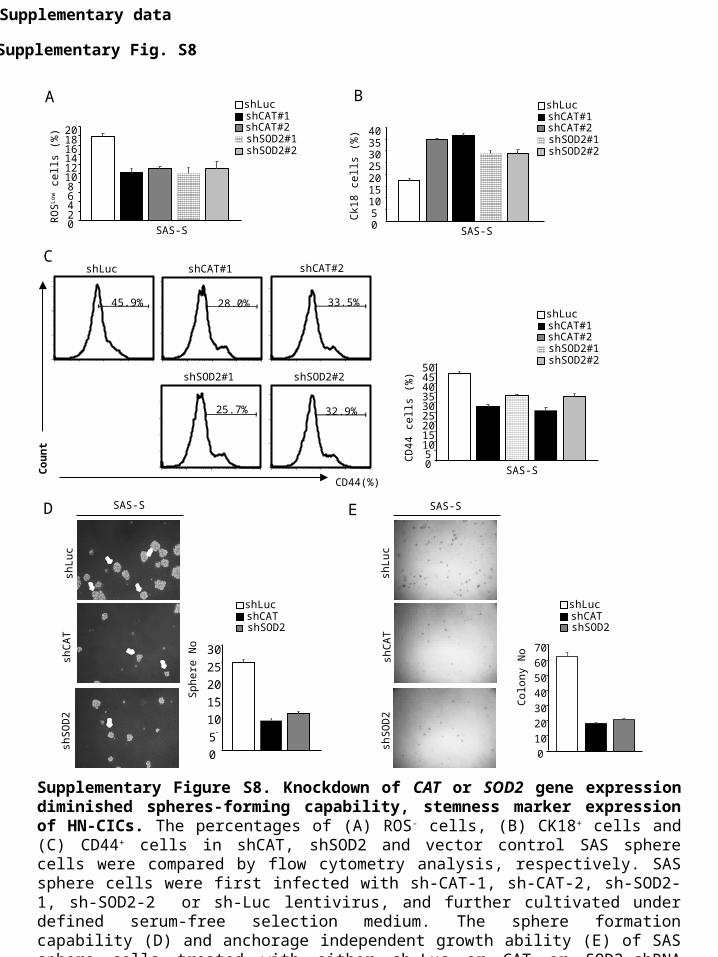
Supplementary Figure S8. Knockdown of CAT or SOD2 gene expression diminished spheres-forming capability, stemness marker expression of HN-CICs. The percentages of (A) ROS- cells, (B) CK18+ cells and (C) CD44+ cells in shCAT, shSOD2 and vector control SAS sphere cells were compared by flow cytometry analysis, respectively. SAS sphere cells were first infected with sh-CAT-1, sh-CAT-2, sh-SOD2-1, sh-SOD2-2 or sh-Luc lentivirus, and further cultivated under defined serum-free selection medium. The sphere formation capability (D) and anchorage independent growth ability (E) of SAS sphere cells treated with either sh-Luc or CAT or SOD2-shRNA lentivirus were examined by microscope.
E
Supplementary Fig. S9
Supplementary data
22.3%16.8%
PEG-Control PEG-CAT
memGrp78(%)
SAS-S
SS
C
16.3%
PEG-Control PEG-CAT
ROS(%)
SAS-S
SS
C
24.6%
A
C
0
5
10
15
20
25
30
SAS-S
PEG-ControlPEG-CAT***
RO
SL
ow c
ells
(%
)
***
0
5
10
15
20
25
SAS-S
me
mG
rp78
cel
ls (
%)
PEG-ControlPEG-CAT
29.6%
OECM1-S 3AT
43.8%
OECM1-S
54.8%
OECM1-S PEG-CAT
47.8%
SAS-S
60.6%
SAS-S PEG-CAT
41.9%
SAS-S 3AT
Co
un
t
D
CD44(%)
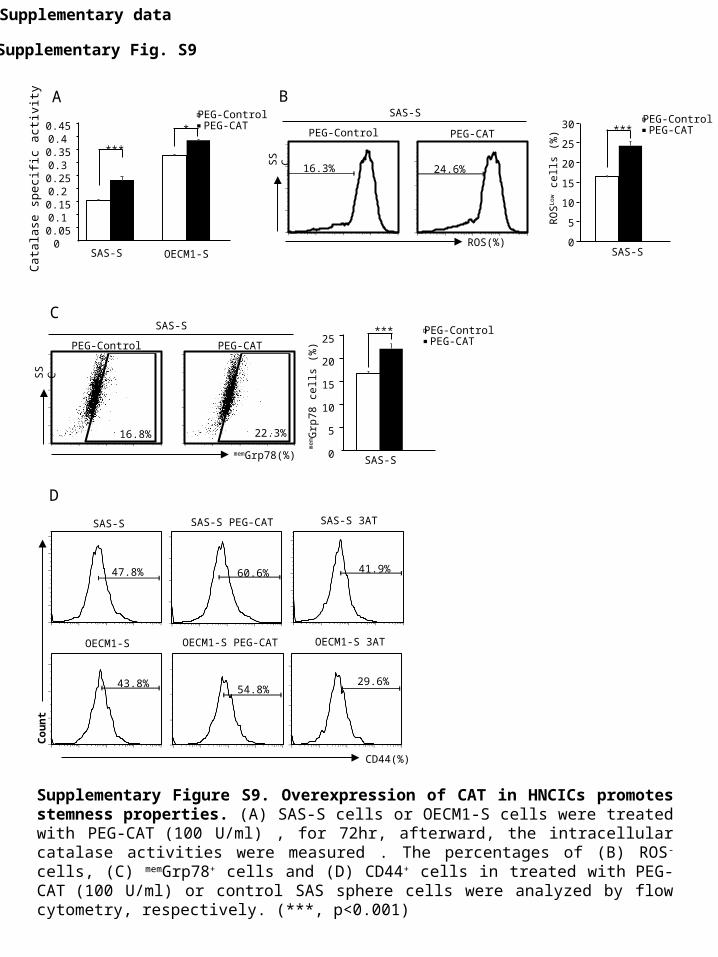
Supplementary Figure S9. Overexpression of CAT in HNCICs promotes stemness properties. (A) SAS-S cells or OECM1-S cells were treated with PEG-CAT (100 U/ml) , for 72hr, afterward, the intracellular catalase activities were measured . The percentages of (B) ROS- cells, (C) memGrp78+ cells and (D) CD44+ cells in treated with PEG-CAT (100 U/ml) or control SAS sphere cells were analyzed by flow cytometry, respectively. (***, p<0.001)
00.050.10.150.20.250.30.350.40.45
***
*
B
Cat
ala
se s
pec
ific
act
ivity
SAS-S OECM1-S
PEG-ControlPEG-CAT
Supplementary Fig. S10
Supplementary data
A
OECM1-P PEG-CAT
37.8%17.2%
30.3%12.0%
OECM1-P PEG-Control
SAS-P PEG-Control SAS-P PEG-CAT
Co
un
t
ALDH(%)05
1015202530354045
SAS-P OECM1-P
PEG-ControlPEG-CAT
ALD
H c
ells
(%
)
***
***
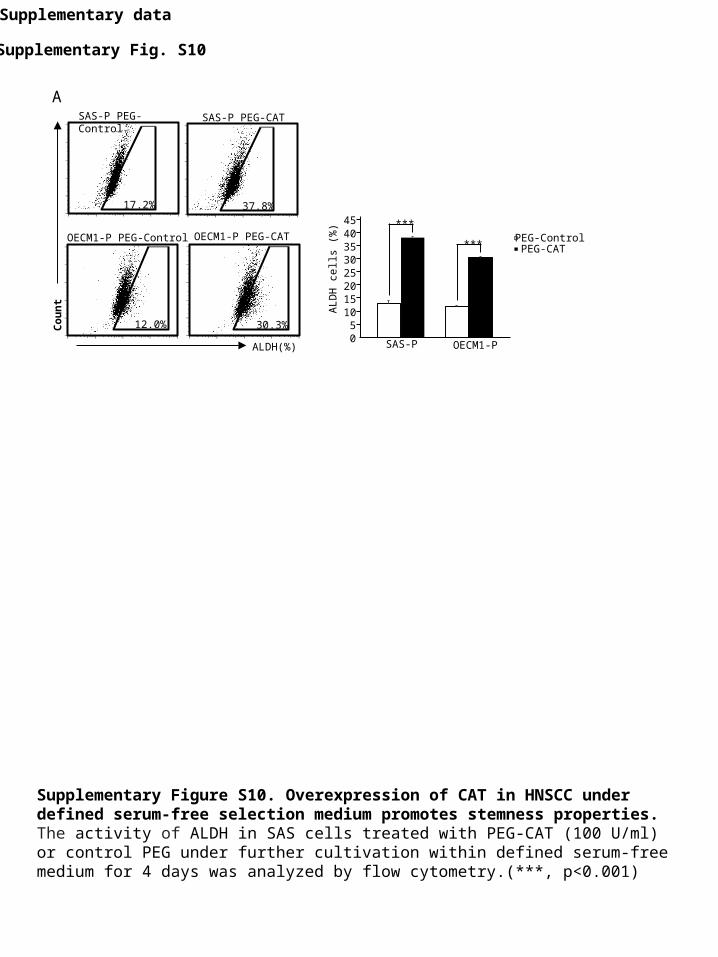
Supplementary Figure S10. Overexpression of CAT in HNSCC under defined serum-free selection medium promotes stemness properties. The activity of ALDH in SAS cells treated with PEG-CAT (100 U/ml) or control PEG under further cultivation within defined serum-free medium for 4 days was analyzed by flow cytometry.(***, p<0.001)
Supplementary Fig. S11
Supplementary data
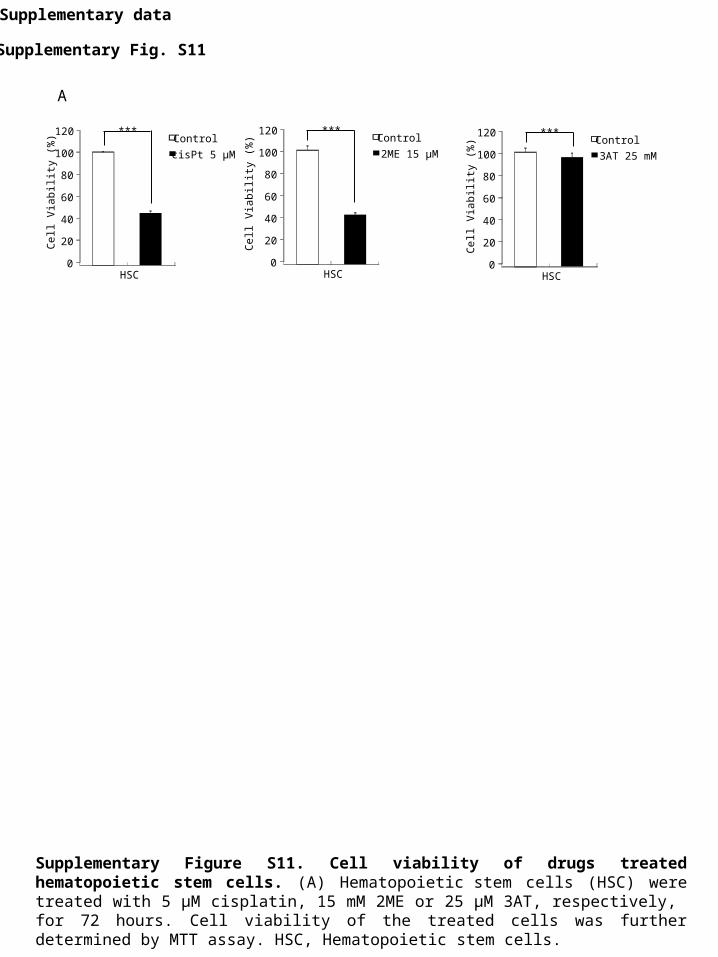
Supplementary Figure S11. Cell viability of drugs treated hematopoietic stem cells. (A) Hematopoietic stem cells (HSC) were treated with 5 µM cisplatin, 15 mM 2ME or 25 µM 3AT, respectively, for 72 hours. Cell viability of the treated cells was further determined by MTT assay. HSC, Hematopoietic stem cells.
A
Cel
l Via
bilit
y (%
)
***
0
20
40
60
80
100
120Control
cisPt 5 µM
HSC
***
0
20
40
60
80
100
120Control
2ME 15 µM
HSC
***
0
20
40
60
80
100
120Control
3AT 25 mM
HSC
Cel
l Via
bilit
y (%
)
Cel
l Via
bilit
y (%
)