Embed Size (px)
Citation preview

Supplementary Information for the ITS-90: Section 1: Introduction
1 / 19
Supplementary Information for the ITS-90
Section 1: Introduction
B Fellmuth
Physikalisch-Technische Bundesanstalt, Berlin, Germany
1 Scope
From 1927 to 1975, the various International Temperature Scales (ITSs) have
incorporated a moderate amount of supplementary information concerning their practical
realization. However, limitations of space prevented this information from being
exhaustive. Furthermore, the lengthy periods between scale editions, ranging from
seven to twenty-one years, have caused much of it to become outdated. The low
temperature scale of 1976 (Echelle Provisoire de Température de 1976, EPT-76) is the
first one, which provided no such information. Supplementary information was instead
given in a more extensive and comprehensive form in a separate document, containing
information on both the EPT-76 and the International Practical Temperature Scale of
1968, IPTS-68. For the International Temperature Scale of 1990, ITS-90, such an
accompanying document was prepared by Working Group 1 of the CCT and approved by
the CCT.
The Supplementary Information for the ITS-90 describes methods by which the
ITS-90 can be realized successfully. However, the document should not be taken as laying
down how this must be done. The description of any particular apparatus is more for
illustration than prescription, and considerable variations can often be effective. Likewise,
quoted numerical data and dimensions are mostly for guidance only. Methods of realizing
the scale will continue to evolve, and this will be reflected in periodic revisions of the text.
Techniques for the realization of the defining fixed points of the ITS-90, excluding the
vapour-pressure points, and for the comparison of fixed-point cells, at the highest level of
accuracy, have been recommended by Working Group 1 in [Mangum et al. 2000] and
[Mangum et al. 1999], respectively.
Though many new methods for realizing the base unit kelvin, including the
measurement of thermodynamic temperature, and new temperature fixed points have been
developed, the Supplementary Information for the ITS-90 strictly deals only with the
realization of the ITS-90 according to its definition. Some references for new or
alternative methods are given as background information in a few chapters. A description
of such methods can be found in the companion document CCT Guidelines on
Approximating Methods to the ITS-90 and the PLTS-2000 [CCT Guidelines] Future
versions of the Mise en Pratique for the Definition of the Kelvin (MeP-K) will endorse
multiple methods for the realization of the kelvin [Ripple et al. 2010]. However, a
diversity of endorsements could lead to the risk that reported temperature values may be
ambiguous, so proper notation and an explanation of the methods used will be required.

Supplementary Information for the ITS-90: Section 1: Introduction
2 / 19
2 Historical background
The ITS-90 [CIPM 1989, Preston-Thomas 1990] has evolved from a series of earlier ITSs.
These were formulated so as to allow measurements of temperature to be made accurately
and reproducibly, with temperatures measured on these scales being as close an
approximation as possible to the corresponding thermodynamic temperatures. A full
description of these scales, together with a historical review, can be found in, for example,
[Quinn 1990]. A brief description of several of the scales is also given in the appendix to
the text of the ITS-90. This description is reproduced here accompanied by some
explanations. In addition, details of three further scales (Normal Hydrogen Scale, ITS-90,
and PLTS-2000) are discussed, with special emphasis laid on the structure, the
thermodynamic basis, the uncertainty, and the reproducibility of the ITS-90. The historical
background should aid in understanding the methods applied for the two scales currently
in effect (ITS-90 and PLTS-2000). Finally, ideas are added on a possible improvement of
the ITS by establishing a new ITS-XX, which is a long-term task. This should especially
illustrate the deficiencies of the ITS-90, which may be of interest for special applications.
2.1 Normal Hydrogen Scale
The Normal Hydrogen Scale was adopted by the International Committee for Weights and
Measures (CIPM) at its sixth session, and was subsequently approved by the first General
Conference on Weights and Measures (CGPM) [CGPM 1889]. This temperature scale had
been developed by Chappuis in the laboratories of the International Bureau of Weights
and Measures (BIPM). It was based on gas thermometer measurements using the ice and
steam points at 0 °C and 100 °C as fixed points, and was transferred to mercury-in-glass
thermometers for distribution to other laboratories. At that time, the temperature range of
this scale was from –25 degrees centigrade to +100 degrees centigrade, a range that was
gradually extended in subsequent years. In 1913, the fifth CGPM approved the use of
gases other than hydrogen, and expressed its readiness to substitute thermodynamic
temperatures in place of the Normal Hydrogen Scale as soon as that became practicable.
2.2 International Temperature Scale of 1927 (ITS-27)
The seventh CGPM adopted provisionally, pending the acquisition of better
thermodynamic data, the International Temperature Scale of 1927 [CGPM 1927], to
overcome the practical difficulties of the direct realization of thermodynamic temperatures
by gas thermometry, and as a universally acceptable replacement for the differing existing
national temperature scales. The ITS-27 was based upon a number of reproducible
temperatures, or fixed points, to which numerical values were assigned, and three standard
instruments, each of the instruments being calibrated at one or more of the fixed points.
The calibrations gave the constants for the formulae that defined temperatures in the
various temperature ranges. A platinum resistance thermometer (PRT) was used for the
lowest temperature range, a platinum10%rhodium-platinum (Pt10%Rh-Pt) thermocouple
for the middle range, and an optical pyrometer for the highest range.
The fixed points for the PRT range were the melting point of ice (0.000 °C) and the
boiling points of oxygen, water and sulphur, defined as –182.97 °C, 100.000 °C, and
444.60 °C, respectively. The resistance-temperature interpolating formulae were the
Callendar equation between 0 °C and 660 °C and the Callendar-van Dusen equation

Supplementary Information for the ITS-90: Section 1: Introduction
3 / 19
between –190 °C and 0 °C. The permitted range of the constants of these formulae
imposed some degree of quality control in the thermometer construction.
The fixed points for the Pt10%Rh-Pt thermocouple range were the melting points
of silver and gold, defined as 960.5 °C and 1063 °C, respectively, while a third calibration
point (not a fixed) was the freezing point of antimony (630.5 °C) as measured by a
calibrated PRT. The EMF-temperature interpolating formula was a quadratic that defined
temperatures between 660 °C and 1063 °C. The permitted ranges of the constants imposed
a degree of quality control on the composition of the thermocouple wires.
Both the lower and upper limits of the temperature range assigned to the PRT were
significant extensions beyond the associated calibration temperatures of approximately
90 K and 444 °C. One awkward result of the upper extension was the non-existence of an
official freezing temperature for aluminium. This freezing temperature was extremely
close to the assigned changeover point of 660 °C. However, it proved to be a little above
the assigned upper limit of the PRT, yet a little below the, supposedly identical, lower
limit assigned to the Pt10%Rh-Pt thermocouple. At the other end of the PRT range, it was
found that for temperatures significantly below the lowest calibration temperature,
departures from thermodynamic temperatures were unacceptably high.
The fixed point for the optical pyrometer was the melting point of gold, which was
used in conjunction with the (approximate) Wien radiation law relating spectral
concentration of radiance to temperature. The value assigned to the second radiation
constant c2 was 1.432 × 10⁻² m K (c1 disappears in the comparison between the unknown
and the calibration temperatures). Wavelength restrictions were the use of "visible"
monochromatic radiation with T ≤ 3 × 10⁻³ m K. The various errors arising from the use
of the Wien law as well as from the values assigned to the gold point and to c2 were not in
general significant for, or even detectable by, the users of that period.
2.3 International Temperature Scale of 1948 (ITS-48)
The ninth CGPM adopted the International Temperature Scale of 1948 [CGPM 1948].
Changes from the ITS-27 were:
the lower limit of the PRT range was changed from –190 °C to the defined oxygen
boiling point of –182.97 °C;
the junction of this range and the thermocouple range became the measured antimony
freezing point (about 630 °C) instead of 660 °C;
the silver freezing point was defined as being 960.8 °C instead of 960.5 °C;
the gold freezing point replaced the gold melting point (1063 °C);
the Wien law was replaced by the Planck radiation law;
the value assigned to the second radiation constant became 1.438 × 10⁻² m K;
the permitted ranges for the constants in the interpolating formulae for the PRTs and
thermocouples were modified;
the limitation on T for optical pyrometry (T < 3 × 10⁻³ m K) was changed to the
requirement that "visible" radiation be used.
Supplementary Information for the ITS-90: Section 1: Introduction
4 / 19
2.4 International Practical Temperature Scale of 1948, amended edition of 1960
(IPTS-48)
The eleventh CGPM adopted the International Practical Temperature Scale of 1948,
amended edition of 1960 [CGPM 1960]. The modifications to the ITS-48 were:
the triple point of water, which in 1954 had become the sole point defining the unit of
thermodynamic temperature, the kelvin, replaced the melting point of ice as the
calibration point in this region;
the freezing point of zinc, defined as 419.505 °C, became a preferred alternative to
the sulphur boiling point (444.6 °C) as a calibration point;
the permitted ranges of the constants of the interpolation formulae for the platinum
resistance thermometers and the thermocouples were further modified;
the restriction to "visible" radiation for optical pyrometry was removed.
Inasmuch as the numerical values of temperature on the ITS-48 were the same as on the
IPTS-48, the latter was not a revision of the scale of 1948 but merely an amended form of
it.
2.5 International Practical Temperature Scale of 1968 (IPTS-68)
In 1968 the CIPM promulgated the International Practical Temperature Scale of 1968,
having been invited to do so by the thirteenth CGPM of 1967-68 [CGPM 1967-68]. The
IPTS-68 incorporated very extensive changes from the IPTS-48. These included
numerical changes, intended to bring it more nearly in accord with thermodynamic
temperatures, which were sufficiently large to be apparent to many users. Other changes
were as follows:
the lower limit of the scale was extended down to 13.81 K;
at even lower temperatures (0.5 K to 5.2 K) the use of the 1958 4He vapour pressure
scale [Brickwedde et al. 1960] and the 1962 3He vapour pressure scale [Sydoriak
et al. 1964] were recommended;
six new fixed points were introduced: the triple point of equilibrium hydrogen
(13.81 K), an intermediate equilibrium-hydrogen vapour-pressure point (17.042 K),
the boiling point of equilibrium hydrogen (20.28 K), the boiling point of neon
(27.102 K), the triple point of oxygen (54.361 K), and the freezing point of tin
(231.9681 °C), which became a permitted alternative to the boiling point of water;
the boiling point of sulphur was deleted;
the values assigned to four fixed points were changed: the boiling point of oxygen
(90.188 K), the freezing point of zinc (419.58 °C), the freezing point of silver
(961.93 °C), and the freezing point of gold (1064.43 °C);
the interpolating formulae for the resistance thermometer range became very much
more complex;
the value assigned to c2 became 1.4388 × 10⁻² m K;
the permitted ranges of the constants for the interpolation formulae for the platinum
resistance thermometers and thermocouples were again modified.

Supplementary Information for the ITS-90: Section 1: Introduction
5 / 19
2.6 International Temperature Scale of 1968, amended edition of 1975
(IPTS-68(75))
The International Practical Temperature Scale of 1968, amended edition of 1975 [CGPM
1975, Preston-Thomas 1976], was adopted by the fifteenth CGPM in 1975. As was the
case for the IPTS-48 vis-à-vis the ITS-48, the IPTS-68(75) introduced no numerical
changes in any measured temperature T68. Most of the extensive textual changes in the
scale were intended only to clarify and simplify its use. More substantive changes were:
the condensation point of oxygen replaced, with no change in numerical value, the
boiling point of oxygen;
the triple point of argon (83.798 K) was introduced as a permitted alternative to the
condensation point of oxygen;
new values of the isotopic composition of naturally occurring neon were adopted;
the recommendation to use the helium vapour pressure scales was withdrawn.
2.7 Echelle Provisoire de Température de 1976 (EPT-76)
The 1976 Provisional 0.5 K to 30 K Temperature Scale, EPT-76 [BIPM 1979], was
adopted in order to provide an agreed basis for thermometry in that temperature range. It
was intended in particular to:
provide a smooth interpolation in place of the erratic interpolation below 27 K, which
had been found in the IPTS-68, and thus, substantially reduce the errors (with respect
to corresponding thermodynamic values);
correct the thermodynamic errors in the 1958 4He and 1962 3He vapour pressure
scales;
bridge the gap between 5.2 K and 13.81 K, in which there had not previously been an
international scale.
Other objectives in devising the EPT-76 were "that it should be thermodynamically
smooth, that it should be continuous with the IPTS-68 at 27.1 K, and that it should agree
with thermodynamic temperature T as closely as these two conditions allow". In contrast
with the IPTS-68, and to ensure its rapid adoption, several methods of realizing the
EPT-76 were approved. These included
using a thermodynamic interpolation instrument and one or more of eleven listed
reference points (that included five superconductive transitions);
taking differences from the IPTS-68 above 13.81 K;
taking differences from helium vapour pressure scales below 5 K;
taking differences from certain well-established laboratory scales.
To the extent that these methods lacked internal consistency it was admitted that slight
differences between realizations might be introduced. However the advantages to be
gained by adopting the EPT-76 as a working scale until such time as the IPTS-68 was
revised and extended were considered to outweigh the disadvantages [Durieux et al. 1979,
Pfeiffer and Kaeser 1982].

Supplementary Information for the ITS-90: Section 1: Introduction
6 / 19
2.8 International Temperature Scale of 1990 (ITS-90)
The International Temperature Scale of 1990 was adopted by the CIPM in 1989 [CIPM
1989] in accordance with the request embodied in Resolution 7 of the 18th CGPM
[CGPM 1987] and came into effect on 1 January 1990. The full text of the ITS-90 is
available on the BIPM website; the following excerpt (the introduction to Section 3 of the
text of the ITS-90) constitutes a brief description:
Between 0.65 K and 5.0 K, T90 is defined in terms of the vapour-pressure temperature
relations of 3He and 4He.
Between 3.0 K and the triple point of neon (24.5561 K), T90 is defined by means of a
helium gas thermometer calibrated at three experimentally realizable temperatures
having assigned numerical values (defining fixed points) and using specified
interpolation procedures.
Between the triple point of equilibrium hydrogen (13.8033 K) and the freezing point
of silver (1234.93 K), T90 is defined by means of PRTs calibrated at specified sets of
defining fixed points and using specified interpolation procedures.
Above the freezing point of silver (1234.93 K), T90 is defined in terms of a defining
fixed point and the Planck radiation law.
The ITS-90 differs from the IPTS-68 in a number of important respects:
It extends to lower temperature, 0.65 K instead of 13.8 K, and hence also replaces the
EPT-76 from 0.65 K to 30 K. The range was limited to 0.65 K for the simple reason
that it did not seem possible to measure 3He vapour pressures below 100 Pa with the
small relative uncertainty of order 0.1 % to achieve an uncertainty of T90 of 0.1 mK.
In most ranges, it is in closer agreement with thermodynamic temperatures.
It has improved continuity and accuracy.
It has a number of overlapping ranges and sub-ranges, and in certain ranges it has
alternative but substantially equivalent definitions.
New versions of the helium vapour-pressure scales are not merely recommended but
are an integral part of the scale.
It includes a gas thermometer, calibrated at three fixed points, as one of the defining
instruments.
The upper limit of the PRT as the defining instrument has been raised from 630 °C to
the silver point (961.78 °C).
The Pt10%Rh-Pt thermocouple is no longer a defining instrument of the scale, and
thus the slope discontinuity, which existed in IPTS-68 at 630 °C, the junction
between the PRT and thermocouple ranges, has been removed.
The range based upon the Planck radiation law begins at the silver point instead of at
the gold point, and any one of the silver, gold or copper freezing points may be
selected as the reference point for this part of the scale.
The design of the ITS-90 is shown schematically in Figure 1, and the list of defining fixed points is given in Table 1. The thermodynamic basis of ITS-90 is described in [Rusby et al. 1991]. The estimation of the uncertainty of realizing the fixed points suffers from the fact that complete uncertainty budgets treating the influence of impurities, as recommended

Supplementary Information for the ITS-90: Section 1: Introduction
7 / 19
Gas thermometer
Radiation thermometerPlatinum resistance thermometer
Platinum resistance thermometerGas thermometer
He vapour pressure
3He
4He I4He II
0.65 K 3 K2.18 K1.25 K 3.2 K
0.65 K
5 K
5 K3 K17 K
14 K
20 K
25 K 54 K 84 K
30 C0 C-39 C 157 C 232 C 420 C 660 C 962 C 1064 C 1085 C
273.16 K234 K
in [Fellmuth et al. 2005], are available only in rare cases. Therefore, two different estimates are given in Table 1. The larger u(T90) values are, except for the vapour-pressure points and the freezing points of Au and Cu, standard deviations of the results of international inter-comparisons of fixed-point realizations: e-H2, Ne, O2, Ar: Star intercomparison of sealed triple-point cells [Fellmuth et al. 2012]; Hg to Zn: Key comparison CCT-K3 [Mangum et al. 2002]; Al and Ag: Key comparison CCT-K4 [Nubbemeyer and Fischer 2002]; H2O: Key comparison CCT-K7 [Stock et al. 2006]. Key comparison CCT-K3 was performed using PRTs as transfer standards; thus, the uncertainty values may be larger due to the possible instability of the PRTs. For the vapour-pressure points, average published values are listed. The smaller u(T90) values given in parenthesis are the smallest uncertainty estimates claimed by metrological institutes. The estimates given for the freezing points of Au and Cu, which are only used for the calibration of radiation thermometers, are based on a document published by Working Group 5 of the CCT [Fischer et al. 2003], where the larger value corresponds to the “normal value”, and the smaller one to the “best value”. The values T – T90 are estimates of the differences between thermodynamic temperatures and the ITS-90, and u(T – T90) are their uncertainties, as published by Working Group 4 of the CCT in [Fischer et al. 2011] and summarised in Section 4 of the MeP-K. In these documents, interpolation functions for T – T90 are also given.
Figure 1. Schematic representation of the ranges, sub-ranges and interpolation
instruments of ITS-90. The temperatures shown are approximate only.
Supplementary Information for the ITS-90: Section 1: Introduction
8 / 19
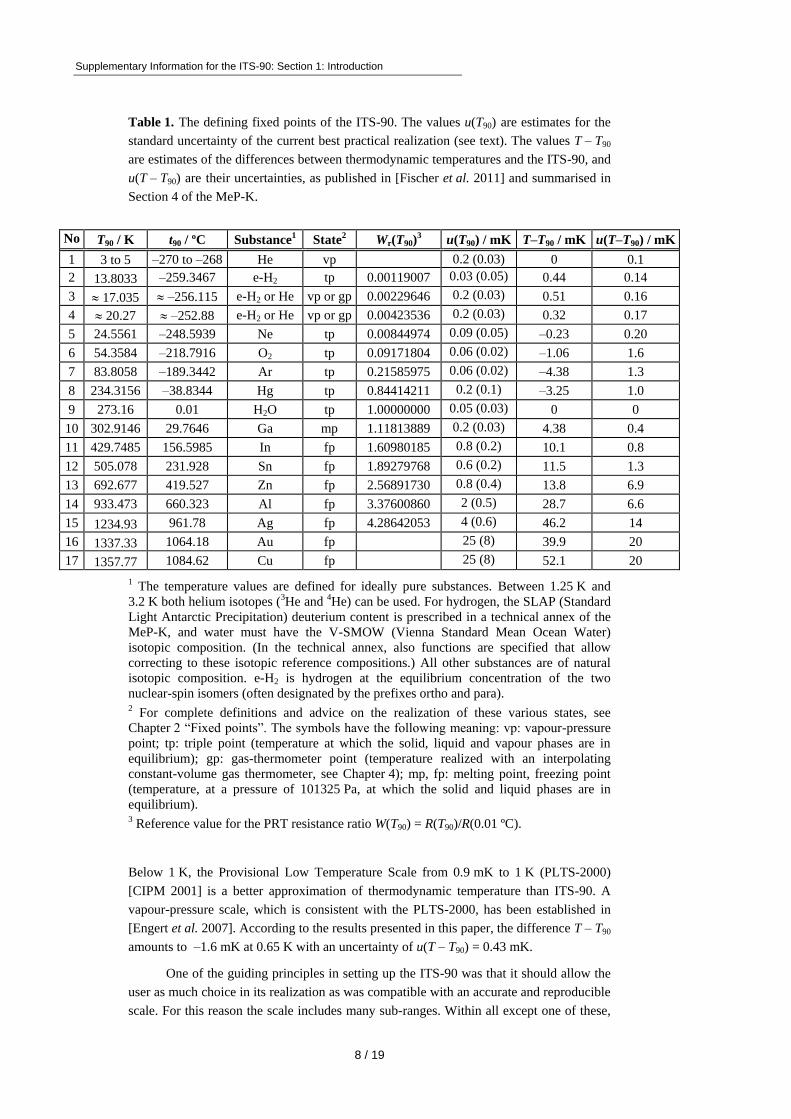
Table 1. The defining fixed points of the ITS-90. The values u(T90) are estimates for the
standard uncertainty of the current best practical realization (see text). The values T – T90
are estimates of the differences between thermodynamic temperatures and the ITS-90, and
u(T – T90) are their uncertainties, as published in [Fischer et al. 2011] and summarised in
Section 4 of the MeP-K.
No
. T90 / K t90 / ºC Substance
1 State
2 Wr(T90)
3 u(T90) / mK T–T90 / mK u(T–T90) / mK
1 3 to 5 –270 to –268 He vp 0.2 (0.03) 0 0.1
2 13.8033 –259.3467 e-H2 tp 0.00119007 0.03 (0.05) 0.44 0.14
3 17.035 –256.115 e-H2 or He vp or gp 0.00229646 0.2 (0.03) 0.51 0.16
4 20.27 –252.88 e-H2 or He vp or gp 0.00423536 0.2 (0.03) 0.32 0.17
5 24.5561 –248.5939 Ne tp 0.00844974 0.09 (0.05) –0.23 0.20
6 54.3584 –218.7916 O2 tp 0.09171804 0.06 (0.02) –1.06 1.6
7 83.8058 –189.3442 Ar tp 0.21585975 0.06 (0.02) –4.38 1.3
8 234.3156 –38.8344 Hg tp 0.84414211 0.2 (0.1) –3.25 1.0
9 273.16 0.01 H2O tp 1.00000000 0.05 (0.03) 0 0
10 302.9146 29.7646 Ga mp 1.11813889 0.2 (0.03) 4.38 0.4
11 429.7485 156.5985 In fp 1.60980185 0.8 (0.2) 10.1 0.8
12 505.078 231.928 Sn fp 1.89279768 0.6 (0.2) 11.5 1.3
13 692.677 419.527 Zn fp 2.56891730 0.8 (0.4) 13.8 6.9
14 933.473 660.323 Al fp 3.37600860 2 (0.5) 28.7 6.6
15 1234.93 961.78 Ag fp 4.28642053 4 (0.6) 46.2 14
16 1337.33 1064.18 Au fp 25 (8) 39.9 20
17 1357.77 1084.62 Cu fp 25 (8) 52.1 20
1 The temperature values are defined for ideally pure substances. Between 1.25 K and
3.2 K both helium isotopes (3He and 4He) can be used. For hydrogen, the SLAP (Standard
Light Antarctic Precipitation) deuterium content is prescribed in a technical annex of the
MeP-K, and water must have the V-SMOW (Vienna Standard Mean Ocean Water)
isotopic composition. (In the technical annex, also functions are specified that allow
correcting to these isotopic reference compositions.) All other substances are of natural
isotopic composition. e-H2 is hydrogen at the equilibrium concentration of the two
nuclear-spin isomers (often designated by the prefixes ortho and para). 2 For complete definitions and advice on the realization of these various states, see
Chapter 2 “Fixed points”. The symbols have the following meaning: vp: vapour-pressure
point; tp: triple point (temperature at which the solid, liquid and vapour phases are in
equilibrium); gp: gas-thermometer point (temperature realized with an interpolating
constant-volume gas thermometer, see Chapter 4); mp, fp: melting point, freezing point
(temperature, at a pressure of 101325 Pa, at which the solid and liquid phases are in
equilibrium). 3 Reference value for the PRT resistance ratio W(T90) = R(T90)/R(0.01 ºC).
Below 1 K, the Provisional Low Temperature Scale from 0.9 mK to 1 K (PLTS-2000)
[CIPM 2001] is a better approximation of thermodynamic temperature than ITS-90. A
vapour-pressure scale, which is consistent with the PLTS-2000, has been established in
[Engert et al. 2007]. According to the results presented in this paper, the difference T – T90
amounts to –1.6 mK at 0.65 K with an uncertainty of u(T – T90) = 0.43 mK.
One of the guiding principles in setting up the ITS-90 was that it should allow the
user as much choice in its realization as was compatible with an accurate and reproducible
scale. For this reason the scale includes many sub-ranges. Within all except one of these,

Supplementary Information for the ITS-90: Section 1: Introduction
9 / 19
. T90 is defined independently of calibration points outside the range. (The exception is the
PRT range extending upwards from the triple point of neon (24.5561 K), which calls for a
calibration at the triple-point of hydrogen (13.8033 K).) Thus, if a PRT is to be calibrated
over the whole low-temperature range from 13.8 K to 273.16 K, all of the eight calibration
points in that range must be used. If, however, a calibration is required only in the range
from the triple point of argon (83.8058 K) to the triple point of water, then only the
three calibration points in this range are needed, 83.8058 K, 234.3156 K (triple point of
mercury) and 273.16 K. Similarly, in the range above 0 °C, a thermometer may be
calibrated from 0 °C to 30 °C using just the triple point of water and melting point of
gallium (29.7646 °C). This last range offers the simplest possible way of achieving the
highest accuracy thermometry in the room temperature range. It allows the user to avoid
the trouble and expense of setting up calibration points at temperatures outside the range
of interest, and in addition it allows the thermometer itself to be maintained under the best
possible conditions by not requiring it to be heated significantly above the temperature of
normal use. The price that is paid for this useful flexibility in the scale is the presence of a
certain level of increased non-uniqueness compared with a scale having no overlapping
ranges or sub-ranges. This is discussed in Section 3.2.
2.9 Provisional Low Temperature Scale from 0.9 mK to 1 K (PLTS-2000)
In October 2000, the CIPM adopted the PLTS-2000 [CIPM 2001]. It is based on noise and
magnetic thermometry performed at three institutes [Rusby et al 2002, Fellmuth et al
2003]. Considering the uncertainty estimates for the thermometers used and the spread of
the results obtained, the relative standard uncertainty of the PLTS-2000 in thermodynamic
terms has been estimated to range from 2 % at 1 mK to 0.05 % at 1 K.
The PLTS-2000 is defined from 0.9 mK to 1 K by a polynomial with 13 terms
describing the temperature dependence of the melting pressure of 3He. Furthermore, four
natural features on the 3He melting curve can be used as intrinsic fixed points of
temperature and pressure because their temperature and pressure values are also defined in
the text of the PLTS-2000: the pressure minimum (315.24 mK, 2.93113 MPa), the
transition to the superfluid ‘A’ phase (2.444 mK, 3.43407 MPa), the ‘A to B’ transition in
the superfluid (1.896 mK, 3.43609 MPa), and the Néel transition in the solid (0.902 mK,
3.43934 MPa). The melting pressure of 3He has been chosen as scale carrier for several
reasons. First of all, it is a thermodynamic property of a pure substance; i.e., though
impurities may have an influence, no principle non-uniqueness due to different
interpolation behaviour of thermometers as for PRTs occurs. The melting pressure can be
reproduced much better than the readings of all other thermometers and a temperature
range of about three decades is covered. Furthermore, apart from a narrow range near the
minimum of the melting curve, a high resolution down to 0.1 K can be achieved.
Supplementary Information for the realization of the PLTS-2000 is available on the BIPM
website and published in [Rusby et al 2007].

Supplementary Information for the ITS-90: Section 1: Introduction
10 / 19
2.10 ITS-XX
Applying ITS-90 for measuring temperatures means accepting several deficiencies of this
scale. As a long-term task, the following changes of the scale are, from today’s
perspective, desirable in preparing a new scale ITS-XX:
improvement of the approximation of thermodynamic temperature, see Section 2.8;
merging of PLTS-2000 and ITS-90, e.g. by including PTB-2006;
reduction of the non-uniqueness in the PRT sub-ranges (see below) by improving the
quality criteria for PRTs, the reference and interpolation functions;
replacement of high-temperature PRTs as interpolating instruments above the
freezing point of aluminium because their instability is too large in this range;
removing the intrinsic limitations of the ITS-90 above the silver freezing point
[Machin et al. 2010], e.g., the increase of the uncertainty in proportion to the square
of T90 above the fixed-point temperature;
inclusion of high-temperature fixed points [Machin et al. 2010].
3 Numerical
3.1 Differences between scales
Differences between various International Temperatures Scales are shown graphically in
Figures 2 to 5. Differences t48 – t27 exist only above 630 °C. They are smaller than the
uncertainty of the great majority of temperature measurements carried out between 1927
and 1948. Thus, the 1948 change of temperature scale required little or no retroactive
adjustments when comparing pre-1948 and post-1948 experimental work, and no analytic
expressions for this are given here. In contrast, the differences t68 – t48, T76 – T68, T90 – T76,
and T90 – T68 are substantially larger than the uncertainties quoted in the scientific
literature of those periods, and numerical corrections are often necessary for comparisons
of work before and after the transition dates.

Supplementary Information for the ITS-90: Section 1: Introduction
11 / 19
Figure 2. The differences t48 – t27 as a function of t48 (after [Hall 1955]).
Figure 3. The differences t68 – t48 as a function of t68 [Bedford et al. 1970].
500 1000 1500 2000 2500 3000 3500 4000
-50
-40
-30
-20
-10
0
10
600 900 1200-0.5
0.0
0.5
(t
48-
t 27)
/ °C
t48
/ °C
(t48-
t 27)
/ °C
t48
/ °C
-200 400 1000 1600 2200 2800 3400 4000
-2
0
2
4
6
8
10
-200 0 200 400-0.05
0.00
0.05
0.10
(t6
8-
t 48)
/ °C
t68
/ °C
(t68-
t 48)
/ °C
t68
/ °C
Supplementary Information for the ITS-90: Section 1: Introduction
12 / 19
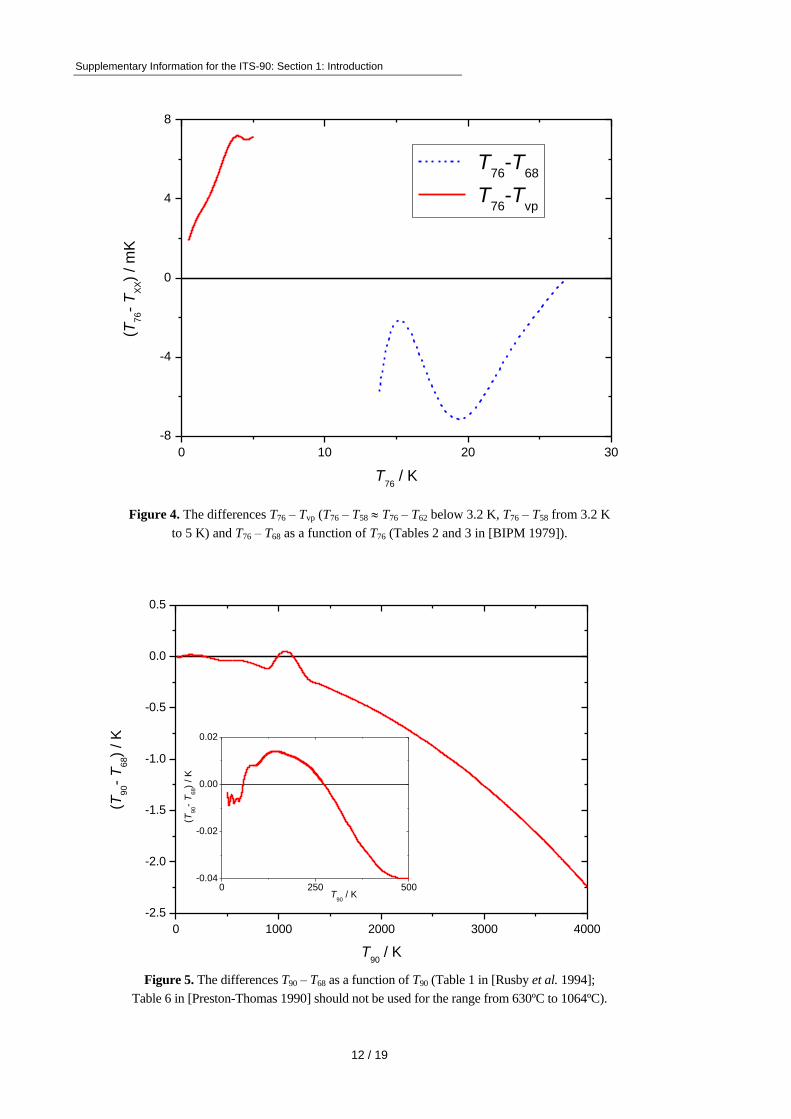
Figure 4. The differences T76 – Tvp (T76 – T58 T76 – T62 below 3.2 K, T76 – T58 from 3.2 K
to 5 K) and T76 – T68 as a function of T76 (Tables 2 and 3 in [BIPM 1979]).
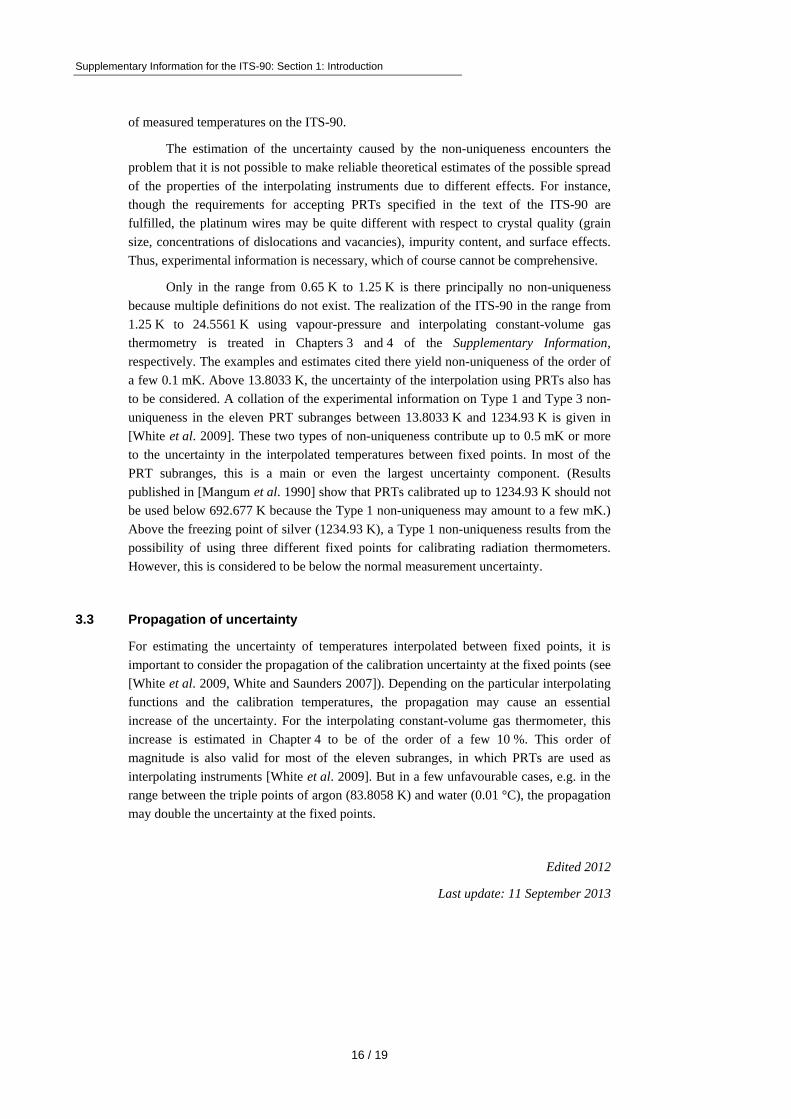
Figure 5. The differences T90 – T68 as a function of T90 (Table 1 in [Rusby et al. 1994];
Table 6 in [Preston-Thomas 1990] should not be used for the range from 630ºC to 1064ºC).
0 10 20 30
-8
-4
0
4
8
T76
-T68
T76
-Tvp
(T7
6-
TX
X)
/ m
K
T76
/ K
0 1000 2000 3000 4000
-2.5
-2.0
-1.5
-1.0
-0.5
0.0
0.5
0 250 500-0.04
-0.02
0.00
0.02
(T9
0-
T6
8)
/ K
T90
/ K
(T90-
T68)
/ K
T90
/ K

Supplementary Information for the ITS-90: Section 1: Introduction
13 / 19
The scale differences shown in Figures 2 to 4 can be described analytically, with a
maximum relative deviation of 10 %, by applying the following polynomials, the
coefficients of which have been determined by fitting and are given in Table 2:
7
0
6814868)C/(C/)(
i
i
itatt , (1)
6
0
762vp76)K/(K/)(
i
i
iTaTT , (2)
7
0
7636876)K/(K/)(
i
i
iTaTT . (3)
Table 2. Values of the coefficients in Equations (1) to (3).
Difference (t68 – t48) / °C (T76 – Tvp) / K (T76 – T68) / K
Coefficients ai1 ai2 ai3
Range –180 °C to 0 °C 0 °C to 470 °C 470 °C to 4000 °C 0.5 K to 5.0 K 13.8 K to 27 K
i
0 8.18841110–03 2.8346910–04 6.031724210+00 2.2391210–01 2.983337810+03
1 9.72212910–04 –4.8552310–04 –3.270304110–02 3.9108310+00 –1.743224610+03
2 1.00997410–04 6.0595610–06 6.507868810–05 –9.1516910–01 3.547549110+02
3 2.95229410–06 –8.1740410–09 –6.023494910–08 –9.4114610–01 –3.611503410+01
4 4.52037210–08 –6.6345410–11 3.042064310–11 7.8552110–01 2.064765210+00
5 3.86362310–10 3.1129210–13 –8.534834710–15 –1.9392510–01 –6.760423010–02
6 1.68488910–12 –5.6599310–16 1.250955710–18 1.5549010–02 1.187410310–03
7 2.87961810–15 3.9813710–19 –7.470754310–23 –8.695835010–06
The helium vapour-pressure equations for the ITS-90 are those originally derived for the
EPT-76. Thus, in the range below 4.2 K (omitted in Table 6 of the text of the ITS-90) the
differences T90 – T76 can be considered to be zero kelvin. In the range from 4.2 K to 27 K,
the differences T90 – T76 listed in this Table 6 were derived by applying the equation
(T90 – T76) / K = –5.6 10–6 (T90 / K)2 . (4)
But since several methods of realizing the EPT-76 were approved, an uncertainty of at
least a few tenths of a millikelvin has to be considered for comparisons of work done
applying the two scales.
The polynomial representations of the differences between ITS-90 and IPTS-68
from 13.8 K to 903.8 K (630.6 ºC) are due to R. L. Rusby [Rusby 1990] with the
coefficients given in Table 3:
from 13.8 K to 83.8 K (uncertainty approximately 1 mK):
12
0
9016890)K40/K)40((K/)(
i
i
iTbTT , (5)

Supplementary Information for the ITS-90: Section 1: Introduction
14 / 19
from 83.8 K to 903.8 K (630.6 ºC) (uncertainty about 1.5 mK up to 0 °C, and 1 mK
above 0 °C)
8
1
9026890)C306/(C/)(
i
i
itbtt . (6)
For the range from 630 ºC to 1064 ºC, revised values for t90 – t68 have been published by
Rusby et al. [Rusby et al. 1994] in Table 1, which are better estimates than the values
listed in Table 6 of the text of the ITS-90 and are approximated by a polynomial of fifth
order, the coefficients of which are also given in Table 3:
5
0
9036890)C/(C/)(
i
i
itbtt . (7)
In this temperature range, the reproducibility of the IPTS-68 was limited to the level of
about (0.1 – 0.2) ºC due to the use of the platinum10%rhodium-platinum thermocouple as
the interpolating instrument. This limitation affected all measurements and scale
comparisons involving the IPTS-68.
Table 3. Values of the coefficients in Equations (5) to (7) describing the differences
T90 –T68 and t90 – t68.
Coefficients bi1 bi2 bi3
Range 13.8 K to 83.8 K 83.8 K to 903.8 K 630 ºC to 1064 ºC
i
0 –0.005903 7.8687209 × 10+01
1 0.008174 –0.148759 –4.7135991× 10–01
2 –0.061924 –0.267408 1.0954715 × 10–03
3 –0.193388 1.080760 –1.2357884 × 10–06
4 1.490793 1.269056 6.7736583 × 10⁻¹⁰
5 1.252347 –4.089591 –1.4458081 × 10⁻¹³
6 –9.835868 –1.871251
7 1.411912 7.438081
8 25.277595 –3.536296
9 –19.183815
10 –18.437089
11 27.000895
12 –8.716324
Above the gold freezing point (1064.18 ºC), the differences T90 – T68 are only caused by
the difference T(Au) = –0.25 K of the temperature values assigned in the two scales to
this fixed point. The T90 – T68 values listed in Table 6 of the text of the ITS-90 and shown
in Figure 5 have been calculated for the domain, in which the Wien equation is a close
approximation to the Planck equation, and for which a quadratic deviation function can be
applied:

Supplementary Information for the ITS-90: Section 1: Introduction
15 / 19
( ) (
( )) (8)
This domain covers practically the entire visible region of the spectrum; i.e., the listed
values apply with negligible error at wavelengths near 0.65 m up to about 4000 ºC. At a
wavelength of 1 m and at higher temperatures, a wavelength dependence arising from
the Planck equation (see Equation (15) of the text of the ITS-90) has to be considered.
The conversion of IPTS-68 PRT calibrations to ITS-90 is not straightforward.
There are no simple analytical relations between the coefficients of ITS-90 and those of
the IPTS-68. The conversion, therefore, consists of calculating the resistance ratios
W(T68) = R(T68)/R(0 ºC) at the IPTS-68 values of the required ITS-90 fixed points,
converting the ratios to W(T90) = R(T90)/R(0.01 ºC), by multiplying by 0.9999601, and
applying the appropriate formula and temperature values as specified in the ITS-90.
For the triple points of neon and mercury, the melting point of gallium and the
freezing point of indium, which were not defining fixed points of the IPTS-68, the values
of T68 should be taken as 24.5616 K, 234.3082 K, 302.9219 K, and 429.7850 K,
respectively [Rusby et al. 1991]. Where the IPTS-68 calibration used the condensation
point of oxygen, rather than the triple point of argon, the T68 value most appropriately
assigned to the argon point may differ slightly from the value 83.798 K specified in the
IPTS-68. The freezing point of aluminium lay beyond the range of the PRT in the
IPTS-68, but on extrapolating the IPTS-68 equations, its value was found to be 933.607 K
[Bedford et al. 1984], although this could be in error by 5 mK or more.
3.2 Non-uniqueness
The irreproducibility of temperatures measured on the ITS-90 is caused by the dispersion
due to deficiencies in the realization of the scale, the associated measurement
instrumentation, and the so-called non-uniqueness of the scale [Mangum et al. 1997].
Three types of non-uniqueness can be identified:
Type 1 arises from the application of different interpolation equations in overlapping
ranges using the same thermometer,
Type 2 arises from the use of different kinds of thermometers in overlapping ranges,
and
Type 3 arises from the use of different interpolating thermometers of the same kind.
Types 1 and 2 are caused by the imperfect definition of the ITS-90, through errors in the
thermodynamic temperature values assigned to the defining fixed points, and/or through
scale equations that are not in agreement with the true thermodynamic equations of state.
These deficiencies manifest themselves as non-uniqueness as soon as multiple definitions
are allowed, as in the ITS-90. Type 3 is connected with deficiencies of the interpolating
thermometers specified in the ITS-90. The thermometers, calibrated at a given set of
defining fixed points, exhibit non-unique interpolation behaviour over the temperature
ranges between the fixed points since they are not ideal, which implies, for example, that
thermometers, albeit of the same kind, are not identical in their physical-chemical
constitution. Since all realizations of the ITS-90 according to its definition are equally
valid, the non-uniqueness determines fundamentally the lowest bounds for the uncertainty
Supplementary Information for the ITS-90: Section 1: Introduction
16 / 19
of measured temperatures on the ITS-90.
The estimation of the uncertainty caused by the non-uniqueness encounters the
problem that it is not possible to make reliable theoretical estimates of the possible spread
of the properties of the interpolating instruments due to different effects. For instance,
though the requirements for accepting PRTs specified in the text of the ITS-90 are
fulfilled, the platinum wires may be quite different with respect to crystal quality (grain
size, concentrations of dislocations and vacancies), impurity content, and surface effects.
Thus, experimental information is necessary, which of course cannot be comprehensive.
Only in the range from 0.65 K to 1.25 K is there principally no non-uniqueness
because multiple definitions do not exist. The realization of the ITS-90 in the range from
1.25 K to 24.5561 K using vapour-pressure and interpolating constant-volume gas
thermometry is treated in Chapters 3 and 4 of the Supplementary Information,
respectively. The examples and estimates cited there yield non-uniqueness of the order of
a few 0.1 mK. Above 13.8033 K, the uncertainty of the interpolation using PRTs also has
to be considered. A collation of the experimental information on Type 1 and Type 3 non-
uniqueness in the eleven PRT subranges between 13.8033 K and 1234.93 K is given in
[White et al. 2009]. These two types of non-uniqueness contribute up to 0.5 mK or more
to the uncertainty in the interpolated temperatures between fixed points. In most of the
PRT subranges, this is a main or even the largest uncertainty component. (Results
published in [Mangum et al. 1990] show that PRTs calibrated up to 1234.93 K should not
be used below 692.677 K because the Type 1 non-uniqueness may amount to a few mK.)
Above the freezing point of silver (1234.93 K), a Type 1 non-uniqueness results from the
possibility of using three different fixed points for calibrating radiation thermometers.
However, this is considered to be below the normal measurement uncertainty.
3.3 Propagation of uncertainty
For estimating the uncertainty of temperatures interpolated between fixed points, it is
important to consider the propagation of the calibration uncertainty at the fixed points (see
[White et al. 2009, White and Saunders 2007]). Depending on the particular interpolating
functions and the calibration temperatures, the propagation may cause an essential
increase of the uncertainty. For the interpolating constant-volume gas thermometer, this
increase is estimated in Chapter 4 to be of the order of a few 10 %. This order of
magnitude is also valid for most of the eleven subranges, in which PRTs are used as
interpolating instruments [White et al. 2009]. But in a few unfavourable cases, e.g. in the
range between the triple points of argon (83.8058 K) and water (0.01 °C), the propagation
may double the uncertainty at the fixed points.
Edited 2012
Last update: 11 September 2013

Supplementary Information for the ITS-90: Section 1: Introduction
17 / 19
References
Bedford R E, Dauphinee T M, Preston-Thomas H 1970 Temperature Measurement. Tools
and Techniques in Physical Metallurgy, ed. Weinberg F (Marcel Dekker, New York)
Bedford R E, Bonnier G, Maas H, Pavese F 1984 Metrologia 20 145-155
BIPM 1979 Metrologia 15 65-68
Brickwedde F G, van Dijk H, Durieux M, Clement J R, Logan J K 1960 J. Res. NBS 64A
1-17
CCT Guidelines on Approximating Methods to the ITS-90 and the PLTS-2000, to be
published on www.BIPM.org , replacing the current “Techniques for Approximating
ITS-90”
CGPM 1889 Comptes Rendus des Séances de la Première Conférence Générale des Poids
et Mesures 35 (This document and the following ones are available on request from
the BIPM.)
CGPM 1927 Comptes Rendus des Séances de la Septième Conférence Générale des Poids
et Mesures 94-99
CGPM 1948 Comptes Rendus des Séances de la Neuvième Conférence Générale des
Poids et Mesures 89-100
CGPM 1960 Comptes Rendus des Séances de la Onzième Conférence Générale des Poids
et Mesures 124-133
CGPM 1967-68 Comptes Rendus des Séances de la Treizième Conférence Générale des
Poids et Mesures A1-A24
CGPM 1975 Comptes Rendus des Séances de la Quinzième Conférence Générale des
Poids et Mesures A1-A21
CGPM 1987 Comptes Rendus des Séances de la Dix-septième Conférence Générale des
Poids et Mesures 67-69, 101
CIPM 1989 Procès-Verbaux des Séances du Comité International des Poids et Mesures,
78th meeting
CIPM 2001 Procès Verbaux des Séances du Comité International des Poids et Mesures
89 (BIPM, Sèvres) pp 128–30
Durieux M, Astrov D N, Kemp W R G, Swenson C A 1979 Metrologia 15 57-63
Engert J, Fellmuth B, Jousten K 2007 Metrologia 44 40-52
Fellmuth B, Hechtfischer D, Hoffmann A 2003 “PTB-96 The Ultra-Low Temperature
Scale of PTB” Proc. Temperature Its Measurement and Control in Science and
Industry, vol 7, ed. Ripple D C (Am. Inst. of Phys., New York) pp 71-76
Fellmuth B, Hill K D, Bloembergen P, de Groot M, Hermier Y, Matveyev M, Pokhodun
A, Ripple D, Steur P P M 2005 “Methodologies for the estimation of uncertainties and
the correction of fixed-point temperatures attributable to the influence of chemical
impurities” CCT 23e Session, Doc. CCT/05-08 (This document is available on the
BIPM website.)

Supplementary Information for the ITS-90: Section 1: Introduction
18 / 19
Fellmuth B, Wolber L, Head D I, Hermier Y, Hill K D, Nakano T, Pavese F, Peruzzi A,
Rusby R L, Shkraba V, Steele A G, Steur P P M, Szmyrka-Grzebyk A, Tew W L,
Wang L, White D R 2012 Metrologia 49 257-265
Fischer J, Battuello M, Sadli M, Ballico M, Seung Nam Park, Saunders P, Yuan Zundong,
Johnson B C, van der Ham E, Wang Li, Fumihiro Sakuma, Machin G, Fox N, Ugur S,
Matveyev M 2003 CCT 22e Session, Doc. CCT/03-03 (This document is available on
the BIPM website.)
Fischer J, de Podesta M, Hill K D, Moldover M, Pitre L, Rusby R, Steur P, Tamura O,
White R, Wolber L 2011 Int. J. Thermophys. 32 12-25
Hall J A 1955 ”The International Temperature Scale” Proc. Temperature Its Measurement
and Control in Science and Industry, vol 2, ed. Wolfe H C (Reinhold Publishing
Corporation, New York) pp 115-139
Machin G, Anhalt K, Bloembergen P, Hartmann J, Saunders P, Woolliams E, Yamada Y,
Yoon H 2010 “Realisation and dissemination of thermodynamic temperature above
the silver point (1234.93 K)” CCT 25th Session, Doc. CCT/2010-12 (This document is
available on request from the BIPM.)
Mangum B W, Pfeiffer E R, Strouse G F 1990 „Non-uniqueness of some standard
platinum resistance thermometers over the temperature range from 13.8 K to 1235 K“
Proc. 4th Symposium on Temperature and Thermal Measurements in Industry and
Science (Finnish Society of Automatic Control, Helsinki) pp 17-36
Mangum B W, Bloembergen P, Chattle M V, Fellmuth B, Marcarino P, Pokhodun A I
1997 Metrologia 34 427-429
Mangum B W, Bloembergen P, Chattle M V, Fellmuth B, Marcarino P, Pokhodun A I
1999 Metrologia 36 79-88
Mangum B W, Bloembergen P, Chattle M V, Fellmuth B, Marcarino P, Pokhodun A I
2000 “Optimal realization of the defining fixed points of the ITS-90 that are used for
contact thermometry” CCT 20e Session, Doc. CCT/2000-13 (This document is
available on request from the BIPM.)
Mangum B W, Strouse G F, Guthrie W F, Pello R, Stock M, Renaot E, Hermier Y,
Bonnier G, Marcarino P, Gam K S, Kang K H, Kim Y G, Nicholas J V, White D R,
Dransfield T D, Duan Y, Qu Y, Connolly J, Rusby R L, Gray J, Sutton G J M, Head
D I, Hill K D, Steele A, Nara K, Tegeler E, Noatsch U, Heyer D, Fellmuth B, Thiele-
Krivoj B, Duris S, Pokhodun A I, Moiseeva N P, Ivanova A G, de Groot M J,
Dubbeldam J F 2002 Metrologia 39 179-205
Nubbemeyer H G, Fischer J 2002 Metrologia 39 03001 DOI:10.1088/0026-1394/39/1A/6
Pfeiffer E R, Kaeser R S 1982 „Realization of the 1976 Provisional 0.5 K to 30 K
Temperature Scale at the National Bureau of Standards“ Proc. Temperature Its
Measurement and Control in Science and Industry, vol 5, ed. Schooley J F (Am. Inst.
of Phys., New York) pp 159-167
Preston-Thomas H 1976 Metrologia 12 7-17
Preston-Thomas H 1990 Metrologia 27 3-10 and 107
Quinn T J 1990 Temperature, 2nd edition (Academic Press, London)

Supplementary Information for the ITS-90: Section 1: Introduction
19 / 19
Ripple D C, Davis R, Fellmuth B, Fischer J, Machin G, Quinn T, Steur P, Tamura O,
White D R 2010 Int. J. Thermophys. 31 1795-1808
Rusby R L 1990 Private communication
Rusby R L, Hudson R P, Durieux M, Schooley J F, Steur P P M, Swenson C A 1991
Metrologia 28 9-18
Rusby R L, Hudson R P, Durieux M 1994 Metrologia 31 149-153
Rusby R L, Durieux M, Reesink A L, Hudson R P, Schuster G, Kühne M, Fogle W E,
Soulen R J and Adams E D 2002 J. Low Temp. Phys. 126 633-642
Rusby R L, Fellmuth B, Engert J, Fogle W E, Adams E D, Pitre L, Durieux M 2007
J. Low Temp. Phys. 149 156-175
Sydoriak S G, Sherman R H, Roberts T R 1964 J. Res. NBS 68A 547-588
White D R, Saunders P 2007 Meas. Sci. & Technol. 18 2157-2169
White D R, Ballico M, Chimenti V, Duris S, Filipe E, Ivanova A, Kartal Dogan A,
Mendez-Lango E, Meyer C, Pavese F, Peruzzi A, Renaot E, Rudtsch S, Yamazawa K
2009 “Uncertainties in the realisation of the SPRT subranges of the ITS-90” CCT
24e Session, Doc. CCT/08-19/rev (This document is available on the BIPM website.)