Embed Size (px)
Citation preview

SUPPLEMENTARY INFORMATION
1www.nature.com/nature
doi: 10.1038/nature08939
Supplementary Table 1. PCR/sequencing results from presence/absence validation of all four TE families (SPIN, OC1, hAT1, and ET)1 and the jawed vertebrate-specific gene, rag-1 (NA = not applicable; indicates PCR was not performed on these species). PCR was performed on all relevant taxa except in Schmidtea mediterranea and Tarsius syrichta for which we did not have genomic DNA.
Species TE Family GeneSPIN OC1 hAT1 ET rag-1
Mouse +/+* - - - NABushbaby +/+* +/+ - - NATenrec +/+* +/+ - - NABat +/+* +/+ +/+ +/+ NAOpossum +/+* +/+ +/+ - +Frog +/+* +/+ - - NALizard +/+* +/+ +/+ - NATriatomine bug +/+ +/+ +/+ +/+ -Pond snail +/+ - - - -Human -* - - - +Lemur - +/+ - - NASquirrel monkey - +/+ - - NADaphnia pulex - - - - NADrosophila ananassae - - - - NA*Taken from Pace et al.5
2www.nature.com/nature
doi: 10.1038/nature08939 SUPPLEMENTARY INFORMATION
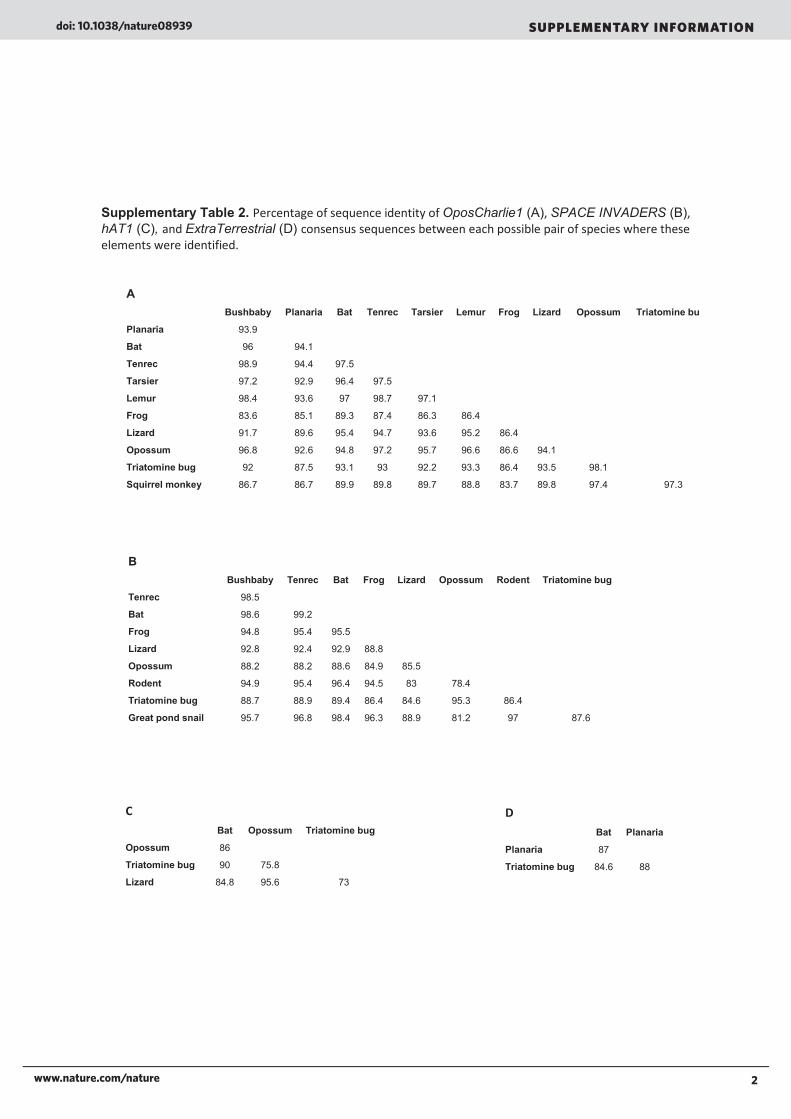
Supplementary Table 2. Percentage of sequence identity of OposCharlie1 (A), SPACE INVADERS (B), hAT1 (C), and ExtraTerrestrial (D) consensus sequences between each possible pair of species where these elements were identified.
ABushbaby Planaria Bat Tenrec Tarsier Lemur Frog Lizard Opossum Triatomine bug
Planaria 93.9
Bat 96 94.1
Tenrec 98.9 94.4 97.5
Tarsier 97.2 92.9 96.4 97.5
Lemur 98.4 93.6 97 98.7 97.1
Frog 83.6 85.1 89.3 87.4 86.3 86.4
Lizard 91.7 89.6 95.4 94.7 93.6 95.2 86.4
Opossum 96.8 92.6 94.8 97.2 95.7 96.6 86.6 94.1
Triatomine bug 92 87.5 93.1 93 92.2 93.3 86.4 93.5 98.1
Squirrel monkey 86.7 86.7 89.9 89.8 89.7 88.8 83.7 89.8 97.4 97.3
BBushbaby Tenrec Bat Frog Lizard Opossum Rodent Triatomine bug
Tenrec 98.5
Bat 98.6 99.2
Frog 94.8 95.4 95.5
Lizard 92.8 92.4 92.9 88.8
Opossum 88.2 88.2 88.6 84.9 85.5
Rodent 94.9 95.4 96.4 94.5 83 78.4
Triatomine bug 88.7 88.9 89.4 86.4 84.6 95.3 86.4
Great pond snail 95.7 96.8 98.4 96.3 88.9 81.2 97 87.6
C Bat Opossum Triatomine bug
Opossum 86
Triatomine bug 90 75.8
Lizard 84.8 95.6 73
D Bat Planaria
Planaria 87
Triatomine bug 84.6 88

3www.nature.com/nature
SUPPLEMENTARY INFORMATIONdoi: 10.1038/nature08939
Supplementary Table 3. Summary of best BLASTN* hits obtained using a selected individual copy of OposCharlie1 (A), SPACE INVADERS (B), hAT1 (C), and ET (D) from each species as a query on the genome of all other species where these transposons are present. This illustrates the level of similarity of extant individual copies between the different species. Numbers in columns refer to best blast score, length, and percent identity to the query.
A
Squirrel monkey (194 bp)
Tarsier (377 bp)
Lemur (3391 bp)
Bushbaby (192 bp)
Bat (743 bp)
Tenrec (3170 bp)
Opossum (3297 bp)
Lizard (2246 bp)
Frog (317 bp)
Triatomine bug (484 bp)
Planaria (1957 bp)
Squirrel monkey
363-292-87% 1817-1447-87% 114-70-95% 508-359-90% 1772-1437-86% 1912-1506-88% 1882-1308-91% 73.4-68-84% 320-260-87% 1195-1272-80%
Tarsier 91.5-61-93%
4417-3391-87% 170-130-89% 596-310-96% 3721-3167-83% 3198-2428-88% 3187-2192-91% 86-72-86% 309-260-86% 1667-1595-81%
Lemur 100-79-88% 416-292-92%
282-192-93% 560-359-94% 3755-3170-83% 2917-2427-86% 3065-2152-91% 98.7-72-90% 279-254-84% 1543-1593-80%
Bushbaby 120-194-73% 425-292-92% 4208-3391-86%
553-359-93% 3770-3170-85% 2993-2432-86% 3034-2213-88% 95.1-72-89% 291-260-84% 1553-1595-80%
Bat 100-64-95% 527-377-91% 3810-2746-90% 251-192-90%
3602-2703-88% 3142-2431-88% 3243-2222-91% 96.9-73-89% 322-255-88% 1620-1592-81%
Tenrec 100-64-95% 441-292-93% 4235-3391-87% 221-192-82% 571-359-95%
3083-2430-87% 3112-2213-90% 96.9-73-89% 298-260-85% 1618-1594-81%
Opossum 178-140-88% 425-377-83% 3056-2371-88% 114-67-97% 517-355-92% 2996-2362-87%
3027-2207-89% 86-67-88% 347-260-90% 1508-1595-79%
Lizard 95.1-63-93% 374-292-87% 3065-2162-91% 125-119-83% 499-359-89% 2985-2162-90% 2852-2253-87%
98.7-72-90% 248-260-80% 1663-1594-81%
Frog 87.8-64-90% 181-175-84% 1770-1801-81% 109-69-94% 302-359-78% 1709-1785-80% 1654-1800-79% 1923-1805-83%
1654-1800-79% 939-1570-72%
Triatomine bug 192-133-92% 325-262-87% 329-259-88% 114-67-97% 354-260-90% 288-262-84% 313-263-86% 288-276-82% 82.4-69-85%
75.2-61-86%
Planaria 64.4-54-87% 205-292-74% 1543-1639-80% 84.2-65-87% 307-354-79% 1543-1624-80% 1404-1640-78% 1663-1640-81% 53.6-64-79% 107-116-80%
B
Bushbaby (2816 bp)
Rodent (225 bp)
Bat (2867 bp)
Tenrec (2831 bp)
Opossum (718 bp)
Lizard (2202 bp)
Frog (186 bp)
Triatomine bug (1160 bp)
Pond snail (190 bp)
Bushbaby
295-225-89% 3842-2865-89% 3276-2825-85% 275-240-85% 2874-2201-89% 221-186-85% 1074-1086-82% 192-185-81
Rodent 1893-2304-77%
2365-2325-81% 1923-2235-78% 187-223-78% 2098-2091-82% 170-186-80% 627-1025-73% 145-173-79
Bat 3674-2816-88% 298-225-90%
3725-2831-88% 293-240-87% 3187-2201-92% 221-186-85% 1191-1068-85% 192-185-81
Tenrec 3227-2816-85% 279-224-88% 3831-2867-89%
286-240-86% 3023-2201-90% 221-186-85% 1052-1062-82% 201-190-84
Opossum 1548-1502-82% 165-146-85% 1835-1665-84% 1570-1514-83%
1725-1654-83% 134-104-88% 1501-1068-91% 123-185-73
Lizard 2715-2195-87% 212-225-91% 3146-2208-91% 2708-2201-87% 275-240-85%
154-102-93% 924-1058-79% 138-104-89
Frog 311-347-79% 120-225-71% 370-335-83% 313-309-79% 120-101-86% 57.2-43-88%
116-99-86% 197-190-83
Triatomine bug 991-1068-80% 150-146-83% 1135-1270-84% 901-1051-79% 392-240-96% 863-791-83% 125-104-86%
93.3-104-80
C
Bat (2923 bp)
Monodelphis (2972 bp)
Lizard (557 bp)
Triatomine bug (472 bp)
Bat
1768-1919-80% 75.2-54-91% 233-281-78%
Monodelphis 1867-1937-81%
242-170-91% 77-86-80%
Lizard 1930-1938-82% 3465-2766-87%
78.8-61-90%
Triatomine bug 425-373-85% 203-299-73% 80.6-70-86%
*BLASTN31 searches were carried out on the NCBI web page with default parameters. For each TE family, an individual copy from the longest subfamily (i.e., autonomous when present, or the longest non-autonomous) was randomly selected and used as a query against the whole genome sequence database of all other species where the TE is present. For each blast, we report the best hit as defined by three parameters in the following order: Best blast score; length of the hit; percent identity. For example, using a 484-bp individual copy of OposCharlie1_NA_1_Rp as a query on the opossum genome, we obtained a best hit with a blast score of 347, over 260 bp, with 90% identity to the query.
D
Bat (2963 bp)
Triatomine bug
Planaria (2746 bp)
Bat
636-521-86% 1957-2027-87%
Triatomine bug 1050-1021-82%
643-524-87%
Planaria 1957-2069-81% 704-524-89%
4www.nature.com/nature
doi: 10.1038/nature08939 SUPPLEMENTARY INFORMATION
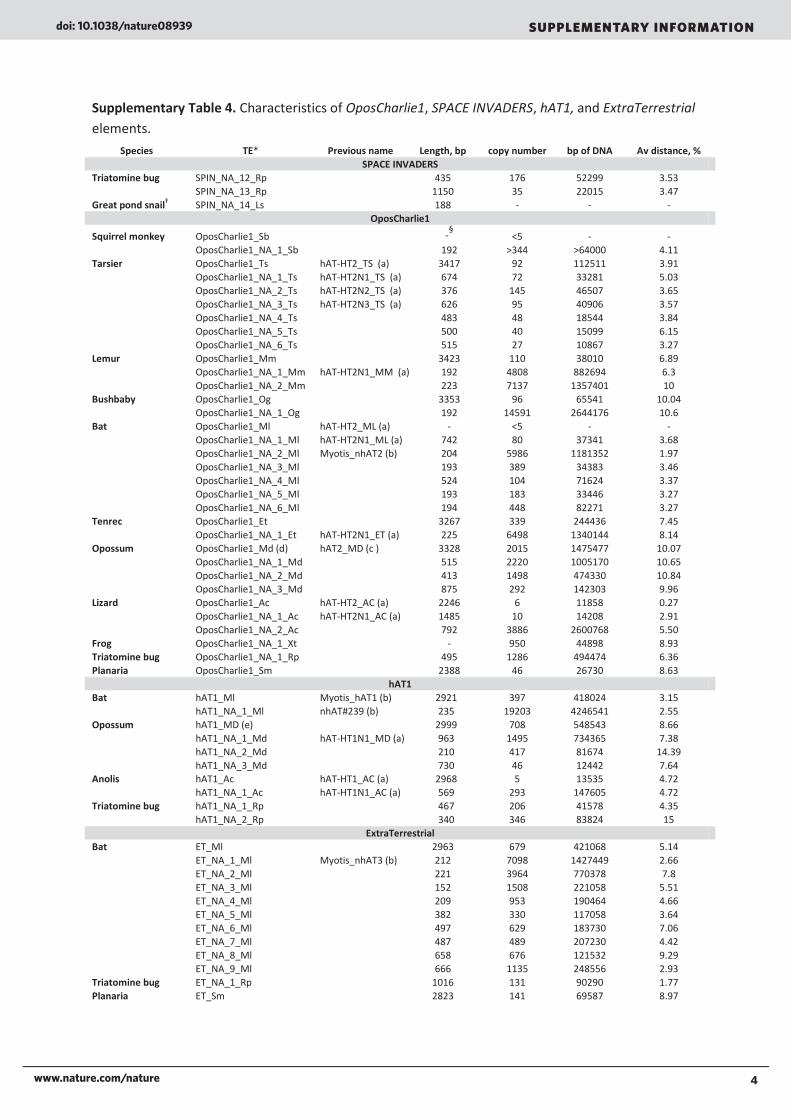
Supplementary Table 4. Characteristics of OposCharlie1, SPACE INVADERS, hAT1, and ExtraTerrestrial elements.
Species TE* Previous name Length, bp copy number bp of DNA Av distance, % SPACE INVADERS
Triatomine bug SPIN_NA_12_Rp
435 176 52299 3.53
SPIN_NA_13_Rp
1150 35 22015 3.47
Great pond snailŦ SPIN_NA_14_Ls
188 - - - OposCharlie1
Squirrel monkey OposCharlie1_Sb
-§ <5 - -
OposCharlie1_NA_1_Sb
192 >344 >64000 4.11
Tarsier OposCharlie1_Ts hAT-HT2_TS (a) 3417 92 112511 3.91
OposCharlie1_NA_1_Ts hAT-HT2N1_TS (a) 674 72 33281 5.03
OposCharlie1_NA_2_Ts hAT-HT2N2_TS (a) 376 145 46507 3.65
OposCharlie1_NA_3_Ts hAT-HT2N3_TS (a) 626 95 40906 3.57
OposCharlie1_NA_4_Ts
483 48 18544 3.84
OposCharlie1_NA_5_Ts
500 40 15099 6.15
OposCharlie1_NA_6_Ts
515 27 10867 3.27
Lemur OposCharlie1_Mm
3423 110 38010 6.89
OposCharlie1_NA_1_Mm hAT-HT2N1_MM (a) 192 4808 882694 6.3
OposCharlie1_NA_2_Mm
223 7137 1357401 10
Bushbaby OposCharlie1_Og
3353 96 65541 10.04
OposCharlie1_NA_1_Og
192 14591 2644176 10.6
Bat OposCharlie1_Ml hAT-HT2_ML (a) - <5 - -
OposCharlie1_NA_1_Ml hAT-HT2N1_ML (a) 742 80 37341 3.68
OposCharlie1_NA_2_Ml Myotis_nhAT2 (b) 204 5986 1181352 1.97
OposCharlie1_NA_3_Ml
193 389 34383 3.46
OposCharlie1_NA_4_Ml
524 104 71624 3.37
OposCharlie1_NA_5_Ml
193 183 33446 3.27
OposCharlie1_NA_6_Ml
194 448 82271 3.27
Tenrec OposCharlie1_Et
3267 339 244436 7.45
OposCharlie1_NA_1_Et hAT-HT2N1_ET (a) 225 6498 1340144 8.14
Opossum OposCharlie1_Md (d) hAT2_MD (c ) 3328 2015 1475477 10.07
OposCharlie1_NA_1_Md
515 2220 1005170 10.65
OposCharlie1_NA_2_Md
413 1498 474330 10.84
OposCharlie1_NA_3_Md
875 292 142303 9.96
Lizard OposCharlie1_Ac hAT-HT2_AC (a) 2246 6 11858 0.27
OposCharlie1_NA_1_Ac hAT-HT2N1_AC (a) 1485 10 14208 2.91
OposCharlie1_NA_2_Ac
792 3886 2600768 5.50
Frog OposCharlie1_NA_1_Xt
- 950 44898 8.93 Triatomine bug OposCharlie1_NA_1_Rp
495 1286 494474 6.36
Planaria OposCharlie1_Sm
2388 46 26730 8.63 hAT1
Bat hAT1_Ml Myotis_hAT1 (b) 2921 397 418024 3.15
hAT1_NA_1_Ml nhAT#239 (b) 235 19203 4246541 2.55
Opossum hAT1_MD (e)
2999 708 548543 8.66
hAT1_NA_1_Md hAT-HT1N1_MD (a) 963 1495 734365 7.38
hAT1_NA_2_Md
210 417 81674 14.39
hAT1_NA_3_Md
730 46 12442 7.64
Anolis hAT1_Ac hAT-HT1_AC (a) 2968 5 13535 4.72
hAT1_NA_1_Ac hAT-HT1N1_AC (a) 569 293 147605 4.72
Triatomine bug hAT1_NA_1_Rp
467 206 41578 4.35
hAT1_NA_2_Rp
340 346 83824 15
ExtraTerrestrial Bat ET_Ml
2963 679 421068 5.14
ET_NA_1_Ml Myotis_nhAT3 (b) 212 7098 1427449 2.66
ET_NA_2_Ml
221 3964 770378 7.8
ET_NA_3_Ml
152 1508 221058 5.51
ET_NA_4_Ml
209 953 190464 4.66
ET_NA_5_Ml
382 330 117058 3.64
ET_NA_6_Ml
497 629 183730 7.06
ET_NA_7_Ml
487 489 207230 4.42
ET_NA_8_Ml
658 676 121532 9.29
ET_NA_9_Ml
666 1135 248556 2.93
Triatomine bug ET_NA_1_Rp
1016 131 90290 1.77 Planaria ET_Sm
2823 141 69587 8.97
5www.nature.com/nature
SUPPLEMENTARY INFORMATIONdoi: 10.1038/nature08939
For each species in which OposCharlie1, Space INvaders, hAT1 and ExtraTerrestrial elements were discovered, the name of the element along with the length, copy number (of both full-length and fragmented elements), number of base pairs and average percent sequence divergence from the consensus sequence (and standard deviation) are shown (see Methods). * Non-autonomous families are denoted with _NA_ . Ŧ Whole genome sequences are not available for Lymnaea stagnalis, therefore we could not estimate the copy number of SPIN elements in this species. § A dash indicates that a consensus sequence could not be derived (and therefore other characteristics could not be assessed) because too few full-length copies could be identified. a. Novick et al.6 b. Ray et al.10 c. Gentles and Jurka33 d. Smit et al.11

6www.nature.com/nature
doi: 10.1038/nature08939 SUPPLEMENTARY INFORMATION
Supplementary Table 5. List of primers used in this study.
Primers were either designed on a superconsensus derived from the alignment of all consensus sequences of a specific family or on a consensus sequence from a specific subfamily in a specific species. M13 primers were also used (F- TGTAAAACGACGGCCAGT; R- CAGGAAACAGCTATGACC)
Locus Description Primers Forward Reverse SPIN Superconsensus CAAACGACCCTTTCACAGG CAGTTCCTCATGTTGTGGTG Rhodnius prolixus CGAACGACCAAAACACAGGGG CAGTTCCTCATGTTGCGGTG Lymnaea stagnalis CGATTGACGATTTGCCAGG CAGTTCCTCATGTTGTGGYGAC OC1 Superconsensus ACTACGGCCCGCGGGCCACATG CAGGGGGCCAGTTCACTGTCC hAT1 Superconsensus GGCGAACCTATGACACGCGTG CAGTGATGGGCAACCTTTTGAG
ET
Superconsensus
AGAGCCAAATATGAACAKTACAAC
CACATGTGGCTCTTTGGC
Rag-1 Degenerate AGYCAGTACCACAAGATGTAC GATGTCTTCYTCCATGTCCATC

7www.nature.com/nature
SUPPLEMENTARY INFORMATIONdoi: 10.1038/nature08939
Supplementary Figure 1. Phylogenetic relationships of OposCharlie1, hAT1, SPIN and ExtraTerrestrial transposases within the eukaryotic hAT superfamily. Each sequence is identified by the name of the transposon followed by the name of the species where the transposon was identified32.
8www.nature.com/nature
doi: 10.1038/nature08939 SUPPLEMENTARY INFORMATION
0.01
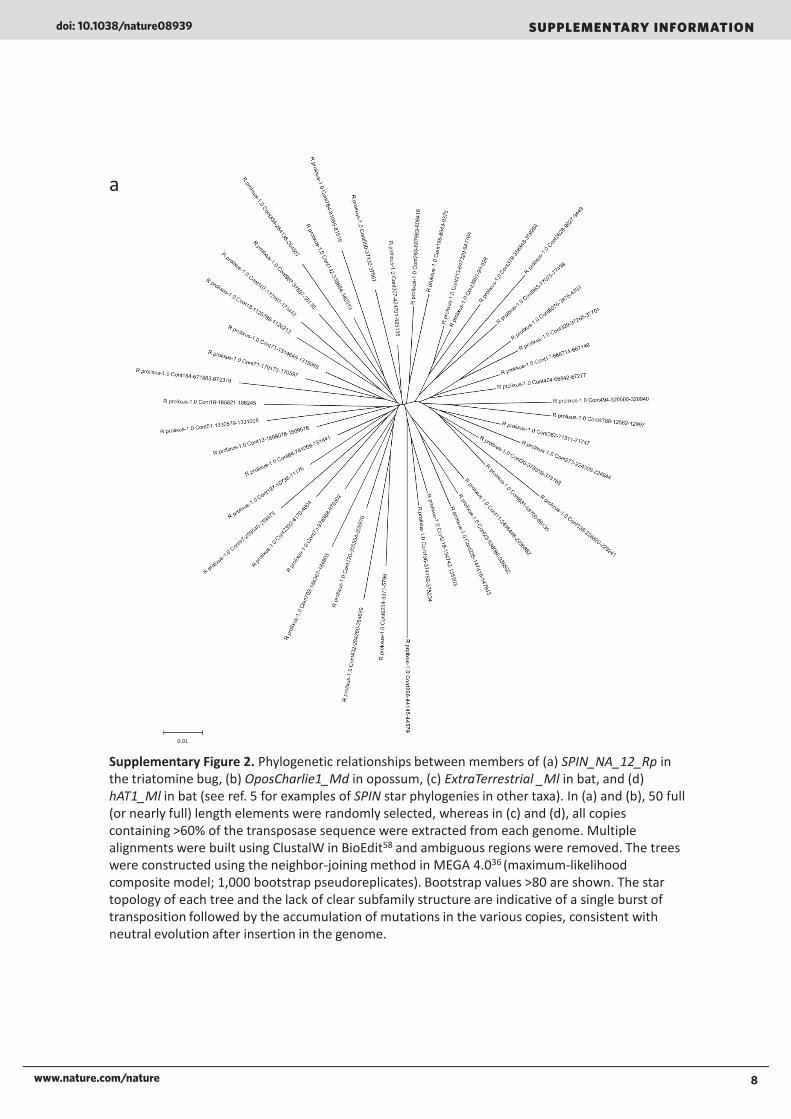
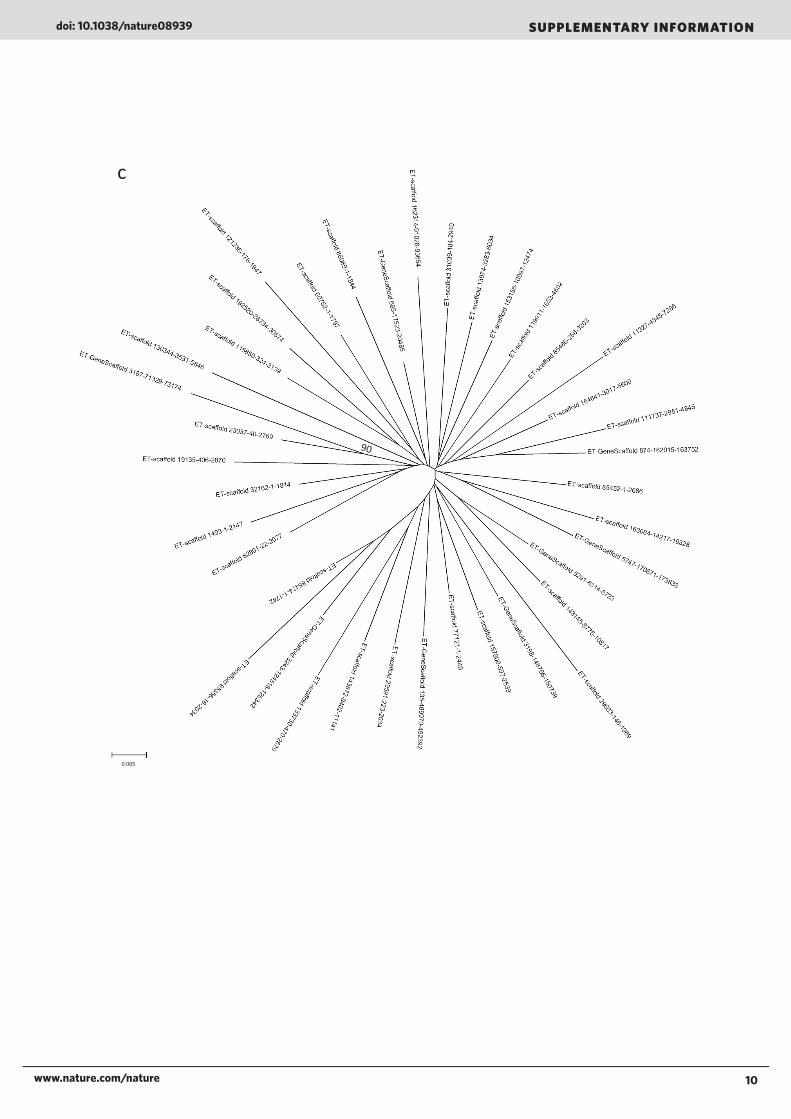
Supplementary Figure 2. Phylogenetic relationships between members of (a) SPIN_NA_12_Rp in the triatomine bug, (b) OposCharlie1_Md in opossum, (c) ExtraTerrestrial _Ml in bat, and (d) hAT1_Ml in bat (see ref. 5 for examples of SPIN star phylogenies in other taxa). In (a) and (b), 50 full (or nearly full) length elements were randomly selected, whereas in (c) and (d), all copies containing >60% of the transposase sequence were extracted from each genome. Multiple alignments were built using ClustalW in BioEdit58 and ambiguous regions were removed. The trees were constructed using the neighbor-joining method in MEGA 4.036 (maximum-likelihood composite model; 1,000 bootstrap pseudoreplicates). Bootstrap values >80 are shown. The star topology of each tree and the lack of clear subfamily structure are indicative of a single burst of transposition followed by the accumulation of mutations in the various copies, consistent with neutral evolution after insertion in the genome.
a

9www.nature.com/nature
SUPPLEMENTARY INFORMATIONdoi: 10.1038/nature08939
b
0.01
10www.nature.com/nature
doi: 10.1038/nature08939 SUPPLEMENTARY INFORMATION
c
0.005

11www.nature.com/nature
SUPPLEMENTARY INFORMATIONdoi: 10.1038/nature08939
98
d
0.005
12www.nature.com/nature
doi: 10.1038/nature08939 SUPPLEMENTARY INFORMATION
Empty site – 1 - position: AC212545: 93115-93305Squirrel monkey CTGGTAATATTTAGAACTCTGTCTCTCTATCTAAACCAGGTGTC...ACGCCTGATCTAAACTATAAGCTCTTTGAGATGTAGGAGTATGTCTTTGCMarmoset ctggtaatatttagaacactgtctctctgtctaaac--------...---------------tgtaagctctttgagatgtaggagtatgtctttgtHuman ctggtaatatttagaactctaactctctgtctaaac--------...---------------tataagttctttMacaque ctggtaatatttagaactctatctctctgtctaaac--------...---------------tgtaagttctttgagatgtgggagtatgtctttgtLemur ctagtagtatacataa--ctgtctctcctactaaac--------...---------------tgtaagctctttgagatgt-ggggtgtgtctctgtTarsier ctagtaatattcataactgtctctccac--ctaaac--------...---------------tgtaagttctttgaaacgtgggggtatatcttcgtBushbaby ------------------------------ctcaac--------...---------------tgcaagctctttgagaagaggtgctgtgtcttttc
Empty site - 2 – position: AAQR01584367: 1155-1188Bushbaby TCTGAGTGAGATTCTGAGAAGACAGGATCCAGATCACGCATCCTC...CTCTGACCCAGGTCATAAAGTGCCTTGTGGG-CCATGCTAGAAAGTTTMarmoset tctgagtgggattctgaaaagacagggtccaggtcac--------...----------------aaagtgccccatggg-ccatgctaggaagtttHuman tctgagtgggattctgaaaaggaagggtccaggtcac--------...----------------aaagtgccctatggggccatgctaggaagtttMacaque tccgagtgggattctgaggagatggggtccagatcac--------...----------------aaagtgccttgtggg-ccatgctaggaagtttLemur ----------------------------ccaggtcac--------...----------------aaagtgccccatggg-ccatgctaggaagtttTarsier tctgag------------aaggcagagtccagatcac--------...----------------agagt-ccctgtagg-ccatgctaggatgtta
Empty site - 3 – position: GeneScaffold-4871: 9512-9888Tarsier ACTAATTGCTCTGATTATCCCAGGCCCTAGAGCAGGGGTC...ACCCCTGCCCTAGAGGAAAGTATTGATGGAGACTTAGCATACAAAGAATGMarmoset accaattgctctgattatcccaggctcttgag--------...---------------gagagtactgatggagacttagcacacaaagaaccHuman attgattgctctgattatcccaggctcttgag--------...---------------gagagtattgatggagacttagtacacaaagaacaMacaque accgattgctctgattatcccaggctcttgag--------...---------------gagagtattgatggagacttagtacacaaaggacgLemur accaattgctctgatcatcacaggctcttgga--------...---------------gaaagtattgacaggcacttagcccacaaaaaatgBushbaby accaattgcactgattatcacaggctcttgag--------...---------------gaaagtattgatgggcacttagcccacaaagaatg
Empty site - 4 – position: GeneScaffold-1192: 110506-110698Lemur GGATCTTTCTGGAAAGAATCCCAAGCACCTTGACCAGGCAT...ACTCTTGACCTTGACTAAGCATTGAACGAACCCTGCTGTTCTGAGCTMarmoset ggggcttcctggaaggaatcccaagcgccgtgac-------...---------------taagaatggaacaaatccgaccattcccagctHuman gggtctttctggaaggaatcccaagcaccttgac-------...---------------taagagttgaacaaatcctgccattctgagctMacaque gggtctttctggaaggaatcccaagcacctttac-------...---------------taagggttgaacaaatcctaccattcccagctTarsier ggatctctctggaaggaatcccaagcaccttgac-------...---------------taagagttgaacaaactctaccattc-----tBushbaby ggatctttctgcaaaga-ttctaag-accttgag-------...---------------taagcattgaacaaaccctgc-----------
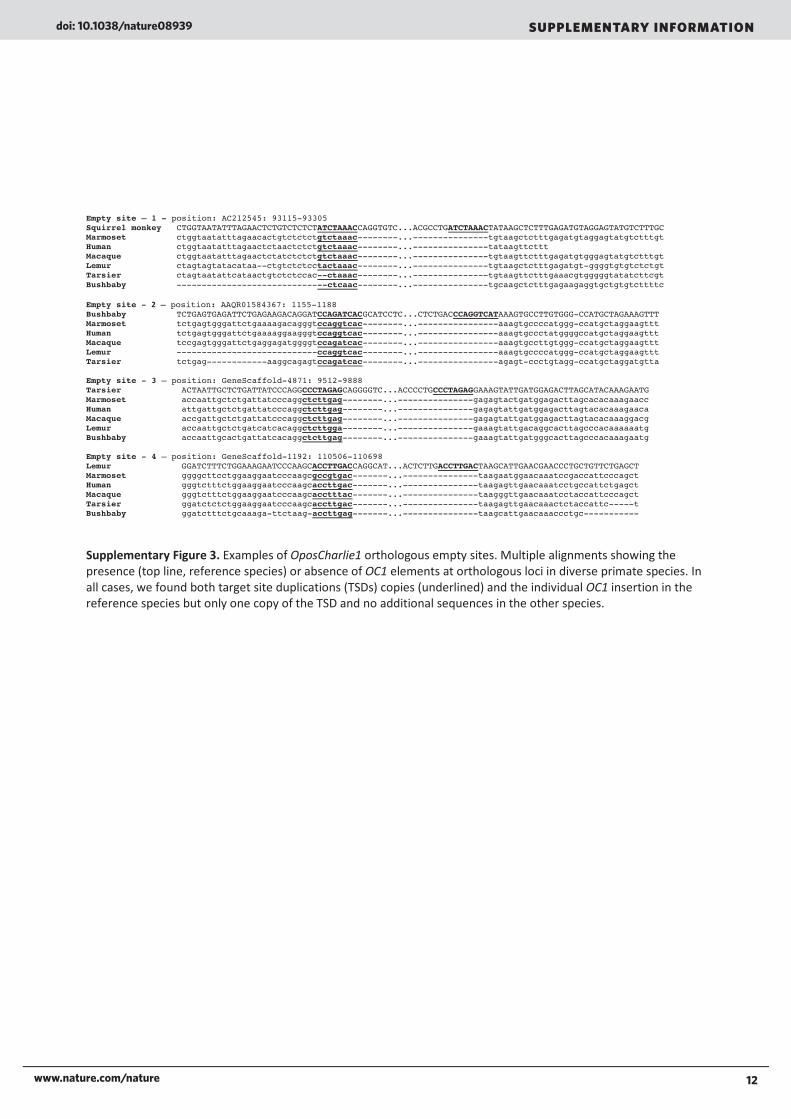
Supplementary Figure 3. Examples of OposCharlie1 orthologous empty sites. Multiple alignments showing the presence (top line, reference species) or absence of OC1 elements at orthologous loci in diverse primate species. In all cases, we found both target site duplications (TSDs) copies (underlined) and the individual OC1 insertion in the reference species but only one copy of the TSD and no additional sequences in the other species.

13www.nature.com/nature
SUPPLEMENTARY INFORMATIONdoi: 10.1038/nature08939
Rhodnius prolixus – Kissing bug6
7
8
9SPIN_NA_12_Rp (435bp) ‐ 176 copies > 100bp ‐ Av. div. 3.45 ‐ STDEV = 1.37
2.5
3
3.5
4
OposCharlie1_NA_1_Rp (495bp) ‐ 1286 copies > 100bp ‐ Av. div. = 6.1 ‐ STDEV = 1.84
0
1
2
3
4
5
0 4 8 2 6 2 4 8 2 6 4 4 8 2 6 6 4 8 2 6 8
0
0.5
1
1.5
2
0
0.8
1.6
2.4
3.2 4
4.8
5.6
6.4
7.2 8
8.8
9.6
10.4
11.2 12
12.8
13.6
14.4
15.2 16
16.8
17.6
18.4
4
5
6
7hAT1_NA_1_Rp (467bp) ‐ 206 copies > 100bp ‐ Av. div. = 4.23 ‐ STDEV = 2.19
0
0.4
0.8
1.2
1.6 2
2.4
2.8
3.2
3.6 4
4.4
4.8
5.2
5.6 6
6.4
6.8
7.2
7.6 8
0
1
2
3
4
0
0.4
0.8
1.2
1.6 2
2.4
2.8
3.2
3.6 4
4.4
4.8
5.2
5.6 6
6.4
6.8
7.2
7.6 8
8.4
8.8
9.2
9.6 10
10.4
2.5
3
3.5
hAT1_NA_3_Rp (340bp) ‐ 346 copies > 100bp ‐ Av. div. = 13.6 ‐ STDEV = 4.33
0
0.5
1
1.5
2
8
10
12
ET_NA_2_Rp (1016bp) ‐ 131copies > 100bp ‐ Av. div. = 1.75 ‐ STDEV = 0.83
0
0.1
1.3
2.5
3.7
4.9
6.1
7.3
8.5
9.7
10.9
12.1
13.3
14.5
15.7
16.9
18.1
19.3
20.5
21.7
22.9
24.1
0
2
4
6
0 4 8 2 6 2 4 8 2 6 4 4 8 2 6
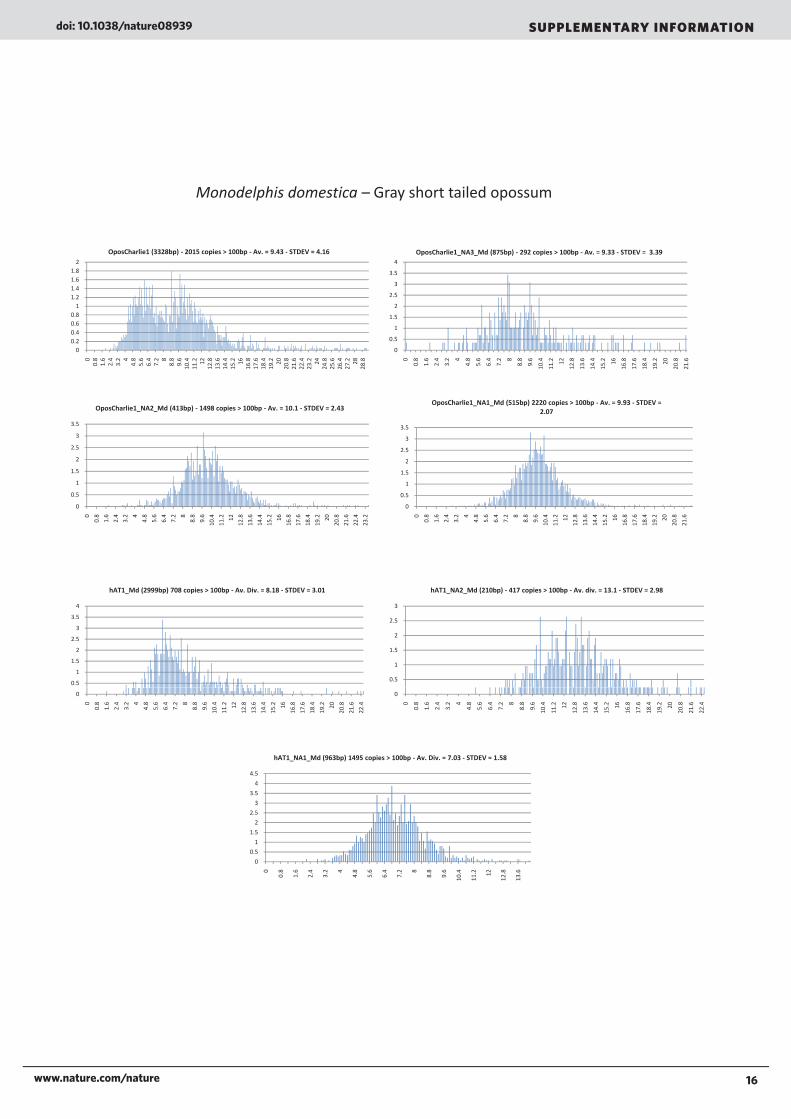
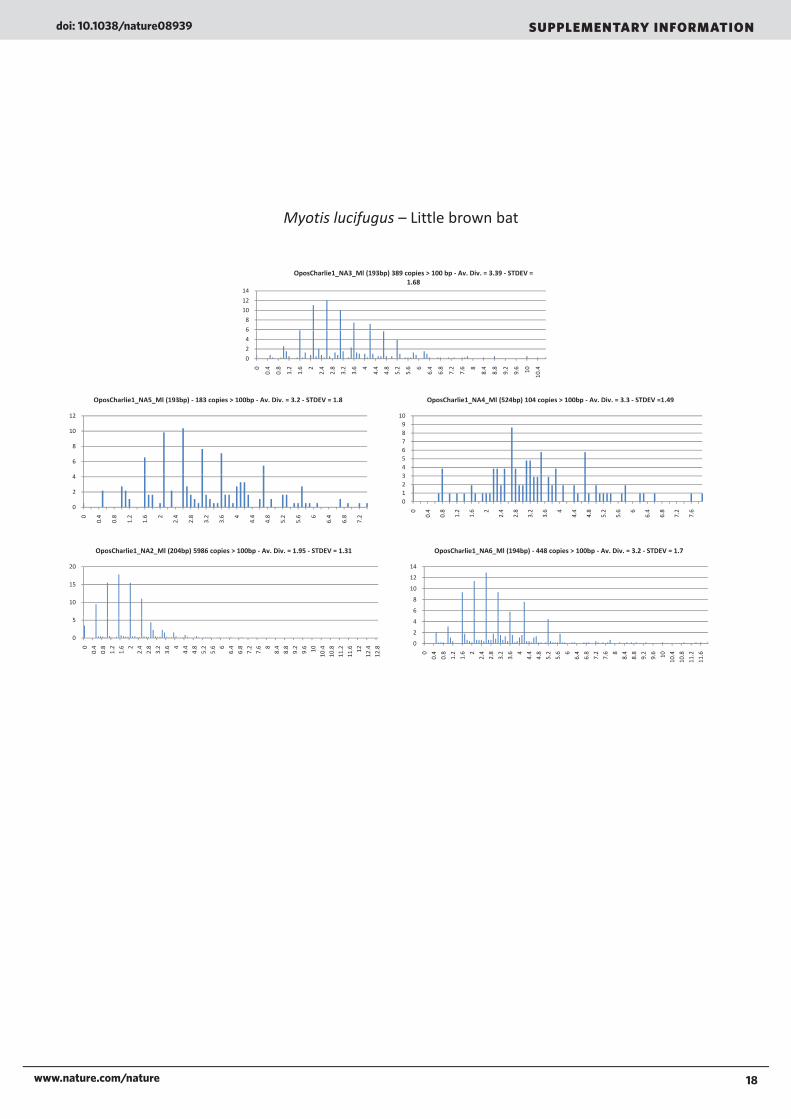
Supplementary Figure 4. Distribution of pairwise divergences from consensus for OposCharlie1, hAT1, ET and SPIN in all species. For each subfamily of transposons the name consensus length 0. 0. 1. 1. 2. 2. 3. 3. 4. 4. 5. 5.For each subfamily of transposons, the name, consensus length, number of copies longer than 100bp, and the average percent divergence with standard deviation are given. The graphs for subfamilies with less than 100 copies are not included.

14www.nature.com/nature
doi: 10.1038/nature08939 SUPPLEMENTARY INFORMATION
Echinops telfairi ‐ Tenrec
OposCharlie1 NA 1 Et (225bp) 6498 copies > 100bp Av div = 7 72 STDEV = O h li 1 Et (3267b ) 339 i 100b A di 7 1 STDEV
Echinops telfairi Tenrec
2
2.5
3
3.5
4
OposCharlie1_NA_1_Et (225bp) ‐ 6498 copies > 100bp ‐ Av. div. = 7.72 ‐ STDEV = 2.81
2
2.5
3
3.5
Oposcharlie1_Et (3267bp) ‐ 339 copies > 100bp ‐ Av. div. = 7.1 ‐ STDEV = 3.05
0
0.5
1
1.5
0
0.8
1.6
2.4
3.2 4
4.8
5.6
6.4
7.2 8
8.8
9.6
10.4
11.2 12
12.8
13.6
14.4
15.2 16
16.8
17.6
18.4
19.2 20
0
0.5
1
1.5
0.1
0.9
1.7
2.5
3.3
4.1
4.9
5.7
6.5
7.3
8.1
8.9
9.7
10.5
11.3
12.1
12.9
13.7
14.5
15.3
16.1
16.9
17.7
1 1 1 1 1 1 1 1 1 1
Microcebus murinus –Mouse lemurMicrocebus murinus Mouse lemur
OposCharlie1_Mm (3423bp) ‐ 110 copies > 100bp ‐ Av. div. = 6.59 ‐ STDEV = 6.4 OposCharlie1_NA_1_Mm (192bp) ‐ 4808 copies > 100bp ‐ Av. div. = 6.05 ‐ STDEV = 2 27
1.52
2.53
3.54
4.55
2
3
4
5
6
7
82.27
00.51
00.4
0.8
1.2
1.6 2
2.4
2.8
3.2
3.6 4
4.4
4.8
5.2
5.6 6
6.4
6.8
7.2
7.6 8
8.4
8.8
9.2
9.6 10
10.4
10.8
11.2
11.6 12
12.4
12.8
13.2
13.6 14
14.4
14.8
15.2
15.6 16
16.4
16.8
0
1
2
0
0.8
1.6
2.4
3.2 4
4.8
5.6
6.4
7.2 8
8.8
9.6
10.4
11.2 12
12.8
13.6
14.4
15.2 16
16.8
17.6
18.4
19.2 20
20.8
21.6
22.4
23.2 24
24.8
33.54
4.55
OposCharlie1_NA_2_Mm (223bp) ‐ 7137 copies > 100bp ‐ Av. div. = 9.37 ‐ STDEV = 2.77
00.51
1.52
2.5
00.8
1.6
2.4
3.2 4
4.8
5.6
6.4
7.2 8
8.8
9.6
10.4
11.2 12
12.8
13.6
14.4
15.2 16
16.8
17.6
18.4
19.2 20
20.8
21.6
22.4
23.2 24
24.8
25.6
26.4

15www.nature.com/nature
SUPPLEMENTARY INFORMATIONdoi: 10.1038/nature08939
Otolemur garnetii – Bushbaby
5
6
OposCharlie1_NA_2_Og(192bp) ‐ 14591 copies > 100bp ‐ Av. div. = 9.89 ‐ STDEV = 2.41
0
1
2
3
4
0
0
0.8
1.6
2.4
3.2 4
4.8
5.6
6.4
7.2 8
8.8
9.6
10.4
11.2 12
12.8
13.6
14.4
15.2 16
16.8
17.6
18.4
19.2 20
20.8
21.6
22.4
23.2 24
24.8
Tarsius syrichta ‐ TarsierTarsius syrichta ‐ Tarsier
8
OposCharlie1_NA2_Ts (376bp) 145 copies > 100 bp ‐ Av. div. = 3.57 ‐ STDEV = 1.36
01234567
0
0.4
0.8
1.2
1.6 2
2.4
2.8
3.2
3.6 4
4.4
4.8
5.2
5.6 6
6.4
6.8
Saimiri boliviensis – Squirrel monkey
30
35
40
45
OposCharlie1_NA1_Sb (192bp) 344 copies > 100bp ‐ Av. div. = 4 ‐ STDEV = 1.6
0
5
10
15
20
25
0
0.4
0.8
1.2
1.6 2
2.4
2.8
3.2
3.6 4
4.4
4.8
5.2
5.6 6
6.4
6.8
7.2
7.6 8
8.4
8.8
9.2
Xenopus tropicalis – African clawed frog
6
7
OposCharlie1_NA1_Xt (?bp) 950 copies > 100bp ‐ Av. div. = 8.42 ‐ STDEV = 3.75
2
3
4
5
0
1
0
0.8
1.6
2.4
3.2 4
4.8
5.6
6.4
7.2 8
8.8
9.6
10.4
11.2 12
12.8
13.6
14.4
15.2 16
16.8
17.6
18.4
19.2 20
16www.nature.com/nature
doi: 10.1038/nature08939 SUPPLEMENTARY INFORMATION
Monodelphis domestica – Gray short tailed opossum
0 81
1.21.41.61.82
OposCharlie1 (3328bp) ‐ 2015 copies > 100bp ‐ Av. = 9.43 ‐ STDEV = 4.16
1 5
2
2.5
3
3.5
4
OposCharlie1_NA3_Md (875bp) ‐ 292 copies > 100bp ‐ Av. = 9.33 ‐ STDEV = 3.39
00.20.40.60.8
00.8
1.6
2.4
3.2 4
4.8
5.6
6.4
7.2 8
8.8
9.6
10.4
11.2 12
12.8
13.6
14.4
15.2 16
16.8
17.6
18.4
19.2 20
20.8
21.6
22.4
23.2 24
24.8
25.6
26.4
27.2 28
28.8
0
0.5
1
1.5
0
0.8
1.6
2.4
3.2 4
4.8
5.6
6.4
7.2 8
8.8
9.6
10.4
11.2 12
12.8
13.6
14.4
15.2 16
16.8
17.6
18.4
19.2 20
20.8
21.6
2
2.5
3
3.5
OposCharlie1_NA2_Md (413bp) ‐ 1498 copies > 100bp ‐ Av. = 10.1 ‐ STDEV = 2.43
2
2.5
3
3.5
OposCharlie1_NA1_Md (515bp) 2220 copies > 100bp ‐ Av. = 9.93 ‐ STDEV = 2.07
0
0.5
1
1.5
2
0
0.8
1.6
2.4
3.2 4
4.8
5.6
6.4
7.2 8
8.8
9.6
10.4
11.2 12
12.8
13.6
14.4
15.2 16
16.8
17.6
18.4
19.2 20
20.8
21.6
22.4
23.2
0
0.5
1
1.5
2
0
0.8
1.6
2.4
3.2 4
4.8
5.6
6.4
7.2 8
8.8
9.6
10.4
11.2 12
12.8
13.6
14.4
15.2 16
16.8
17.6
18.4
19.2 20
20.8
21.6
Monodelphis domestica – Gray short tailed opossum
3 5
4
hAT1_Md (2999bp) 708 copies > 100bp ‐ Av. Div. = 8.18 ‐ STDEV = 3.01
3
hAT1_NA2_Md (210bp) ‐ 417 copies > 100bp ‐ Av. div. = 13.1 ‐ STDEV = 2.98
Monodelphis domestica Gray short tailed opossum
0.5
1
1.5
2
2.5
3
3.5
0.5
1
1.5
2
2.5
0
0
0.8
1.6
2.4
3.2 4
4.8
5.6
6.4
7.2 8
8.8
9.6
10.4
11.2 12
12.8
13.6
14.4
15.2 16
16.8
17.6
18.4
19.2 20
20.8
21.6
22.4
0
0
0.8
1.6
2.4
3.2 4
4.8
5.6
6.4
7.2 8
8.8
9.6
10.4
11.2 12
12.8
13.6
14.4
15.2 16
16.8
17.6
18.4
19.2 20
20.8
21.6
22.4
hAT1 NA1 Md (963bp) 1495 copies > 100bp ‐ Av. Div. = 7.03 ‐ STDEV = 1.58
1 5
2
2.5
3
3.5
4
4.5
hAT1_NA1_Md (963bp) 1495 copies > 100bp Av. Div. 7.03 STDEV 1.58
0
0.5
1
1.5
0
0.8
1.6
2.4
3.2 4
4.8
5.6
6.4
7.2 8
8.8
9.6
10.4
11.2 12
12.8
13.6

17www.nature.com/nature
SUPPLEMENTARY INFORMATIONdoi: 10.1038/nature08939
Myotis lucifugus – Little brown bat
8
hAT1_Ml (2921bp) ‐ 397 copies > 100bp ‐ Av. Div. = 3.09 ‐ STDEV = 1.873.5
ET_Ml (2963bp) ‐ 679 copies > 100bp ‐ Av. Div. = 4.97 ‐ STDEV = 2.44
1
2
3
4
5
6
7
8
0.5
1
1.5
2
2.5
3
0
1
0
0.4
0.8
1.2
1.6 2
2.4
2.8
3.2
3.6 4
4.4
4.8
5.2
5.6 6
6.4
6.8
7.2
7.6 8
8.4
8.8
9.2
9.6 10
10.4
10.8
11.2
11.6
12
14
hAT1_NA1_Ml (235bp) ‐ 19203 copies > 100bp ‐ Av. Div. = 2.51 ‐ STDEV = 1.75
0
0.5
0
0.8
1.6
2.4
3.2 4
4.8
5.6
6.4
7.2 8
8.8
9.6
10.4
11.2 12
12.8
13.6
14.4
14
16
ET_NA_1_Ml (212bp) ‐ 7098 copies > 100bp ‐ Av. Div. = 2.62 ‐ STDEV = 1.5
0
2
4
6
8
10
12
0 8 6 4 2 4 8 6 4 2 8 8 6 4 2 2 8 6 4 2 6 8 6 4 2 0 8 6 4 2 0
2
4
6
8
10
12
14
0
0.8
1.6
2.4
3.2 4
4.8
5.6
6.4
7.2 8
8.8
9.6
10.4
11.2 12
12.8
13.6
14.4
15.2 16
16.8
17.6
18.4
19.2 20
20.8
21.6
22.4
23.2
0
0.8
1.6
2.4
3.2 4
4.8
5.6
6.4
7.2 8
8.8
9.6
10.4
11.2 12
12.8
13.6
14.4
15.2
5
6
ET_NA_2_Ml (221bp) ‐ 3964 copies > 100bp ‐ Av. Div. = 7.41 ‐ STDEV = 3
12
14
ET_NA_3_Ml (152bp) ‐ 1508 copies > 100bp ‐ Av. Div. = 5.32 ‐ STDEV= 3.13
0
1
2
3
4
5
0
2
4
6
8
10
00.8
1.6
2.4
3.2 4
4.8
5.6
6.4
7.2 8
8.8
9.6
10.4
11.2 12
12.8
13.6
14.4
15.2 16
16.8
17.6
18.4
19.2 20
20.8
21.6
22.4
23.2 24
24.8 0
0.8
1.6
2.4
3.2 4
4.8
5.6
6.4
7.2 8
8.8
9.6
10.4
11.2 12
12.8
13.6
14.4
15.2 16
16.8
17.6
18.4
19.2 20
20.8
10
ET_NA_4_Ml (209bp) ‐ 953 copies > 100bp ‐ Av. Div. = 4.52 ‐ STDEV = 1.98
12
ET_NA_5_Ml (382bp) 330 copies > 100bp ‐ Av. Div. = 3.56 ‐ STDEV = 1.23
Myotis lucifugus – Little brown bat
2345678910
2
4
6
8
10
12
012
0
0.8
1.6
2.4
3.2 4
4.8
5.6
6.4
7.2 8
8.8
9.6
10.4
11.2 12
12.8
0
2
0
0.4
0.8
1.2
1.6 2
2.4
2.8
3.2
3.6 4
4.4
4.8
5.2
5.6 6
6.4
6.8
ET_NA_6_Ml (497bp) ‐ 629 copies > 100bp ‐ Av. Div. = 6.74 ‐ STDEV = 2.47
7
ET_NA_7_Ml (487bp) ‐ 489 copies > 100bp ‐ Av. Div. = 4.3 ‐ STDEV= 2.5
1
1.5
2
2.5
3
3.5
4
2
3
4
5
6
0
0.5
0
0.8
1.6
2.4
3.2 4
4.8
5.6
6.4
7.2 8
8.8
9.6
10.4
11.2 12
12.8
13.6
14.4
15.2
0
1
0
0.8
1.6
2.4
3.2 4
4.8
5.6
6.4
7.2 8
8.8
9.6
10.4
11.2 12
12.8
2.5ET_NA_8_Ml (658bp) ‐ 676 copies > 100bp ‐ Av. Div. = 8.74 ‐ STDEV = 5.68
6ET_NA_9_Ml (666bp) ‐ 1135 copies > 100bp ‐ Av. Div. = 2.88 ‐ STDEV =1.88
0.5
1
1.5
2
1
2
3
4
5
0
00.8
1.6
2.4
3.2 4
4.8
5.6
6.4
7.2 8
8.8
9.6
10.4
11.2 12
12.8
13.6
14.4
15.2 16
16.8
17.6
18.4
19.2 20
20.8
21.6
22.4
23.2 24
24.8
25.6
26.4
27.2 28
0
1
0
0.8
1.6
2.4
3.2 4
4.8
5.6
6.4
7.2 8
8.8
9.6
10.4
11.2 12
12.8
13.6
18www.nature.com/nature
doi: 10.1038/nature08939 SUPPLEMENTARY INFORMATION
Myotis lucifugus – Little brown bat
6
8
10
12
14
OposCharlie1_NA3_Ml (193bp) 389 copies > 100 bp ‐ Av. Div. = 3.39 ‐ STDEV = 1.68
0
2
4
6
0
0.4
0.8
1.2
1.6 2
2.4
2.8
3.2
3.6 4
4.4
4.8
5.2
5.6 6
6.4
6.8
7.2
7.6 8
8.4
8.8
9.2
9.6 10
10.4
OposCharlie1 NA5 Ml (193bp) ‐ 183 copies > 100bp ‐ Av. Div. = 3.2 ‐ STDEV = 1.8 OposCharlie1 NA4 Ml (524bp) 104 copies > 100bp ‐ Av. Div. = 3.3 ‐ STDEV =1.49
6
8
10
12
p _ _ ( p) p p
345678910
p _ _ ( p) p p
0
2
4
0
0.4
0.8
1.2
1.6 2
2.4
2.8
3.2
3.6 4
4.4
4.8
5.2
5.6 6
6.4
6.8
7.2
0123
0
0.4
0.8
1.2
1.6 2
2.4
2.8
3.2
3.6 4
4.4
4.8
5.2
5.6 6
6.4
6.8
7.2
7.6
10
15
20
OposCharlie1_NA2_Ml (204bp) 5986 copies > 100bp ‐ Av. Div. = 1.95 ‐ STDEV = 1.31
6
8
10
12
14
OposCharlie1_NA6_Ml (194bp) ‐ 448 copies > 100bp ‐ Av. Div. = 3.2 ‐ STDEV = 1.7
0
5
00.4
0.8
1.2
1.6 2
2.4
2.8
3.2
3.6 4
4.4
4.8
5.2
5.6 6
6.4
6.8
7.2
7.6 8
8.4
8.8
9.2
9.6 10
10.4
10.8
11.2
11.6 12
12.4
12.8
0
2
4
0
0.4
0.8
1.2
1.6 2
2.4
2.8
3.2
3.6 4
4.4
4.8
5.2
5.6 6
6.4
6.8
7.2
7.6 8
8.4
8.8
9.2
9.6 10
10.4
10.8
11.2
11.6

19www.nature.com/nature
SUPPLEMENTARY INFORMATIONdoi: 10.1038/nature08939
Anolis carolinensis – Anole lizard
hAT1_NA_1_Ac (569bp) ‐ 293 copies > 100bp ‐ Av. Div. = 4.58 ‐ STDEV = 7
OposCharlie1_NA_2_Ac (792bp) 3886 copies > 100bp ‐ Av. Div. = 5.31 ‐ STDEV = 1.7
11.52
2.53
3.54
4.5
2.23
2
3
4
5
6
7
00.51
0
0.8
1.6
2.4
3.2 4
4.8
5.6
6.4
7.2 8
8.8
9.6
10.4
11.2 12
12.8
13.6
14.4
15.2
0
1
0.1
0.9
1.7
2.5
3.3
4.1
4.9
5.7
6.5
7.3
8.1
8.9
9.7
10.5
11.3
12.1
12.9
13.7
14.5
15.3
16.1
16.9
17.7
18.5
19.3
20.1
20.9
21.7
22.5
ET S (2823b ) 141 i 100b A Di 8 46 STDEV 3 43
Schmidtea mediterranea ‐ Planaria
2
2.5
3
3.5
4
ET_Sm (2823bp) 141 copies > 100bp ‐ Av. Div = 8.46 ‐ STDEV = 3.43
0
0.5
1
1.5
00.8
1.6
2.4
3.2 4
4.8
5.6
6.4
7.2 8
8.8
9.6
10.4
11.2 12
12.8
13.6
14.4
15.2 16
16.8
17.6
18.4
19.2

20www.nature.com/nature
doi: 10.1038/nature08939 SUPPLEMENTARY INFORMATION
A
B
Supplementary Figure 5. A. Percent similarity (based on pi) across the entire length of full-length OposCharlie1 (OC1)elements. The plot reflects the average percent similarity over 10 nucleotide windows using 3 nucleotide stepwise increments, across a multiple alignment of the full-length OC1 consensus sequences from bat, tenrec, and bushbaby, tarsier, lemur, planarian, and opossum. The transposase ORF is depicted as a white rectangle and the terminal inverted repeats are indicated by arrowheads. B. Species distribution and timing of amplification of OC1 transposons. The tree depicts the phylogenetic relationships and divergence times of the vertebrate species with complete or nearly complete genome sequences currently available63,64. The species harboring OC1 transposons are in bold. The timing of OC1 amplification in each species lineage is shown by the red vertical bars above the corresponding branches. Each set of bars represents the age span for all OC1 subfamilies found in the species with each individual bar showing the relative proportion of elements falling within the same, non-overlapping 3-Myr bin. The orange histogram for the bat represents the age span of a non-autonomous subfamily which is much younger than the other OC1 subfamilies in this species. The age span is not shown for lizard and frog because the neutral substitution rate is unknown for these species.
References63. Hugall, A. F., Foster, R., & Lee, M. S. Y. Calibration choice, rate smoothing, and the pattern of tetrapod diversificationaccording to the long nuclear gene RAG-1. Syst. Biol. 56, 543-563 (2007).64. Murphy, W. J. et al. Using genomic data to unravel the root of the placental mammal phylogeny. Genome Res. 17, 413-421 (2007).

21www.nature.com/nature
SUPPLEMENTARY INFORMATIONdoi: 10.1038/nature08939
Supplementary Figure 6. Tree used for constructing Fig. 1 showing the names of the species for which a complete or near complete genome is available in the NCBI database.