Embed Size (px)
Citation preview
www.sciencemag.org/cgi/content/full/330/6012/1816/DC1
Supporting Online Material for
Structures of C3b in Complex with Factors B and D Give Insight into Complement Convertase Formation
Federico Forneris, Daniel Ricklin, Jin Wu, Apostolia Tzekou, Rachel S. Wallace, John D. Lambris,* Piet Gros*
*To whom correspondence should be addressed. E-mail: [email protected] (P.G.);
[email protected] (J.D.L.)
Published 24 December 2010, Science 330, 1816 (2010) DOI: 10.1126/science.1195821
This PDF file includes:
Materials and Methods Figs. S1 to S12 Table S1 References
S1
Supporting Online Material Forneris et al. Structures of C3b in complex with factors B and D give insight into complement convertase formation Federico Forneris1, Daniel Ricklin2, Jin Wu1, Apostolia Tzekou2, Rachel S. Wallace1,
John D. Lambris2*†, Piet Gros1*† 1Crystal and Structural Chemistry, Bijvoet Center for Biomolecular Research,
Department of Chemistry, Faculty of Science, Utrecht University, Padualaan 8, 3584 CH
Utrecht, The Netherlands, 2Department of Pathology & Laboratory Medicine, University
of Pennsylvania, 401 Stellar Chance, Philadelphia, PA 19104, USA. *These authors co-supervised the work. †To whom correspondence should be addressed. E-mail: [email protected] or [email protected].
Materials and Methods Supporting Figures Fig. S1. Quality of the electron density maps of C3bB (A,B) and C3bBD* (C) complexes. Fig. S2. Structural comparison of C3b, FB and FD molecules. Fig. S3. SPR analysis of the interactions between C3b, FB and FD. Fig. S4. Comparison between crystallography and electron microscopy data on the pro-convertase. Fig. S5. Comparison of the MIDAS sites in, C3bB, C3bBD*, CVFB and SCIN convertase. Fig. S6. Kinetic analysis of pro-convertase activation using SDS-PAGE on mutants of FB designed to
reduce stabilization of the open conformation of the pro-convertase. Fig. S7. Comparison of structural changes at the VWA-SP interface in FB. Fig. S8. Mutagenic analysis of FD exosite. Fig. S9. Pro-convertase activation assays using FB mutant E446A. Fig. S10. Comparison of FD crystal structures. Fig. S11. Analysis of mutants involved in interactions with FD self-inhibitory loop. Fig. S12. Structural representation of the formation and activation of complement alternative pathway
pro-convertases Supporting Tables Table S1: Diffraction, data collection and refinement statistics Supporting References and Notes Supplementary References
S2
Materials and Methods
Protein expression and purification. C3 was purified from freshly isolated human plasma as described (14). After informed consent was provided by the donor, plasma was obtained at the University Medical Center Utrecht according to a study protocol approved by the medical ethics committee of the University Medical Center Utrecht. C3b was generated from C3 using FB and FD to generate active convertases. Briefly, C3 (30 M) was incubated with FB (10 M) and FD (0.3 M) for 20 minutes at 37° C in phosphate buffer saline (PBS), pH 7.4. Cleavage of C3a was verified using SDS-PAGE. Purification of C3b was performed as described (14). FB was fused to a N-terminal His-tag containing a TEV cleavage site, and expressed in N-acetylglucosaminyltransferase I (GnTI) deficient human embryonic kidney 293 cells that stably express Epstein-Bar virus nuclear antigen EBNA1 (HEK293-ES, supplied by U-Protein Express BV (U-PE), Utrecht, The Netherlands). The deficiency of GnTI results in production of homogeneous N-linked glycosylation (S1). FB was purified by metal-affinity chromatography as described (15). The His-tag was removed by TEV protease cleavage, followed by a second column passage on Ni-sepharose beads (GE Healthcare) and a size-exclusion chromatography step on a Superdex 200 column (GE Healthcare). Human FD was expressed without a tag in HEK293-E cells (HEK293 cells that express EBNA1, supplied by U-PE). Secreted FD was purified by cation-exchange using a HiScreen CaptoS column (GE Healthcare), followed size-exclusion chromatography on a Superdex 75 column (GE Healthcare). For SPR experiments, C3b was generated from C3 using limited trypsin digestion (13) and site-specifically biotinylated at its thioester moiety using maleimide-PEG-biotin (Pierce, USA). Factor H was obtained from Complement Technologies Inc., USA.
Mutagenesis. FB and FD mutants were generated using Quickchange mutagenesis kit (Stratagene) on TOPO clones inserted in pCR4 vectors (Invitrogen). After confirmation of successful mutagenesis by DNA sequencing, FB mutant genes were digested using BamHI/NotI restriction endonucleases and ligated into pUPE.06.08 vectors for mammalian expression. FD mutants were digested using BsmBI and ligated into pUPE.05.05 vectors for mammalian expression. All mutants were expressed and purified using the same protocol used for their wild-type variants.
Crystallization and data collection. All proteins were dialyzed in a buffer containing 25 mM 4-(2-Hydroxyethyl)-1-piperazineethanesulfonic acid (HEPES), 50 mM NaCl, pH 7.5 prior to crystallization. C3bB and C3bBD* complexes (8-10 mg/ml) were generated by mixing stoichiometric amounts of freshly purified C3b and FB in the presence of 2mM NiCl2 (C3bB) and C3b, FB and FD S183A (S195A) in the presence of 2mM MgCl2 (C3bBD*). These mixtures were incubated for 1 hour at 4 °C before crystallization. For crystallization we used a double gain-of-function mutant (D254G N260D) of FB in which the glycan moiety on N260 is removed (S2). Screening for initial crystallization conditions were performed using a Honeybee 961 nano-dispenser (Isogen, De Meern, The Netherlands). Crystals were optimized by hand using the hanging-drop vapour diffusion technique at 18 °C. C3bB crystals grew after 2-3 days in 5% w/v
S3
polyethylene glycol (PEG) 3350, 75 mM sodium malonate and 3 % w/v 1,4-dioxane, pH 4.0. Crystals of C3bBD* required 10 days to reach optimum size using precipitant solution containing 8 % w/v PEG 3350 and 75 mM magnesium sulfate, pH 7.7. For the crystallization of FD mutants R202A (R218A) and S183A (S195A), we used the crystallization protocol previously described (22). For cryo protection, the crystals were transferred to a solution containing the crystallization mother liquor plus 25% v/v glycerol. Diffraction data were collected at beamlines ID23-EH1 and ID14-EH4 of the European Synchrotron Radiation Facility (ESRF, Grenoble) and beamline X06SA (PXI) of Swiss Light Source (SLS, Villigen). Space groups and cell parameters are summarized in Supplementary Table 1. Data sets were integrated and scaled using the programs MOSFLM (S3) and SCALA (S4) .
Structure determination and analysis. The crystal of C3bBD* diffracted to 3.5-Å resolution and contained two complexes per asymmetric unit. The structure was determined by molecular replacement with the program PHASER (S5) using C3c (PDB ID 2A74) (S6) without the C345C domain as initial search model, followed step-by-step by FD (PDB ID 1DSU) (22), VWA and SP domains from CVFB structure (PDB ID 3HRZ)(16), C345C, TED and CUB domains from C3b structure (PDB ID 2I07) (28) and CCP1-3 domains of FB from CVFB structure (PDB ID 3HRZ) (16). The automatic searches for the TED domain of C3b and CCP1 domain of FB yielded only one instead of two copies of each domain. The missing parts were placed manually by superposition using COOT (S7) and were adjusted by rigid-body refinement in PHASER to obtain a complete model. Refinement was done using PHENIX software (S8). Tight twofold non-crystallographic symmetry (NCS) restraints were applied to the entire model and loosened during refinement only for highly flexible regions involved in crystal contacts. The final Rwork and Rfree values were 18.9% and 24.5%, respectively. The crystal of C3bB diffracted to 4.0-Å resolution structure and contained four pro-convertase complexes in the asymmetric unit. In this case, the pro-convertase model derived from the C3bBD* structure was used as a search model for molecular replacement with PHASER, followed by NCS-restrained refinement using PHENIX and manual rebuilding with COOT. The final Rwork and Rfree values were 22.9% and 28.1%. N-linked glycans were placed into the electron densities, when visible. Due to the low resolution of the x-ray data, water molecules were introduced only for the MIDAS sites by copying their positions from the CVFB structure (3HRZ) (16). For FD mutants, we used the structure of wild-type FD (PDB ID 1DSU) (22) for molecular replacement using PHASER. Refinement was done using REFMAC5 and manual rebuilding with COOT. The final Rwork and Rfree values were 14.2% and 17.3% for the 1.2-Å resolution structure of FD S183A (S195A) and 24.0% and 28.9% for the 2.8-Å resolution structure of FD R202A (R218A). Structural analysis was performed using COOT, molecules were superposed using SSM (S9) and DynDom (S10) and inter-molecular interactions were evaluated using PISA (S11). The model of FB’s scissile bond loop into the catalytic cavity of FD was created using COOT and geometry regularization in PHENIX. To evaluate the fit of C3bB structure into the electron microscopy map (EMDB ID EMD-1583) (30), we used the program SITUS (S12). For structural comparisons, we used the following structures: C3b (PDB ID 2I07) (28), CVFB (PDB ID 3HRZ) (16), SCIN-C3bBb (PDB ID 2WIN) (13), engineered Bb fragment (PDB ID 1RRK) (S13), wild-type factor B (PDB ID 2OK5) (15), fragment C2a
S4
(PDB ID 2I6Q) (S14), wild-type factor D (PDB ID 1DSU) (22) and FD mutant with enhanced catalytic activity S81Y T198S S199W (S94Y T214S S215W) (PDB ID 1DST) (25). All molecular graphics figures were generated using PyMOL (S15).
Pro-convertase activation experiments. Assays were performed by incubating C3b (7.5 M) with Factor B (7.5 M) and Factor D (7.5 nM), in 50 mM tris-(hydroxymethyl)-aminomethane (TRIS)/HCl, 100 mM NaCl, and 2 mM MgCl (pH 7.5, 37 °C). Aliquots of each reaction mixture were removed at various times, and the reactions were quenched by boiling briefly with electrophoresis sample buffer containing 2-mercaptoethanol and SDS. At the end of the experiment, all of the quenched aliquots were run on 12% SDS polyacrylamide gels and stained with PAGE-Blue (Fermentas). The extent of reaction was determined by the comparison of formed Bb and Ba fragments to the unreacted FB. For some FD mutants, the cleavage of C3bB was also measured by surface plasmon resonance (SPR) on a Biacore 3000 instrument at 25 ºC using HBS-Mg (10 mM HEPES pH 7.4, 150 mM NaCl, 1 mM MgCl2, 0.005% Tween-20) as running buffer. Site-specifically biotinylated C3b was captured on a Biotin CAPture chip (GE Healthcare) that had been loaded with streptavidin. A double gain-of-function mutant of FB (D254G N260D) at 500 nM was injected for 3 min onto C3b to form a stable C3bB complex. After a short dissociation period, various FD mutants were injected at 1 nM for 2 minutes and the conversion to the C3bBb complex was observed as a drop in the SPR response (due to the removal of Ba). Finally, a 10 nM solution of wild-type FD was injected to confirm cleavability, and the chip surface was regenerated using the manufacturer’s regeneration solution (6 M guanidine-HCl, 250 mM NaOH). The SPR signals were processed in Scrubber (v2.0c; BioLogic Pty, Australia), including a referencing step by subtracting the responses from a C3b-free sensor chip surface. Inactivated FD mutant S183A (S195A) and the surface mutant R115C (R129C) located outside the exosite of FD were used as negative and positive controls, respectively.
C3b deposition assays. The relative activities of FD mutant in the activation of the
alternative complement pathway was tested by ELISA based on a previously described method. FD-depleted plasma (PFD) was prepared by passing plasma through a Bio-Rex 70 column. An ELISA plate was coated with Salmonella typhosa lipopolysaccharide (LPS) in PBS for 2 hours and blocked with BSA. FD or its mutants were serially diluted (0.06-32 nM) in VBS-MgEGTA (5 mM barbituric acid pH 7.4, 75 mM NaCl, 5 mM MgCl2, and 5 mM EGTA) and added to diluted PFD (1:10). Reconstituted plasma samples were transferred to the LPS-coated plate and incubated for 60 min to allow complement activation. Deposited C3b was detected by an HRP-conjugated anti-human C3 antibody (ICN Cappel). The optical density (OD) was measured at 405 nm and plotted against the concentration of FD. Control experiments were performed using FD mutants S183A and R115C.
Haemolytic assays. Rabbit erythrocytes, from rabbit blood in EDTA (Cocalico
Biologicals), were washed in GVB-MgEGTA (5 mM barbituric pH 7.4, 140 mM NaCl, 0.1% gelatin, 2.5 mM MgCl2 and 2.5 mM EGTA) until the supernatant was clear. The volume of the suspension was then adjusted so that a 1:30 dilution of the cell suspension in H2O had an optical density equal to 1 at 405 nm (corresponding to 109 cells/ml). In a
S5
preliminary titration approach, 10 µl erythrocyte suspension was mixed with different volumes of human plasma (0 - 10 ul) and adjusted to a total volume of 100 µl in GVB-MgEGTA. Water was used instead of buffer as 100 % lysis control. After incubation for 30 minutes at 37 °C, the reaction was stopped by addition of 200 µM GVB-EDTA (GVB with 20mM EDTA) and the optical density of the supernatant were measured at 405 nM. The plasma volume that gave 50 % lysis was chosen for the screening of FD mutants. Serial dilutions of the various FD mutants were performed in 50 µl GVB-MgEGTA and added to 50 µl of a suspension of rabbit erythrocytes in FD-depleted plasma (see above) and buffer in the previously titrated ratio. Incubation and read out was performed as described for the titration step. Control experiments were performed using FD mutants S183A (S195A) and R115C (R129C).
Convertase formation assays. The participation of various FD mutants in the formation of the alternative pathway C3 convertase was investigated by SPR using a Biacore 3000 at 25 ºC and HBS-Mg as running buffer. Wild-type FB (100 nM) was mixed with individual FD mutants (100 nM) and injected over site-specifically immobilized C3b (see above) for 3 min at a flow rate of 10 µl/min. The convertase decay was observed for 3 min and the residual convertase was regenerated by consecutive injections of 200 nM FH (in HBS buffer containing 3 mM EDTA) and 2 M NaCl. Pure FB and FD (wt) were injected at 100 nM as controls. The signals were processed and referenced as described above. In addition, double-referencing was performed by subtracting the responses from averaged blank injections. Control experiments were performed using FD mutants S183A (S195A) and R115C (R129C).
Binding of FB to C3b. The direct binding of FB to C3b was characterized using SPR single cycle kinetic evaluation on a Biacore 3000 instrument at 25 ºC in HBS-Mg. Biotinylated C3b was immobilized as described above and FB was injected as two-fold dilution series at a flow rate of 30 µl/min. Two sample groups consisting of five concentrations each (2-31 nM and 63-1000 nM) were consecutively injected for 2 minutes without intermittent regeneration. At the end of each group, the surface was regenerated with short injections of 0.2 M sodium carbonate pH 9.0. The signals of a C3b-free chip surface and group of five buffer blank injections were subtracted as a double referencing step. Data analysis was performed in BIAevaluation (v4; GE Healthcare) using a single cycle kinetic fitting method that was adapted to a conformational change model based on a method that was kindly provided by GE Healthcare.
Binding of FD to C3bB. The binding of FD to C3b-bound FB was characterized
using SPR on a ProteOn XPR36 instrument (Bio-Rad) at 25 ºC in HBS-Mg buffer. Biotinylated C3b was immobilized on a neutravidin-coated sensor chip (NLC; Bio-Rad) and FB (D254G N260D; 500 nM) was injected at a flow rate of 25 µl/min on all channels. A concentration series of enzymatically inactive FD S183A (S195A) (4-1000 nM) was subsequently injected to five channels and the sixth channel was used to subtract FB-related baseline drift. All signals were processed, referenced by interspot signals, and kinetically evaluated using a ligand heterogeneity model in ProteOn Manager (v2; Bio-Rad).
S6
Kinetic experiments using chromogenic substrates. Reactions with acetyl-Lys-
Arg-paranitroanilide peptide substrates (Ac-Lys-Arg-pNA, Bachem AG, Switzerland) were performed by adding varied amounts (0.5-10 mM) of substrate dissolved in 80 % v/v DMSO in a solution containing 50 mM TRIS/HCl, 150 mM NaCl (pH 7.5) to reach a final volume of 90 l. In all reactions, DMSO was added to adjust the reaction mixtures to a final concentration of 4 % v/v, and the solutions were equilibrated at 25 °C in the controlled sample compartment of a Bio-Rad model 680 microplate reader. Reaction was initiated by adding 10 l of FD stock solution (97 mM) and the absorbance at 405 nm due to formation of p-nitroaniline ( = 10400 M-1cm-1) was monitored at intervals of 2 minutes over a 600 minutes period. Reaction rates were determined from initial slopes of the progress curves, and no background correction was applied, as background hydrolysis of the p-nitroanilide substrates was found to be negligible under the conditions of the experiment. After visual inspection of double reciprocal plots, which were linear, the initial velocity values, expressed as apparent turnover values, were directly fitted to the Michaelis-Menten equation using Grafit (Erithacus Software) which provides the values of apparent kcat and KM along with their associated errors. Propagation of statistical error value was carried out as described (S16).
S7
Supporting Figures

S8
S9
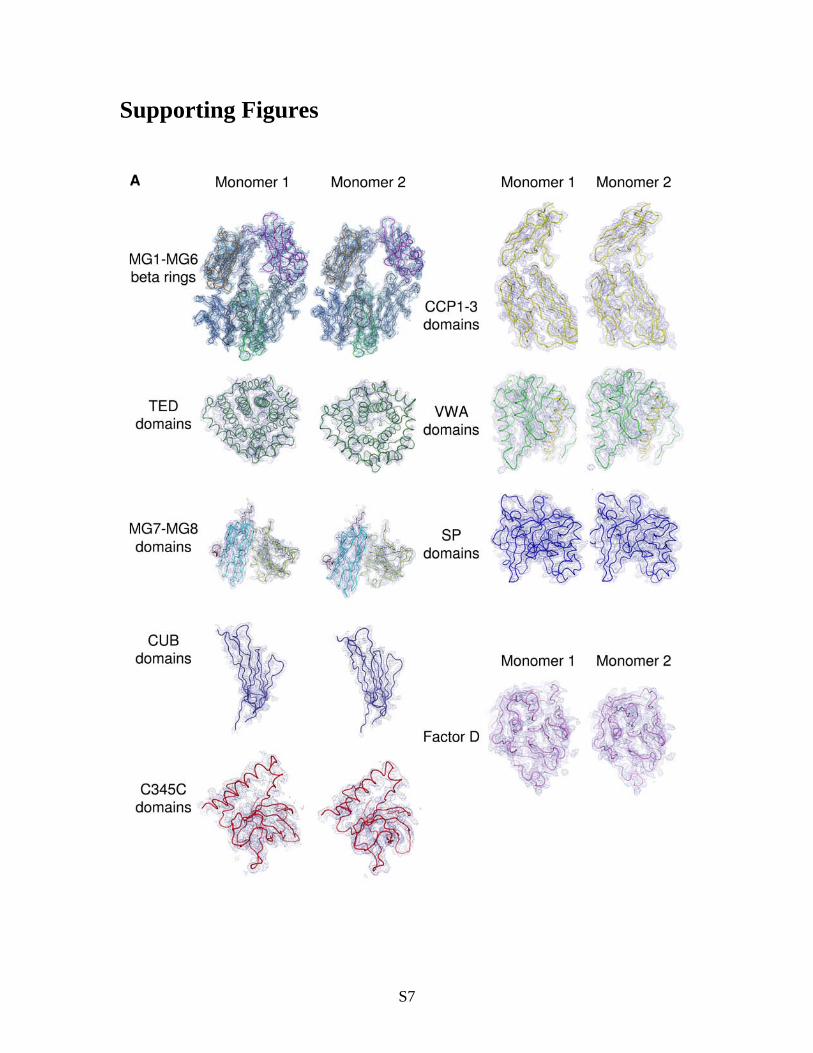
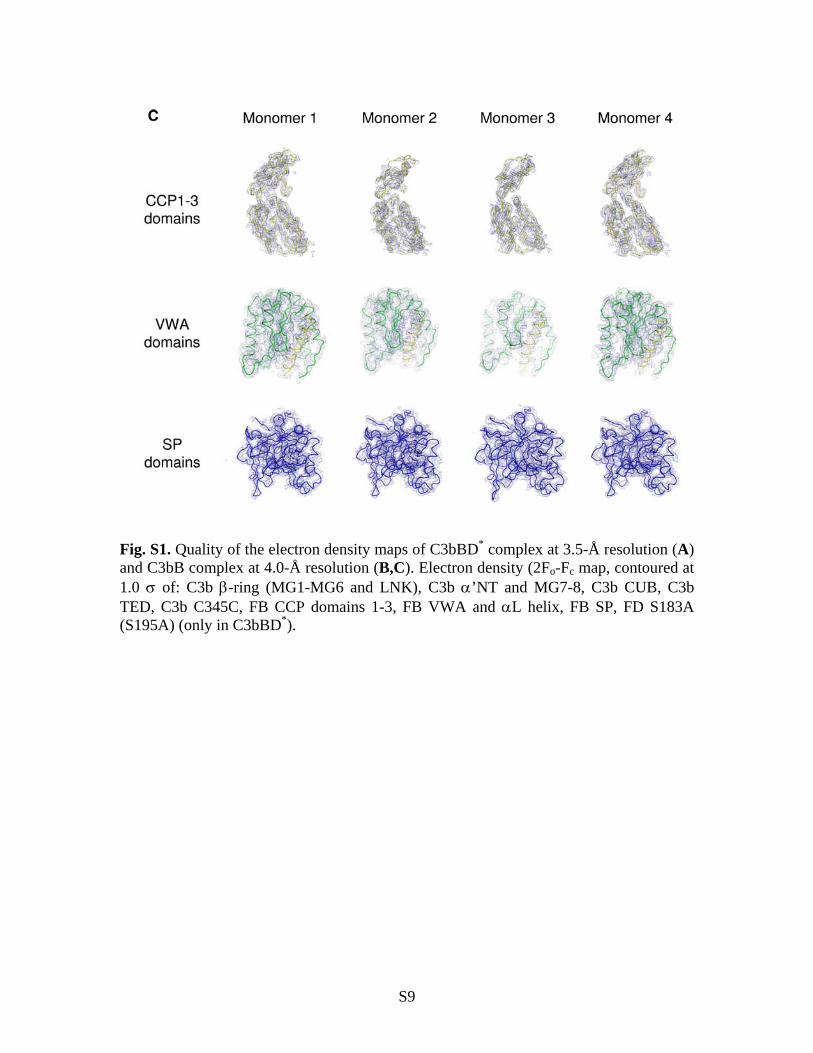
Fig. S1. Quality of the electron density maps of C3bBD* complex at 3.5-Å resolution (A) and C3bB complex at 4.0-Å resolution (B,C). Electron density (2Fo-Fc map, contoured at 1.0 of: C3b -ring (MG1-MG6 and LNK), C3b ’NT and MG7-8, C3b CUB, C3b TED, C3b C345C, FB CCP domains 1-3, FB VWA and L helix, FB SP, FD S183A (S195A) (only in C3bBD*).
S10
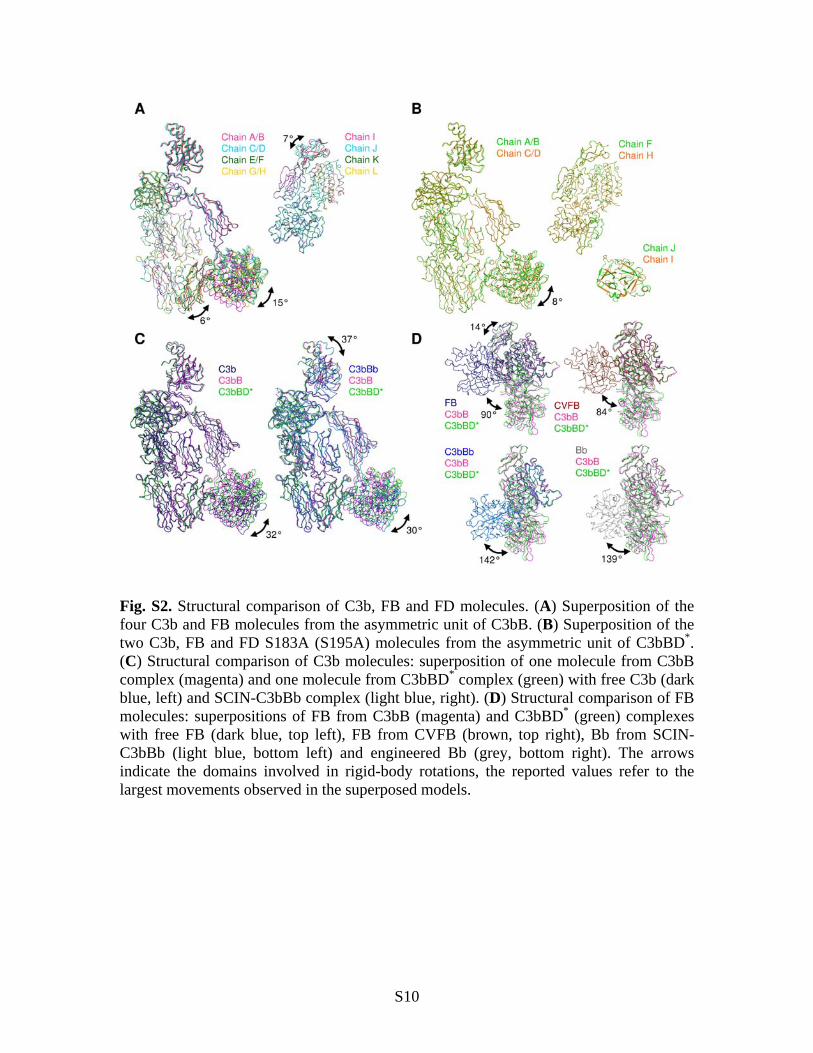
Fig. S2. Structural comparison of C3b, FB and FD molecules. (A) Superposition of the four C3b and FB molecules from the asymmetric unit of C3bB. (B) Superposition of the two C3b, FB and FD S183A (S195A) molecules from the asymmetric unit of C3bBD*. (C) Structural comparison of C3b molecules: superposition of one molecule from C3bB complex (magenta) and one molecule from C3bBD* complex (green) with free C3b (dark blue, left) and SCIN-C3bBb complex (light blue, right). (D) Structural comparison of FB molecules: superpositions of FB from C3bB (magenta) and C3bBD* (green) complexes with free FB (dark blue, top left), FB from CVFB (brown, top right), Bb from SCIN-C3bBb (light blue, bottom left) and engineered Bb (grey, bottom right). The arrows indicate the domains involved in rigid-body rotations, the reported values refer to the largest movements observed in the superposed models.
S11
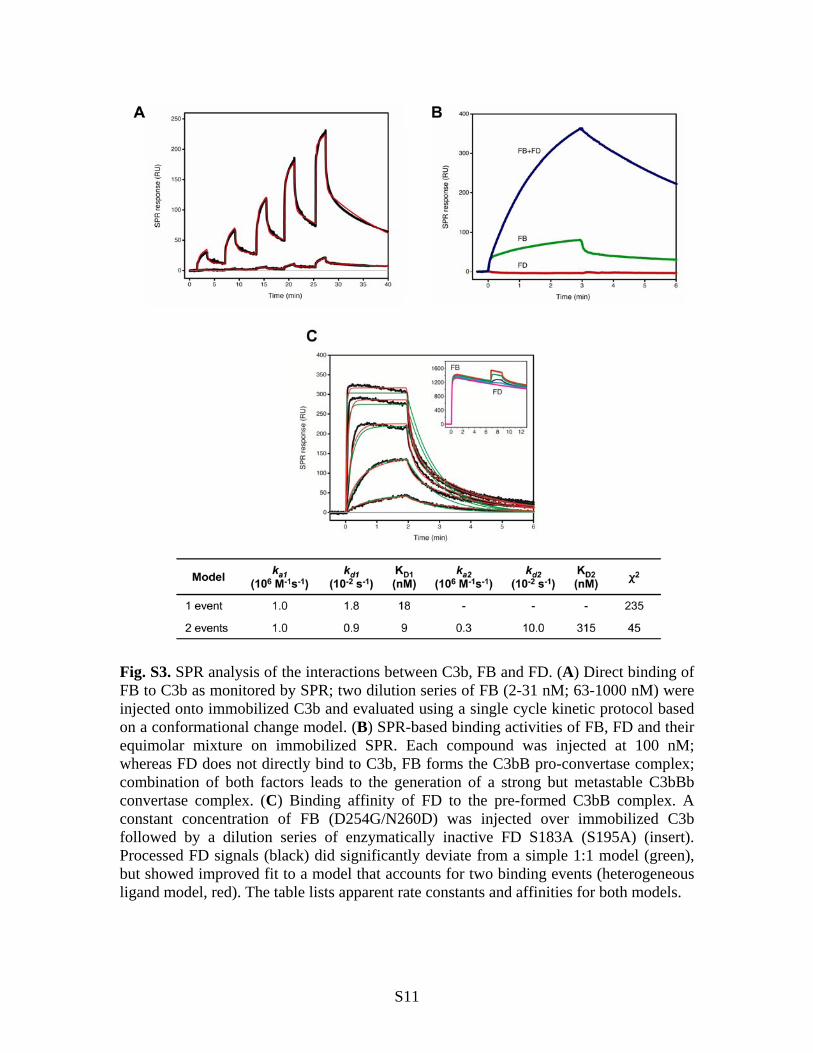
Fig. S3. SPR analysis of the interactions between C3b, FB and FD. (A) Direct binding of FB to C3b as monitored by SPR; two dilution series of FB (2-31 nM; 63-1000 nM) were injected onto immobilized C3b and evaluated using a single cycle kinetic protocol based on a conformational change model. (B) SPR-based binding activities of FB, FD and their equimolar mixture on immobilized SPR. Each compound was injected at 100 nM; whereas FD does not directly bind to C3b, FB forms the C3bB pro-convertase complex; combination of both factors leads to the generation of a strong but metastable C3bBb convertase complex. (C) Binding affinity of FD to the pre-formed C3bB complex. A constant concentration of FB (D254G/N260D) was injected over immobilized C3b followed by a dilution series of enzymatically inactive FD S183A (S195A) (insert). Processed FD signals (black) did significantly deviate from a simple 1:1 model (green), but showed improved fit to a model that accounts for two binding events (heterogeneous ligand model, red). The table lists apparent rate constants and affinities for both models.
S12
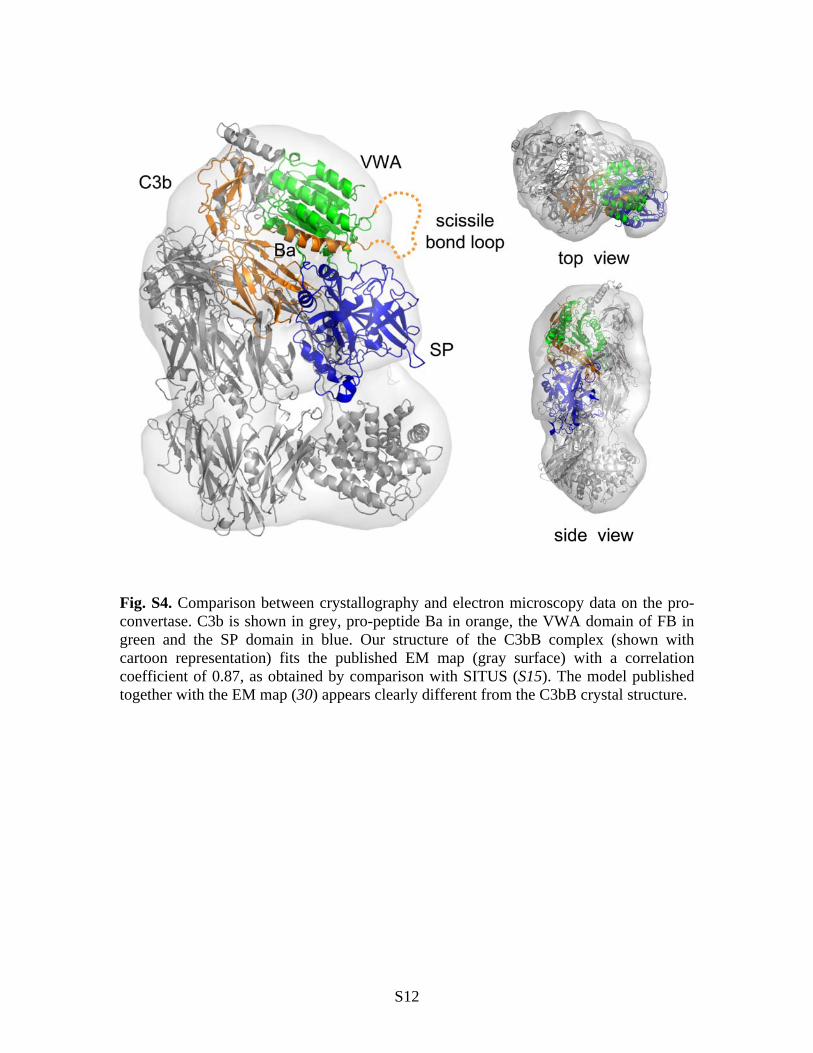
Fig. S4. Comparison between crystallography and electron microscopy data on the pro-convertase. C3b is shown in grey, pro-peptide Ba in orange, the VWA domain of FB in green and the SP domain in blue. Our structure of the C3bB complex (shown with cartoon representation) fits the published EM map (gray surface) with a correlation coefficient of 0.87, as obtained by comparison with SITUS (S15). The model published together with the EM map (30) appears clearly different from the C3bB crystal structure.
S13
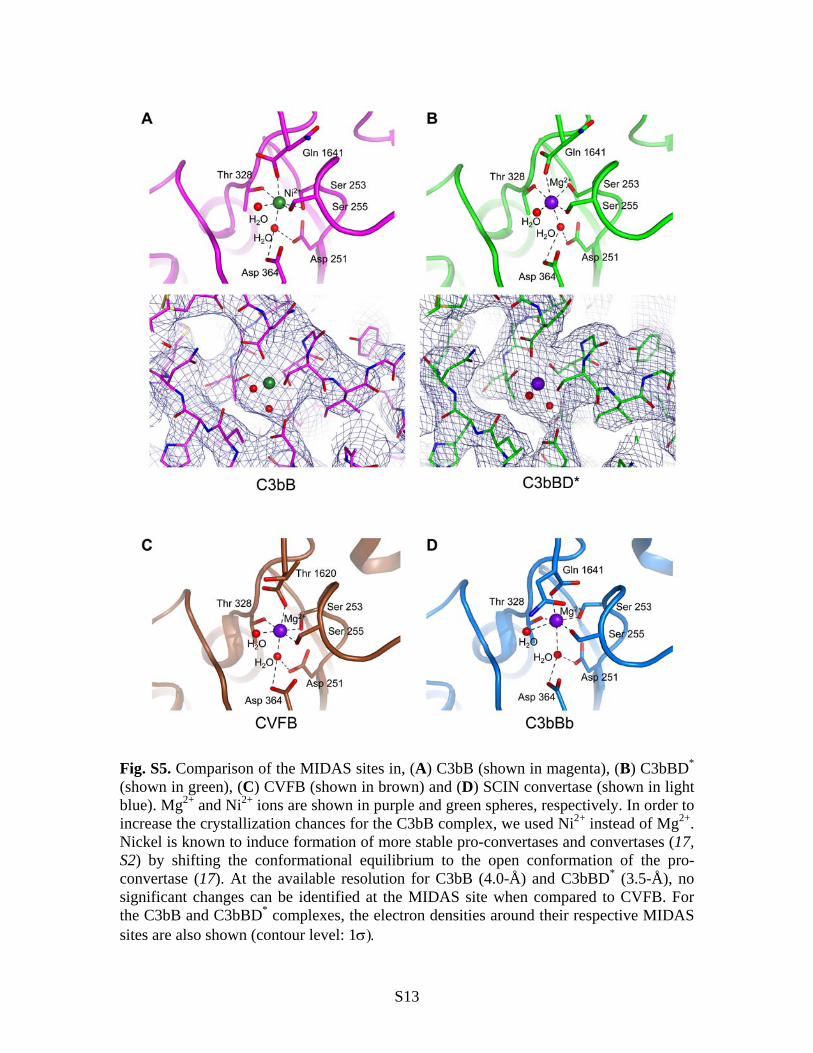
Fig. S5. Comparison of the MIDAS sites in, (A) C3bB (shown in magenta), (B) C3bBD* (shown in green), (C) CVFB (shown in brown) and (D) SCIN convertase (shown in light blue). Mg2+ and Ni2+ ions are shown in purple and green spheres, respectively. In order to increase the crystallization chances for the C3bB complex, we used Ni2+ instead of Mg2+. Nickel is known to induce formation of more stable pro-convertases and convertases (17, S2) by shifting the conformational equilibrium to the open conformation of the pro-convertase (17). At the available resolution for C3bB (4.0-Å) and C3bBD* (3.5-Å), no significant changes can be identified at the MIDAS site when compared to CVFB. For the C3bB and C3bBD* complexes, the electron densities around their respective MIDAS sites are also shown (contour level: 1
S14
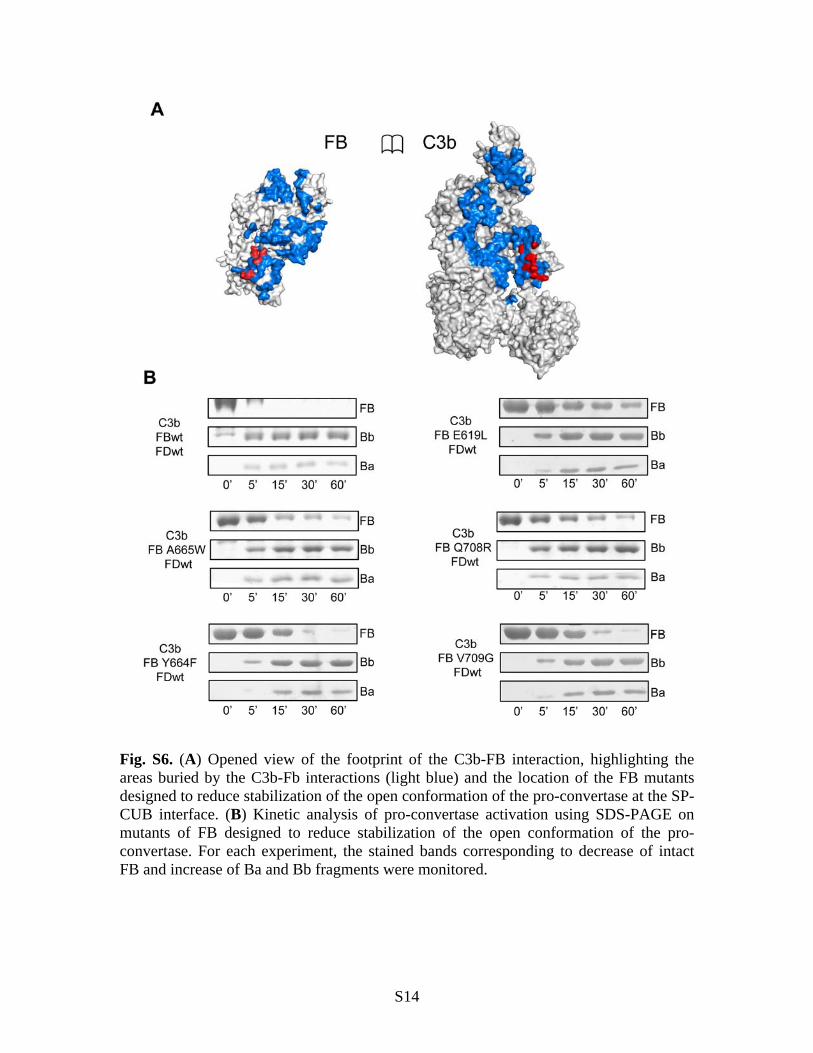
Fig. S6. (A) Opened view of the footprint of the C3b-FB interaction, highlighting the areas buried by the C3b-Fb interactions (light blue) and the location of the FB mutants designed to reduce stabilization of the open conformation of the pro-convertase at the SP-CUB interface. (B) Kinetic analysis of pro-convertase activation using SDS-PAGE on mutants of FB designed to reduce stabilization of the open conformation of the pro-convertase. For each experiment, the stained bands corresponding to decrease of intact FB and increase of Ba and Bb fragments were monitored.
S15
S16
S17
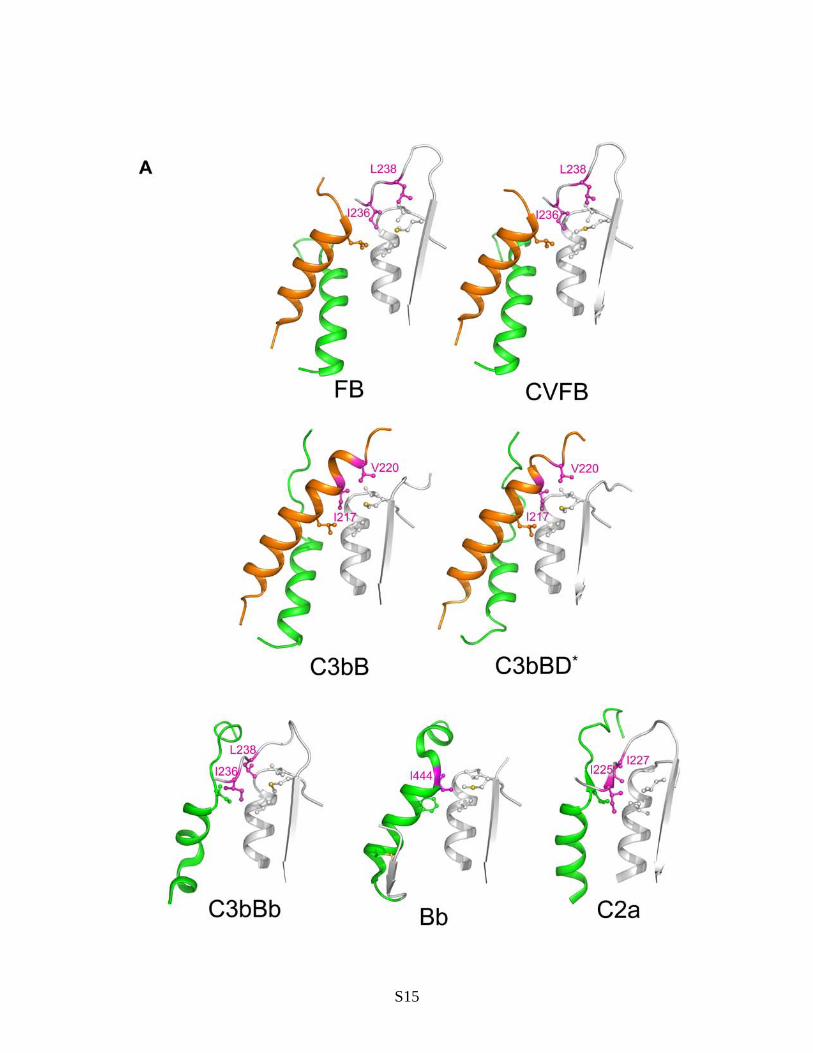
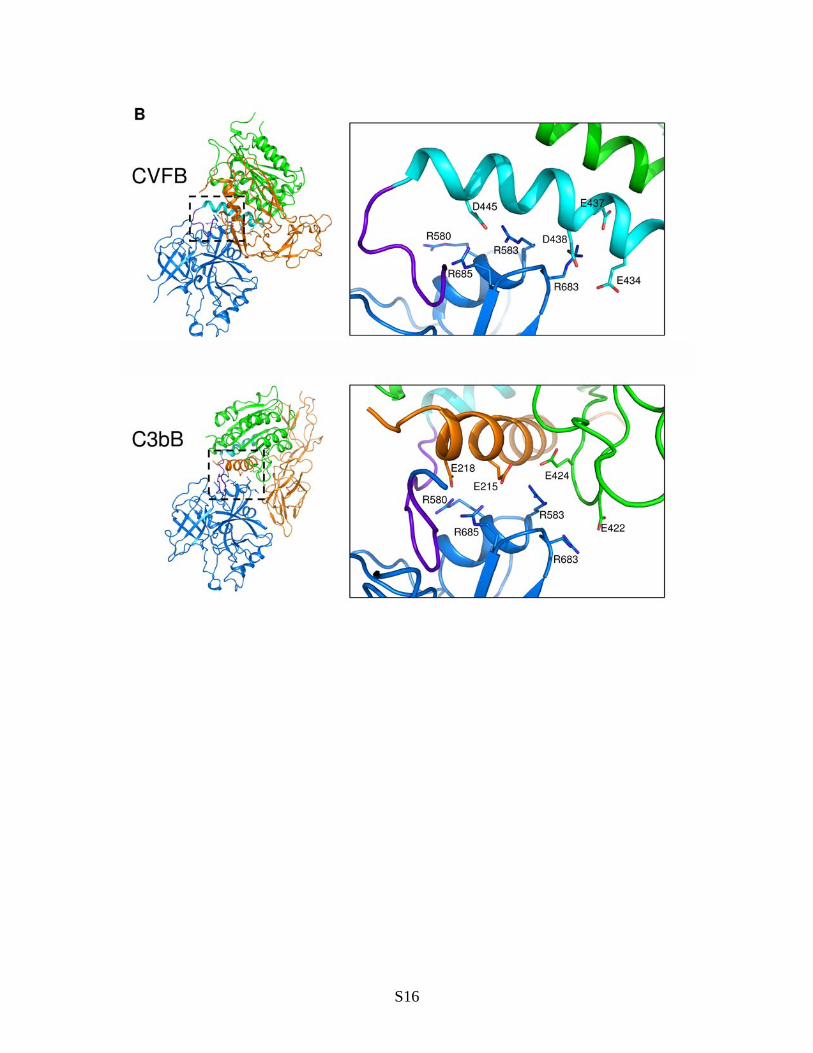
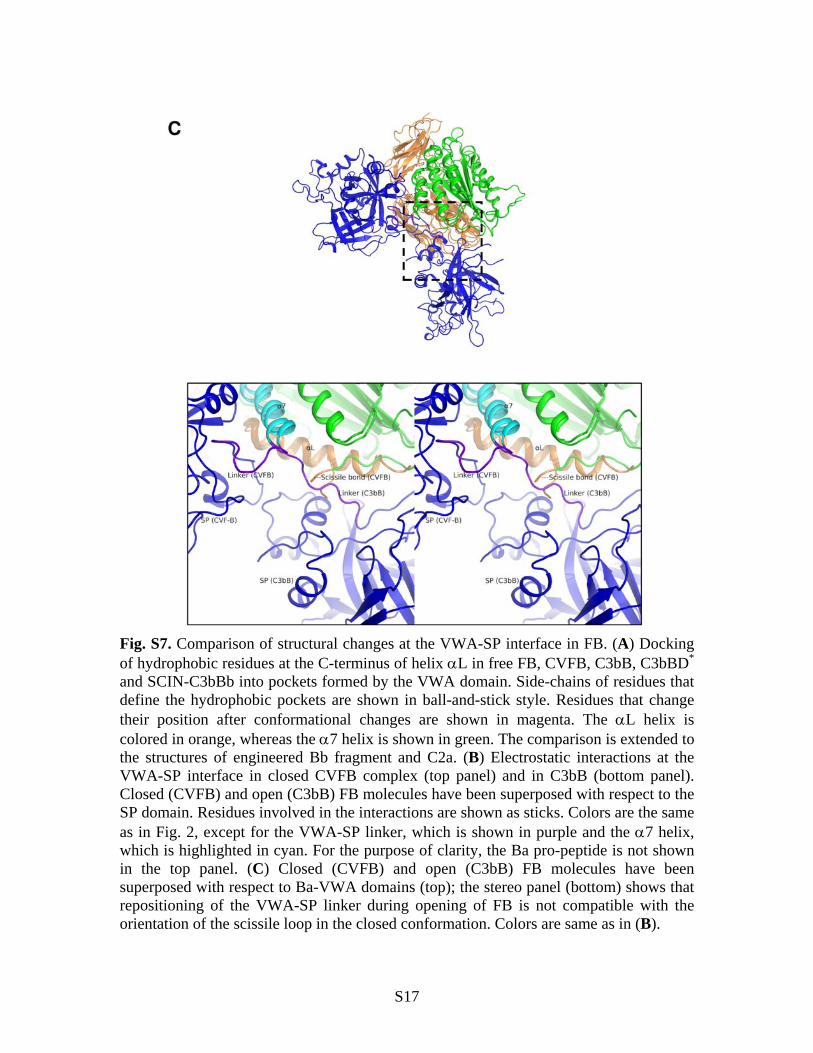
Fig. S7. Comparison of structural changes at the VWA-SP interface in FB. (A) Docking of hydrophobic residues at the C-terminus of helix L in free FB, CVFB, C3bB, C3bBD* and SCIN-C3bBb into pockets formed by the VWA domain. Side-chains of residues that define the hydrophobic pockets are shown in ball-and-stick style. Residues that change their position after conformational changes are shown in magenta. The L helix is colored in orange, whereas the 7 helix is shown in green. The comparison is extended to the structures of engineered Bb fragment and C2a. (B) Electrostatic interactions at the VWA-SP interface in closed CVFB complex (top panel) and in C3bB (bottom panel). Closed (CVFB) and open (C3bB) FB molecules have been superposed with respect to the SP domain. Residues involved in the interactions are shown as sticks. Colors are the same as in Fig. 2, except for the VWA-SP linker, which is shown in purple and the 7 helix, which is highlighted in cyan. For the purpose of clarity, the Ba pro-peptide is not shown in the top panel. (C) Closed (CVFB) and open (C3bB) FB molecules have been superposed with respect to Ba-VWA domains (top); the stereo panel (bottom) shows that repositioning of the VWA-SP linker during opening of FB is not compatible with the orientation of the scissile loop in the closed conformation. Colors are same as in (B).
S18
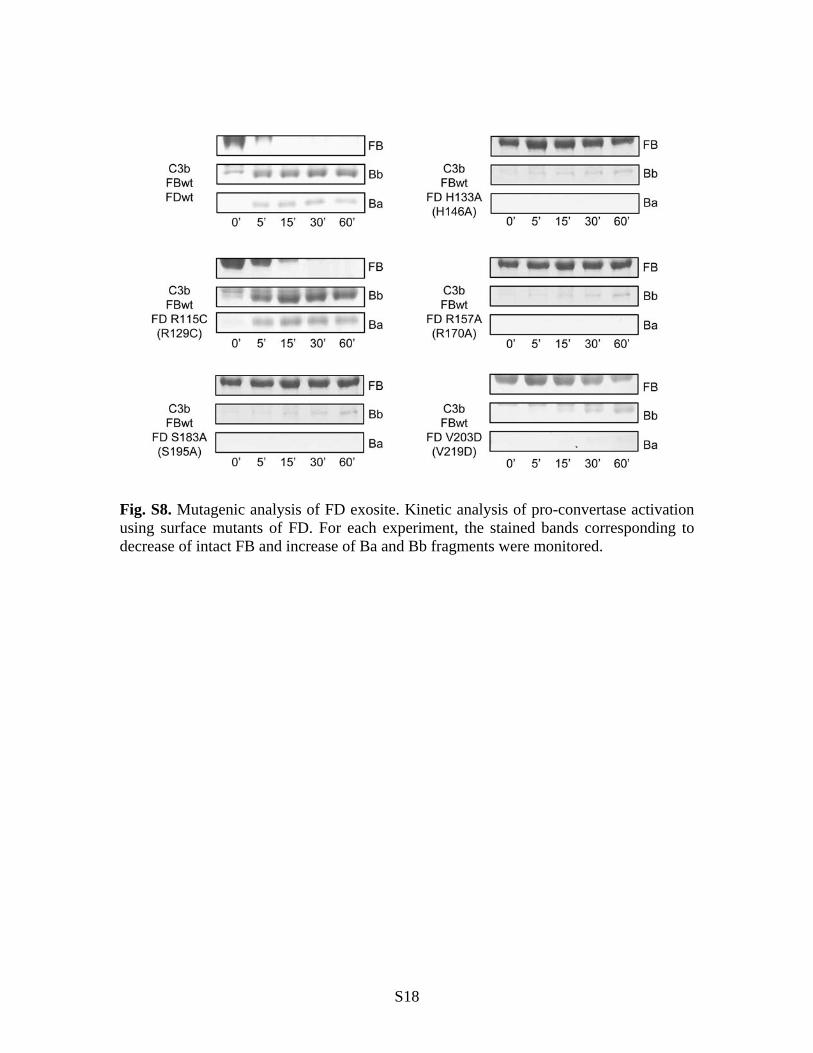
Fig. S8. Mutagenic analysis of FD exosite. Kinetic analysis of pro-convertase activation using surface mutants of FD. For each experiment, the stained bands corresponding to decrease of intact FB and increase of Ba and Bb fragments were monitored.
S19
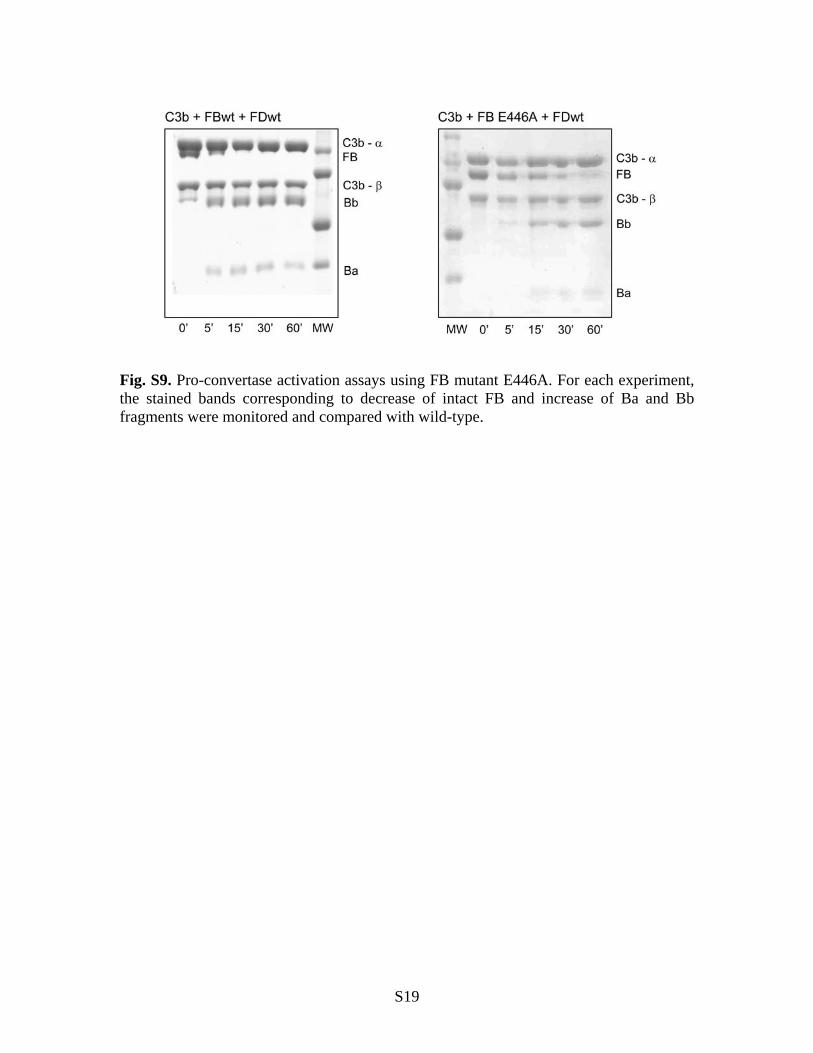
Fig. S9. Pro-convertase activation assays using FB mutant E446A. For each experiment, the stained bands corresponding to decrease of intact FB and increase of Ba and Bb fragments were monitored and compared with wild-type.
S20
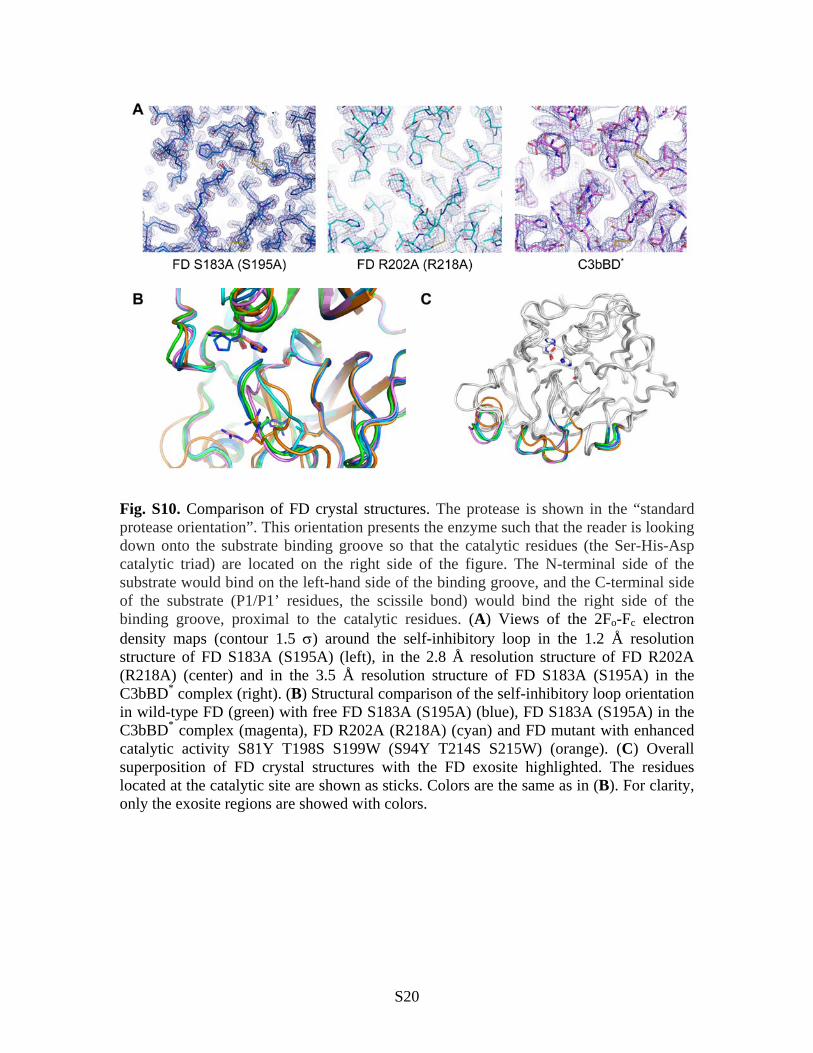
Fig. S10. Comparison of FD crystal structures. The protease is shown in the “standard protease orientation”. This orientation presents the enzyme such that the reader is looking down onto the substrate binding groove so that the catalytic residues (the Ser-His-Asp catalytic triad) are located on the right side of the figure. The N-terminal side of the substrate would bind on the left-hand side of the binding groove, and the C-terminal side of the substrate (P1/P1’ residues, the scissile bond) would bind the right side of the binding groove, proximal to the catalytic residues. (A) Views of the 2Fo-Fc electron density maps (contour 1.5 ) around the self-inhibitory loop in the 1.2 Å resolution structure of FD S183A (S195A) (left), in the 2.8 Å resolution structure of FD R202A (R218A) (center) and in the 3.5 Å resolution structure of FD S183A (S195A) in the C3bBD* complex (right). (B) Structural comparison of the self-inhibitory loop orientation in wild-type FD (green) with free FD S183A (S195A) (blue), FD S183A (S195A) in the C3bBD* complex (magenta), FD R202A (R218A) (cyan) and FD mutant with enhanced catalytic activity S81Y T198S S199W (S94Y T214S S215W) (orange). (C) Overall superposition of FD crystal structures with the FD exosite highlighted. The residues located at the catalytic site are shown as sticks. Colors are the same as in (B). For clarity, only the exosite regions are showed with colors.
S21
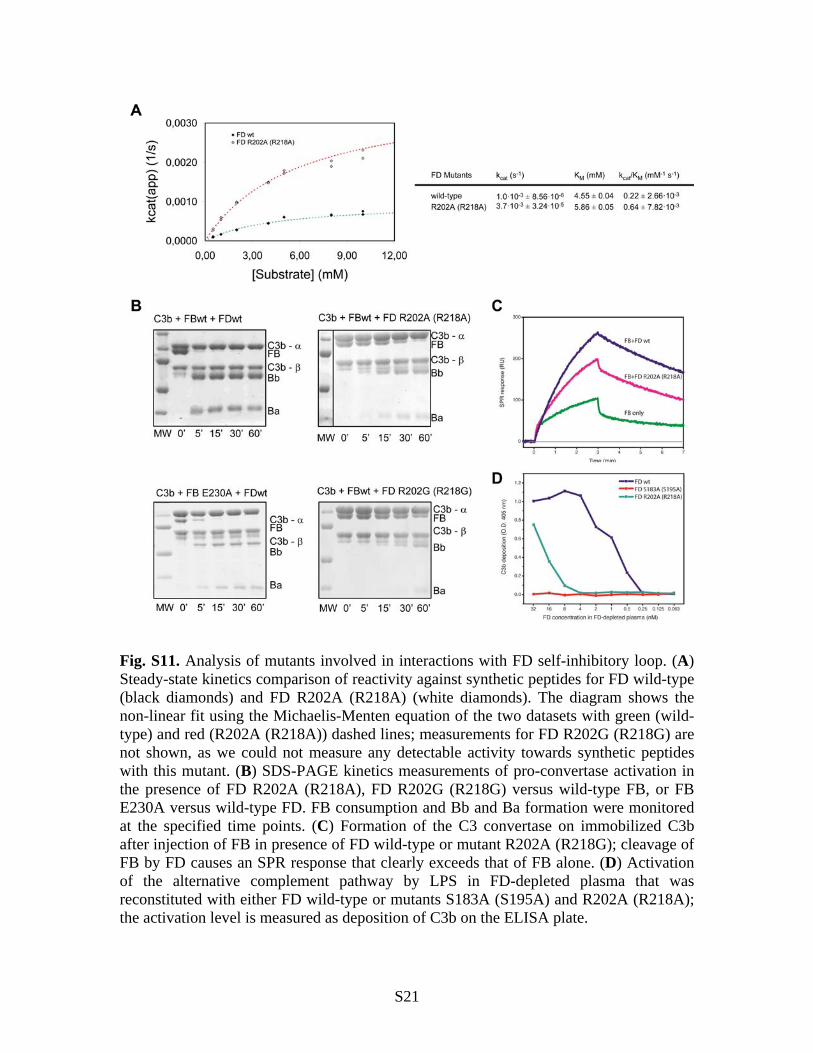
Fig. S11. Analysis of mutants involved in interactions with FD self-inhibitory loop. (A) Steady-state kinetics comparison of reactivity against synthetic peptides for FD wild-type (black diamonds) and FD R202A (R218A) (white diamonds). The diagram shows the non-linear fit using the Michaelis-Menten equation of the two datasets with green (wild-type) and red (R202A (R218A)) dashed lines; measurements for FD R202G (R218G) are not shown, as we could not measure any detectable activity towards synthetic peptides with this mutant. (B) SDS-PAGE kinetics measurements of pro-convertase activation in the presence of FD R202A (R218A), FD R202G (R218G) versus wild-type FB, or FB E230A versus wild-type FD. FB consumption and Bb and Ba formation were monitored at the specified time points. (C) Formation of the C3 convertase on immobilized C3b after injection of FB in presence of FD wild-type or mutant R202A (R218G); cleavage of FB by FD causes an SPR response that clearly exceeds that of FB alone. (D) Activation of the alternative complement pathway by LPS in FD-depleted plasma that was reconstituted with either FD wild-type or mutants S183A (S195A) and R202A (R218A); the activation level is measured as deposition of C3b on the ELISA plate.
S22
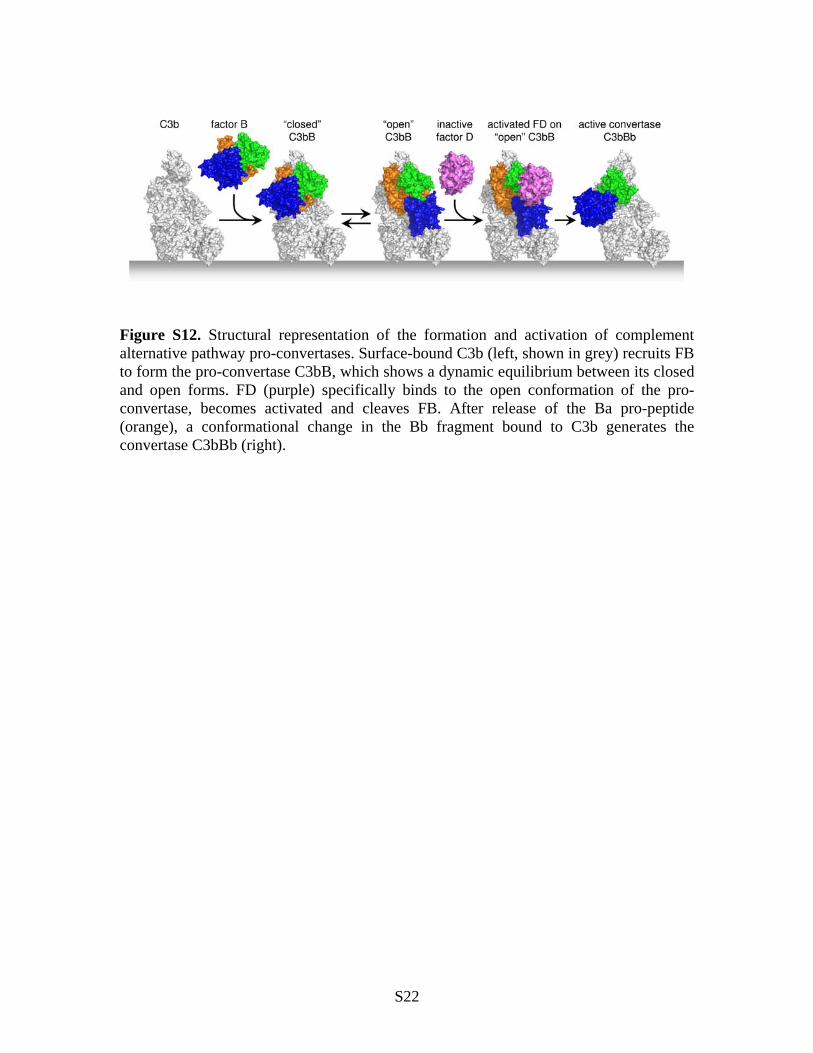
Figure S12. Structural representation of the formation and activation of complement alternative pathway pro-convertases. Surface-bound C3b (left, shown in grey) recruits FB to form the pro-convertase C3bB, which shows a dynamic equilibrium between its closed and open forms. FD (purple) specifically binds to the open conformation of the pro-convertase, becomes activated and cleaves FB. After release of the Ba pro-peptide (orange), a conformational change in the Bb fragment bound to C3b generates the convertase C3bBb (right).
S23
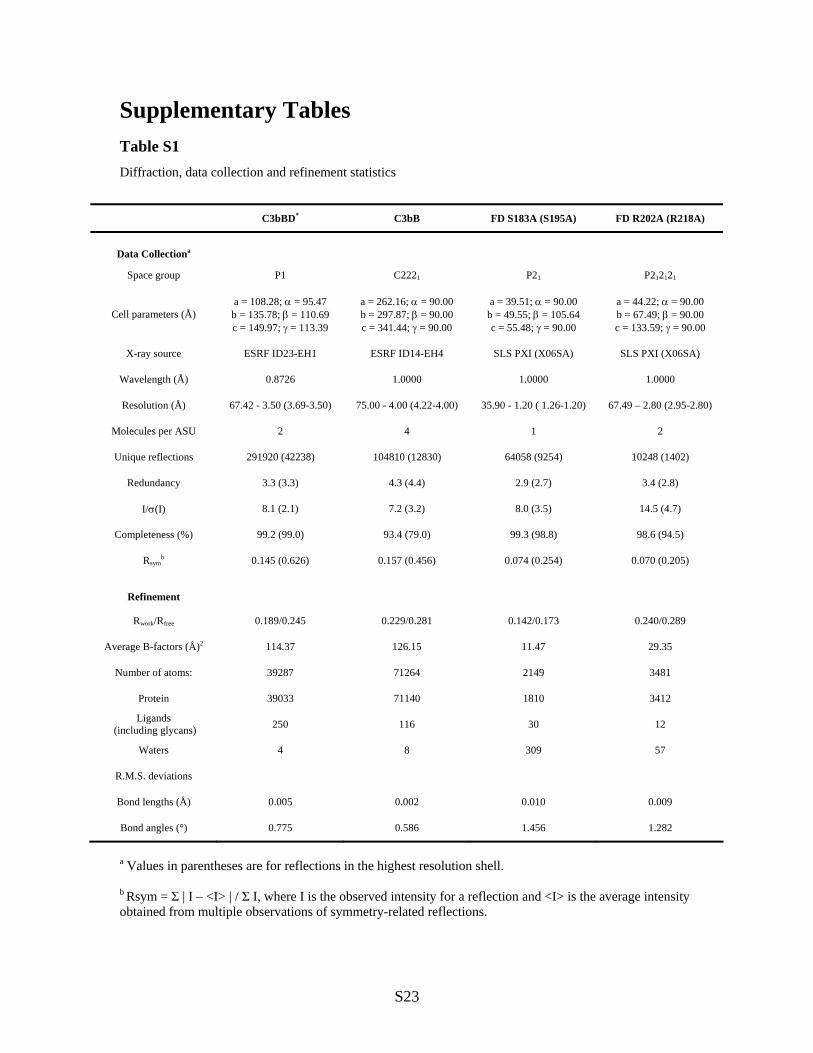
Supplementary Tables Table S1 Diffraction, data collection and refinement statistics
C3bBD* C3bB FD S183A (S195A) FD R202A (R218A)
Data Collectiona
Space group P1 C2221 P21 P212121
Cell parameters (Å) a = 108.28; = 95.47 b = 135.78; = 110.69 c = 149.97; = 113.39
a = 262.16; = 90.00 b = 297.87; = 90.00 c = 341.44; = 90.00
a = 39.51; = 90.00 b = 49.55; = 105.64 c = 55.48; = 90.00
a = 44.22; = 90.00 b = 67.49; = 90.00 c = 133.59; = 90.00
X-ray source ESRF ID23-EH1 ESRF ID14-EH4 SLS PXI (X06SA) SLS PXI (X06SA)
Wavelength (Å) 0.8726 1.0000 1.0000 1.0000
Resolution (Å) 67.42 - 3.50 (3.69-3.50) 75.00 - 4.00 (4.22-4.00) 35.90 - 1.20 ( 1.26-1.20) 67.49 – 2.80 (2.95-2.80)
Molecules per ASU 2 4 1 2
Unique reflections 291920 (42238) 104810 (12830) 64058 (9254) 10248 (1402)
Redundancy 3.3 (3.3) 4.3 (4.4) 2.9 (2.7) 3.4 (2.8)
I/(I) 8.1 (2.1) 7.2 (3.2) 8.0 (3.5) 14.5 (4.7)
Completeness (%) 99.2 (99.0) 93.4 (79.0) 99.3 (98.8) 98.6 (94.5)
Rsymb 0.145 (0.626) 0.157 (0.456) 0.074 (0.254) 0.070 (0.205)
Refinement
Rwork/Rfree 0.189/0.245 0.229/0.281 0.142/0.173 0.240/0.289
Average B-factors (Å)2 114.37 126.15 11.47 29.35
Number of atoms: 39287 71264 2149 3481
Protein 39033 71140 1810 3412
Ligands (including glycans) 250 116 30 12
Waters 4 8 309 57
R.M.S. deviations
Bond lengths (Å) 0.005 0.002 0.010 0.009
Bond angles (°) 0.775 0.586 1.456 1.282
a Values in parentheses are for reflections in the highest resolution shell. b Rsym = Σ | I – <I> | / Σ I, where I is the observed intensity for a reflection and <I> is the average intensity obtained from multiple observations of symmetry-related reflections.
S24
Supporting References and Notes S1. P. J. Reeves, N. Callewaert, R. Contreras, H. G. Khorana, Proc Natl Acad Sci U S
A 99, 13419 (Oct 15, 2002). S2. D. E. Hourcade, L. M. Mitchell, T. J. Oglesby, J Immunol 162, 2906 (Mar 1,
1999). S3. A. G. W. Leslie, Joint CCP4 + ESF-EAMCB Newsletter on Protein
Crystallography 26, (1992). S4. Acta Crystallogr D Biol Crystallogr 50, 760 (Sep 1, 1994). S5. A. J. McCoy et al., J Appl Crystallogr 40, 658 (Aug 1, 2007). S6. B. J. Janssen et al., Nature 437, 505 (Sep 22, 2005). S7. P. Emsley, B. Lohkamp, W. G. Scott, K. Cowtan, Acta Crystallographica Section
D 66, 486 (2010). S8. P. D. Adams et al., Acta Crystallogr D Biol Crystallogr 66, 213 (Feb, 2010). S9. E. Krissinel, K. Henrick, Acta Crystallogr D Biol Crystallogr 60, 2256 (Dec,
2004). S10. S. Hayward, H. J. Berendsen, Proteins 30, 144 (Feb 1, 1998). S11. E. Krissinel, K. Henrick, J Mol Biol 372, 774 (Sep 21, 2007). S12. W. Wriggers, Biophys Rev 2, 21 (Feb, 2010). S13. K. Ponnuraj et al., Mol Cell 14, 17 (Apr 9, 2004). S14. F. J. Milder et al., Structure 14, 1587 (Oct, 2006). S15. W. L. Delano, The PyMOL Molecular Graphics System (DeLano Scientific, San
Carlos, CA, 2002), http://pymol.sourceforge.net. S16. P. H. Bevington, Data Reduction and Error Analysis for the Physical Sciences.
(McGraw-Hill, New York, 1969), pp. 56–62.