Embed Size (px)
Citation preview
S1
S1
Supplementary Information NaNO2-Activated, Iron-TEMPO Catalyst System for Aerobic Alcohol Oxidation
under Mild Conditions
Naiwei Wang, Renhua Liu*, Jiping Chen, Xinmiao Liang* Dalian Institute of Chemical Physics, the Chinese Academy of Sciences, Dalian, 116023, People’s Republic of China *To whom correspondence should be address. E-mail: [email protected]; [email protected] 1. Experimental Section (2 page). 2. Experimental Data (1 page). 3. GC diagram (50 figures)
S2
S2
NaNO2-Activated, Iron-TEMPO Catalyst System for Aerobic Alcohol Oxidation under
Mild Conditions
Naiwei Wang, Renhua Liu*, Jiping Chen, Xinmiao Liang*, Dalian Institute of Chemical Physics, the Chinese Academy of Sciences, Dalian, 116023, People’s Republic of China *To whom correspondence should be address. E-mail: [email protected]; [email protected] Experimental Section General. Equipment and Material Experimental Section General Equipment and Material GC analysis of determination of conversions and selectivities was performed on a GC-9790. Benzyl alcohol, 1-octanol, 2-octanol, 4-chloro-benzyl, 4-methyl-benzyl alcohol, 2-pyridinyl methanol, cyclohexanol, 3-Methyl-but-2-en-1-ol, dichloromethane, trifluorotoluene were domestic reagent without further purification. TEMPO, methyl phenyl sulfide, α-methyl-benzyl alcohol, and 2-thionyl methanol are purchased from Acros directly used for oxidation without further purification. General procedure of TEMPO-catalyzed aerobic oxidation under air: The oxidation of alcohols was carried out under air in a 50ml three-necked round-bottom flask equipped a magnetic stirrer. Typically, the alcohol (10.0mmol) and TEMPO (0.5mmol) were dissolved in 10ml trifluorotoluene. FeCl3·6H2O( 0.5mmol) was added followed by NaNO2(0.5mmol). The resulting mixture was stirred at room temperature and ambient pressure. The conversion and selectivity of the reaction was detected by GC without any purification. General procedure of TEMPO-catalyzed aerobic oxidation under oxygen: All experiments were carried out in a closed Teflon-lined 316L stainless steel autoclave (300 mL), the initial atmospheric air in the autoclave did not exchange for all oxidations. To a Teflon-lines 316L stainless steel autoclave (300 mL), added 10.00 mL of CH2Cl2, 135.2mg of FeCl3·6H2O (0.5mmol), 15.6 mg of TEMPO (0.1 mmol), 34.5mg of NaNO2 (0.5 mmol) and 10.0 mmol of alcohol substrate. Then closed the autoclave and charged oxygen to 0.1MPa. Put the autoclave into the oil bath, which was preheated to 80℃. A heating period of autoclave to desired temperature was excluded. After the reaction complete, cooled to room temperature and carefully depressurized the autoclave. Diluted the sample with CH2Cl2 and detected the conversion and selectivity by GC without any purification. the liquid in the autoclave was transferred into a separation funnel, carefully

S3
S3
washed the autoclave with CH2Cl2, combined all organic solutions. The organic mixture was washed with aqueous Na2S2O3 to remove the residual oxidants and TEMPO. The organic layer was dried over anhydrous Na2SO4, concentrated to dryness. The yield was calculated based on 10.0 mmol of substrate.
General GC conditions: HP-5 column, 30m x 0.32mm (id); FID detector, 250 oC;
injection: 250 oC; carrier gas: nitrogen; carrier gas rate: 0.8 mL / min; area normalization.
The products were detected under a condition as: column temperature: 40℃ for 10 minutes, raising to 250℃in a rate of 10℃/ min. TEMPO and solvent were also detected under this condition, and their corresponding peak areas were deleted in the GC diagrams.
S4
S4
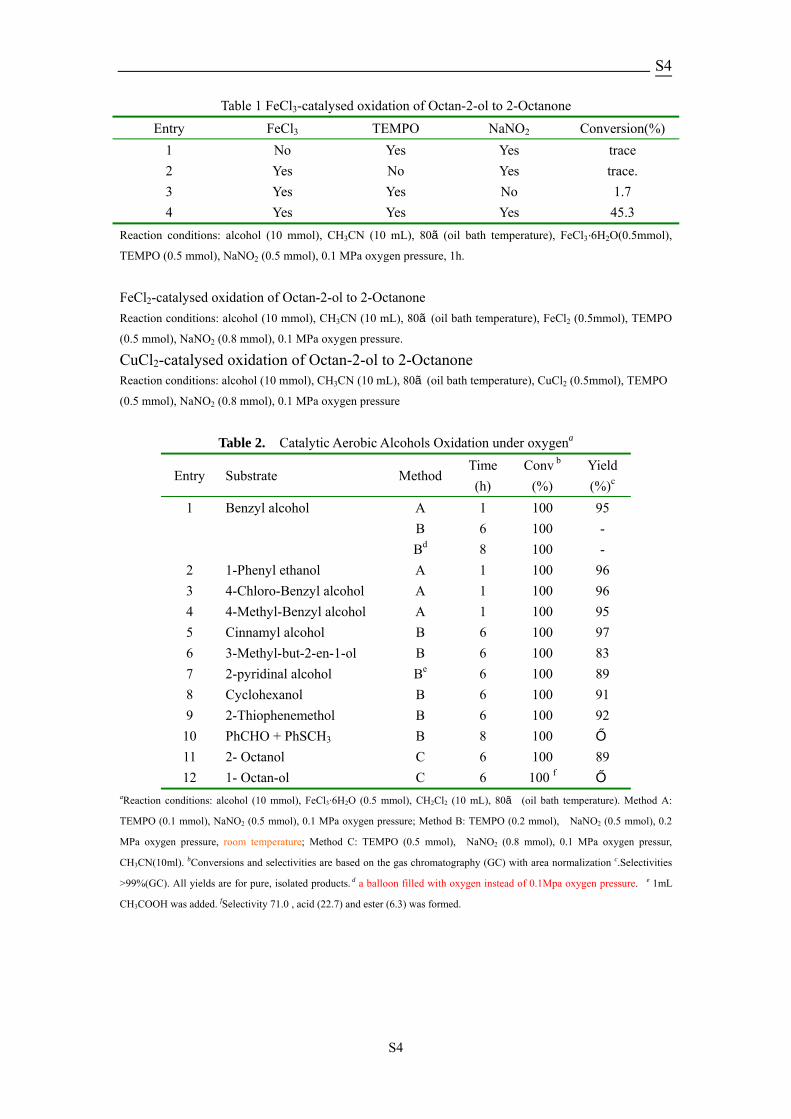
Table 1 FeCl3-catalysed oxidation of Octan-2-ol to 2-Octanone Entry FeCl3 TEMPO NaNO2 Conversion(%)
1 No Yes Yes trace 2 Yes No Yes trace. 3 Yes Yes No 1.7 4 Yes Yes Yes 45.3
Reaction conditions: alcohol (10 mmol), CH3CN (10 mL), 80℃(oil bath temperature), FeCl3·6H2O(0.5mmol),
TEMPO (0.5 mmol), NaNO2 (0.5 mmol), 0.1 MPa oxygen pressure, 1h.
FeCl2-catalysed oxidation of Octan-2-ol to 2-Octanone
Reaction conditions: alcohol (10 mmol), CH3CN (10 mL), 80℃(oil bath temperature), FeCl2 (0.5mmol), TEMPO
(0.5 mmol), NaNO2 (0.8 mmol), 0.1 MPa oxygen pressure.
CuCl2-catalysed oxidation of Octan-2-ol to 2-Octanone Reaction conditions: alcohol (10 mmol), CH3CN (10 mL), 80℃(oil bath temperature), CuCl2 (0.5mmol), TEMPO
(0.5 mmol), NaNO2 (0.8 mmol), 0.1 MPa oxygen pressure
Table 2. Catalytic Aerobic Alcohols Oxidation under oxygena
Entry Substrate Method Time (h)
Conv b (%)
Yield (%)c
1 Benzyl alcohol A 1 100 95 B 6 100 - Bd 8 100 - 2 1-Phenyl ethanol A 1 100 96 3 4-Chloro-Benzyl alcohol A 1 100 96 4 4-Methyl-Benzyl alcohol A 1 100 95 5 Cinnamyl alcohol B 6 100 97 6 3-Methyl-but-2-en-1-ol B 6 100 83 7 2-pyridinal alcohol Be 6 100 89 8 Cyclohexanol B 6 100 91 9 2-Thiophenemethol B 6 100 92
10 PhCHO + PhSCH3 B 8 100 - 11 2- Octanol C 6 100 89 12 1- Octan-ol C 6 100 f -
aReaction conditions: alcohol (10 mmol), FeCl3·6H2O (0.5 mmol), CH2Cl2 (10 mL), 80℃ (oil bath temperature). Method A:
TEMPO (0.1 mmol), NaNO2 (0.5 mmol), 0.1 MPa oxygen pressure; Method B: TEMPO (0.2 mmol), NaNO2 (0.5 mmol), 0.2
MPa oxygen pressure, room temperature; Method C: TEMPO (0.5 mmol), NaNO2 (0.8 mmol), 0.1 MPa oxygen pressur,
CH3CN(10ml). bConversions and selectivities are based on the gas chromatography (GC) with area normalization c.Selectivities
>99%(GC). All yields are for pure, isolated products. d a balloon filled with oxygen instead of 0.1Mpa oxygen pressure. e 1mL
CH3COOH was added. fSelectivity 71.0 , acid (22.7) and ester (6.3) was formed.
S5
S5
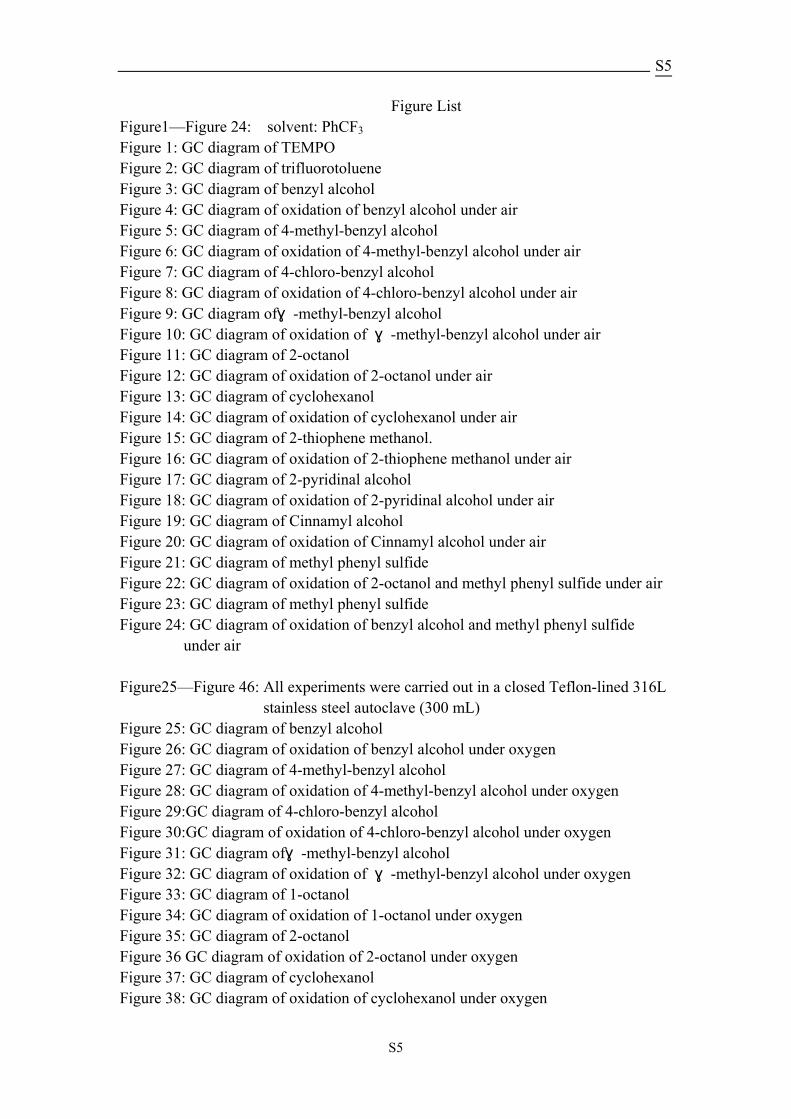
Figure List Figure1—Figure 24: solvent: PhCF3
Figure 1: GC diagram of TEMPO Figure 2: GC diagram of trifluorotoluene Figure 3: GC diagram of benzyl alcohol Figure 4: GC diagram of oxidation of benzyl alcohol under air Figure 5: GC diagram of 4-methyl-benzyl alcohol Figure 6: GC diagram of oxidation of 4-methyl-benzyl alcohol under air Figure 7: GC diagram of 4-chloro-benzyl alcohol Figure 8: GC diagram of oxidation of 4-chloro-benzyl alcohol under air Figure 9: GC diagram ofα-methyl-benzyl alcohol Figure 10: GC diagram of oxidation of α-methyl-benzyl alcohol under air Figure 11: GC diagram of 2-octanol Figure 12: GC diagram of oxidation of 2-octanol under air Figure 13: GC diagram of cyclohexanol Figure 14: GC diagram of oxidation of cyclohexanol under air Figure 15: GC diagram of 2-thiophene methanol. Figure 16: GC diagram of oxidation of 2-thiophene methanol under air Figure 17: GC diagram of 2-pyridinal alcohol Figure 18: GC diagram of oxidation of 2-pyridinal alcohol under air Figure 19: GC diagram of Cinnamyl alcohol Figure 20: GC diagram of oxidation of Cinnamyl alcohol under air Figure 21: GC diagram of methyl phenyl sulfide Figure 22: GC diagram of oxidation of 2-octanol and methyl phenyl sulfide under air Figure 23: GC diagram of methyl phenyl sulfide Figure 24: GC diagram of oxidation of benzyl alcohol and methyl phenyl sulfide
under air Figure25—Figure 46: All experiments were carried out in a closed Teflon-lined 316L
stainless steel autoclave (300 mL) Figure 25: GC diagram of benzyl alcohol Figure 26: GC diagram of oxidation of benzyl alcohol under oxygen Figure 27: GC diagram of 4-methyl-benzyl alcohol Figure 28: GC diagram of oxidation of 4-methyl-benzyl alcohol under oxygen Figure 29:GC diagram of 4-chloro-benzyl alcohol Figure 30:GC diagram of oxidation of 4-chloro-benzyl alcohol under oxygen Figure 31: GC diagram ofα-methyl-benzyl alcohol Figure 32: GC diagram of oxidation of α-methyl-benzyl alcohol under oxygen Figure 33: GC diagram of 1-octanol Figure 34: GC diagram of oxidation of 1-octanol under oxygen Figure 35: GC diagram of 2-octanol Figure 36 GC diagram of oxidation of 2-octanol under oxygen Figure 37: GC diagram of cyclohexanol Figure 38: GC diagram of oxidation of cyclohexanol under oxygen
S6
S6
Figure 39: GC diagram of 2-thiophene methanol. Figure 40: GC diagram of oxidation of 2-thiophene methanol under oxygen Figure 41: GC diagram of 2-pyridinal alcohol Figure 42: GC diagram of oxidation of 2-pyridinal alcohol under oxygen Figure 43: GC diagram of Cinnamyl alcohol Figure 44: GC diagram of oxidation of Cinnamyl alcohol under oxygen Figure 45: GC diagram of 2-octanol Figure 46 GC diagram of oxidation of 2-octanol under oxygen (CuCl2 in place of
FeCl3) Figure 47: GC diagram of 2-octanol of 3-Methyl-but-2-en-1-ol Figure 48: GC diagram of 2-octanol of 3-Methyl-but-2-en-1-ol under oxygen Figure 49: GC diagram of benzyl alcohol and methyl phenyl sulfide Figure 50: GC diagram of oxidation of benzyl alcohol and methyl phenyl sulfide
under oxygen
S7
S7
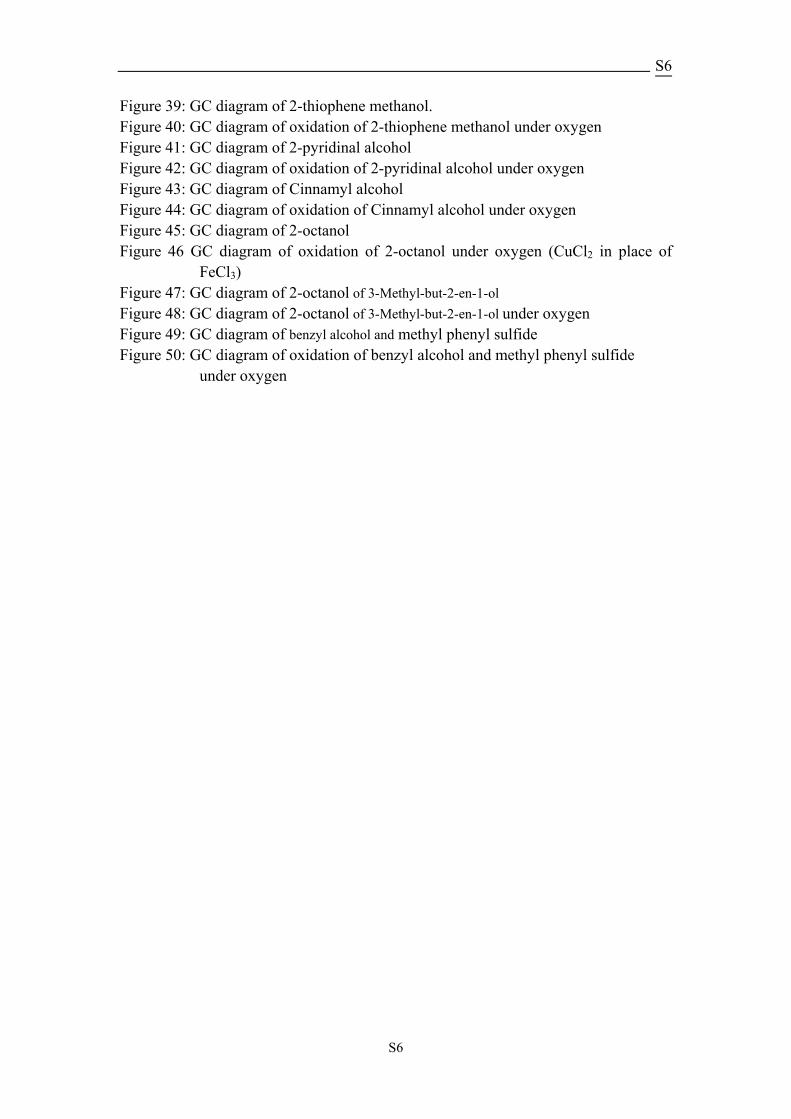
Figure 1: GC diagram of TEMPO
Peak RetTime (min) Height Area Area % 1 17.917 78399.2 1462145.4 99.6774 2 30.317 411.0 4732.7 0.3226 Totals: 78810.2 1466878.0 100.0000 Figure 2: GC diagram of trifluorotoluene
Peak RetTime (min) Height Area Area % 1 3.195 686976.1 19042465.4 99.8701 2 7.191 698.3 8948.4 0.0469 3 7.382 549.3 11641.9 0.0611 4 30.053 328.9 4172.9 0.0219 Totals: 688552.6 19067228.5 100.0000
S8
S8
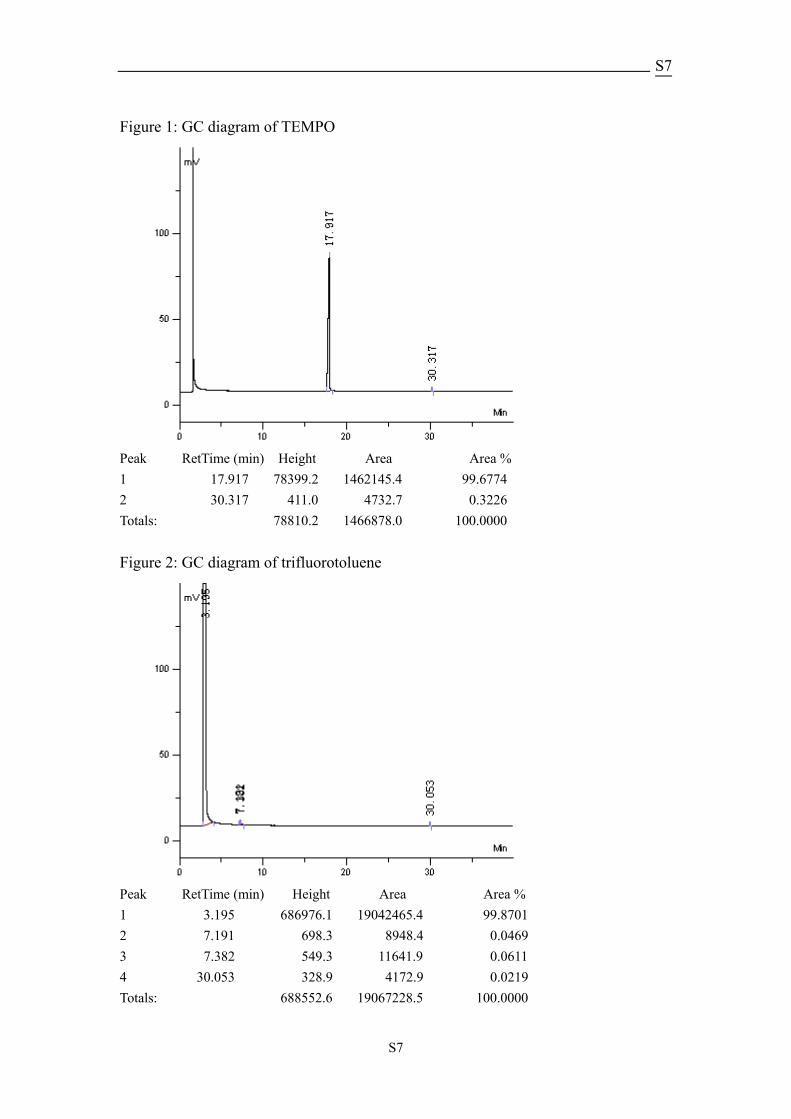
Figure 3: GC diagram of benzyl alcohol
Peak RetTime (min) Height Area Area % 1 15.971 29109.1 638903.2 99.5150 2 30.150 88.5 1035.5 0.1613 3 31.000 90.8 2078.2 0.3237 Totals: 29288.4 642016.9 100.0000 Figure 4: GC diagram of oxidation of benzyl alcohol under air
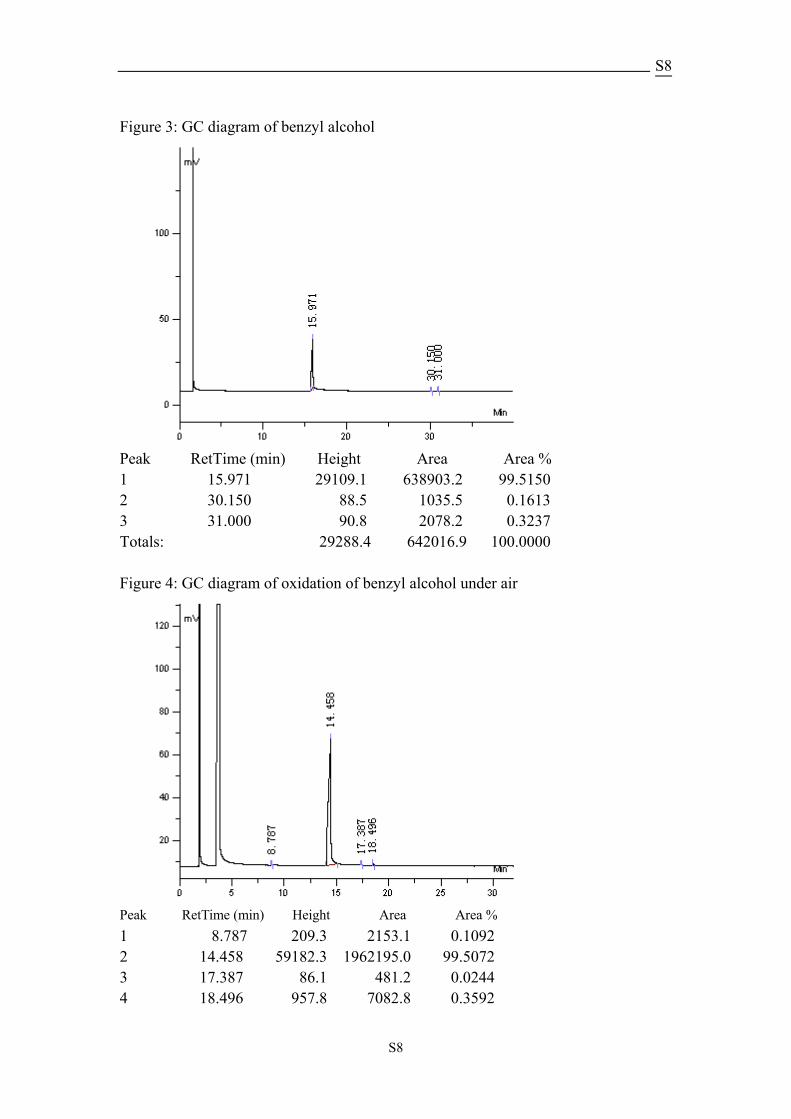
Peak RetTime (min) Height Area Area % 1 8.787 209.3 2153.1 0.1092 2 14.458 59182.3 1962195.0 99.5072 3 17.387 86.1 481.2 0.0244 4 18.496 957.8 7082.8 0.3592
S9
S9
Totals: 60435.4 1971912.1 100.0000 Figure 5: GC diagram of 4-methyl-benzyl alcohol
Peak RetTime (min) Height Area Area % 1 18.280 88933.3 2114593.0 100.0000 Totals: 88933.3 2114593.0 100.0000 Figure 6: GC diagram of oxidation of 4-methyl-benzyl alcohol under air
Peak RetTime (min) Height Area Area % 1 16.225 52860.0 957276.5 99.6861 2 17.154 490.9 3014.7 0.3139 Totals: 53350.9 960291.2 100.0000
S10
S10
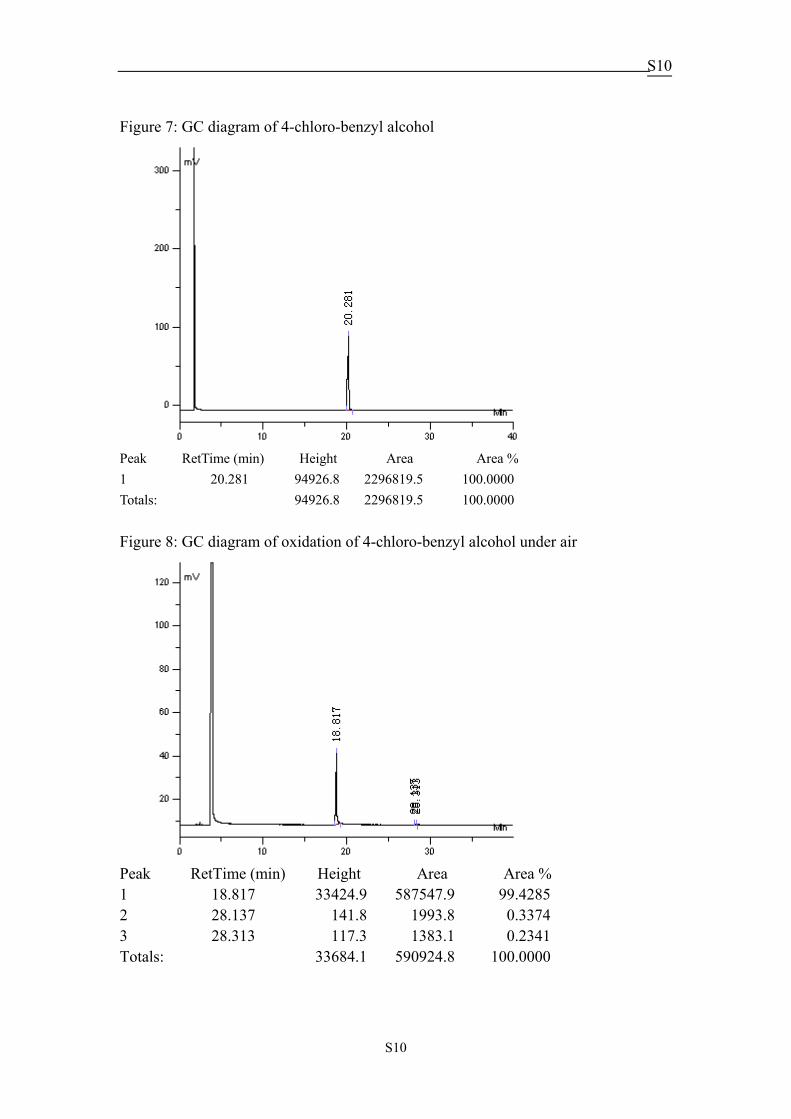
Figure 7: GC diagram of 4-chloro-benzyl alcohol
Peak RetTime (min) Height Area Area % 1 20.281 94926.8 2296819.5 100.0000 Totals: 94926.8 2296819.5 100.0000 Figure 8: GC diagram of oxidation of 4-chloro-benzyl alcohol under air
Peak RetTime (min) Height Area Area % 1 18.817 33424.9 587547.9 99.4285 2 28.137 141.8 1993.8 0.3374 3 28.313 117.3 1383.1 0.2341 Totals: 33684.1 590924.8 100.0000
S11
S11
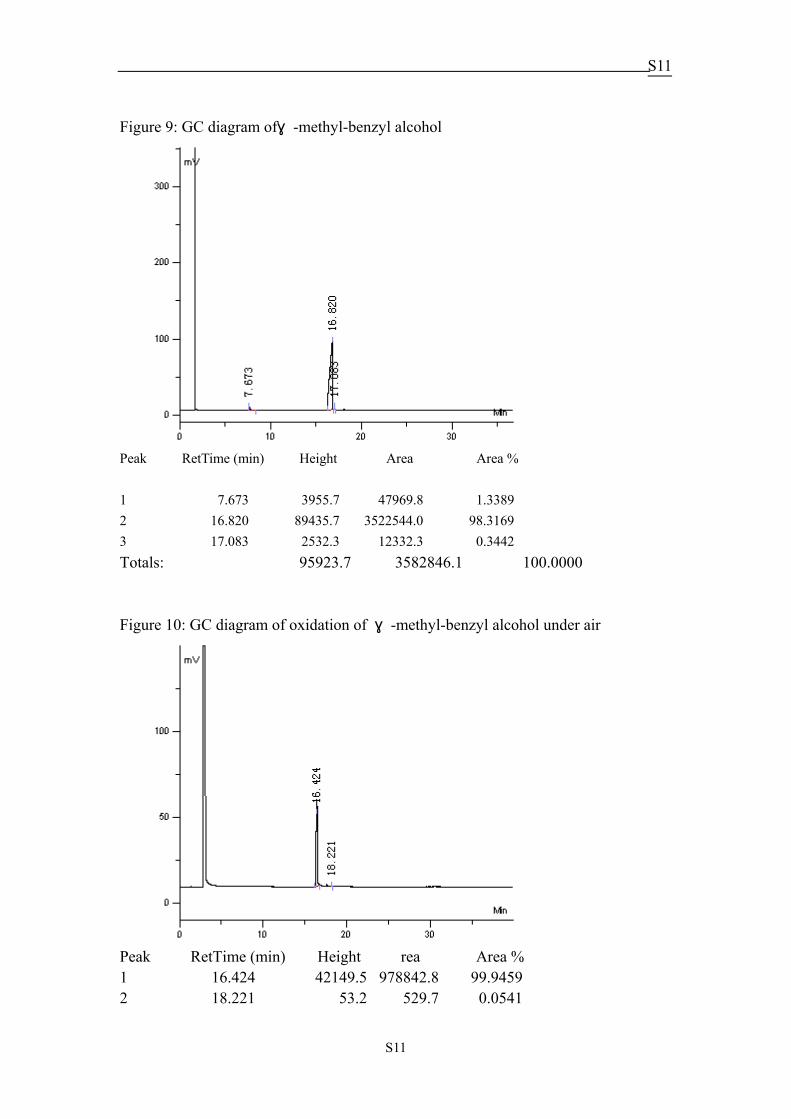
Figure 9: GC diagram ofα-methyl-benzyl alcohol
Peak RetTime (min) Height Area Area % 1 7.673 3955.7 47969.8 1.3389 2 16.820 89435.7 3522544.0 98.3169 3 17.083 2532.3 12332.3 0.3442 Totals: 95923.7 3582846.1 100.0000 Figure 10: GC diagram of oxidation of α-methyl-benzyl alcohol under air
Peak RetTime (min) Height rea Area % 1 16.424 42149.5 978842.8 99.9459 2 18.221 53.2 529.7 0.0541
S12
S12
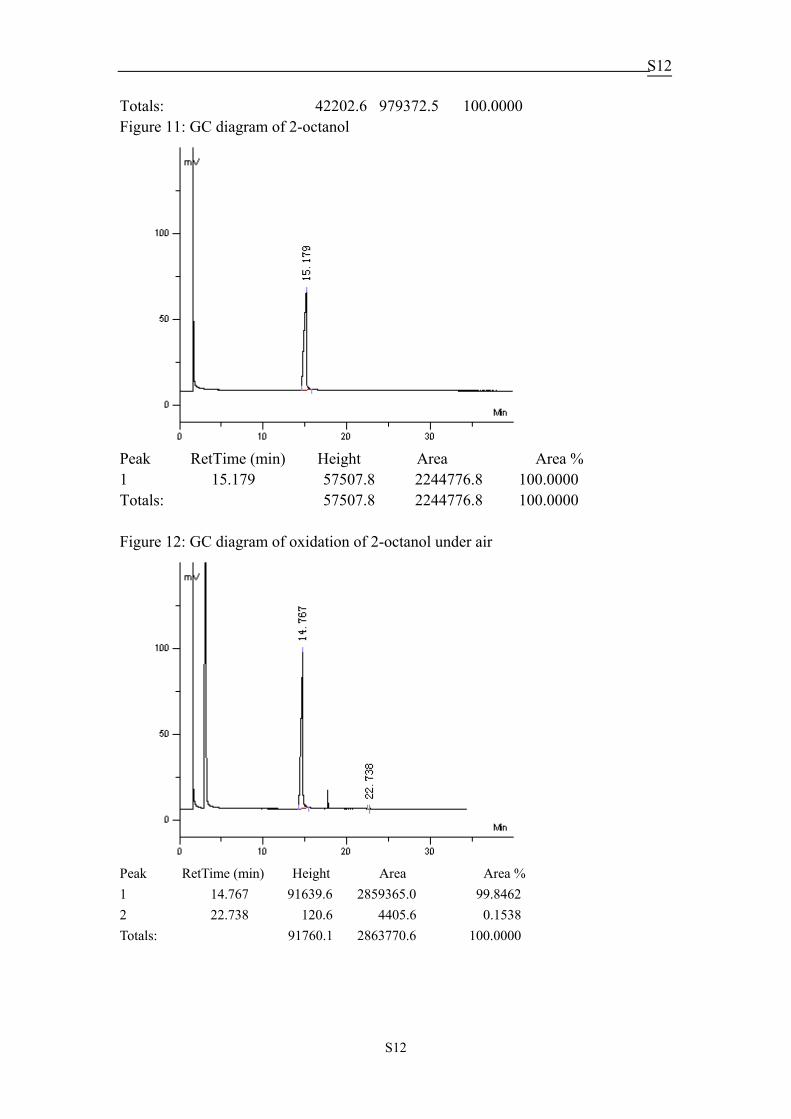
Totals: 42202.6 979372.5 100.0000 Figure 11: GC diagram of 2-octanol
Peak RetTime (min) Height Area Area % 1 15.179 57507.8 2244776.8 100.0000 Totals: 57507.8 2244776.8 100.0000 Figure 12: GC diagram of oxidation of 2-octanol under air
Peak RetTime (min) Height Area Area % 1 14.767 91639.6 2859365.0 99.8462 2 22.738 120.6 4405.6 0.1538 Totals: 91760.1 2863770.6 100.0000
S13
S13
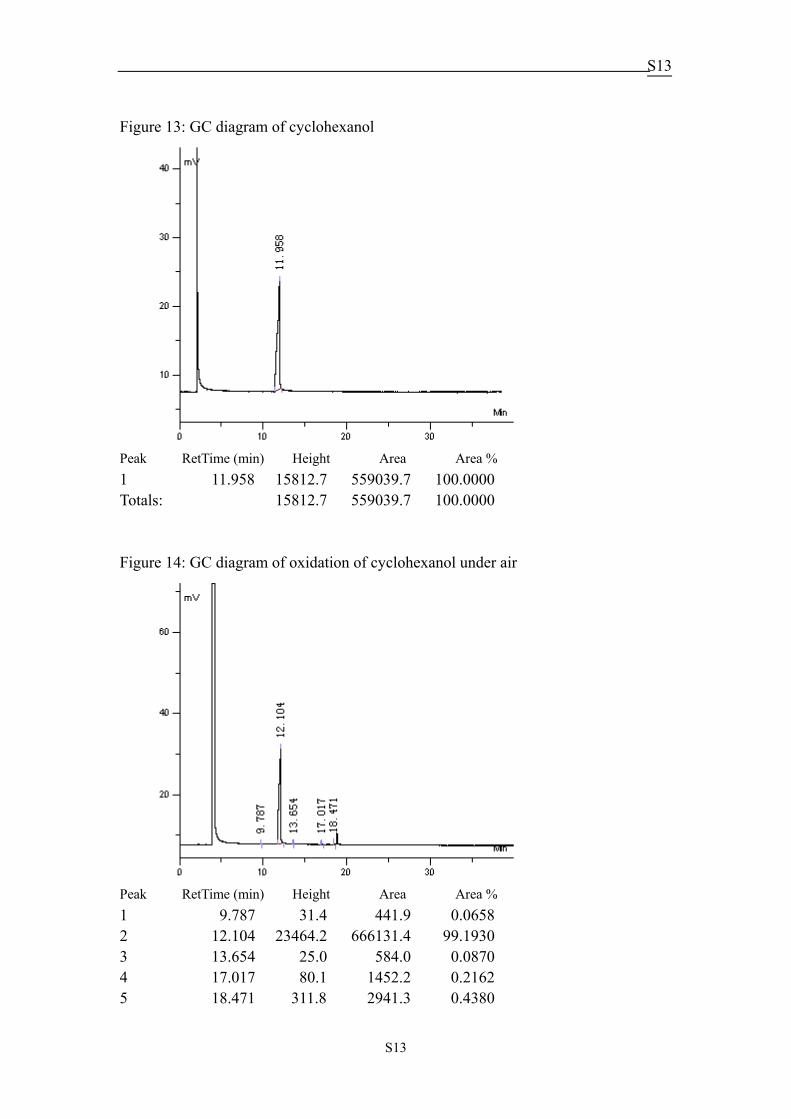
Figure 13: GC diagram of cyclohexanol
Peak RetTime (min) Height Area Area % 1 11.958 15812.7 559039.7 100.0000 Totals: 15812.7 559039.7 100.0000 Figure 14: GC diagram of oxidation of cyclohexanol under air
Peak RetTime (min) Height Area Area % 1 9.787 31.4 441.9 0.0658 2 12.104 23464.2 666131.4 99.1930 3 13.654 25.0 584.0 0.0870 4 17.017 80.1 1452.2 0.2162 5 18.471 311.8 2941.3 0.4380
S14
S14
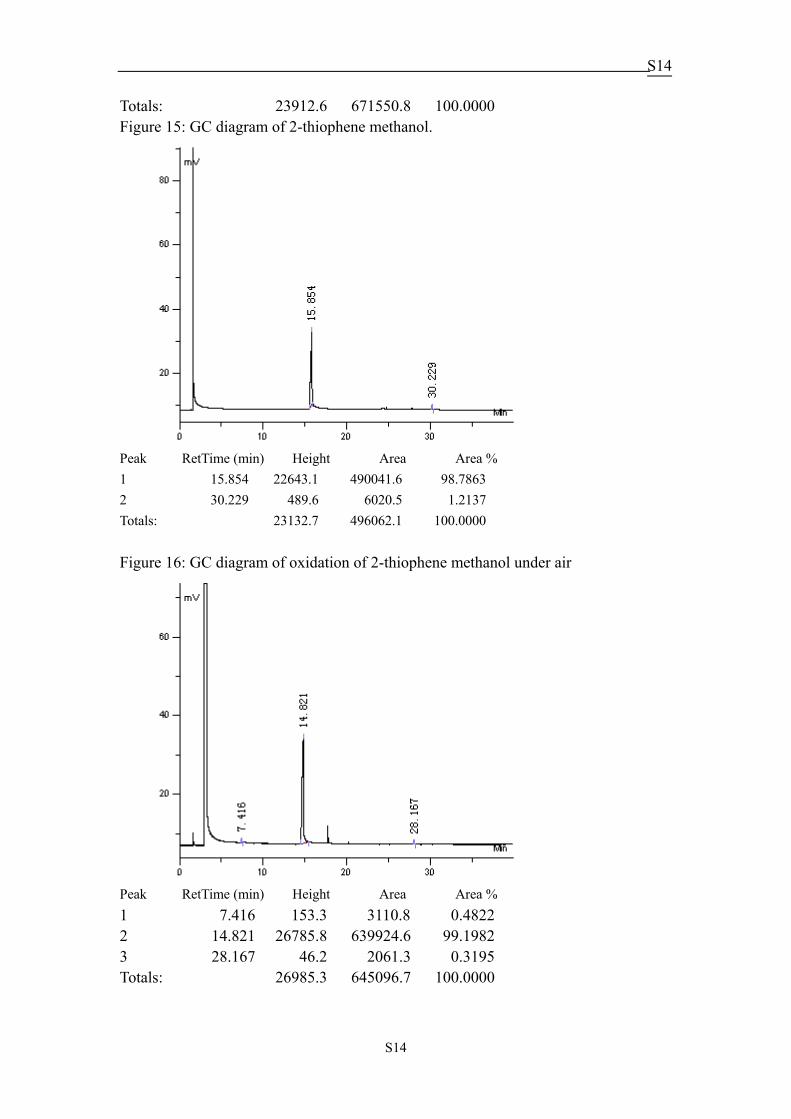
Totals: 23912.6 671550.8 100.0000 Figure 15: GC diagram of 2-thiophene methanol.
Peak RetTime (min) Height Area Area % 1 15.854 22643.1 490041.6 98.7863 2 30.229 489.6 6020.5 1.2137 Totals: 23132.7 496062.1 100.0000 Figure 16: GC diagram of oxidation of 2-thiophene methanol under air
Peak RetTime (min) Height Area Area % 1 7.416 153.3 3110.8 0.4822 2 14.821 26785.8 639924.6 99.1982 3 28.167 46.2 2061.3 0.3195 Totals: 26985.3 645096.7 100.0000

S15
S15
Figure 17: GC diagram of 2-pyridinal alcohol
Peak RetTime (min) Height Area Area % 1 16.288 16751.0 361018.7 99.0891 2 16.758 417.6 2594.6 0.7121 3 30.500 66.9 724.2 0.1988 Totals: 17235.6 364337.5 100.0000 Figure 18: GC diagram of oxidation of 2-pyridinal alcohol under air
Peak RetTime (min) Height Area Area % 1 12.992 22105.1 445286.6 99.8499 2 16.613 97.5 669.4 0.1501 Totals: 22202.6 445956.0 100.0000
S16
S16
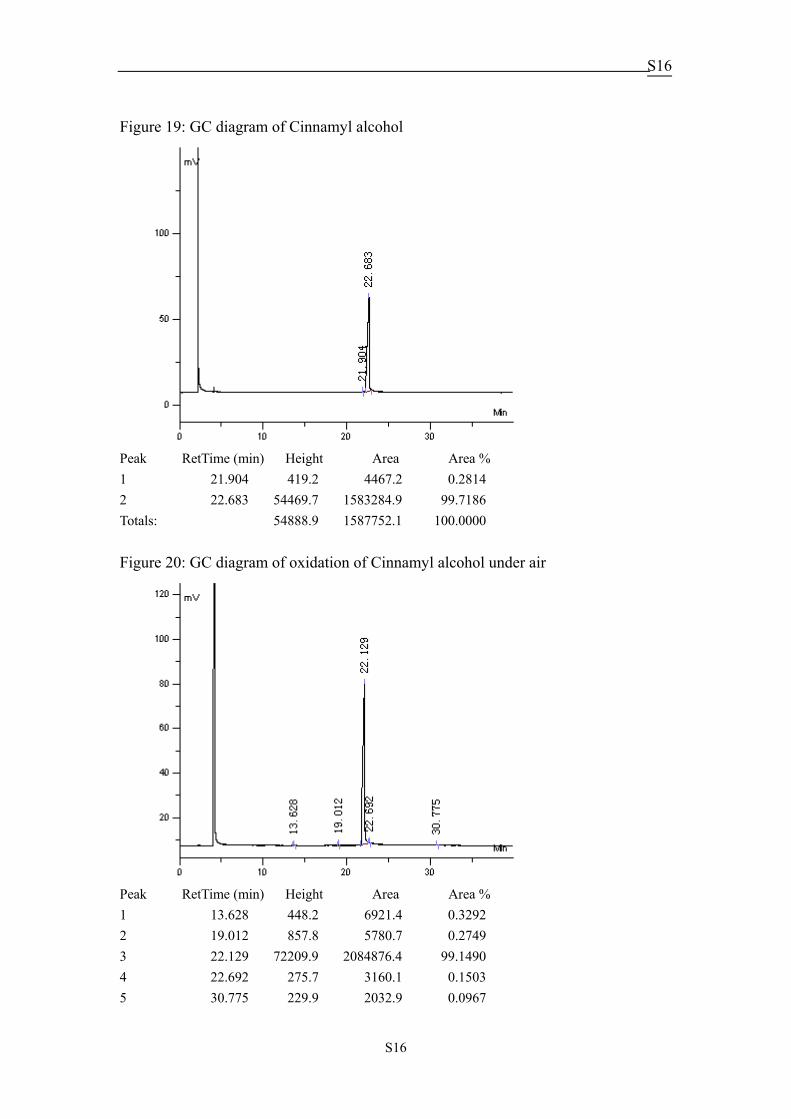
Figure 19: GC diagram of Cinnamyl alcohol
Peak RetTime (min) Height Area Area % 1 21.904 419.2 4467.2 0.2814 2 22.683 54469.7 1583284.9 99.7186 Totals: 54888.9 1587752.1 100.0000 Figure 20: GC diagram of oxidation of Cinnamyl alcohol under air
Peak RetTime (min) Height Area Area % 1 13.628 448.2 6921.4 0.3292 2 19.012 857.8 5780.7 0.2749 3 22.129 72209.9 2084876.4 99.1490 4 22.692 275.7 3160.1 0.1503 5 30.775 229.9 2032.9 0.0967
S17
S17
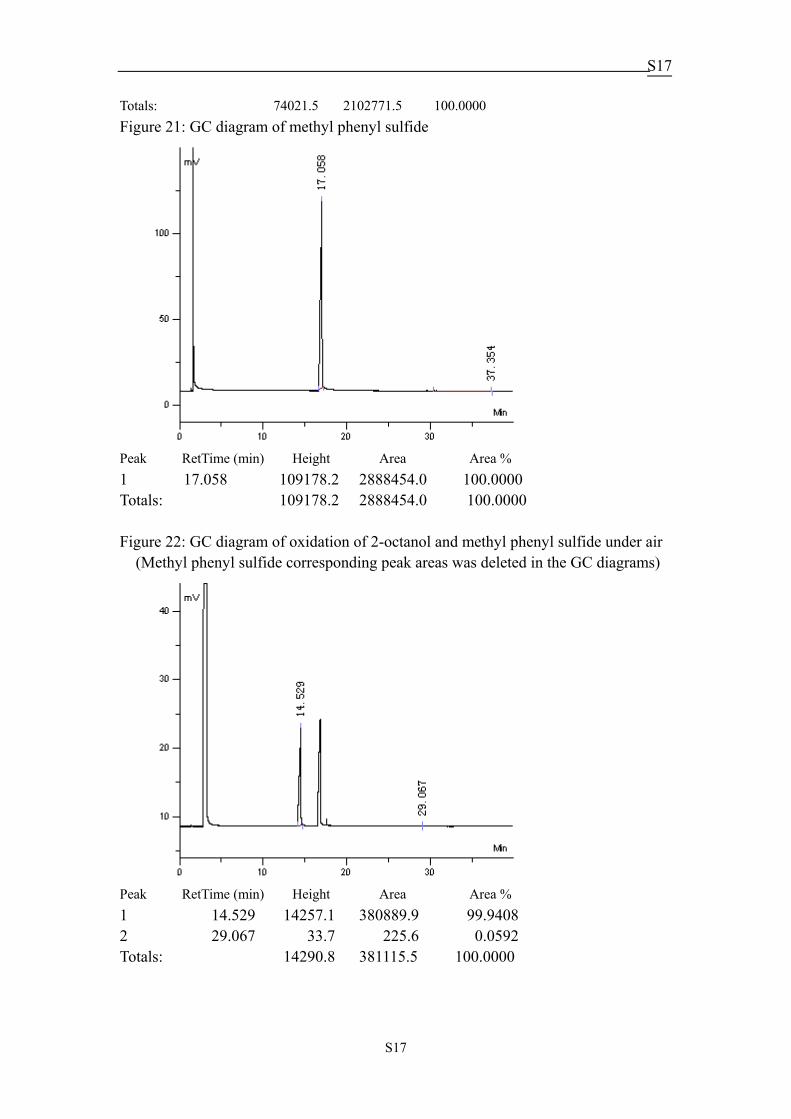
Totals: 74021.5 2102771.5 100.0000 Figure 21: GC diagram of methyl phenyl sulfide
Peak RetTime (min) Height Area Area % 1 17.058 109178.2 2888454.0 100.0000 Totals: 109178.2 2888454.0 100.0000 Figure 22: GC diagram of oxidation of 2-octanol and methyl phenyl sulfide under air (Methyl phenyl sulfide corresponding peak areas was deleted in the GC diagrams)
Peak RetTime (min) Height Area Area % 1 14.529 14257.1 380889.9 99.9408 2 29.067 33.7 225.6 0.0592 Totals: 14290.8 381115.5 100.0000
S18
S18
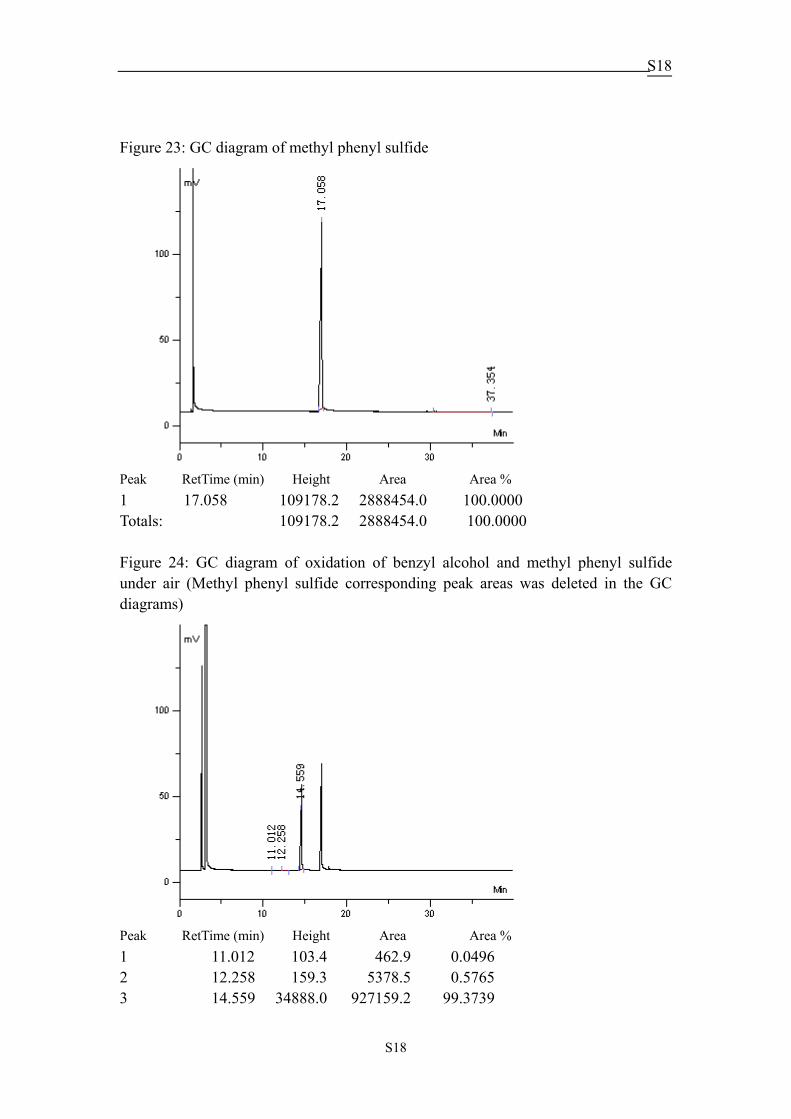
Figure 23: GC diagram of methyl phenyl sulfide
Peak RetTime (min) Height Area Area % 1 17.058 109178.2 2888454.0 100.0000 Totals: 109178.2 2888454.0 100.0000 Figure 24: GC diagram of oxidation of benzyl alcohol and methyl phenyl sulfide under air (Methyl phenyl sulfide corresponding peak areas was deleted in the GC diagrams)
Peak RetTime (min) Height Area Area % 1 11.012 103.4 462.9 0.0496 2 12.258 159.3 5378.5 0.5765 3 14.559 34888.0 927159.2 99.3739
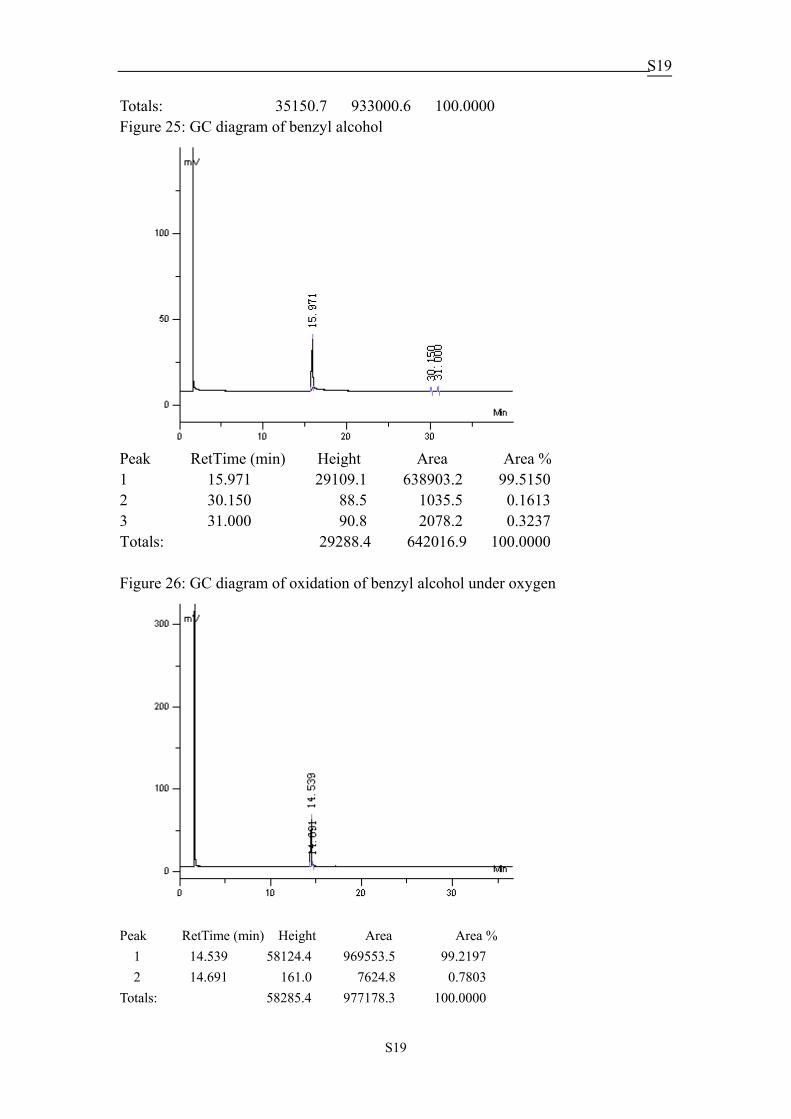
S19
S19
Totals: 35150.7 933000.6 100.0000 Figure 25: GC diagram of benzyl alcohol
Peak RetTime (min) Height Area Area % 1 15.971 29109.1 638903.2 99.5150 2 30.150 88.5 1035.5 0.1613 3 31.000 90.8 2078.2 0.3237 Totals: 29288.4 642016.9 100.0000 Figure 26: GC diagram of oxidation of benzyl alcohol under oxygen
Peak RetTime (min) Height Area Area %
1 14.539 58124.4 969553.5 99.2197 2 14.691 161.0 7624.8 0.7803
Totals: 58285.4 977178.3 100.0000
S20
S20
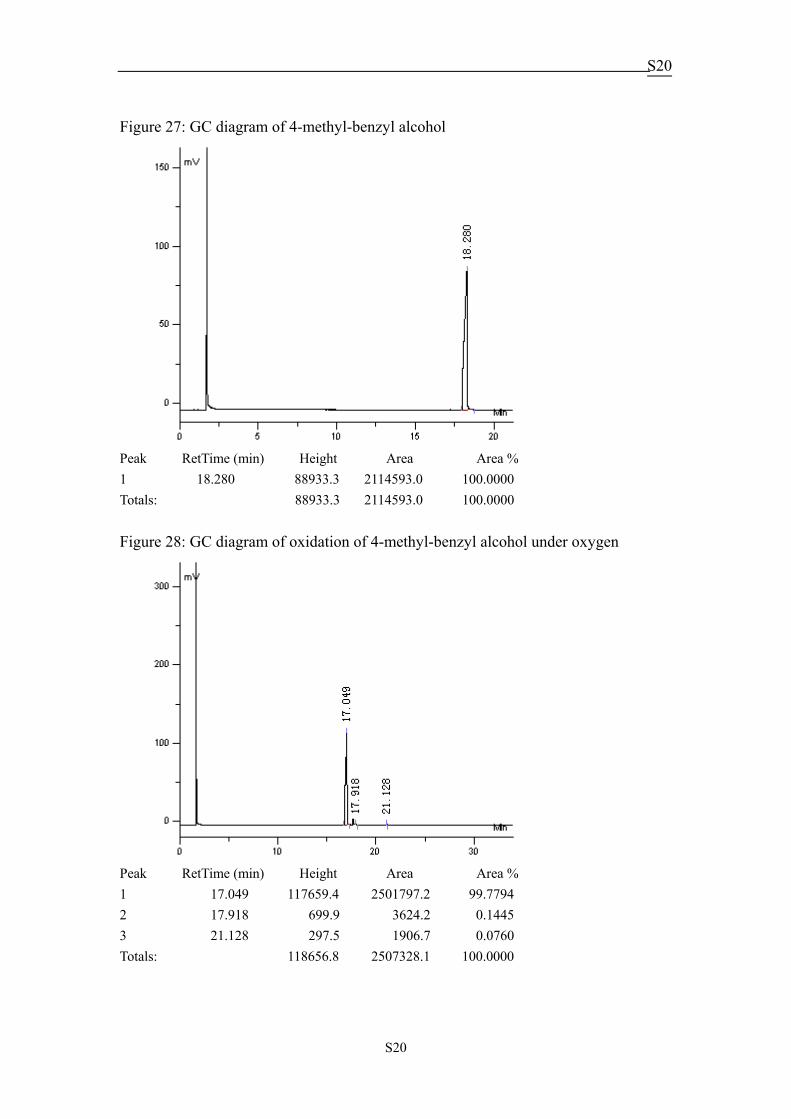
Figure 27: GC diagram of 4-methyl-benzyl alcohol
Peak RetTime (min) Height Area Area % 1 18.280 88933.3 2114593.0 100.0000 Totals: 88933.3 2114593.0 100.0000 Figure 28: GC diagram of oxidation of 4-methyl-benzyl alcohol under oxygen
Peak RetTime (min) Height Area Area % 1 17.049 117659.4 2501797.2 99.7794 2 17.918 699.9 3624.2 0.1445 3 21.128 297.5 1906.7 0.0760 Totals: 118656.8 2507328.1 100.0000
S21
S21
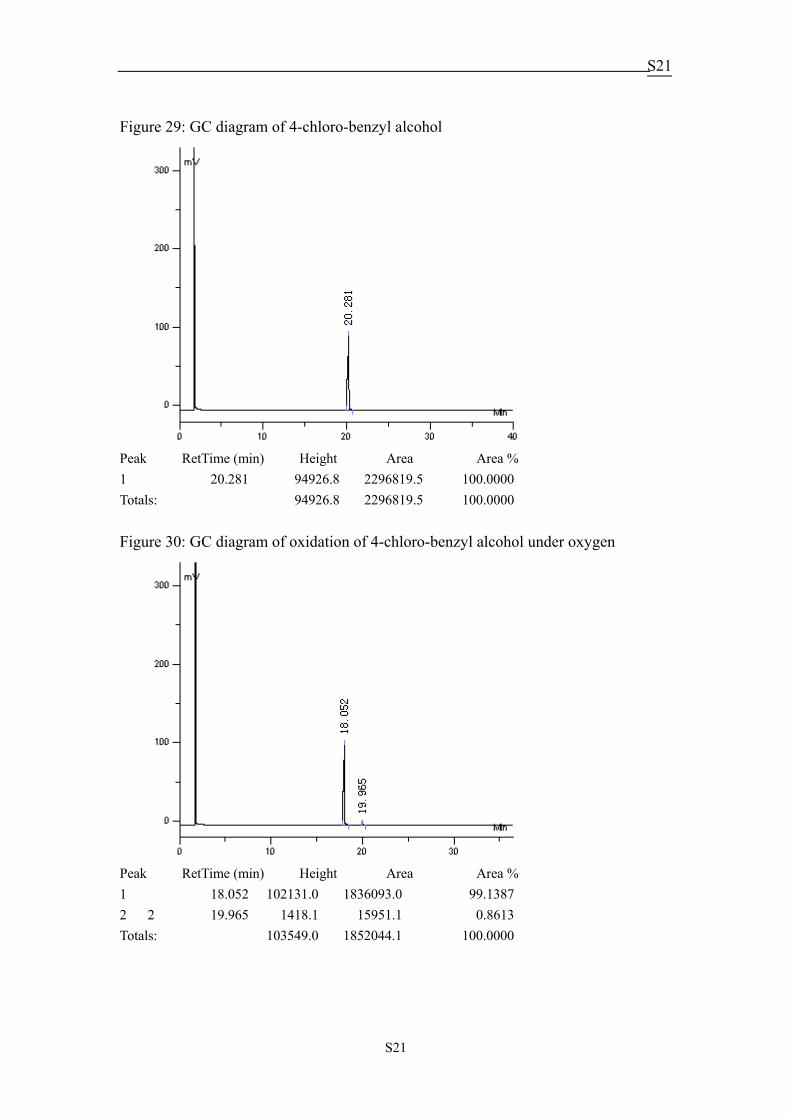
Figure 29: GC diagram of 4-chloro-benzyl alcohol
Peak RetTime (min) Height Area Area % 1 20.281 94926.8 2296819.5 100.0000 Totals: 94926.8 2296819.5 100.0000 Figure 30: GC diagram of oxidation of 4-chloro-benzyl alcohol under oxygen
Peak RetTime (min) Height Area Area % 1 18.052 102131.0 1836093.0 99.1387 2 2 19.965 1418.1 15951.1 0.8613 Totals: 103549.0 1852044.1 100.0000
S22
S22
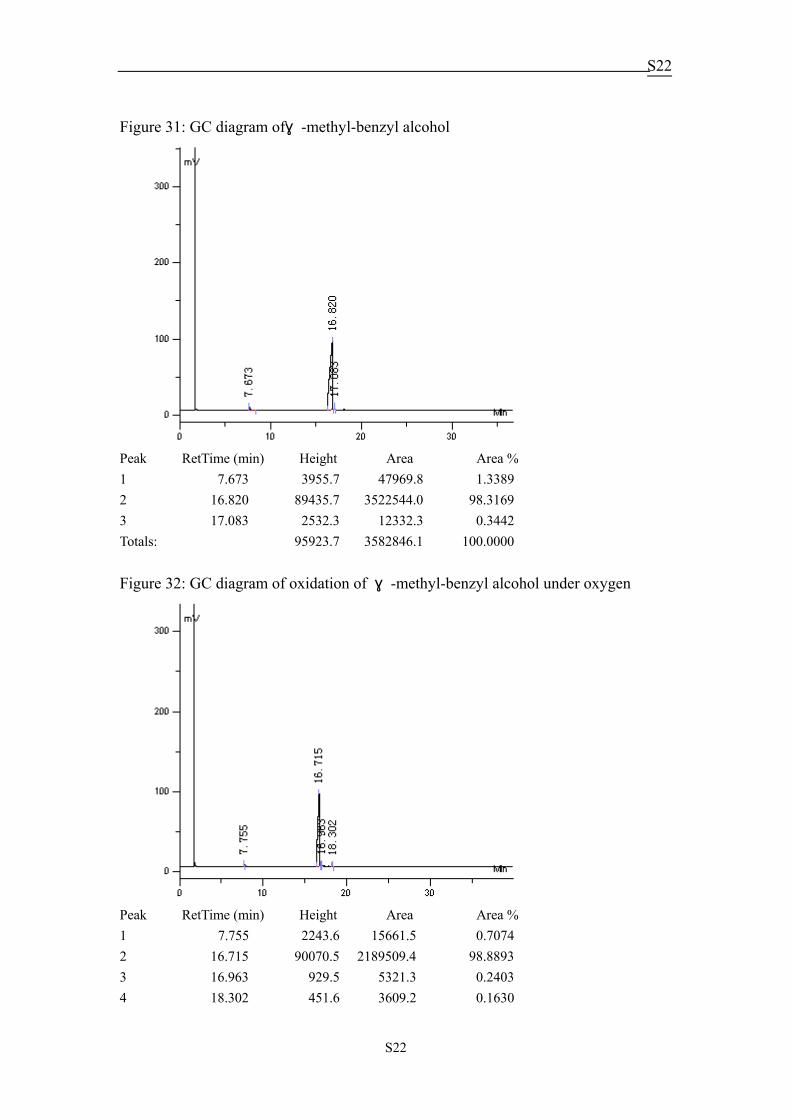
Figure 31: GC diagram ofα-methyl-benzyl alcohol
Peak RetTime (min) Height Area Area % 1 7.673 3955.7 47969.8 1.3389 2 16.820 89435.7 3522544.0 98.3169 3 17.083 2532.3 12332.3 0.3442 Totals: 95923.7 3582846.1 100.0000 Figure 32: GC diagram of oxidation of α-methyl-benzyl alcohol under oxygen
Peak RetTime (min) Height Area Area % 1 7.755 2243.6 15661.5 0.7074 2 16.715 90070.5 2189509.4 98.8893 3 16.963 929.5 5321.3 0.2403 4 18.302 451.6 3609.2 0.1630
S23
S23
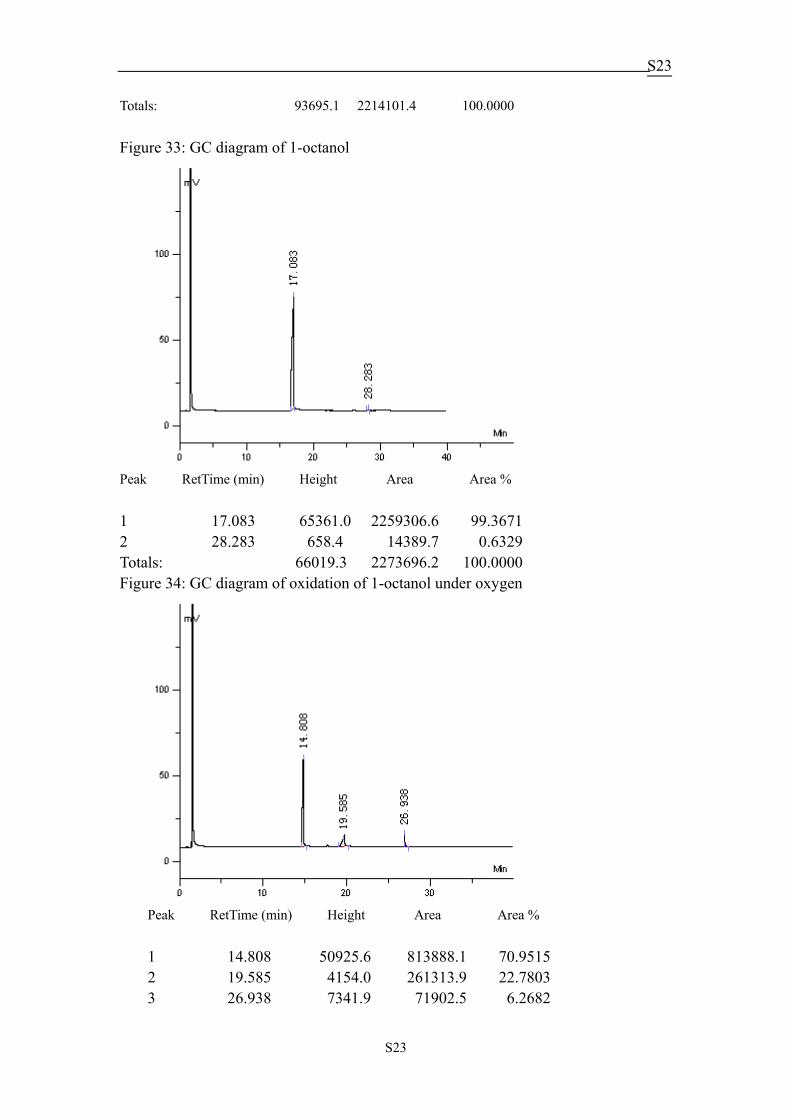
Totals: 93695.1 2214101.4 100.0000 Figure 33: GC diagram of 1-octanol
Peak RetTime (min) Height Area Area % 1 17.083 65361.0 2259306.6 99.3671 2 28.283 658.4 14389.7 0.6329 Totals: 66019.3 2273696.2 100.0000 Figure 34: GC diagram of oxidation of 1-octanol under oxygen
Peak RetTime (min) Height Area Area % 1 14.808 50925.6 813888.1 70.9515 2 19.585 4154.0 261313.9 22.7803 3 26.938 7341.9 71902.5 6.2682
S24
S24
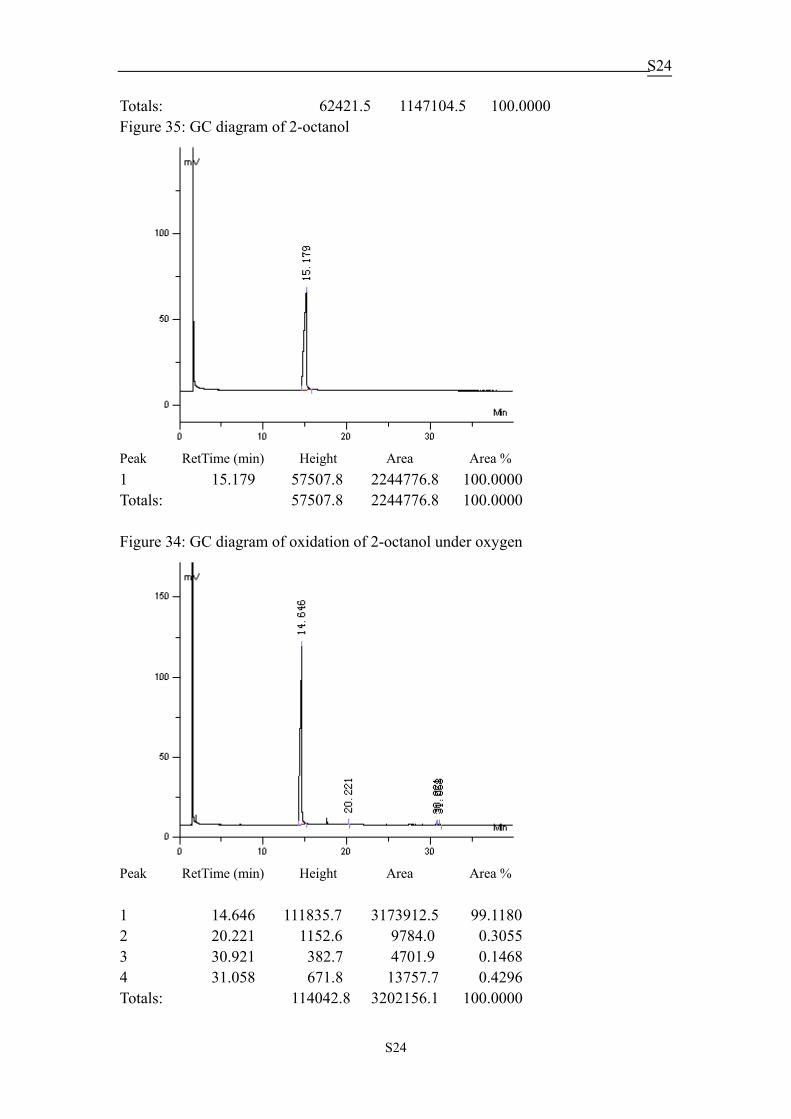
Totals: 62421.5 1147104.5 100.0000 Figure 35: GC diagram of 2-octanol
Peak RetTime (min) Height Area Area % 1 15.179 57507.8 2244776.8 100.0000 Totals: 57507.8 2244776.8 100.0000 Figure 34: GC diagram of oxidation of 2-octanol under oxygen
Peak RetTime (min) Height Area Area % 1 14.646 111835.7 3173912.5 99.1180 2 20.221 1152.6 9784.0 0.3055 3 30.921 382.7 4701.9 0.1468 4 31.058 671.8 13757.7 0.4296 Totals: 114042.8 3202156.1 100.0000
S25
S25
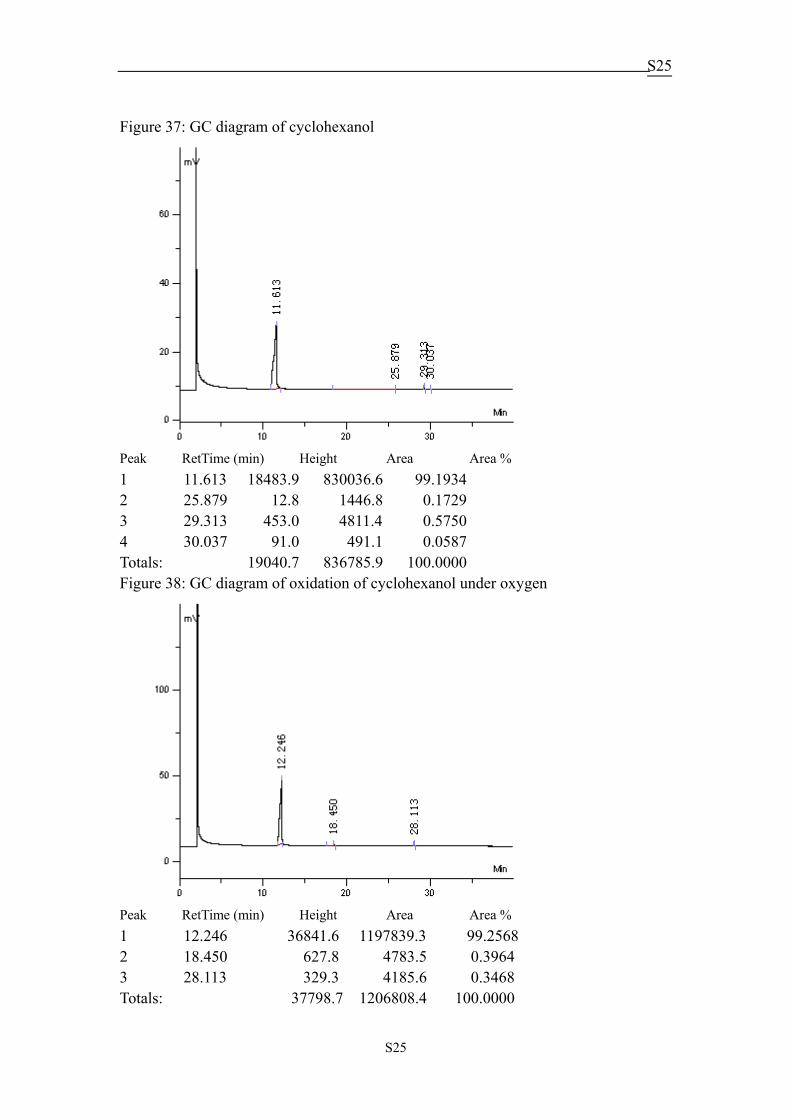
Figure 37: GC diagram of cyclohexanol
Peak RetTime (min) Height Area Area % 1 11.613 18483.9 830036.6 99.1934 2 25.879 12.8 1446.8 0.1729 3 29.313 453.0 4811.4 0.5750 4 30.037 91.0 491.1 0.0587 Totals: 19040.7 836785.9 100.0000 Figure 38: GC diagram of oxidation of cyclohexanol under oxygen
Peak RetTime (min) Height Area Area % 1 12.246 36841.6 1197839.3 99.2568 2 18.450 627.8 4783.5 0.3964 3 28.113 329.3 4185.6 0.3468 Totals: 37798.7 1206808.4 100.0000
S26
S26
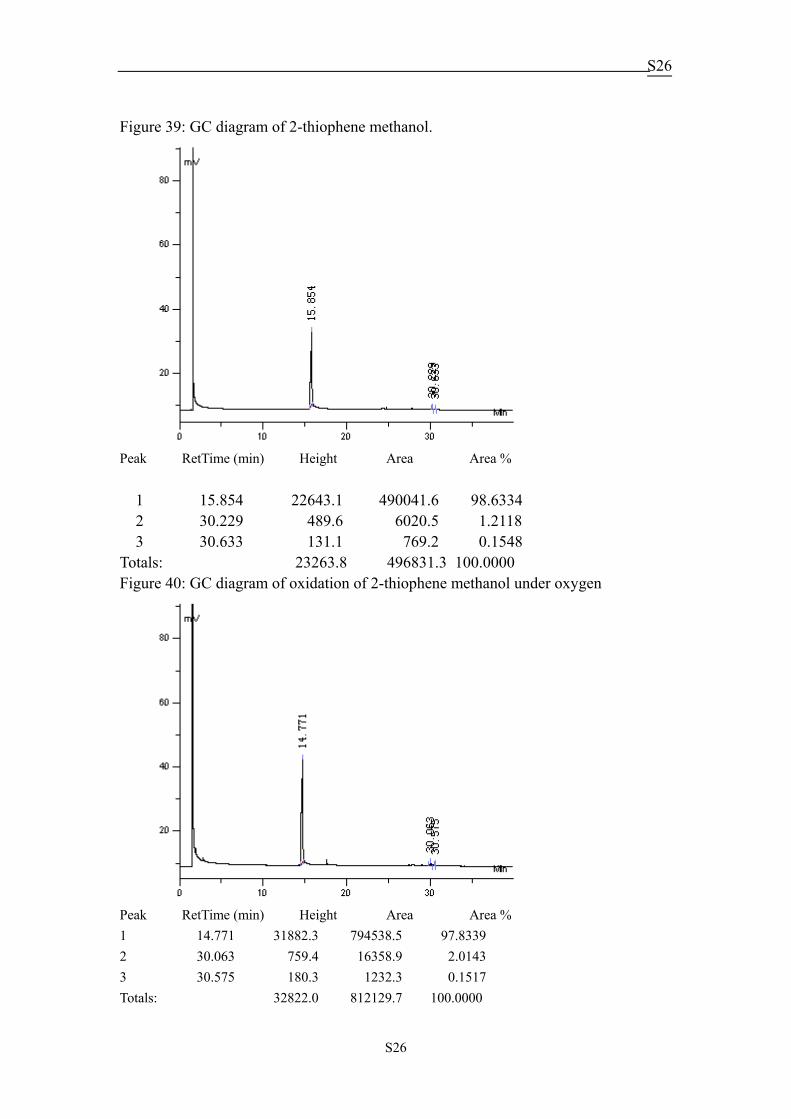
Figure 39: GC diagram of 2-thiophene methanol.
Peak RetTime (min) Height Area Area %
1 15.854 22643.1 490041.6 98.6334 2 30.229 489.6 6020.5 1.2118 3 30.633 131.1 769.2 0.1548
Totals: 23263.8 496831.3 100.0000 Figure 40: GC diagram of oxidation of 2-thiophene methanol under oxygen
Peak RetTime (min) Height Area Area % 1 14.771 31882.3 794538.5 97.8339 2 30.063 759.4 16358.9 2.0143 3 30.575 180.3 1232.3 0.1517 Totals: 32822.0 812129.7 100.0000
S27
S27
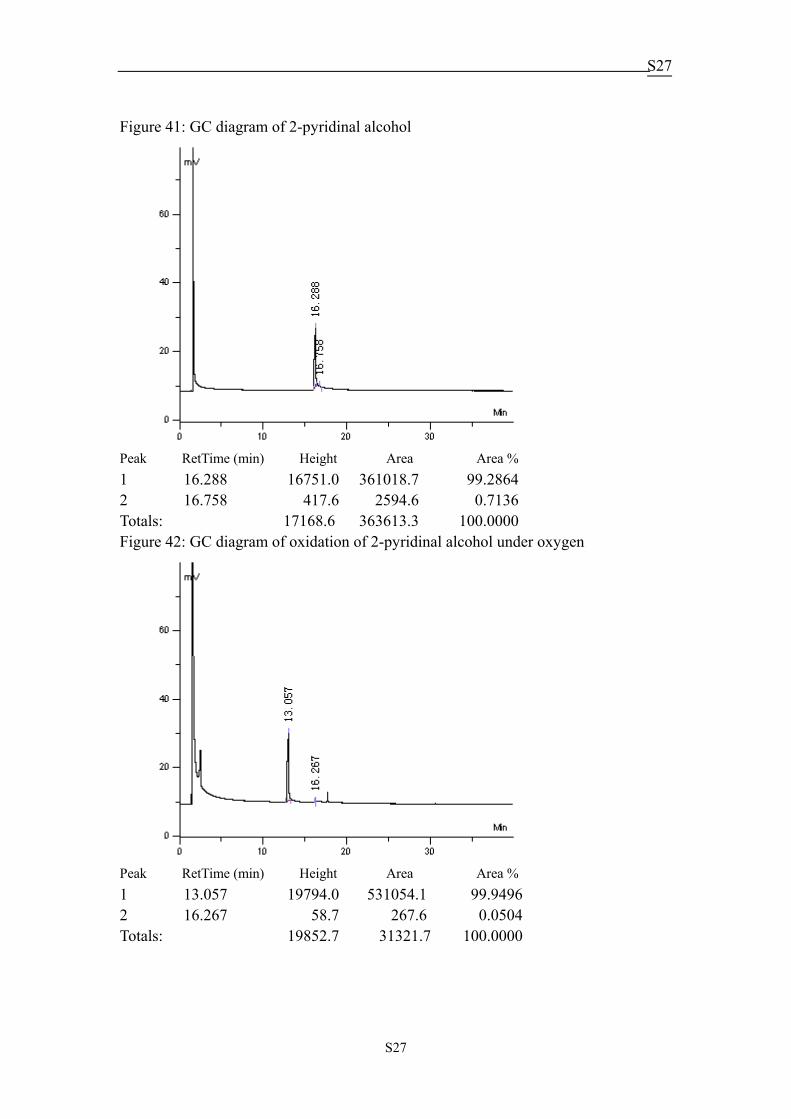
Figure 41: GC diagram of 2-pyridinal alcohol
Peak RetTime (min) Height Area Area % 1 16.288 16751.0 361018.7 99.2864 2 16.758 417.6 2594.6 0.7136 Totals: 17168.6 363613.3 100.0000 Figure 42: GC diagram of oxidation of 2-pyridinal alcohol under oxygen
Peak RetTime (min) Height Area Area % 1 13.057 19794.0 531054.1 99.9496 2 16.267 58.7 267.6 0.0504 Totals: 19852.7 31321.7 100.0000
S28
S28
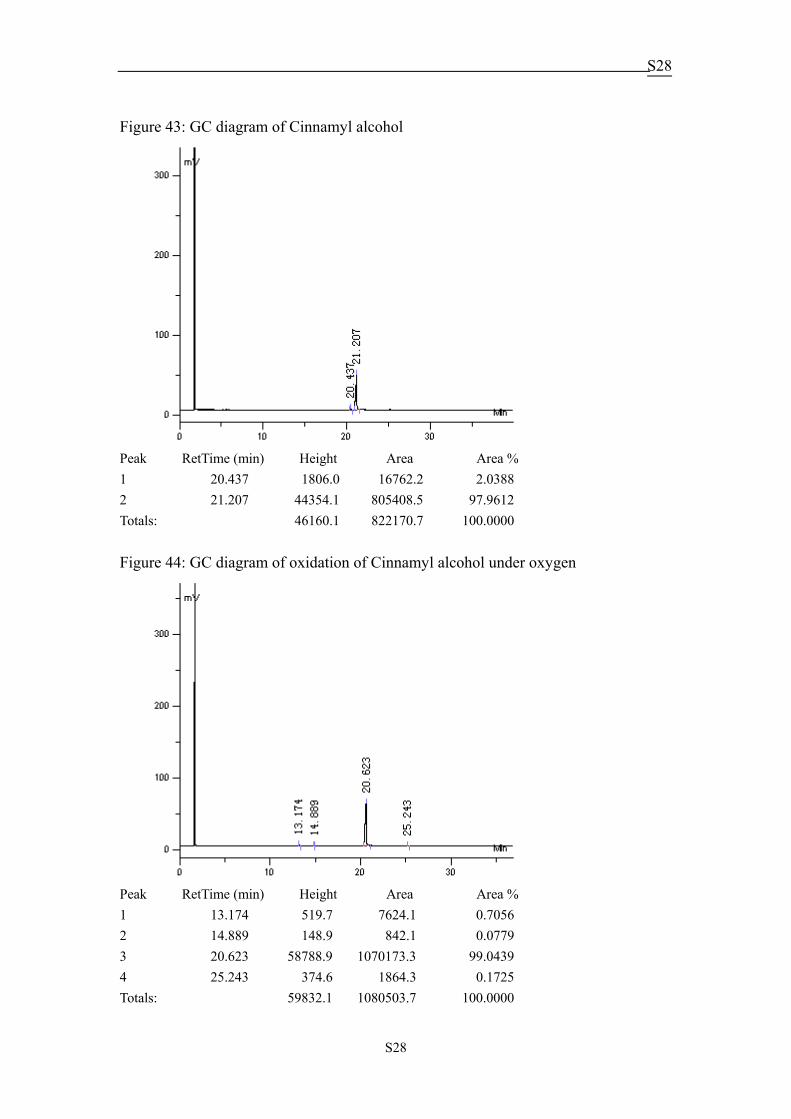
Figure 43: GC diagram of Cinnamyl alcohol
Peak RetTime (min) Height Area Area % 1 20.437 1806.0 16762.2 2.0388 2 21.207 44354.1 805408.5 97.9612 Totals: 46160.1 822170.7 100.0000 Figure 44: GC diagram of oxidation of Cinnamyl alcohol under oxygen
Peak RetTime (min) Height Area Area % 1 13.174 519.7 7624.1 0.7056 2 14.889 148.9 842.1 0.0779 3 20.623 58788.9 1070173.3 99.0439 4 25.243 374.6 1864.3 0.1725 Totals: 59832.1 1080503.7 100.0000
S29
S29
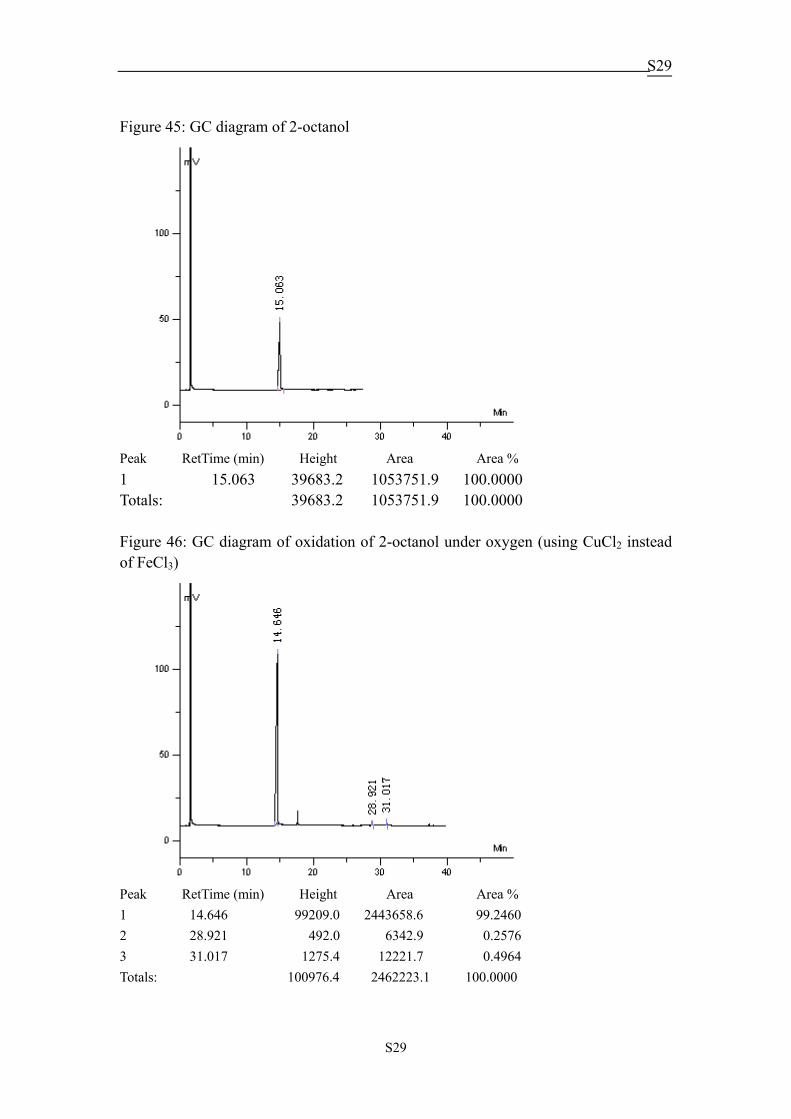
Figure 45: GC diagram of 2-octanol
Peak RetTime (min) Height Area Area % 1 15.063 39683.2 1053751.9 100.0000 Totals: 39683.2 1053751.9 100.0000 Figure 46: GC diagram of oxidation of 2-octanol under oxygen (using CuCl2 instead of FeCl3)
Peak RetTime (min) Height Area Area % 1 14.646 99209.0 2443658.6 99.2460 2 28.921 492.0 6342.9 0.2576 3 31.017 1275.4 12221.7 0.4964 Totals: 100976.4 2462223.1 100.0000
S30
S30
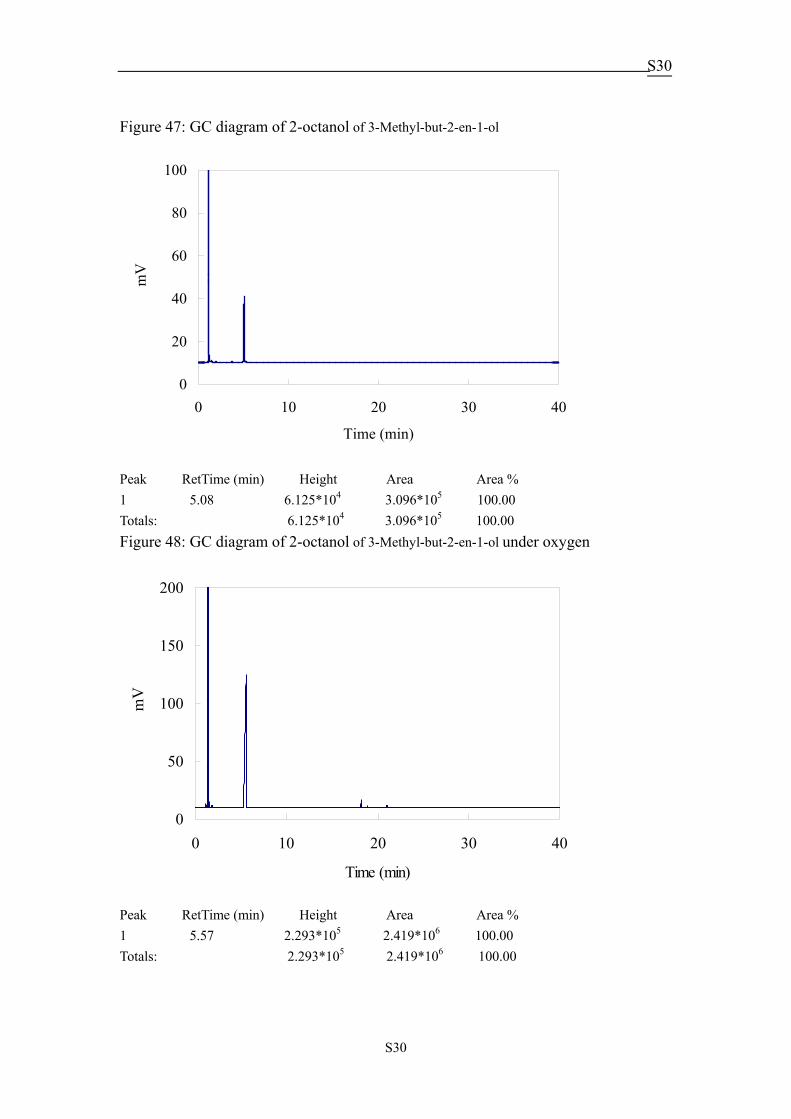
Figure 47: GC diagram of 2-octanol of 3-Methyl-but-2-en-1-ol
0
20
40
60
80
100
0 10 20 30 40
Time (min)
mV
Peak RetTime (min) Height Area Area % 1 5.08 6.125*104 3.096*105 100.00 Totals: 6.125*104 3.096*105 100.00 Figure 48: GC diagram of 2-octanol of 3-Methyl-but-2-en-1-ol under oxygen
0
50
100
150
200
0 10 20 30 40
Time (min)
mV
Peak RetTime (min) Height Area Area % 1 5.57 2.293*105 2.419*106 100.00 Totals: 2.293*105 2.419*106 100.00
S31
S31
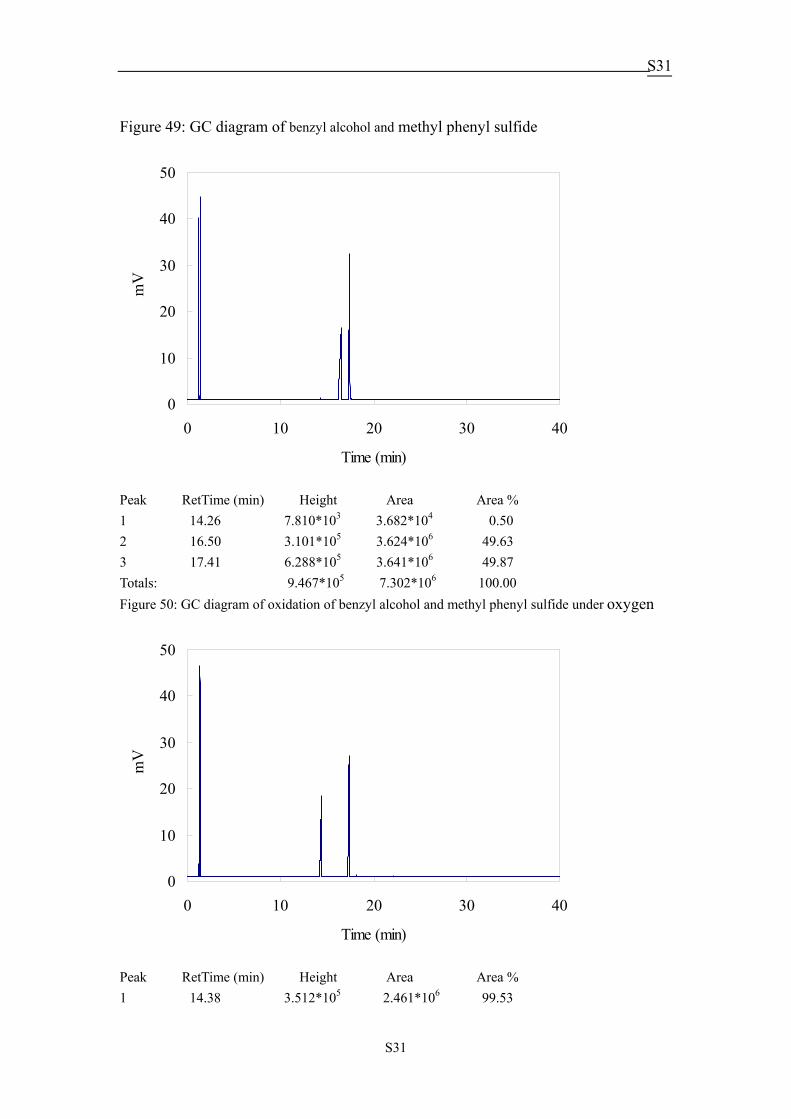
Figure 49: GC diagram of benzyl alcohol and methyl phenyl sulfide
0
10
20
30
40
50
0 10 20 30 40
Time (min)
mV
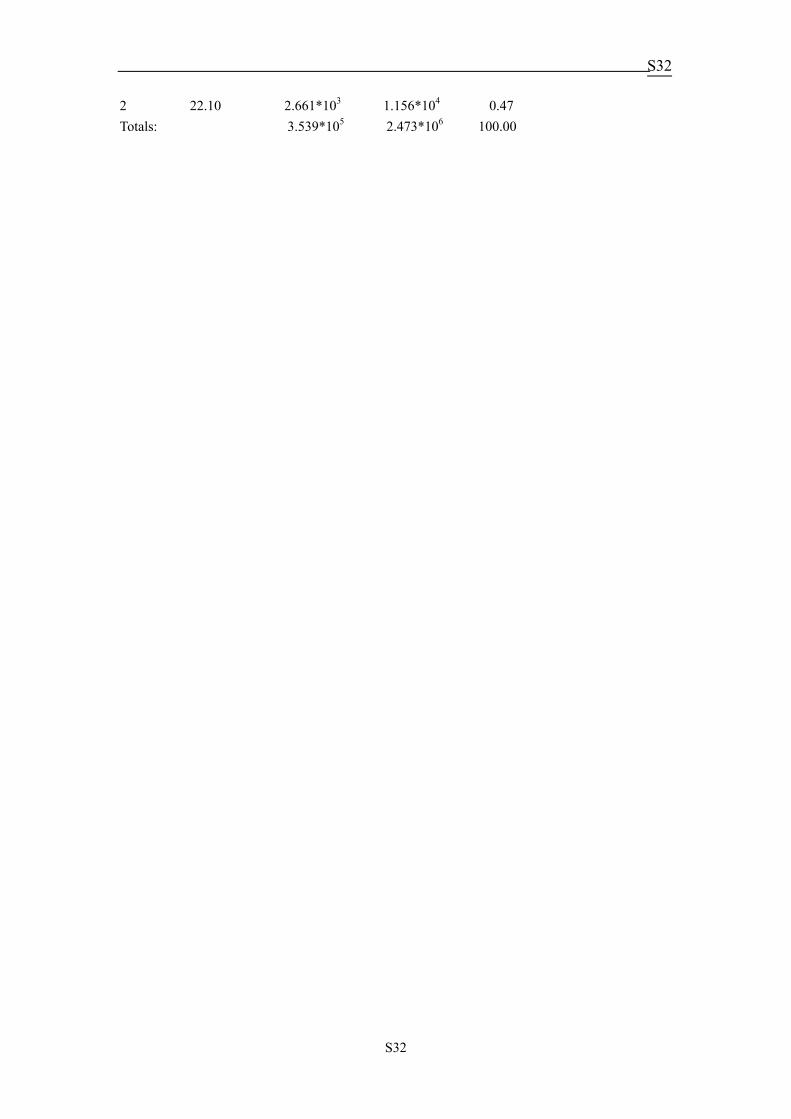
Peak RetTime (min) Height Area Area % 1 14.26 7.810*103 3.682*104 0.50 2 16.50 3.101*105 3.624*106 49.63 3 17.41 6.288*105 3.641*106 49.87 Totals: 9.467*105 7.302*106 100.00 Figure 50: GC diagram of oxidation of benzyl alcohol and methyl phenyl sulfide under oxygen
0
10
20
30
40
50
0 10 20 30 40
Time (min)
mV
Peak RetTime (min) Height Area Area % 1 14.38 3.512*105 2.461*106 99.53
S32
S32
2 22.10 2.661*103 1.156*104 0.47 Totals: 3.539*105 2.473*106 100.00