Embed Size (px)
Citation preview
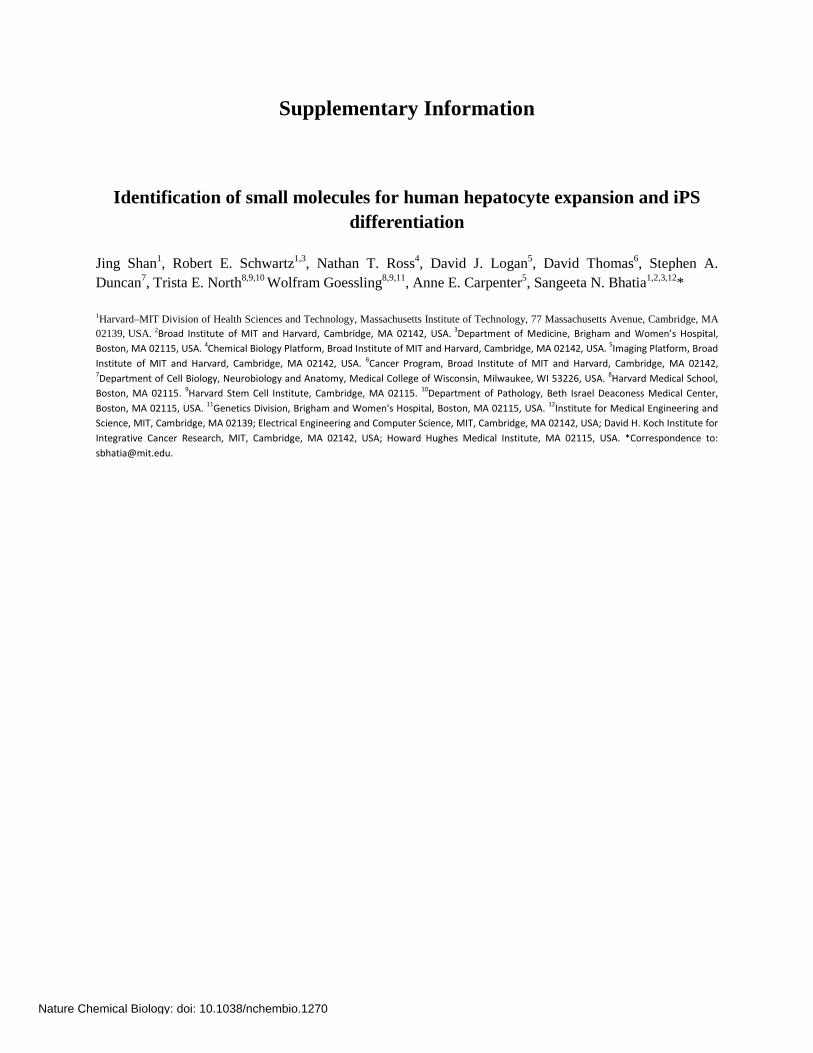
Supplementary Information
Identification of small molecules for human hepatocyte expansion and iPS differentiation
Jing Shan1, Robert E. Schwartz1,3, Nathan T. Ross4, David J. Logan5, David Thomas6, Stephen A. Duncan7, Trista E. North8,9,10 Wolfram Goessling8,9,11, Anne E. Carpenter5, Sangeeta N. Bhatia1,2,3,12* 1Harvard–MIT Division of Health Sciences and Technology, Massachusetts Institute of Technology, 77 Massachusetts Avenue, Cambridge, MA 02139, USA. 2Broad Institute of MIT and Harvard, Cambridge, MA 02142, USA. 3Department of Medicine, Brigham and Women’s Hospital, Boston, MA 02115, USA. 4Chemical Biology Platform, Broad Institute of MIT and Harvard, Cambridge, MA 02142, USA. 5Imaging Platform, Broad Institute of MIT and Harvard, Cambridge, MA 02142, USA. 6Cancer Program, Broad Institute of MIT and Harvard, Cambridge, MA 02142, 7Department of Cell Biology, Neurobiology and Anatomy, Medical College of Wisconsin, Milwaukee, WI 53226, USA. 8Harvard Medical School, Boston, MA 02115. 9Harvard Stem Cell Institute, Cambridge, MA 02115. 10Department of Pathology, Beth Israel Deaconess Medical Center, Boston, MA 02115, USA. 11Genetics Division, Brigham and Women's Hospital, Boston, MA 02115, USA. 12Institute for Medical Engineering and Science, MIT, Cambridge, MA 02139; Electrical Engineering and Computer Science, MIT, Cambridge, MA 02142, USA; David H. Koch Institute for Integrative Cancer Research, MIT, Cambridge, MA 02142, USA; Howard Hughes Medical Institute, MA 02115, USA. *Correspondence to: [email protected].
Nature Chemical Biology: doi: 10.1038/nchembio.1270
Supplementary Results
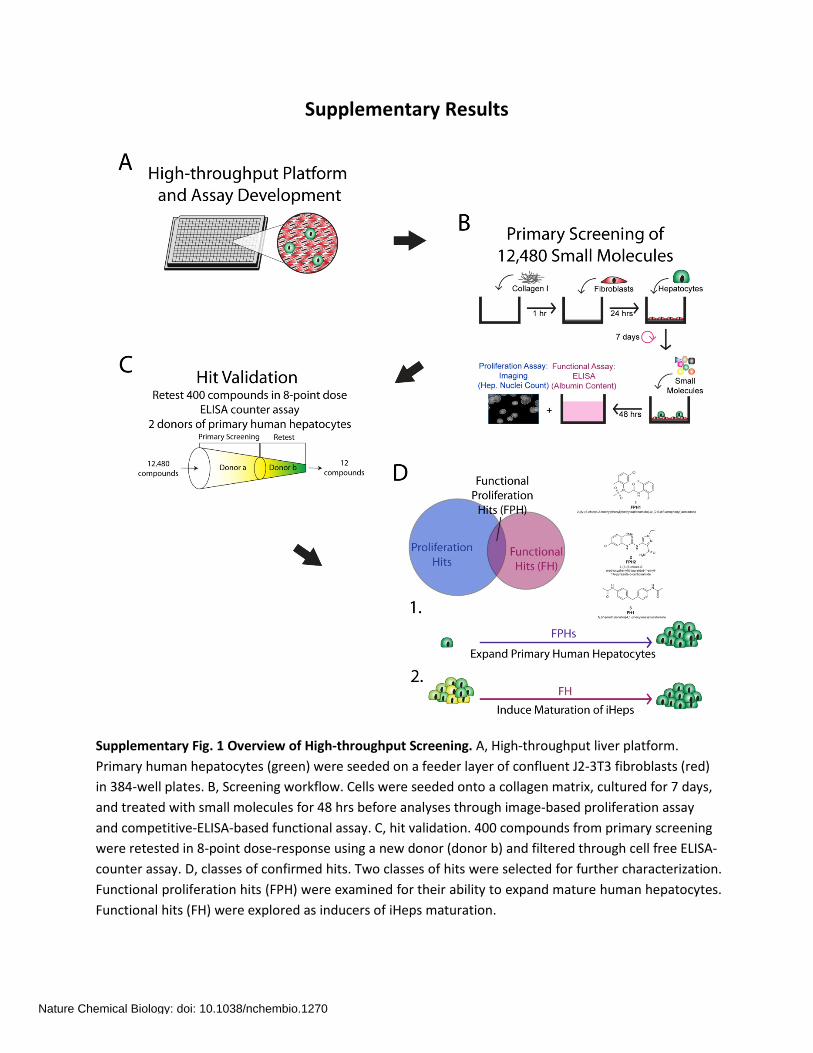
Supplementary Fig. 1 Overview of High-throughput Screening. A, High-throughput liver platform. Primary human hepatocytes (green) were seeded on a feeder layer of confluent J2-3T3 fibroblasts (red) in 384-well plates. B, Screening workflow. Cells were seeded onto a collagen matrix, cultured for 7 days, and treated with small molecules for 48 hrs before analyses through image-based proliferation assay and competitive-ELISA-based functional assay. C, hit validation. 400 compounds from primary screening were retested in 8-point dose-response using a new donor (donor b) and filtered through cell free ELISA-counter assay. D, classes of confirmed hits. Two classes of hits were selected for further characterization. Functional proliferation hits (FPH) were examined for their ability to expand mature human hepatocytes. Functional hits (FH) were explored as inducers of iHeps maturation.
Nature Chemical Biology: doi: 10.1038/nchembio.1270
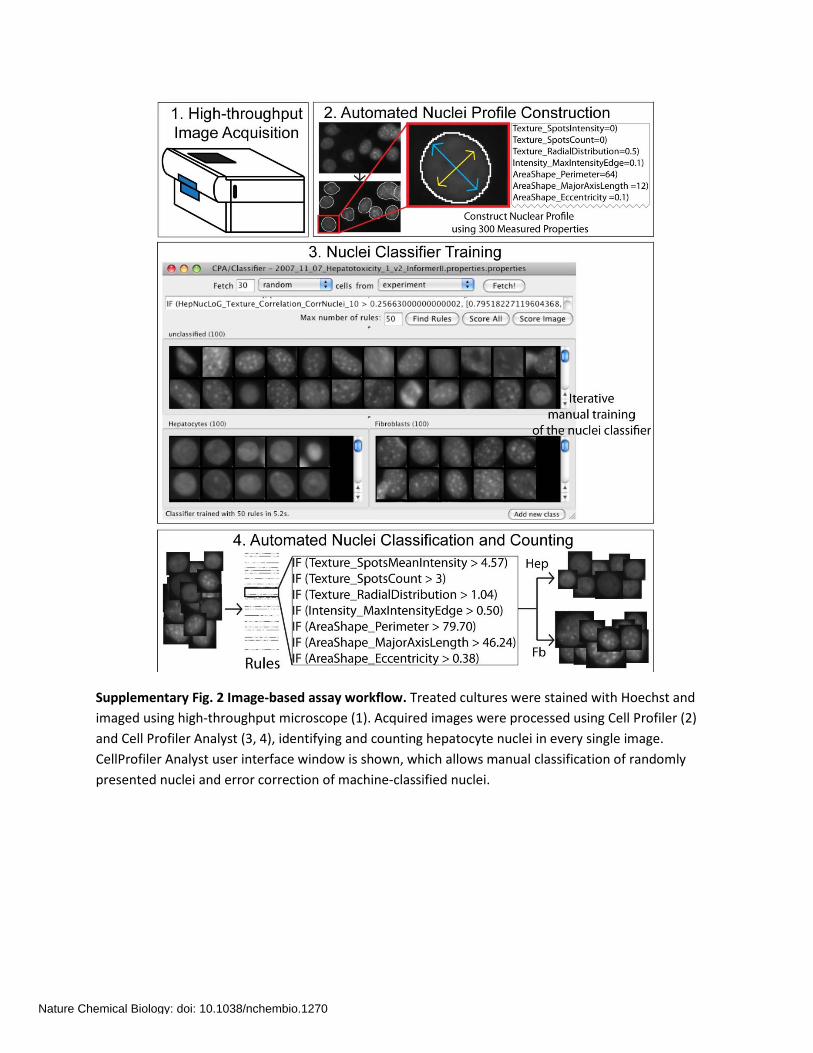
Supplementary Fig. 2 Image-based assay workflow. Treated cultures were stained with Hoechst and imaged using high-throughput microscope (1). Acquired images were processed using Cell Profiler (2) and Cell Profiler Analyst (3, 4), identifying and counting hepatocyte nuclei in every single image. CellProfiler Analyst user interface window is shown, which allows manual classification of randomly presented nuclei and error correction of machine-classified nuclei.
Nature Chemical Biology: doi: 10.1038/nchembio.1270
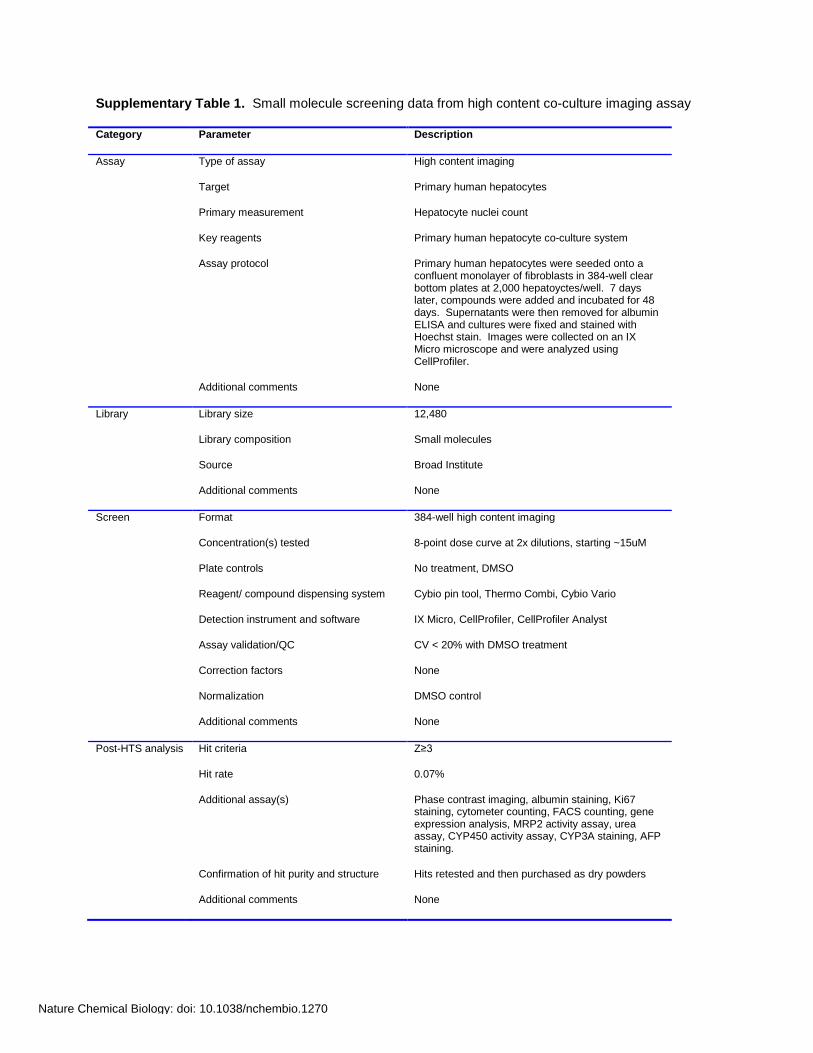
Supplementary Table 1. Small molecule screening data from high content co-culture imaging assay
Category Parameter Description
Assay Type of assay High content imaging
Target Primary human hepatocytes
Primary measurement Hepatocyte nuclei count
Key reagents Primary human hepatocyte co-culture system
Assay protocol Primary human hepatocytes were seeded onto a confluent monolayer of fibroblasts in 384-well clear bottom plates at 2,000 hepatoyctes/well. 7 days later, compounds were added and incubated for 48 days. Supernatants were then removed for albumin ELISA and cultures were fixed and stained with Hoechst stain. Images were collected on an IX Micro microscope and were analyzed using CellProfiler.
Additional comments None
Library Library size 12,480
Library composition Small molecules
Source Broad Institute
Additional comments None
Screen Format 384-well high content imaging
Concentration(s) tested 8-point dose curve at 2x dilutions, starting ~15uM
Plate controls No treatment, DMSO
Reagent/ compound dispensing system Cybio pin tool, Thermo Combi, Cybio Vario
Detection instrument and software IX Micro, CellProfiler, CellProfiler Analyst
Assay validation/QC CV < 20% with DMSO treatment
Correction factors None
Normalization DMSO control
Additional comments None
Post-HTS analysis Hit criteria Z≥3
Hit rate 0.07%
Additional assay(s) Phase contrast imaging, albumin staining, Ki67 staining, cytometer counting, FACS counting, gene expression analysis, MRP2 activity assay, urea assay, CYP450 activity assay, CYP3A staining, AFP staining.
Confirmation of hit purity and structure Hits retested and then purchased as dry powders
Additional comments None
Nature Chemical Biology: doi: 10.1038/nchembio.1270
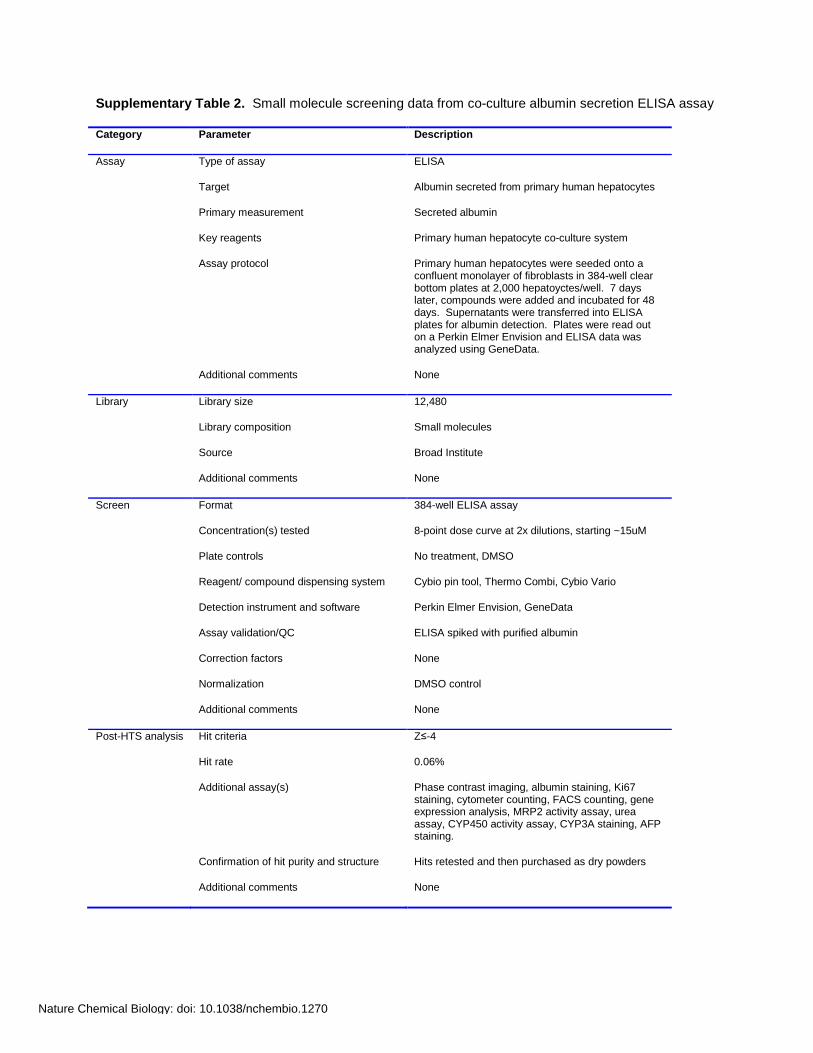
Supplementary Table 2. Small molecule screening data from co-culture albumin secretion ELISA assay
Category Parameter Description
Assay Type of assay ELISA
Target Albumin secreted from primary human hepatocytes
Primary measurement Secreted albumin
Key reagents Primary human hepatocyte co-culture system
Assay protocol Primary human hepatocytes were seeded onto a confluent monolayer of fibroblasts in 384-well clear bottom plates at 2,000 hepatoyctes/well. 7 days later, compounds were added and incubated for 48 days. Supernatants were transferred into ELISA plates for albumin detection. Plates were read out on a Perkin Elmer Envision and ELISA data was analyzed using GeneData.
Additional comments None
Library Library size 12,480
Library composition Small molecules
Source Broad Institute
Additional comments None
Screen Format 384-well ELISA assay
Concentration(s) tested 8-point dose curve at 2x dilutions, starting ~15uM
Plate controls No treatment, DMSO
Reagent/ compound dispensing system Cybio pin tool, Thermo Combi, Cybio Vario
Detection instrument and software Perkin Elmer Envision, GeneData
Assay validation/QC ELISA spiked with purified albumin
Correction factors None
Normalization DMSO control
Additional comments None
Post-HTS analysis Hit criteria Z≤-4
Hit rate 0.06%
Additional assay(s) Phase contrast imaging, albumin staining, Ki67 staining, cytometer counting, FACS counting, gene expression analysis, MRP2 activity assay, urea assay, CYP450 activity assay, CYP3A staining, AFP staining.
Confirmation of hit purity and structure Hits retested and then purchased as dry powders
Additional comments None
Nature Chemical Biology: doi: 10.1038/nchembio.1270
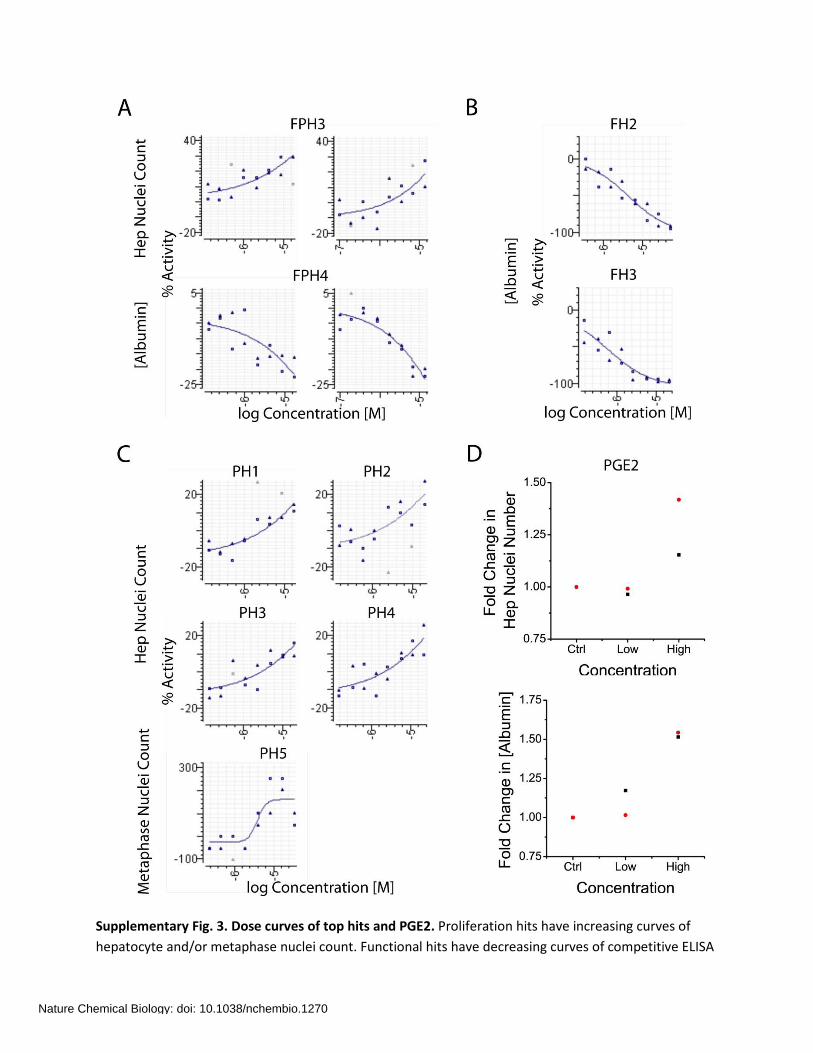
Supplementary Fig. 3. Dose curves of top hits and PGE2. Proliferation hits have increasing curves of hepatocyte and/or metaphase nuclei count. Functional hits have decreasing curves of competitive ELISA
Nature Chemical Biology: doi: 10.1038/nchembio.1270
for [Albumin] or increasing curves of fold change in [Albumin]. Control cultures were treated with empty vehicle (DMSO).
Nature Chemical Biology: doi: 10.1038/nchembio.1270
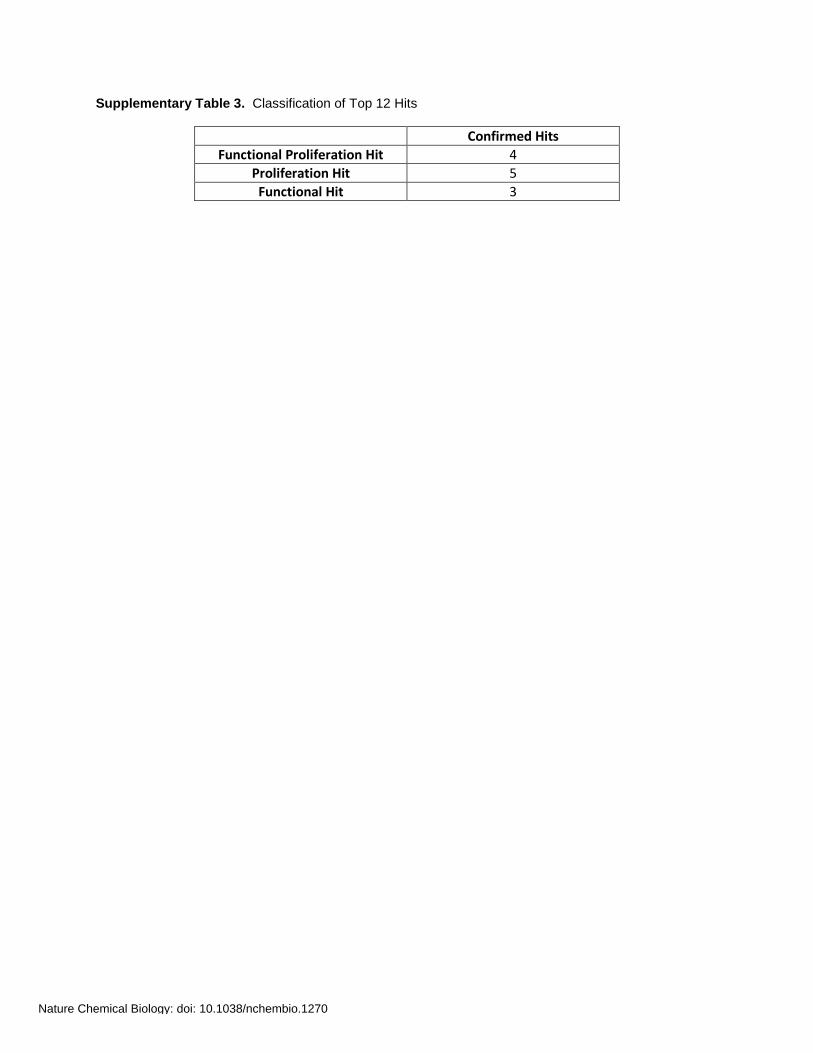
Supplementary Table 3. Classification of Top 12 Hits
Confirmed Hits Functional Proliferation Hit 4
Proliferation Hit 5 Functional Hit 3
Nature Chemical Biology: doi: 10.1038/nchembio.1270
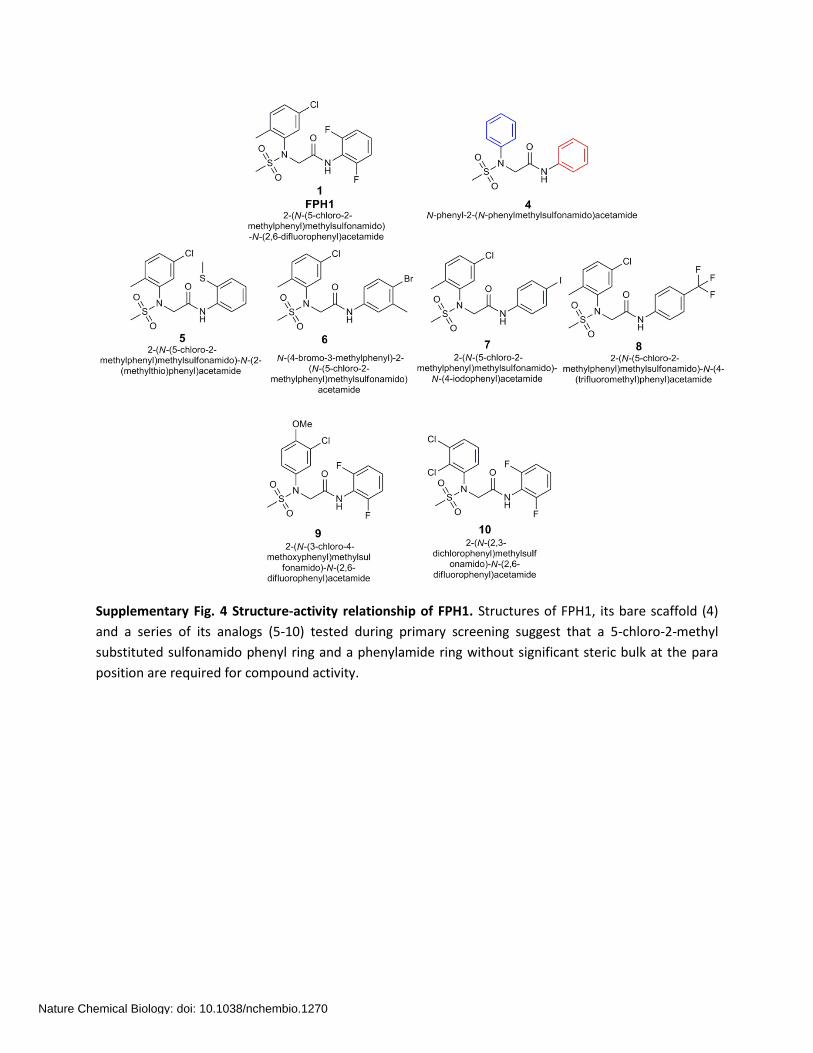
Supplementary Fig. 4 Structure-activity relationship of FPH1. Structures of FPH1, its bare scaffold (4) and a series of its analogs (5-10) tested during primary screening suggest that a 5-chloro-2-methyl substituted sulfonamido phenyl ring and a phenylamide ring without significant steric bulk at the para position are required for compound activity.
Nature Chemical Biology: doi: 10.1038/nchembio.1270
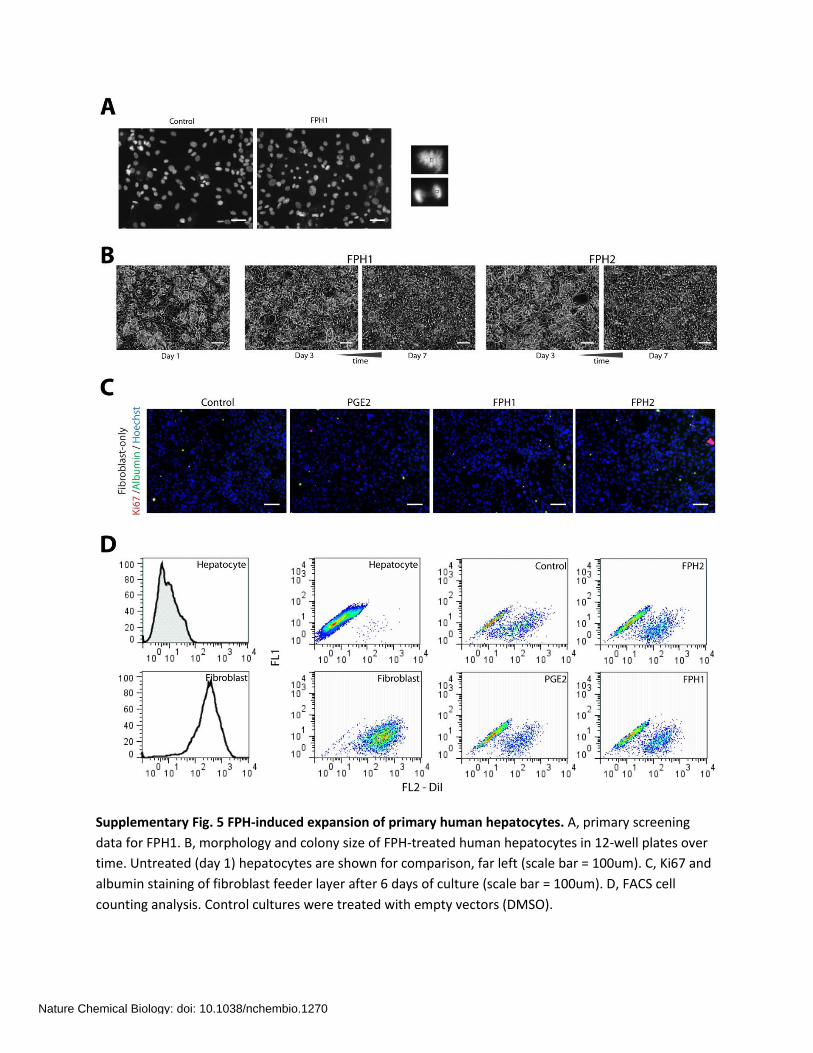
Supplementary Fig. 5 FPH-induced expansion of primary human hepatocytes. A, primary screening data for FPH1. B, morphology and colony size of FPH-treated human hepatocytes in 12-well plates over time. Untreated (day 1) hepatocytes are shown for comparison, far left (scale bar = 100um). C, Ki67 and albumin staining of fibroblast feeder layer after 6 days of culture (scale bar = 100um). D, FACS cell counting analysis. Control cultures were treated with empty vectors (DMSO).
Nature Chemical Biology: doi: 10.1038/nchembio.1270
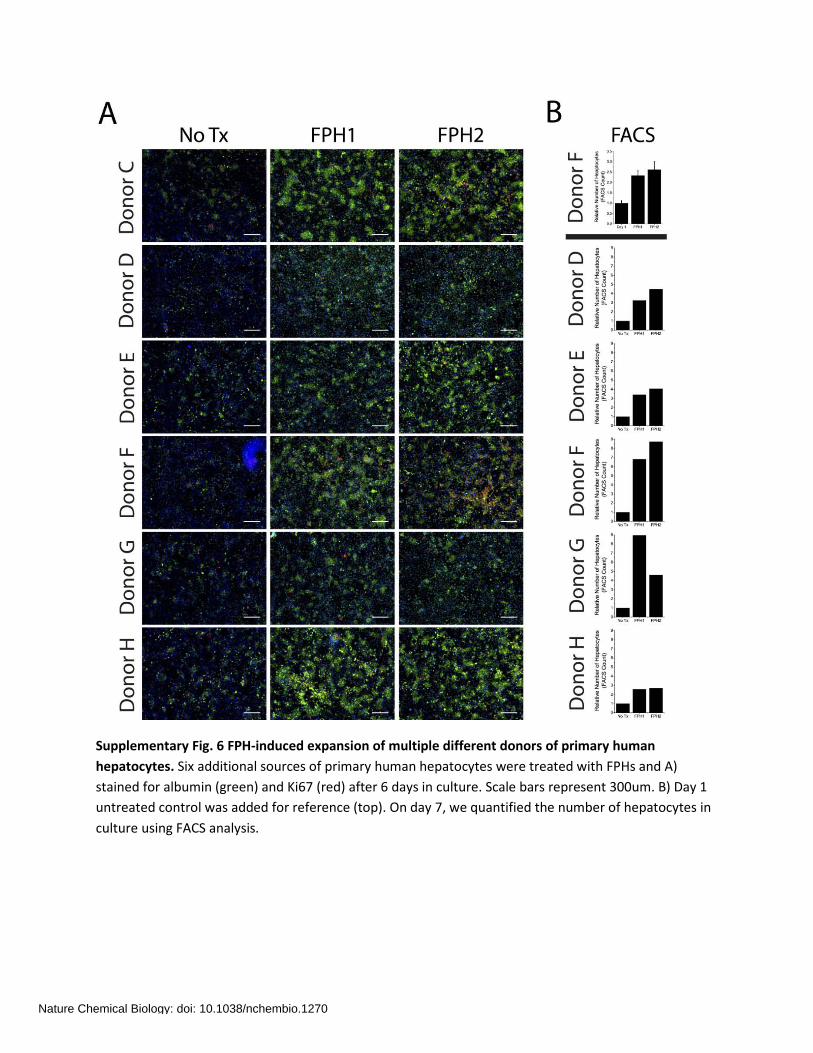
Supplementary Fig. 6 FPH-induced expansion of multiple different donors of primary human hepatocytes. Six additional sources of primary human hepatocytes were treated with FPHs and A) stained for albumin (green) and Ki67 (red) after 6 days in culture. Scale bars represent 300um. B) Day 1 untreated control was added for reference (top). On day 7, we quantified the number of hepatocytes in culture using FACS analysis.
Nature Chemical Biology: doi: 10.1038/nchembio.1270
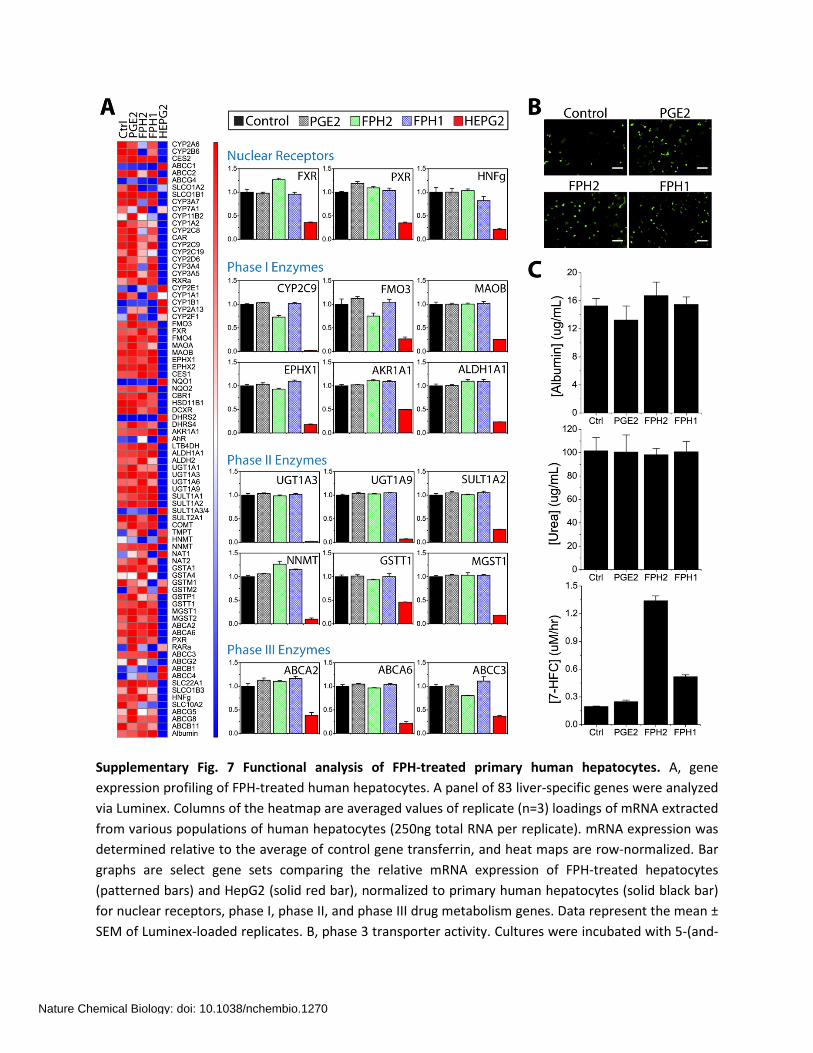
Supplementary Fig. 7 Functional analysis of FPH-treated primary human hepatocytes. A, gene expression profiling of FPH-treated human hepatocytes. A panel of 83 liver-specific genes were analyzed via Luminex. Columns of the heatmap are averaged values of replicate (n=3) loadings of mRNA extracted from various populations of human hepatocytes (250ng total RNA per replicate). mRNA expression was determined relative to the average of control gene transferrin, and heat maps are row-normalized. Bar graphs are select gene sets comparing the relative mRNA expression of FPH-treated hepatocytes (patterned bars) and HepG2 (solid red bar), normalized to primary human hepatocytes (solid black bar) for nuclear receptors, phase I, phase II, and phase III drug metabolism genes. Data represent the mean ± SEM of Luminex-loaded replicates. B, phase 3 transporter activity. Cultures were incubated with 5-(and-
Nature Chemical Biology: doi: 10.1038/nchembio.1270
6)-carboxy-2’,7’-dichlorofluorescein diacetate, which is internalized by hepatocytes, cleaved by intracellular esterases and excreted into the bile canaliculi between hepatocytes by transporters (scale bar = 50um). C, biochemical characterization of key hepatocyte functions. Albumin secretion reflects protein synthesis capability; urea content is a surrogate marker for protein metabolism; detoxification functions were measured via processing of substrate BFC into fluorescent products. For all analyses, primary and FPH-treated hepatocytes were cultured for 7 days in 12-well plates (n=3). Control cultures were treated with empty vehicles (DMSO). All data presented as mean ± s.d.
Nature Chemical Biology: doi: 10.1038/nchembio.1270
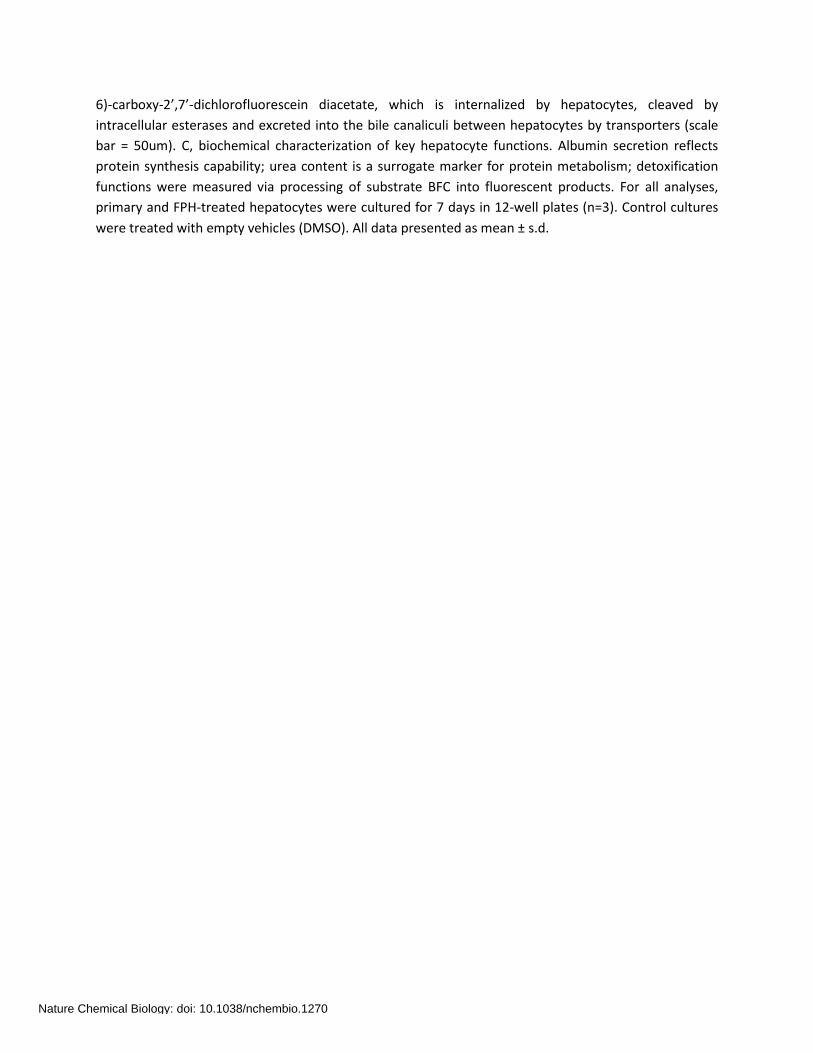
Supplementary Fig. 8 iHeps generation. A) Undifferentiated iPS (top) and hepatic progenitor cells (iHEP) generated from iPS (bottom). B) Immunofluorescent staining of hepatic lineage markers, not present in iPS (top), but expressed by iHEP (bottom). C) FACS analysis illustrating expression of iPS markers and hepatic progenitor markers in undifferentiated iPS (top) and iHEP (bottom). Scale bars = 50um.
Nature Chemical Biology: doi: 10.1038/nchembio.1270
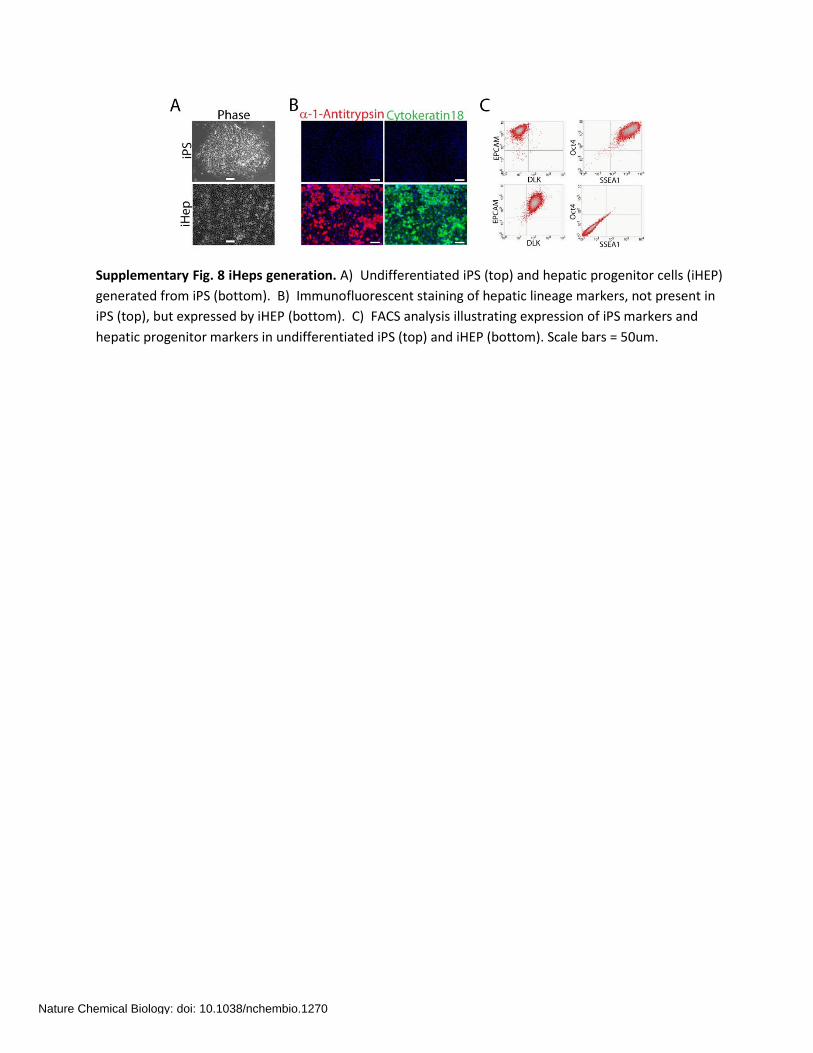
Supplementary Fig. 9 Maturation of human iHeps. Albumin, CYP3A and AFP staining of iHeps after 9 days of culture (scale bar = 100um). Control iHeps were maintained in OSM-free hepatocyte basal medium.
Nature Chemical Biology: doi: 10.1038/nchembio.1270
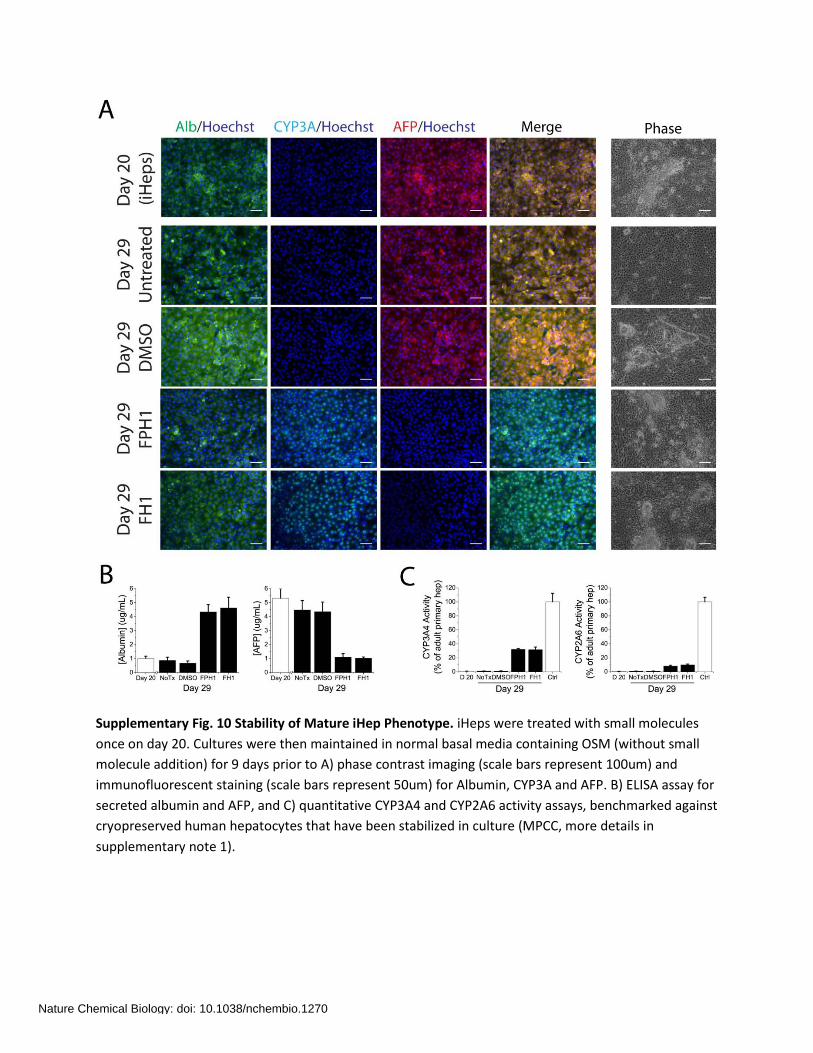
Supplementary Fig. 10 Stability of Mature iHep Phenotype. iHeps were treated with small molecules once on day 20. Cultures were then maintained in normal basal media containing OSM (without small molecule addition) for 9 days prior to A) phase contrast imaging (scale bars represent 100um) and immunofluorescent staining (scale bars represent 50um) for Albumin, CYP3A and AFP. B) ELISA assay for secreted albumin and AFP, and C) quantitative CYP3A4 and CYP2A6 activity assays, benchmarked against cryopreserved human hepatocytes that have been stabilized in culture (MPCC, more details in supplementary note 1).
Nature Chemical Biology: doi: 10.1038/nchembio.1270
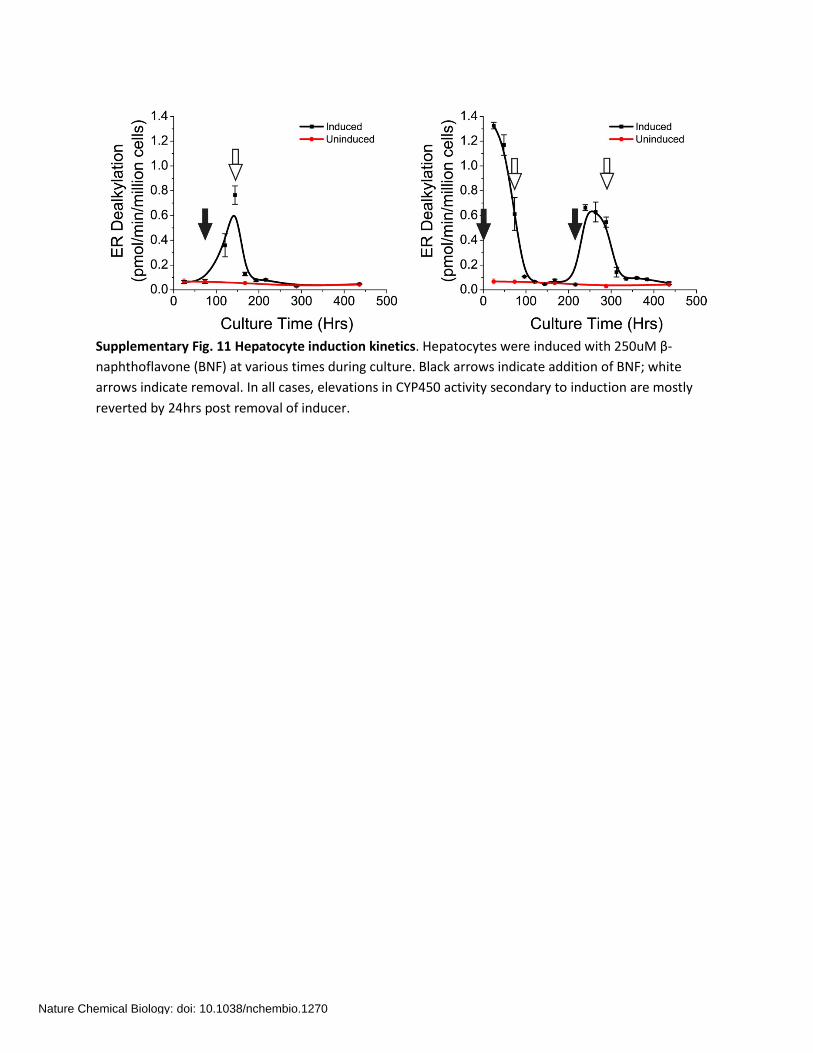
Supplementary Fig. 11 Hepatocyte induction kinetics. Hepatocytes were induced with 250uM β-naphthoflavone (BNF) at various times during culture. Black arrows indicate addition of BNF; white arrows indicate removal. In all cases, elevations in CYP450 activity secondary to induction are mostly reverted by 24hrs post removal of inducer.
Nature Chemical Biology: doi: 10.1038/nchembio.1270
Supplementary Note 1
Hepatocyte Medium Composition
1X DMEM 10% fetal bovine serum (FBS) 15.6 ug/ml insulin 7.5 µg/ml hydrocortisone 16 ng/ml glucagon 1% penicillin-streptomycin Fibroblast Medium Composition
1X DMEM 10% bovine serum (BS) 1% penicillin-streptomycin Cell Culture Conditions High-throughput screening. Screening of small molecules was conducted in384-well formats using cryopreserved primary human hepatocytes co-cultured on confluent feeder layers of murine embryonic J2-3T3 fibroblasts. Each screening plate contained 64 wells of untreated or vehicle-treated (DMSO) controls. J2-3T3s were cultured in fibroblast media; co-cultures were maintained in hepatocyte media. Expansion of primary human hepatocytes. Validation experiments examining the proliferative effects of FPH1 and FPH2 were conducted in standard tissue culture vessels (24, 12 or 6-wells) using cryopreserved primary human hepatocytes co-cultured on confluent feeder layers of murine embryonic J2-3T3 fibroblasts. J2-3T3s were cultured in fibroblast media; co-cultures were maintained in hepatocyte media. J2-3T3s were growth-arrested with 8ug/mL of mitomycin-C (Sigma) for 3 hours and labeled with Vybrant CM-DiI (Invitrogen) prior to use in co-culture. Control cultures were either treated with empty vehicles (DMSO) or were untreated. Differentiation of iPS cells. Validation experiments examining the maturation effects of FH1 and FPH1 were conducted in standard tissue culture vessels (24 or 6-wells) using human iPS-derived hepatocyte-like cells (iHeps). iHeps were cultured in hepatocyte basal media. Experiments examining maturation (rather than differentiation) of iHeps (Fig. 3, 4 and supplementary Fig. 9) were conducted without OSM supplementation in the late stages (after day 20) of cultures while experiments reported in supplementary Fig. 10 were conducted in the presence of OSM. Phenotype of treated iHeps were benchmarked to cryopreserved primary human hepatocytes stabilized by a micropatterned co-culture system (MPCC), previously reported21 to allow for functional recovery of primary human hepatocytes
Nature Chemical Biology: doi: 10.1038/nchembio.1270

following the trauma of isolation and disruption from the native microenvironment, and is thus more representative of in vivo liver physiology.
Nature Chemical Biology: doi: 10.1038/nchembio.1270
Supplementary Note 2
Lead Compounds
FPH1 (BRD-6125) was purchased as a dry powder from ChemBridge Corporation.
FPH2 (BRD-9424) was purchased as a dry powder from Molport.
FH1 (BRD-K4477) was purchased as a dry powder from Molport.
Characterization of Lead Compounds
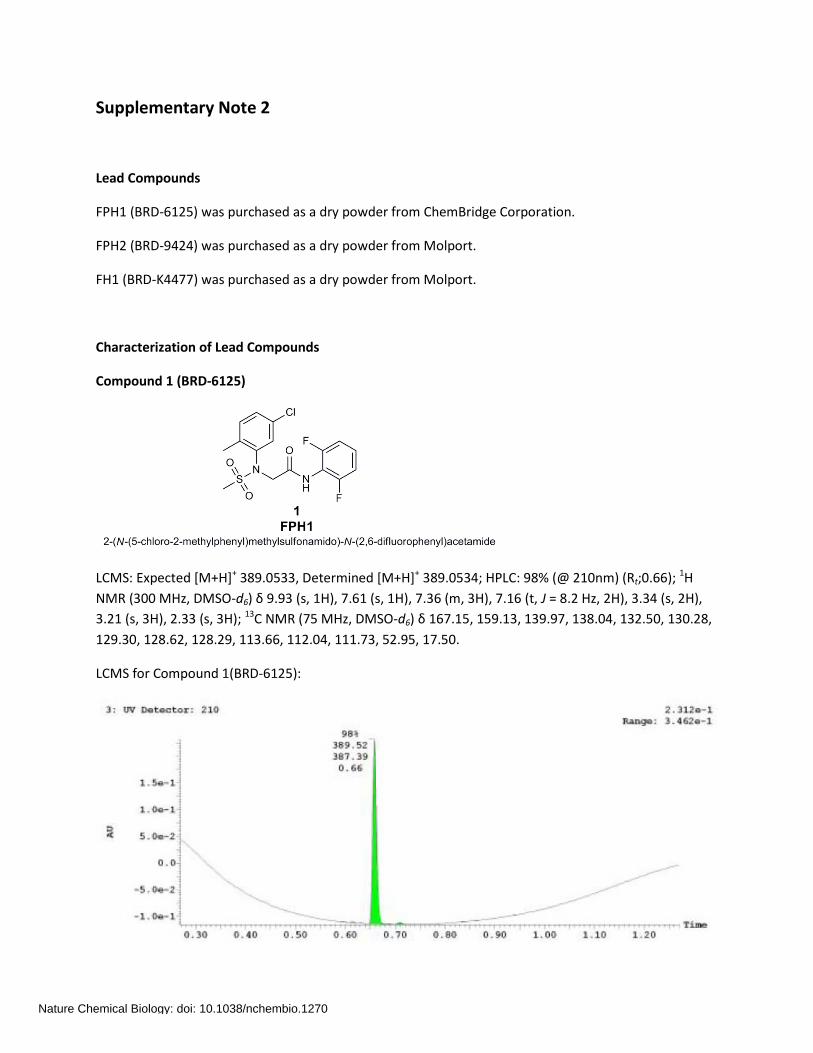
Compound 1 (BRD-6125)
LCMS: Expected [M+H]+ 389.0533, Determined [M+H]+ 389.0534; HPLC: 98% (@ 210nm) (Rt;0.66); 1H NMR (300 MHz, DMSO-d6) δ 9.93 (s, 1H), 7.61 (s, 1H), 7.36 (m, 3H), 7.16 (t, J = 8.2 Hz, 2H), 3.34 (s, 2H), 3.21 (s, 3H), 2.33 (s, 3H); 13C NMR (75 MHz, DMSO-d6) δ 167.15, 159.13, 139.97, 138.04, 132.50, 130.28, 129.30, 128.62, 128.29, 113.66, 112.04, 111.73, 52.95, 17.50.
LCMS for Compound 1(BRD-6125):
Nature Chemical Biology: doi: 10.1038/nchembio.1270
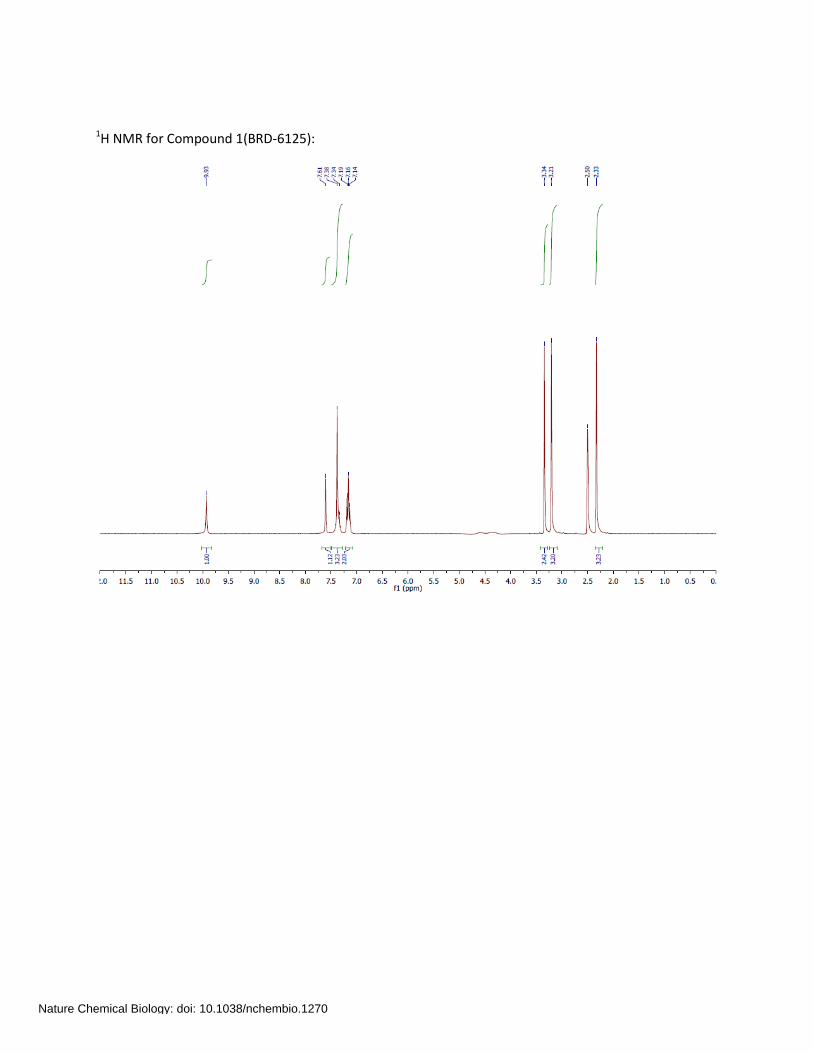
1H NMR for Compound 1(BRD-6125):
Nature Chemical Biology: doi: 10.1038/nchembio.1270
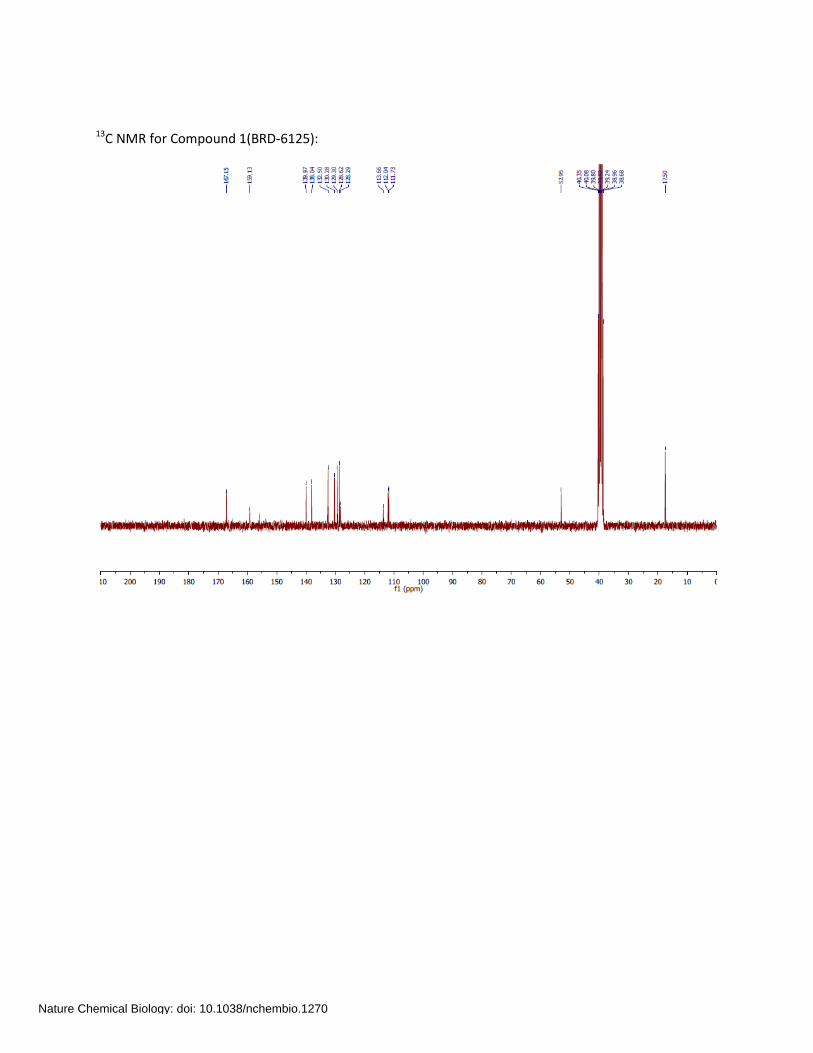
13C NMR for Compound 1(BRD-6125):
Nature Chemical Biology: doi: 10.1038/nchembio.1270
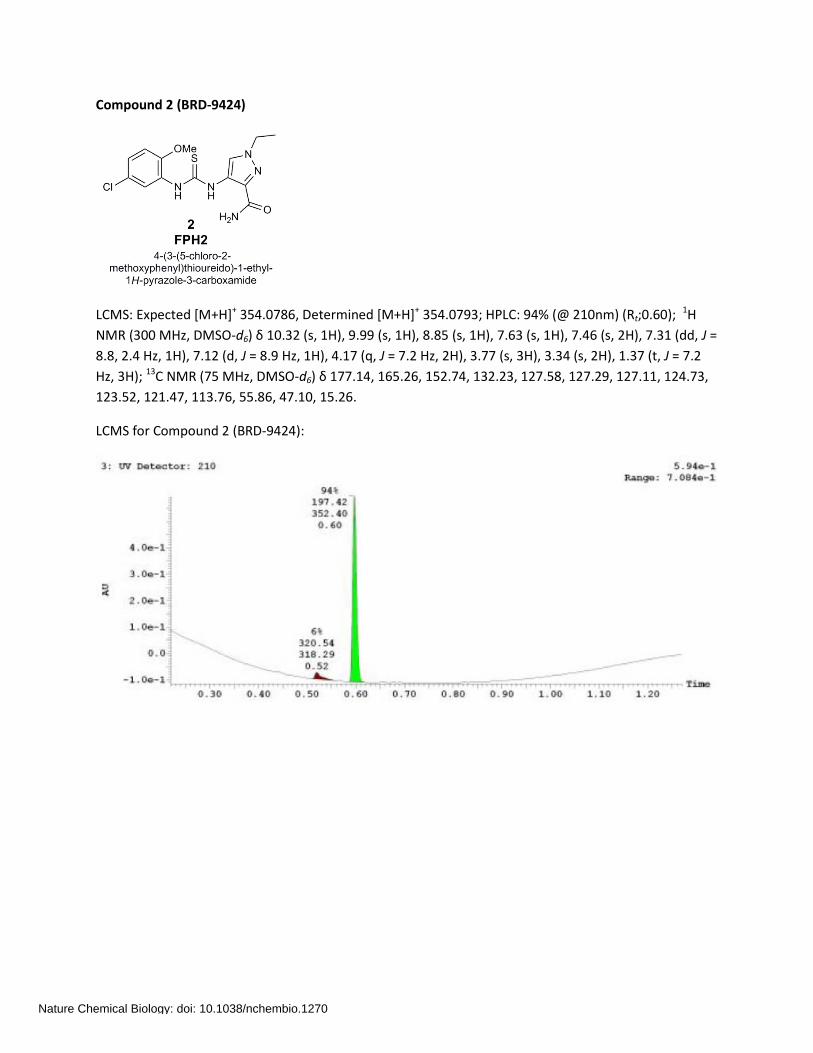
Compound 2 (BRD-9424)
LCMS: Expected [M+H]+ 354.0786, Determined [M+H]+ 354.0793; HPLC: 94% (@ 210nm) (Rt;0.60); 1H NMR (300 MHz, DMSO-d6) δ 10.32 (s, 1H), 9.99 (s, 1H), 8.85 (s, 1H), 7.63 (s, 1H), 7.46 (s, 2H), 7.31 (dd, J = 8.8, 2.4 Hz, 1H), 7.12 (d, J = 8.9 Hz, 1H), 4.17 (q, J = 7.2 Hz, 2H), 3.77 (s, 3H), 3.34 (s, 2H), 1.37 (t, J = 7.2 Hz, 3H); 13C NMR (75 MHz, DMSO-d6) δ 177.14, 165.26, 152.74, 132.23, 127.58, 127.29, 127.11, 124.73, 123.52, 121.47, 113.76, 55.86, 47.10, 15.26.
LCMS for Compound 2 (BRD-9424):
Nature Chemical Biology: doi: 10.1038/nchembio.1270
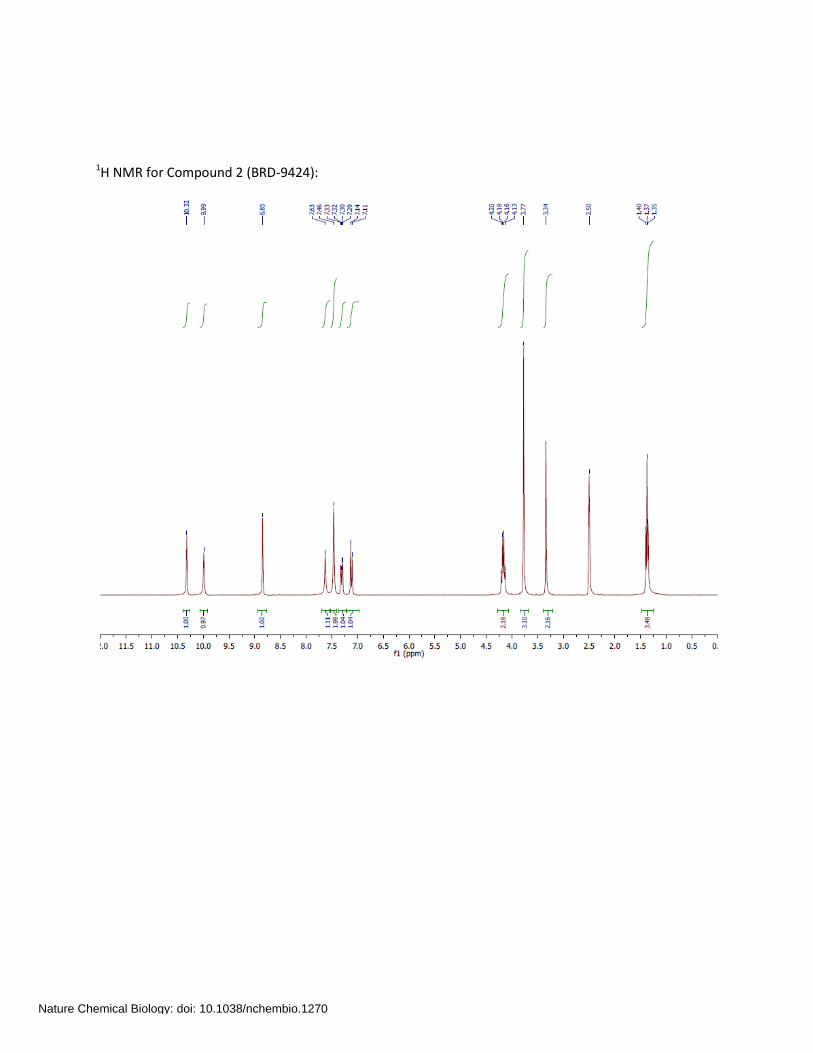
1H NMR for Compound 2 (BRD-9424):
Nature Chemical Biology: doi: 10.1038/nchembio.1270
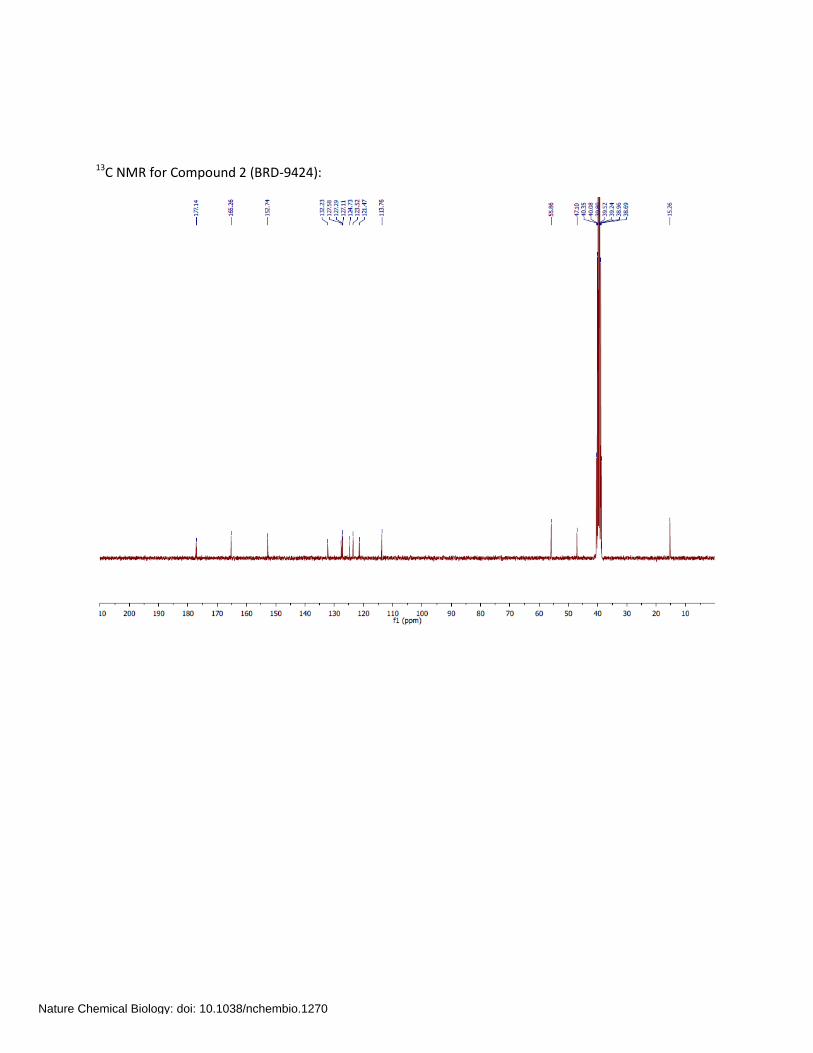
13C NMR for Compound 2 (BRD-9424):
Nature Chemical Biology: doi: 10.1038/nchembio.1270
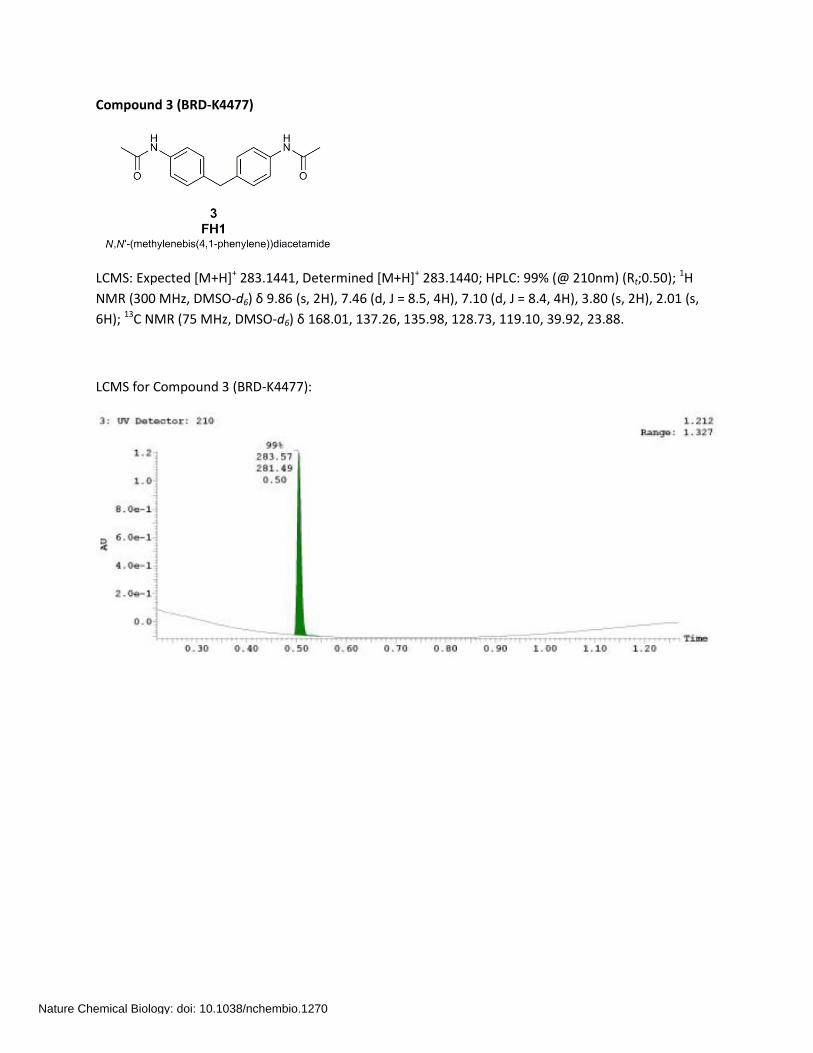
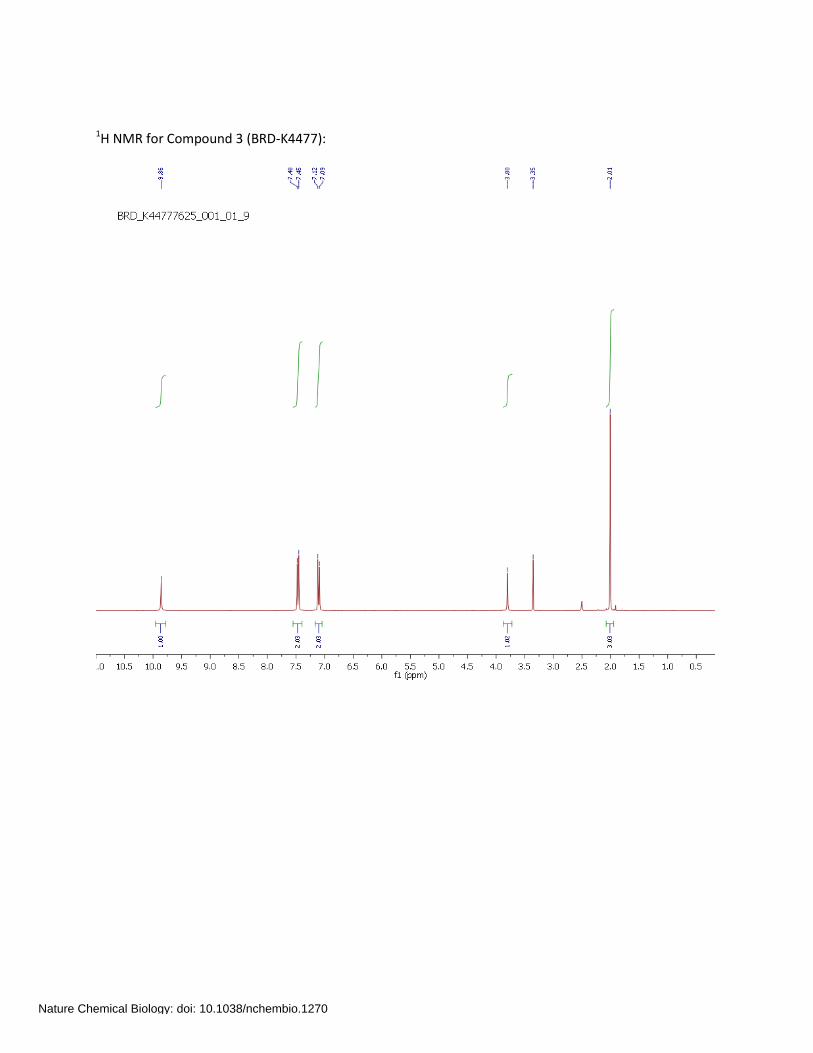
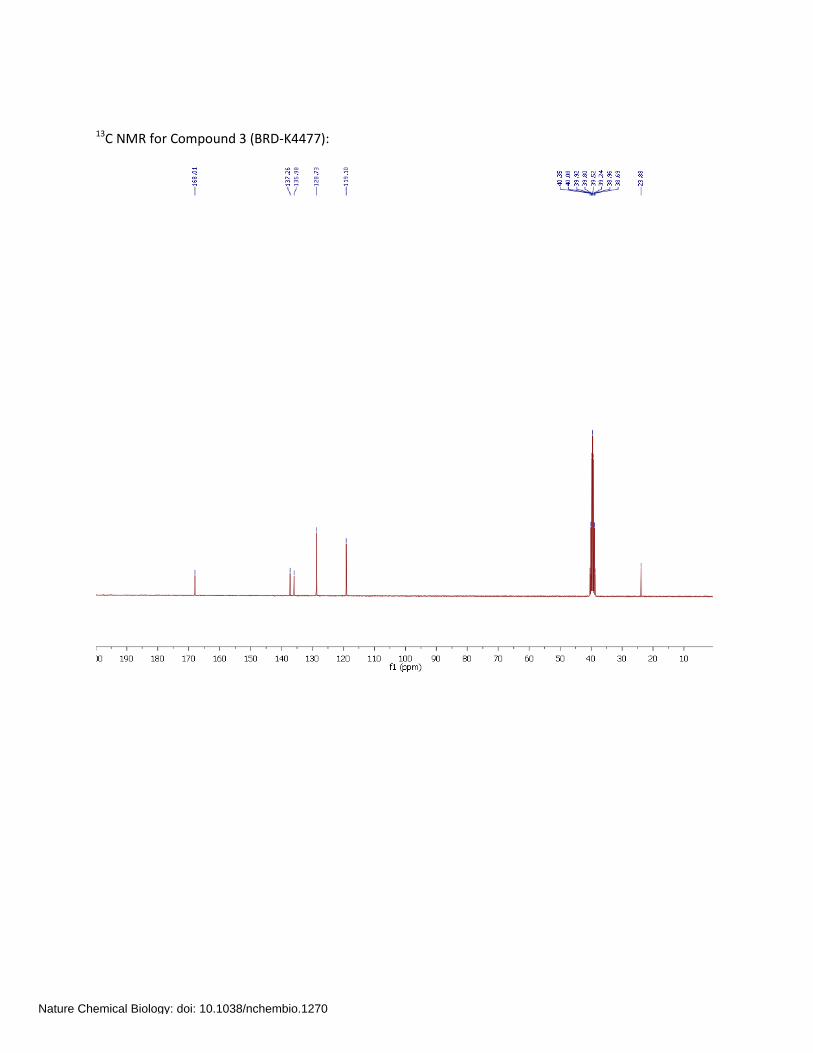
Compound 3 (BRD-K4477)
LCMS: Expected [M+H]+ 283.1441, Determined [M+H]+ 283.1440; HPLC: 99% (@ 210nm) (Rt;0.50); 1H NMR (300 MHz, DMSO-d6) δ 9.86 (s, 2H), 7.46 (d, J = 8.5, 4H), 7.10 (d, J = 8.4, 4H), 3.80 (s, 2H), 2.01 (s, 6H); 13C NMR (75 MHz, DMSO-d6) δ 168.01, 137.26, 135.98, 128.73, 119.10, 39.92, 23.88.
LCMS for Compound 3 (BRD-K4477):
Nature Chemical Biology: doi: 10.1038/nchembio.1270
1H NMR for Compound 3 (BRD-K4477):
Nature Chemical Biology: doi: 10.1038/nchembio.1270
13C NMR for Compound 3 (BRD-K4477):
Nature Chemical Biology: doi: 10.1038/nchembio.1270