Embed Size (px)
Citation preview

- S1 -
Supplementary Information
for manuscript entitled
Effect of Preorganization on the Affinity of Synthetic DNA Binding Motifs for
Nucleotide Ligands
by
Sven Vollmer and Clemens Richert
Contents
1. Selected HPLC Chromatograms of Modified Oligonucleotides
2. MALDI-TOF Mass Spectra of Modified Oligonucleotides
3. Additional UV/VIS-Spectra from Filtration Assays
4. Additional UV-Melting Curves
5. Effect of Magnesium Ions and pH 7.0 on UV-Melting Points
6. Confirming Binding of cAMP by RP-HPLC
Electronic Supplementary Material (ESI) for Organic & Biomolecular Chemistry.This journal is © The Royal Society of Chemistry 2015

- S2 -
2. Selected HPLC Chromatograms of Modified Oligonucleotides
For oligonucleotides 2-6, see Experimental Part for HPLC gradients.
Figure S1. HPLC chromatogram of oligonucleotide 2.
Figure S2. HPLC chromatogram of oligonucleotide 3.

- S3 -
Figure S3. HPLC chromatogram of oligonucleotide 5.
Figure S4. HPLC chromatogram of oligonucleotide 6.

- S4 -
Figure S5. HPLC chromatogram of oligonucleotide 15; gradient: 0% acetonitrile for 5 min,
then of 0% to 10% acetonitrile in 20 min, 10% to 20% in 25 min, 20% to 25% in 10 min, then
25% to 80% in 5 min.
Figure S6. HPLC chromatogram of oligonucleotide 16; gradient identical to that reported in
the legend to Figure S5.
- S5 -
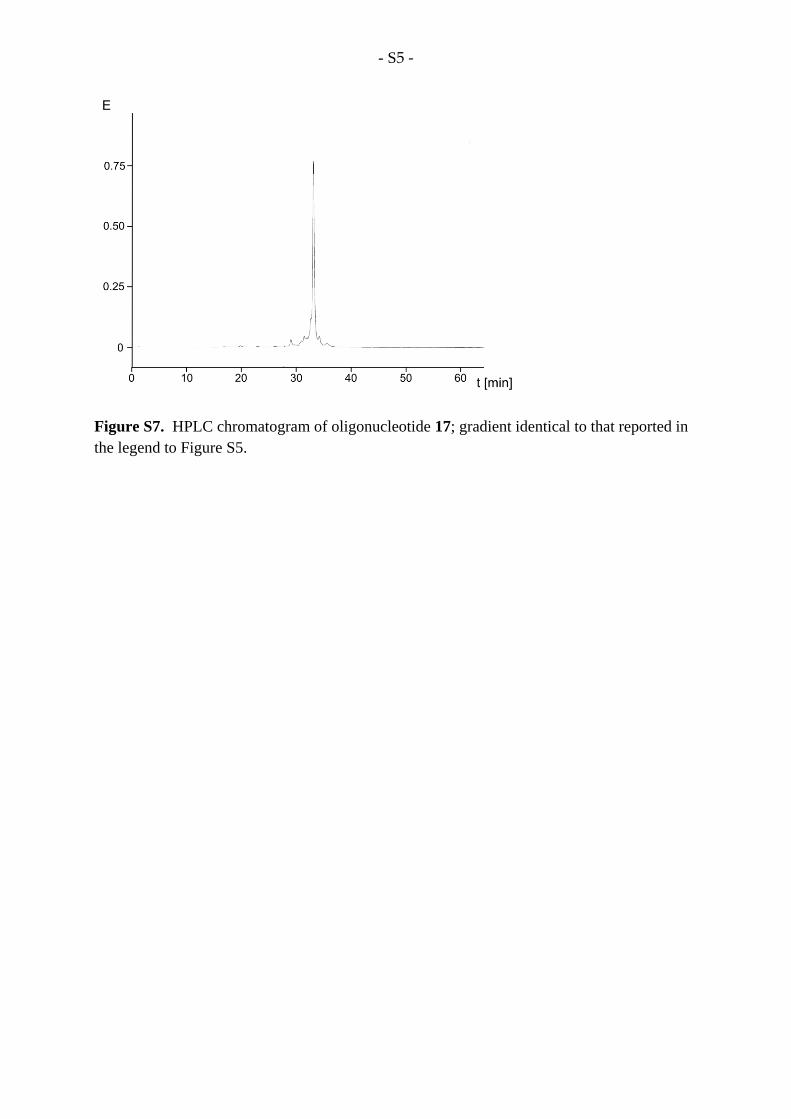
Figure S7. HPLC chromatogram of oligonucleotide 17; gradient identical to that reported in
the legend to Figure S5.

- S6 -
2. MALDI-TOF Mass Spectra of Modified Oligonucleotides
Figure S8. MALDI-TOF mass spectrum of oligonucleotide 2, as measured in linear negative
mode. An assignment of the ions is shown above the relevant peaks.
Figure S9. MALDI-TOF mass spectrum of oligonucleotide 3, as measured in linear negative
mode. An assignment of the ions is shown above the relevant peaks.

- S7 -
Figure S10. MALDI-TOF mass spectrum of oligonucleotide 4, as measured in linear
negative mode. An assignment of the ions is shown above the relevant peaks.
Figure S11. MALDI-TOF mass spectrum of oligonucleotide 5, as measured in linear
negative mode. An assignment of the ions is shown above the relevant peaks.

- S8 -
Figure S12. MALDI-TOF mass spectrum of oligonucleotide 6, as measured in linear
negative mode. An assignment of the ions is shown above the relevant peaks.
Figure S13. MALDI spectrum of motif 15. Measured in linear negative mode with matrix /
comatrix: 2,4,6-trihydroxyacetophenone / diammonium hydrogen citrate in ethanol.
- S9 -
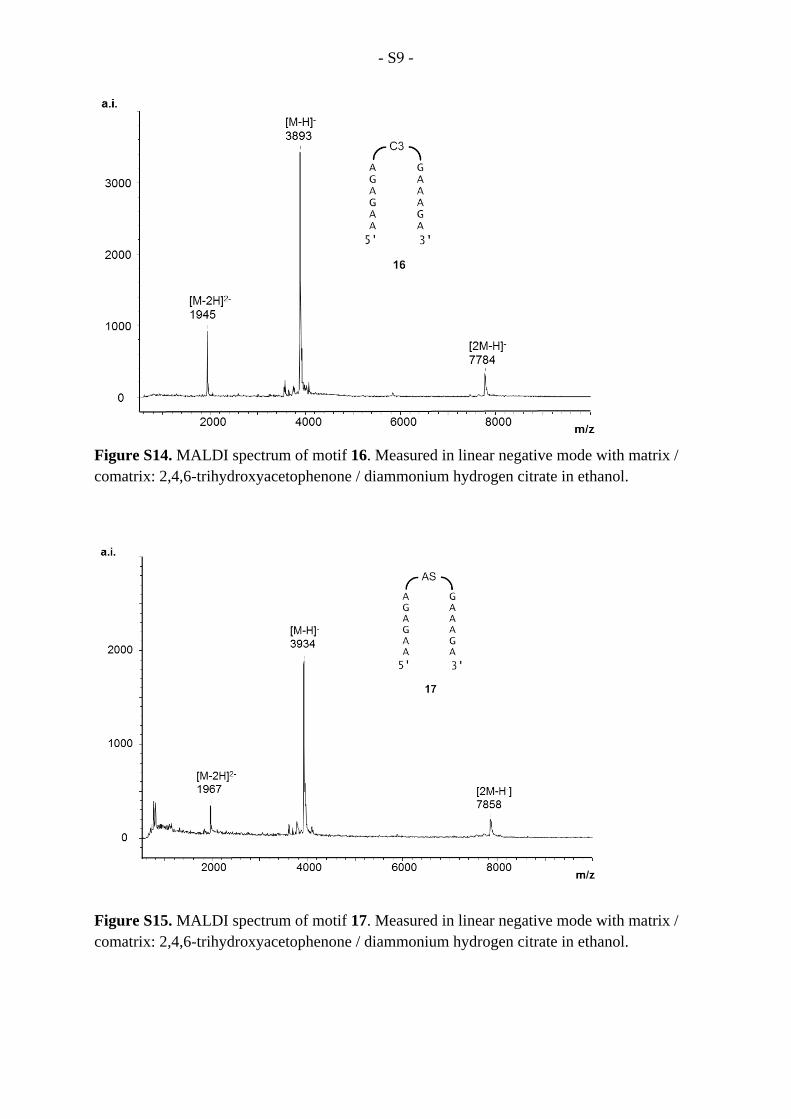
Figure S14. MALDI spectrum of motif 16. Measured in linear negative mode with matrix /
comatrix: 2,4,6-trihydroxyacetophenone / diammonium hydrogen citrate in ethanol.
Figure S15. MALDI spectrum of motif 17. Measured in linear negative mode with matrix /
comatrix: 2,4,6-trihydroxyacetophenone / diammonium hydrogen citrate in ethanol.

- S10 -
3. Additional UV/VIS-Spectra from Filtration Assays
Intramolecular triplex formed by 6
Figure S16. UV/VIS-spectra from equilibrium filtration assays with triplex 6 with cAMP or
SAM as ligands. The dashed curves are spectra of filtrates, and solid curves are from a
control sample containing the ligand only. Conditions: 10 µM triplex, 10 µM ligand, 10 mM
phosphate buffer (pH 6.0), 1 mM NaCl.
cAMP SAM

- S11 -
Triplex 16:19
Triplex 17:19
Triplex 18:19
Figure S17. UV/VIS-spectra from equilibrium filtration assays with triplex 16 – 18 and 19
with ATP, cAMP, FAD or cGMP as ligands. The dashed curves are spectra of filtrates, and
solid curves are from a control sample containing the ligand only. Conditions: 10 µM triplex,
10 µM ligand, 10 mM phosphate buffer (pH 6.0), 1 mM NaCl.
ATP cAMP FAD cGMP
ATP cAMP FAD cGMP
ATP cAMP cGMP FAD
- S12 -
4. Additional UV-Melting Curves
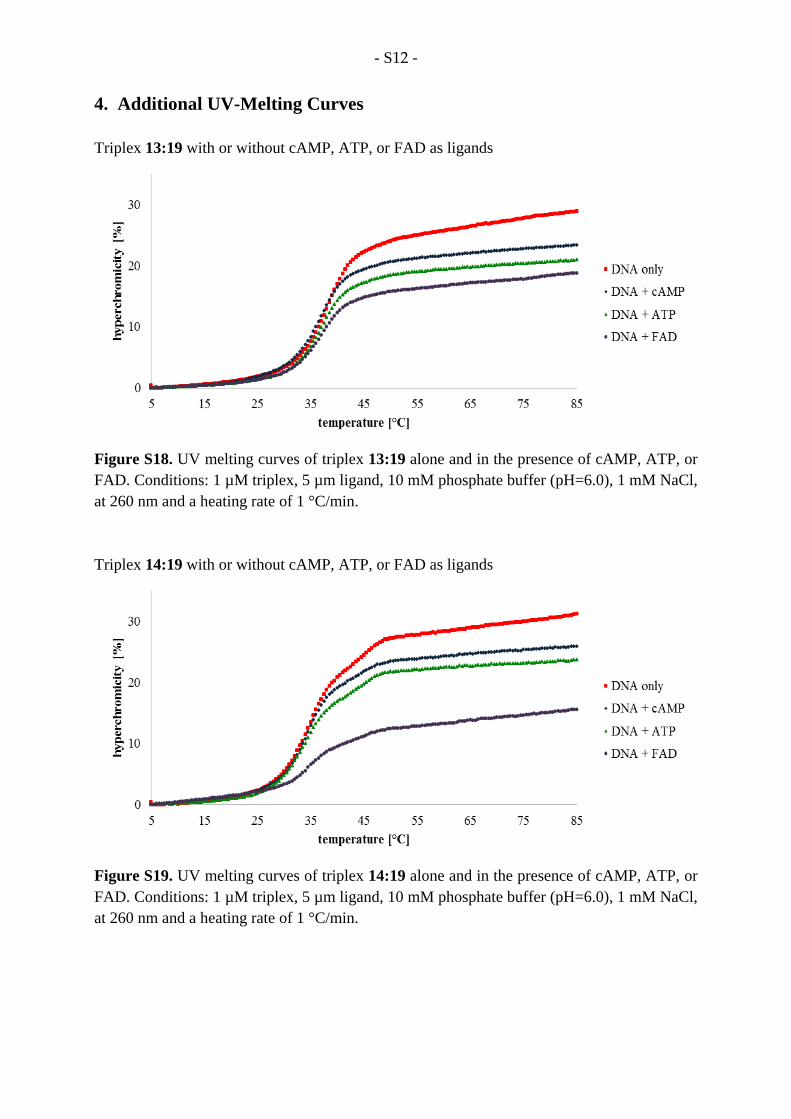
Triplex 13:19 with or without cAMP, ATP, or FAD as ligands
Figure S18. UV melting curves of triplex 13:19 alone and in the presence of cAMP, ATP, or
FAD. Conditions: 1 µM triplex, 5 µm ligand, 10 mM phosphate buffer (pH=6.0), 1 mM NaCl,
at 260 nm and a heating rate of 1 °C/min.
Triplex 14:19 with or without cAMP, ATP, or FAD as ligands
Figure S19. UV melting curves of triplex 14:19 alone and in the presence of cAMP, ATP, or
FAD. Conditions: 1 µM triplex, 5 µm ligand, 10 mM phosphate buffer (pH=6.0), 1 mM NaCl,
at 260 nm and a heating rate of 1 °C/min.

- S13 -
Triplex 15:19 with or without cAMP, ATP, or FAD as ligands
Figure S20. UV melting curves of triplex 15:19 alone and in the presence of cAMP, ATP, or
FAD. Conditions: 1 µM triplex, 5 µm ligand, 10 mM phosphate buffer (pH=6.0), 1 mM NaCl,
at 260 nm and a heating rate of 1 °C/min.
Triplex 16:19 with or without cAMP, ATP, or FAD as ligands
Figure S21. UV melting curves of triplex 16:19 alone and in the presence of cAMP, ATP, or
FAD. Conditions: 1 µM triplex, 5 µm ligand, 10 mM phosphate buffer (pH=6.0), 1 mM
NaCl, at 260 nm and a heating rate of 1 °C/min.

- S14 -
Triplex 17:19 with or without cAMP, ATP, or FAD as ligands
Figure S22. UV melting curves of triplex 17:19 alone and in the presence of cAMP, ATP, or
FAD. Conditions: 1 µM triplex, 5 µm ligand, 10 mM phosphate buffer (pH=6.0), 1 mM NaCl,
at 260 nm and a heating rate of 1 °C/min.
Triplex 18:19 with or without cAMP, ATP, or FAD as ligands
Figure S23. UV melting curves of triplex 18:19 alone and in the presence of cAMP, ATP, or
FAD. Conditions: 1 µM triplex, 5 µm ligand, 10 mM phosphate buffer (pH=6.0), 1 mM NaCl,
at 260 nm and a heating rate of 1 °C/min.

- S15 -
5. Effect of Magnesium Ions and pH 7.0 on UV-Melting Points
Table S1. UV-Melting points (Tm's) of triplexe of 17 and 19 in the
presence or in the absence of cAMP at pH values of 6.0 or 7.0, with or
without MgCl2 in the buffer.a
Sequence
c(MgCl2)
[mM]
Melting Point [°C]
Entry No. pH = 6 pH = 7
1 17:19 0 40.6 33.1
2 17:19, cAMP 0 44.7 38.7
3 17:19 10 41.9 34.5
4 17:19, cAMP 10 46.0 40.0
a Conditions: 1 µM DNA, 5 µM cAMP, 10 mM phosphate buffer (pH = 6.0
or pH = 7.0), 1 M NaCl, heating rate 1 °C/min. Single UV transitions, most
probably encompassing the triplex-to-duplex and duplex-to-single-strand
transitions were observed.

- S16 -
6. Confirming Binding of cAMP by RP-HPLC
Binding of cAMP by the triplex of 17 and 19 was confirmed by RP-HPLC analysis of the
complex. For this, equilibrium filtration of an aqueous solution containing 17, 19, and cAMP
was performed, as described in the Experimental Part of the main Paper under Binding
Constants via Equilibrium Filtration. The complex retained by the filter was harvested. The
resulting solution was then injected into the HPLC instrument. Prior to this, a reference
solution of cAMP had been injected to establish its retention time and to serve as standard for
quantitation. The HPLC conditions (55°C and increasing acetonitrile content) are denaturing,
so each of the components of the ternary complex elutes separately. Figure S25 shows the
resulting chromatogram.
Figure S25. Confirming binding of cAMP by RP-HPLC (C4 column). a) Chromatogram of
the complex obtained by equilibrium filtration (3 kDa cut-off), as measured with elution at
55°C column temperature and a gradient of 0% acetonitrile for 5 min, followed by 0% to 10%
acetonitrile in 20 min, 10% to 20% acetonitrile in 25 min, 20% to 25% in 10 min, and 25% to
80% in 5 min. tR, cAMP = 21 min. b) Expansion of the region showing the cAMP peak. c)
The same region of a reference chromatogram of cAMP alone. Manual integration of the
peak for cAMP gave a dissociation constant (Kd) of approx. 0.1 µM, with an estimated error
of ±0.05 µM.


![in vitro with Oligonucleotide Therapeutics [Abstract]](https://img.pdfslide.net/doc/110x75/62740ef1dfd06522fd6f6a17/in-vitro-with-oligonucleotide-therapeutics-abstract.jpg)