Embed Size (px)
Citation preview
Supplementary Information
The locust genome provides insight into swarm formation and long-distance
flight
Xianhui Wang1, Xiaodong Fang
2, Pengcheng Yang
1,3, Xuanting Jiang
2, Feng
Jiang1,3
, Dejian Zhao1, Bolei Li
1, Feng Cui
1, Jianing Wei
1, Chuan Ma
1,3, Yundan
Wang1,3
, Jing He1, Yuan Luo
1, Zhifeng Wang
1, Xiaojiao Guo
1, Wei Guo
1, Xuesong
Wang1,3
, Yi Zhang1, Meiling Yang
1, Shuguang Hao
1, Bing Chen
1, Zongyuan Ma
1,3,
Dan Yu1, Zhiqiang Xiong
2, Yabing Zhu
2, Dingding Fan
2, Lijuan Han
2, Bo Wang
2,
Yuanxin Chen2, Junwen Wang
2, Lan Yang
2, Wei Zhao
2, Yue Feng
2, Guanxing Chen
2,
Jinmin Lian2, Qiye Li
2, Zhiyong Huang
2, Xiaoming Yao
2, Na Lv
4, Guojie Zhang
2,
Yingrui Li2, Jian Wang
2, Jun Wang
2, Baoli Zhu
4, Le Kang
1,3#
1 State Key Laboratory of Integrated Management of Pest Insects and Rodents,
Institute of Zoology, Chinese Academy of Sciences, 1 Beichen West Road, Chaoyang
District, Beijing 100101, China
2 BGI-Shenzhen, Beishan Industrial Zone, Yantian District, Shenzhen 518083,
China
3 Beijing Institutes of Life Science, Chinese Academy of Sciences, 1 Beichen West
Road, Chaoyang District, Beijing 100101, China
4 CAS Key Laboratory of Pathogenic Microbiology and Immunology, Institute of
Microbiology, Chinese Academy of Sciences, 1 Beichen West Road, Chaoyang
District, Beijing 100101, China
#Send correspondence to:
Dr. Le Kang,

Institute of Zoology, Chinese Academy of Sciences, Beijing 100101, China
Tel: 86-10-64807219; Fax: 86-10-84379559; E-mail: [email protected]
Supplementary Figures
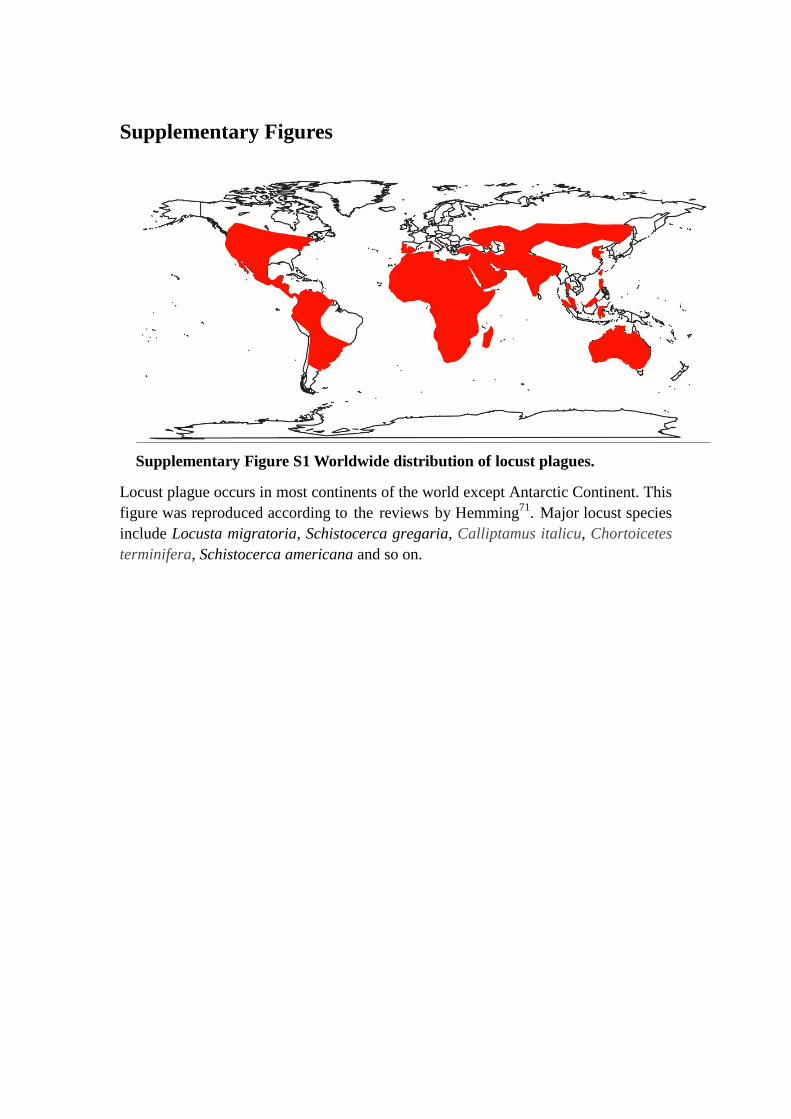
Supplementary Figure S1 Worldwide distribution of locust plagues.
Locust plague occurs in most continents of the world except Antarctic Continent. This
figure was reproduced according to the reviews by Hemming71
. Major locust species
include Locusta migratoria, Schistocerca gregaria, Calliptamus italicu, Chortoicetes
terminifera, Schistocerca americana and so on.
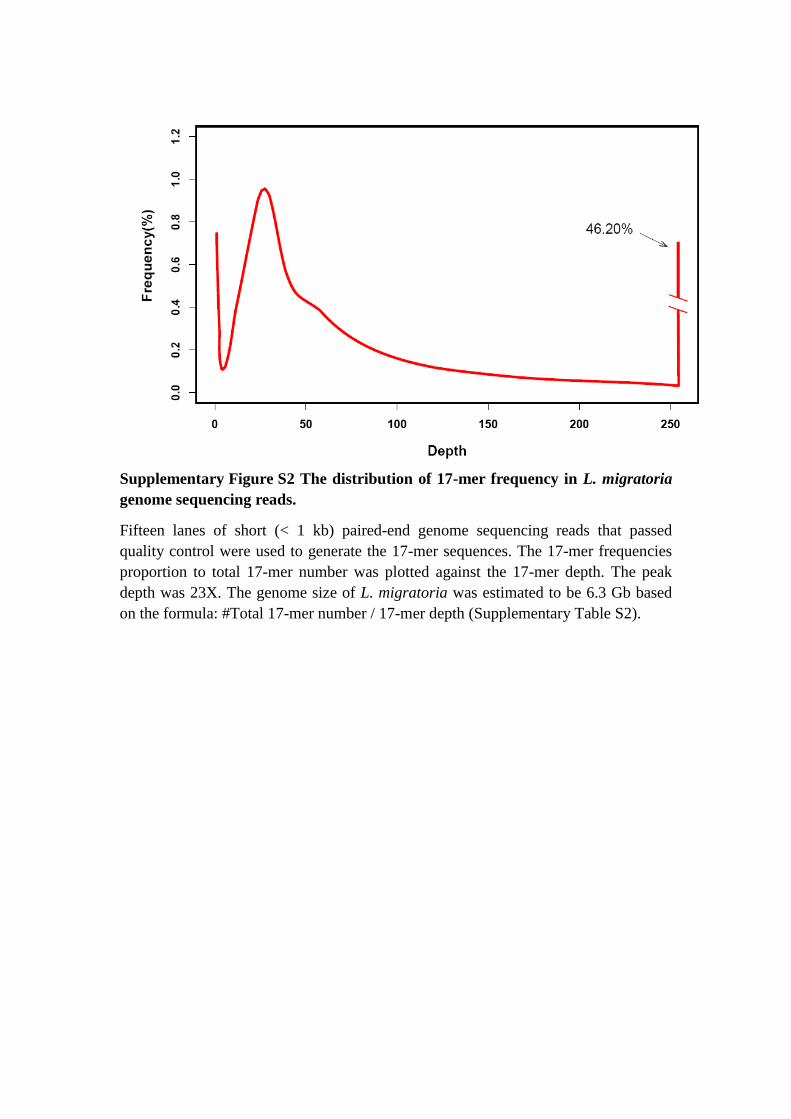
Supplementary Figure S2 The distribution of 17-mer frequency in L. migratoria
genome sequencing reads.
Fifteen lanes of short (< 1 kb) paired-end genome sequencing reads that passed
quality control were used to generate the 17-mer sequences. The 17-mer frequencies
proportion to total 17-mer number was plotted against the 17-mer depth. The peak
depth was 23X. The genome size of L. migratoria was estimated to be 6.3 Gb based
on the formula: #Total 17-mer number / 17-mer depth (Supplementary Table S2).
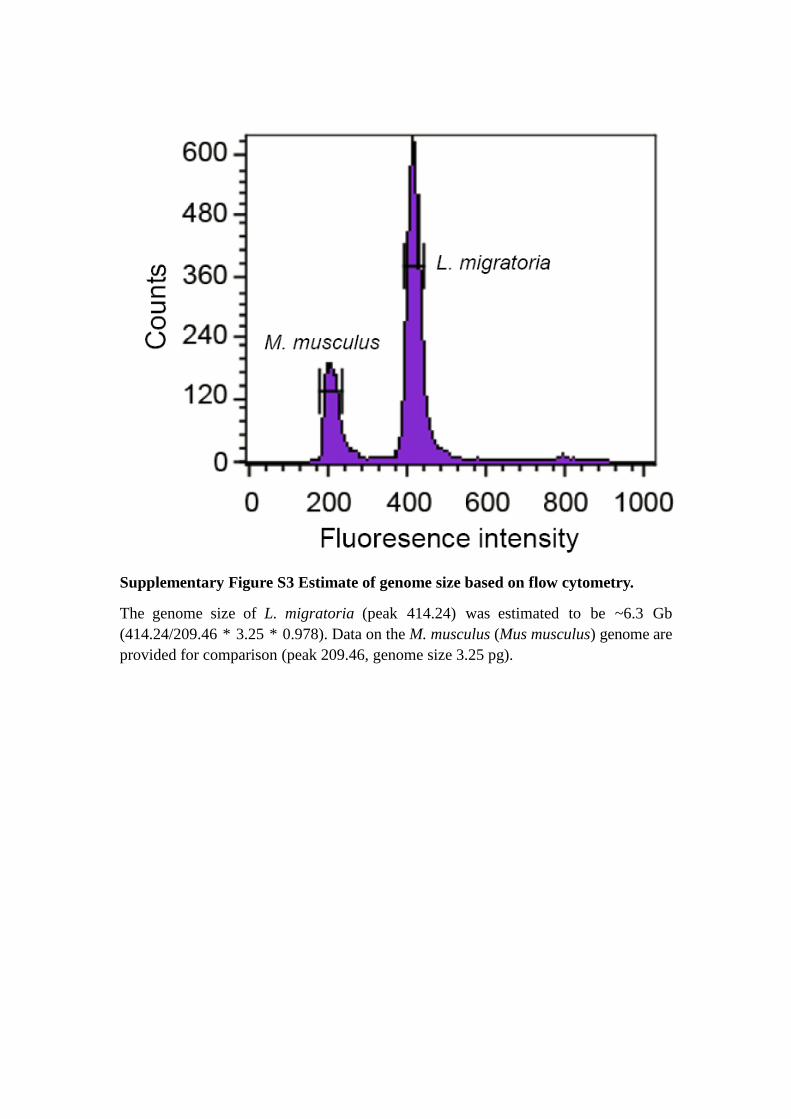
Supplementary Figure S3 Estimate of genome size based on flow cytometry.
The genome size of L. migratoria (peak 414.24) was estimated to be ~6.3 Gb
(414.24/209.46 * 3.25 * 0.978). Data on the M. musculus (Mus musculus) genome are
provided for comparison (peak 209.46, genome size 3.25 pg).
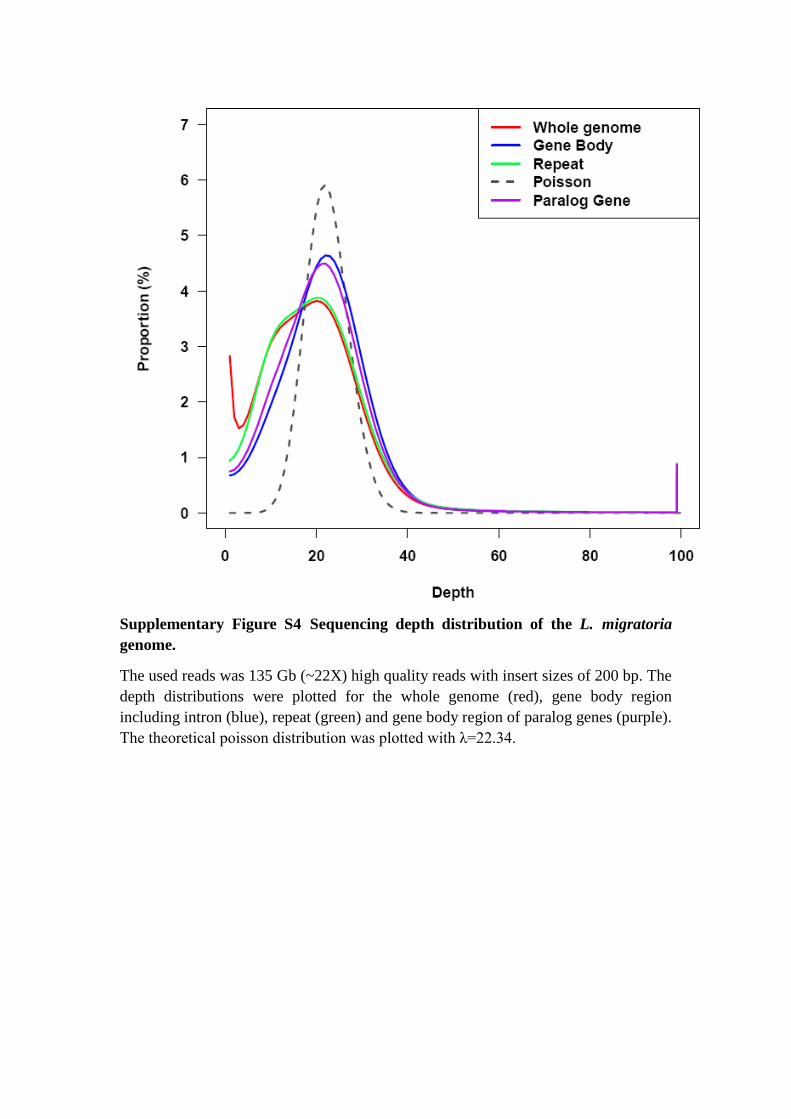
Supplementary Figure S4 Sequencing depth distribution of the L. migratoria
genome.
The used reads was 135 Gb (~22X) high quality reads with insert sizes of 200 bp. The
depth distributions were plotted for the whole genome (red), gene body region
including intron (blue), repeat (green) and gene body region of paralog genes (purple).
The theoretical poisson distribution was plotted with λ=22.34.
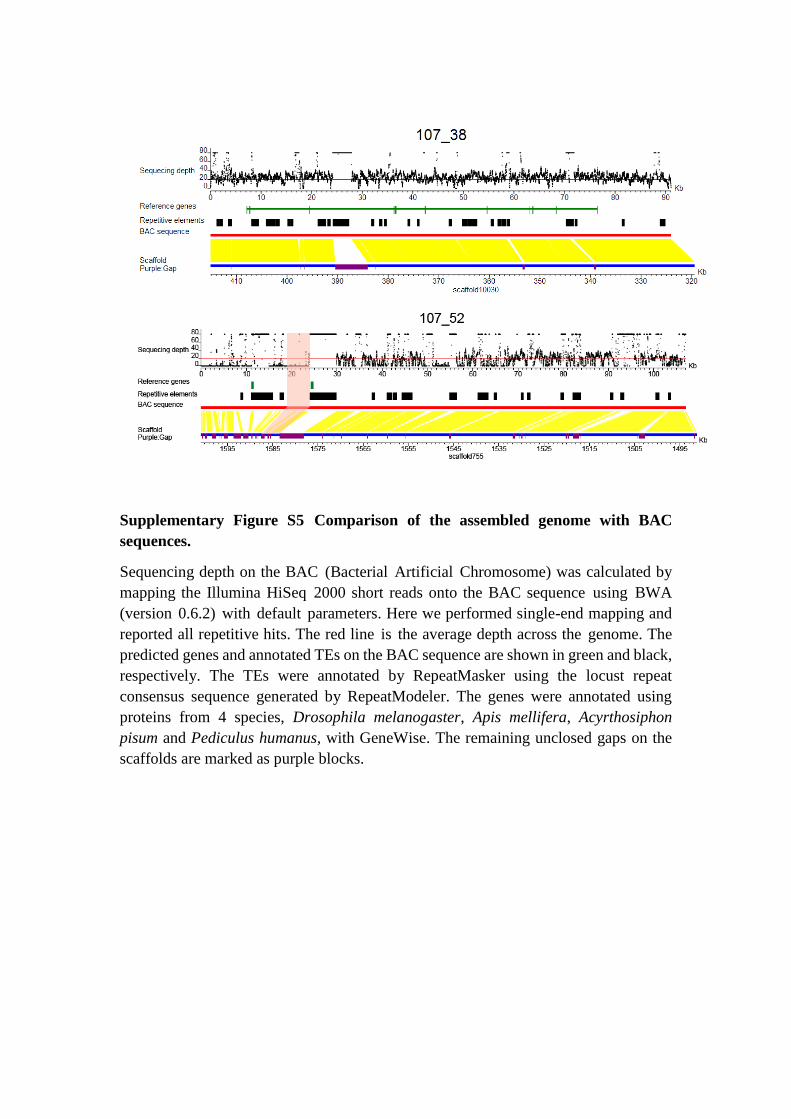
Supplementary Figure S5 Comparison of the assembled genome with BAC
sequences.
Sequencing depth on the BAC (Bacterial Artificial Chromosome) was calculated by
mapping the Illumina HiSeq 2000 short reads onto the BAC sequence using BWA
(version 0.6.2) with default parameters. Here we performed single-end mapping and
reported all repetitive hits. The red line is the average depth across the genome. The
predicted genes and annotated TEs on the BAC sequence are shown in green and black,
respectively. The TEs were annotated by RepeatMasker using the locust repeat
consensus sequence generated by RepeatModeler. The genes were annotated using
proteins from 4 species, Drosophila melanogaster, Apis mellifera, Acyrthosiphon
pisum and Pediculus humanus, with GeneWise. The remaining unclosed gaps on the
scaffolds are marked as purple blocks.
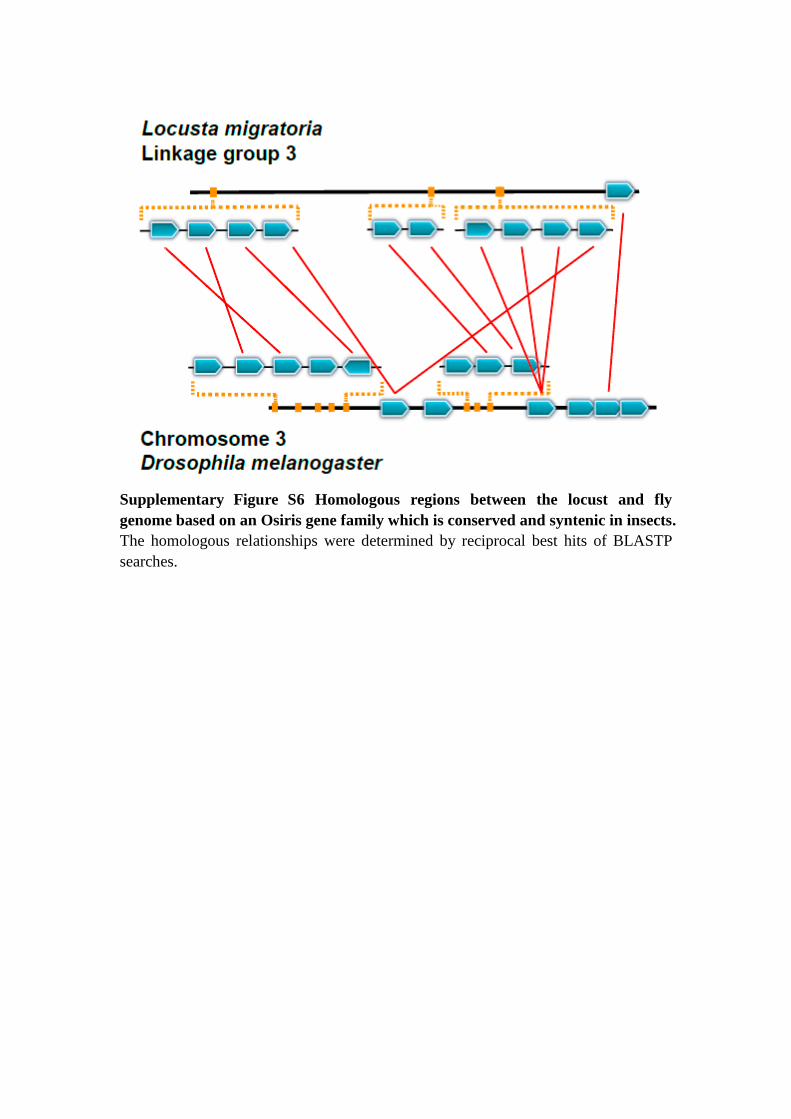
Supplementary Figure S6 Homologous regions between the locust and fly
genome based on an Osiris gene family which is conserved and syntenic in insects.
The homologous relationships were determined by reciprocal best hits of BLASTP
searches.
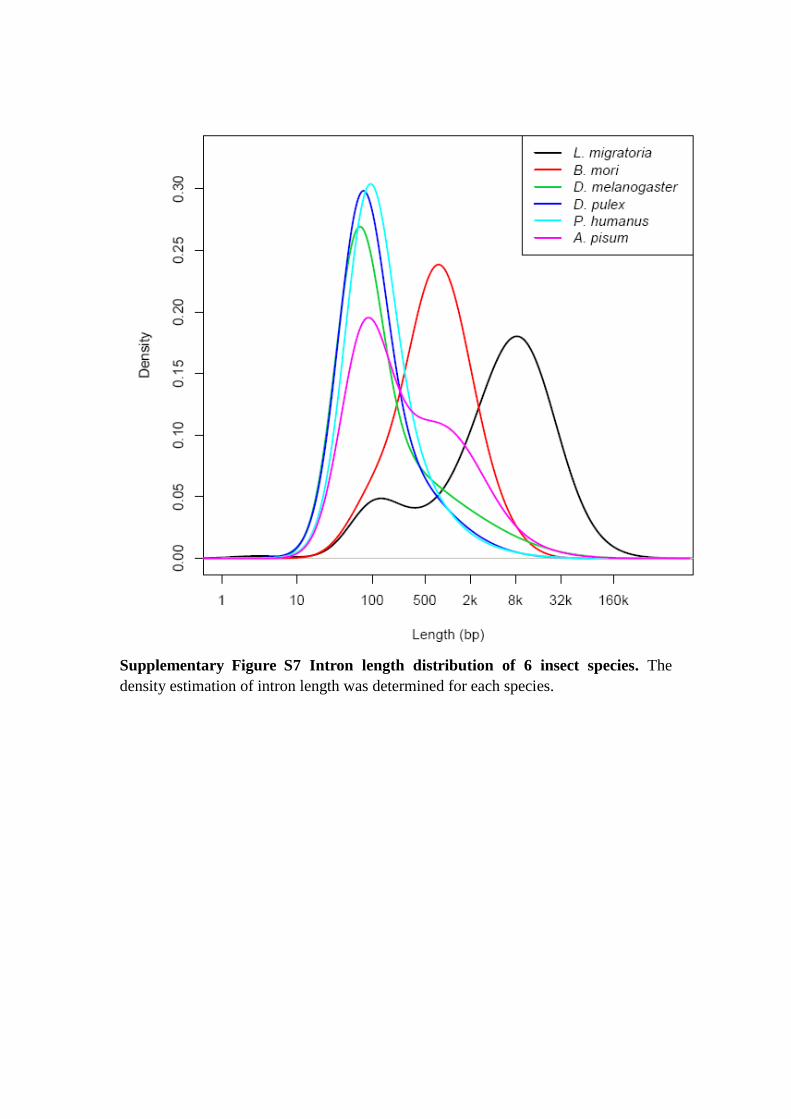
Supplementary Figure S7 Intron length distribution of 6 insect species. The
density estimation of intron length was determined for each species.

Supplementary Figure S8 Comparison of intron size expansion across insects.
Pairwise comparisons between L. migratoria and other insects were visualized using
the log expansion/contraction ratios of introns in the 1,046 conserved homologous
genes.
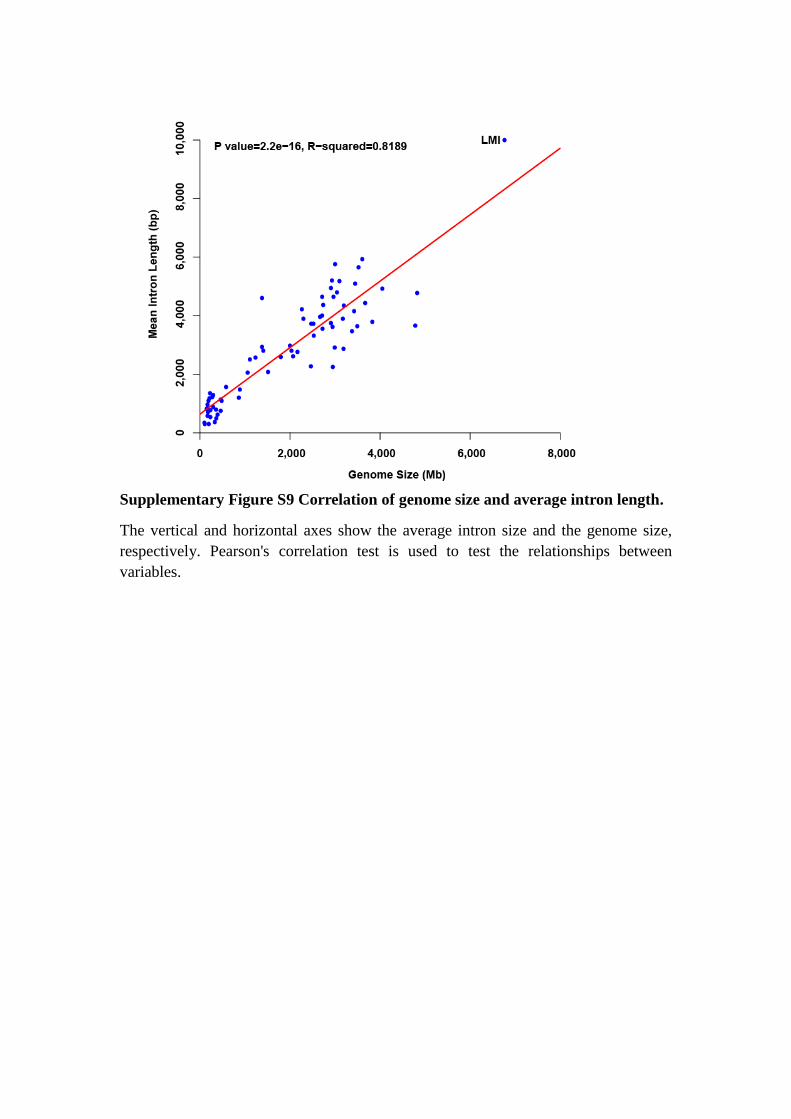
Supplementary Figure S9 Correlation of genome size and average intron length.
The vertical and horizontal axes show the average intron size and the genome size,
respectively. Pearson's correlation test is used to test the relationships between
variables.
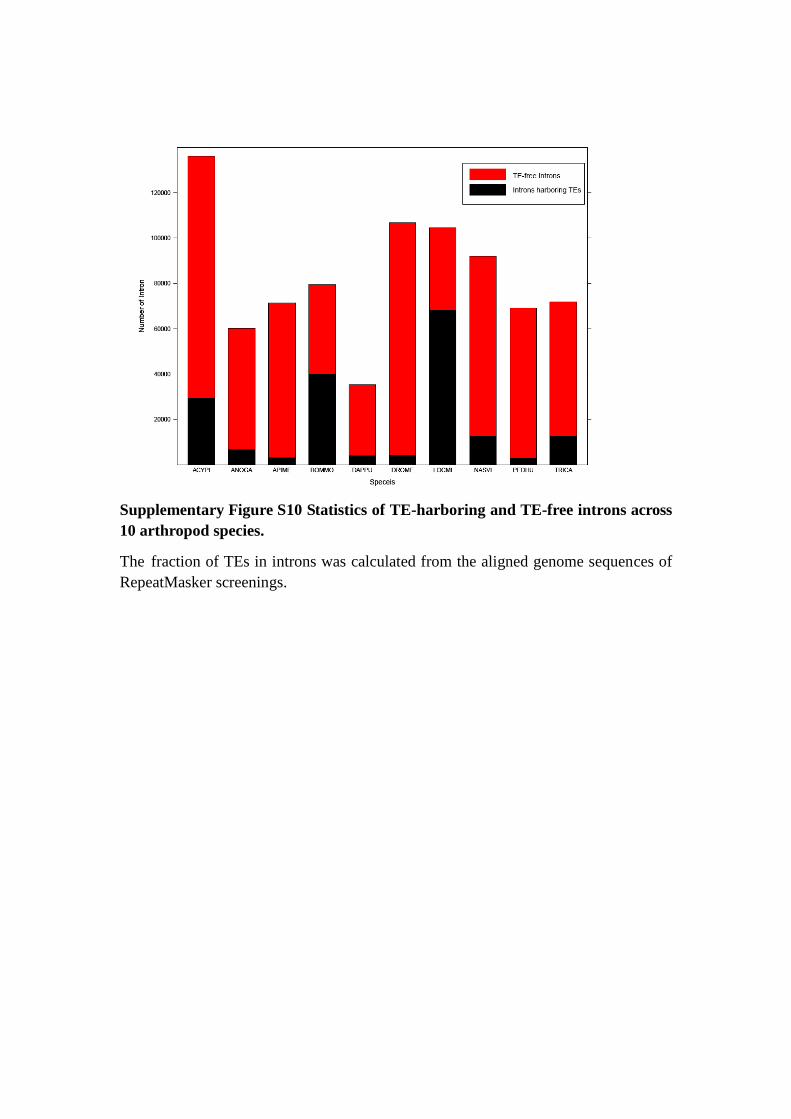
Supplementary Figure S10 Statistics of TE-harboring and TE-free introns across
10 arthropod species.
The fraction of TEs in introns was calculated from the aligned genome sequences of
RepeatMasker screenings.
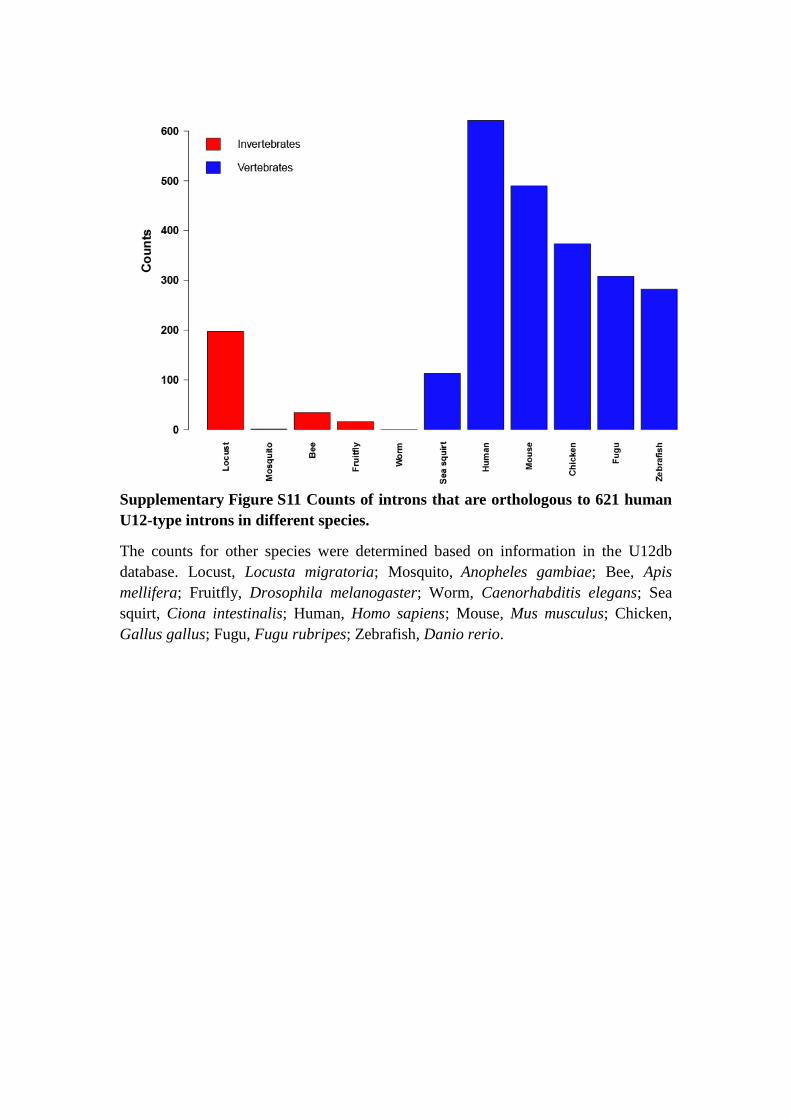
Supplementary Figure S11 Counts of introns that are orthologous to 621 human
U12-type introns in different species.
The counts for other species were determined based on information in the U12db
database. Locust, Locusta migratoria; Mosquito, Anopheles gambiae; Bee, Apis
mellifera; Fruitfly, Drosophila melanogaster; Worm, Caenorhabditis elegans; Sea
squirt, Ciona intestinalis; Human, Homo sapiens; Mouse, Mus musculus; Chicken,
Gallus gallus; Fugu, Fugu rubripes; Zebrafish, Danio rerio.
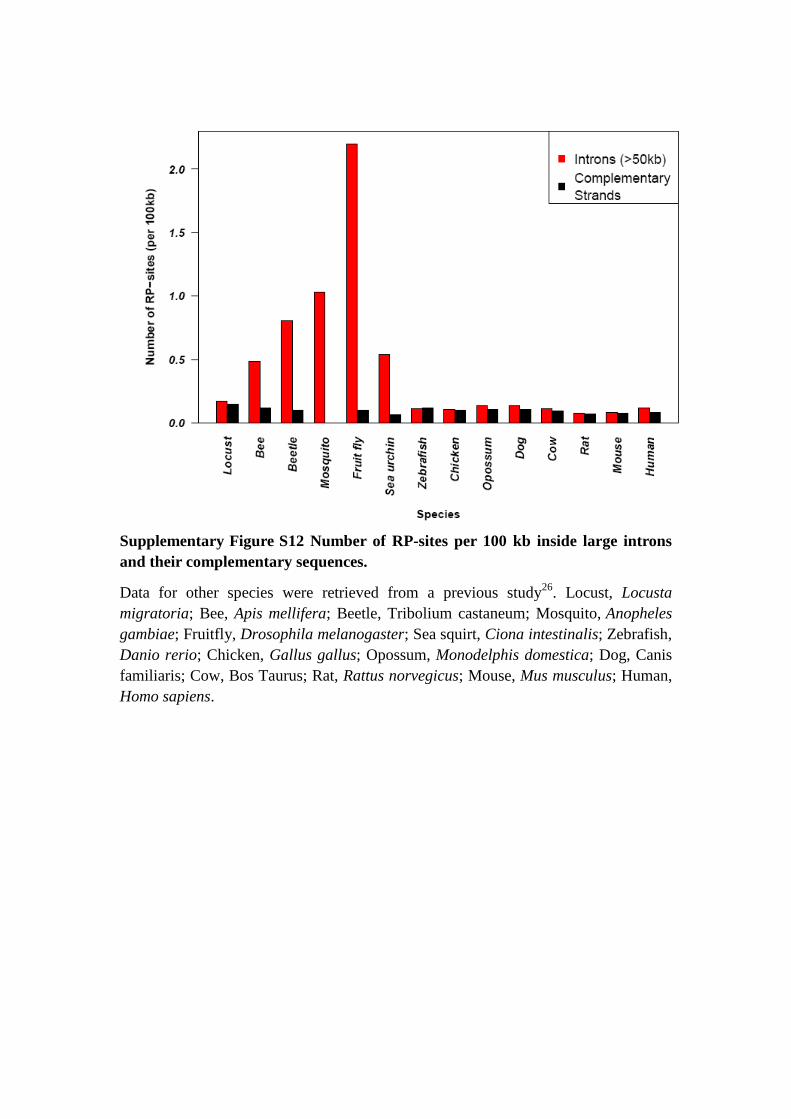
Supplementary Figure S12 Number of RP-sites per 100 kb inside large introns
and their complementary sequences.
Data for other species were retrieved from a previous study26
. Locust, Locusta
migratoria; Bee, Apis mellifera; Beetle, Tribolium castaneum; Mosquito, Anopheles
gambiae; Fruitfly, Drosophila melanogaster; Sea squirt, Ciona intestinalis; Zebrafish,
Danio rerio; Chicken, Gallus gallus; Opossum, Monodelphis domestica; Dog, Canis
familiaris; Cow, Bos Taurus; Rat, Rattus norvegicus; Mouse, Mus musculus; Human,
Homo sapiens.
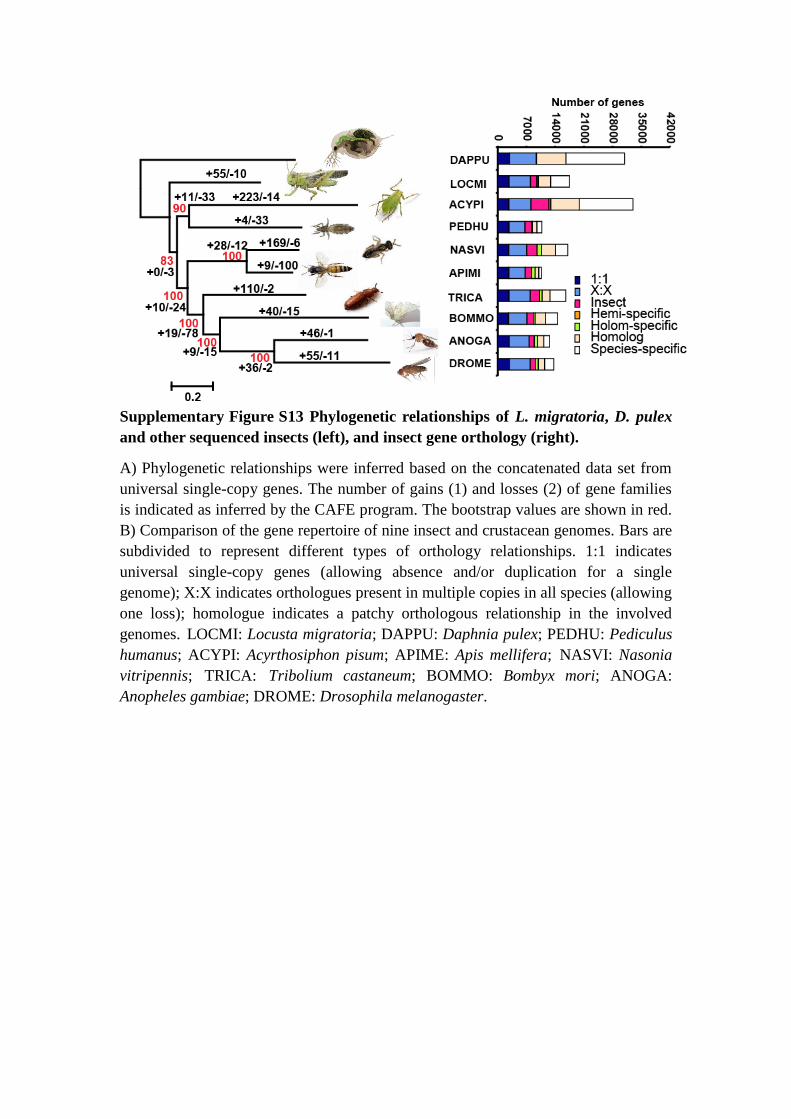
Supplementary Figure S13 Phylogenetic relationships of L. migratoria, D. pulex
and other sequenced insects (left), and insect gene orthology (right).
A) Phylogenetic relationships were inferred based on the concatenated data set from
universal single-copy genes. The number of gains (1) and losses (2) of gene families
is indicated as inferred by the CAFE program. The bootstrap values are shown in red.
B) Comparison of the gene repertoire of nine insect and crustacean genomes. Bars are
subdivided to represent different types of orthology relationships. 1:1 indicates
universal single-copy genes (allowing absence and/or duplication for a single
genome); X:X indicates orthologues present in multiple copies in all species (allowing
one loss); homologue indicates a patchy orthologous relationship in the involved
genomes. LOCMI: Locusta migratoria; DAPPU: Daphnia pulex; PEDHU: Pediculus
humanus; ACYPI: Acyrthosiphon pisum; APIME: Apis mellifera; NASVI: Nasonia
vitripennis; TRICA: Tribolium castaneum; BOMMO: Bombyx mori; ANOGA:
Anopheles gambiae; DROME: Drosophila melanogaster.
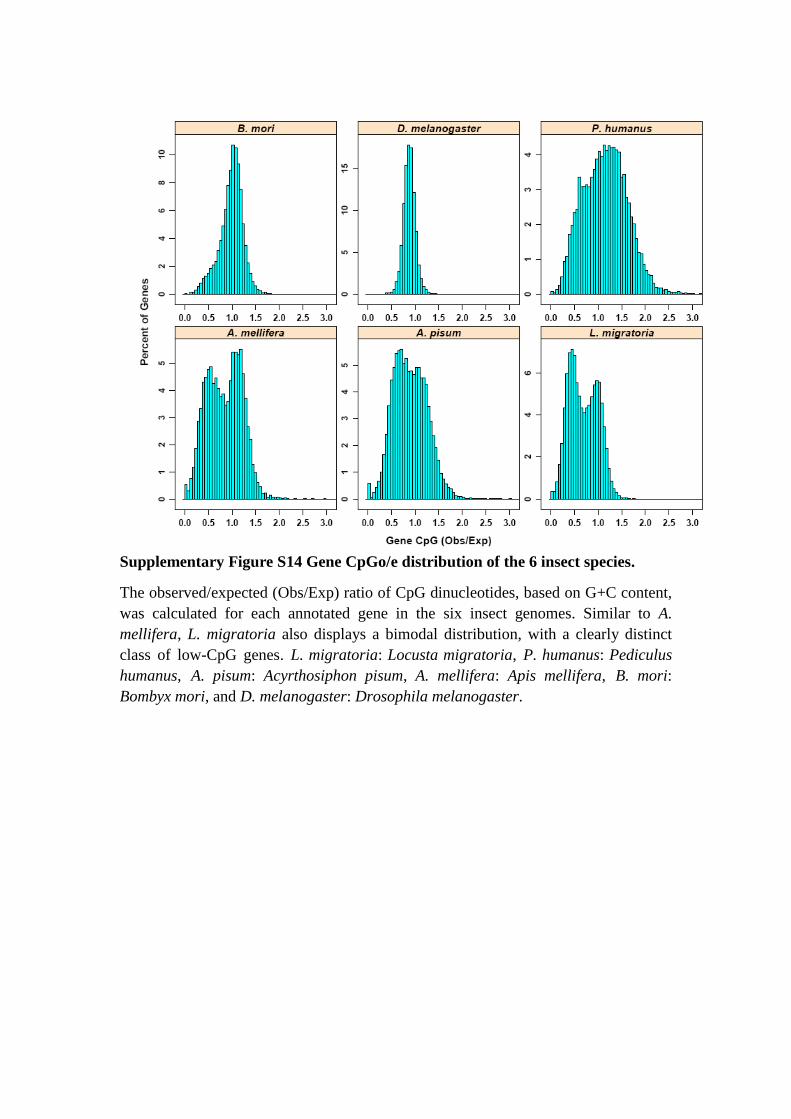
Supplementary Figure S14 Gene CpGo/e distribution of the 6 insect species.
The observed/expected (Obs/Exp) ratio of CpG dinucleotides, based on G+C content,
was calculated for each annotated gene in the six insect genomes. Similar to A.
mellifera, L. migratoria also displays a bimodal distribution, with a clearly distinct
class of low-CpG genes. L. migratoria: Locusta migratoria, P. humanus: Pediculus
humanus, A. pisum: Acyrthosiphon pisum, A. mellifera: Apis mellifera, B. mori:
Bombyx mori, and D. melanogaster: Drosophila melanogaster.
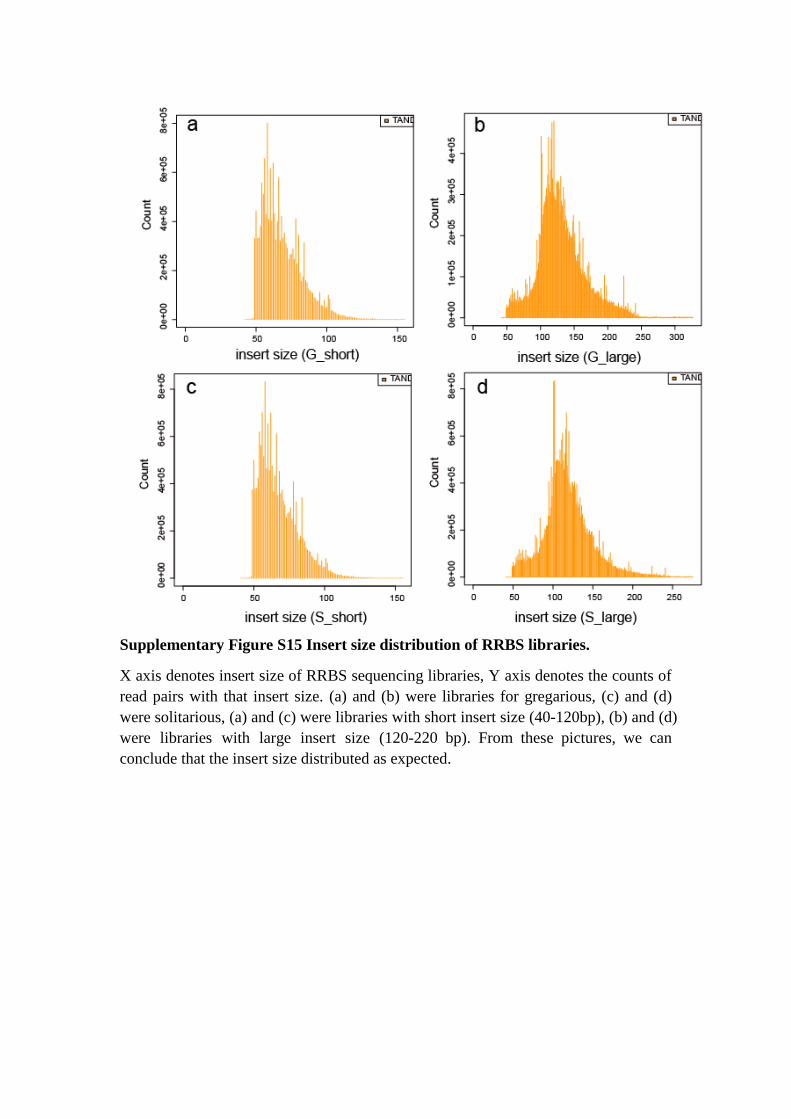
Supplementary Figure S15 Insert size distribution of RRBS libraries.
X axis denotes insert size of RRBS sequencing libraries, Y axis denotes the counts of
read pairs with that insert size. (a) and (b) were libraries for gregarious, (c) and (d)
were solitarious, (a) and (c) were libraries with short insert size (40-120bp), (b) and (d)
were libraries with large insert size (120-220 bp). From these pictures, we can
conclude that the insert size distributed as expected.
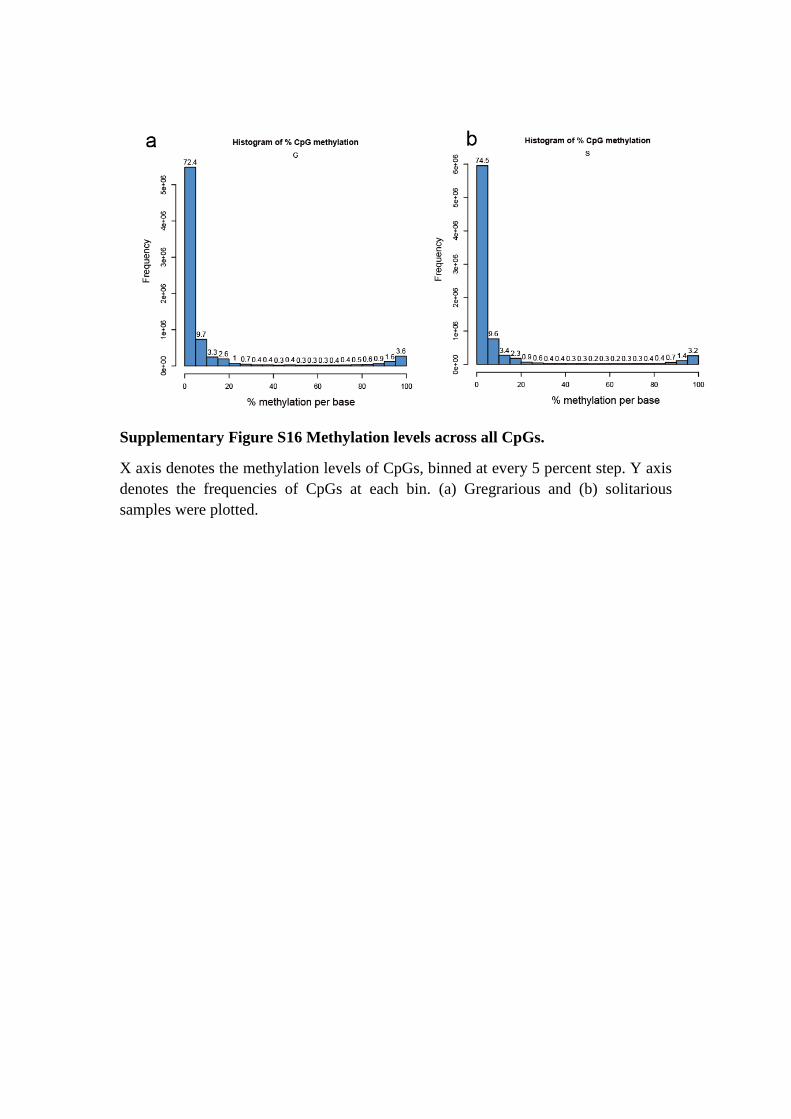
Supplementary Figure S16 Methylation levels across all CpGs.
X axis denotes the methylation levels of CpGs, binned at every 5 percent step. Y axis
denotes the frequencies of CpGs at each bin. (a) Gregrarious and (b) solitarious
samples were plotted.
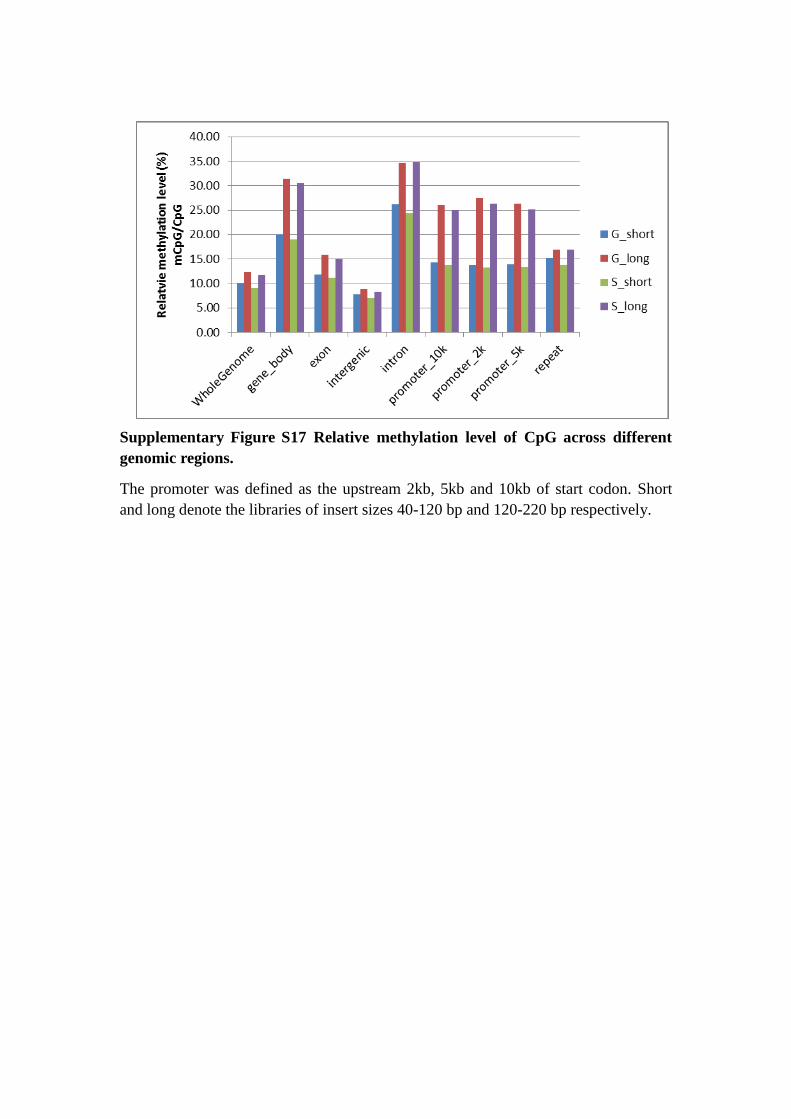
Supplementary Figure S17 Relative methylation level of CpG across different
genomic regions.
The promoter was defined as the upstream 2kb, 5kb and 10kb of start codon. Short
and long denote the libraries of insert sizes 40-120 bp and 120-220 bp respectively.
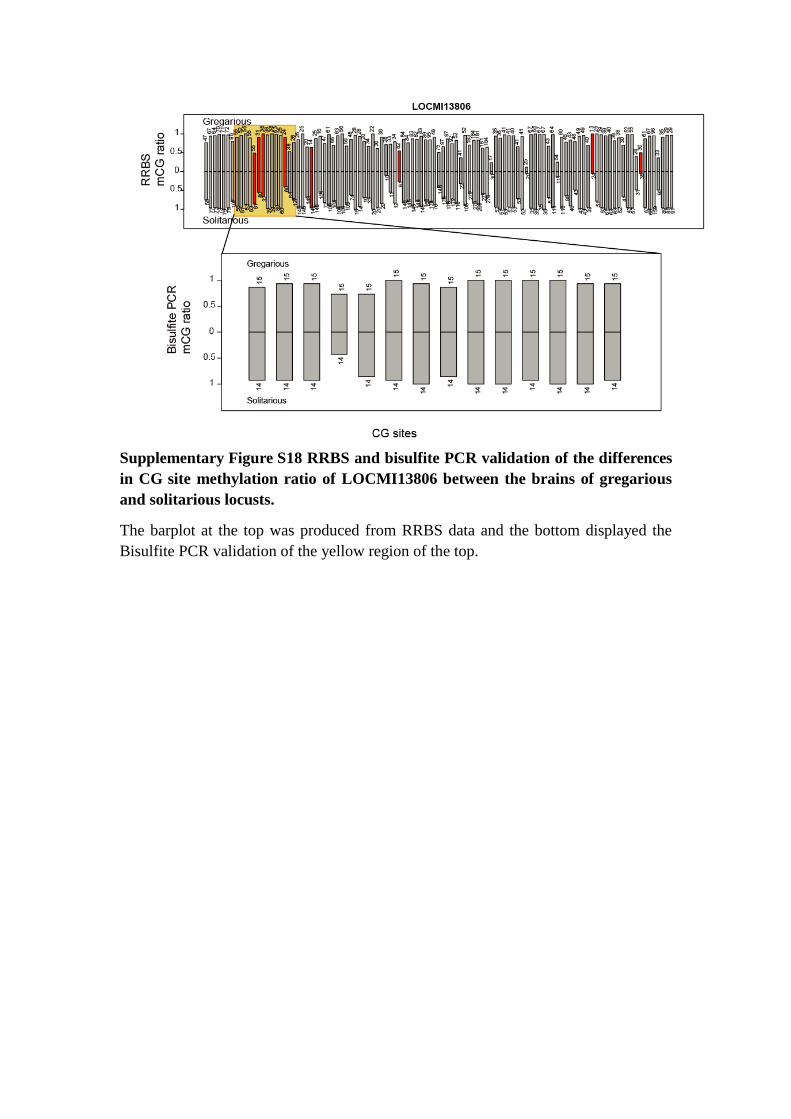
Supplementary Figure S18 RRBS and bisulfite PCR validation of the differences
in CG site methylation ratio of LOCMI13806 between the brains of gregarious
and solitarious locusts.
The barplot at the top was produced from RRBS data and the bottom displayed the
Bisulfite PCR validation of the yellow region of the top.
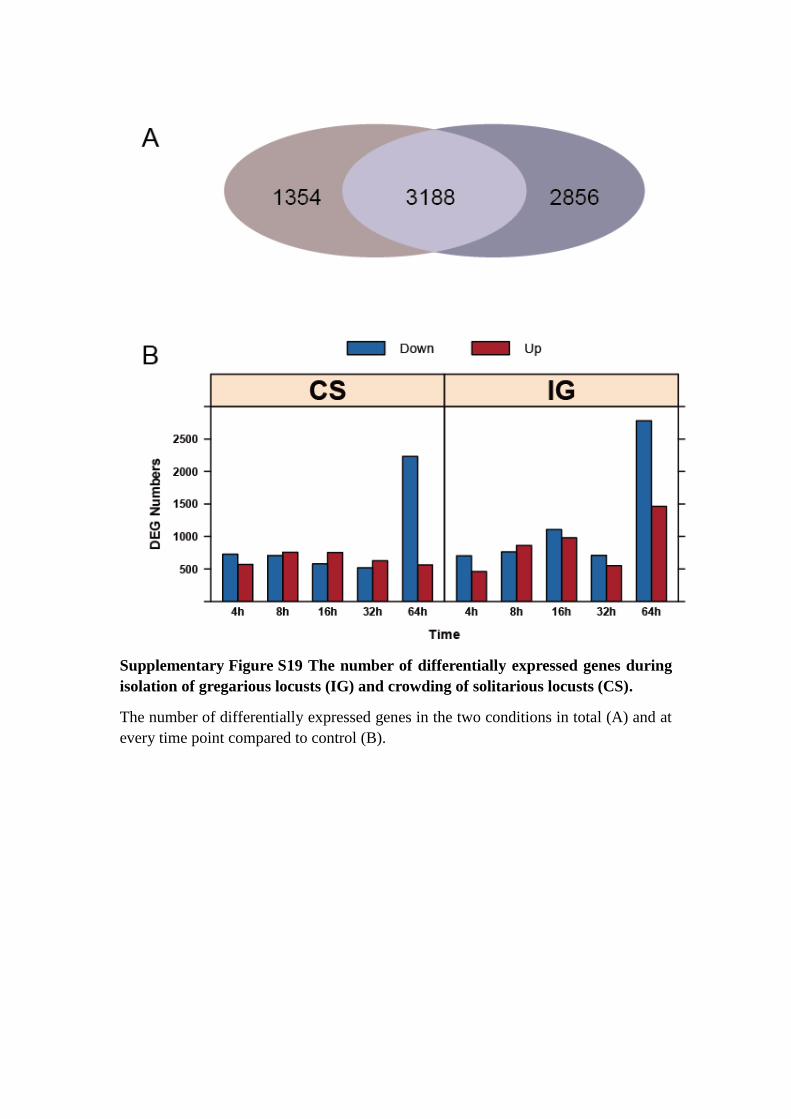
Supplementary Figure S19 The number of differentially expressed genes during
isolation of gregarious locusts (IG) and crowding of solitarious locusts (CS).
The number of differentially expressed genes in the two conditions in total (A) and at
every time point compared to control (B).
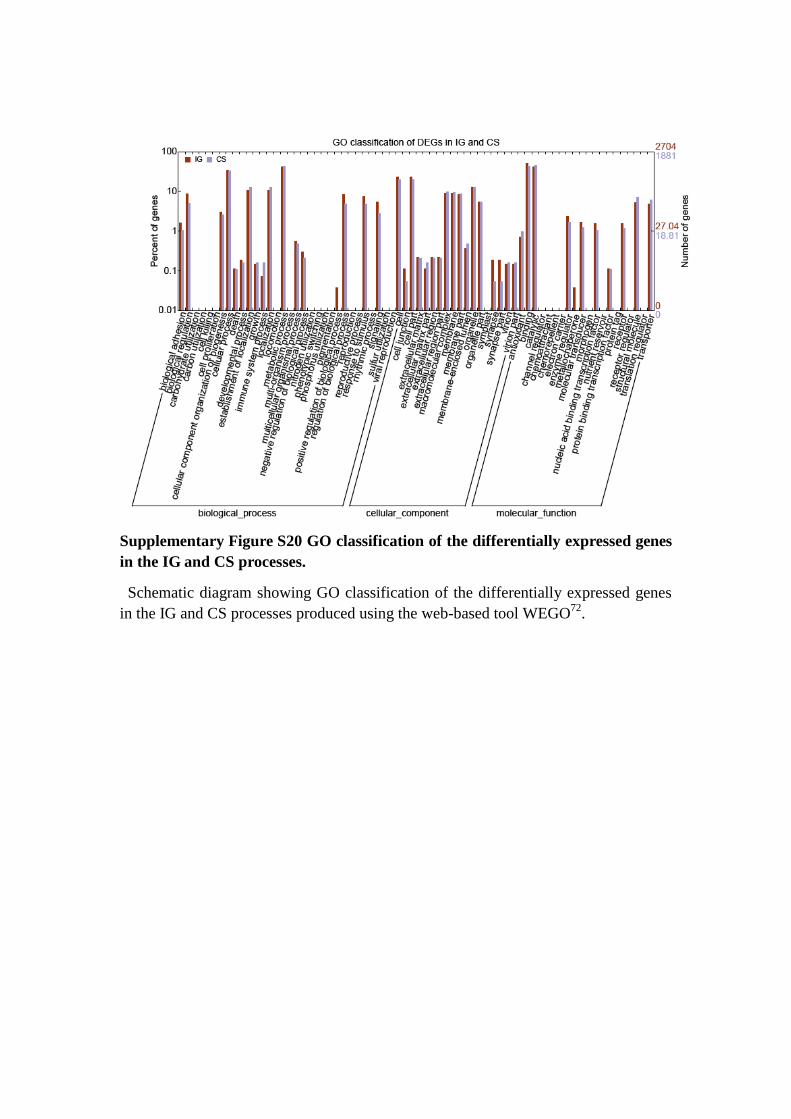
Supplementary Figure S20 GO classification of the differentially expressed genes
in the IG and CS processes.
Schematic diagram showing GO classification of the differentially expressed genes
in the IG and CS processes produced using the web-based tool WEGO72
.
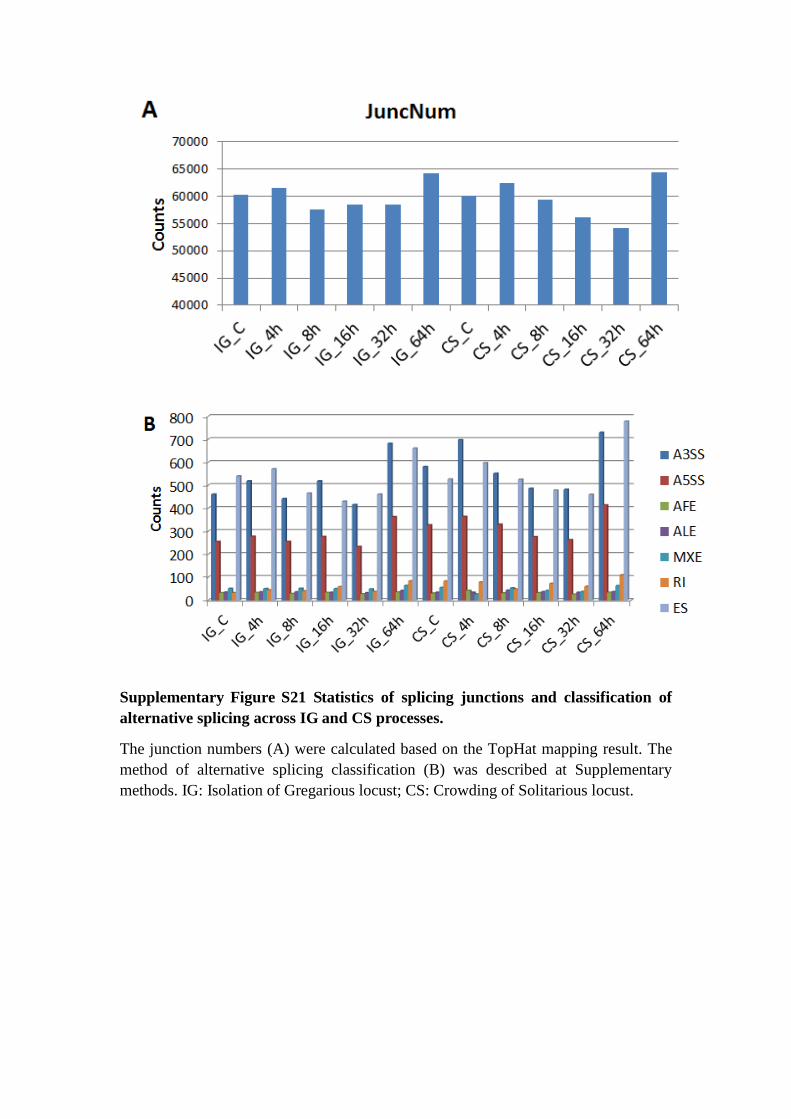
Supplementary Figure S21 Statistics of splicing junctions and classification of
alternative splicing across IG and CS processes.
The junction numbers (A) were calculated based on the TopHat mapping result. The
method of alternative splicing classification (B) was described at Supplementary
methods. IG: Isolation of Gregarious locust; CS: Crowding of Solitarious locust.
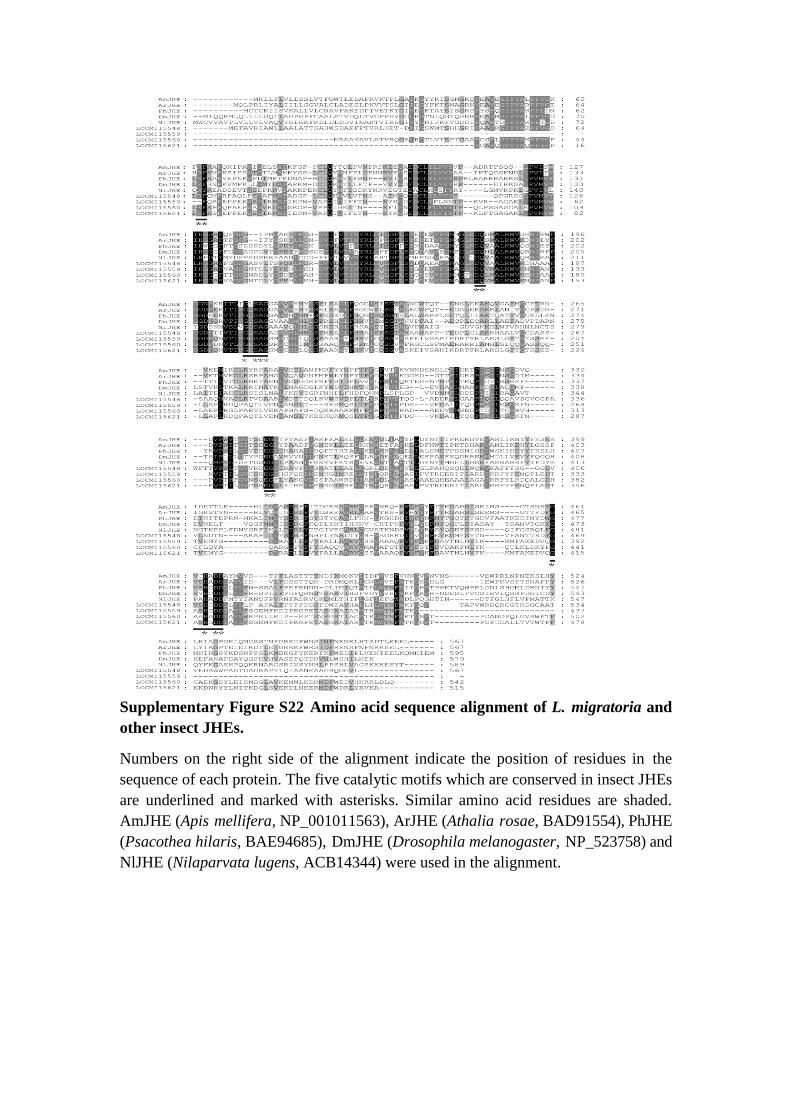
Supplementary Figure S22 Amino acid sequence alignment of L. migratoria and
other insect JHEs.
Numbers on the right side of the alignment indicate the position of residues in the
sequence of each protein. The five catalytic motifs which are conserved in insect JHEs
are underlined and marked with asterisks. Similar amino acid residues are shaded.
AmJHE (Apis mellifera, NP_001011563), ArJHE (Athalia rosae, BAD91554), PhJHE
(Psacothea hilaris, BAE94685), DmJHE (Drosophila melanogaster, NP_523758) and
NlJHE (Nilaparvata lugens, ACB14344) were used in the alignment.
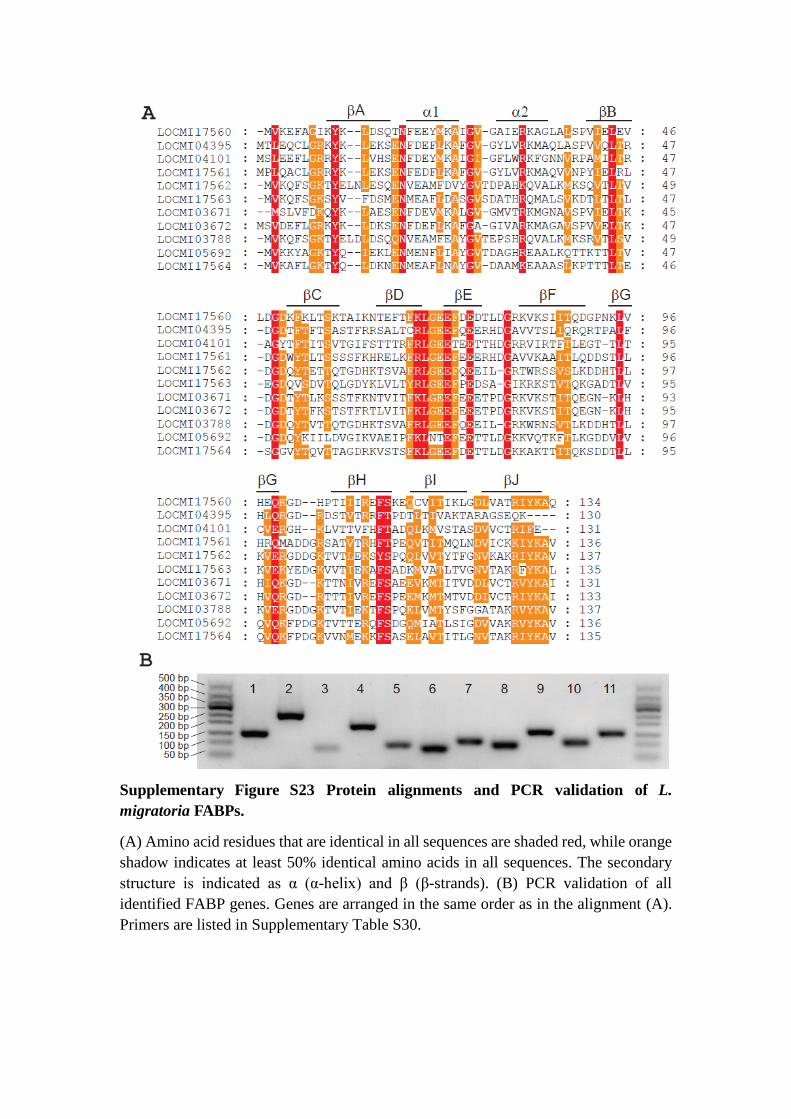
Supplementary Figure S23 Protein alignments and PCR validation of L.
migratoria FABPs.
(A) Amino acid residues that are identical in all sequences are shaded red, while orange
shadow indicates at least 50% identical amino acids in all sequences. The secondary
structure is indicated as α (α-helix) and β (β-strands). (B) PCR validation of all
identified FABP genes. Genes are arranged in the same order as in the alignment (A).
Primers are listed in Supplementary Table S30.
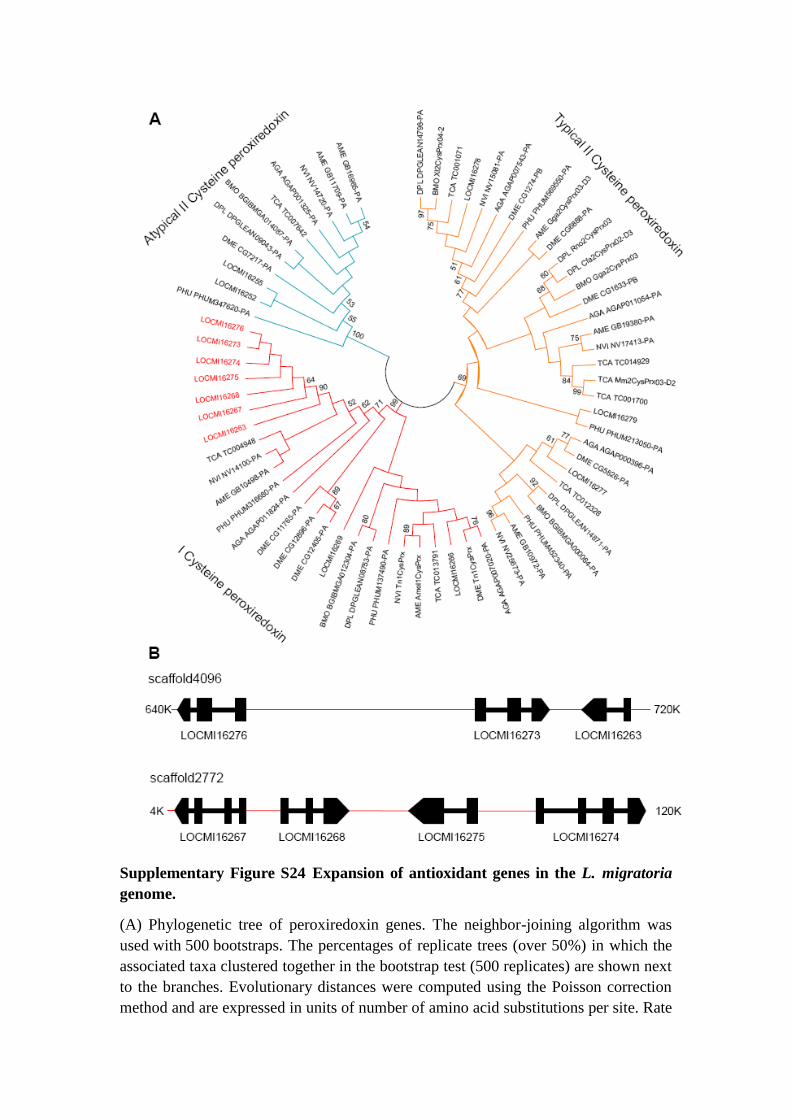
Supplementary Figure S24 Expansion of antioxidant genes in the L. migratoria
genome.
(A) Phylogenetic tree of peroxiredoxin genes. The neighbor-joining algorithm was
used with 500 bootstraps. The percentages of replicate trees (over 50%) in which the
associated taxa clustered together in the bootstrap test (500 replicates) are shown next
to the branches. Evolutionary distances were computed using the Poisson correction
method and are expressed in units of number of amino acid substitutions per site. Rate

variation among sites was modeled with gamma distribution (shape parameter = 1).
(B) Organization of the expanded I cysteine peroxiredoxin (Prdx6) genes in the L.
migratoria genome.
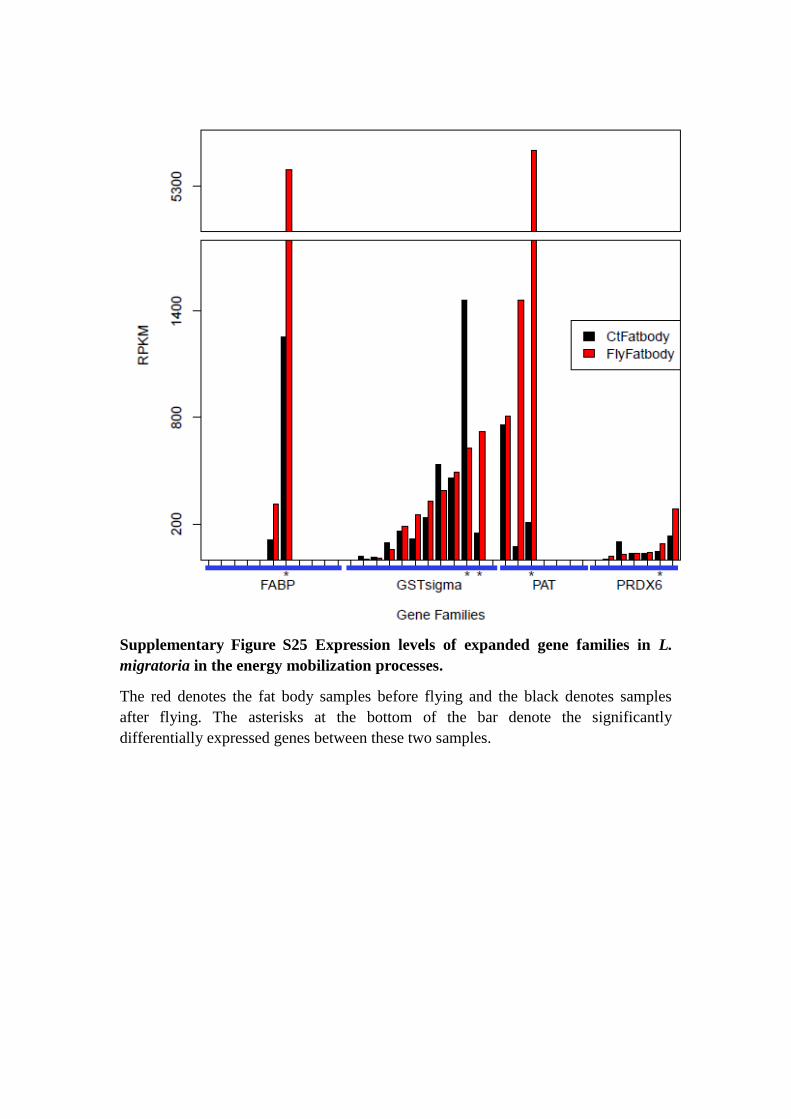
Supplementary Figure S25 Expression levels of expanded gene families in L.
migratoria in the energy mobilization processes.
The red denotes the fat body samples before flying and the black denotes samples
after flying. The asterisks at the bottom of the bar denote the significantly
differentially expressed genes between these two samples.
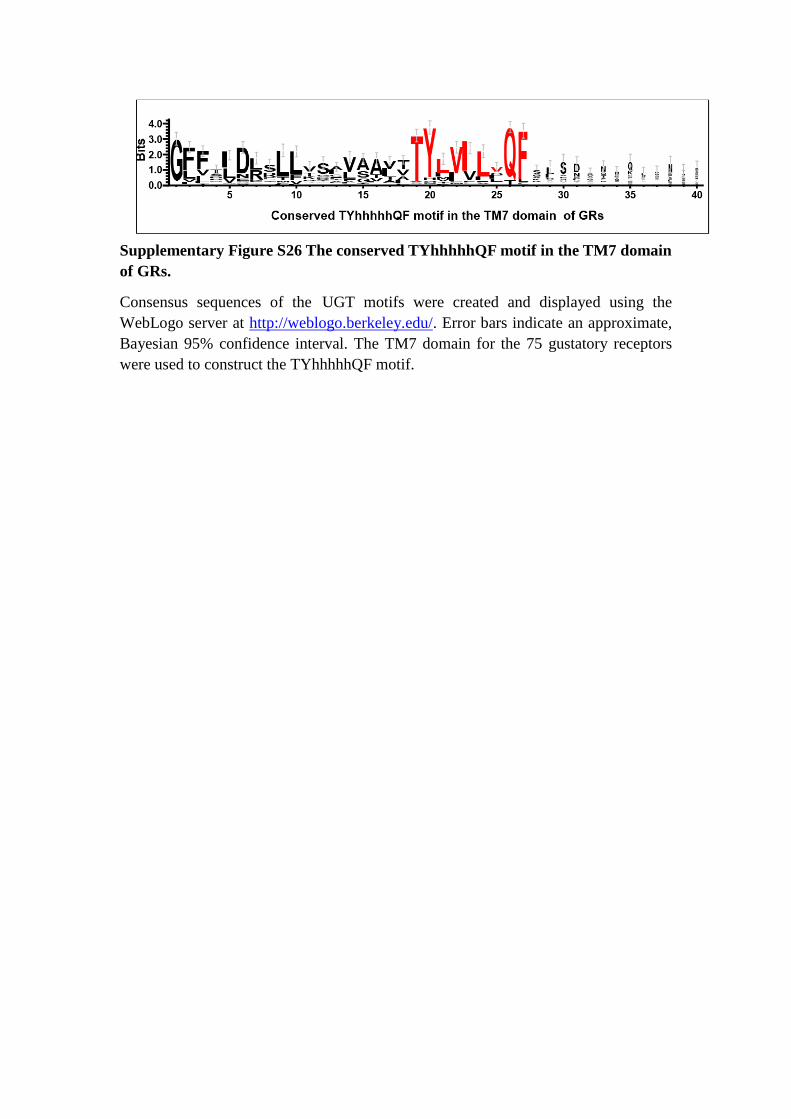
Supplementary Figure S26 The conserved TYhhhhhQF motif in the TM7 domain
of GRs.
Consensus sequences of the UGT motifs were created and displayed using the
WebLogo server at http://weblogo.berkeley.edu/. Error bars indicate an approximate,
Bayesian 95% confidence interval. The TM7 domain for the 75 gustatory receptors
were used to construct the TYhhhhhQF motif.
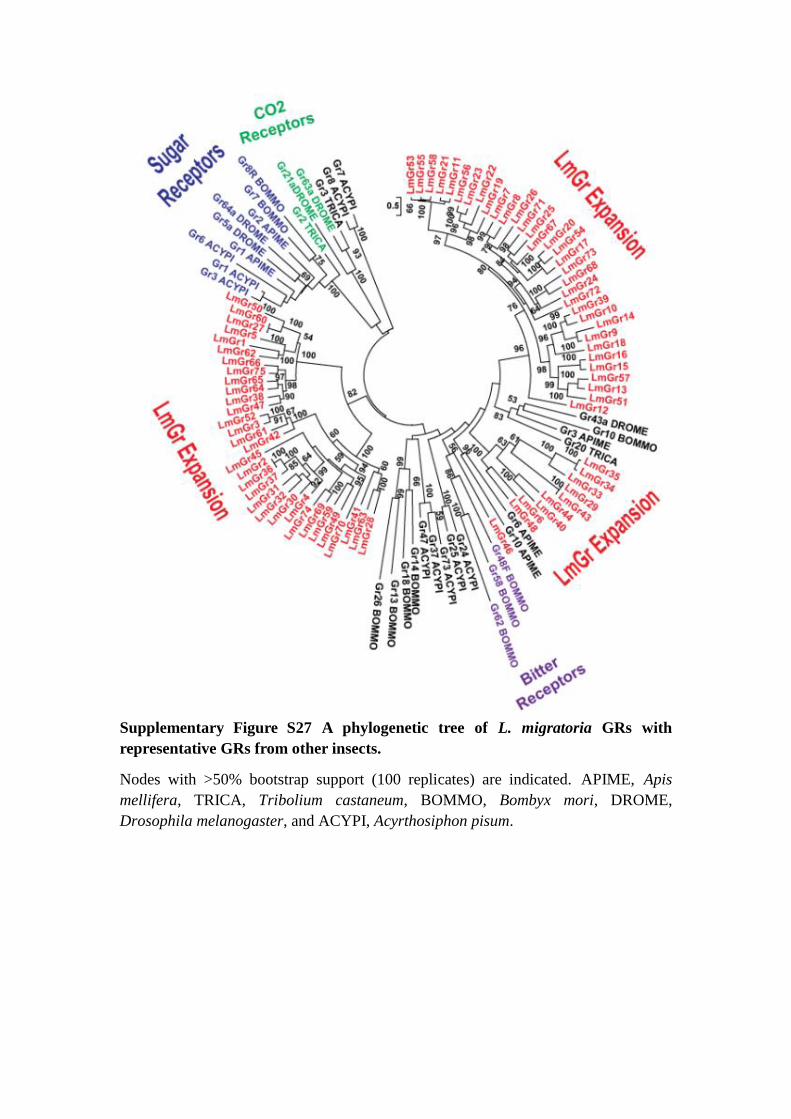
Supplementary Figure S27 A phylogenetic tree of L. migratoria GRs with
representative GRs from other insects.
Nodes with >50% bootstrap support (100 replicates) are indicated. APIME, Apis
mellifera, TRICA, Tribolium castaneum, BOMMO, Bombyx mori, DROME,
Drosophila melanogaster, and ACYPI, Acyrthosiphon pisum.

Supplementary Figure S28 WebLogos representing the signature motif of L.
migratoria UGT genes.
UGT genes include a conserved C-terminal region that contain the UGT signature
motif
[FVA]-[LIVMF]-[TS]-[HQ]-[SGAC]-G-X[2]-[STG]-X[2]-[DE]-X[6]-P-[LIVMFA]-[
LIVMFA]-X[2]- P-[LMVFIQ]-X[2]-[DE]-Q, where X is any amino acid 73
. The UGT
signature motifs are underlined in red. Consensus sequences of the UGT motifs were
created and displayed using the WebLogo server (http://weblogo.berkeley.edu/).
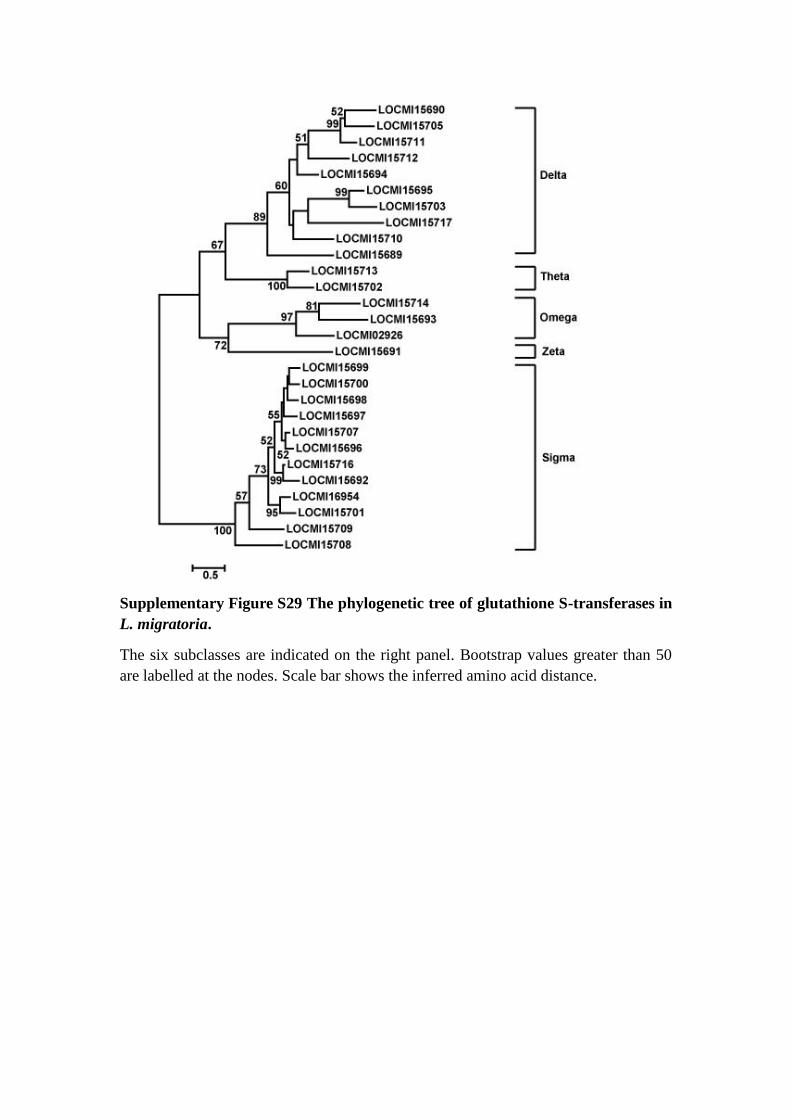
Supplementary Figure S29 The phylogenetic tree of glutathione S-transferases in
L. migratoria.
The six subclasses are indicated on the right panel. Bootstrap values greater than 50
are labelled at the nodes. Scale bar shows the inferred amino acid distance.
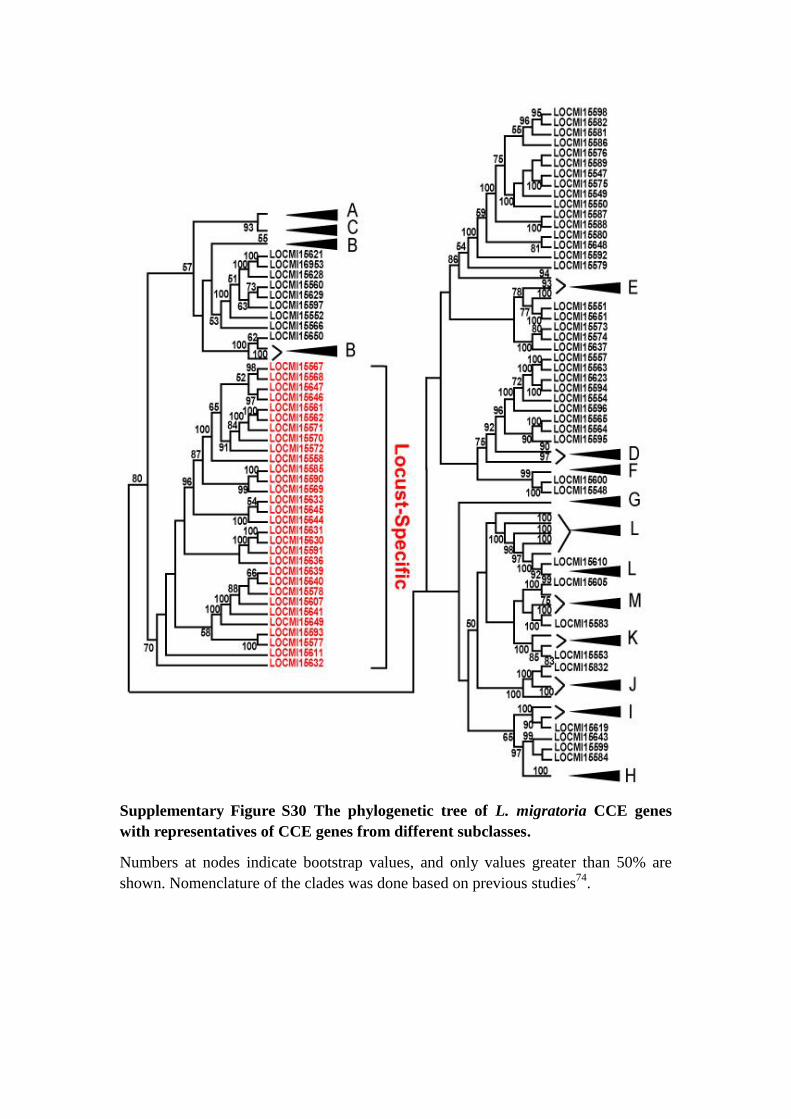
Supplementary Figure S30 The phylogenetic tree of L. migratoria CCE genes
with representatives of CCE genes from different subclasses.
Numbers at nodes indicate bootstrap values, and only values greater than 50% are
shown. Nomenclature of the clades was done based on previous studies74
.
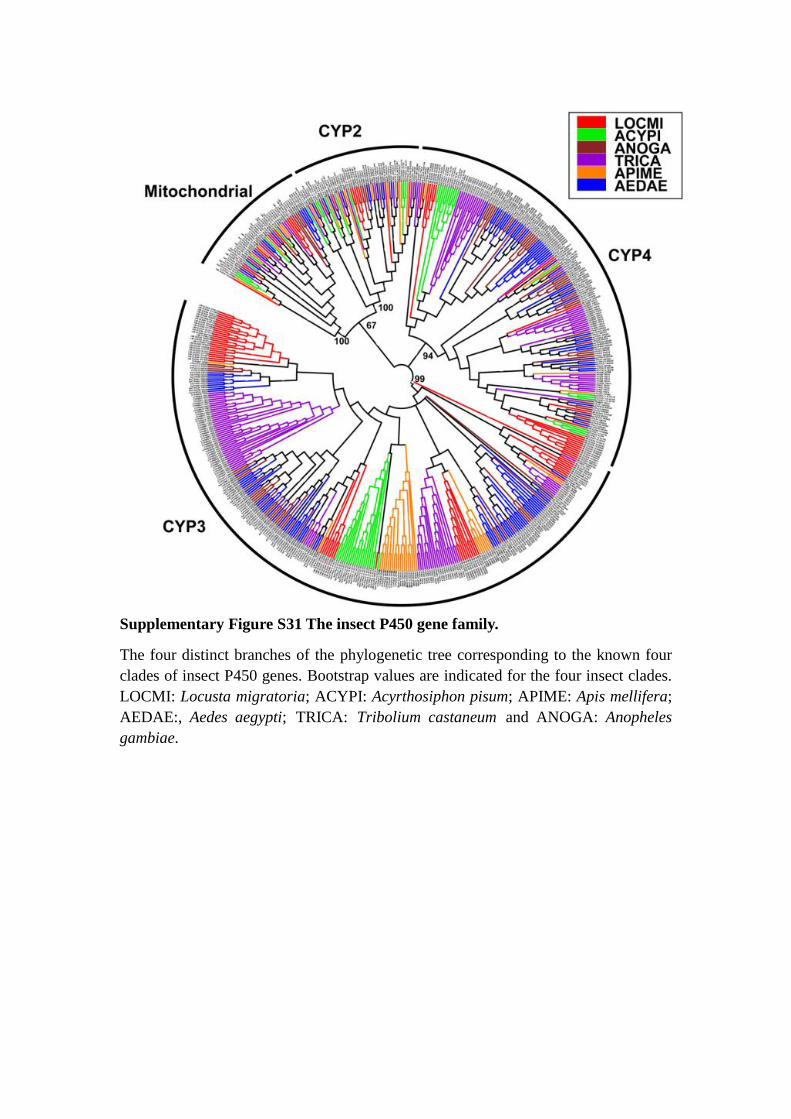
Supplementary Figure S31 The insect P450 gene family.
The four distinct branches of the phylogenetic tree corresponding to the known four
clades of insect P450 genes. Bootstrap values are indicated for the four insect clades.
LOCMI: Locusta migratoria; ACYPI: Acyrthosiphon pisum; APIME: Apis mellifera;
AEDAE:, Aedes aegypti; TRICA: Tribolium castaneum and ANOGA: Anopheles
gambiae.
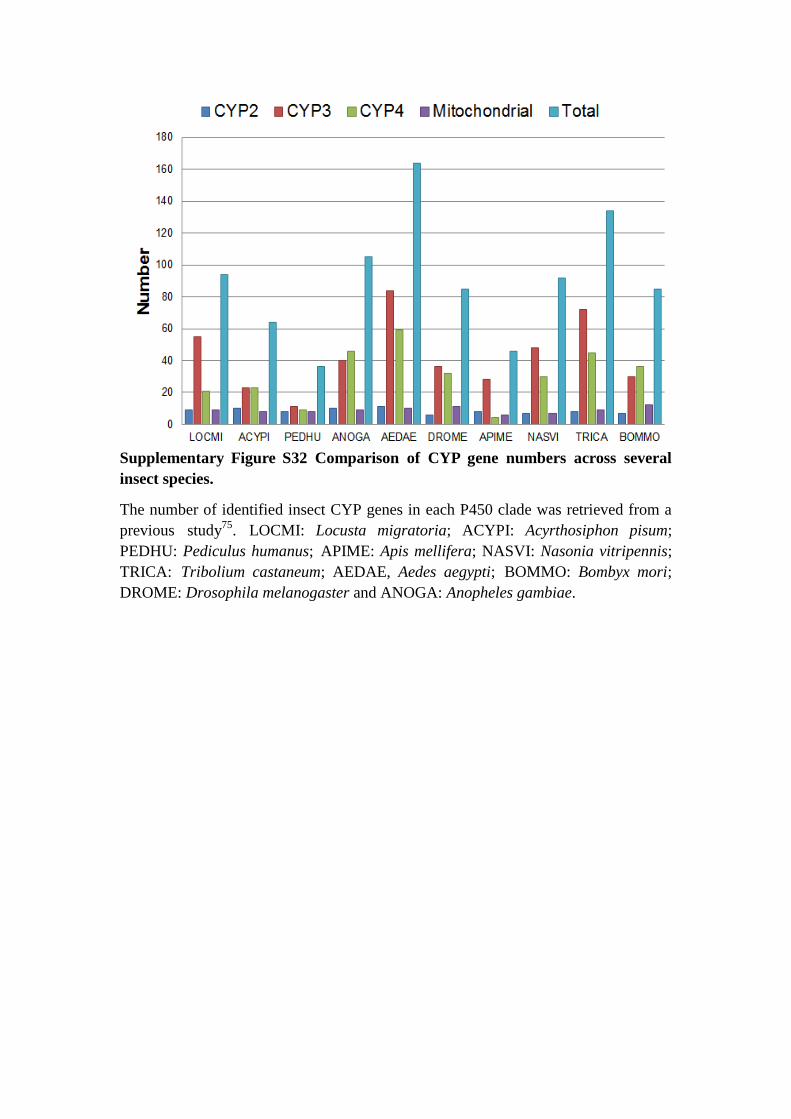
Supplementary Figure S32 Comparison of CYP gene numbers across several
insect species.
The number of identified insect CYP genes in each P450 clade was retrieved from a
previous study75
. LOCMI: Locusta migratoria; ACYPI: Acyrthosiphon pisum;
PEDHU: Pediculus humanus; APIME: Apis mellifera; NASVI: Nasonia vitripennis;
TRICA: Tribolium castaneum; AEDAE, Aedes aegypti; BOMMO: Bombyx mori;
DROME: Drosophila melanogaster and ANOGA: Anopheles gambiae.
Supplementary Tables
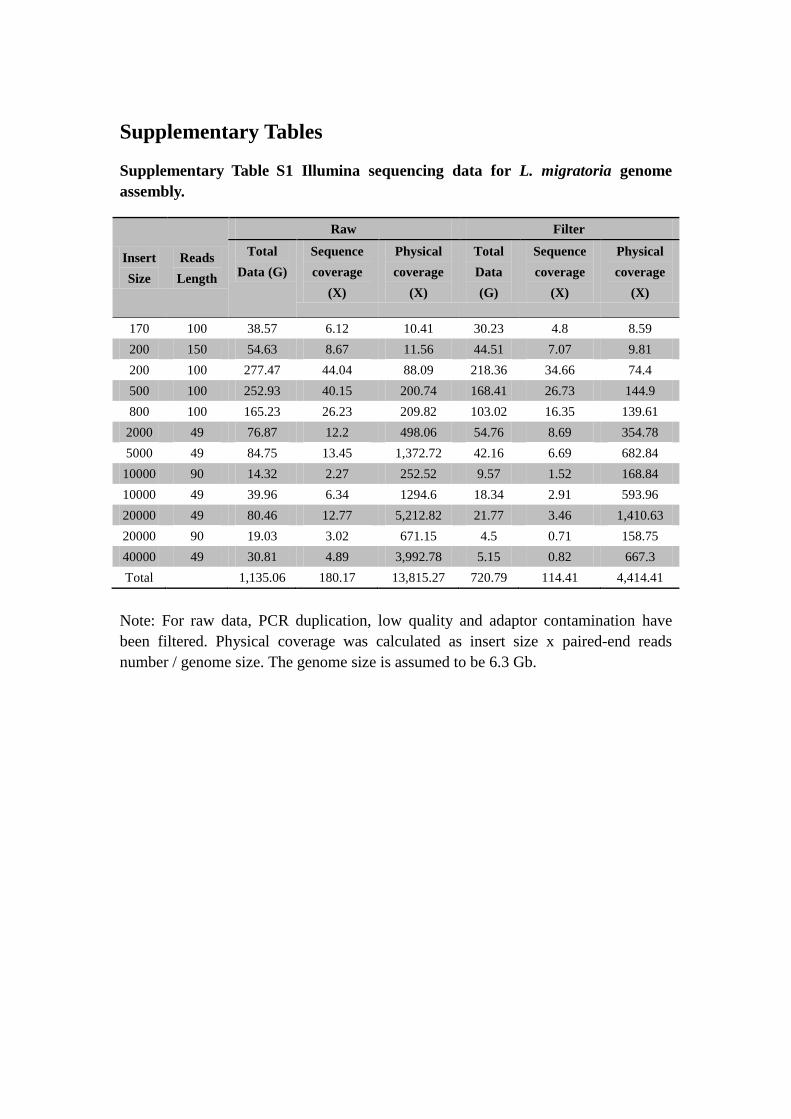
Supplementary Table S1 Illumina sequencing data for L. migratoria genome
assembly.
Insert
Size
Reads
Length
Raw Filter
Total
Data (G)
Sequence
coverage
(X)
Physical
coverage
(X)
Total
Data
(G)
Sequence
coverage
(X)
Physical
coverage
(X)
170 100 38.57 6.12 10.41 30.23 4.8 8.59
200 150 54.63 8.67 11.56 44.51 7.07 9.81
200 100 277.47 44.04 88.09 218.36 34.66 74.4
500 100 252.93 40.15 200.74 168.41 26.73 144.9
800 100 165.23 26.23 209.82 103.02 16.35 139.61
2000 49 76.87 12.2 498.06 54.76 8.69 354.78
5000 49 84.75 13.45 1,372.72 42.16 6.69 682.84
10000 90 14.32 2.27 252.52 9.57 1.52 168.84
10000 49 39.96 6.34 1294.6 18.34 2.91 593.96
20000 49 80.46 12.77 5,212.82 21.77 3.46 1,410.63
20000 90 19.03 3.02 671.15 4.5 0.71 158.75
40000 49 30.81 4.89 3,992.78 5.15 0.82 667.3
Total 1,135.06 180.17 13,815.27 720.79 114.41 4,414.41
Note: For raw data, PCR duplication, low quality and adaptor contamination have
been filtered. Physical coverage was calculated as insert size x paired-end reads
number / genome size. The genome size is assumed to be 6.3 Gb.

Supplementary Table S2 Genome size estimation of L. migratoria based on
17-mer analysis.
k-mer size #Total k-mer k-mer depth Genome size (bp)
17 146,642,996,731 23 6,375,782,466
Note: See Supplementary Supplementary Figure S2 for detailed description of the
methods used.
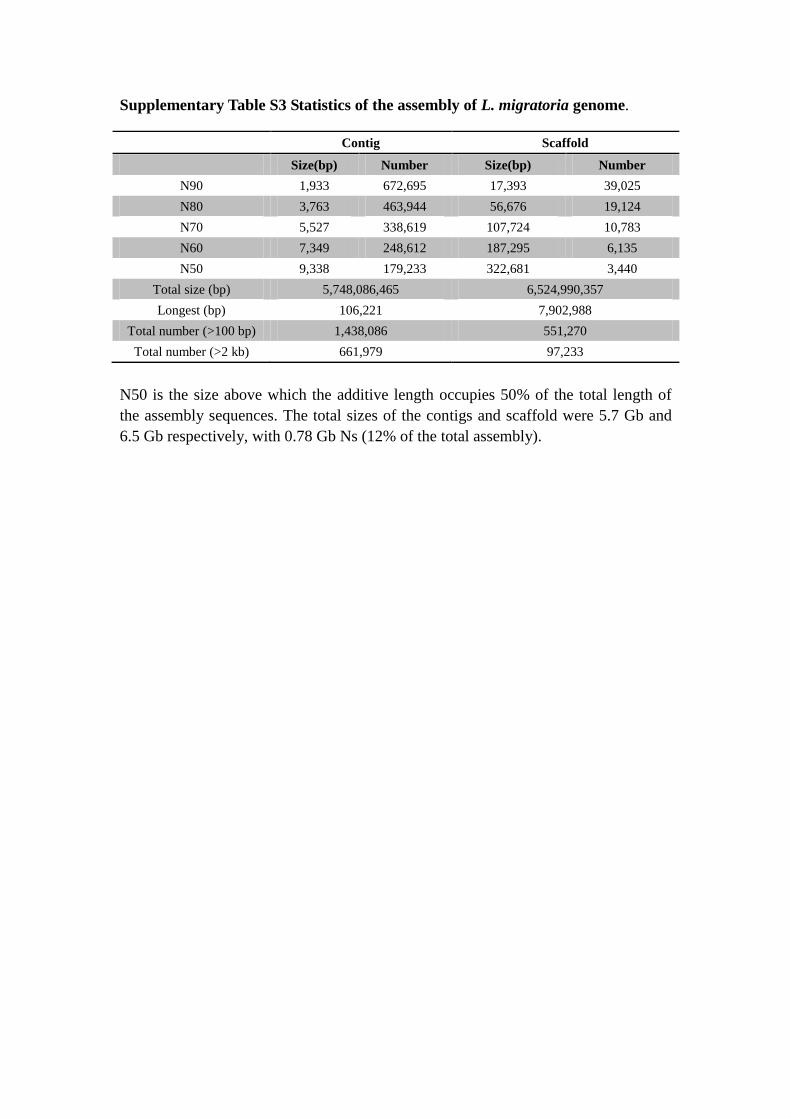
Supplementary Table S3 Statistics of the assembly of L. migratoria genome.
Contig Scaffold
Size(bp) Number Size(bp) Number
N90 1,933 672,695 17,393 39,025
N80 3,763 463,944 56,676 19,124
N70 5,527 338,619 107,724 10,783
N60 7,349 248,612 187,295 6,135
N50 9,338 179,233 322,681 3,440
Total size (bp) 5,748,086,465 6,524,990,357
Longest (bp) 106,221 7,902,988
Total number (>100 bp) 1,438,086 551,270
Total number (>2 kb) 661,979 97,233
N50 is the size above which the additive length occupies 50% of the total length of
the assembly sequences. The total sizes of the contigs and scaffold were 5.7 Gb and
6.5 Gb respectively, with 0.78 Gb Ns (12% of the total assembly).
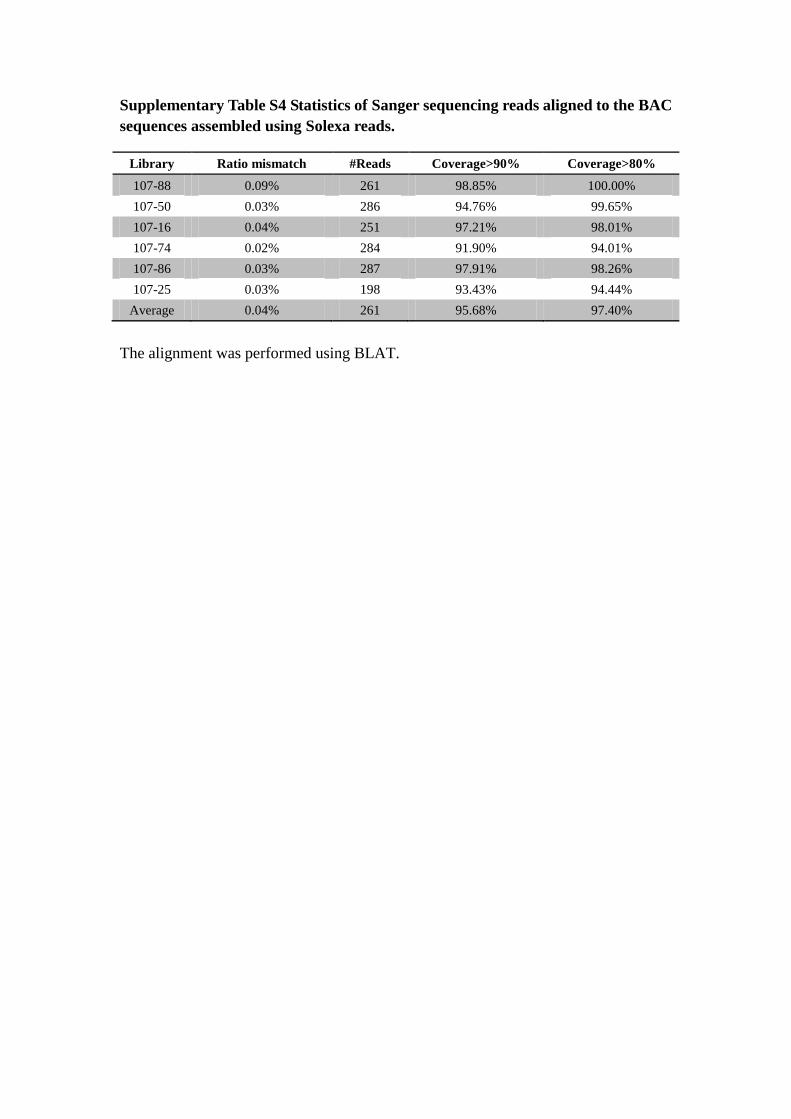
Supplementary Table S4 Statistics of Sanger sequencing reads aligned to the BAC
sequences assembled using Solexa reads.
Library Ratio mismatch #Reads Coverage>90% Coverage>80%
107-88 0.09% 261 98.85% 100.00%
107-50 0.03% 286 94.76% 99.65%
107-16 0.04% 251 97.21% 98.01%
107-74 0.02% 284 91.90% 94.01%
107-86 0.03% 287 97.91% 98.26%
107-25 0.03% 198 93.43% 94.44%
Average 0.04% 261 95.68% 97.40%
The alignment was performed using BLAT.
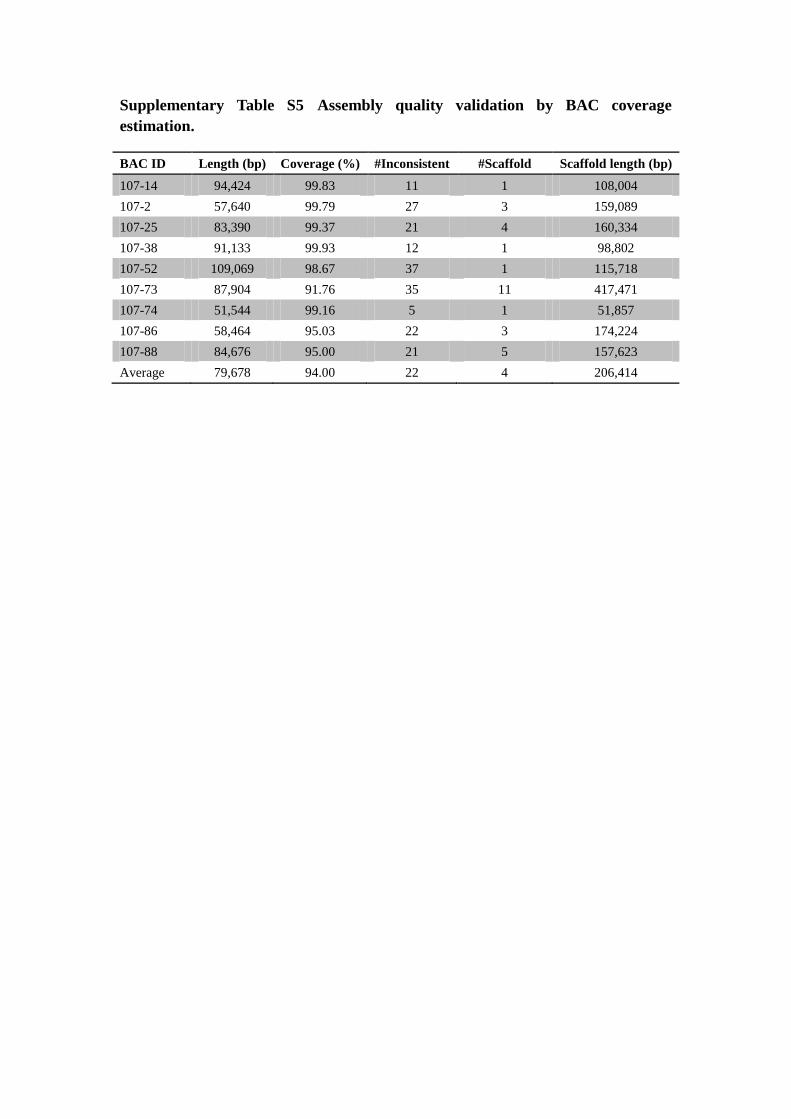
Supplementary Table S5 Assembly quality validation by BAC coverage
estimation.
BAC ID Length (bp) Coverage (%) #Inconsistent #Scaffold Scaffold length (bp)
107-14 94,424 99.83 11 1 108,004
107-2 57,640 99.79 27 3 159,089
107-25 83,390 99.37 21 4 160,334
107-38 91,133 99.93 12 1 98,802
107-52 109,069 98.67 37 1 115,718
107-73 87,904 91.76 35 11 417,471
107-74 51,544 99.16 5 1 51,857
107-86 58,464 95.03 22 3 174,224
107-88 84,676 95.00 21 5 157,623
Average 79,678 94.00 22 4 206,414
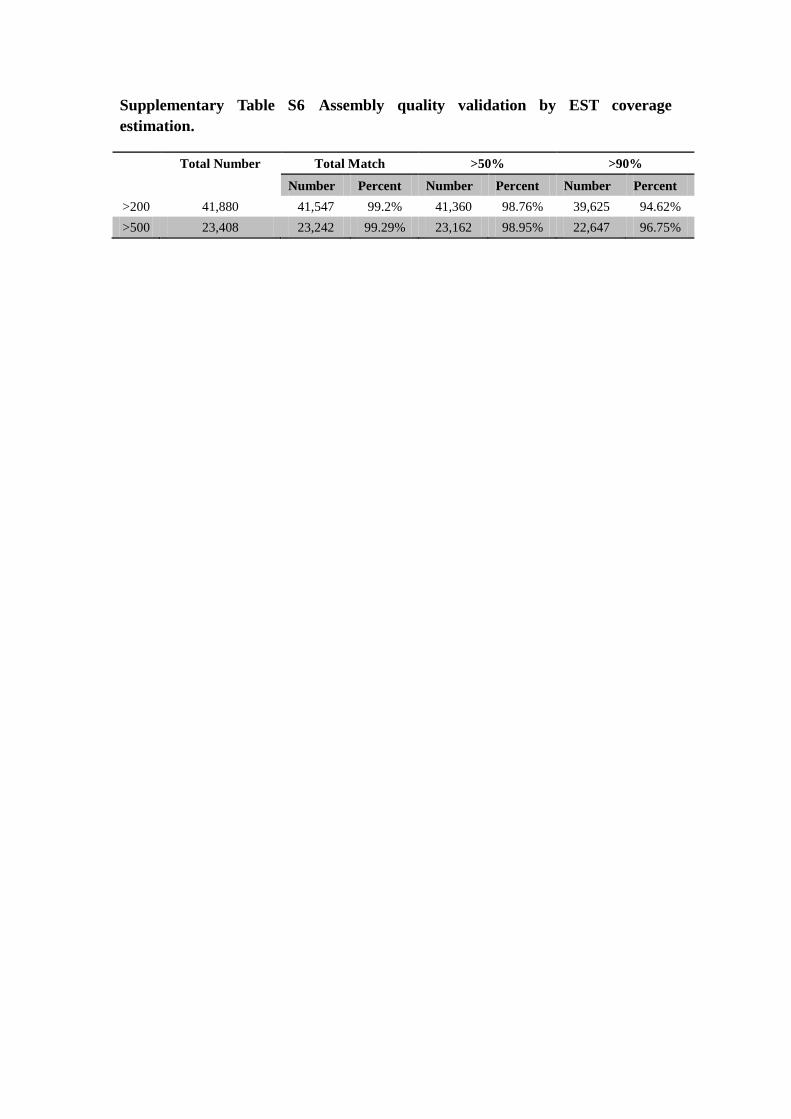
Supplementary Table S6 Assembly quality validation by EST coverage
estimation.
Total Number Total Match >50% >90%
Number Percent Number Percent Number Percent
>200 41,880 41,547 99.2% 41,360 98.76% 39,625 94.62%
>500 23,408 23,242 99.29% 23,162 98.95% 22,647 96.75%
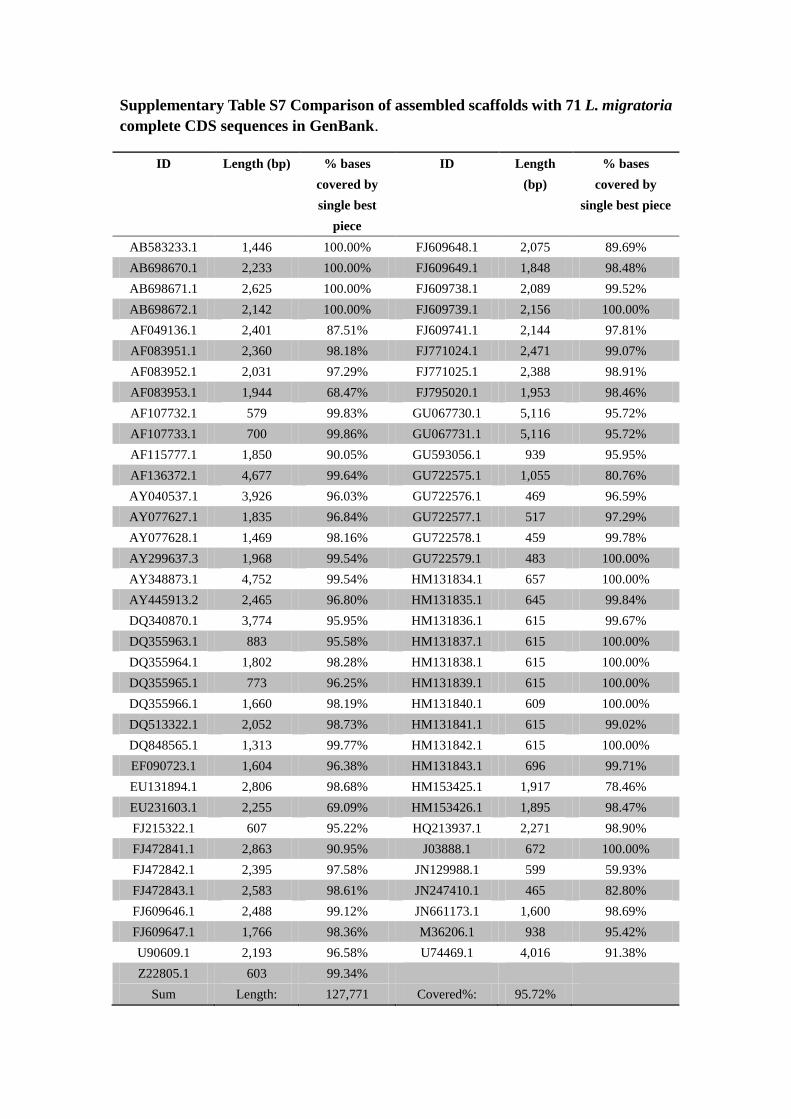
Supplementary Table S7 Comparison of assembled scaffolds with 71 L. migratoria
complete CDS sequences in GenBank.
ID Length (bp) % bases
covered by
single best
piece
ID Length
(bp)
% bases
covered by
single best piece
AB583233.1 1,446 100.00% FJ609648.1 2,075 89.69%
AB698670.1 2,233 100.00% FJ609649.1 1,848 98.48%
AB698671.1 2,625 100.00% FJ609738.1 2,089 99.52%
AB698672.1 2,142 100.00% FJ609739.1 2,156 100.00%
AF049136.1 2,401 87.51% FJ609741.1 2,144 97.81%
AF083951.1 2,360 98.18% FJ771024.1 2,471 99.07%
AF083952.1 2,031 97.29% FJ771025.1 2,388 98.91%
AF083953.1 1,944 68.47% FJ795020.1 1,953 98.46%
AF107732.1 579 99.83% GU067730.1 5,116 95.72%
AF107733.1 700 99.86% GU067731.1 5,116 95.72%
AF115777.1 1,850 90.05% GU593056.1 939 95.95%
AF136372.1 4,677 99.64% GU722575.1 1,055 80.76%
AY040537.1 3,926 96.03% GU722576.1 469 96.59%
AY077627.1 1,835 96.84% GU722577.1 517 97.29%
AY077628.1 1,469 98.16% GU722578.1 459 99.78%
AY299637.3 1,968 99.54% GU722579.1 483 100.00%
AY348873.1 4,752 99.54% HM131834.1 657 100.00%
AY445913.2 2,465 96.80% HM131835.1 645 99.84%
DQ340870.1 3,774 95.95% HM131836.1 615 99.67%
DQ355963.1 883 95.58% HM131837.1 615 100.00%
DQ355964.1 1,802 98.28% HM131838.1 615 100.00%
DQ355965.1 773 96.25% HM131839.1 615 100.00%
DQ355966.1 1,660 98.19% HM131840.1 609 100.00%
DQ513322.1 2,052 98.73% HM131841.1 615 99.02%
DQ848565.1 1,313 99.77% HM131842.1 615 100.00%
EF090723.1 1,604 96.38% HM131843.1 696 99.71%
EU131894.1 2,806 98.68% HM153425.1 1,917 78.46%
EU231603.1 2,255 69.09% HM153426.1 1,895 98.47%
FJ215322.1 607 95.22% HQ213937.1 2,271 98.90%
FJ472841.1 2,863 90.95% J03888.1 672 100.00%
FJ472842.1 2,395 97.58% JN129988.1 599 59.93%
FJ472843.1 2,583 98.61% JN247410.1 465 82.80%
FJ609646.1 2,488 99.12% JN661173.1 1,600 98.69%
FJ609647.1 1,766 98.36% M36206.1 938 95.42%
U90609.1 2,193 96.58% U74469.1 4,016 91.38%
Z22805.1 603 99.34%
Sum Length: 127,771 Covered%: 95.72%
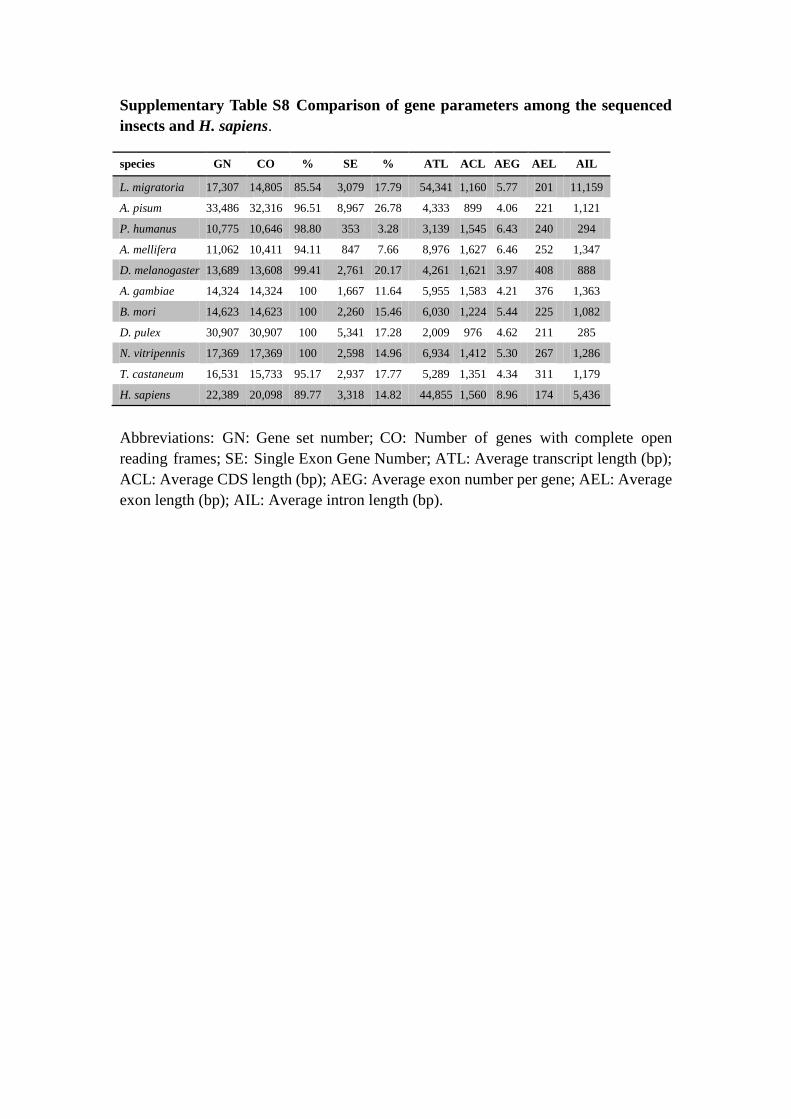
Supplementary Table S8 Comparison of gene parameters among the sequenced
insects and H. sapiens.
species GN CO % SE % ATL ACL AEG AEL AIL
L. migratoria 17,307 14,805 85.54 3,079 17.79 54,341 1,160 5.77 201 11,159
A. pisum 33,486 32,316 96.51 8,967 26.78 4,333 899 4.06 221 1,121
P. humanus 10,775 10,646 98.80 353 3.28 3,139 1,545 6.43 240 294
A. mellifera 11,062 10,411 94.11 847 7.66 8,976 1,627 6.46 252 1,347
D. melanogaster 13,689 13,608 99.41 2,761 20.17 4,261 1,621 3.97 408 888
A. gambiae 14,324 14,324 100 1,667 11.64 5,955 1,583 4.21 376 1,363
B. mori 14,623 14,623 100 2,260 15.46 6,030 1,224 5.44 225 1,082
D. pulex 30,907 30,907 100 5,341 17.28 2,009 976 4.62 211 285
N. vitripennis 17,369 17,369 100 2,598 14.96 6,934 1,412 5.30 267 1,286
T. castaneum 16,531 15,733 95.17 2,937 17.77 5,289 1,351 4.34 311 1,179
H. sapiens 22,389 20,098 89.77 3,318 14.82 44,855 1,560 8.96 174 5,436
Abbreviations: GN: Gene set number; CO: Number of genes with complete open
reading frames; SE: Single Exon Gene Number; ATL: Average transcript length (bp);
ACL: Average CDS length (bp); AEG: Average exon number per gene; AEL: Average
exon length (bp); AIL: Average intron length (bp).
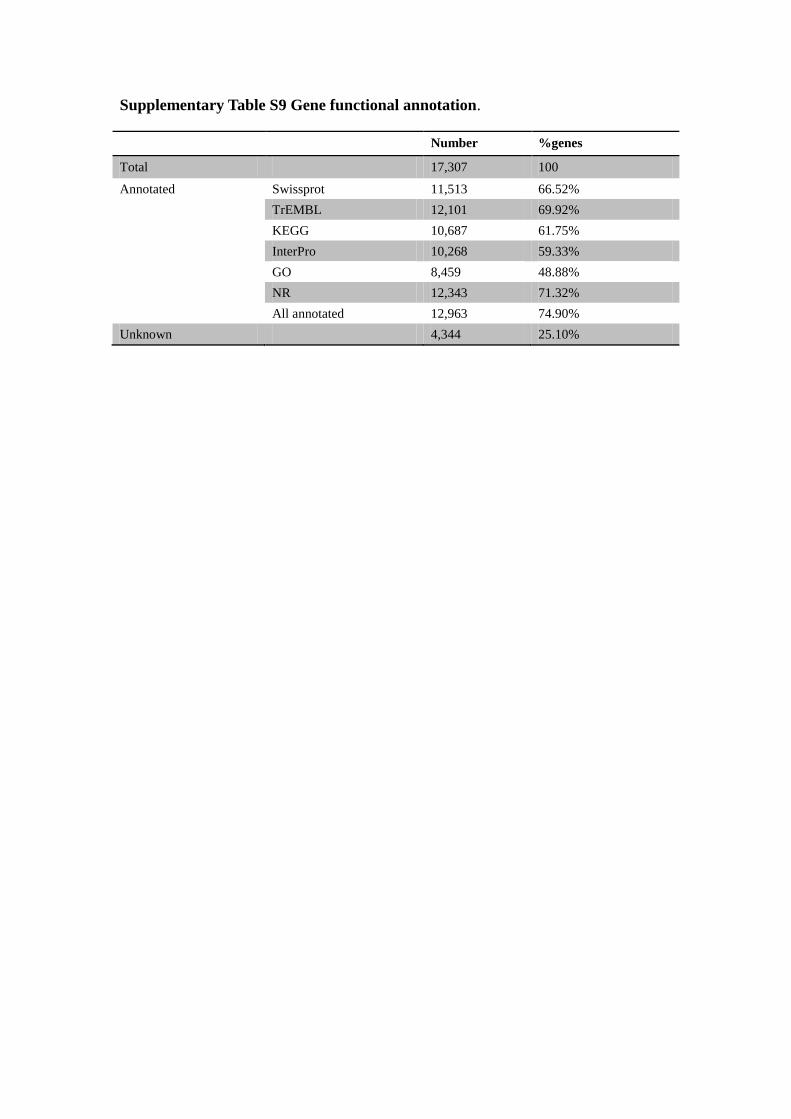
Supplementary Table S9 Gene functional annotation.
Number %genes
Total 17,307 100
Annotated Swissprot 11,513 66.52%
TrEMBL 12,101 69.92%
KEGG 10,687 61.75%
InterPro 10,268 59.33%
GO 8,459 48.88%
NR 12,343 71.32%
All annotated 12,963 74.90%
Unknown 4,344 25.10%
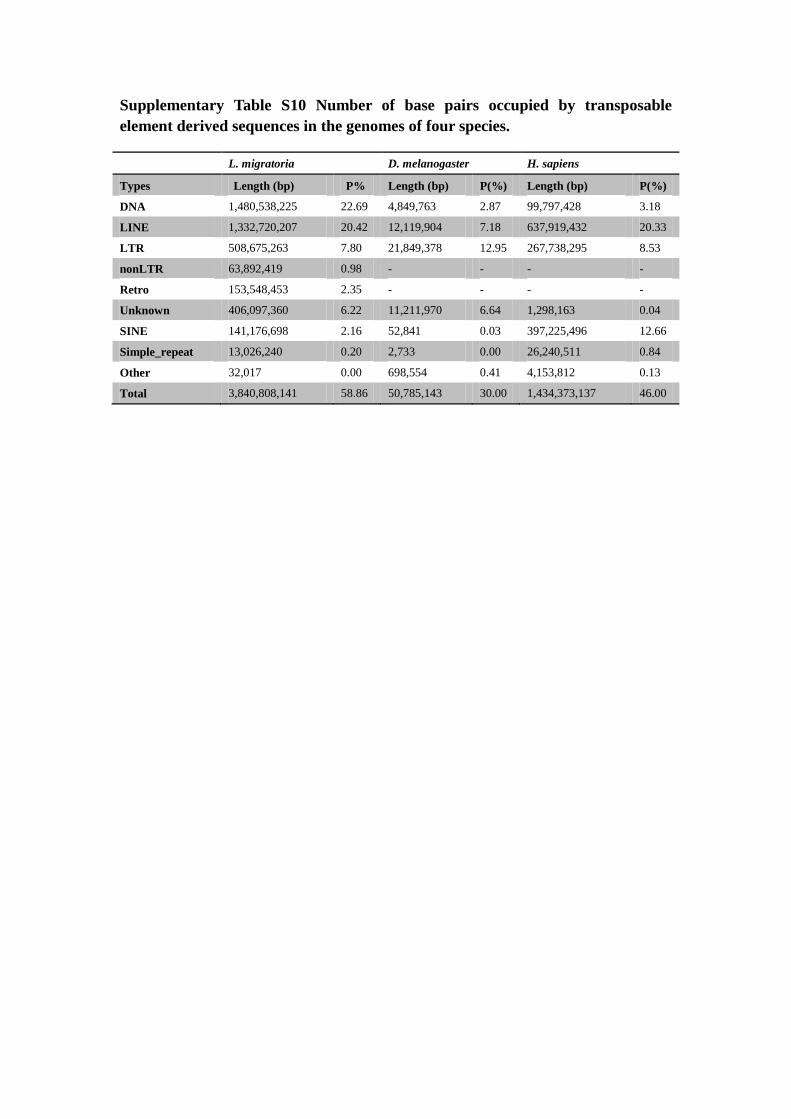
Supplementary Table S10 Number of base pairs occupied by transposable
element derived sequences in the genomes of four species.
L. migratoria D. melanogaster H. sapiens
Types Length (bp) P% Length (bp) P(%) Length (bp) P(%)
DNA 1,480,538,225 22.69 4,849,763 2.87 99,797,428 3.18
LINE 1,332,720,207 20.42 12,119,904 7.18 637,919,432 20.33
LTR 508,675,263 7.80 21,849,378 12.95 267,738,295 8.53
nonLTR 63,892,419 0.98 - - - -
Retro 153,548,453 2.35 - - - -
Unknown 406,097,360 6.22 11,211,970 6.64 1,298,163 0.04
SINE 141,176,698 2.16 52,841 0.03 397,225,496 12.66
Simple_repeat 13,026,240 0.20 2,733 0.00 26,240,511 0.84
Other 32,017 0.00 698,554 0.41 4,153,812 0.13
Total 3,840,808,141 58.86 50,785,143 30.00 1,434,373,137 46.00
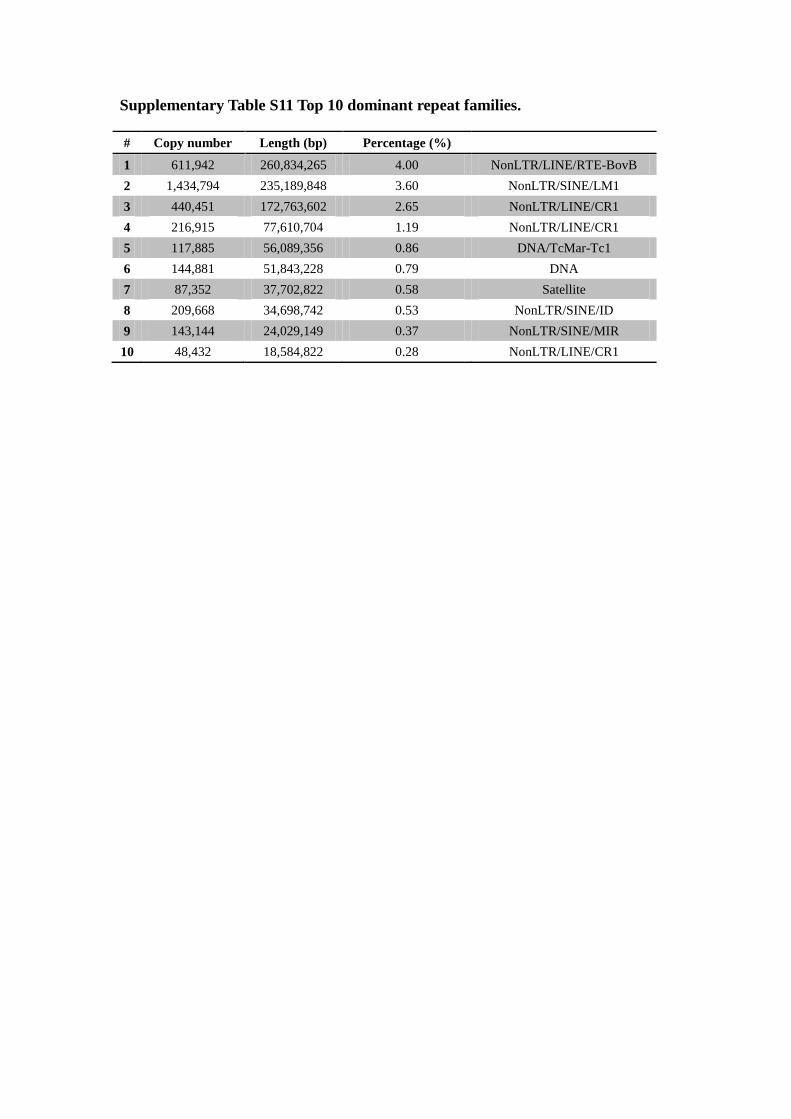
Supplementary Table S11 Top 10 dominant repeat families.
# Copy number Length (bp) Percentage (%)
1 611,942 260,834,265 4.00 NonLTR/LINE/RTE-BovB
2 1,434,794 235,189,848 3.60 NonLTR/SINE/LM1
3 440,451 172,763,602 2.65 NonLTR/LINE/CR1
4 216,915 77,610,704 1.19 NonLTR/LINE/CR1
5 117,885 56,089,356 0.86 DNA/TcMar-Tc1
6 144,881 51,843,228 0.79 DNA
7 87,352 37,702,822 0.58 Satellite
8 209,668 34,698,742 0.53 NonLTR/SINE/ID
9 143,144 24,029,149 0.37 NonLTR/SINE/MIR
10 48,432 18,584,822 0.28 NonLTR/LINE/CR1
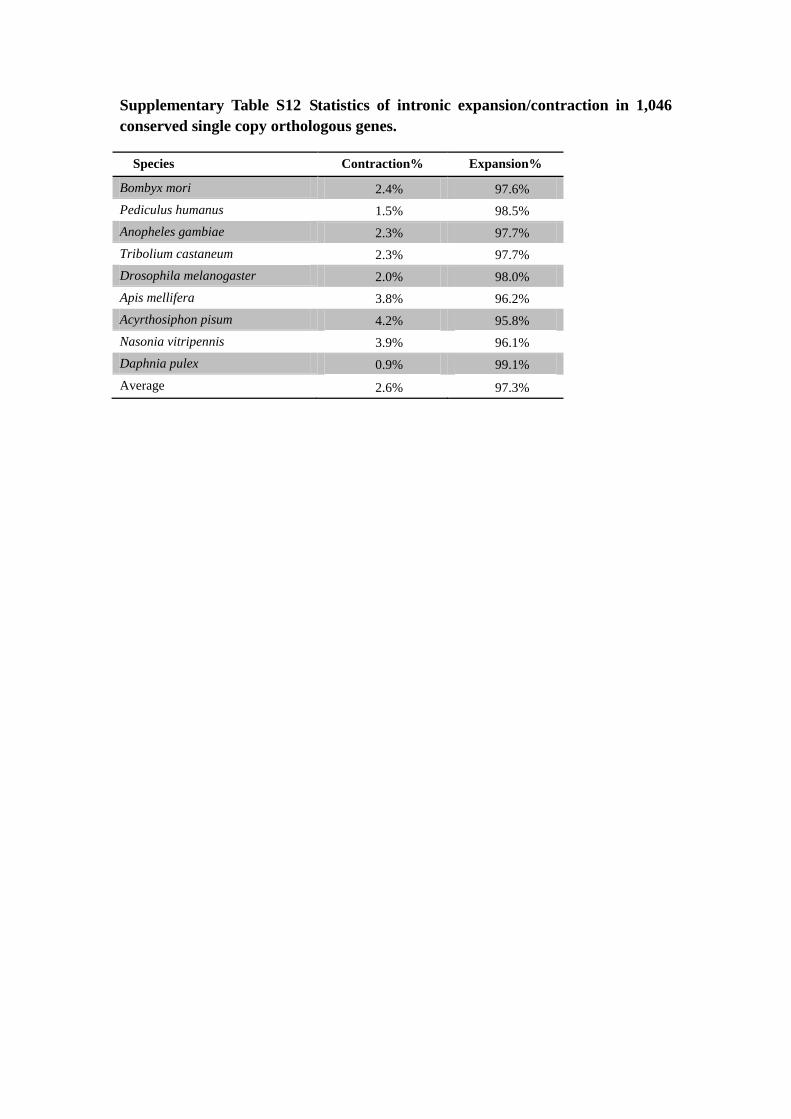
Supplementary Table S12 Statistics of intronic expansion/contraction in 1,046
conserved single copy orthologous genes.
Species Contraction% Expansion%
Bombyx mori 2.4% 97.6%
Pediculus humanus 1.5% 98.5%
Anopheles gambiae 2.3% 97.7%
Tribolium castaneum 2.3% 97.7%
Drosophila melanogaster 2.0% 98.0%
Apis mellifera 3.8% 96.2%
Acyrthosiphon pisum 4.2% 95.8%
Nasonia vitripennis 3.9% 96.1%
Daphnia pulex 0.9% 99.1%
Average 2.6% 97.3%
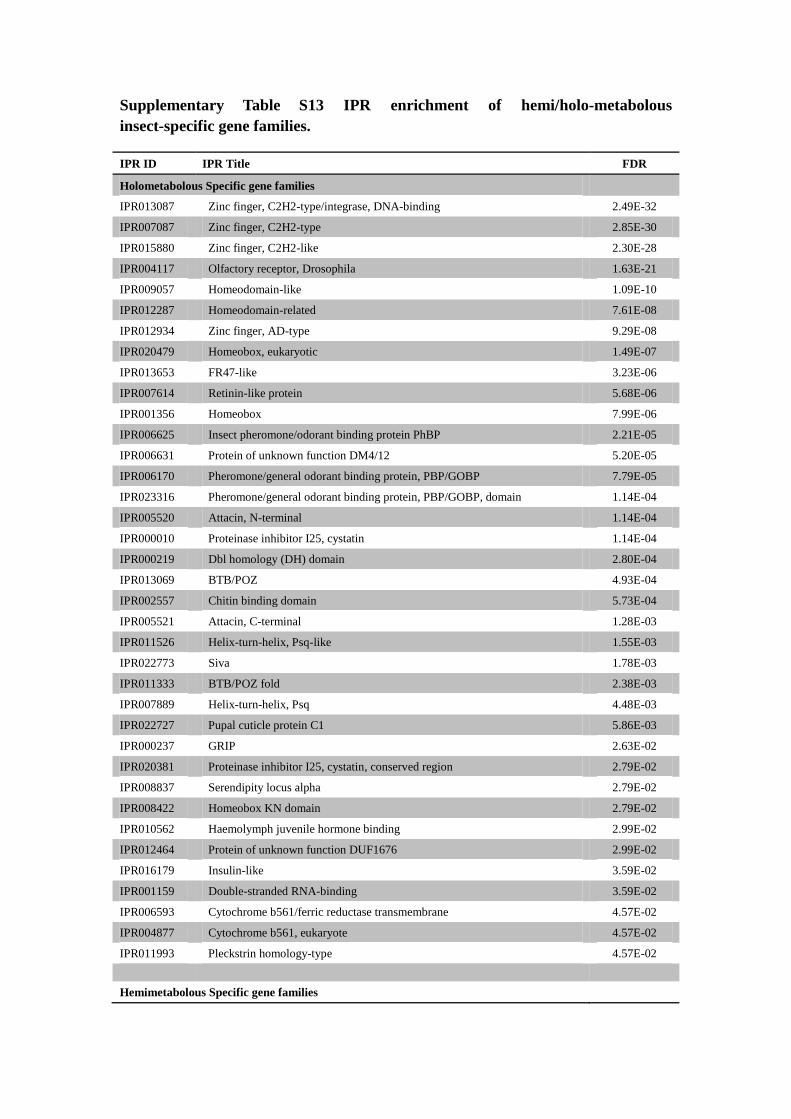
Supplementary Table S13 IPR enrichment of hemi/holo-metabolous
insect-specific gene families.
IPR ID IPR Title FDR
Holometabolous Specific gene families
IPR013087 Zinc finger, C2H2-type/integrase, DNA-binding 2.49E-32
IPR007087 Zinc finger, C2H2-type 2.85E-30
IPR015880 Zinc finger, C2H2-like 2.30E-28
IPR004117 Olfactory receptor, Drosophila 1.63E-21
IPR009057 Homeodomain-like 1.09E-10
IPR012287 Homeodomain-related 7.61E-08
IPR012934 Zinc finger, AD-type 9.29E-08
IPR020479 Homeobox, eukaryotic 1.49E-07
IPR013653 FR47-like 3.23E-06
IPR007614 Retinin-like protein 5.68E-06
IPR001356 Homeobox 7.99E-06
IPR006625 Insect pheromone/odorant binding protein PhBP 2.21E-05
IPR006631 Protein of unknown function DM4/12 5.20E-05
IPR006170 Pheromone/general odorant binding protein, PBP/GOBP 7.79E-05
IPR023316 Pheromone/general odorant binding protein, PBP/GOBP, domain 1.14E-04
IPR005520 Attacin, N-terminal 1.14E-04
IPR000010 Proteinase inhibitor I25, cystatin 1.14E-04
IPR000219 Dbl homology (DH) domain 2.80E-04
IPR013069 BTB/POZ 4.93E-04
IPR002557 Chitin binding domain 5.73E-04
IPR005521 Attacin, C-terminal 1.28E-03
IPR011526 Helix-turn-helix, Psq-like 1.55E-03
IPR022773 Siva 1.78E-03
IPR011333 BTB/POZ fold 2.38E-03
IPR007889 Helix-turn-helix, Psq 4.48E-03
IPR022727 Pupal cuticle protein C1 5.86E-03
IPR000237 GRIP 2.63E-02
IPR020381 Proteinase inhibitor I25, cystatin, conserved region 2.79E-02
IPR008837 Serendipity locus alpha 2.79E-02
IPR008422 Homeobox KN domain 2.79E-02
IPR010562 Haemolymph juvenile hormone binding 2.99E-02
IPR012464 Protein of unknown function DUF1676 2.99E-02
IPR016179 Insulin-like 3.59E-02
IPR001159 Double-stranded RNA-binding 3.59E-02
IPR006593 Cytochrome b561/ferric reductase transmembrane 4.57E-02
IPR004877 Cytochrome b561, eukaryote 4.57E-02
IPR011993 Pleckstrin homology-type 4.57E-02
Hemimetabolous Specific gene families
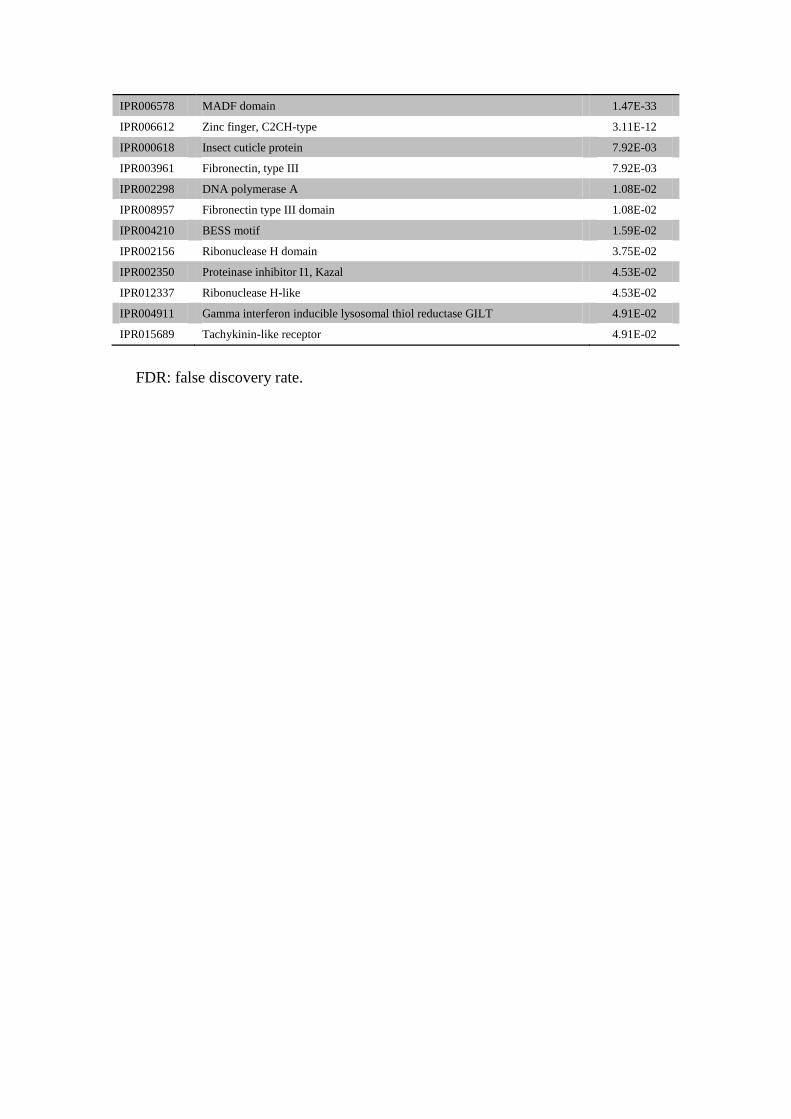
IPR006578 MADF domain 1.47E-33
IPR006612 Zinc finger, C2CH-type 3.11E-12
IPR000618 Insect cuticle protein 7.92E-03
IPR003961 Fibronectin, type III 7.92E-03
IPR002298 DNA polymerase A 1.08E-02
IPR008957 Fibronectin type III domain 1.08E-02
IPR004210 BESS motif 1.59E-02
IPR002156 Ribonuclease H domain 3.75E-02
IPR002350 Proteinase inhibitor I1, Kazal 4.53E-02
IPR012337 Ribonuclease H-like 4.53E-02
IPR004911 Gamma interferon inducible lysosomal thiol reductase GILT 4.91E-02
IPR015689 Tachykinin-like receptor 4.91E-02
FDR: false discovery rate.
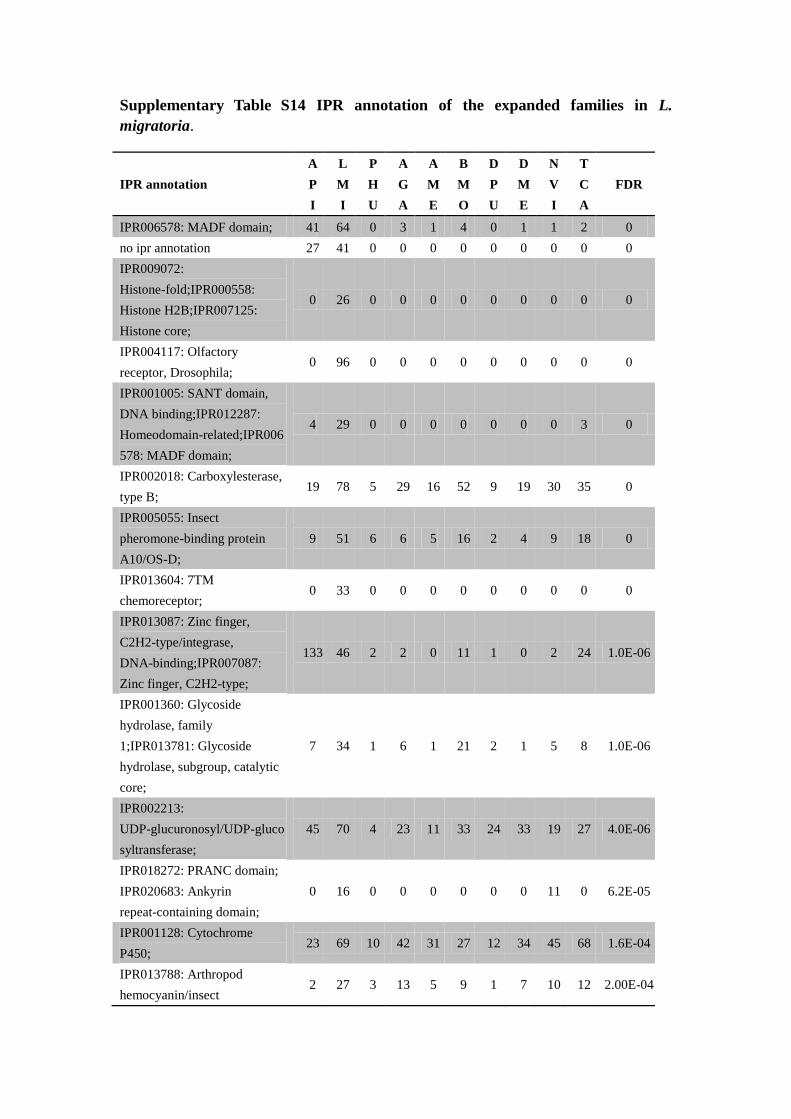
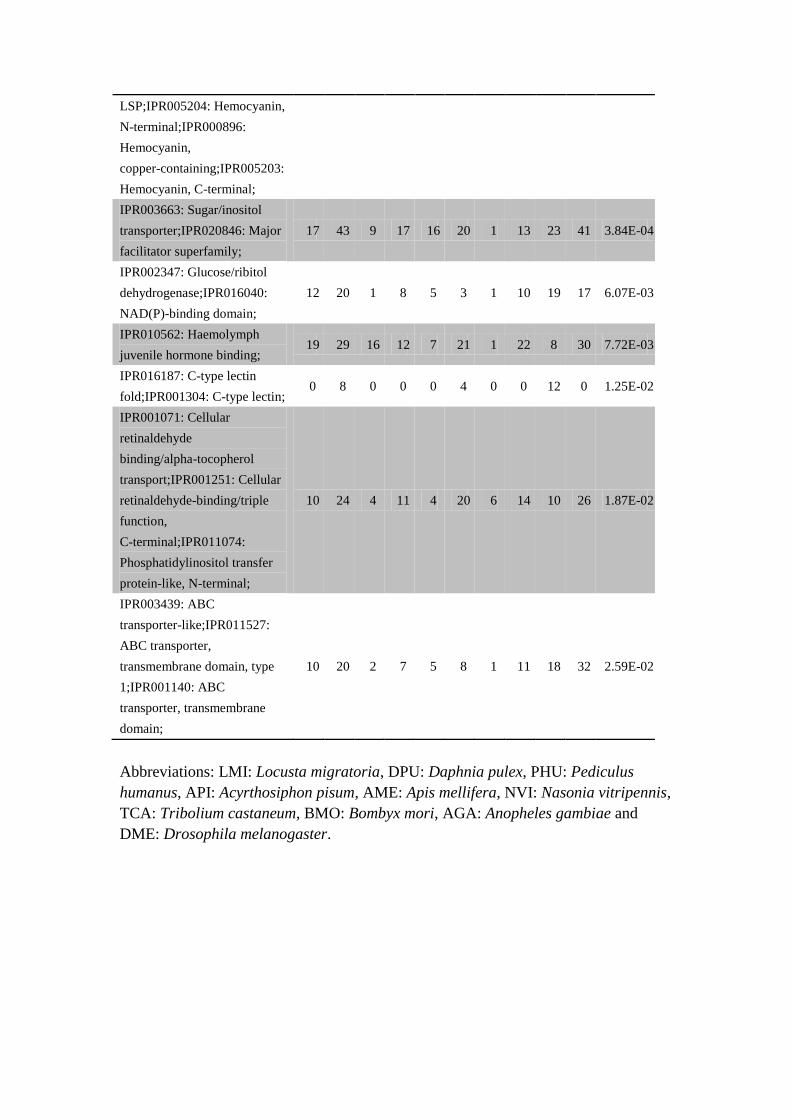
Supplementary Table S14 IPR annotation of the expanded families in L.
migratoria.
IPR annotation
A
P
I
L
M
I
P
H
U
A
G
A
A
M
E
B
M
O
D
P
U
D
M
E
N
V
I
T
C
A
FDR
IPR006578: MADF domain; 41 64 0 3 1 4 0 1 1 2 0
no ipr annotation 27 41 0 0 0 0 0 0 0 0 0
IPR009072:
Histone-fold;IPR000558:
Histone H2B;IPR007125:
Histone core;
0 26 0 0 0 0 0 0 0 0 0
IPR004117: Olfactory
receptor, Drosophila; 0 96 0 0 0 0 0 0 0 0 0
IPR001005: SANT domain,
DNA binding;IPR012287:
Homeodomain-related;IPR006
578: MADF domain;
4 29 0 0 0 0 0 0 0 3 0
IPR002018: Carboxylesterase,
type B; 19 78 5 29 16 52 9 19 30 35 0
IPR005055: Insect
pheromone-binding protein
A10/OS-D;
9 51 6 6 5 16 2 4 9 18 0
IPR013604: 7TM
chemoreceptor; 0 33 0 0 0 0 0 0 0 0 0
IPR013087: Zinc finger,
C2H2-type/integrase,
DNA-binding;IPR007087:
Zinc finger, C2H2-type;
133 46 2 2 0 11 1 0 2 24 1.0E-06
IPR001360: Glycoside
hydrolase, family
1;IPR013781: Glycoside
hydrolase, subgroup, catalytic
core;
7 34 1 6 1 21 2 1 5 8 1.0E-06
IPR002213:
UDP-glucuronosyl/UDP-gluco
syltransferase;
45 70 4 23 11 33 24 33 19 27 4.0E-06
IPR018272: PRANC domain;
IPR020683: Ankyrin
repeat-containing domain;
0 16 0 0 0 0 0 0 11 0 6.2E-05
IPR001128: Cytochrome
P450; 23 69 10 42 31 27 12 34 45 68 1.6E-04
IPR013788: Arthropod
hemocyanin/insect 2 27 3 13 5 9 1 7 10 12 2.00E-04
LSP;IPR005204: Hemocyanin,
N-terminal;IPR000896:
Hemocyanin,
copper-containing;IPR005203:
Hemocyanin, C-terminal;
IPR003663: Sugar/inositol
transporter;IPR020846: Major
facilitator superfamily;
17 43 9 17 16 20 1 13 23 41 3.84E-04
IPR002347: Glucose/ribitol
dehydrogenase;IPR016040:
NAD(P)-binding domain;
12 20 1 8 5 3 1 10 19 17 6.07E-03
IPR010562: Haemolymph
juvenile hormone binding; 19 29 16 12 7 21 1 22 8 30 7.72E-03
IPR016187: C-type lectin
fold;IPR001304: C-type lectin; 0 8 0 0 0 4 0 0 12 0 1.25E-02
IPR001071: Cellular
retinaldehyde
binding/alpha-tocopherol
transport;IPR001251: Cellular
retinaldehyde-binding/triple
function,
C-terminal;IPR011074:
Phosphatidylinositol transfer
protein-like, N-terminal;
10 24 4 11 4 20 6 14 10 26 1.87E-02
IPR003439: ABC
transporter-like;IPR011527:
ABC transporter,
transmembrane domain, type
1;IPR001140: ABC
transporter, transmembrane
domain;
10 20 2 7 5 8 1 11 18 32 2.59E-02
Abbreviations: LMI: Locusta migratoria, DPU: Daphnia pulex, PHU: Pediculus
humanus, API: Acyrthosiphon pisum, AME: Apis mellifera, NVI: Nasonia vitripennis,
TCA: Tribolium castaneum, BMO: Bombyx mori, AGA: Anopheles gambiae and
DME: Drosophila melanogaster.
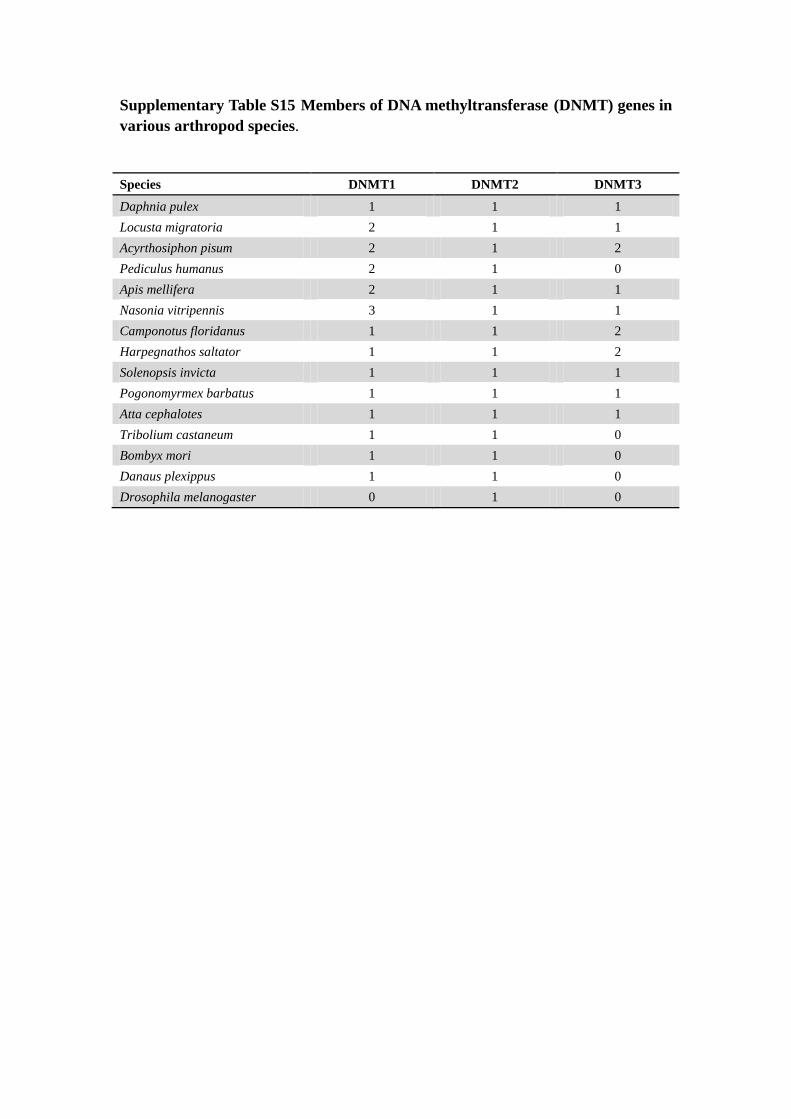
Supplementary Table S15 Members of DNA methyltransferase (DNMT) genes in
various arthropod species.
Species DNMT1 DNMT2 DNMT3
Daphnia pulex 1 1 1
Locusta migratoria 2 1 1
Acyrthosiphon pisum 2 1 2
Pediculus humanus 2 1 0
Apis mellifera 2 1 1
Nasonia vitripennis 3 1 1
Camponotus floridanus 1 1 2
Harpegnathos saltator 1 1 2
Solenopsis invicta 1 1 1
Pogonomyrmex barbatus 1 1 1
Atta cephalotes 1 1 1
Tribolium castaneum 1 1 0
Bombyx mori 1 1 0
Danaus plexippus 1 1 0
Drosophila melanogaster 0 1 0
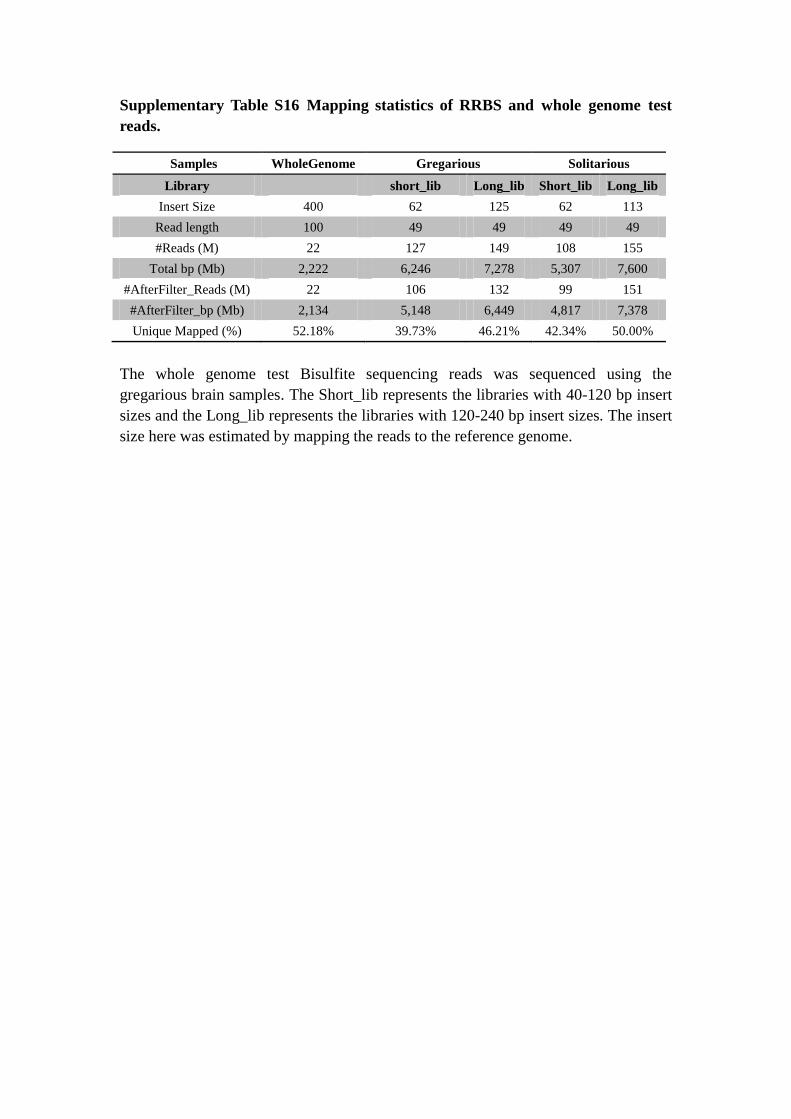
Supplementary Table S16 Mapping statistics of RRBS and whole genome test
reads.
Samples WholeGenome Gregarious Solitarious
Library short_lib Long_lib Short_lib Long_lib
Insert Size 400 62 125 62 113
Read length 100 49 49 49 49
#Reads (M) 22 127 149 108 155
Total bp (Mb) 2,222 6,246 7,278 5,307 7,600
#AfterFilter_Reads (M) 22 106 132 99 151
#AfterFilter_bp (Mb) 2,134 5,148 6,449 4,817 7,378
Unique Mapped (%) 52.18% 39.73% 46.21% 42.34% 50.00%
The whole genome test Bisulfite sequencing reads was sequenced using the
gregarious brain samples. The Short_lib represents the libraries with 40-120 bp insert
sizes and the Long_lib represents the libraries with 120-240 bp insert sizes. The insert
size here was estimated by mapping the reads to the reference genome.
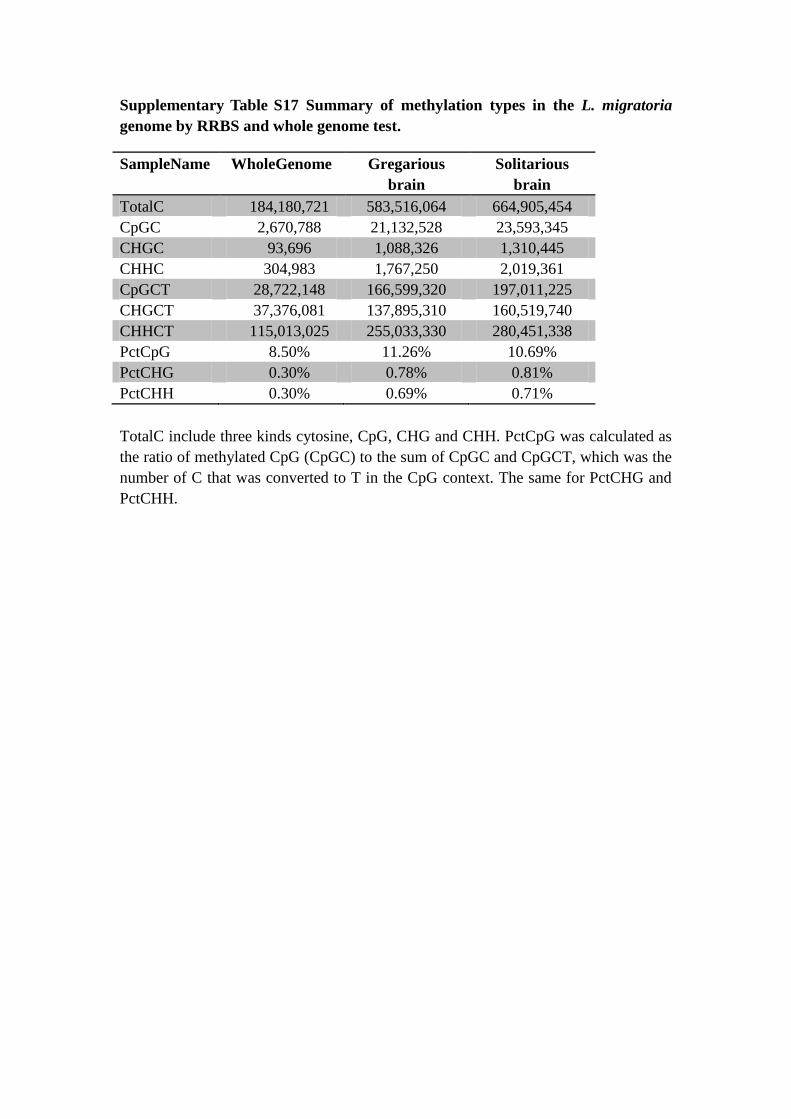
Supplementary Table S17 Summary of methylation types in the L. migratoria
genome by RRBS and whole genome test.
SampleName WholeGenome Gregarious
brain
Solitarious
brain
TotalC 184,180,721 583,516,064 664,905,454
CpGC 2,670,788 21,132,528 23,593,345
CHGC 93,696 1,088,326 1,310,445
CHHC 304,983 1,767,250 2,019,361
CpGCT 28,722,148 166,599,320 197,011,225
CHGCT 37,376,081 137,895,310 160,519,740
CHHCT 115,013,025 255,033,330 280,451,338
PctCpG 8.50% 11.26% 10.69%
PctCHG 0.30% 0.78% 0.81%
PctCHH 0.30% 0.69% 0.71%
TotalC include three kinds cytosine, CpG, CHG and CHH. PctCpG was calculated as
the ratio of methylated CpG (CpGC) to the sum of CpGC and CpGCT, which was the
number of C that was converted to T in the CpG context. The same for PctCHG and
PctCHH.
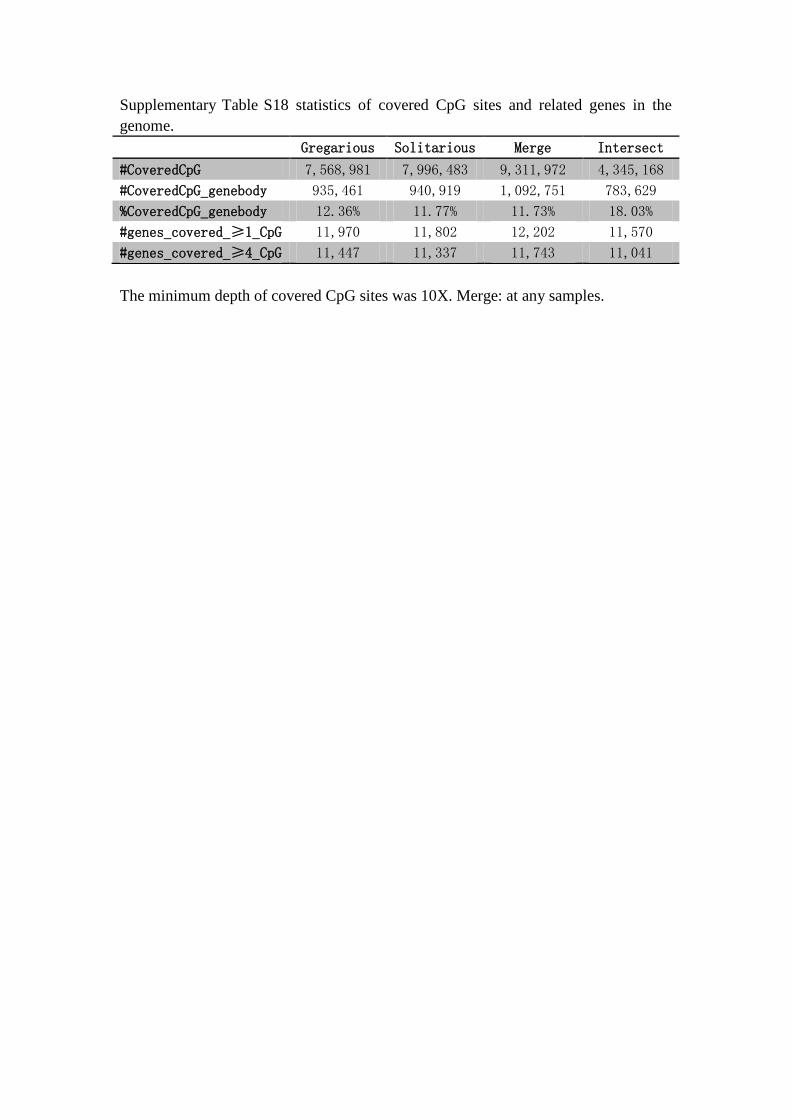
Supplementary Table S18 statistics of covered CpG sites and related genes in the
genome.
Gregarious Solitarious Merge Intersect
#CoveredCpG 7,568,981 7,996,483 9,311,972 4,345,168
#CoveredCpG_genebody 935,461 940,919 1,092,751 783,629
%CoveredCpG_genebody 12.36% 11.77% 11.73% 18.03%
#genes_covered_≥1_CpG 11,970 11,802 12,202 11,570
#genes_covered_≥4_CpG 11,447 11,337 11,743 11,041
The minimum depth of covered CpG sites was 10X. Merge: at any samples.

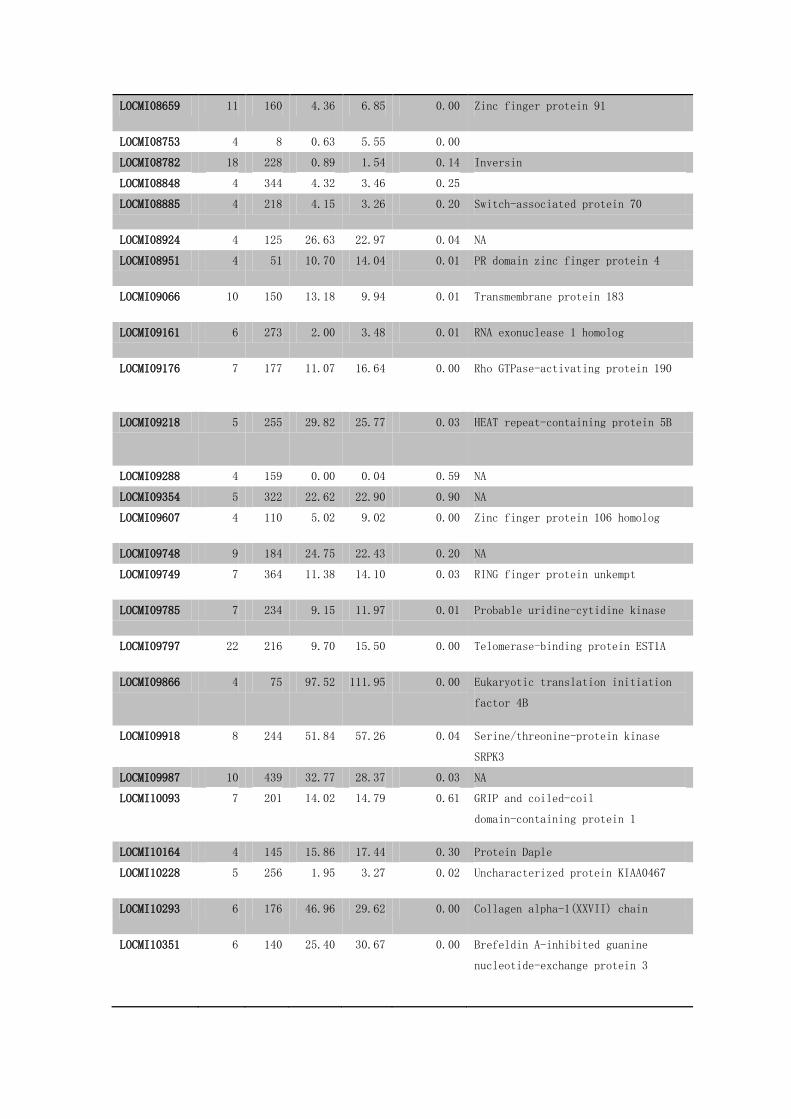
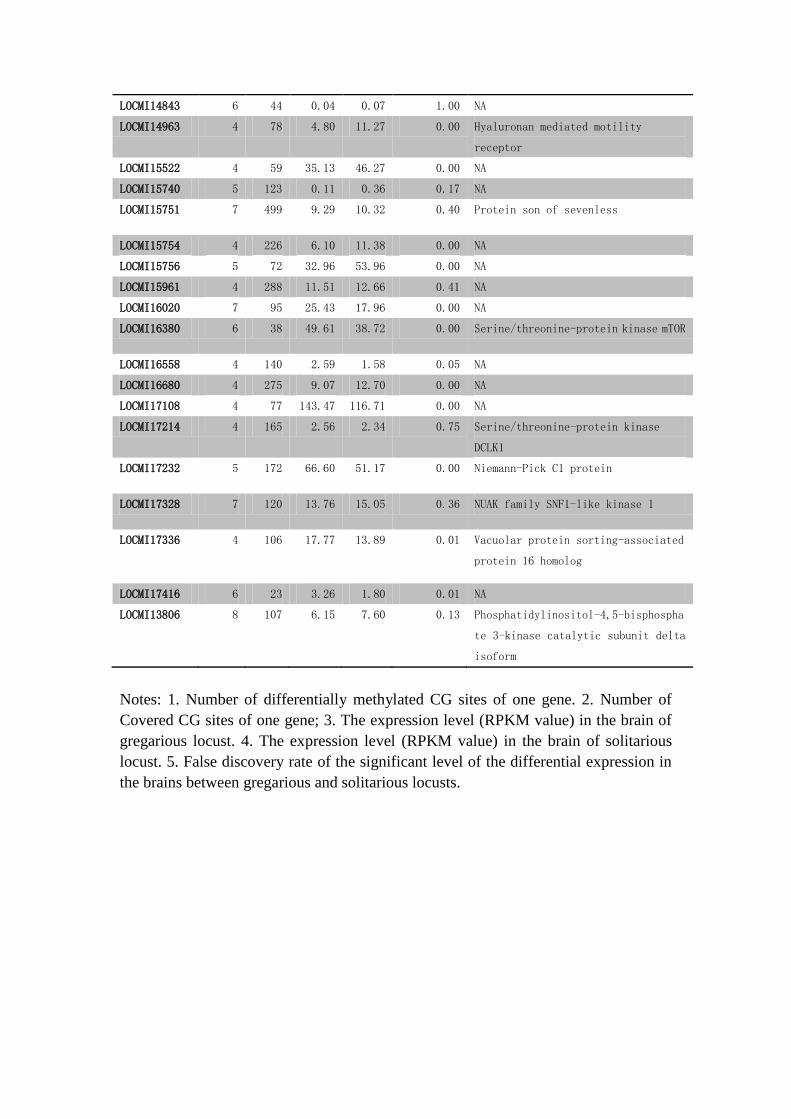
Supplementary Table S19 The 90 differentially methylated genes between the
gregarious and solitarious locust brains.
GeneID 1#DMC
G
2#Cov
CG
3RPKM
G-B
4RPKM
S-B
5Adjpv
(S-B/G-B)
Annotation
LOCMI01552 4 22 6.55 6.28 0.81 Neuroglobin
LOCMI02733 6 24 4.23 4.87 0.42 NA
LOCMI02892 6 87 147.55 94.15 0.00 Mitogen-activated protein-binding
protein-interacting protein homolog
LOCMI03529 4 64 6.98 6.54 0.66 NA
LOCMI03618 7 43 0.40 2.34 0.00 NA
LOCMI03849 4 330 33.39 56.35 0.00 SAP domain-containing
ribonucleoprotein
LOCMI04268 5 534 10.59 11.42 0.54 Kinesin-associated protein 3
LOCMI04715 4 110 1.90 2.28 0.47 NA
LOCMI05065 5 93 28.11 34.45 0.00 Sterile alpha and TIR
motif-containing protein 1
LOCMI05203 4 5 20.73 20.02 0.70 NA
LOCMI05982 5 49 13.11 18.46 0.00 Early endosome antigen 1
LOCMI06392 4 75 14.91 20.56 0.00 MAGUK p55 subfamily member 7
LOCMI06494 12 97 60.17 51.91 0.00 Unc-112-related protein
LOCMI06973 5 274 16.43 18.02 0.32 UPF0614 protein C14orf102
LOCMI07217 5 126 6.41 3.97 0.00 Transmembrane protein 194A
LOCMI07377 9 422 176.42 157.21 0.00 Basement membrane-specific heparan
sulfate proteoglycan core protein
LOCMI07716 4 100 8.53 7.75 0.50 Protein FAN
LOCMI07961 4 99 1.04 3.23 0.00 NA
LOCMI08088 4 189 56.34 41.44 0.00 Probable protein-cysteine
N-palmitoyltransferase porcupine
LOCMI08168 4 15 0.00 2.40 0.00 Ankyrin-2
LOCMI08308 5 233 64.88 56.36 0.00 E3 ubiquitin-protein ligase hyd
LOCMI08333 5 424 16.37 17.61 0.45 Polyhomeotic-like protein 1
LOCMI08659 11 160 4.36 6.85 0.00 Zinc finger protein 91
LOCMI08753 4 8 0.63 5.55 0.00
LOCMI08782 18 228 0.89 1.54 0.14 Inversin
LOCMI08848 4 344 4.32 3.46 0.25
LOCMI08885 4 218 4.15 3.26 0.20 Switch-associated protein 70
LOCMI08924 4 125 26.63 22.97 0.04 NA
LOCMI08951 4 51 10.70 14.04 0.01 PR domain zinc finger protein 4
LOCMI09066 10 150 13.18 9.94 0.01 Transmembrane protein 183
LOCMI09161 6 273 2.00 3.48 0.01 RNA exonuclease 1 homolog
LOCMI09176 7 177 11.07 16.64 0.00 Rho GTPase-activating protein 190
LOCMI09218 5 255 29.82 25.77 0.03 HEAT repeat-containing protein 5B
LOCMI09288 4 159 0.00 0.04 0.59 NA
LOCMI09354 5 322 22.62 22.90 0.90 NA
LOCMI09607 4 110 5.02 9.02 0.00 Zinc finger protein 106 homolog
LOCMI09748 9 184 24.75 22.43 0.20 NA
LOCMI09749 7 364 11.38 14.10 0.03 RING finger protein unkempt
LOCMI09785 7 234 9.15 11.97 0.01 Probable uridine-cytidine kinase
LOCMI09797 22 216 9.70 15.50 0.00 Telomerase-binding protein EST1A
LOCMI09866 4 75 97.52 111.95 0.00 Eukaryotic translation initiation
factor 4B
LOCMI09918 8 244 51.84 57.26 0.04 Serine/threonine-protein kinase
SRPK3
LOCMI09987 10 439 32.77 28.37 0.03 NA
LOCMI10093 7 201 14.02 14.79 0.61 GRIP and coiled-coil
domain-containing protein 1
LOCMI10164 4 145 15.86 17.44 0.30 Protein Daple
LOCMI10228 5 256 1.95 3.27 0.02 Uncharacterized protein KIAA0467
LOCMI10293 6 176 46.96 29.62 0.00 Collagen alpha-1(XXVII) chain
LOCMI10351 6 140 25.40 30.67 0.00 Brefeldin A-inhibited guanine
nucleotide-exchange protein 3

LOCMI10509 5 60 17.58 12.03 0.00 ATP-binding cassette sub-family D
member 3
LOCMI10788 4 58 1.76 1.15 0.18 Tubulin glycylase 3B
LOCMI11004 9 115 43.14 31.20 0.00 Phosphatidylinositol glycan anchor
biosynthesis class U protein
LOCMI11005 8 51 9.64 12.00 0.05 Ribosome biogenesis protein BOP1
homolog
LOCMI11060 5 68 4.41 4.15 0.77 Ankyrin-2
LOCMI11711 5 586 8.87 7.10 0.09 Ubiquitin-protein ligase E3B
LOCMI12126 4 73 3.63 5.64 0.01 Uncharacterized protein C10orf118
homolog
LOCMI12132 5 55 5.47 8.75 0.00 Protein FAM91A1
LOCMI12604 4 25 0.42 0.04 0.04 Putative ankyrin repeat protein
RBE_0921
LOCMI12740 4 210 0.58 1.25 0.04
LOCMI12853 5 142 42.90 45.55 0.30 Phosphatidylinositol-4-phosphate
5-kinase type-1 alpha
LOCMI13295 4 80 0.00 0.00 1.00 Sialin OS=Homo sapiens
LOCMI13328 4 119 29.86 31.06 0.58 Calcium-binding and coiled-coil
domain-containing protein 2
LOCMI13357 4 95 29.17 39.62 0.00 Endophilin-B1
LOCMI13712 4 300 43.42 40.68 0.26 Glycyl-tRNA synthetase
LOCMI13714 6 358 2.82 3.99 0.08 NA
LOCMI13789 5 76 10.96 13.58 0.04 Probable phospholipid-transporting
ATPase IA
LOCMI13989 4 101 0.59 0.05 0.00 Netrin-G1 ligand
LOCMI14004 4 19 9.60 17.88 0.00 Serine--pyruvate aminotransferase,
mitochondrial
LOCMI14187 4 145 22.85 21.61 0.51 Polyphosphoinositide phosphatase
LOCMI14270 4 41 104.11 97.50 0.07 Dynein heavy chain, cytoplasmic
LOCMI14289 4 85 4.18 6.25 0.01 Dedicator of cytokinesis protein 7
LOCMI14667 11 102 4.75 4.87 0.92 Aladin
LOCMI14843 6 44 0.04 0.07 1.00 NA
LOCMI14963 4 78 4.80 11.27 0.00 Hyaluronan mediated motility
receptor
LOCMI15522 4 59 35.13 46.27 0.00 NA
LOCMI15740 5 123 0.11 0.36 0.17 NA
LOCMI15751 7 499 9.29 10.32 0.40 Protein son of sevenless
LOCMI15754 4 226 6.10 11.38 0.00 NA
LOCMI15756 5 72 32.96 53.96 0.00 NA
LOCMI15961 4 288 11.51 12.66 0.41 NA
LOCMI16020 7 95 25.43 17.96 0.00 NA
LOCMI16380 6 38 49.61 38.72 0.00 Serine/threonine-protein kinase mTOR
LOCMI16558 4 140 2.59 1.58 0.05 NA
LOCMI16680 4 275 9.07 12.70 0.00 NA
LOCMI17108 4 77 143.47 116.71 0.00 NA
LOCMI17214 4 165 2.56 2.34 0.75 Serine/threonine-protein kinase
DCLK1
LOCMI17232 5 172 66.60 51.17 0.00 Niemann-Pick C1 protein
LOCMI17328 7 120 13.76 15.05 0.36 NUAK family SNF1-like kinase 1
LOCMI17336 4 106 17.77 13.89 0.01 Vacuolar protein sorting-associated
protein 16 homolog
LOCMI17416 6 23 3.26 1.80 0.01 NA
LOCMI13806 8 107 6.15 7.60 0.13 Phosphatidylinositol-4,5-bisphospha
te 3-kinase catalytic subunit delta
isoform
Notes: 1. Number of differentially methylated CG sites of one gene. 2. Number of
Covered CG sites of one gene; 3. The expression level (RPKM value) in the brain of
gregarious locust. 4. The expression level (RPKM value) in the brain of solitarious
locust. 5. False discovery rate of the significant level of the differential expression in
the brains between gregarious and solitarious locusts.
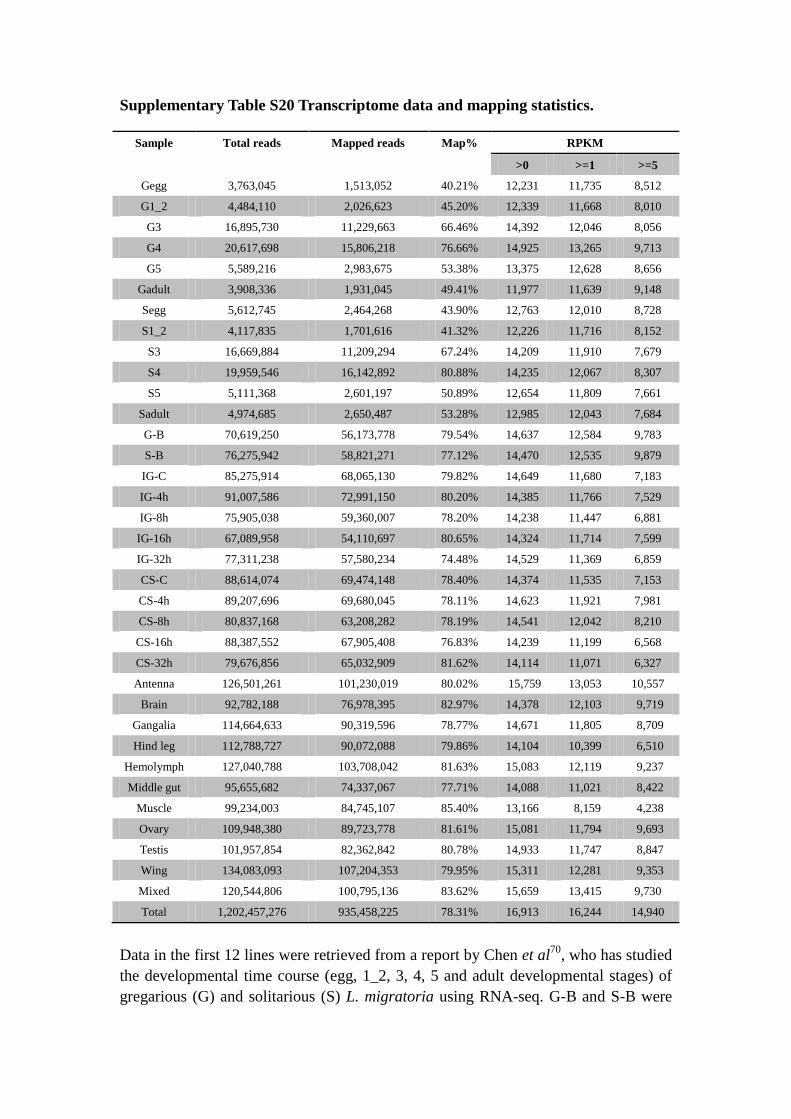
Supplementary Table S20 Transcriptome data and mapping statistics.
Sample Total reads Mapped reads Map% RPKM
>0 >=1 >=5
Gegg 3,763,045 1,513,052 40.21% 12,231 11,735 8,512
G1_2 4,484,110 2,026,623 45.20% 12,339 11,668 8,010
G3 16,895,730 11,229,663 66.46% 14,392 12,046 8,056
G4 20,617,698 15,806,218 76.66% 14,925 13,265 9,713
G5 5,589,216 2,983,675 53.38% 13,375 12,628 8,656
Gadult 3,908,336 1,931,045 49.41% 11,977 11,639 9,148
Segg 5,612,745 2,464,268 43.90% 12,763 12,010 8,728
S1_2 4,117,835 1,701,616 41.32% 12,226 11,716 8,152
S3 16,669,884 11,209,294 67.24% 14,209 11,910 7,679
S4 19,959,546 16,142,892 80.88% 14,235 12,067 8,307
S5 5,111,368 2,601,197 50.89% 12,654 11,809 7,661
Sadult 4,974,685 2,650,487 53.28% 12,985 12,043 7,684
G-B 70,619,250 56,173,778 79.54% 14,637 12,584 9,783
S-B 76,275,942 58,821,271 77.12% 14,470 12,535 9,879
IG-C 85,275,914 68,065,130 79.82% 14,649 11,680 7,183
IG-4h 91,007,586 72,991,150 80.20% 14,385 11,766 7,529
IG-8h 75,905,038 59,360,007 78.20% 14,238 11,447 6,881
IG-16h 67,089,958 54,110,697 80.65% 14,324 11,714 7,599
IG-32h 77,311,238 57,580,234 74.48% 14,529 11,369 6,859
CS-C 88,614,074 69,474,148 78.40% 14,374 11,535 7,153
CS-4h 89,207,696 69,680,045 78.11% 14,623 11,921 7,981
CS-8h 80,837,168 63,208,282 78.19% 14,541 12,042 8,210
CS-16h 88,387,552 67,905,408 76.83% 14,239 11,199 6,568
CS-32h 79,676,856 65,032,909 81.62% 14,114 11,071 6,327
Antenna 126,501,261 101,230,019 80.02% 15,759 13,053 10,557
Brain 92,782,188 76,978,395 82.97% 14,378 12,103 9,719
Gangalia 114,664,633 90,319,596 78.77% 14,671 11,805 8,709
Hind leg 112,788,727 90,072,088 79.86% 14,104 10,399 6,510
Hemolymph 127,040,788 103,708,042 81.63% 15,083 12,119 9,237
Middle gut 95,655,682 74,337,067 77.71% 14,088 11,021 8,422
Muscle 99,234,003 84,745,107 85.40% 13,166 8,159 4,238
Ovary 109,948,380 89,723,778 81.61% 15,081 11,794 9,693
Testis 101,957,854 82,362,842 80.78% 14,933 11,747 8,847
Wing 134,083,093 107,204,353 79.95% 15,311 12,281 9,353
Mixed 120,544,806 100,795,136 83.62% 15,659 13,415 9,730
Total 1,202,457,276 935,458,225 78.31% 16,913 16,244 14,940
Data in the first 12 lines were retrieved from a report by Chen et al70
, who has studied
the developmental time course (egg, 1_2, 3, 4, 5 and adult developmental stages) of
gregarious (G) and solitarious (S) L. migratoria using RNA-seq. G-B and S-B were

RNA-seq data for samples used for the RRBS study. The RNA-seq data of time
course (control, 4, 8, 16 and 32 hour) of isolation of gregarious (IG) and crowding of
solitarious (CS) locusts was produced in this study. Mixed samples from various
organs and developmental stages were used to assist gene annotation.
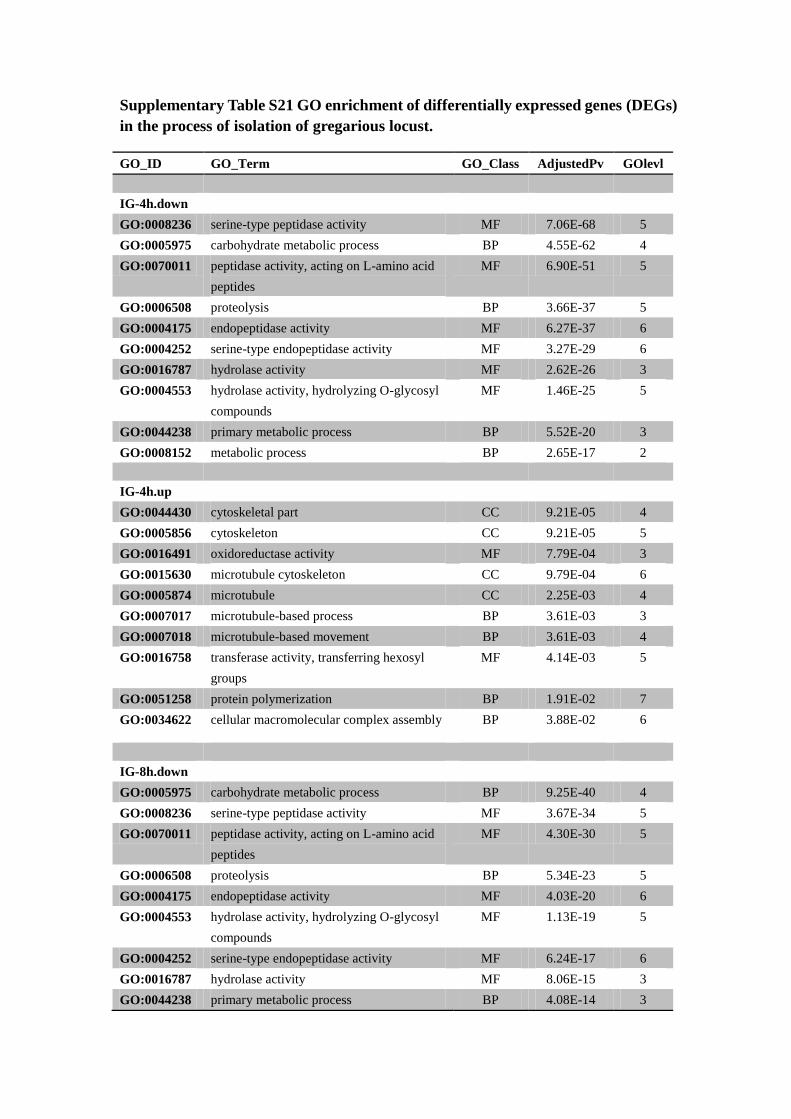
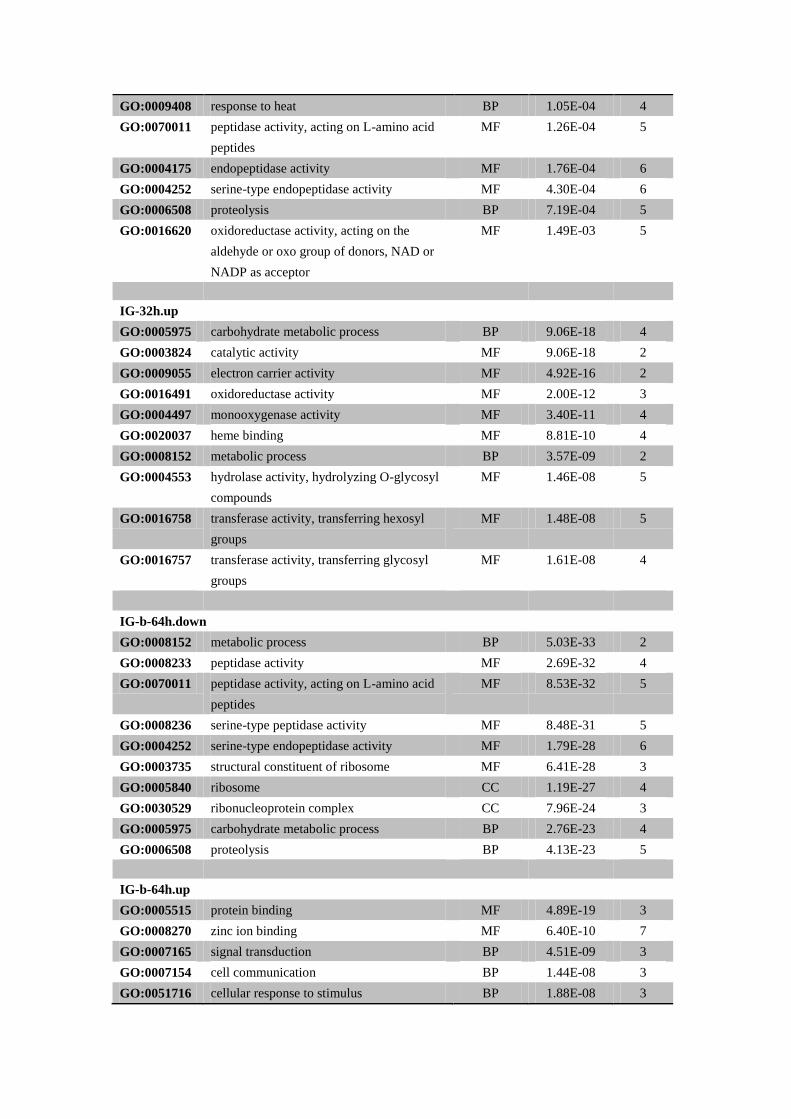
Supplementary Table S21 GO enrichment of differentially expressed genes (DEGs)
in the process of isolation of gregarious locust.
GO_ID GO_Term GO_Class AdjustedPv GOlevl
IG-4h.down
GO:0008236 serine-type peptidase activity MF 7.06E-68 5
GO:0005975 carbohydrate metabolic process BP 4.55E-62 4
GO:0070011 peptidase activity, acting on L-amino acid
peptides
MF 6.90E-51 5
GO:0006508 proteolysis BP 3.66E-37 5
GO:0004175 endopeptidase activity MF 6.27E-37 6
GO:0004252 serine-type endopeptidase activity MF 3.27E-29 6
GO:0016787 hydrolase activity MF 2.62E-26 3
GO:0004553 hydrolase activity, hydrolyzing O-glycosyl
compounds
MF 1.46E-25 5
GO:0044238 primary metabolic process BP 5.52E-20 3
GO:0008152 metabolic process BP 2.65E-17 2
IG-4h.up
GO:0044430 cytoskeletal part CC 9.21E-05 4
GO:0005856 cytoskeleton CC 9.21E-05 5
GO:0016491 oxidoreductase activity MF 7.79E-04 3
GO:0015630 microtubule cytoskeleton CC 9.79E-04 6
GO:0005874 microtubule CC 2.25E-03 4
GO:0007017 microtubule-based process BP 3.61E-03 3
GO:0007018 microtubule-based movement BP 3.61E-03 4
GO:0016758 transferase activity, transferring hexosyl
groups
MF 4.14E-03 5
GO:0051258 protein polymerization BP 1.91E-02 7
GO:0034622 cellular macromolecular complex assembly BP 3.88E-02 6
IG-8h.down
GO:0005975 carbohydrate metabolic process BP 9.25E-40 4
GO:0008236 serine-type peptidase activity MF 3.67E-34 5
GO:0070011 peptidase activity, acting on L-amino acid
peptides
MF 4.30E-30 5
GO:0006508 proteolysis BP 5.34E-23 5
GO:0004175 endopeptidase activity MF 4.03E-20 6
GO:0004553 hydrolase activity, hydrolyzing O-glycosyl
compounds
MF 1.13E-19 5
GO:0004252 serine-type endopeptidase activity MF 6.24E-17 6
GO:0016787 hydrolase activity MF 8.06E-15 3
GO:0044238 primary metabolic process BP 4.08E-14 3

GO:0008061 chitin binding MF 3.47E-10 5
IG-8h.up
GO:0009308 amine metabolic process BP 1.31E-11 4
GO:0005976 polysaccharide metabolic process BP 1.32E-10 4
GO:0006022 aminoglycan metabolic process BP 1.22E-09 5
GO:0008061 chitin binding MF 3.45E-08 5
GO:0006030 chitin metabolic process BP 3.15E-07 6
GO:0005975 carbohydrate metabolic process BP 3.15E-07 4
GO:0005576 extracellular region CC 1.60E-05 2
GO:0016491 oxidoreductase activity MF 6.52E-05 3
GO:0006816 calcium ion transport BP 6.52E-05 8
GO:0005262 calcium channel activity MF 2.22E-04 8
IG-16h.down
GO:0004553 hydrolase activity, hydrolyzing O-glycosyl
compounds
MF 2.55E-30 5
GO:0005975 carbohydrate metabolic process BP 2.62E-29 4
GO:0008236 serine-type peptidase activity MF 3.89E-24 5
GO:0004252 serine-type endopeptidase activity MF 2.83E-22 6
GO:0008152 metabolic process BP 1.21E-20 2
GO:0044238 primary metabolic process BP 8.70E-20 3
GO:0008233 peptidase activity MF 1.88E-17 4
GO:0070011 peptidase activity, acting on L-amino acid
peptides
MF 2.88E-17 5
GO:0006508 proteolysis BP 6.49E-11 5
GO:0004175 endopeptidase activity MF 9.92E-11 6
IG-16h.up
GO:0016491 oxidoreductase activity MF 1.55E-06 3
GO:0005856 cytoskeleton CC 1.74E-05 5
GO:0008061 chitin binding MF 1.74E-05 5
GO:0020037 heme binding MF 1.74E-05 4
GO:0042302 structural constituent of cuticle MF 1.74E-05 3
GO:0004601 peroxidase activity MF 1.93E-05 3
GO:0006979 response to oxidative stress BP 1.93E-05 4
GO:0044430 cytoskeletal part CC 2.79E-05 4
GO:0006030 chitin metabolic process BP 5.88E-05 6
GO:0005976 polysaccharide metabolic process BP 1.08E-04 4
IG-32h.down
GO:0005975 carbohydrate metabolic process BP 5.54E-07 4
GO:0009628 response to abiotic stimulus BP 1.51E-06 3
GO:0055114 oxidation-reduction process BP 5.31E-05 3
GO:0016491 oxidoreductase activity MF 5.31E-05 3
GO:0009408 response to heat BP 1.05E-04 4
GO:0070011 peptidase activity, acting on L-amino acid
peptides
MF 1.26E-04 5
GO:0004175 endopeptidase activity MF 1.76E-04 6
GO:0004252 serine-type endopeptidase activity MF 4.30E-04 6
GO:0006508 proteolysis BP 7.19E-04 5
GO:0016620 oxidoreductase activity, acting on the
aldehyde or oxo group of donors, NAD or
NADP as acceptor
MF 1.49E-03 5
IG-32h.up
GO:0005975 carbohydrate metabolic process BP 9.06E-18 4
GO:0003824 catalytic activity MF 9.06E-18 2
GO:0009055 electron carrier activity MF 4.92E-16 2
GO:0016491 oxidoreductase activity MF 2.00E-12 3
GO:0004497 monooxygenase activity MF 3.40E-11 4
GO:0020037 heme binding MF 8.81E-10 4
GO:0008152 metabolic process BP 3.57E-09 2
GO:0004553 hydrolase activity, hydrolyzing O-glycosyl
compounds
MF 1.46E-08 5
GO:0016758 transferase activity, transferring hexosyl
groups
MF 1.48E-08 5
GO:0016757 transferase activity, transferring glycosyl
groups
MF 1.61E-08 4
IG-b-64h.down
GO:0008152 metabolic process BP 5.03E-33 2
GO:0008233 peptidase activity MF 2.69E-32 4
GO:0070011 peptidase activity, acting on L-amino acid
peptides
MF 8.53E-32 5
GO:0008236 serine-type peptidase activity MF 8.48E-31 5
GO:0004252 serine-type endopeptidase activity MF 1.79E-28 6
GO:0003735 structural constituent of ribosome MF 6.41E-28 3
GO:0005840 ribosome CC 1.19E-27 4
GO:0030529 ribonucleoprotein complex CC 7.96E-24 3
GO:0005975 carbohydrate metabolic process BP 2.76E-23 4
GO:0006508 proteolysis BP 4.13E-23 5
IG-b-64h.up
GO:0005515 protein binding MF 4.89E-19 3
GO:0008270 zinc ion binding MF 6.40E-10 7
GO:0007165 signal transduction BP 4.51E-09 3
GO:0007154 cell communication BP 1.44E-08 3
GO:0051716 cellular response to stimulus BP 1.88E-08 3
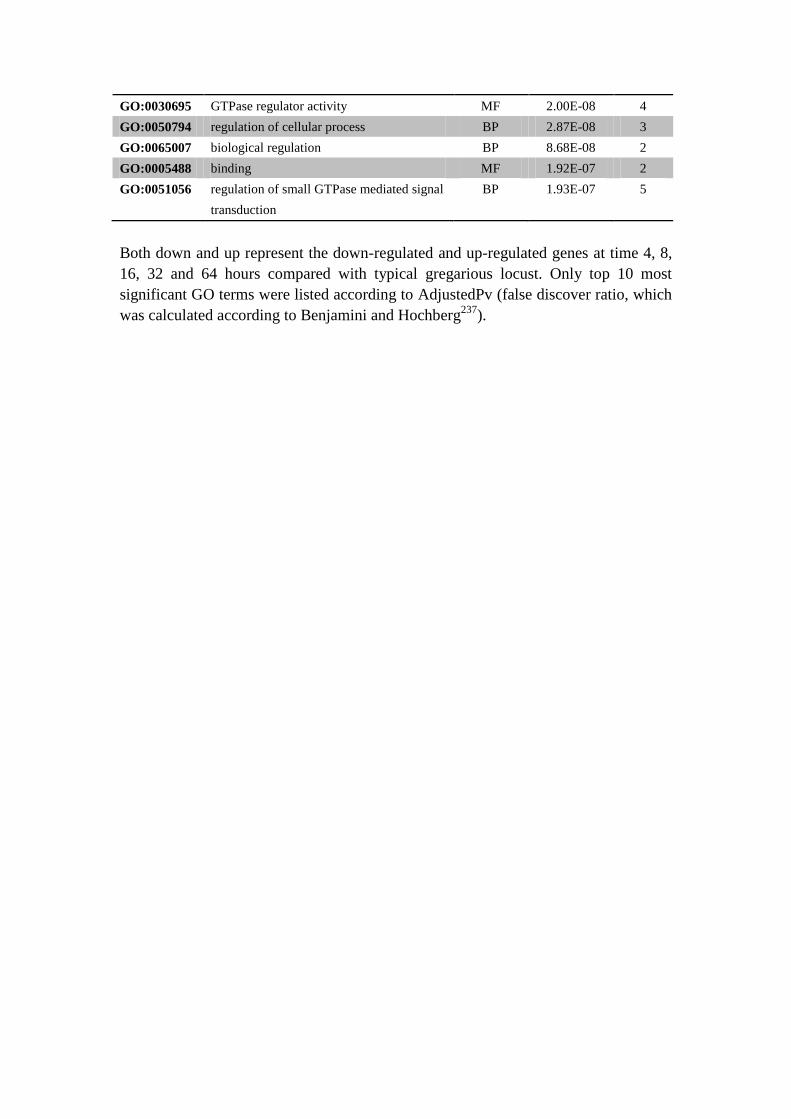
GO:0030695 GTPase regulator activity MF 2.00E-08 4
GO:0050794 regulation of cellular process BP 2.87E-08 3
GO:0065007 biological regulation BP 8.68E-08 2
GO:0005488 binding MF 1.92E-07 2
GO:0051056 regulation of small GTPase mediated signal
transduction
BP 1.93E-07 5
Both down and up represent the down-regulated and up-regulated genes at time 4, 8,
16, 32 and 64 hours compared with typical gregarious locust. Only top 10 most
significant GO terms were listed according to AdjustedPv (false discover ratio, which
was calculated according to Benjamini and Hochberg237
).
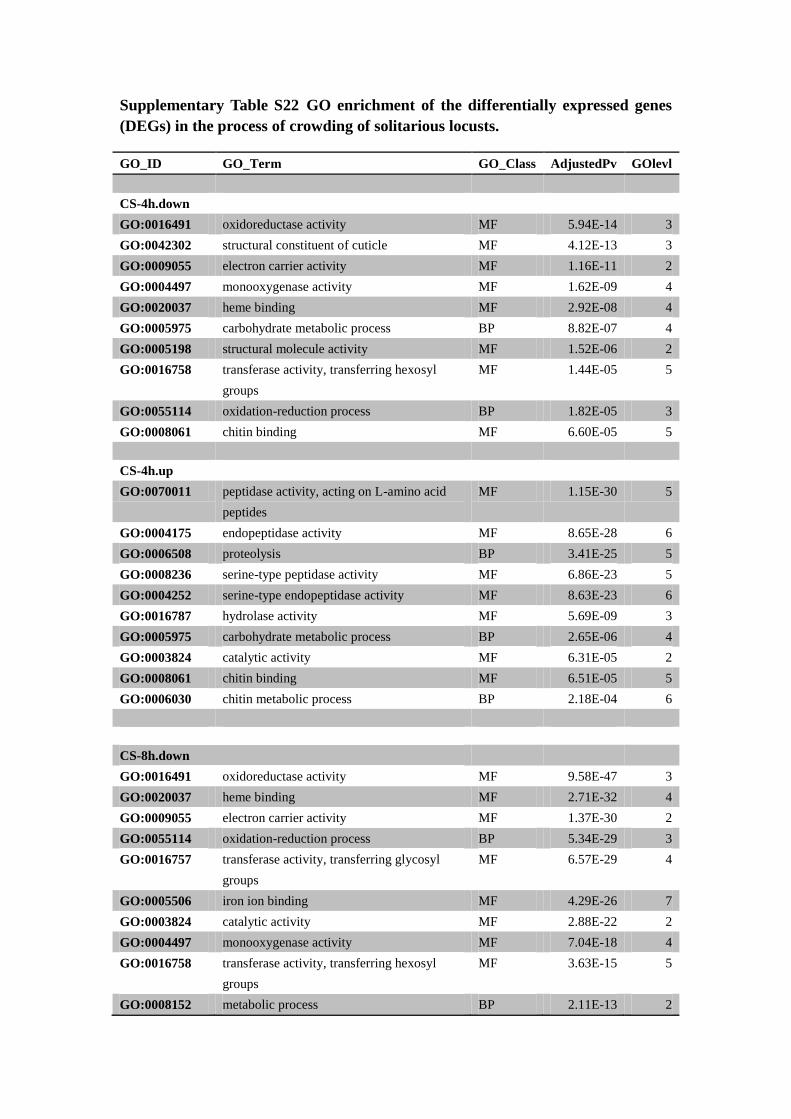
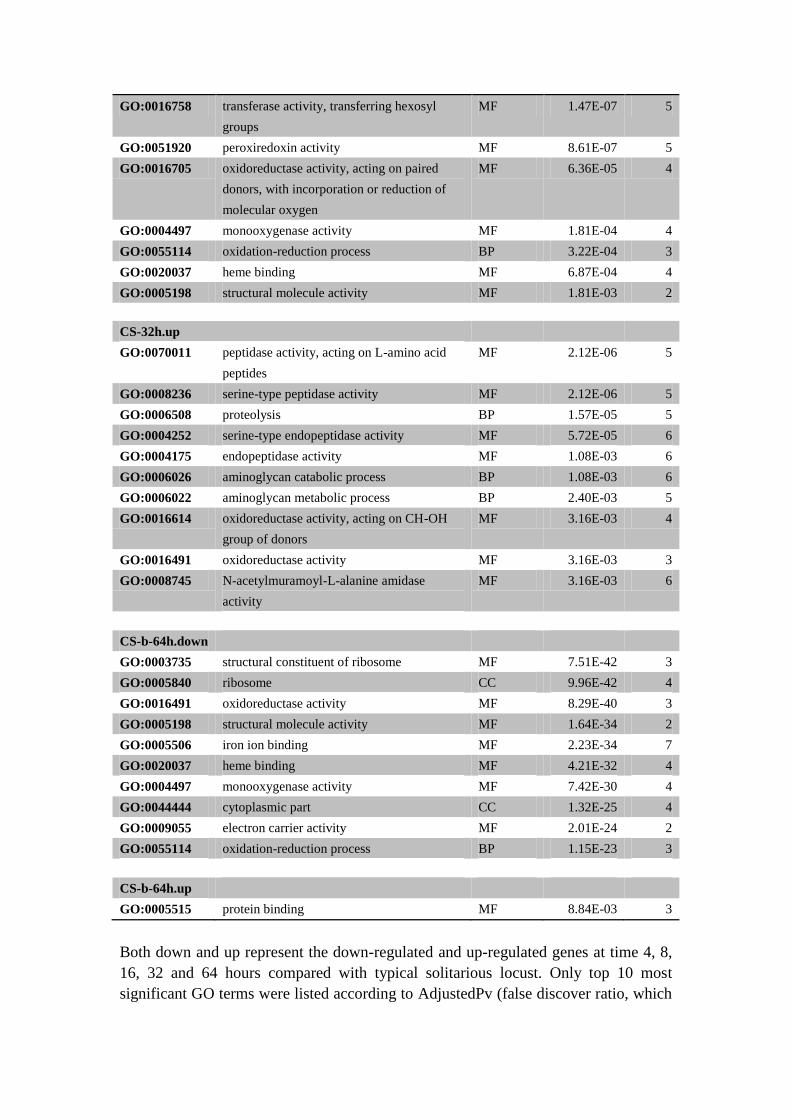
Supplementary Table S22 GO enrichment of the differentially expressed genes
(DEGs) in the process of crowding of solitarious locusts.
GO_ID GO_Term GO_Class AdjustedPv GOlevl
CS-4h.down
GO:0016491 oxidoreductase activity MF 5.94E-14 3
GO:0042302 structural constituent of cuticle MF 4.12E-13 3
GO:0009055 electron carrier activity MF 1.16E-11 2
GO:0004497 monooxygenase activity MF 1.62E-09 4
GO:0020037 heme binding MF 2.92E-08 4
GO:0005975 carbohydrate metabolic process BP 8.82E-07 4
GO:0005198 structural molecule activity MF 1.52E-06 2
GO:0016758 transferase activity, transferring hexosyl
groups
MF 1.44E-05 5
GO:0055114 oxidation-reduction process BP 1.82E-05 3
GO:0008061 chitin binding MF 6.60E-05 5
CS-4h.up
GO:0070011 peptidase activity, acting on L-amino acid
peptides
MF 1.15E-30 5
GO:0004175 endopeptidase activity MF 8.65E-28 6
GO:0006508 proteolysis BP 3.41E-25 5
GO:0008236 serine-type peptidase activity MF 6.86E-23 5
GO:0004252 serine-type endopeptidase activity MF 8.63E-23 6
GO:0016787 hydrolase activity MF 5.69E-09 3
GO:0005975 carbohydrate metabolic process BP 2.65E-06 4
GO:0003824 catalytic activity MF 6.31E-05 2
GO:0008061 chitin binding MF 6.51E-05 5
GO:0006030 chitin metabolic process BP 2.18E-04 6
CS-8h.down
GO:0016491 oxidoreductase activity MF 9.58E-47 3
GO:0020037 heme binding MF 2.71E-32 4
GO:0009055 electron carrier activity MF 1.37E-30 2
GO:0055114 oxidation-reduction process BP 5.34E-29 3
GO:0016757 transferase activity, transferring glycosyl
groups
MF 6.57E-29 4
GO:0005506 iron ion binding MF 4.29E-26 7
GO:0003824 catalytic activity MF 2.88E-22 2
GO:0004497 monooxygenase activity MF 7.04E-18 4
GO:0016758 transferase activity, transferring hexosyl
groups
MF 3.63E-15 5
GO:0008152 metabolic process BP 2.11E-13 2
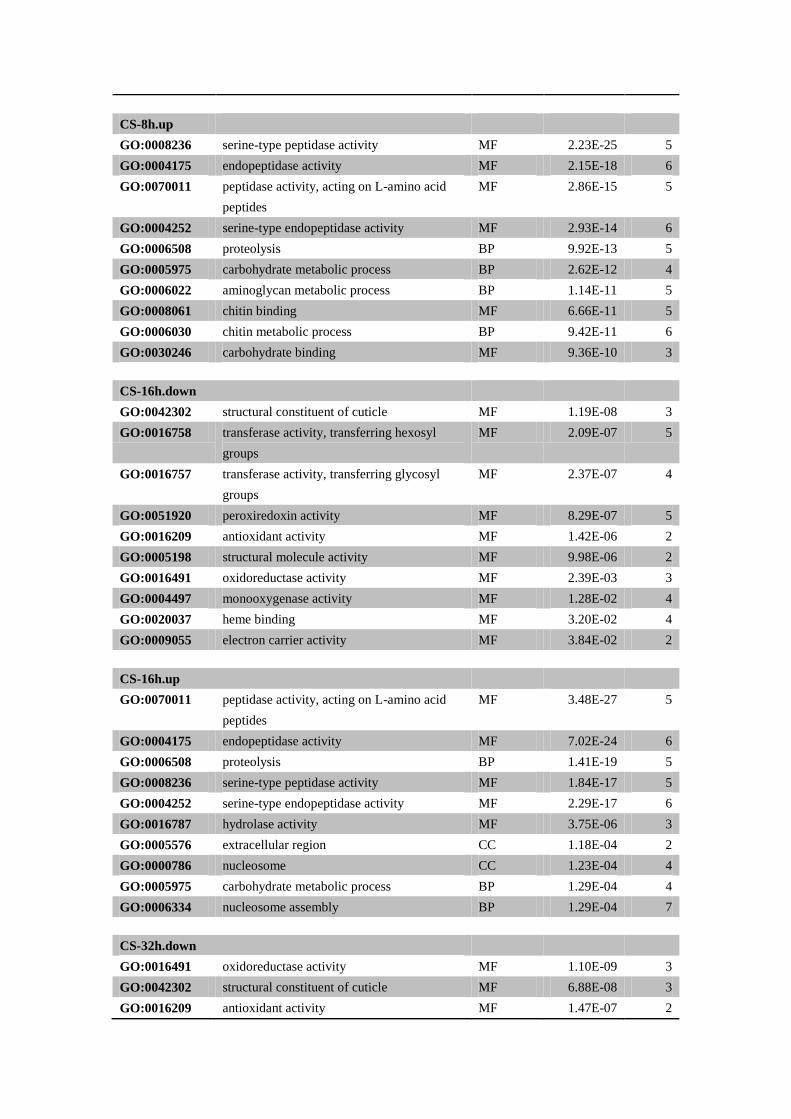
CS-8h.up
GO:0008236 serine-type peptidase activity MF 2.23E-25 5
GO:0004175 endopeptidase activity MF 2.15E-18 6
GO:0070011 peptidase activity, acting on L-amino acid
peptides
MF 2.86E-15 5
GO:0004252 serine-type endopeptidase activity MF 2.93E-14 6
GO:0006508 proteolysis BP 9.92E-13 5
GO:0005975 carbohydrate metabolic process BP 2.62E-12 4
GO:0006022 aminoglycan metabolic process BP 1.14E-11 5
GO:0008061 chitin binding MF 6.66E-11 5
GO:0006030 chitin metabolic process BP 9.42E-11 6
GO:0030246 carbohydrate binding MF 9.36E-10 3
CS-16h.down
GO:0042302 structural constituent of cuticle MF 1.19E-08 3
GO:0016758 transferase activity, transferring hexosyl
groups
MF 2.09E-07 5
GO:0016757 transferase activity, transferring glycosyl
groups
MF 2.37E-07 4
GO:0051920 peroxiredoxin activity MF 8.29E-07 5
GO:0016209 antioxidant activity MF 1.42E-06 2
GO:0005198 structural molecule activity MF 9.98E-06 2
GO:0016491 oxidoreductase activity MF 2.39E-03 3
GO:0004497 monooxygenase activity MF 1.28E-02 4
GO:0020037 heme binding MF 3.20E-02 4
GO:0009055 electron carrier activity MF 3.84E-02 2
CS-16h.up
GO:0070011 peptidase activity, acting on L-amino acid
peptides
MF 3.48E-27 5
GO:0004175 endopeptidase activity MF 7.02E-24 6
GO:0006508 proteolysis BP 1.41E-19 5
GO:0008236 serine-type peptidase activity MF 1.84E-17 5
GO:0004252 serine-type endopeptidase activity MF 2.29E-17 6
GO:0016787 hydrolase activity MF 3.75E-06 3
GO:0005576 extracellular region CC 1.18E-04 2
GO:0000786 nucleosome CC 1.23E-04 4
GO:0005975 carbohydrate metabolic process BP 1.29E-04 4
GO:0006334 nucleosome assembly BP 1.29E-04 7
CS-32h.down
GO:0016491 oxidoreductase activity MF 1.10E-09 3
GO:0042302 structural constituent of cuticle MF 6.88E-08 3
GO:0016209 antioxidant activity MF 1.47E-07 2
GO:0016758 transferase activity, transferring hexosyl
groups
MF 1.47E-07 5
GO:0051920 peroxiredoxin activity MF 8.61E-07 5
GO:0016705 oxidoreductase activity, acting on paired
donors, with incorporation or reduction of
molecular oxygen
MF 6.36E-05 4
GO:0004497 monooxygenase activity MF 1.81E-04 4
GO:0055114 oxidation-reduction process BP 3.22E-04 3
GO:0020037 heme binding MF 6.87E-04 4
GO:0005198 structural molecule activity MF 1.81E-03 2
CS-32h.up
GO:0070011 peptidase activity, acting on L-amino acid
peptides
MF 2.12E-06 5
GO:0008236 serine-type peptidase activity MF 2.12E-06 5
GO:0006508 proteolysis BP 1.57E-05 5
GO:0004252 serine-type endopeptidase activity MF 5.72E-05 6
GO:0004175 endopeptidase activity MF 1.08E-03 6
GO:0006026 aminoglycan catabolic process BP 1.08E-03 6
GO:0006022 aminoglycan metabolic process BP 2.40E-03 5
GO:0016614 oxidoreductase activity, acting on CH-OH
group of donors
MF 3.16E-03 4
GO:0016491 oxidoreductase activity MF 3.16E-03 3
GO:0008745 N-acetylmuramoyl-L-alanine amidase
activity
MF 3.16E-03 6
CS-b-64h.down
GO:0003735 structural constituent of ribosome MF 7.51E-42 3
GO:0005840 ribosome CC 9.96E-42 4
GO:0016491 oxidoreductase activity MF 8.29E-40 3
GO:0005198 structural molecule activity MF 1.64E-34 2
GO:0005506 iron ion binding MF 2.23E-34 7
GO:0020037 heme binding MF 4.21E-32 4
GO:0004497 monooxygenase activity MF 7.42E-30 4
GO:0044444 cytoplasmic part CC 1.32E-25 4
GO:0009055 electron carrier activity MF 2.01E-24 2
GO:0055114 oxidation-reduction process BP 1.15E-23 3
CS-b-64h.up
GO:0005515 protein binding MF 8.84E-03 3
Both down and up represent the down-regulated and up-regulated genes at time 4, 8,
16, 32 and 64 hours compared with typical solitarious locust. Only top 10 most
significant GO terms were listed according to AdjustedPv (false discover ratio, which

was calculated according to Benjamini and Hochberg236
).
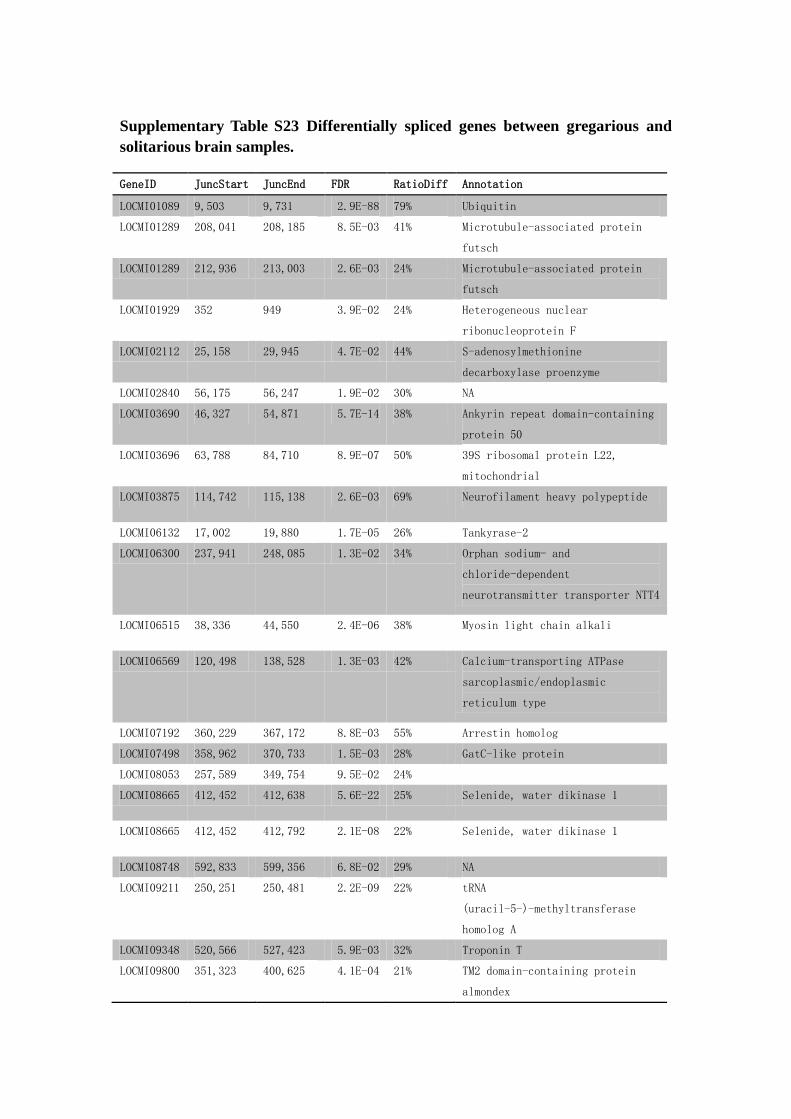
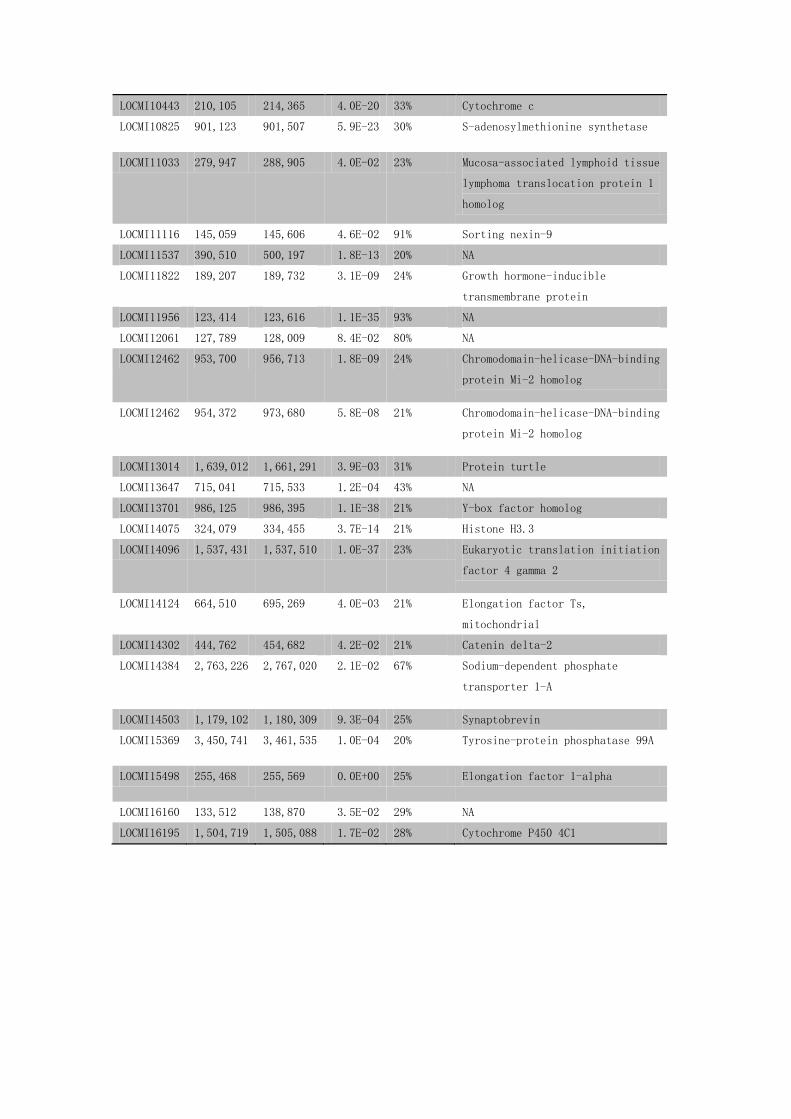
Supplementary Table S23 Differentially spliced genes between gregarious and
solitarious brain samples.
GeneID JuncStart JuncEnd FDR RatioDiff Annotation
LOCMI01089 9,503 9,731 2.9E-88 79% Ubiquitin
LOCMI01289 208,041 208,185 8.5E-03 41% Microtubule-associated protein
futsch
LOCMI01289 212,936 213,003 2.6E-03 24% Microtubule-associated protein
futsch
LOCMI01929 352 949 3.9E-02 24% Heterogeneous nuclear
ribonucleoprotein F
LOCMI02112 25,158 29,945 4.7E-02 44% S-adenosylmethionine
decarboxylase proenzyme
LOCMI02840 56,175 56,247 1.9E-02 30% NA
LOCMI03690 46,327 54,871 5.7E-14 38% Ankyrin repeat domain-containing
protein 50
LOCMI03696 63,788 84,710 8.9E-07 50% 39S ribosomal protein L22,
mitochondrial
LOCMI03875 114,742 115,138 2.6E-03 69% Neurofilament heavy polypeptide
LOCMI06132 17,002 19,880 1.7E-05 26% Tankyrase-2
LOCMI06300 237,941 248,085 1.3E-02 34% Orphan sodium- and
chloride-dependent
neurotransmitter transporter NTT4
LOCMI06515 38,336 44,550 2.4E-06 38% Myosin light chain alkali
LOCMI06569 120,498 138,528 1.3E-03 42% Calcium-transporting ATPase
sarcoplasmic/endoplasmic
reticulum type
LOCMI07192 360,229 367,172 8.8E-03 55% Arrestin homolog
LOCMI07498 358,962 370,733 1.5E-03 28% GatC-like protein
LOCMI08053 257,589 349,754 9.5E-02 24%
LOCMI08665 412,452 412,638 5.6E-22 25% Selenide, water dikinase 1
LOCMI08665 412,452 412,792 2.1E-08 22% Selenide, water dikinase 1
LOCMI08748 592,833 599,356 6.8E-02 29% NA
LOCMI09211 250,251 250,481 2.2E-09 22% tRNA
(uracil-5-)-methyltransferase
homolog A
LOCMI09348 520,566 527,423 5.9E-03 32% Troponin T
LOCMI09800 351,323 400,625 4.1E-04 21% TM2 domain-containing protein
almondex
LOCMI10443 210,105 214,365 4.0E-20 33% Cytochrome c
LOCMI10825 901,123 901,507 5.9E-23 30% S-adenosylmethionine synthetase
LOCMI11033 279,947 288,905 4.0E-02 23% Mucosa-associated lymphoid tissue
lymphoma translocation protein 1
homolog
LOCMI11116 145,059 145,606 4.6E-02 91% Sorting nexin-9
LOCMI11537 390,510 500,197 1.8E-13 20% NA
LOCMI11822 189,207 189,732 3.1E-09 24% Growth hormone-inducible
transmembrane protein
LOCMI11956 123,414 123,616 1.1E-35 93% NA
LOCMI12061 127,789 128,009 8.4E-02 80% NA
LOCMI12462 953,700 956,713 1.8E-09 24% Chromodomain-helicase-DNA-binding
protein Mi-2 homolog
LOCMI12462 954,372 973,680 5.8E-08 21% Chromodomain-helicase-DNA-binding
protein Mi-2 homolog
LOCMI13014 1,639,012 1,661,291 3.9E-03 31% Protein turtle
LOCMI13647 715,041 715,533 1.2E-04 43% NA
LOCMI13701 986,125 986,395 1.1E-38 21% Y-box factor homolog
LOCMI14075 324,079 334,455 3.7E-14 21% Histone H3.3
LOCMI14096 1,537,431 1,537,510 1.0E-37 23% Eukaryotic translation initiation
factor 4 gamma 2
LOCMI14124 664,510 695,269 4.0E-03 21% Elongation factor Ts,
mitochondrial
LOCMI14302 444,762 454,682 4.2E-02 21% Catenin delta-2
LOCMI14384 2,763,226 2,767,020 2.1E-02 67% Sodium-dependent phosphate
transporter 1-A
LOCMI14503 1,179,102 1,180,309 9.3E-04 25% Synaptobrevin
LOCMI15369 3,450,741 3,461,535 1.0E-04 20% Tyrosine-protein phosphatase 99A
LOCMI15498 255,468 255,569 0.0E+00 25% Elongation factor 1-alpha
LOCMI16160 133,512 138,870 3.5E-02 29% NA
LOCMI16195 1,504,719 1,505,088 1.7E-02 28% Cytochrome P450 4C1
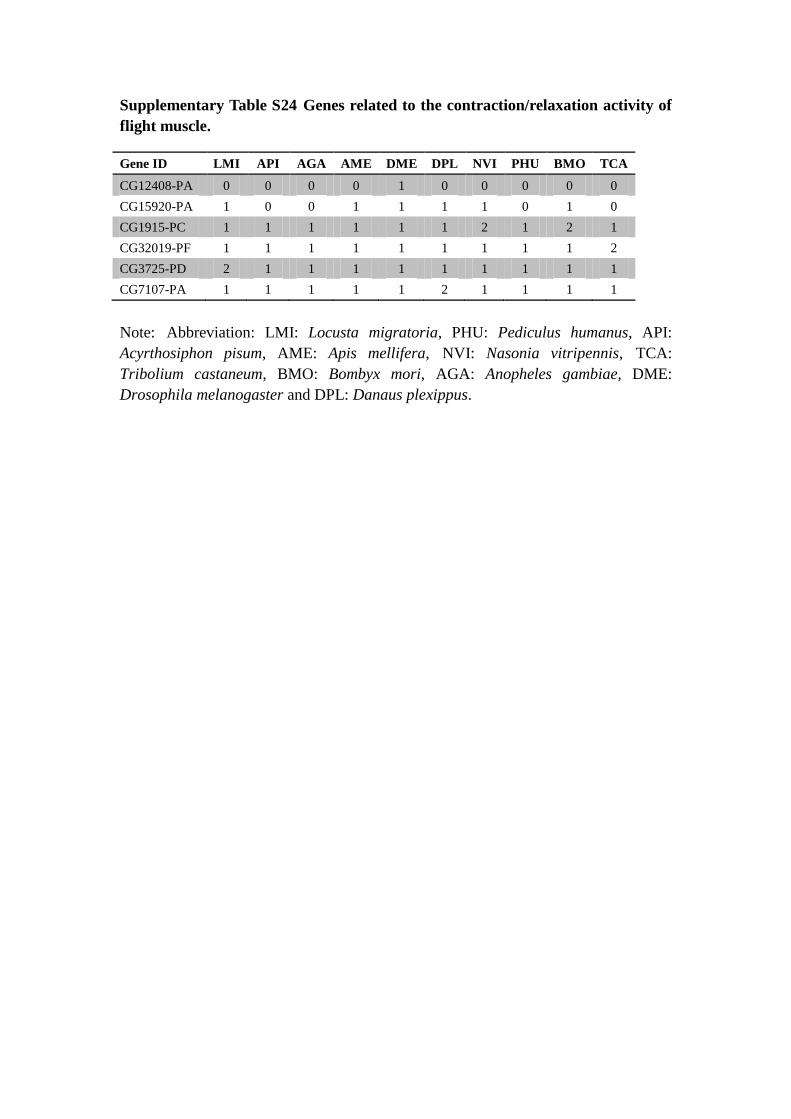
Supplementary Table S24 Genes related to the contraction/relaxation activity of
flight muscle.
Gene ID LMI API AGA AME DME DPL NVI PHU BMO TCA
CG12408-PA 0 0 0 0 1 0 0 0 0 0
CG15920-PA 1 0 0 1 1 1 1 0 1 0
CG1915-PC 1 1 1 1 1 1 2 1 2 1
CG32019-PF 1 1 1 1 1 1 1 1 1 2
CG3725-PD 2 1 1 1 1 1 1 1 1 1
CG7107-PA 1 1 1 1 1 2 1 1 1 1
Note: Abbreviation: LMI: Locusta migratoria, PHU: Pediculus humanus, API:
Acyrthosiphon pisum, AME: Apis mellifera, NVI: Nasonia vitripennis, TCA:
Tribolium castaneum, BMO: Bombyx mori, AGA: Anopheles gambiae, DME:
Drosophila melanogaster and DPL: Danaus plexippus.
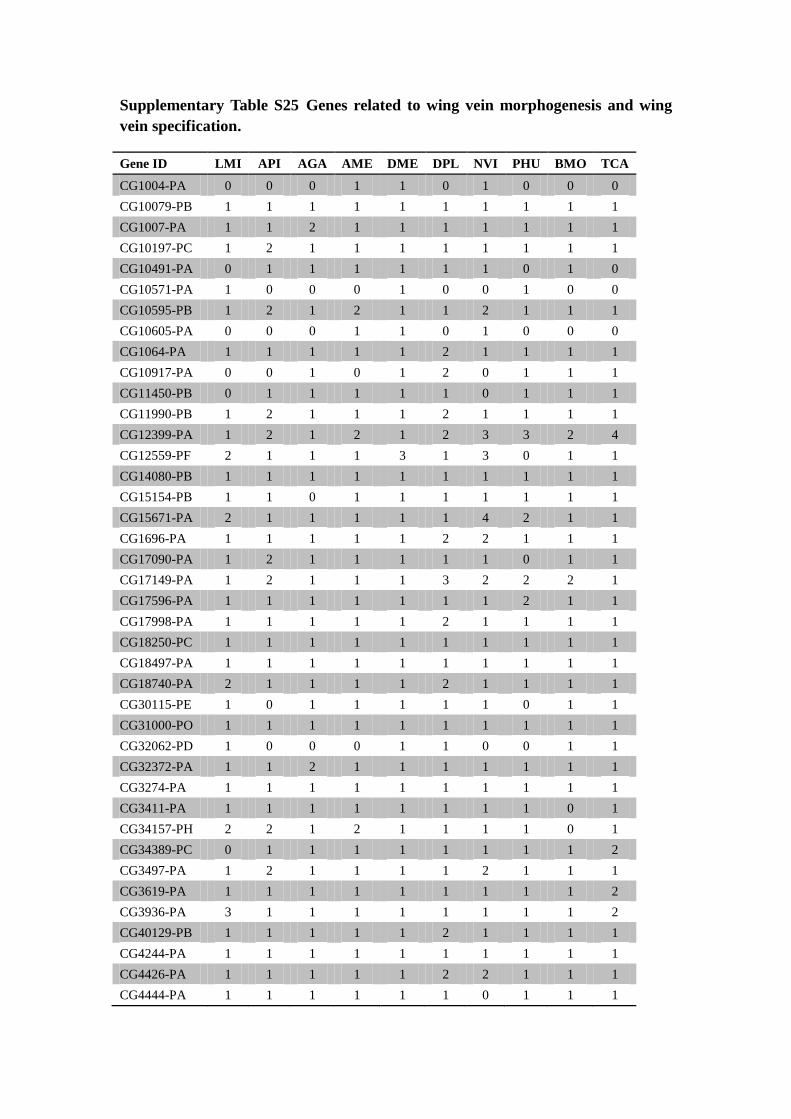
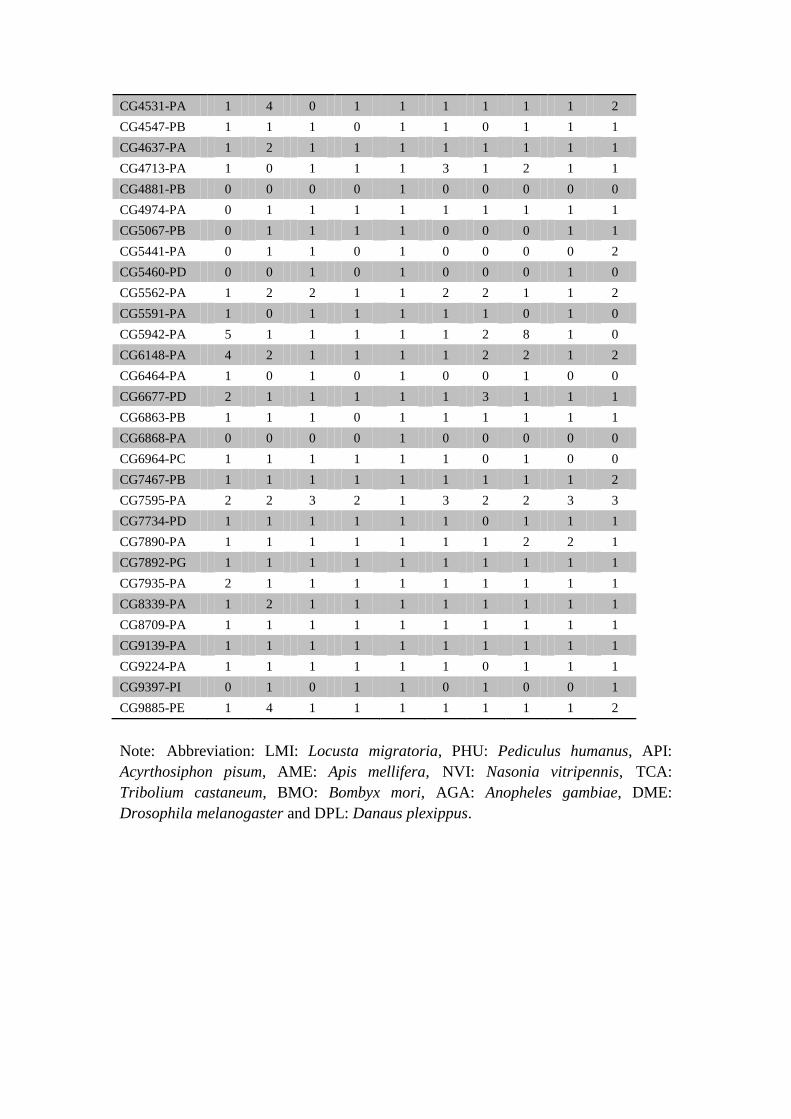
Supplementary Table S25 Genes related to wing vein morphogenesis and wing
vein specification.
Gene ID LMI API AGA AME DME DPL NVI PHU BMO TCA
CG1004-PA 0 0 0 1 1 0 1 0 0 0
CG10079-PB 1 1 1 1 1 1 1 1 1 1
CG1007-PA 1 1 2 1 1 1 1 1 1 1
CG10197-PC 1 2 1 1 1 1 1 1 1 1
CG10491-PA 0 1 1 1 1 1 1 0 1 0
CG10571-PA 1 0 0 0 1 0 0 1 0 0
CG10595-PB 1 2 1 2 1 1 2 1 1 1
CG10605-PA 0 0 0 1 1 0 1 0 0 0
CG1064-PA 1 1 1 1 1 2 1 1 1 1
CG10917-PA 0 0 1 0 1 2 0 1 1 1
CG11450-PB 0 1 1 1 1 1 0 1 1 1
CG11990-PB 1 2 1 1 1 2 1 1 1 1
CG12399-PA 1 2 1 2 1 2 3 3 2 4
CG12559-PF 2 1 1 1 3 1 3 0 1 1
CG14080-PB 1 1 1 1 1 1 1 1 1 1
CG15154-PB 1 1 0 1 1 1 1 1 1 1
CG15671-PA 2 1 1 1 1 1 4 2 1 1
CG1696-PA 1 1 1 1 1 2 2 1 1 1
CG17090-PA 1 2 1 1 1 1 1 0 1 1
CG17149-PA 1 2 1 1 1 3 2 2 2 1
CG17596-PA 1 1 1 1 1 1 1 2 1 1
CG17998-PA 1 1 1 1 1 2 1 1 1 1
CG18250-PC 1 1 1 1 1 1 1 1 1 1
CG18497-PA 1 1 1 1 1 1 1 1 1 1
CG18740-PA 2 1 1 1 1 2 1 1 1 1
CG30115-PE 1 0 1 1 1 1 1 0 1 1
CG31000-PO 1 1 1 1 1 1 1 1 1 1
CG32062-PD 1 0 0 0 1 1 0 0 1 1
CG32372-PA 1 1 2 1 1 1 1 1 1 1
CG3274-PA 1 1 1 1 1 1 1 1 1 1
CG3411-PA 1 1 1 1 1 1 1 1 0 1
CG34157-PH 2 2 1 2 1 1 1 1 0 1
CG34389-PC 0 1 1 1 1 1 1 1 1 2
CG3497-PA 1 2 1 1 1 1 2 1 1 1
CG3619-PA 1 1 1 1 1 1 1 1 1 2
CG3936-PA 3 1 1 1 1 1 1 1 1 2
CG40129-PB 1 1 1 1 1 2 1 1 1 1
CG4244-PA 1 1 1 1 1 1 1 1 1 1
CG4426-PA 1 1 1 1 1 2 2 1 1 1
CG4444-PA 1 1 1 1 1 1 0 1 1 1
CG4531-PA 1 4 0 1 1 1 1 1 1 2
CG4547-PB 1 1 1 0 1 1 0 1 1 1
CG4637-PA 1 2 1 1 1 1 1 1 1 1
CG4713-PA 1 0 1 1 1 3 1 2 1 1
CG4881-PB 0 0 0 0 1 0 0 0 0 0
CG4974-PA 0 1 1 1 1 1 1 1 1 1
CG5067-PB 0 1 1 1 1 0 0 0 1 1
CG5441-PA 0 1 1 0 1 0 0 0 0 2
CG5460-PD 0 0 1 0 1 0 0 0 1 0
CG5562-PA 1 2 2 1 1 2 2 1 1 2
CG5591-PA 1 0 1 1 1 1 1 0 1 0
CG5942-PA 5 1 1 1 1 1 2 8 1 0
CG6148-PA 4 2 1 1 1 1 2 2 1 2
CG6464-PA 1 0 1 0 1 0 0 1 0 0
CG6677-PD 2 1 1 1 1 1 3 1 1 1
CG6863-PB 1 1 1 0 1 1 1 1 1 1
CG6868-PA 0 0 0 0 1 0 0 0 0 0
CG6964-PC 1 1 1 1 1 1 0 1 0 0
CG7467-PB 1 1 1 1 1 1 1 1 1 2
CG7595-PA 2 2 3 2 1 3 2 2 3 3
CG7734-PD 1 1 1 1 1 1 0 1 1 1
CG7890-PA 1 1 1 1 1 1 1 2 2 1
CG7892-PG 1 1 1 1 1 1 1 1 1 1
CG7935-PA 2 1 1 1 1 1 1 1 1 1
CG8339-PA 1 2 1 1 1 1 1 1 1 1
CG8709-PA 1 1 1 1 1 1 1 1 1 1
CG9139-PA 1 1 1 1 1 1 1 1 1 1
CG9224-PA 1 1 1 1 1 1 0 1 1 1
CG9397-PI 0 1 0 1 1 0 1 0 0 1
CG9885-PE 1 4 1 1 1 1 1 1 1 2
Note: Abbreviation: LMI: Locusta migratoria, PHU: Pediculus humanus, API:
Acyrthosiphon pisum, AME: Apis mellifera, NVI: Nasonia vitripennis, TCA:
Tribolium castaneum, BMO: Bombyx mori, AGA: Anopheles gambiae, DME:
Drosophila melanogaster and DPL: Danaus plexippus.
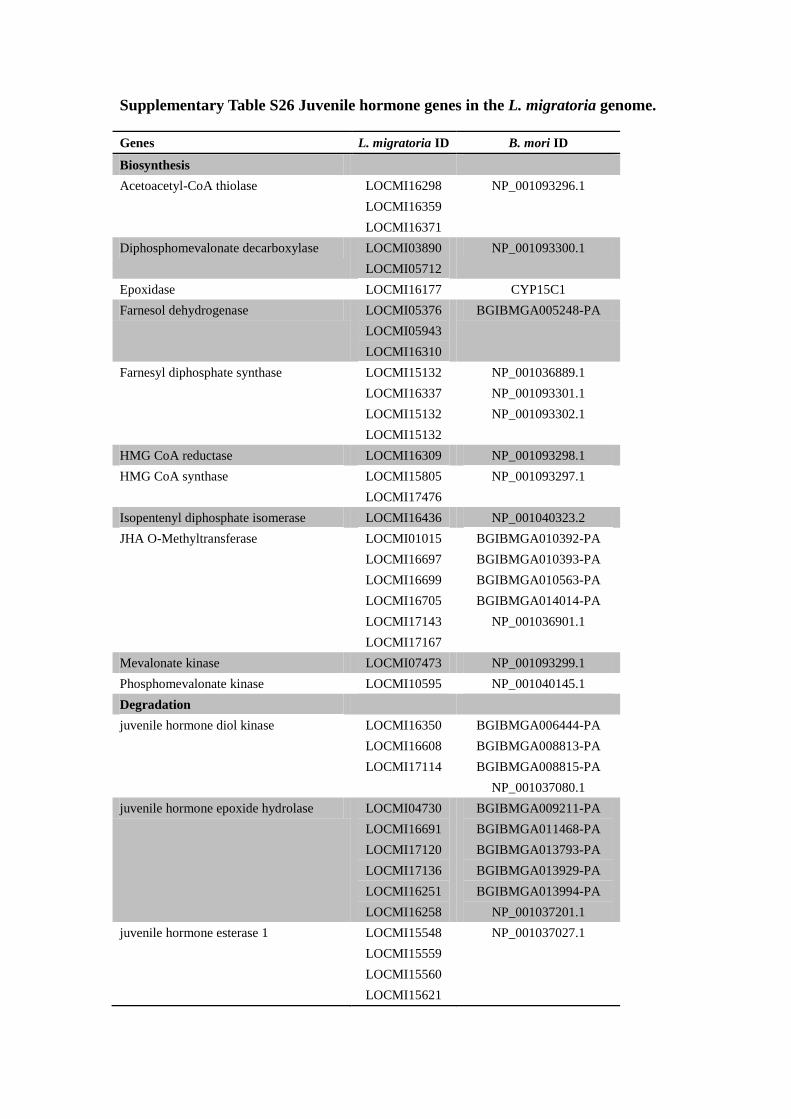
Supplementary Table S26 Juvenile hormone genes in the L. migratoria genome.
Genes L. migratoria ID B. mori ID
Biosynthesis
Acetoacetyl-CoA thiolase LOCMI16298
LOCMI16359
LOCMI16371
NP_001093296.1
Diphosphomevalonate decarboxylase LOCMI03890
LOCMI05712
NP_001093300.1
Epoxidase LOCMI16177 CYP15C1
Farnesol dehydrogenase LOCMI05376
LOCMI05943
LOCMI16310
BGIBMGA005248-PA
Farnesyl diphosphate synthase LOCMI15132
LOCMI16337
LOCMI15132
LOCMI15132
NP_001036889.1
NP_001093301.1
NP_001093302.1
HMG CoA reductase LOCMI16309 NP_001093298.1
HMG CoA synthase LOCMI15805
LOCMI17476
NP_001093297.1
Isopentenyl diphosphate isomerase LOCMI16436 NP_001040323.2
JHA O-Methyltransferase LOCMI01015
LOCMI16697
LOCMI16699
LOCMI16705
LOCMI17143
LOCMI17167
BGIBMGA010392-PA
BGIBMGA010393-PA
BGIBMGA010563-PA
BGIBMGA014014-PA
NP_001036901.1
Mevalonate kinase LOCMI07473 NP_001093299.1
Phosphomevalonate kinase LOCMI10595 NP_001040145.1
Degradation
juvenile hormone diol kinase LOCMI16350
LOCMI16608
LOCMI17114
BGIBMGA006444-PA
BGIBMGA008813-PA
BGIBMGA008815-PA
NP_001037080.1
juvenile hormone epoxide hydrolase LOCMI04730
LOCMI16691
LOCMI17120
LOCMI17136
LOCMI16251
LOCMI16258
BGIBMGA009211-PA
BGIBMGA011468-PA
BGIBMGA013793-PA
BGIBMGA013929-PA
BGIBMGA013994-PA
NP_001037201.1
juvenile hormone esterase 1 LOCMI15548
LOCMI15559
LOCMI15560
LOCMI15621
NP_001037027.1
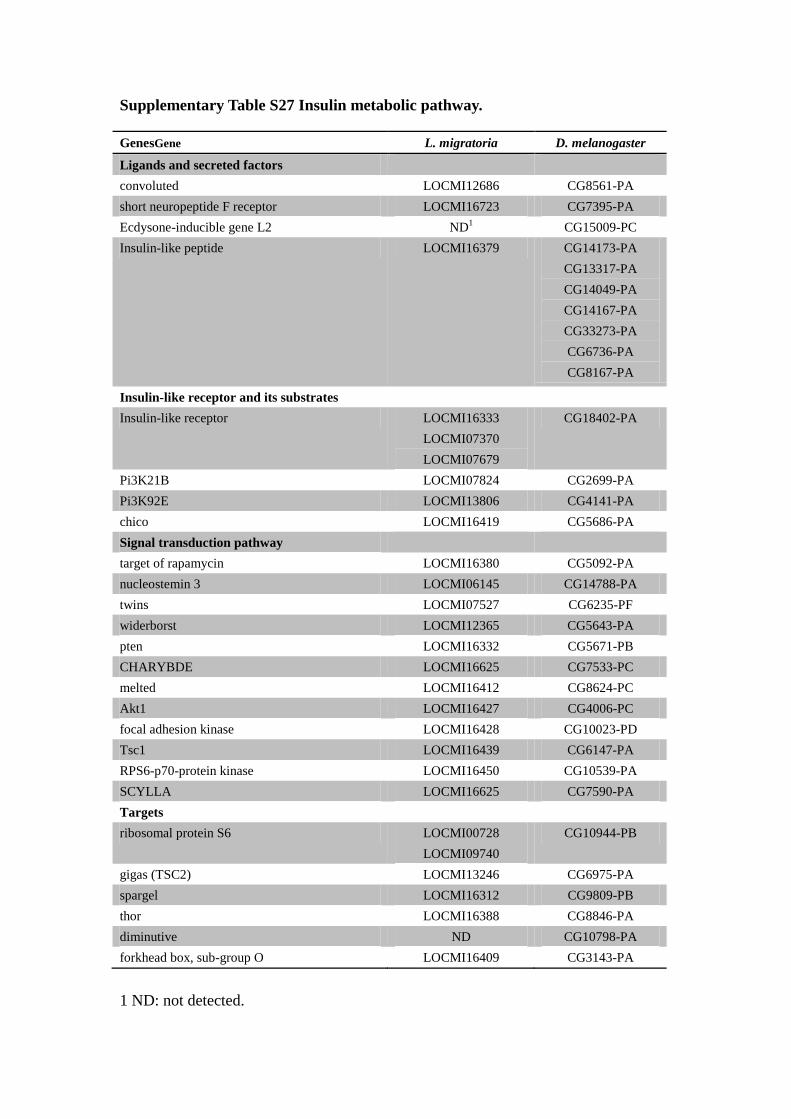
Supplementary Table S27 Insulin metabolic pathway.
GenesGene L. migratoria D. melanogaster
Ligands and secreted factors
convoluted LOCMI12686 CG8561-PA
short neuropeptide F receptor LOCMI16723 CG7395-PA
Ecdysone-inducible gene L2 ND1
CG15009-PC
Insulin-like peptide LOCMI16379 CG14173-PA
CG13317-PA
CG14049-PA
CG14167-PA
CG33273-PA
CG6736-PA
CG8167-PA
Insulin-like receptor and its substrates
Insulin-like receptor LOCMI16333
LOCMI07370
LOCMI07679
CG18402-PA
Pi3K21B LOCMI07824 CG2699-PA
Pi3K92E LOCMI13806 CG4141-PA
chico LOCMI16419 CG5686-PA
Signal transduction pathway
target of rapamycin LOCMI16380 CG5092-PA
nucleostemin 3 LOCMI06145 CG14788-PA
twins LOCMI07527 CG6235-PF
widerborst LOCMI12365 CG5643-PA
pten LOCMI16332 CG5671-PB
CHARYBDE LOCMI16625 CG7533-PC
melted LOCMI16412 CG8624-PC
Akt1 LOCMI16427 CG4006-PC
focal adhesion kinase LOCMI16428 CG10023-PD
Tsc1 LOCMI16439 CG6147-PA
RPS6-p70-protein kinase LOCMI16450 CG10539-PA
SCYLLA LOCMI16625 CG7590-PA
Targets
ribosomal protein S6 LOCMI00728
LOCMI09740
CG10944-PB
gigas (TSC2) LOCMI13246 CG6975-PA
spargel LOCMI16312 CG9809-PB
thor LOCMI16388 CG8846-PA
diminutive ND CG10798-PA
forkhead box, sub-group O LOCMI16409 CG3143-PA
1 ND: not detected.
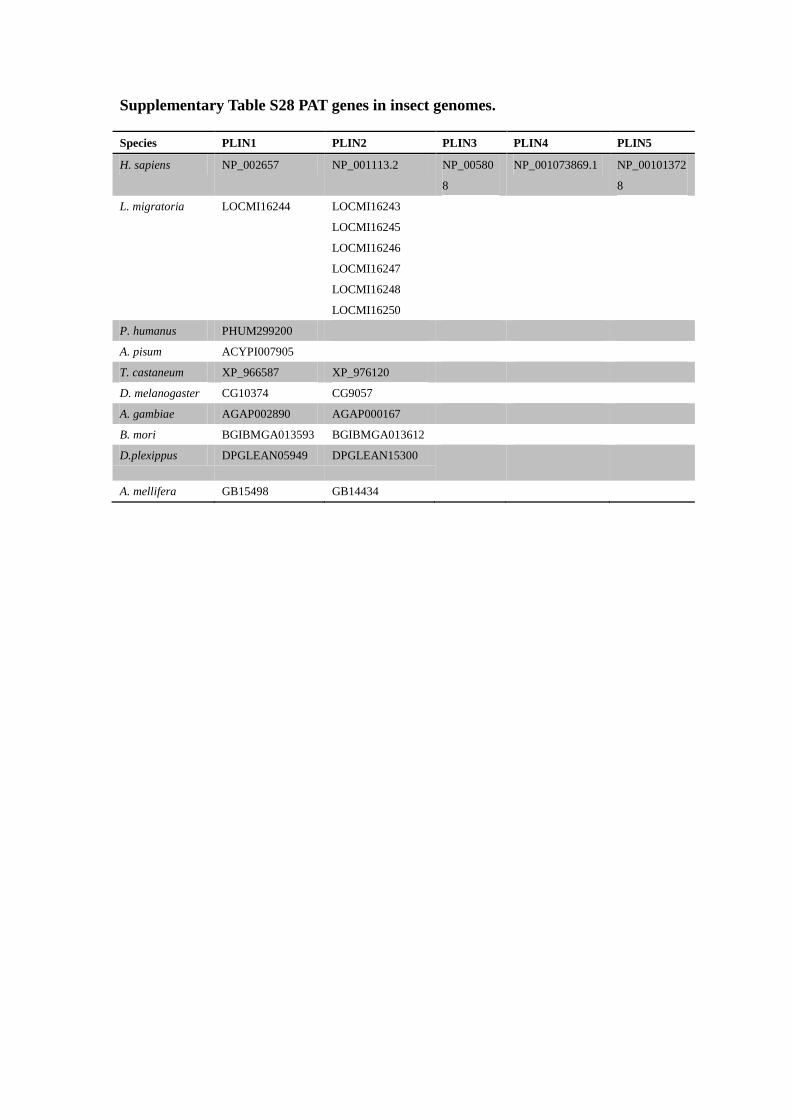
Supplementary Table S28 PAT genes in insect genomes.
Species PLIN1 PLIN2 PLIN3 PLIN4 PLIN5
H. sapiens NP_002657 NP_001113.2 NP_00580
8
NP_001073869.1 NP_00101372
8
L. migratoria LOCMI16244 LOCMI16243
LOCMI16245
LOCMI16246
LOCMI16247
LOCMI16248
LOCMI16250
P. humanus PHUM299200
A. pisum ACYPI007905
T. castaneum XP_966587 XP_976120
D. melanogaster CG10374 CG9057
A. gambiae AGAP002890 AGAP000167
B. mori BGIBMGA013593 BGIBMGA013612
D.plexippus DPGLEAN05949 DPGLEAN15300
A. mellifera GB15498 GB14434
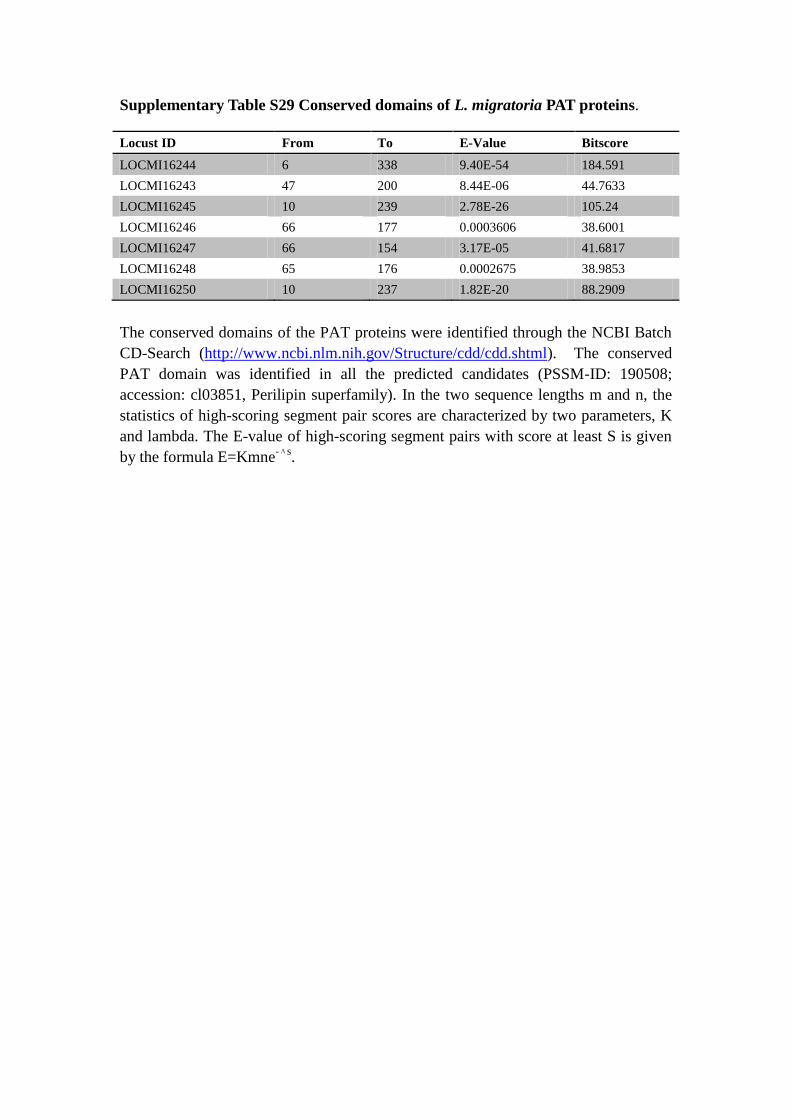
Supplementary Table S29 Conserved domains of L. migratoria PAT proteins.
Locust ID From To E-Value Bitscore
LOCMI16244 6 338 9.40E-54 184.591
LOCMI16243 47 200 8.44E-06 44.7633
LOCMI16245 10 239 2.78E-26 105.24
LOCMI16246 66 177 0.0003606 38.6001
LOCMI16247 66 154 3.17E-05 41.6817
LOCMI16248 65 176 0.0002675 38.9853
LOCMI16250 10 237 1.82E-20 88.2909
The conserved domains of the PAT proteins were identified through the NCBI Batch
CD-Search (http://www.ncbi.nlm.nih.gov/Structure/cdd/cdd.shtml). The conserved
PAT domain was identified in all the predicted candidates (PSSM-ID: 190508;
accession: cl03851, Perilipin superfamily). In the two sequence lengths m and n, the
statistics of high-scoring segment pair scores are characterized by two parameters, K
and lambda. The E-value of high-scoring segment pairs with score at least S is given
by the formula E=Kmne-Λs
.
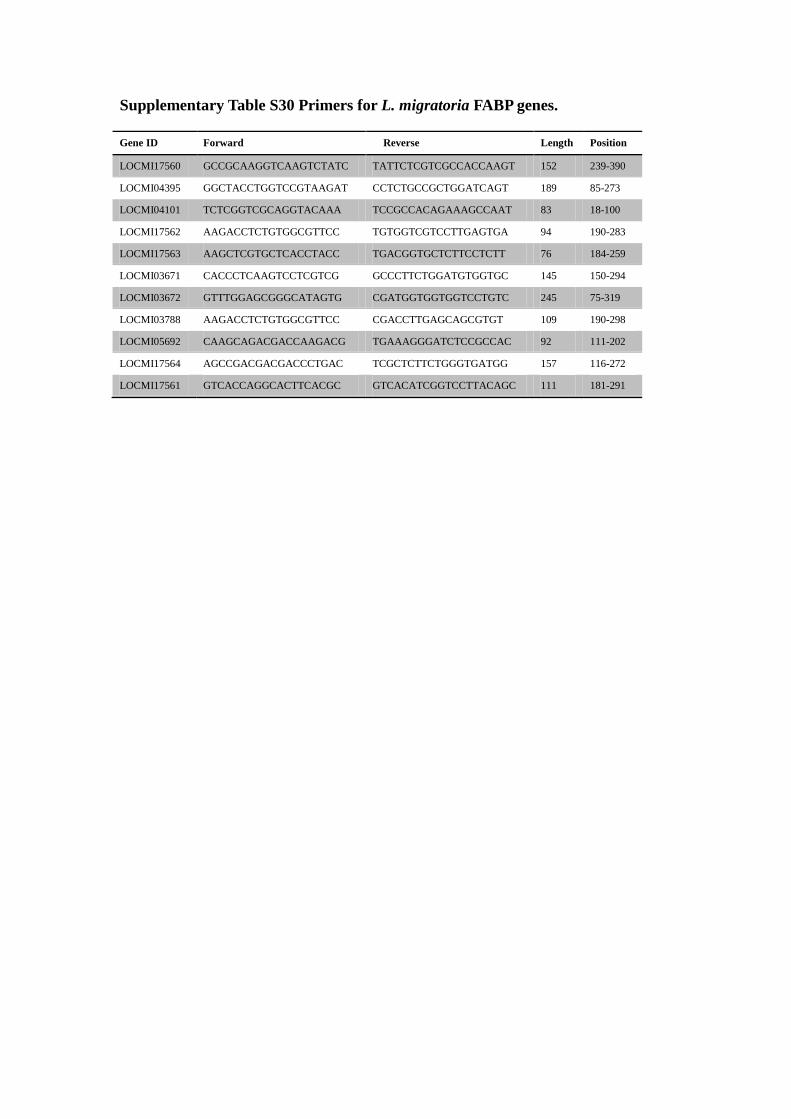
Supplementary Table S30 Primers for L. migratoria FABP genes.
Gene ID Forward Reverse Length Position
LOCMI17560 GCCGCAAGGTCAAGTCTATC TATTCTCGTCGCCACCAAGT 152 239-390
LOCMI04395 GGCTACCTGGTCCGTAAGAT CCTCTGCCGCTGGATCAGT 189 85-273
LOCMI04101 TCTCGGTCGCAGGTACAAA TCCGCCACAGAAAGCCAAT 83 18-100
LOCMI17562 AAGACCTCTGTGGCGTTCC TGTGGTCGTCCTTGAGTGA 94 190-283
LOCMI17563 AAGCTCGTGCTCACCTACC TGACGGTGCTCTTCCTCTT 76 184-259
LOCMI03671 CACCCTCAAGTCCTCGTCG GCCCTTCTGGATGTGGTGC 145 150-294
LOCMI03672 GTTTGGAGCGGGCATAGTG CGATGGTGGTGGTCCTGTC 245 75-319
LOCMI03788 AAGACCTCTGTGGCGTTCC CGACCTTGAGCAGCGTGT 109 190-298
LOCMI05692 CAAGCAGACGACCAAGACG TGAAAGGGATCTCCGCCAC 92 111-202
LOCMI17564 AGCCGACGACGACCCTGAC TCGCTCTTCTGGGTGATGG 157 116-272
LOCMI17561 GTCACCAGGCACTTCACGC GTCACATCGGTCCTTACAGC 111 181-291
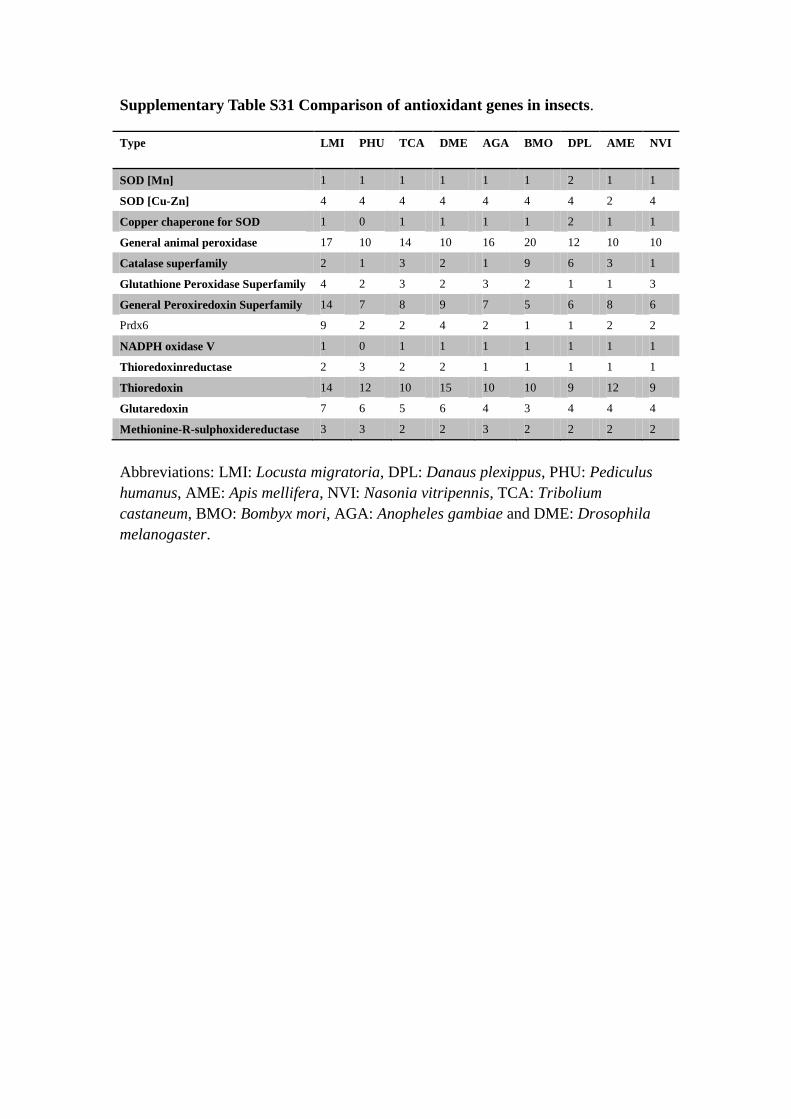
Supplementary Table S31 Comparison of antioxidant genes in insects.
Type LMI PHU TCA DME AGA BMO DPL AME NVI
SOD [Mn] 1 1 1 1 1 1 2 1 1
SOD [Cu-Zn] 4 4 4 4 4 4 4 2 4
Copper chaperone for SOD 1 0 1 1 1 1 2 1 1
General animal peroxidase 17 10 14 10 16 20 12 10 10
Catalase superfamily 2 1 3 2 1 9 6 3 1
Glutathione Peroxidase Superfamily 4 2 3 2 3 2 1 1 3
General Peroxiredoxin Superfamily 14 7 8 9 7 5 6 8 6
Prdx6 9 2 2 4 2 1 1 2 2
NADPH oxidase V 1 0 1 1 1 1 1 1 1
Thioredoxinreductase 2 3 2 2 1 1 1 1 1
Thioredoxin 14 12 10 15 10 10 9 12 9
Glutaredoxin 7 6 5 6 4 3 4 4 4
Methionine-R-sulphoxidereductase 3 3 2 2 3 2 2 2 2
Abbreviations: LMI: Locusta migratoria, DPL: Danaus plexippus, PHU: Pediculus
humanus, AME: Apis mellifera, NVI: Nasonia vitripennis, TCA: Tribolium
castaneum, BMO: Bombyx mori, AGA: Anopheles gambiae and DME: Drosophila
melanogaster.
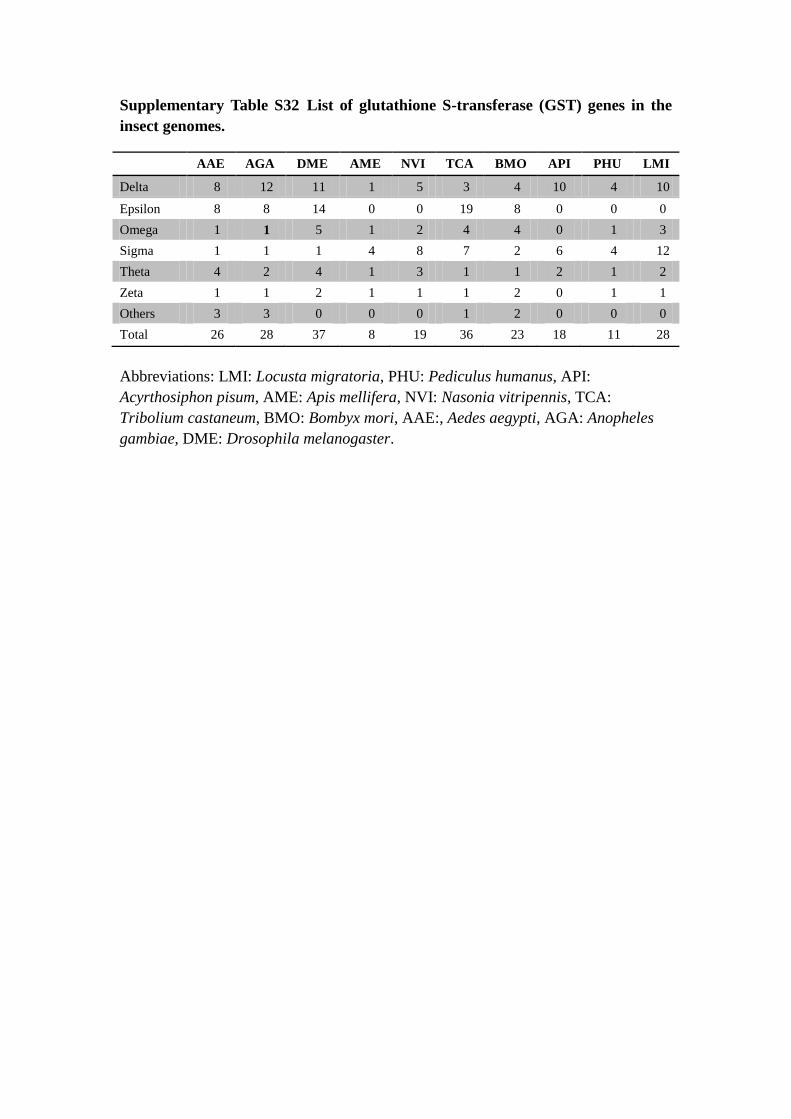
Supplementary Table S32 List of glutathione S-transferase (GST) genes in the
insect genomes.
AAE AGA DME AME NVI TCA BMO API PHU LMI
Delta 8 12 11 1 5 3 4 10 4 10
Epsilon 8 8 14 0 0 19 8 0 0 0
Omega 1 1 5 1 2 4 4 0 1 3
Sigma 1 1 1 4 8 7 2 6 4 12
Theta 4 2 4 1 3 1 1 2 1 2
Zeta 1 1 2 1 1 1 2 0 1 1
Others 3 3 0 0 0 1 2 0 0 0
Total 26 28 37 8 19 36 23 18 11 28
Abbreviations: LMI: Locusta migratoria, PHU: Pediculus humanus, API:
Acyrthosiphon pisum, AME: Apis mellifera, NVI: Nasonia vitripennis, TCA:
Tribolium castaneum, BMO: Bombyx mori, AAE:, Aedes aegypti, AGA: Anopheles
gambiae, DME: Drosophila melanogaster.
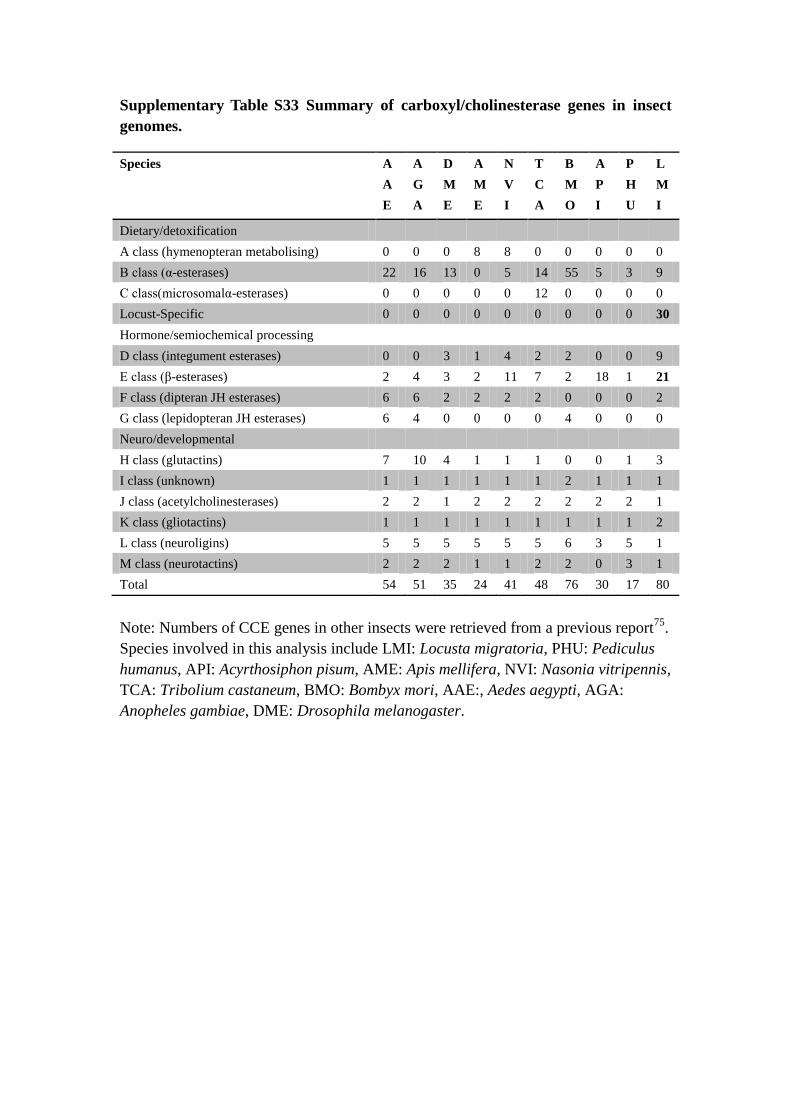
Supplementary Table S33 Summary of carboxyl/cholinesterase genes in insect
genomes.
Species A
A
E
A
G
A
D
M
E
A
M
E
N
V
I
T
C
A
B
M
O
A
P
I
P
H
U
L
M
I
Dietary/detoxification
A class (hymenopteran metabolising) 0 0 0 8 8 0 0 0 0 0
B class (α-esterases) 22 16 13 0 5 14 55 5 3 9
C class(microsomalα-esterases) 0 0 0 0 0 12 0 0 0 0
Locust-Specific 0 0 0 0 0 0 0 0 0 30
Hormone/semiochemical processing
D class (integument esterases) 0 0 3 1 4 2 2 0 0 9
E class (β-esterases) 2 4 3 2 11 7 2 18 1 21
F class (dipteran JH esterases) 6 6 2 2 2 2 0 0 0 2
G class (lepidopteran JH esterases) 6 4 0 0 0 0 4 0 0 0
Neuro/developmental
H class (glutactins) 7 10 4 1 1 1 0 0 1 3
I class (unknown) 1 1 1 1 1 1 2 1 1 1
J class (acetylcholinesterases) 2 2 1 2 2 2 2 2 2 1
K class (gliotactins) 1 1 1 1 1 1 1 1 1 2
L class (neuroligins) 5 5 5 5 5 5 6 3 5 1
M class (neurotactins) 2 2 2 1 1 2 2 0 3 1
Total 54 51 35 24 41 48 76 30 17 80
Note: Numbers of CCE genes in other insects were retrieved from a previous report75
.
Species involved in this analysis include LMI: Locusta migratoria, PHU: Pediculus
humanus, API: Acyrthosiphon pisum, AME: Apis mellifera, NVI: Nasonia vitripennis,
TCA: Tribolium castaneum, BMO: Bombyx mori, AAE:, Aedes aegypti, AGA:
Anopheles gambiae, DME: Drosophila melanogaster.
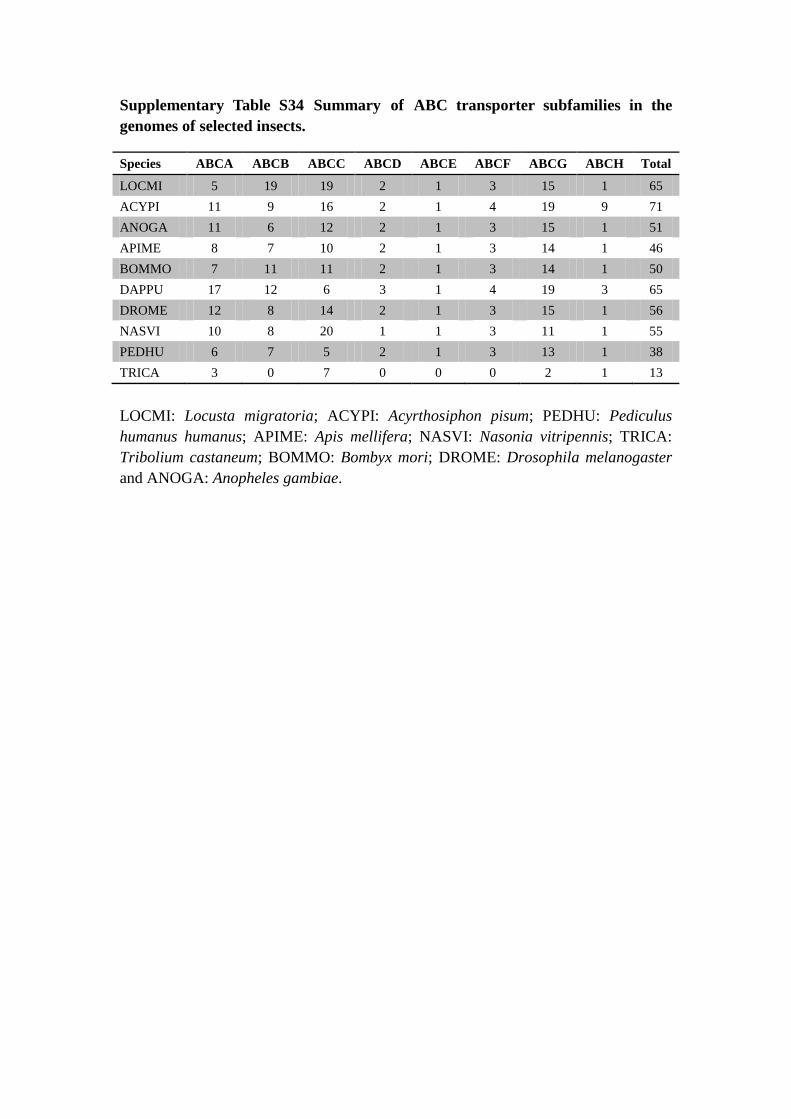
Supplementary Table S34 Summary of ABC transporter subfamilies in the
genomes of selected insects.
Species ABCA ABCB ABCC ABCD ABCE ABCF ABCG ABCH Total
LOCMI 5 19 19 2 1 3 15 1 65
ACYPI 11 9 16 2 1 4 19 9 71
ANOGA 11 6 12 2 1 3 15 1 51
APIME 8 7 10 2 1 3 14 1 46
BOMMO 7 11 11 2 1 3 14 1 50
DAPPU 17 12 6 3 1 4 19 3 65
DROME 12 8 14 2 1 3 15 1 56
NASVI 10 8 20 1 1 3 11 1 55
PEDHU 6 7 5 2 1 3 13 1 38
TRICA 3 0 7 0 0 0 2 1 13
LOCMI: Locusta migratoria; ACYPI: Acyrthosiphon pisum; PEDHU: Pediculus
humanus humanus; APIME: Apis mellifera; NASVI: Nasonia vitripennis; TRICA:
Tribolium castaneum; BOMMO: Bombyx mori; DROME: Drosophila melanogaster
and ANOGA: Anopheles gambiae.
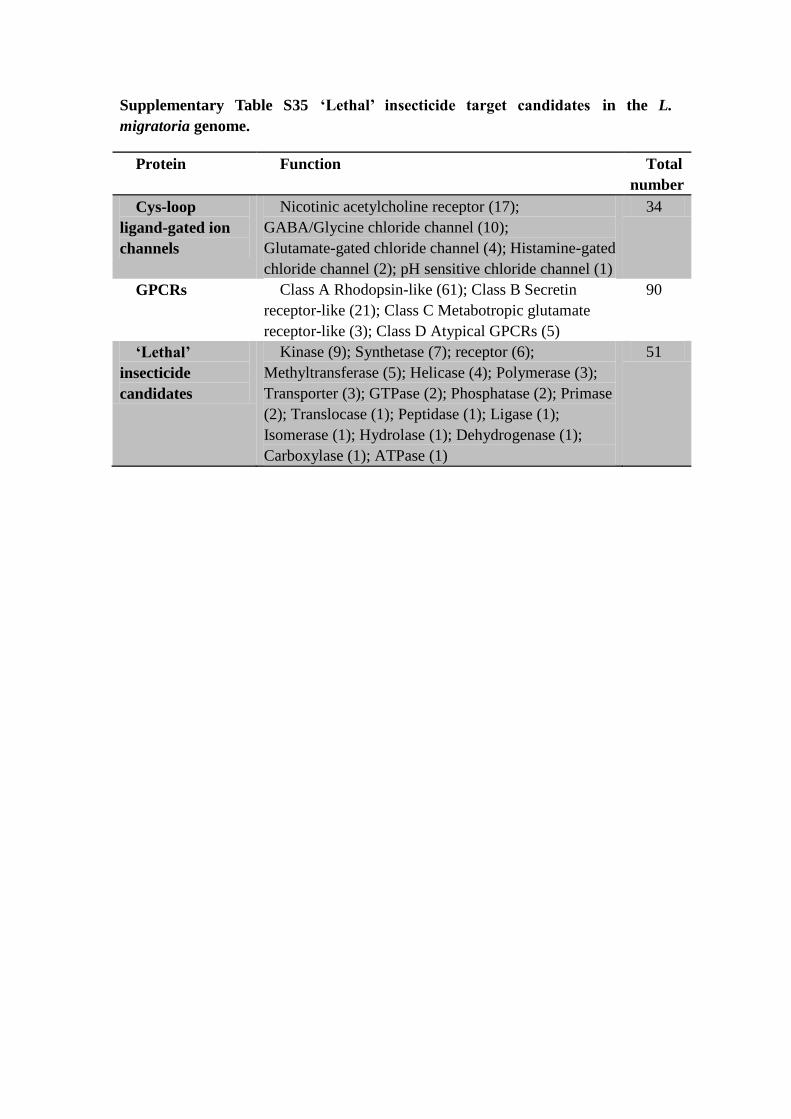
Supplementary Table S35 ‘Lethal’ insecticide target candidates in the L.
migratoria genome.
Protein Function Total
number
Cys-loop
ligand-gated ion
channels
Nicotinic acetylcholine receptor (17);
GABA/Glycine chloride channel (10);
Glutamate-gated chloride channel (4); Histamine-gated
chloride channel (2); pH sensitive chloride channel (1)
34
GPCRs Class A Rhodopsin-like (61); Class B Secretin
receptor-like (21); Class C Metabotropic glutamate
receptor-like (3); Class D Atypical GPCRs (5)
90
‘Lethal’
insecticide
candidates
Kinase (9); Synthetase (7); receptor (6);
Methyltransferase (5); Helicase (4); Polymerase (3);
Transporter (3); GTPase (2); Phosphatase (2); Primase
(2); Translocase (1); Peptidase (1); Ligase (1);
Isomerase (1); Hydrolase (1); Dehydrogenase (1);
Carboxylase (1); ATPase (1)
51
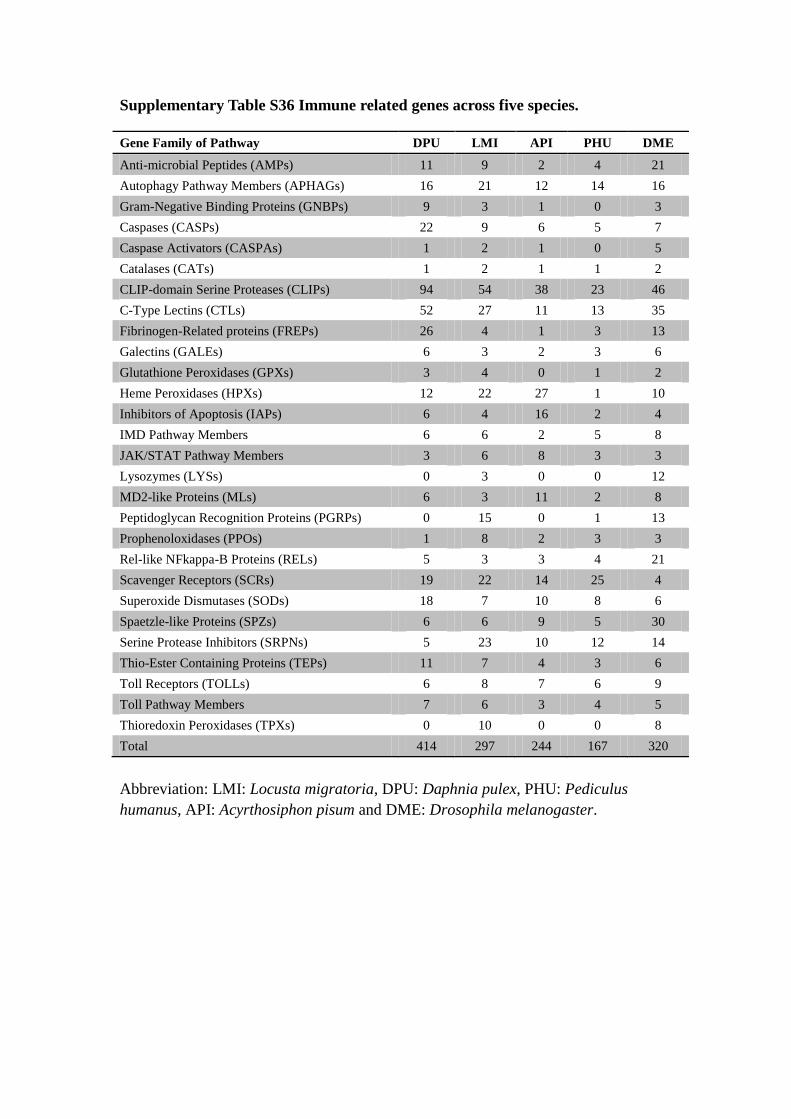
Supplementary Table S36 Immune related genes across five species.
Gene Family of Pathway DPU LMI API PHU DME
Anti-microbial Peptides (AMPs) 11 9 2 4 21
Autophagy Pathway Members (APHAGs) 16 21 12 14 16
Gram-Negative Binding Proteins (GNBPs) 9 3 1 0 3
Caspases (CASPs) 22 9 6 5 7
Caspase Activators (CASPAs) 1 2 1 0 5
Catalases (CATs) 1 2 1 1 2
CLIP-domain Serine Proteases (CLIPs) 94 54 38 23 46
C-Type Lectins (CTLs) 52 27 11 13 35
Fibrinogen-Related proteins (FREPs) 26 4 1 3 13
Galectins (GALEs) 6 3 2 3 6
Glutathione Peroxidases (GPXs) 3 4 0 1 2
Heme Peroxidases (HPXs) 12 22 27 1 10
Inhibitors of Apoptosis (IAPs) 6 4 16 2 4
IMD Pathway Members 6 6 2 5 8
JAK/STAT Pathway Members 3 6 8 3 3
Lysozymes (LYSs) 0 3 0 0 12
MD2-like Proteins (MLs) 6 3 11 2 8
Peptidoglycan Recognition Proteins (PGRPs) 0 15 0 1 13
Prophenoloxidases (PPOs) 1 8 2 3 3
Rel-like NFkappa-B Proteins (RELs) 5 3 3 4 21
Scavenger Receptors (SCRs) 19 22 14 25 4
Superoxide Dismutases (SODs) 18 7 10 8 6
Spaetzle-like Proteins (SPZs) 6 6 9 5 30
Serine Protease Inhibitors (SRPNs) 5 23 10 12 14
Thio-Ester Containing Proteins (TEPs) 11 7 4 3 6
Toll Receptors (TOLLs) 6 8 7 6 9
Toll Pathway Members 7 6 3 4 5
Thioredoxin Peroxidases (TPXs) 0 10 0 0 8
Total 414 297 244 167 320
Abbreviation: LMI: Locusta migratoria, DPU: Daphnia pulex, PHU: Pediculus
humanus, API: Acyrthosiphon pisum and DME: Drosophila melanogaster.
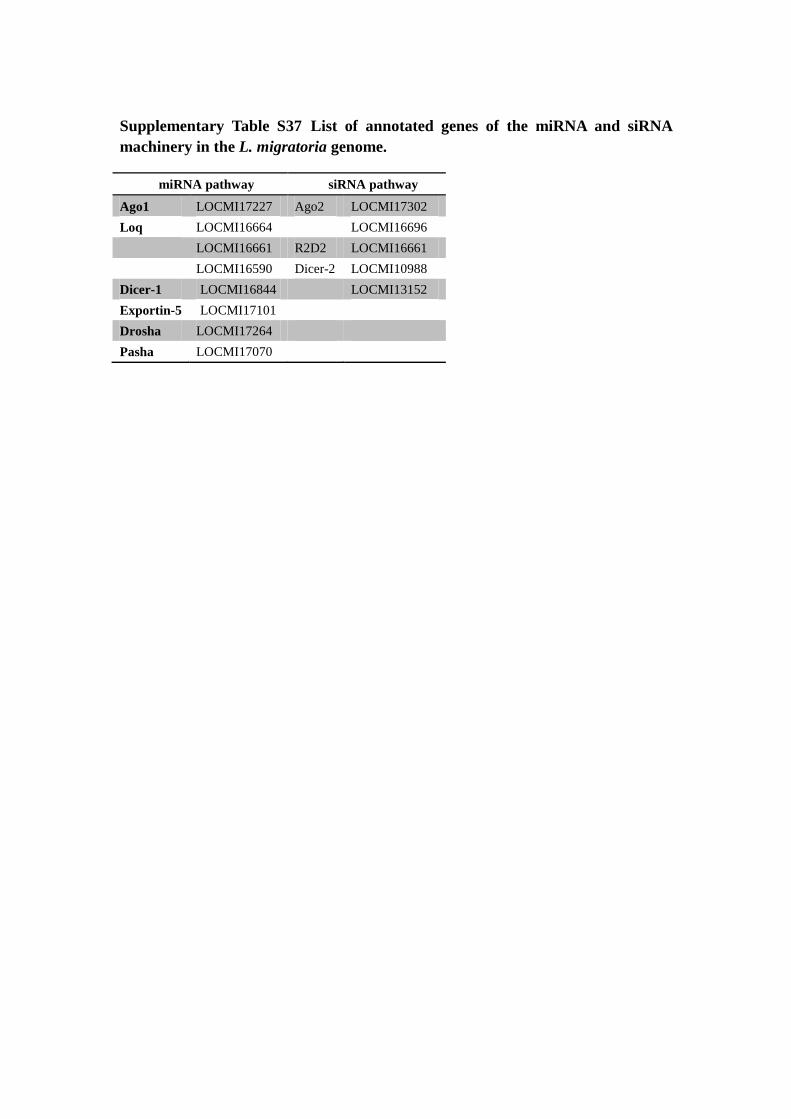
Supplementary Table S37 List of annotated genes of the miRNA and siRNA
machinery in the L. migratoria genome.
miRNA pathway siRNA pathway
Ago1 LOCMI17227 Ago2 LOCMI17302
Loq LOCMI16664 LOCMI16696
LOCMI16661 R2D2 LOCMI16661
LOCMI16590 Dicer-2 LOCMI10988
Dicer-1 LOCMI16844 LOCMI13152
Exportin-5 LOCMI17101
Drosha LOCMI17264
Pasha LOCMI17070
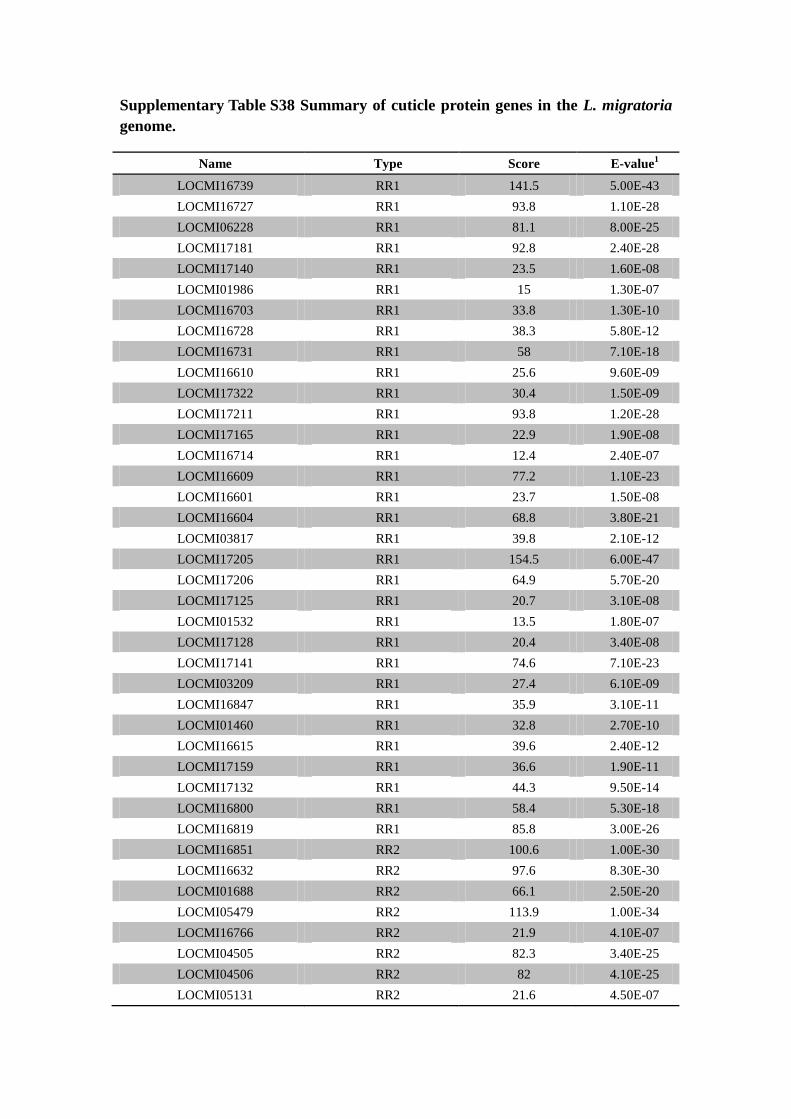
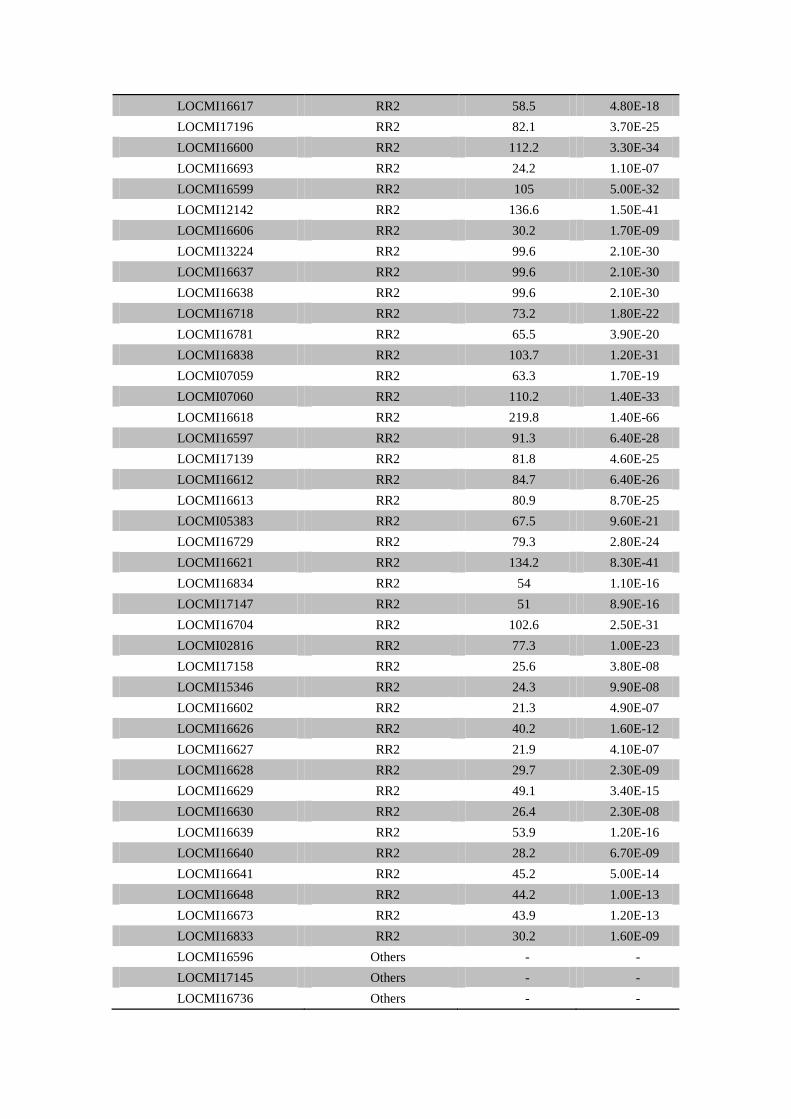
Supplementary Table S38 Summary of cuticle protein genes in the L. migratoria
genome.
Name Type Score E-value1
LOCMI16739 RR1 141.5 5.00E-43
LOCMI16727 RR1 93.8 1.10E-28
LOCMI06228 RR1 81.1 8.00E-25
LOCMI17181 RR1 92.8 2.40E-28
LOCMI17140 RR1 23.5 1.60E-08
LOCMI01986 RR1 15 1.30E-07
LOCMI16703 RR1 33.8 1.30E-10
LOCMI16728 RR1 38.3 5.80E-12
LOCMI16731 RR1 58 7.10E-18
LOCMI16610 RR1 25.6 9.60E-09
LOCMI17322 RR1 30.4 1.50E-09
LOCMI17211 RR1 93.8 1.20E-28
LOCMI17165 RR1 22.9 1.90E-08
LOCMI16714 RR1 12.4 2.40E-07
LOCMI16609 RR1 77.2 1.10E-23
LOCMI16601 RR1 23.7 1.50E-08
LOCMI16604 RR1 68.8 3.80E-21
LOCMI03817 RR1 39.8 2.10E-12
LOCMI17205 RR1 154.5 6.00E-47
LOCMI17206 RR1 64.9 5.70E-20
LOCMI17125 RR1 20.7 3.10E-08
LOCMI01532 RR1 13.5 1.80E-07
LOCMI17128 RR1 20.4 3.40E-08
LOCMI17141 RR1 74.6 7.10E-23
LOCMI03209 RR1 27.4 6.10E-09
LOCMI16847 RR1 35.9 3.10E-11
LOCMI01460 RR1 32.8 2.70E-10
LOCMI16615 RR1 39.6 2.40E-12
LOCMI17159 RR1 36.6 1.90E-11
LOCMI17132 RR1 44.3 9.50E-14
LOCMI16800 RR1 58.4 5.30E-18
LOCMI16819 RR1 85.8 3.00E-26
LOCMI16851 RR2 100.6 1.00E-30
LOCMI16632 RR2 97.6 8.30E-30
LOCMI01688 RR2 66.1 2.50E-20
LOCMI05479 RR2 113.9 1.00E-34
LOCMI16766 RR2 21.9 4.10E-07
LOCMI04505 RR2 82.3 3.40E-25
LOCMI04506 RR2 82 4.10E-25
LOCMI05131 RR2 21.6 4.50E-07
LOCMI16617 RR2 58.5 4.80E-18
LOCMI17196 RR2 82.1 3.70E-25
LOCMI16600 RR2 112.2 3.30E-34
LOCMI16693 RR2 24.2 1.10E-07
LOCMI16599 RR2 105 5.00E-32
LOCMI12142 RR2 136.6 1.50E-41
LOCMI16606 RR2 30.2 1.70E-09
LOCMI13224 RR2 99.6 2.10E-30
LOCMI16637 RR2 99.6 2.10E-30
LOCMI16638 RR2 99.6 2.10E-30
LOCMI16718 RR2 73.2 1.80E-22
LOCMI16781 RR2 65.5 3.90E-20
LOCMI16838 RR2 103.7 1.20E-31
LOCMI07059 RR2 63.3 1.70E-19
LOCMI07060 RR2 110.2 1.40E-33
LOCMI16618 RR2 219.8 1.40E-66
LOCMI16597 RR2 91.3 6.40E-28
LOCMI17139 RR2 81.8 4.60E-25
LOCMI16612 RR2 84.7 6.40E-26
LOCMI16613 RR2 80.9 8.70E-25
LOCMI05383 RR2 67.5 9.60E-21
LOCMI16729 RR2 79.3 2.80E-24
LOCMI16621 RR2 134.2 8.30E-41
LOCMI16834 RR2 54 1.10E-16
LOCMI17147 RR2 51 8.90E-16
LOCMI16704 RR2 102.6 2.50E-31
LOCMI02816 RR2 77.3 1.00E-23
LOCMI17158 RR2 25.6 3.80E-08
LOCMI15346 RR2 24.3 9.90E-08
LOCMI16602 RR2 21.3 4.90E-07
LOCMI16626 RR2 40.2 1.60E-12
LOCMI16627 RR2 21.9 4.10E-07
LOCMI16628 RR2 29.7 2.30E-09
LOCMI16629 RR2 49.1 3.40E-15
LOCMI16630 RR2 26.4 2.30E-08
LOCMI16639 RR2 53.9 1.20E-16
LOCMI16640 RR2 28.2 6.70E-09
LOCMI16641 RR2 45.2 5.00E-14
LOCMI16648 RR2 44.2 1.00E-13
LOCMI16673 RR2 43.9 1.20E-13
LOCMI16833 RR2 30.2 1.60E-09
LOCMI16596 Others - -
LOCMI17145 Others - -
LOCMI16736 Others - -
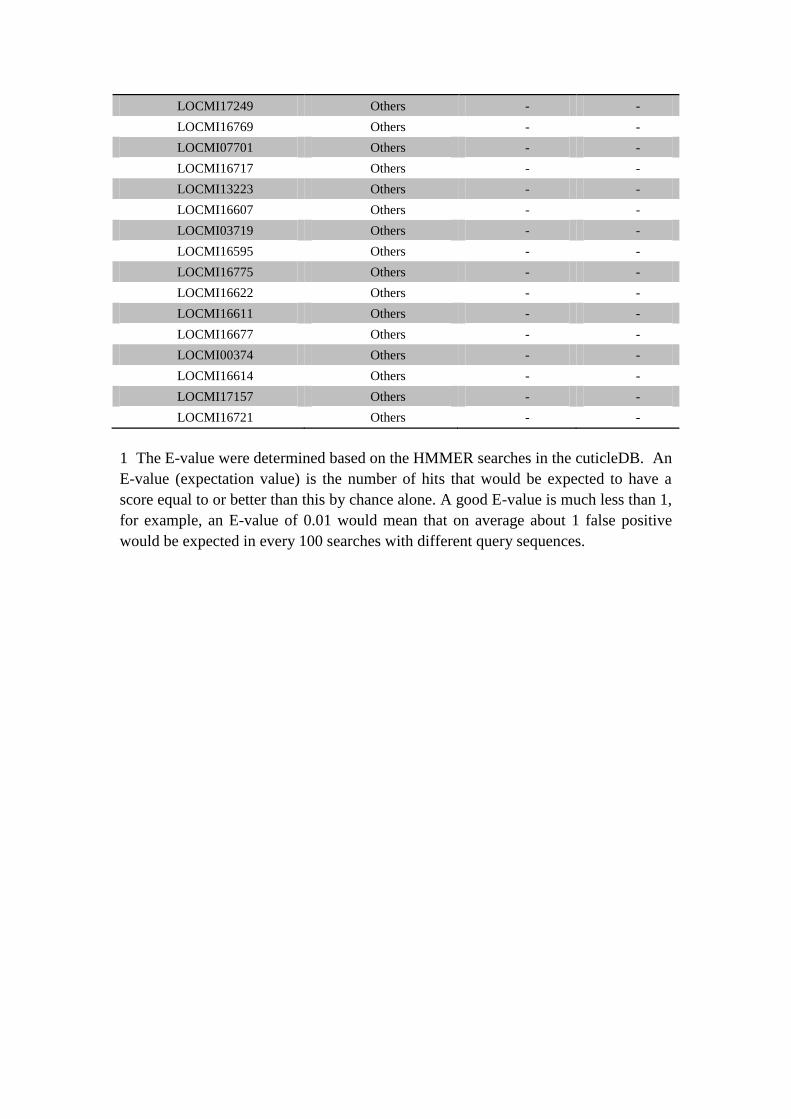
LOCMI17249 Others - -
LOCMI16769 Others - -
LOCMI07701 Others - -
LOCMI16717 Others - -
LOCMI13223 Others - -
LOCMI16607 Others - -
LOCMI03719 Others - -
LOCMI16595 Others - -
LOCMI16775 Others - -
LOCMI16622 Others - -
LOCMI16611 Others - -
LOCMI16677 Others - -
LOCMI00374 Others - -
LOCMI16614 Others - -
LOCMI17157 Others - -
LOCMI16721 Others - -
1 The E-value were determined based on the HMMER searches in the cuticleDB. An
E-value (expectation value) is the number of hits that would be expected to have a
score equal to or better than this by chance alone. A good E-value is much less than 1,
for example, an E-value of 0.01 would mean that on average about 1 false positive
would be expected in every 100 searches with different query sequences.
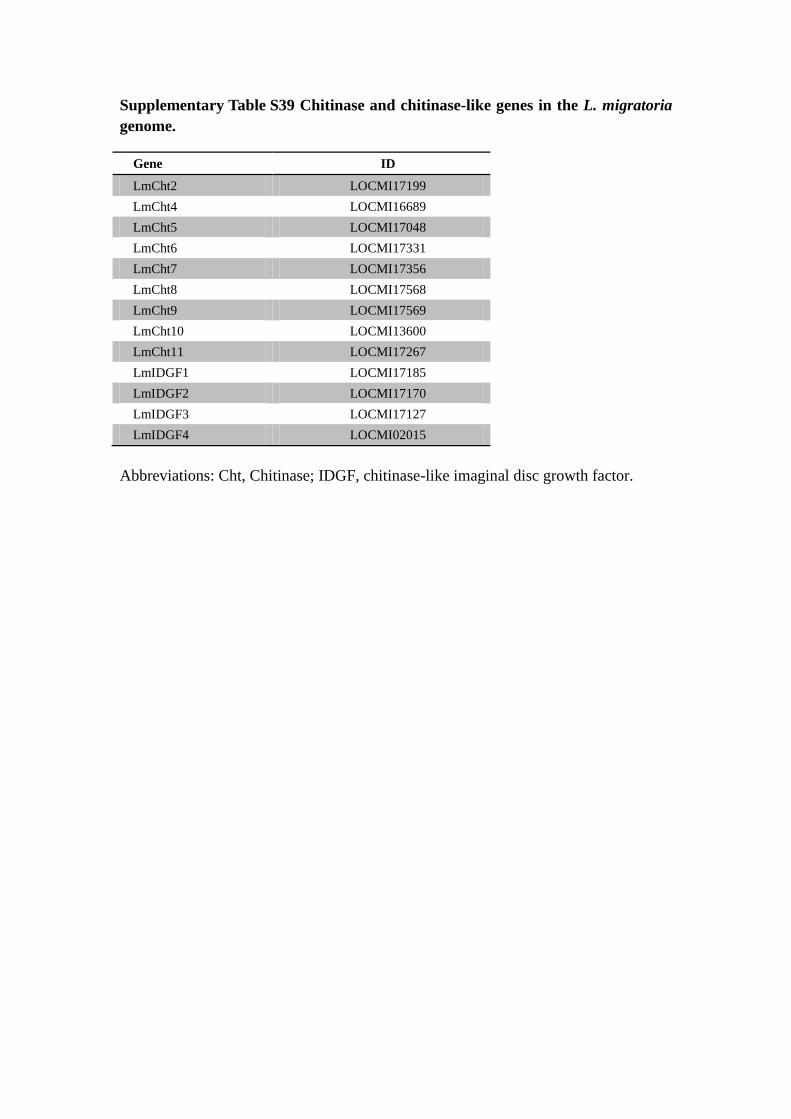
Supplementary Table S39 Chitinase and chitinase-like genes in the L. migratoria
genome.
Gene ID
LmCht2 LOCMI17199
LmCht4 LOCMI16689
LmCht5 LOCMI17048
LmCht6 LOCMI17331
LmCht7 LOCMI17356
LmCht8 LOCMI17568
LmCht9 LOCMI17569
LmCht10 LOCMI13600
LmCht11 LOCMI17267
LmIDGF1 LOCMI17185
LmIDGF2 LOCMI17170
LmIDGF3 LOCMI17127
LmIDGF4 LOCMI02015
Abbreviations: Cht, Chitinase; IDGF, chitinase-like imaginal disc growth factor.
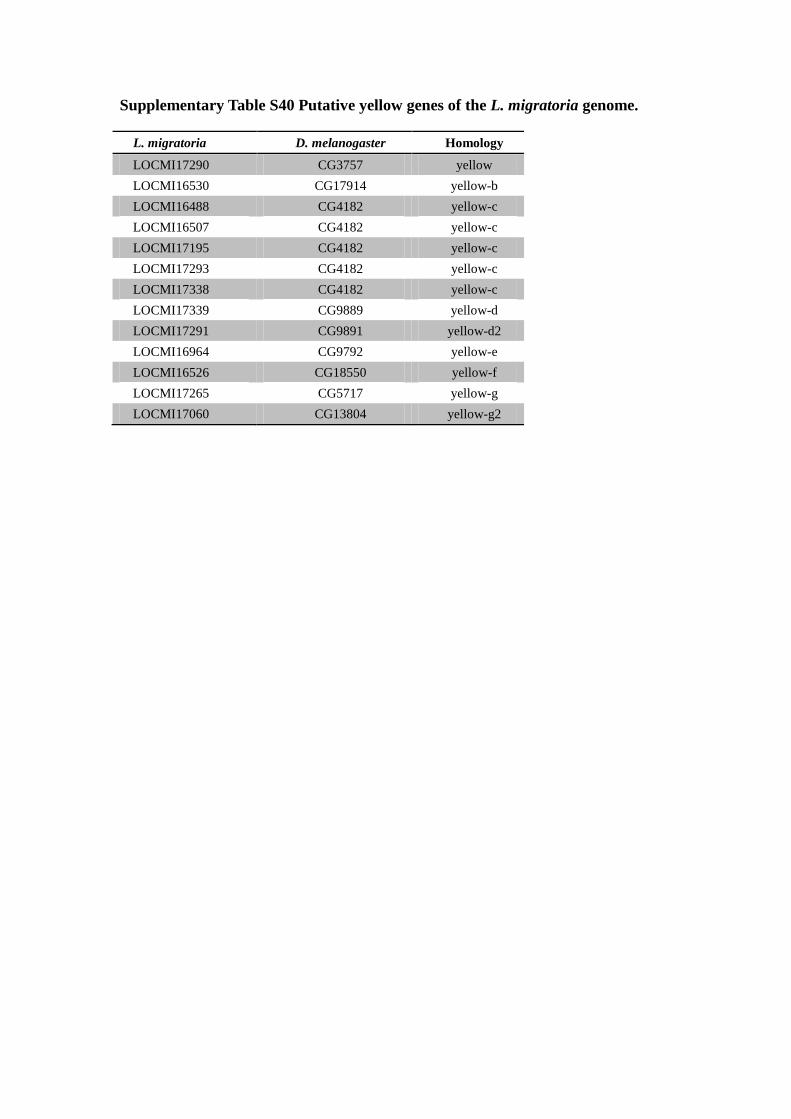
Supplementary Table S40 Putative yellow genes of the L. migratoria genome.
L. migratoria D. melanogaster Homology
LOCMI17290 CG3757 yellow
LOCMI16530 CG17914 yellow-b
LOCMI16488 CG4182 yellow-c
LOCMI16507 CG4182 yellow-c
LOCMI17195 CG4182 yellow-c
LOCMI17293 CG4182 yellow-c
LOCMI17338 CG4182 yellow-c
LOCMI17339 CG9889 yellow-d
LOCMI17291 CG9891 yellow-d2
LOCMI16964 CG9792 yellow-e
LOCMI16526 CG18550 yellow-f
LOCMI17265 CG5717 yellow-g
LOCMI17060 CG13804 yellow-g2
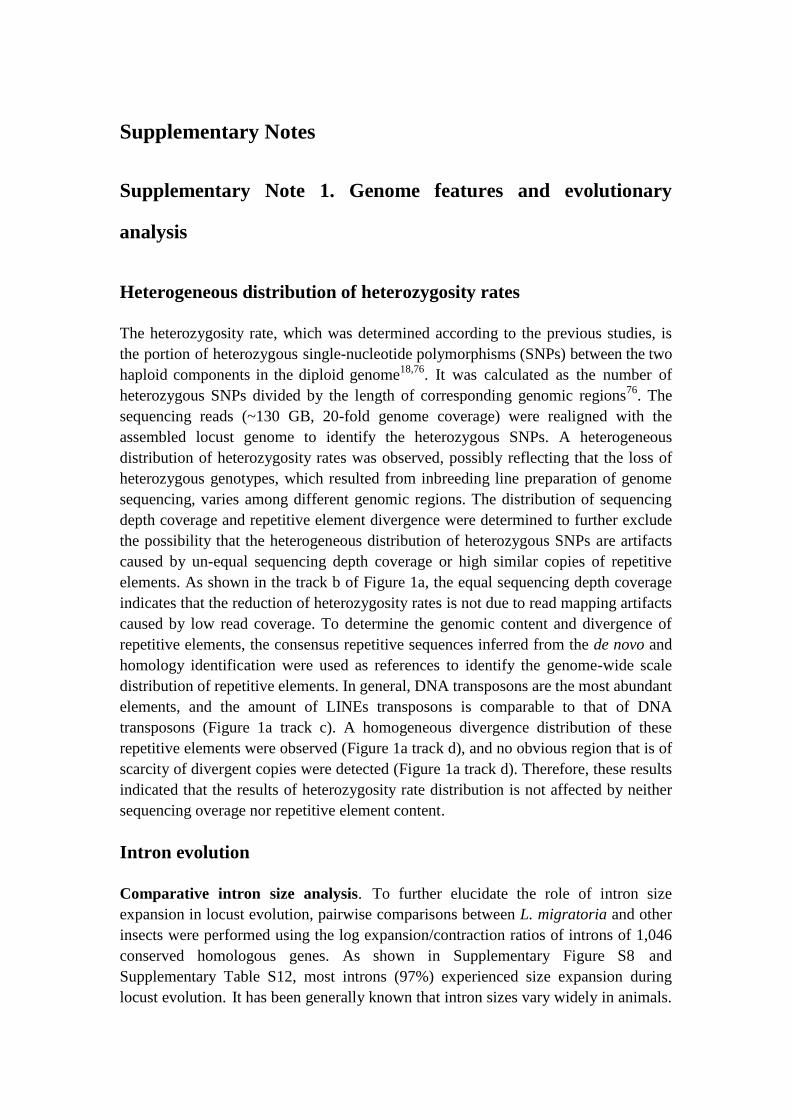
Supplementary Notes
Supplementary Note 1. Genome features and evolutionary
analysis
Heterogeneous distribution of heterozygosity rates
The heterozygosity rate, which was determined according to the previous studies, is
the portion of heterozygous single-nucleotide polymorphisms (SNPs) between the two
haploid components in the diploid genome18,76
. It was calculated as the number of
heterozygous SNPs divided by the length of corresponding genomic regions76
. The
sequencing reads (~130 GB, 20-fold genome coverage) were realigned with the
assembled locust genome to identify the heterozygous SNPs. A heterogeneous
distribution of heterozygosity rates was observed, possibly reflecting that the loss of
heterozygous genotypes, which resulted from inbreeding line preparation of genome
sequencing, varies among different genomic regions. The distribution of sequencing
depth coverage and repetitive element divergence were determined to further exclude
the possibility that the heterogeneous distribution of heterozygous SNPs are artifacts
caused by un-equal sequencing depth coverage or high similar copies of repetitive
elements. As shown in the track b of Figure 1a, the equal sequencing depth coverage
indicates that the reduction of heterozygosity rates is not due to read mapping artifacts
caused by low read coverage. To determine the genomic content and divergence of
repetitive elements, the consensus repetitive sequences inferred from the de novo and
homology identification were used as references to identify the genome-wide scale
distribution of repetitive elements. In general, DNA transposons are the most abundant
elements, and the amount of LINEs transposons is comparable to that of DNA
transposons (Figure 1a track c). A homogeneous divergence distribution of these
repetitive elements were observed (Figure 1a track d), and no obvious region that is of
scarcity of divergent copies were detected (Figure 1a track d). Therefore, these results
indicated that the results of heterozygosity rate distribution is not affected by neither
sequencing overage nor repetitive element content.
Intron evolution
Comparative intron size analysis. To further elucidate the role of intron size
expansion in locust evolution, pairwise comparisons between L. migratoria and other
insects were performed using the log expansion/contraction ratios of introns of 1,046
conserved homologous genes. As shown in Supplementary Figure S8 and
Supplementary Table S12, most introns (97%) experienced size expansion during
locust evolution. It has been generally known that intron sizes vary widely in animals.
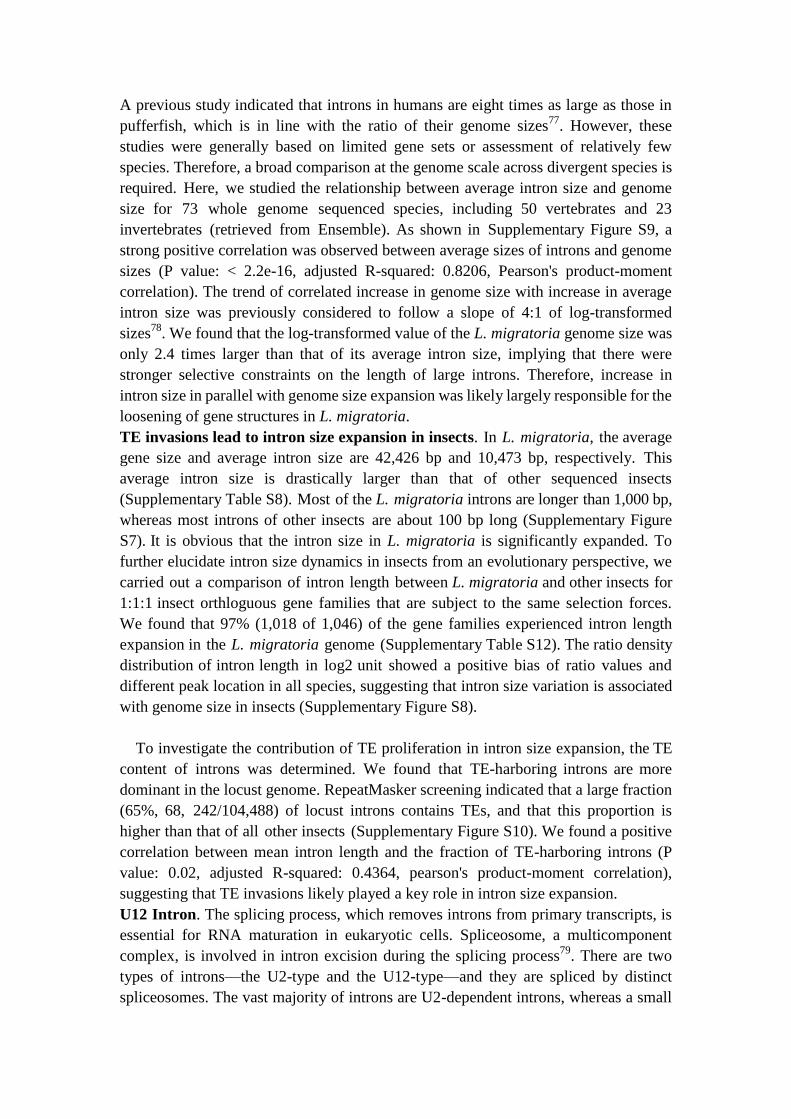
A previous study indicated that introns in humans are eight times as large as those in
pufferfish, which is in line with the ratio of their genome sizes77
. However, these
studies were generally based on limited gene sets or assessment of relatively few
species. Therefore, a broad comparison at the genome scale across divergent species is
required. Here, we studied the relationship between average intron size and genome
size for 73 whole genome sequenced species, including 50 vertebrates and 23
invertebrates (retrieved from Ensemble). As shown in Supplementary Figure S9, a
strong positive correlation was observed between average sizes of introns and genome
sizes (P value: < 2.2e-16, adjusted R-squared: 0.8206, Pearson's product-moment
correlation). The trend of correlated increase in genome size with increase in average
intron size was previously considered to follow a slope of 4:1 of log-transformed
sizes78
. We found that the log-transformed value of the L. migratoria genome size was
only 2.4 times larger than that of its average intron size, implying that there were
stronger selective constraints on the length of large introns. Therefore, increase in
intron size in parallel with genome size expansion was likely largely responsible for the
loosening of gene structures in L. migratoria.
TE invasions lead to intron size expansion in insects. In L. migratoria, the average
gene size and average intron size are 42,426 bp and 10,473 bp, respectively. This
average intron size is drastically larger than that of other sequenced insects
(Supplementary Table S8). Most of the L. migratoria introns are longer than 1,000 bp,
whereas most introns of other insects are about 100 bp long (Supplementary Figure
S7). It is obvious that the intron size in L. migratoria is significantly expanded. To
further elucidate intron size dynamics in insects from an evolutionary perspective, we
carried out a comparison of intron length between L. migratoria and other insects for
1:1:1 insect orthloguous gene families that are subject to the same selection forces.
We found that 97% (1,018 of 1,046) of the gene families experienced intron length
expansion in the L. migratoria genome (Supplementary Table S12). The ratio density
distribution of intron length in log2 unit showed a positive bias of ratio values and
different peak location in all species, suggesting that intron size variation is associated
with genome size in insects (Supplementary Figure S8).
To investigate the contribution of TE proliferation in intron size expansion, the TE
content of introns was determined. We found that TE-harboring introns are more
dominant in the locust genome. RepeatMasker screening indicated that a large fraction
(65%, 68, 242/104,488) of locust introns contains TEs, and that this proportion is
higher than that of all other insects (Supplementary Figure S10). We found a positive
correlation between mean intron length and the fraction of TE-harboring introns (P
value: 0.02, adjusted R-squared: 0.4364, pearson's product-moment correlation),
suggesting that TE invasions likely played a key role in intron size expansion.
U12 Intron. The splicing process, which removes introns from primary transcripts, is
essential for RNA maturation in eukaryotic cells. Spliceosome, a multicomponent
complex, is involved in intron excision during the splicing process79
. There are two
types of introns—the U2-type and the U12-type—and they are spliced by distinct
spliceosomes. The vast majority of introns are U2-dependent introns, whereas a small
fraction of them are U12-dependent introns80
. U12-type introns have an RT
dinucleotide (the R indicates G or A) at the 5’ splicing site and variable terminal
nucleotides at the 3’ splicing site. This breaks the rule observed in the U2-type introns,
which have a GT dinucleotide at the 5’ splicing site and an AG dinucleotide at the 3’
splicing site. Further examination of U12 intron sequences revealed distinct properties
compared to U2 introns, including conserved sequences (RTATCCTT nucleotide
segments) at the 5’ splicing site and adjacent branch site (TCTTAAC nucleotide
segments) from the 3’ splicing site. Both properties are required for prespliceosome
complex formation81
.
U12-type introns have been identified in a wide range of eukaryotic species,
indicating their early evolutionary origin82
. Two recent studies based on comprehensive
searches of genomic sequences revealed that U12 introns were lost in multiple
invertebrate lineages during evolution83,84
. Among insects, only 16 and 34 U12 introns
have been identified in the Drosophila melanogaster and the Apis mellifera genomes,
respectively. Of the 198 human-fruitfly orthologous genes with U12-type introns, 169
introns were lost and only sixteen cases have been maintained in the D. melanogaster
genome.
The number of U12 introns in the locust genome was determined and was compared
with those of other species reported in previous studies. Surprisingly, we identified 197
U12 introns in the L. migratoria genome, which is significantly higher than that of most
other invertebrates (P < 0.01, student’s t-test, Supplementary Figure S11), and twice as
many as that of sea squirt (113), a vertebrate evolutionary ancestor, indicating the
unique intron feature of L. migratoria genome compared to other insects.
Recursive splicing sites. The pattern of intron size can be extremely variable among
different species. Although intron size expansion can be of benefit to gene expression
and evolution, they also increase the potential for transcription processing errors85
. In
insects, an effective way to avoid the generation of extremely long transcripts is
recursive splicing (RP), which excises long intronic transcripts into sub-fragments
co-transcriptionally86
. However, this regulatory mechanism is not observed in
vertebrates85
. Using the splice junction consensus matrix, we calculated the ratios of
RP-sites within large introns (>50 kb as previously described26
) and within their
complementary strands in the L. migratoria genome (Supplementary Figure S12). In
general, the larger introns of insects exhibited marked enrichment of RP-sites in the
sense strand85
. Contrary to the case in insects, the RP-sites of larger introns in the sense
strand are less abundant in vertebrates (a ratio of 1.5 or less85
). In L. migratoria, the
RP-sites (with ratio of 1.14) are dramatically smaller than those of other insects, but
similar to those of vertebrates. In addition, the ratio of RP-sites between the two strands
was also determined in shorter introns with sequence length less than 50 kb. In
Drosophila, the RP-sites of larger introns are significantly more abundant than those of
shorter introns, whereas the ratio of RP-sites is approximately equal between the two
strands in humans 85
. In L. migratoria, the ratio of shorter introns, 1.28, is similar to that
of larger introns, indicating that the shorter introns in L. migratoria exhibit similar

RP-site patterns as those of humans. Taken together, these results indicate that the
regulatory mechanism of introns in L. migratoria is similar to those in vertebrates.
Gene family analysis
Among the 17,307 genes in the L. migratoria genome, 7,995 are conserved across
insect and daphnia, while 1,562 and 335 of them are conserved across insects and
hemimetabolous animals, respectively. A total of 4,571 genes are locust specific
(Supplementary Figure S13).
Supplementary Note 2. Genes related to pest and major Locust
biology
Phase change
Fluctuations of CpGO/E in the coding region of genes. CpGO/E is an efficient
measure of inferring the pattern of DNA methylation due to mutational mechanisms of
hypermutable methylated cytosines that mutational decay of CpG di-nucleotides lead to
a lower-than-expected CpGO/E from methylated region30
. Briefly, methylated
cytosines are chemically unstable and easily change to thymine via spontaneous
deamination. This causes increased frequency of CpG to TpG mutations.
Consequently, hypermethylated genomic regions lose CpG dinucleoties over time and
have lower-than-expected CpGO/E. Hypomethylated regions have high CpGO/E.
CpGO/E is expected to be negatively correlated with the levels of DNA methylation.
Recent studies have demonstrated that the CpGO/E in several insect species that have
the low level of methylation in their genomes, such as D. melanogaster, T. castaneun,
A. gambiae has approximately normal distribution with a mean around 1. In contrast,
the CpGO/E of genes in A. mellirera that has higher methylation level exhibits a
striking bimodal pattern. Accordingly, CpGO/E can act as a indicator of the
methylation level in insect genomes. We examined the distribution of CpGO/E and
observed the intensity fluctuations of CpGO/E in the coding region but not in the whole
genome. The depletion of CpG di-nucleotides in the coding region suggests widespread
gene methylation in the locust genome.
Locust methylation system. DNA methylation is a major mechanism of epigenetic
regulation and refers to the addition of a methyl group to position 5 of cytosine bases.
Several studies have proposed that DNA methylation may be involved in the regulation
of phenotypic plasticity in insects87,88
. The three DNA methyltransferase genes,
Dnmt1–3, display different functions. Dnmt3 establishes DNA methylation patterns,
while Dnmt1 maintains these patterns, and Dnmt2 is involved in tRNA methylation.
There have been various duplications and deletions of the three Dnmt genes within
arthropods. Only Dnmt2 is present in all sequenced arthropods. Dnmt1 and Dnmt3 have
been lost in several lineages. We found two copies of Dnmt1 in L. migratoria, similar to
A. mellifera and A. pisum. Both Dnmt2 and Dnmt3 exist as single copies in L.
migratoria (Supplementary Table S15). All three Dnmt genes in L. migratoria exhibit
conservation in the expected conserved domains.
Long-distance flight
Genes related to contraction/relaxation of flight muscles. Locust flight muscles are
synchronous muscles89
, which are characterized by a 1:1 correspondence between
neural activation and muscle contraction. Each contraction/relaxation cycle is
accompanied by membrane depolarization and subsequent repolarization, release of
activator calcium, attachment of cross-bridges and muscle shortening, then removal of
activator calcium and cross-bridge detachment90
. We identified the genes reported to
contribute to the high frequency of flight muscle contraction and relaxation cycles in
the L. migratoria genome. For example, calcium pumps contribute partially to the high
rate of calcium removal in synchronous muscles90,91
, the troponin T subunit is possibly
involved in muscle activation90
; and resilin, one of the elastic proteins found in the wing
hinge, contributes to the elastic storage of inertial energy in locust muscles92
. The
identification of these genes in the L. migratoria genome will help understand the
function of flight muscles during long-distance flight. Comparison of these genes
across insect genomes shows that there is no significant variation in their copy number
across insect species, indicating that the capacity of L. migratoria for long-distance
flight is likely supported by other genetic variations (Supplementary Table S24).
Genes related to wing vein morphogenesis and wing vein specification. In
long-distance flying insects, integrity of the wings is critical for insect flight93
. During
the lifetime of a flying insect, its wings are subjected to mechanical forces and
deformations for millions of cycles. Because insects control the wings remotely by
transmitting forces distally via veins and areas of thickened membrane, defects in the
thin membranes or veins may affect the insect’s flight performance94
. Seventy genes
involved in wing vein morphogenesis (GO:0008586) and wing vein specification
(GO:0007474) have been reported in D. melanogaster (retrieved from Amigo
database: http://amigo.geneontology.org). We identified their homologues through
homology-based searches (TBLASTN) in the genomes of nine other insects,
including A. pisum, A. gambiae, A. mellifera, B. mori, D. plexioppus, L. migratoria, N.
vitripennis, P. humanus, T. castaneum. Most of the genes are conserved across the
insect species with only one copy in the insect genome (Supplementary Table S25).
Thirty-five genes are shared by all the examined insect species, indicating that insects
share a similar mechanism of vein morphogenesis and vein specification. Although
wing shape and structure vary considerably between L. migratoria and D.
melanogaster, 57 of the 70 genes involved in wing vein morphogenesis and wing vein
specification are shared between them. This further supports a previously proposed
theory that transition between different venation types may require relatively few
changes in the regulatory gene networks involved95,96
.
Genes involved in biosynthesis of juvenile hormone.
Juvenile hormone (JH) plays important roles in regulating flight activity in insects97-99
.
JH is synthesized and secreted from the corpora allata, a pair of endocrine glands with
neural connections to the brain. The biosynthetic pathway of JH can be divided into
two steps: in the first step, farnesyl pyrophosphate (FPP) is formed from acetate
through a series of chemical reactions, and in the second step, FPP is hydrolyzed by a
pyrophosphatase to farnesol, and then oxidized successively to farnesal and farnesoic
acid (FA) by two dehydrogenases100
.
Silkworm genes involved in JH biosynthesis were used as bait genes to identify
their homologues in the L. migratoria genome through homology-based searches.
Juvenile hormone esterase (JHE) has five essential catalytic motifs101
which were
confirmed by multiple sequence alignment with other insect JHE proteins
(Supplementary Figure S22). We found that half of the JH pathway genes (7/14) in L.
migratoria exist in more copies than their silkworm homologues do (Supplementary
Table S26), which supports the idea that JH pathways function as integrators of
metabolic physiology during locust flight102
.
Genes related to Insulin signalling pathway. The insulin/IGF signalling (IIS)
pathway is highly conserved from yeast to worms, fruit flies, and rodents, and plays key
roles in growth, metabolism, stress resistance, reproduction, and longevity in diverse
organisms103-105
. Several studies have demonstrated that the insulin signalling
pathway is also involved in regulation of insect flight activity106
. We identified most
of the IIS genes in the L. migratoria genome using the IIS genes of Drosophila as bait
genes (Supplementary Table S27). We only found one insulin-like peptide in the L.
migratoria genome, which is significantly lower compared to 7 in Drosophila107
and 37
in C. elegans108
. In addition, a total of 3 insulin-like peptide receptors were identified
in the L. migratoria genome.
PAT and FABP protein.
Lipid deposition, activation and transportation are critical for long-distance flight of
locusts109
.
Lipid droplets are intracellular organelles enriched in adipose tissues that regulate the
body fat stores of animals. PAT proteins, comprising of Perilipin, Adipose
differentiation-related protein (ADRP), Tail-interacting protein of 47 kDa (TIP47),
S3-12, and OXPAT110,111
, also known as PLIN1-5111
, are positioned at the surface of
the lipid droplet40
. PAT proteins manage the access of lipases to lipid esters within the
lipid droplet core and interact with cellular machinery important for lipid
homeostasis112
. Members of the PAT family are present in evolutionarily distant
organisms, including mammals, insects, slime molds and fungi113
. All PAT proteins
share sequence similarity and the ability to bind intracellular lipid droplets.
Using the human and D. melanogaster PAT homologous proteins as baits, we
identified the PAT proteins of L. migratoria and 10 other arthropod species. The
conserved domains of identified PAT proteins were further examined using Batch
CD-Search114
, and only those with the perilipin domain were retained (Supplementary
Table S29). Finally, 1 PLIN1 and 6 PLIN2 were identified in the L. migratoria genome

(Supplementary Table S28). Interestingly, the PLIN2 gene was found to be duplicated
in the genome of D. plexippus. In D. melanogaster, the PLIN2 gene (Lsd2) has been
reported to mainly control fat storage in fat bodies and the germ line of females115
.
Thus, duplication of PLIN2 genes might enhance the capacity of fat storage in L.
migratoria and D. plexippus, which is possibly an adaptation to intensive energy
demand during long-distance flight.
The fatty-acid-binding proteins (FABPs) are a family of carrier proteins for fatty acids
and other lipophilic substances such as eicosanoids and retinoids. These proteins are
thought to facilitate the transfer of fatty acids between extra- and intracellular
membranes116
. FABPs have been demonstrated to play key roles in the long-distance
flight capacity of locusts. So we also detected these proteins in L. migratoria and 10
other arthropod species, using the D. melanogaster FABP homologous proteins as
baits, we identified the number of FABP in 10 species are: 3 copies in Pediculus
humanus, 2 copies in Tribolium castaneum, 1 copy in Drosophila melanogaster, 2
copies in Anopheles gambiae, 7 copies in Bombyx mori, 6 copies in Danaus
plexioppus, 3 copies in Apis mellifera, 2 copies in Nasonia vitripennis and 11 copies
in Locusta migratoria.
Antioxidants
Generation of reactive oxygen species (ROS) is a ubiquitous phenomenon in eukaryotic
cells, resulting in oxidative stress, pathogenesis and aging117
. For insects with intensive
flight activity, ROS damage mitochondrial proteins and the cell membrane, and thus
shorten their life span43,118
. As defense against oxidative stress, insects have evolved a
variety of antioxidant systems, such as antioxidant enzymes including superoxide
dismutase, catalase and glutathione transferase, and soluble antioxidants such as
ascorbate, glutathione, tocopherols, and carotenoids119
.
We searched the L. migratoria and 8 other insect genomes for antioxidant genes
using D. melanogaster and A. mellifera antioxidant genes120
and peroxidases from
PeroxiBase121
as bait. After homology-based searching, peroxidases were further
filtered and classified using PeroxiScan121
. The copy numbers of most antioxidant
genes across the examined species are conservative except Prdx6, which belongs to
the general peroxiredoxin superfamily (PS52075) (Supplementary Table S31). In
contrast to the small copy number of Prdx6 in other species, nine copies were
identified in the L. migratoria genome (Supplementary Table S31). Seven Prdx6 genes
are tandemly located on two scaffolds (Supplementary Figure S24), as observed in the
D. melanogaster genome (CG11765, CG12405, and CG12896). Prdx6 can scavenge
peroxides, reduce peroxidized membrane phospholipids by using glutathione as a
reductant, and protect cells against oxidant-induced plasma membrane damage122-124
.
Expansion of Prdx6 in the L. migtratoria genome may help alleviate the oxidative
stress caused by reactive oxidative species produced during extensive flight
activity43,118
.
Feeding
Odor related genes
Chemoreceptor genes. Utilizing their senses of taste (gustation) and smell (olfaction)
to locate and recognize plants is a key aspect of host plant recognition in insects125
.
Environmental chemicals are detected, recognized and discriminated by
chemoreceptor genes expressed in olfactory and taste sensory organs. Chemoreceptor
genes include gustatory receptors (GRs), odorant receptors (ORs), and ionotropic
receptors (IRs), which were identified recently126
.
The locust GRs were first identified using known insect GR proteins as templates
by combined TBLASTN and GENEWISE searches127
. Then, identified locust GRs and
known insect GRs were used to perform the iterated profile searches with PSI-BLAST,
because of high divergence of the GR genes128
. These strategies were also applied in
the identification of locust IRs. Known insect ORs deposited in GenBank were
retrieved to identify the locust ORs by the AUGUSTUS gene prediction program129
.
Multiple alignment of the OR protein sequences were performed to construct a block
profile using accompanying scripts from AUGUSTUS. The members and their
exon-intron structure of the locust ORs were determined based on the protein profile
extension from the block profile. Probable gene fragments of which presumed protein
sequences are shorter than 250 amino acids were discarded following the strategy of a
previous study130
. For phylogenetic analysis, protein sequences were aligned with
representative sequences from other insects. The phylogenetic trees were inferred by
maximum likelihood methods, and were drawn using the PhyML 3.0 program with the
JTT substitutional matrix131
.
By combined GLEAN gene set and predicted gene models from PSI-BLAST
searches, we identified 75 L. migratoria GRs (LmGRs) in the draft genome
sequences. To verify our gene prediction, the relative frequency of the corresponding
amino acid at each position was generated using WebLogo. The WebLogo results
clearly illustrated that conserved TYhhhhhQF motifs, which are representative
features of GR genes, are present in the TM7 domain of most locust GRs
(Supplementary Figure S26). For phylogenetic analysis, representative GRs including
known carbon dioxide receptors, bitter receptors and sugar receptors were included to
provide context for LmGRs. Phylogenetic relationships of the 75 LmGrs with each
other are shown in Supplementary Figure S27. Most LmGRs formed three large
lineages that were unique in L. migratoria, indicating their origin from LmGR
expansion. Orthologues of the carbon dioxide and sugar receptors were not detected
in the L. migratoria genome. In addition, no orthologue of the well-conserved
DmGr43a gene lineage could be identified. Taken together with a previous report that
these genes were also lost in the A. pisum genome130
, our results suggest that these
genes are conserved only in holometabolous insects. However, the locust GR family
does contain one member of the bitter receptor superfamily that is present in the
silkworm moth Bombyx mori132
. We also found 95 L. migratoria ORs and 10 L.
migratoria IRs in the draft genome sequences. As expected, we identified a single
orthologue of the Or83b gene, a highly conserved single-copy gene present in all
insects studied to date.
Odorant-binding proteins. In insects, recognition of volatile compounds allows for

odor and pheromone perception that is essential for feeding, survival and reproduction.
Odorant-binding proteins (OBPs) are important components of the insect olfactory
system133
. The OBP genes were identified through homology searches using
information from already known insect protein sequences134
. Using the known insect
OBPs as templates, the GENEWISE program was used to improve and extend the
GLEAN predictions into full-length proteins. The HMMER searches using the
PBP/GOBP pfam01395 profiles were conducted to determine the conserved OBP
domain. Furthermore, the secondary structures including α-helices were predicted
using the PSIPRED program to assist with the OBP gene annotation process135
. We
found a total of 22 putative OBPs in the L. migratoria genome. This indicates that
compared to other known insect genomes, the L. migratoria genome contains a
relatively low number of genes encoding OBPs.
Detoxification related genes
Families of detoxification related genes paly essential roles in interactions and
defense against natural and synthetic xenobiotics, which facilitate adaptation to
specific ecological niches in insects. To fully characterize these gene families, we
manually annotated and compared the detoxification related genes in the L.
migratoria genome to those in other insect genomes, including the families of genes
encoding UDP-glycosyltransferases, glutathione-S-transferase,
carboxyl/cholinesterase, ATP-binding cassette transporters and cytochrome P450
monooxygenases.
UDP glycosyltransferase. Potential defensive compounds of plants can act as toxins or
feeding deterrents toward herbivorous insects. The detoxication of ingested plant
compounds is considered to be one of the principle functions of
UDP-glycosyltransferases (UGT) enzymes in insects. UGTs belong to a superfamily of
metabolic enzymes that play important roles in the detoxification and elimination of a
variety of endogenous and exogenous compounds52
. Members of this superfamily are
variable in sequence composition and abundance in bacteria, viruses, plants and
animals, suggesting their very ancient origin and an essential role in living
organisms136
. These enzymes catalyze the conjugation of a glycosyl group from an
activated sugar donor with various small lipophilic molecules, resulting in more
hydrophilic products that are efficiently excreted73,137
.
We identified 68 putative UGT genes in the L. migratoria genome with subsequent
manual curation. This number is larger than that of other insects of which genomes are
determined, representing an approximately 2-fold expansion compared to D.
melanogaster and 5.7-fold expansion relative to the number of UGTs identified in A.
mellifera138
. The deduced amino acid sequences showed similarity to a range of insect
UGTs and included the UGT signature motif in a conserved C-terminal region:
[FVA]-[LIVMF]-[TS]-[HQ]-[SGAC]-G-X[2]-[STG]-X[2]-[DE]-X[6]-P-[LIVMFA]-[
LIVMFA]-X[2]- P-[LMVFIQ]-X[2]-[DE]-Q. Generally, the binding site of UDP
moiety of the nucleotide sugar, also known as the UGT signature motif, is present in the
conserved region of the C-terminal halves139
. The availability of the full repertoire of
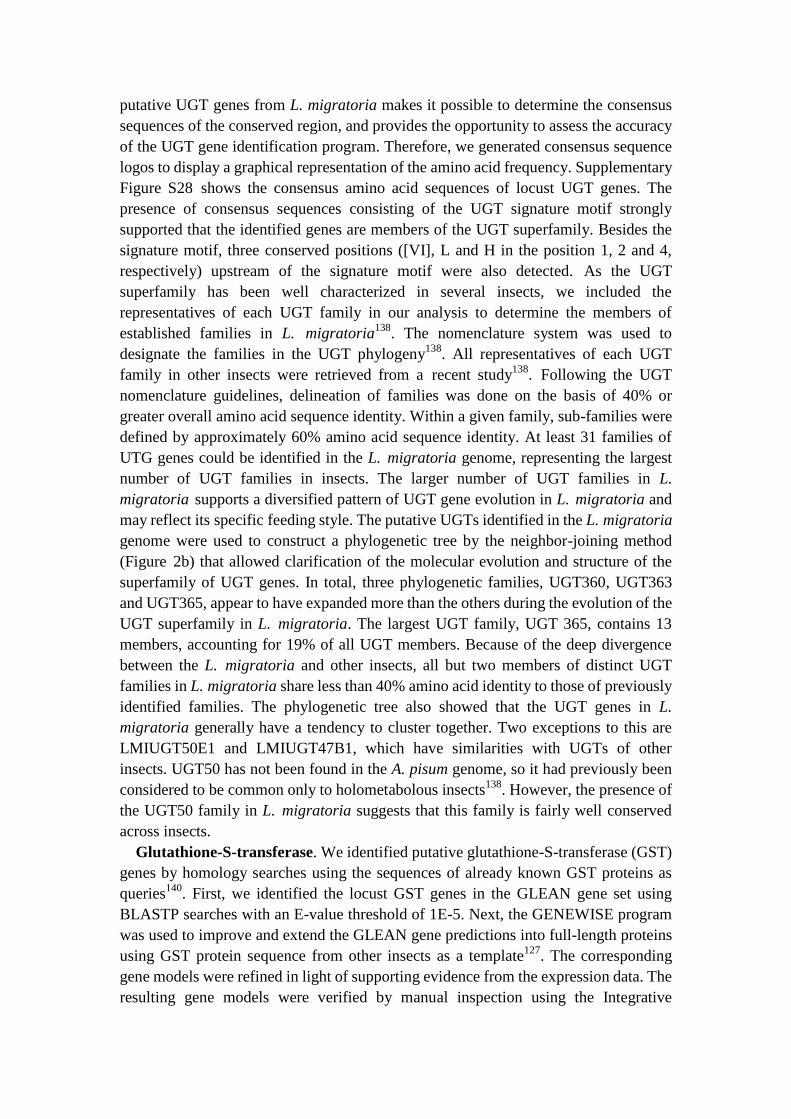
putative UGT genes from L. migratoria makes it possible to determine the consensus
sequences of the conserved region, and provides the opportunity to assess the accuracy
of the UGT gene identification program. Therefore, we generated consensus sequence
logos to display a graphical representation of the amino acid frequency. Supplementary
Figure S28 shows the consensus amino acid sequences of locust UGT genes. The
presence of consensus sequences consisting of the UGT signature motif strongly
supported that the identified genes are members of the UGT superfamily. Besides the
signature motif, three conserved positions ([VI], L and H in the position 1, 2 and 4,
respectively) upstream of the signature motif were also detected. As the UGT
superfamily has been well characterized in several insects, we included the
representatives of each UGT family in our analysis to determine the members of
established families in L. migratoria138
. The nomenclature system was used to
designate the families in the UGT phylogeny138
. All representatives of each UGT
family in other insects were retrieved from a recent study138
. Following the UGT
nomenclature guidelines, delineation of families was done on the basis of 40% or
greater overall amino acid sequence identity. Within a given family, sub-families were
defined by approximately 60% amino acid sequence identity. At least 31 families of
UTG genes could be identified in the L. migratoria genome, representing the largest
number of UGT families in insects. The larger number of UGT families in L.
migratoria supports a diversified pattern of UGT gene evolution in L. migratoria and
may reflect its specific feeding style. The putative UGTs identified in the L. migratoria
genome were used to construct a phylogenetic tree by the neighbor-joining method
(Figure 2b) that allowed clarification of the molecular evolution and structure of the
superfamily of UGT genes. In total, three phylogenetic families, UGT360, UGT363
and UGT365, appear to have expanded more than the others during the evolution of the
UGT superfamily in L. migratoria. The largest UGT family, UGT 365, contains 13
members, accounting for 19% of all UGT members. Because of the deep divergence
between the L. migratoria and other insects, all but two members of distinct UGT
families in L. migratoria share less than 40% amino acid identity to those of previously
identified families. The phylogenetic tree also showed that the UGT genes in L.
migratoria generally have a tendency to cluster together. Two exceptions to this are
LMIUGT50E1 and LMIUGT47B1, which have similarities with UGTs of other
insects. UGT50 has not been found in the A. pisum genome, so it had previously been
considered to be common only to holometabolous insects138
. However, the presence of
the UGT50 family in L. migratoria suggests that this family is fairly well conserved
across insects.
Glutathione-S-transferase. We identified putative glutathione-S-transferase (GST)
genes by homology searches using the sequences of already known GST proteins as
queries140
. First, we identified the locust GST genes in the GLEAN gene set using
BLASTP searches with an E-value threshold of 1E-5. Next, the GENEWISE program
was used to improve and extend the GLEAN gene predictions into full-length proteins
using GST protein sequence from other insects as a template127
. The corresponding
gene models were refined in light of supporting evidence from the expression data. The
resulting gene models were verified by manual inspection using the Integrative
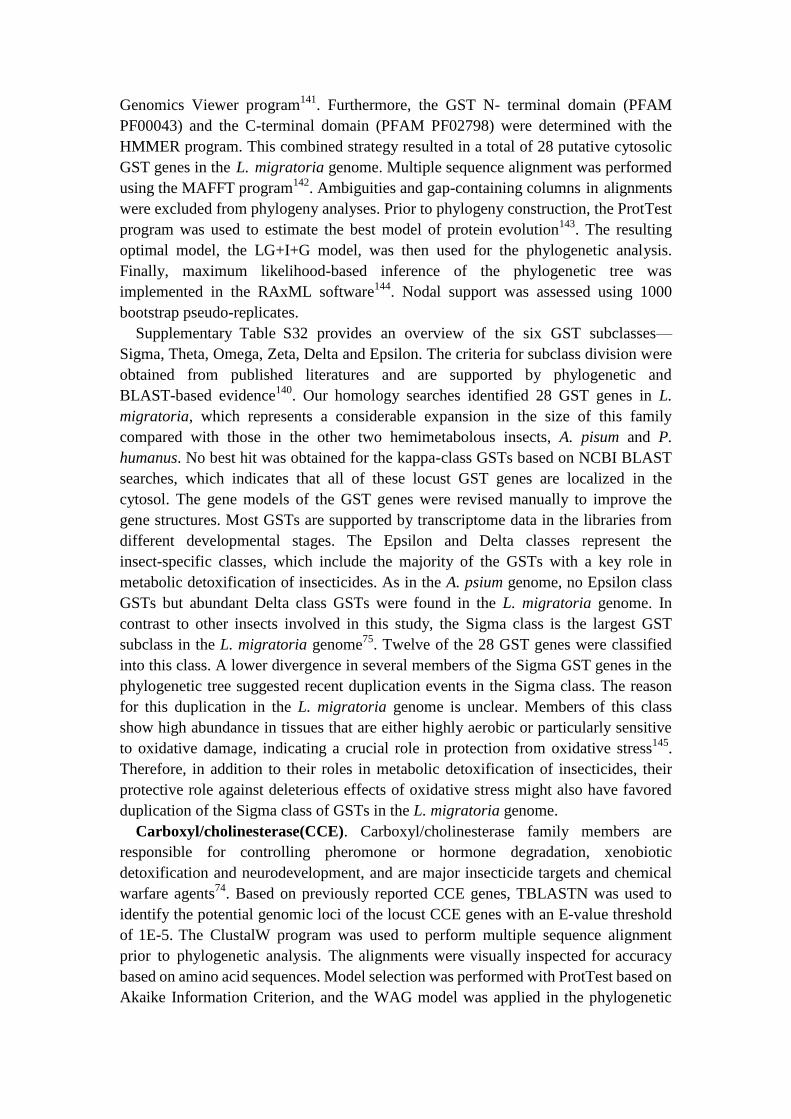
Genomics Viewer program141
. Furthermore, the GST N- terminal domain (PFAM
PF00043) and the C-terminal domain (PFAM PF02798) were determined with the
HMMER program. This combined strategy resulted in a total of 28 putative cytosolic
GST genes in the L. migratoria genome. Multiple sequence alignment was performed
using the MAFFT program142
. Ambiguities and gap-containing columns in alignments
were excluded from phylogeny analyses. Prior to phylogeny construction, the ProtTest
program was used to estimate the best model of protein evolution143
. The resulting
optimal model, the LG+I+G model, was then used for the phylogenetic analysis.
Finally, maximum likelihood-based inference of the phylogenetic tree was
implemented in the RAxML software144
. Nodal support was assessed using 1000
bootstrap pseudo-replicates.
Supplementary Table S32 provides an overview of the six GST subclasses—
Sigma, Theta, Omega, Zeta, Delta and Epsilon. The criteria for subclass division were
obtained from published literatures and are supported by phylogenetic and
BLAST-based evidence140
. Our homology searches identified 28 GST genes in L.
migratoria, which represents a considerable expansion in the size of this family
compared with those in the other two hemimetabolous insects, A. pisum and P.
humanus. No best hit was obtained for the kappa-class GSTs based on NCBI BLAST
searches, which indicates that all of these locust GST genes are localized in the
cytosol. The gene models of the GST genes were revised manually to improve the
gene structures. Most GSTs are supported by transcriptome data in the libraries from
different developmental stages. The Epsilon and Delta classes represent the
insect-specific classes, which include the majority of the GSTs with a key role in
metabolic detoxification of insecticides. As in the A. psium genome, no Epsilon class
GSTs but abundant Delta class GSTs were found in the L. migratoria genome. In
contrast to other insects involved in this study, the Sigma class is the largest GST
subclass in the L. migratoria genome75
. Twelve of the 28 GST genes were classified
into this class. A lower divergence in several members of the Sigma GST genes in the
phylogenetic tree suggested recent duplication events in the Sigma class. The reason
for this duplication in the L. migratoria genome is unclear. Members of this class
show high abundance in tissues that are either highly aerobic or particularly sensitive
to oxidative damage, indicating a crucial role in protection from oxidative stress145
.
Therefore, in addition to their roles in metabolic detoxification of insecticides, their
protective role against deleterious effects of oxidative stress might also have favored
duplication of the Sigma class of GSTs in the L. migratoria genome.
Carboxyl/cholinesterase(CCE). Carboxyl/cholinesterase family members are
responsible for controlling pheromone or hormone degradation, xenobiotic
detoxification and neurodevelopment, and are major insecticide targets and chemical
warfare agents74
. Based on previously reported CCE genes, TBLASTN was used to
identify the potential genomic loci of the locust CCE genes with an E-value threshold
of 1E-5. The ClustalW program was used to perform multiple sequence alignment
prior to phylogenetic analysis. The alignments were visually inspected for accuracy
based on amino acid sequences. Model selection was performed with ProtTest based on
Akaike Information Criterion, and the WAG model was applied in the phylogenetic
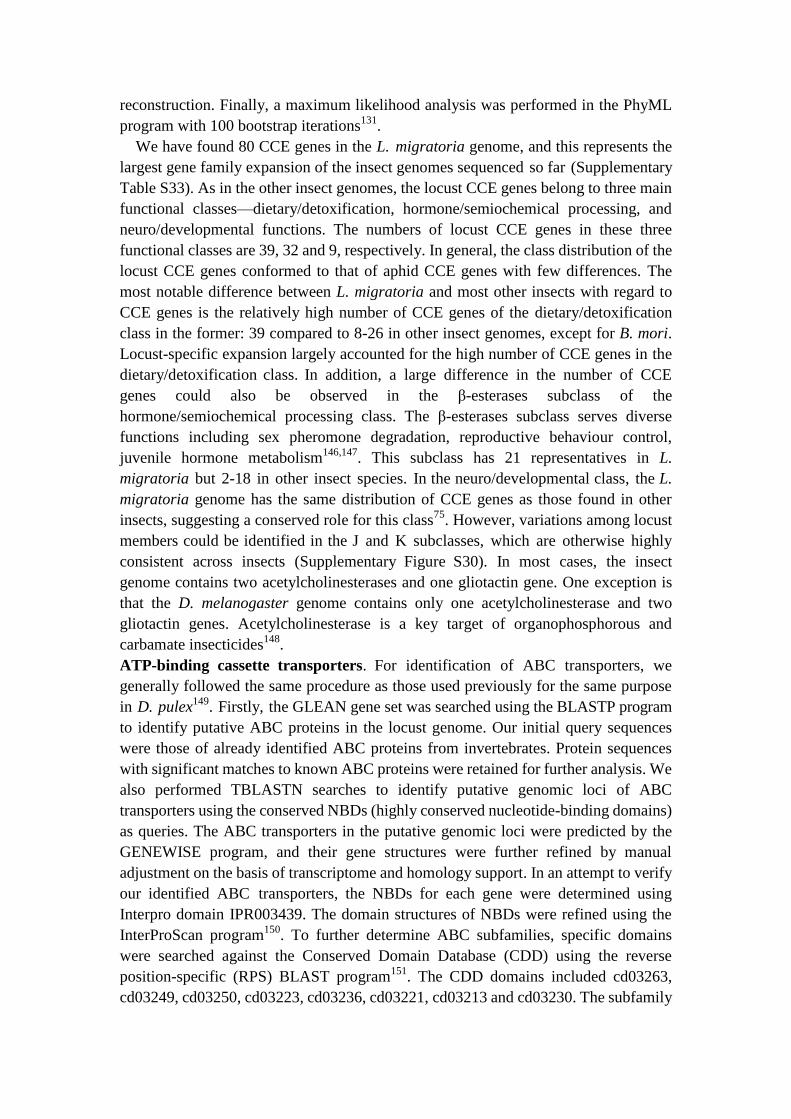
reconstruction. Finally, a maximum likelihood analysis was performed in the PhyML
program with 100 bootstrap iterations131
.
We have found 80 CCE genes in the L. migratoria genome, and this represents the
largest gene family expansion of the insect genomes sequenced so far (Supplementary
Table S33). As in the other insect genomes, the locust CCE genes belong to three main
functional classes—dietary/detoxification, hormone/semiochemical processing, and
neuro/developmental functions. The numbers of locust CCE genes in these three
functional classes are 39, 32 and 9, respectively. In general, the class distribution of the
locust CCE genes conformed to that of aphid CCE genes with few differences. The
most notable difference between L. migratoria and most other insects with regard to
CCE genes is the relatively high number of CCE genes of the dietary/detoxification
class in the former: 39 compared to 8-26 in other insect genomes, except for B. mori.
Locust-specific expansion largely accounted for the high number of CCE genes in the
dietary/detoxification class. In addition, a large difference in the number of CCE
genes could also be observed in the β-esterases subclass of the
hormone/semiochemical processing class. The β-esterases subclass serves diverse
functions including sex pheromone degradation, reproductive behaviour control,
juvenile hormone metabolism146,147
. This subclass has 21 representatives in L.
migratoria but 2-18 in other insect species. In the neuro/developmental class, the L.
migratoria genome has the same distribution of CCE genes as those found in other
insects, suggesting a conserved role for this class75
. However, variations among locust
members could be identified in the J and K subclasses, which are otherwise highly
consistent across insects (Supplementary Figure S30). In most cases, the insect
genome contains two acetylcholinesterases and one gliotactin gene. One exception is
that the D. melanogaster genome contains only one acetylcholinesterase and two
gliotactin genes. Acetylcholinesterase is a key target of organophosphorous and
carbamate insecticides148
.
ATP-binding cassette transporters. For identification of ABC transporters, we
generally followed the same procedure as those used previously for the same purpose
in D. pulex149
. Firstly, the GLEAN gene set was searched using the BLASTP program
to identify putative ABC proteins in the locust genome. Our initial query sequences
were those of already identified ABC proteins from invertebrates. Protein sequences
with significant matches to known ABC proteins were retained for further analysis. We
also performed TBLASTN searches to identify putative genomic loci of ABC
transporters using the conserved NBDs (highly conserved nucleotide-binding domains)
as queries. The ABC transporters in the putative genomic loci were predicted by the
GENEWISE program, and their gene structures were further refined by manual
adjustment on the basis of transcriptome and homology support. In an attempt to verify
our identified ABC transporters, the NBDs for each gene were determined using
Interpro domain IPR003439. The domain structures of NBDs were refined using the
InterProScan program150
. To further determine ABC subfamilies, specific domains
were searched against the Conserved Domain Database (CDD) using the reverse
position-specific (RPS) BLAST program151
. The CDD domains included cd03263,
cd03249, cd03250, cd03223, cd03236, cd03221, cd03213 and cd03230. The subfamily

assignment was further confirmed by phylogenetic analysis together with known ABC
transporters. For comparison, ABC transporters of several insect genomes were also
determined by the same procedure.
In total, our searches identified a total of 65 putative ABC genes in the L.
migratoria genome (Supplementary Table S34), which includes members from all
known ABC subfamilies. Of these, 19 genes were classified under the ABCB
subfamily while the two ABCC subfamilies together comprised another 19 genes.
These two subfamilies are involved in xenobiotic resistance and represent the largest
ABC subfamilies in L. migratoria as well as other insects152
.
Cytochrome P450 genes. Cytochrome P450s (CYPs) form a large and diverse gene
family in metabolic systems and are involved in the metabolism of xenobiotics such
as pesticides, plant toxins and toxic environmental chemicals. They are also important
in the regulation of endogenous lipophilic compounds, including hormones, fatty
acids and steroids. To detect the CYP genes, the GLEAN gene models were searched
by the TBLASTN and GENEWISE programs with known insect CYP sequences
representing the four conserved CYP clades127
. The gene models were corrected to
avoid fusion with adjacent CYP genes or fragmentation when necessary. Through
these manual annotation and curation of CYPs, we found 94 P450 genes in the L.
migratoria genome. As shown in Supplementary Figure S31, this number represents
an intermediate number of P450s in the insect genome but higher than that of the
other two sequenced hemimetabolous insects, A. pisum and P. humanus. A
phylogenetic analysis was performed to classify the locust P450s with other identified
insect P450s. The amino acid sequences of the resulting P450 genes were aligned with
those of other insect P450 genes by the MAFFT program with some manual
adjustments142
. A phylogenetic tree was then constructed based on the maximum
likelihood algorithm using the RAxML program. Supplementary Figure S32 shows
the four distinct branches of the phylogenetic tree corresponding to the known CYP
clades. The locust P450s could be divided into four distinct clades—CYP2, CYP3,
CYP4 and mitochondrial clades—that are also found in other insects. The number of
genes in the CYP3 clade in the L. migratoria genome is higher than that of the typical
insect with the exceptions of A. aegypti and T. castaneum. The CYP3 clade contains
the largest number of insect P450 genes and considerable amount of evidence points
to its role in xenobiotic metabolism and insecticide resistance, implying its critical
role in locust biology153
.
Supplementary Note 3. Pest control
Established insecticide targets
Deficiency of ion channels and receptors promotes the death of insects by interfering
with nervous system functions154
. A variety of ion channels and receptors have been
utilized as the major target sites of various insecticides54
. Although a few genes of the
ion channel superfamily have been reported in locusts, the full complement of locust
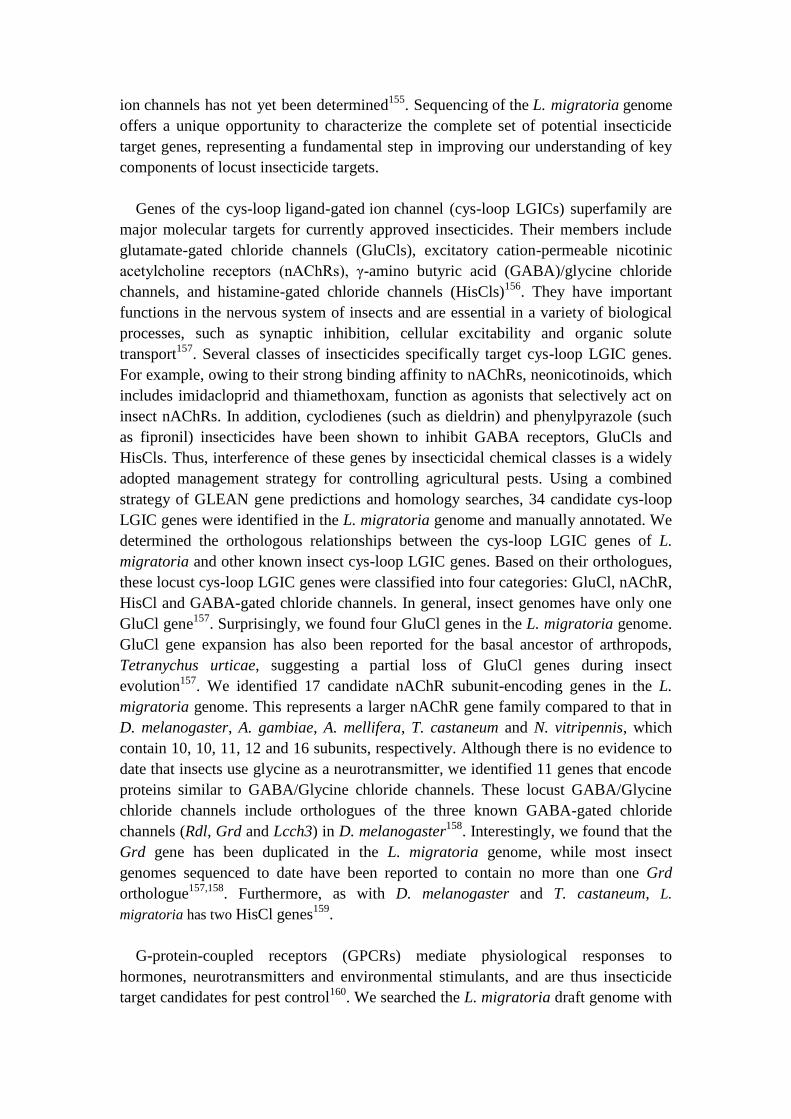
ion channels has not yet been determined155
. Sequencing of the L. migratoria genome
offers a unique opportunity to characterize the complete set of potential insecticide
target genes, representing a fundamental step in improving our understanding of key
components of locust insecticide targets.
Genes of the cys-loop ligand-gated ion channel (cys-loop LGICs) superfamily are
major molecular targets for currently approved insecticides. Their members include
glutamate-gated chloride channels (GluCls), excitatory cation-permeable nicotinic
acetylcholine receptors (nAChRs), γ-amino butyric acid (GABA)/glycine chloride
channels, and histamine-gated chloride channels (HisCls)156
. They have important
functions in the nervous system of insects and are essential in a variety of biological
processes, such as synaptic inhibition, cellular excitability and organic solute
transport157
. Several classes of insecticides specifically target cys-loop LGIC genes.
For example, owing to their strong binding affinity to nAChRs, neonicotinoids, which
includes imidacloprid and thiamethoxam, function as agonists that selectively act on
insect nAChRs. In addition, cyclodienes (such as dieldrin) and phenylpyrazole (such
as fipronil) insecticides have been shown to inhibit GABA receptors, GluCls and
HisCls. Thus, interference of these genes by insecticidal chemical classes is a widely
adopted management strategy for controlling agricultural pests. Using a combined
strategy of GLEAN gene predictions and homology searches, 34 candidate cys-loop
LGIC genes were identified in the L. migratoria genome and manually annotated. We
determined the orthologous relationships between the cys-loop LGIC genes of L.
migratoria and other known insect cys-loop LGIC genes. Based on their orthologues,
these locust cys-loop LGIC genes were classified into four categories: GluCl, nAChR,
HisCl and GABA-gated chloride channels. In general, insect genomes have only one
GluCl gene157
. Surprisingly, we found four GluCl genes in the L. migratoria genome.
GluCl gene expansion has also been reported for the basal ancestor of arthropods,
Tetranychus urticae, suggesting a partial loss of GluCl genes during insect
evolution157
. We identified 17 candidate nAChR subunit-encoding genes in the L.
migratoria genome. This represents a larger nAChR gene family compared to that in
D. melanogaster, A. gambiae, A. mellifera, T. castaneum and N. vitripennis, which
contain 10, 10, 11, 12 and 16 subunits, respectively. Although there is no evidence to
date that insects use glycine as a neurotransmitter, we identified 11 genes that encode
proteins similar to GABA/Glycine chloride channels. These locust GABA/Glycine
chloride channels include orthologues of the three known GABA-gated chloride
channels (Rdl, Grd and Lcch3) in D. melanogaster158
. Interestingly, we found that the
Grd gene has been duplicated in the L. migratoria genome, while most insect
genomes sequenced to date have been reported to contain no more than one Grd
orthologue157,158
. Furthermore, as with D. melanogaster and T. castaneum, L.
migratoria has two HisCl genes159
.
G-protein-coupled receptors (GPCRs) mediate physiological responses to
hormones, neurotransmitters and environmental stimulants, and are thus insecticide
target candidates for pest control160
. We searched the L. migratoria draft genome with
protein sequences corresponding to fly GPCRs161
. The searches were performed using
the AUGUSTUS gene prediction program based on protein family specific
conservation162
. Our annotation efforts resulted in the discovery of 90 GPCR genes
composed of 61 rhodopsin-like receptors, 21 secretin-like receptors, 3 metabotropic
glutamate receptors and 5 atypical 7 TM proteins. In the rhodopsin-like receptor
family, we identified receptors for most biogenic amines, several of which are
considered to be key regulators in phase transitions29
. We found 20 GPCRs
responsible for binding of biogenic amines such as dopamine, tyramine, octopamine,
and serotonin (Supplementary Table S35).
Lethal insecticide candidates
Gene overexpression or silencing offers an important tool for development of
alternative pest management strategies. These gene manipulation approaches enable
us to protect crops by up- or down-regulating essential gene functions in pests to kill
them163
. Several essential genes in insects have been approved recently as insecticide
targets; their functions are altered through chemical approaches or via uptake of
dsRNA molecules57,164,165
. However, the number of essential genes successfully
utilized as insecticide targets is rather limited. Integration of genomic information
with essential gene identification based on phenotypic data allows the discovery of
new insecticide targets for suppressing agricultural pests. Complete genome
sequences have been determined for an increasing number of insects from various
orders, and these genomic resources provide a platform to further explore essential
insect genes by comparative genomic analyses. Such analyses can facilitate discovery
of novel insecticide targets that are unique to pests in a fair and effective manner at
unprecedented selectivity. High specificity of gene manipulation approaches is
necessary to guarantee safety to human health. Fine-scale, or even complete,
specificity in essential-gene-based pest management depends largely on the
nucleotide sequence identity between insecticide target genes in pests and
similar-sequence genes of other species, including humans and transgenic plants57
.
Additionally, the specificity may be influenced by nucleotide variations of insecticide
target genes in pests. Therefore, sequence similarity with other species and allelic
variability should be taken into account in the identification of novel insecticide target
genes. In this study, a genome-wide screening of essential genes based on
comparative genomic analyses was carried out to identify candidate insecticide targets
for developing selective, specific and human-safe control approaches. Firstly, all
protein sequences and phenotype data for D. melanogaster and C. elegans were
downloaded from Flybase (http://flybase.org/) and Wormbase (http://wormbase.org/),
respectively. Following the approach used in a previous study56
, genes with mutant
phenotypes of “lethal” and/or “neurophysiology defective” were considered to be
essential in D. melanogaster while those with mutant phenotypes of “lethal”,
“paralyzed”, “movement abnormal” and/or “muscle system physiology abnormal”
were considered essential in C. elegans. Only essential genes were considered for
further analysis. Secondly, protein sequences of the L. migratoria genes were
compared with those of essential genes from D. melanogaster and C. elegans using
reciprocal BLAST searches to determine orthologous relationships. The orthologues
of locust essential genes were defined as those that had best–best hits in BLAST
searches. Thirdly, locust essential genes with sequences similar to those of human
genes were filtered to avoid harmful side effects to human health. Finally, essential
gene targets from single-copy genes or lower diversity genes were given a higher
priority, given that higher allelic variability is likely to contribute to increased
susceptibility towards silencing resistance. Altogether, 166 L. migratoria essential
function genes with orthologous essential functions in C. elegans and D.
melanogaster were identified by this in silico screening approach (Supplementary
Table S35). A large number (51/166, 30%) of these genes have annotated molecular
function of ‘enzyme or transporter or receptor activities’, and comprise diverse classes
of proteins that mediate critical biological process. Among the 166 essential genes,
several belong to molecular classes whose representatives have been successfully
utilized as chemical and RNAi targets57,166
. For instance, kinases, ATPases, synthases,
carboxylasterases and receptors have been confirmed as effective targets for pest
control in several insects57
. In conclusion, our screen revealed many essential genes
that are potential insecticide targets against L. migratoria. Importantly, this approach
can also be applied to other sequenced pests.
RNA interference
RNA interference (RNAi) mediated by short interfering double-stranded RNA
molecules (dsRNA) is a conserved post-transcriptional gene silencing mechanism
involving degradation of a target mRNA in a variety of eukaryotic organisms57
. This
dsRNA-mediated gene silencing can be categorized into two partially overlapping
pathways: the microRNAs (miRNA) pathway and the small interfering RNA (siRNA)
pathway167
. In the miRNA pathway, endogenous genes encoding stem loop hairpin
primary miRNA transcripts are cleaved into a ~70-nucleotide precursor miRNA
molecules, which are processed in the nucleus by a microprocessor complex composed
of Drosha and its cofactor, Pasha168
. The resulting precursor miRNAs are then exported
from the nucleus into the cytoplasm by Exportin-5, a Ran-GTP dependent
nucleo–cytoplasmic transporter169
. Dicer-1 interacts with a dsRNA binding protein
partner, Loquacious (Loqs), to generate a miRNA/miRNA* duplex from precursor
miRNAs170
. In the siRNA pathway, long exogenous dsRNAs are processed into
siRNAs in the cytoplasm by Dicer-2 and a dsRNA-binding domain partner protein,
R2D2171
. Both miRNAs and siRNAs bind the Argonaute (Ago) protein family in the
RNA-induced silencing complex (RISC), resulting in either mRNA degradation or
repression of mRNA translation168
. As observed in the most sequenced insect genomes,
the L. migratoria genome possesses one copy of each gene in the miRNA pathway: one
Ago1, one Dicer-1, one Exportin-5, one Drosha and one Pasha, with exception of the 3
copies of Loqs (Supplementary Table S37). For siRNA biosynthesis, one copy of R2D2
was found in the L. migratoria genome, which is also typical of siRNA machinery in
insects. However, we found duplications of Dicer-2 (2 copies) and Ago2 (2 copies) in
the L. migratoria genome. The duplication in important proteins of siRNA machinery
may reflect a functional expansion of the siRNA pathway, which requires further
understanding their biological significance in locust biology.
Immune system
Locust is a notorious agricultural pest and migrate long distance after swarming.
During them travel, they might encounter numerous kinds of pathogens attacking.
Insect can trigger humoral and cellular immune defenses to resist infections by
organizing the responses of melanization, anti-microbial peptides production and
phagocytosis of hemocytes172
.
Immune genes in L. migratoria were identified by combining the results from both
HMM profile and BLASTP based searches as previously described173
. For the HMM
method, two sets of profiles were used: one was built from manually curated protein
sequences of four dipteran species, D. melanogaster, A. gambiae, A. aegypt,and C.
quinquefasciatus, while the other one was built from automatically defined orthologous
groups across 21 insect species. All protein sequences for each family were
downloaded from ImmunoDB174
(http://cegg.unige.ch/Insecta/immunodb).
MUSCLE175
was used to align multiple protein sequences and HMMER 3.0176
was
used to build profiles. The profiles were then searched against the L. migratoria
proteins. For the BLASTP method, all known immune related genes in D.
melanogastor were downloaded from ImmunoDB and were searched against the L.
migratoria proteins. Then, all the results were integrated to produce the final list of
immune related genes. For the purpose of comparison, the same method was also
applied to the other three species, A. pisum, P. humanus and D. pulex (Supplementary
Table S36).
Using the above procedures, we found that the typical immune pathways including
IMD, Toll and JAK/STAT all exists in L. migratoria. Interestingly, we found that the
humoral immune gene families of prophenoloxidases (PPOs, 8) and serine protease
inhibitors (SRPNs, 23) were expanded in L. migratoria, as the most abundant among
the 5 species. It is known that the SRPNs involved in regulation of serine proteases
cascades that ultimately activate PPO during melanisation response, and these two gene
classes systematically control melanisation cascades spatially and temporally177
.
Moreover, the PGRP class expands as 15 members in locust in comparison of other
insect species. Thus the expansion of these humoral gene classes suggests humoral
immune defences might play a crucial role in L. migratoria life cycle.
Environment friendly biopesticides, such as pathogenic fungus Metarhizium178
, are
widely used to control locust outbreak. However, as in other insects, the efficiency of
bio-pesticide was reduced by the immune system of locusts172
. Based on the
genomic-scale observation, the dissection of the immune system of locust in responses
to the challenge with the pathogenic fungus Metarhizium178
and laminarin179
could
provide the important cues in development of novel pesticides.
Cuticle metabolism
Insect cuticle is an important ecological innovation of a highly successful invertebrate
phylum. It is a strong, light exoskeleton and environmental interface predominantly
composed of an ordered matrix of chitin fibers and protein180
. The biomechanical
properties of cuticle and the control of its deposition during development have long
been of interest to researchers. More recently, evidence has emerged that cuticular
proteins are relevant to problems in applied entomology, such as insecticide resistance,
immune responses, heavy metal tolerance and drought tolerance181
. The insect-specific
metabolism that occurs in the integument is vital for growth and, therefore, is a good
target for development of highly selective insecticides182
. Here, we identified several
major gene families, including cuticular proteins, chitinase and yellow proteins, which
are involved in insect cuticle metabolism by conducting genome-wide searches using
homologue BLAST.
The cuticle consists mainly of chitin fibers embedded in a matrix of a large number
of cuticular proteins (CPs)183
. Hundreds of CPs have now been identified from various
insect species184
. The vast majority of these proteins belong to the CPR family, which is
defined by a well-conserved domain termed the Rebers and Riddiford Consensus (R&R
Consensus) and also recognized as pfam00379. This family has two distinct groups—
RR-1 in soft cuticles, and RR-2 present in proteins from hard cuticles185
. Putative
cuticular protein genes containing the pfam00379 domain were searched using
InterproScan with IPR000618. The InterproScan searches annotated 110 putative
cuticular protein genes in the L. migratoria genome (Supplementary Table S38). R&R
consensus in each putative cuticular protein gene was further identified by using a web
server based on profile hidden Markov models in the cuticleDB website, which is
capable of RR-1 and RR-2 consensus classification186
. Thirty-two genes were
identified as RR-1 cuticular protein genes and forty-nine were found to be RR-2
cuticular protein genes. Despite showing sequence similarity with known cuticular
protein genes, nineteen other genes failed to be classified using the cuticleDB searches.
Chitin is an important component of the exoskeleton of arthropods, but it is absent in
vertebrates. Therefore, it represents a useful target for drugs against insects. During
insect growth and development, the cuticle must be degraded periodically and replaced
to allow for growth, maturation and repair187
. Chitinolytic enzymes (chitinase) play
important roles in shedding of the old cuticle and turnover of both the PM and tracheal
lining. Chitinase (EC 3.2.1.14, endochitinase) is an enzyme that catalyzes the random
hydrolysis of N-acetyl-b-D-glucosamine b-1, 4 glycosidic linkages in chitin and
chitodextrins in a variety of organisms. All insect chitinases belong to family 18 of
glycosylhydrolases and many of them may be involved in cuticle turnover, digestion
and PM degradation during molting. We identified a total of 13 chitinase and
chitinase-like genes in the L. migratoria genome based on the presence of signature
sequences of insect chitinases by using homologue searching (Supplementary Table
S39).
The yellow gene family is perhaps one of the most enigmatic families discovered so
far. There is some evidence that one of the primary functions of insect yellow genes is
related to cuticle and eggshell (chorion) formation and hardening during insect
development, and that the yellow gene family is vital for insect survival188
. The unusual
phylogenetic distribution of yellow-like sequences suggests either multiple horizontal
transfer from bacteria into eukaryotes, or extensive gene loss in eukaryote lineages. The
yellow gene family contains 10 to 15 members in most insect genomes, but the A.
mellifera yellow gene family has 26 individual yellow-like genes189
. Using the D.
melanogaster YELLOW protein sequence as query sequences for iterated
PSI-BLAST searches, we found a gene family composed of 13 members, each of
which contained a conserved MRJP domain. We named it the YELLOW protein
family of L. migratoria (Supplementary Table S40).
Supplementary Methods
Genome Sequencing, Assembly and Evaluation
Samples for genome sequencing
Locust swarms devastate crops and cause major agricultural damage. They occur in
many areas, especially in African, Asian, and Australian countries (Supplementary
Figure S1). The migratory locust Locusta migratoria is one of the most famous locust
species and is considered a model for the study of insect physiology. Whole genome
sequencing of L. migratoria will enhance our ability to understand locust biology and
may provide effective choices for our battle against locust plagues.
The strain used in this study for genome sequencing originated from the inbred
laboratory strains of solitarious locusts at the Institute of Zoology, CAS, China16
.
Both colonies were reared under a 14:10 light/dark photo regime at 30℃ and on a
diet of fresh greenhouse-grown wheat seedlings and wheat bran. To produce an even
more inbred line, a sibling female adult and male adult were mated and eight
generations of sib mating were then allowed to occur. DNA for genome sequencing
was extracted from the whole body of one female adult except its guts.
Genome size estimation
Estimation of genome size using k-mer. K-mer analysis has previously been used to
estimate genome size190
. In this study, based on a k=17 estimation, the L. migratoria
genome size was estimated to be 6.38 Gb (Supplementary Table S2, Supplementary
Figure S2). However, based on k-mer distribution, we assumed that there was certain
degree of heterozygosity in the L. migratoria diploid genome.
Estimation of genome size using flow cytometric analysis. The genome size of L.
migratoria was determined with flow cytometry, using 4'-6-Diamidino-2-phenylindole
(DAPI) as the stain and Mus musculus testis cells as internal standards. The samples
from L. migratoria testis cells of one male and the hemolymph of one female were
tested in the flow cytometric analysis. We estimated the L. migratoria genome size to
be ~6.3 Gb per haploid genome (Supplementary Figure S3). Our estimation was close
to the previous Feulgen densitometry measurement that indicated that the locust
genome size ranged from 5.28 to 6.35 pg/1C or approximately 5.21 to 6.27 Gb per
haploid genome191,192
.
RAD sequencing and Genetic linkage group construction
The mapping cross. A male L. migratoria from Hainan province was crossed with a
female from the laboratory raised population, the same lineage used for the reference
sequence. DNA from 106 F1 (F:55, M:51) individuals and two parents was isolated
using QIAGEN DNeasy Blood&Tissue Kit (Qiagen) after getting rid of the whole
gut.
RAD library preparation and sequencing. Approximate 1μg genomic DNA of each
individual was digested with 20U EcoRI for 1 hour at 37. Then the digestion products
were ligated to a modified Illumina P1 adapter which has a unique index. The ligation
products from 24 individuals were pooled together and sheared to an average size of
500 bp. DNA samples were electrophresised on a 2% TAE gel, and DNA with length
350 bp – 500 bp was isolated with gel extraction kit (Qiagen). After end polishing and
adenine adding, samples were ligated with an Illumina P2 adapter. Finally the libraries
were enriched by PCR amplification and qualified by Agilent 2100 test and Q-PCR.
Illumina protocols were followed for cluster generating and sequencing. One hundred
and six F1 individuals and two parents were sequenced with 50 bp single end on a
HiSeq 2000 platform. Parents and F1 individuals were sequenced at ~20X and ~10X,
respectively.
SNP calling. The reads were aligned to the genome using BWA (version 0.6.2) and
the SNPs for every individuals were called using “samtools pileup”60
. Only the unique
mapped reads were used. The SNPs were further filtered using "samtools.pl varFilter".
All the SNPs sites across all F1 progenies were merged and the sites that exist or not
be covered in the two F1 parents were filtered.
Genetic linkage group construction. Finally, 8,708 markers were classified into
11 linkage groups using minimum LOD 25. Each linkage map was constructed using
JoinMap 3.061
. Assembled sequences were mapped to the linkage group based on the
marker position. Totally, 7,165 scaffolds were anchored with accumulated length 2.9
Gb (44.7% of the genome).
Genome Assembly Evaluation
Strategies for resequencing-based genome assembly quality evaluation have been
described previously12
. To assess the representative of the assembly, 135 Gb (~22X)
high quality reads with insert sizes of 200 bp were aligned onto the assembly using
MAQ-0.7.159
with default parameters except -C 1. Unmapped reads were further
aligned using BLAT with the following parameters: -minScore=80, -maxIntron=50,
-repMatch=100. SNP calling was carried out using samtools pileup pipeline.
A total of 94.37% of the reads (90.21% by MAQ and 4.16% by BLAT) could be
mapped to the assembly, suggesting that nearly the entire L. migratoria genome was
represented in our assembly. Completeness of the assembly was assessed by the
sequencing depth of each base. The proportion of a given depth was calculated and
plotted, then compared to the theoretical Poisson distribution with a mean
corresponding to the peak (here is 22x) in our data (Supplementary Figure S4).
However, there was a minor peak at half of the peak, which suggested the presence of
some redundancy in the assembly. The redundancy could have been caused by
heterozygosity, which makes the regions with higher heterozygous between sister
chromatids were assembled into two sequences193
, which was supported by Fig 1a
track b. We found the depth distribution of the repeat regions was similar to those of
the whole genome. However, the depth distributions of the gene body region of all
genes and all the paralogs were similar to the theoretical distribution, which gave us
confidence for further analysis. The positions with depth three times higher than 22x,
comprised 1.14% of assembled sequences, indicated that repeat collapse was not a
serious issue in our assembly.
To evaluate the assembly quality, 9 BACs (bacterial artificial chromosomes) were
sequenced using Illumina HiSeq 2000 with 500 bp insert size and >100x coverage. The
reads for each BAC were assembled with SOAPdenovo v1.05 separately to avoid the
influence of repeat sequences and heterozygosity. For each BAC, different k-mer sizes
were optimized. To validate accuracy of the assembly and to connect the BAC
fragments, we also sequenced ~1.5x Sanger paired-end reads with 3-5 Kb insert sizes
for 6 BACs and then mapped the Sanger reads to the assembly. Two fragments were
connected if the Sanger paired-end reads were mapped with correct direction and
proper distance. The statistics for accuracy of the BAC assembly by Solexa
sequencing were assessed through aligning Sanger reads to the assembly
(Supplementary Table S4). The sequencing error rates were estimated at 4 x 10⁻⁴
. The
longest scaffold in each BAC assembly, ranging from 57-109 Kb, was chosen to
evaluate the genome assembly (Supplementary Table S5). The alignment was carried
out using LASTZ194
with the following parameters: --match=1,5; --gap=6,1;
--seed=match15; --ambiguous=n; --identity=80; --format=axt. The aligned regions
were then linked using chainNet195
. On average, 94% of regions of these BACs were
covered by the assembly. The assessment results are shown in Supplementary Figure
S5 and the legends there showed the methods. In BAC 107-38, the gap region in the
genome assembly was annotated as repeat regions in the corresponding region of the
BAC, which was a known shortcoming of the next generation sequencing
assembler196,197
. The gap length in the genome assembly was longer than the actual
gap length which might also lead to the larger assembly. The depth of BAC 107-38
was also normally distributed around 20X. However, all of the gene exons were
assembled well. In BAC 107-52, several regions, illustrated by light red rectangle
(Supplementary Figure S5), showed extremely low depth. However, the depth of the
genome assembly was normal (data not shown). Manual alignments of the two
regions demonstrated that they were aligned well between the BAC and the genome
assembly. However, their identity was lower than 90%, indicating heterozygosity.
Since the maximum mismatch tolerance for a 32-bp seed is 2 in BWA
(Burrows-Wheeler Alignment tool), the reads in these heterozygous regions could not
be aligned with default parameters198
.
The gene region coverage of the assembly was also evaluated. We downloaded
41,880 EST sequences (Supplementary Table S6) > 200 bp long from LocustDB199
.
The ESTs were aligned to the assembly genome using BLAT200
with default
parameters. The cut-off for identity was set to 80%. More than 96.75% of ESTs with
length > 500 bp were covered by the genome at > 90% coverage. We also aligned 71
complete L. migratoria CDS (Coding DNA Sequence) from GenBank to the genome
assembly. On average, 95.72% region of these CDSs was covered by a single best piece
(Supplementary Table S7). Additionally, among the 248 highly conserved Core
Eukaryotic Genes201
, 246 (99.19%) could be covered by more than 90% using
TBLASTN searches. Finally, the RNA-seq mapping ratios of the L. migratoria genome
assembly were comparable to that of previously published genomes (Supplementary
Table S20). More than 75% of the reads in all the samples were aligned to the genome.
In conclusion, the genome assembly covered most of the coding genes accurately,
which provided a solid base for further analysis.
Genome annotation
Gene annotation pipeline
Gene set prediction. For homology-based prediction, protein sequences of four insects
were retrieved from public genome databases (of Drosophila melanogaster from
Flybase, Apis mellifera from BeeBase, Acyrthosiphon pisum from AphidBase, and
Pediculus humanus from VectorBase). These protein sequences were aligned to the L.
migratoria genome using TBLASTN (E-value ≤ 1E-5) and the matches with length
coverage > 20% of the homologous proteins were considered as gene model candidates.
Then, to improve gene models, the corresponding homologous genome sequences were
aligned against the matching proteins using Genewise127
.
For de novo prediction, Augustus62
, SNAP63
and Glimmer-HMM64
were used to
determine de novo predicted gene structures on the repeat masked assembly
sequences. RefSeq proteins from A. pisum and P. humanus were used as training data to
obtain suitable parameters in the L. migratoria gene prediction.
For transcriptome-based prediction, ESTs and RNA-seq data were incorporated into
gene prediction. The L. migratoria ESTs were aligned against genome sequences using
BLAT (identity ≥ 95%, coverage ≥ 90%) to generate spliced alignments. Spliced EST
alignments were identified using PASA to define model gene structures202
. TopHat203
was applied to align the RNA-seq reads of multiple libraries to the genome assembly.
To obtain transcript structures, Cufflinks204
was used to combine the junction sites from
different libraries.
Finally, homology-based, de novo derived and transcript gene sets were merged to
form a comprehensive and non-redundant reference gene set using GLEAN66
. GLEAN
genes were filtered if they satisfied any of the following criteria: 1) coverage < 50% of
any evidence; 2) genes that were only supported by de novo evidence, with the highest
expression level RPKM (reads per kilobase per million) < 5 and with RNA-seq read
mapping region < 50% at all the libraries; 3) length of deduced protein sequences < 50
aa (amino acid).
Connecting split gene. Gene sets from gene annotation pipelines frequently contains
split genes, which are annotated fragments on the same scaffold or across scaffolds
that actually belong to the same gene205,206
. To remove unreasonable gene models
from our reference gene set, we performed large-scale manual curation. We first
searched for split genes using ESPRIT206
, which was developed based on proteomes
of relatively distantly related species as references. Homologous proteins from seven
insect species, including A. pisum, P. humanus, D. melanogaster, T. castaneum, B.
mori, A. mellifera, and A. gambiae, were used as evidence. In order to maximize
identification of split genes, we tested several combinations of parameters and finally
selected the following: MinSeqLenContig 20, MinProbContig 0.4, MaxContigOverlap
5, MinBestScore 250, DistConfLevel 5, AllowMultipleHits, StablepairTol 1.81. A
total of 50 genes were refined using these parameters.
We also developed a pipeline to integrate RNA-seq data as evidence to connect
split genes. Our method was inspired by Mortazavi et al, who have conducted
transcriptome scaffolding using RNAPATH integrated within the ENRAGE
package207
. It combined the RNA-seq and homologous protein data and provided
confirmation of the authenticity of the connections. The method is described below.
To obtain evidence of homologous genes, protein sequences from the seven insect
species same to ESPRIT were utilized. All insect proteins were searched against the
GLEAN gene set using BLASTP with parameters "-e 1e-2 -F F". The fragmental hits
were then conjoined linearly by the SOLAR program208
. Two GLEAN genes were
supported by one homologous protein if: 1) two GLEAN genes with > 40% of the
region were covered by the same homologous gene, and 2) no obvious conflicts
occurred in hit overlap, strands and directions on the scaffold.
RNA-seq reads with unique mapping in the exon region were collected.
Split gene pairs were determined.
Based on evidence from the above two steps, two GLEAN genes were considered split
from the same gene if they were hit by at least three RNA-seq read pairs or were
located on the same scaffold, and were supported by at least one homologous protein.
Gene pairs that were only supported by less than three RNA-seq pairs were omitted to
avoid random mapping. A total of 3,953 gene pairs satisfied these criteria. The two
GLEAN genes of any given split gene pair were connected in the following steps.
Split gene pairs were clustered. In one cluster, any two genes could be connected
through at least one path. Any two genes from two different clusters could not be
connected. A new split gene was added to the cluster if it could be connected to any
member in the cluster.
Split genes that belonged to the same cluster were connected following these
guidelines:
All members of a cluster must be covered by at least one homologous protein.
Clusters that did not satisfy this criterion were manually split.
The GLEAN gene pairs with direction or strand conflict for any supported
homologous proteins in one cluster have been manually checked.
Based on the direction of homolog alignment, the genome sequences of the genes in
one cluster were connected. Gene prediction was performed using GeneWise based on
the homolog protein with the highest blast score among the seven insect species. If the
cluster contained more than one assembly sequence, the direction and strand were also
considered. A total of 50 “N” were placed between two sequences and the coordinates
were adjusted.
Based on this procedure, 2,396 GLEAN genes were refined, which covered all the
genes that were discovered by the ESPRIT program.
Gene filtering based on the coverage depth of resequencing reads. To lessen the
influence of assembly redundancy on gene prediction, we further filtered the GLEAN
gene set based on the coverage depth of resequencing reads. The average coverage
depths of genic regions were calculated based on the WGS (Whole-Genome Shotgun)
reads re-mapping. Based on the depth distribution (Supplementary Figure S4) and
average depth of 20x, we set the cut off to 15x as the half average depth. All the CDS
sequences were self-to-self aligned using BLAT. If two CDSs had average depth < 15x,
the percentage of half depth positions > 50%, the alignment identity > 90% and the
overlap ratio > 70% to any sequences, one of them was considered redundant, and the
longer one was retained. Finally, 210 genes were filtered.
Manual curation. Finally, we further manually improved 2,192 functionally
important genes involved in detoxification, chemoreception, energy metabolism,
phase changes and so on. Various information were integrated into the integrative
genomics viewer141
, including homologues from the 10 insects and human genomes,
genomic BLAT searches of ESTs and RNA-seq data, location of junction sites,
GLEAN gene structures, isoforms predicted by cufflinks and prediction of three de
novo methods. All of these genes were visually inspected to avoid erroneous gene
models.
After filtering and manual correction, 17,307 genes were obtained (Supplementary
Table S8), among which 6,837 (39.50%) were supported by three evidence, at least
9,170 (52.98%) were supported by homologous genes, 11,562 (66.81%) were
supported by RNA-seq/EST, and 16,244 (93.86%) genes had RPKM > 1 in at least one
sample.
To evaluate gene quality, we compared the gene parameters to other sequenced
insect gene sets (Supplementary Table S8). As a consequence of large intron size,
mRNA lengths of L. migratoria are longer than that of other insects and slightly longer
than that of humans. The average CDS length is a little shorter than those of other
insects, while the average exon number per gene is comparable to those of other
insects. However, the average exon length is shorter than those of all insects but
similar to those of humans.
Protein coding gene function assignment
Protein coding gene functions were assigned based on the best match derived from
alignments to proteins annotated in SwissProt, TrEMBL209
databases using BLASTP
with E-value < 1E-5. The KEGG210
pathway was annotated using KAAS211
web
service version 1.64a, BBH method, by searching against a representative set plus all
available insect species with default parameters. We annotated motifs and domains
using InterProScan212
(version 4.7) by searching against the InterPro213
database.
Descriptions of gene products including Gene Ontology214
were retrieved from InterPro.
The statistics of annotated results are listed in Supplementary Table S9.
Repeat annotation
Both homology-based and de novo methods were used to perform interspersed repeat
identification. We first scanned the draft genome sequence assembly of L. migratoria
to identify putative repeat regions using the RepeatModeler package, a tool for de novo
repeat family identification and modeling based on two de-novo repeat finding
programs, RepeatScout and RECON. Unclassified repetitive elements from the
RepeatModeler predictions were identified using the REPCLASS package, a program
that integrates three different independent classification modules: homology, structure
and target site duplication215
. Tandem repeats were searched using the program
Tandem Repeat Finder216
with default settings. We found that most of these repeat
elements showing lower similarity to known repeat elements of sequenced insects
could not be classified by homology-based approaches in the previous steps. Therefore,
additional approaches were conducted based on the de novo methods. A machine
learning approach was adopted to classify unknown repeat elements in the previous
steps into main functional categories using the TEclass program217
. The total
proportion of the genomic region containing interspersed repeat elements was
estimated by RepeatMasker searching based on the integrated consensus library.
Since predictions made by different methods lead to redundant repeat annotations, an
additional filter step was adopted to remove the redundant regions of repeats. Three
priority levels were assigned to all the consensus repeats. Known TEs from
homology-based annotation had the highest priority, while tandem repeats and
unknown TEs received the lowest priority. If two known TEs overlapped, the latter one
was split at the end of the former one, and a fragment of the latter one remained.
However, unknown TEs and tandem repeats were merged into one longer TE or repeat
when they overlapped with each other. Considering that this filter step resulted in many
short fragments, we removed fragments shorter than 50 bp.
Estimation of divergence time for interspersed repeats
Substitution rates in interspersed repeats can be used to estimate the time of divergence
on the assumption that they are subject to decay with the same substitution rates under
weak selective constraints. The time of divergence of interspersed repeats was
estimated according to the molecular clock equation R = K/2T, where R is the average
substitution rate, K is the average number of substitutions per site, and T is the
divergence time between species. The number of substitutions per site was calculated
under the one-parameter Jukes-Cantor model [-3/4 ㏑(1-4/3P)], where P represents the
sequence divergence rate between fragmented repeats and consensus sequences. The
average nucleotide substitution rate for interspersed repeats is 1.66 × 10⁻⁸
per site per
year according to substitution rates for a nuclear pseudogene in insects218
, and this rate
is close to the numbers reported for substitutions in the intron region in insects219
.
Deletion rates measurements across insect genomes
Long terminal repeat (LTR) retrotransposons constitute a substantial fraction of
eukaryotic genomes, and they are characterized by the presence of flanking LTR
sequences. The LTR sequences are the direct sequence repeats that flank the internal
protein coding domains which include genes encoding both structural and enzymatic
proteins. The structural and enzymatic proteins typically are composed of open reading
frames for the GAG and POL proteins. The GAG protein is a retroviral structural
protein that is capable of assembling into virus-like particles, and the POL protein
encodes several enzymatic functions, including a protease, a reverse transcriptase and
an integrase. In addition, two structural sites critical to replication, the primer-binding
site (PBS) and polypurine tract (PPT), were also includes in the LTR retrotransposon
identification. The two LTR sequences of LTR retrotransposons are identical at the
time of retrotransposition into the host genome, and thus the degree of divergence
between the two LTRs provides an estimate of the time that has elapsed since
retrotransposition220
. Therefore, it is feasible to identify intact LTR retrotransposons
based on the sequence similarity (identical or nearly identical) of LTRs sequences and
internal structural signatures. Because the insertion and deletion in most of new
retrotransposition copies can lead to loss-of-function, LTR retrotransposons are
presumably neutral proxies and under relaxed selection pressures. The RepeatMasker
program was used in the genome sequence scanning to identify the LTR
retrotransposon copies using the intact LTR retrotransposons as query221
. The repeat
copies search was performed using WU-blast as sequence search engine222
. Scanning
was carried out using a cutoff value of 300 bp in length. Gaps and ambiguous sites were
removed from the WU-blast alignment in order to ensure accuracy of the deletion rates
measurements.
Comparative genomics analysis
Orthologous gene family assignment
Treefam67
defines a gene family as a group of genes descending from a single gene in
the last common ancestor. We constructed a pipeline to cluster individual genes into
gene families and performed phylogenetic analyses:
Data preparation. We collected protein-coding sequences more than 30 aa of sequenced
related species as well as those of L. migratoria. In total, 10 species were selected for
orthologous gene assignment: D. pulex, P. humanus, A. pisum, A. mellifera, N.
vitripennis, T. castaneum, B. mori, A. gambiae, A. aegypti, and D. melanogaster. The
longest protein isoform was retained for each gene.
Pair-wise BLAST alignment (graph building). ALL-to-ALL alignment of all proteins
were performed using BLASTP with E-value < 1E-5, and the fragmental alignments
were conjoined using SOLAR208
. A connection (edge) between two nodes (genes) was
assigned if more than 1/3 of the region was aligned in both genes. H-score ranging from
0 to 100 was used to weigh the similarity of two genes (edge). For two genes G1 and
G2, the H-score was defined as score (G1G2) / max (score(G1G1), score(G2G2))(score
= BLAST raw score).
Gene family construction. The average distance was used in the hierarchical clustering
algorithm, the minimum edge weight (H-score) was set to 10 and the minimum edge
density (total number of edges/theoretical number of edges) was set to > 1/3. Having
obtained gene families, we could extract special genes of one species or some relative
species sharing common phylogenic node.
Phylogeny and orthology analysis. We performed multiple alignments of protein
sequences for each gene family using MUSCLE175
and converted the protein
alignments to CDS alignments using an in-house Perl script.
Phylogeny, divergence estimation and gene family evolution
It has been suggested that combining data from multiple genes may potentially alleviate
misleading phylogenetic signals in individual genes223
. We conducted phylogenomic
analysis based on the concatenated data set from universal single-copy genes. Gene
orthologous relationships were identified with Treefam using all the protein sequences
predicted by merging the GLEAN and manually curated gene sets. The predicted amino
acid sequences of the 122 universal single-copy orthologues were aligned in MAFFT
with its l-INS-i algorithm142
. The resulting alignments were then manually inspected,
and ambiguously aligned regions containing gaps were excluded from further analyses.
Sequences from individual gene regions were concatenated into the final set of 67,387
amino acids. The phylogenomic trees were inferred using maximum likelihood (ML)
algorithms. The ML analyses were performed on the PhyML 3.0 program with the JTT
substitutional matrix and discrete gamma distribution in four categories + invariant
sites131,224
. Gamma shape parameter and the fraction of invariant sites estimated from
the data set were set to 1.065 and 0.148, respectively. Tree topology search by
nearest-neighbour interchanges (NNIs) was used, and BioNJ tree was used to designate
the starting tree. Bootstrapping was done with 100 re-sampling replicates to assess the
node supports.
Estimates of divergence times for insect lineages were done using Bayesian relaxed
molecular clock approaches implemented in MCMCTREE from the PAML package225
.
This method allows the use of soft age bounds and flexible probability distributions to
accommodate uncertainties in fossil calibrations226
. We considered Daphnia
(Crustacea: Branchiopoda) to be outgroup of Insecta. The MCMC was run twice each
for 100,000 generations, sampling every 2nd tree with a burn-in phase of 10,000. The
simulations were repeated with different starting seed values to check for convergence
of the MCMC chain. Fossil calibrations of nodes were set as soft bounds in the
MCMCTREE analysis. Since a prior age for the root node (in our case the
Daphnia–Insecta split) must be specified to effectively constrain the standard deviation
of the estimated time, the minimum age of the split between Branchiopoda and
Hexapoda took place ~550 MYA as suggested in a previous study227
. This constraint is
closer to the molecular divergence evidence in a recent study228
, and is also consistent
with the fossil record that the oldest known fossils of hexapods are Collembolans of
Rhyniella praecursor from the Lower Devonian period 400 MYA229
. We selected the
following fossil calibrations: 1) the split between Aculeata (include Apis) and
Chalcidoidea (include Nasonia) dates to the middle Mesozoic period 140~180
MYA230
; 2) the minimum data for the spilt between Lepidoptera and Diptera is around
290 MYA230
.
The rate and direction of gene family size in L. migratoria and its related species was
inferred using CAFE68
, which is based on a stochastic birth-death model. In order to
analyze gain and loss of genes with consideration for the phylogenomic tree, we built a
pipeline as follows: Based on the phylogenomic tree and the gene family information
gathered from the above steps, we estimated the average rate of gene turnover λ, which
is the probability of both gene gain and loss per gene per unit time in the phylogeny.
The significance of changes in gene family size was inferred in each branch.
Intron evolution
Intron analysis in orthologous genes. Genome sequences, gene models and
coordinates were downloaded from public databases as described above. The intron
length and intron number were extracted from the GFF files using customized Perl
scripts to perform multiple gene comparison. The frequency distributions were built
for each species and plotted using customized R scripts. To alleviate bias from multiple
gene comparison, intron information of the 1:1 orthologous genes was also further
retrieved based on the gene family.
Identification of U12 introns. We used the program Tophat to perform spliced
alignments of the reads against the L. migratoria genome203
. Tophat identifies splice
junctions by mapping paired-end RNA-seq data to the genomic sequences in two steps.
In the first step, all reads are aligned to the genomic sequences, and reads that do not
match any location are set aside as ‘initially unmapped reads’. In the following step, the
program identifies putative exons and assesses whether previously unmatched reads
span any of these islands. Tophat calls a splice junction if at least one read is found that
spans two expressed islands (hereafter called ‘spliced reads’). By default, Tophat finds
any reads that span splice junctions by at least five bases on each side. Tophat also
considers paired-end read information when available to support detected splice
junctions. We considered a splice junction expressed in a given subspecies if it was
covered by ≥5 spliced reads. The U12 introns have consensus sequences at the 5’ splice
site (RTATCCTTT) as well as branch site (TCCTTAACT), which are more conserved
than their counterparts in U2 introns80
. However, the 3’ splice site is more variable. We
considered the intron containing these two properties as the U12-type intron. The splice
junctions that meet the criterion of U12 intron identification were retained for further
comparison across species.
Transcriptome Analysis
Samples for RNA sequencing
Brain transcriptome during phase transition processes To reveal the molecular
mechanisms underlying locust phase change, we previously used two colors cDNA
array10,11
determine the differential gene expression profiles from locust head tissues
between both phases and used RNA-seq70
determine the differential gene expression
profiles from locust whole body between both phases. These studies had highlighted
that the critical roles of the peripheral and central nervous systems in locust phase
change. So, to further elucidate signaling pathways involved in phase change in
central nervous systems, we here carried out the transcriptome sequence for brain
tissues in the early process of phase change.
Gregarious and solitarious locusts were reared as previously described10
. For
isolation of gregarious L. migratoria (IG), the 3-day-old fourth-instar gregarious
nymphs were separately reared in solitarious-rearing cages. After 0, 4, 8, 16, 32 hours,
their brain tissues were dissected and immediately put into liquid nitrogen. Each
treatment condition contained 20 individuals. For crowding of solitarious L.
migratoria (CS), two solitarious fourth-instar nymphs were introduced into the
gregarious-rearing cages, in which there were 20 3-day-old gregarious nymphs. After
placing together with the stimulus group for 0, 4, 8, 16, 32 h, solitarous L. migratoria
were removed from the cages for dissection of brain tissue. Each treatment condition
contained 20 individuals. All samples were immediately put into liquid nitrogen and
stored at -80oC until further analysis. All insects were dissected at 3:00 PM.
Transcriptome of ten tissues Tissues of brain, antenna, fat body, midgut, testis,
ovary, thorax flight muscle, hind leg, hemolymph, gangalia, labipalp and wing were
collected from gregarious adults L. migratoria.
Transcriptome of mixed samples These samples were from various developmental
stages, including eggs.
Transcriptome of flight Adult male locusts aging at least 8 days after the final molt
were used and a computer-aided flight mill system similar to Schumacher et al231
was
constructed. The treated locust was fixed to the arm of the flight mill by a thin copper
wire surrounding the metathorax and the wings were free to fly. For the control locust,
the wings were simultaneously fastened to prevent flying. Ambient temperature was
maintained at 30±2 °C. To initiate flight, a 2-second wind stimulus from an automated
wind supplier above the mill was exerted when the locusts stopped flying for a period
of 20 seconds. When the treated locust flied for a total of 2 hours, fat bodies were
dissected from the treated and control locusts, and these tissues were each used for
subsequent RNA extraction.
Alternative splicing analysis
Short paired-end reads from transcriptome sequencing datasets were aligned to genome
sequence using TopHat package to identify splicing junction sites. TopHat first aligns
the raw reads onto the reference and reports the “initially unmapped reads” (IUM reads)
not mapped to the genome.Then, through a seed-and-extend strategy,TopHat finds
reads spanning junctions from IUM reads. Based on the junction result identified by
TopHat203
and predicted gene structures, we identified alternative splicing events by
comparing the position of the observed junction sites to the annotated gene models and
categories them into seven categories: exonskipping (ES), intron-retention (IR),
mutually exclusive exon (MXE), alternative 5’ splice site (A5SS),alternative 3’ splice
site (A3SS), alternative first exon (AFE), and alternative last exon (ALE).
The current methods to detect differential splicing always require experimental
replicates and well annotated reference232,233
, which is not satisfied for non model
species. To simplify the question and got credible differential alternative splicing
events, we used two criteria: one was the p value calculated based on fisher’s exact test
or chi-square test, another was the ratio difference of the “percentage spliced in”
(PSI)234
between two samples.
The junction data of every sample was produced from tophat (Supplementary
Figure S21). For each junction, the number of reads that support this junction n and the
number of reads that across this junction N. N was calculated as the maximum read
number across the junction region. To eliminate the bias between samples, the
supporting numbers of original reads were normalized using DESeq’s method235
. The
PSI was defined as n/N. For two samples, the fisher’s exact test or chi-square test was
performed based on the four numbers. The fisher’s exact test was selected when there is
any theory number smaller than 5. P values of multiple test were adjusted using
Benjamini’s FDR65,236
. The differential junctions were detected as adjusted p value <
0.1 and the PSI difference > 20%. BEDTools237
was used to extract the junctions that
overlapped with annotated genes. Finally, 45 differentially spliced genes (DSG) were
found between gregarious and solitarious brain samples (Supplementary Table S23).
Enrichment analysis
Enrichment analysis for the supplied gene list was carried out based on an algorithm
presented by GOstat238
, with the whole annotated gene set as the background. The
p-value was approximated using the Chi-square test. Fisher’s exact test was used when
any expected value of count was below 5. This program was implemented as a
pipeline70
. For the GO and IPR enrichment analyses, in order to obtain succinct results,
if one item was ancestor of another and the enriched gene list of these two items were
the same, the ancestor item was deleted from the results. To adjust for multiple testing,
we calculated the False Discovery Rate using the Benjamini-Hochberg method236
for
each class.
Reduced Representation Bisulfite Sequencing data analysis
Bioinformatic processing of the data
Short reads generated by Illumina sequencing were first processed by Trimmomatic-
0.22239
with parameters “SLIDINGWINDOW:4:15 MINLEN:40” for filtering low
quality, adaptor contaminated reads. After filtering, the remain reads were aligned to
L. migratoria genome sequence using Bismark v0.7.12240
with default parameters.
Bismark aligned the converted reads to the converted reference genome using
bowtie241
(version 2 was used in our analysis), and the unique best alignment was
used to determine the methylation states of cytosine position by comparing the reads
with their corresponding genomic sequences. The unique mapped reads were 39~50%
for the four RRBS and one whole genome libraries (Supplementary Table S16). After
mapping the reads to the reference genome, BAM files were generated. Based on
these BAM files, insert size distribution were plotted using picard
(http://picard.sourceforge.net/). The insert size was ideally centered at 60 bp for short
libraries and 130 bp for large libraries, which were consistent with expect
(Supplementary Figure S15).
The methylation state of cytosine of every reads was extracted using
bismark_methylation_extractor. The extractor outputted the overall methylation level
of three kinds cytosine for all reads, which was defined as the ratio of the number of
methylated C sites to the total number of C sites on the reads (Supplementary Table
S17). Based on the methylation state of cytosine of every reads, the CG methylation
level for the regions of gene body, exon, intron, intergenic sequence, promoter were
calculated (Supplementary Figure S17). In total, 7,568,981 and 7,996,483 CpG sites
were covered by more than 10X for G and S samples respectively. The methylation
levels across all CpGs was also plotted (Supplementary Figure S16) and followed
bimodal distribution. Among these CpG sites, 954,031 (12.6%) and 959,172 (12.0%)
were found in the gene body. In total, 11,447 and 11,337 genes were covered at least
4 CpG sites (Supplementary Table S18).
Differentially methylated genes
To identify differentially methylated (DM) gene (DMG), we first identified DM CG
sites using methylKit version 0.5.7242
. 4,345,168 CpG sites were covered at minimum
10X in both samples. The P-value of Fisher’s exact test of CG site was calculated
using the number of sequenced methylated and non-methylated cytosines in
gregarious and solitarious brain samples. The P-value was adjusted by FDR236
. The
DM CG site was defined as FDR < 0.01 and the difference of methylation level
between two samples > 0.25. Because the reads of RRBS were singled-end in 50 bp
length, the covered regions were not continuous as those whole genome bisulfite
sequencing. So we defined the DMG as those with at least 4 DM CG sites
(Supplementary Table S19). 89 DMGs were identified between two phases in the
genome.
Supplementary References
71. Hemming, C.F. The Locust Menace, (Centre for Overseas Pest Research, 1974).
72. Ye, J. et al. WEGO: a web tool for plotting GO annotations. Nucleic Acids Res
34, W293-7 (2006).
73. Mackenzie, P.I. et al. The UDP glycosyltransferase gene superfamily:
recommended nomenclature update based on evolutionary divergence.
Pharmacogenetics 7, 255-69 (1997).
74. Johnson, G. & Moore, S.W. The carboxylesterase/cholinesterase gene family in
invertebrate deuterostomes. Comp Biochem Physiol Part D Genomics
Proteomics 7, 83-93 (2012).
75. Oakeshott, J.G. et al. Metabolic enzymes associated with xenobiotic and
chemosensory responses in Nasonia vitripennis. Insect Mol Biol 19 Suppl 1,
147-63 (2010).
76. Bactrian Camels Genome, S. et al. Genome sequences of wild and domestic
bactrian camels. Nat Commun 3, 1202 (2012).
77. McLysaght, A., Enright, A.J., Skrabanek, L. & Wolfe, K.H. Estimation of
synteny conservation and genome compaction between pufferfish (Fugu) and
human. Yeast 17, 22-36 (2000).
78. Vinogradov, A.E. Intron-genome size relationship on a large evolutionary scale.
J Mol Evol 49, 376-84 (1999).
79. Tarn, W.Y. & Steitz, J.A. A novel spliceosome containing U11, U12, and U5
snRNPs excises a minor class (AT-AC) intron in vitro. Cell 84, 801-11 (1996).
80. Burge, C.B., Padgett, R.A. & Sharp, P.A. Evolutionary fates and origins of
U12-type introns. Mol Cell 2, 773-85 (1998).
81. Frilander, M.J. & Steitz, J.A. Initial recognition of U12-dependent introns
requires both U11/5′ splice-site and U12/branchpoint interactions. Genes Dev
13, 851-863 (1999).
82. Russell, A.G., Charette, J.M., Spencer, D.F. & Gray, M.W. An early
evolutionary origin for the minor spliceosome. Nature 443, 863-6 (2006).
83. Lin, C.F., Mount, S.M., Jarmolowski, A. & Makalowski, W. Evolutionary
dynamics of U12-type spliceosomal introns. BMC Evol Biol 10, 47 (2010).
84. Bartschat, S. & Samuelsson, T. U12 type introns were lost at multiple occasions
during evolution. BMC Genomics 11, 106 (2010).
85. Burnette, J.M., Miyamoto-Sato, E., Schaub, M.A., Conklin, J. & Lopez, A.J.
Subdivision of large introns in Drosophila by recursive splicing at nonexonic
elements. Genetics 170, 661 (2005).
86. Hatton, A.R., Subramaniam, V. & Lopez, A.J. Generation of alternative
Ultrabithorax isoforms and stepwise removal of a large intron by resplicing at
exon-exon junctions. Mol Cell 2, 787-796 (1998).
87. Law, J.A. & Jacobsen, S.E. Establishing, maintaining and modifying DNA
methylation patterns in plants and animals. Nat Rev Genet 11, 204-20 (2010).
88. Lyko, F. & Maleszka, R. Insects as innovative models for functional studies of
DNA methylation. Trends Genet 27, 127-31 (2011).
89. Peckham, M., Cripps, R., White, D. & Bullard, B. Mechanics and
Protein-Content of Insect Flight Muscles. J Exp Biol 168, 57-76 (1992).
90. Syme, D.A. & Josephson, R.K. How to build fast muscles: synchronous and
asynchronous designs. Integr Comp Biol 42, 762-70 (2002).
91. Rome, L.C. & Lindstedt, S.L. The Quest for Speed: Muscles Built for
High-Frequency Contractions. Physiology 13, 261-268 (1998).
92. Mizisin, A.P. & Josephson, R.K. Mechanical power output of locust flight
muscle. J Comp Physiol A Neuroethol Sens Neural Behav Physiol 160, 413-419
(1987).
93. Dirks, J.-H. & Taylor, D. Veins Improve Fracture Toughness of Insect Wings.
PLoS ONE 7, e43411 (2012).
94. Wootton, R.J. Functional Morphology of Insect Wings. Annu Rev Entomol 37,
113-140 (1992).
95. De Celis, J.F. & Diaz-Benjumea, F.J. Developmental basis for vein pattern
variations in insect wings. Int J Dev Biol 47, 653-63 (2003).
96. Marcus, J.M. The development and evolution of crossveins in insect wings. J
Anat 199, 211-6 (2001).
97. Tobe, S.S. & Pratt, G.E. The influence of substrate concentrations on the rate of
insect juvenile hormone biosynthesis by corpora allata of the desert locust in
vitro. Biochem J 144, 107-13 (1974).
98. Min, K.J., Jones, N., Borst, D.W. & Rankin, M.A. Increased juvenile hormone
levels after long-duration flight in the grasshopper, Melanoplus sanguinipes. J
Insect Physiol 50, 531-7 (2004).
99. de Oliveira Tozetto, S., Rachinsky, A. & Engels, W. Juvenile hormone
promotes flight activity in drones (Apis mellifera carnica). Apidologie 28, 77-84
(1997).
100. Mayoral, J.G., Nouzova, M., Navare, A. & Noriega, F.G. NADP+-dependent
farnesol dehydrogenase, a corpora allata enzyme involved in juvenile hormone
synthesis. Proc Natl Acad Sci U S A 106, 21091-6 (2009).
101. Liu, S. et al. Molecular cloning and characterization of a juvenile hormone
esterase gene from brown planthopper, Nilaparvata lugens. J Insect Physiol 54,
1495-502 (2008).
102. Nilsen, K.A. et al. Insulin-like peptide genes in honey bee fat body respond
differently to manipulation of social behavioral physiology. J Exp Biol 214,
1488-97 (2011).
103. Barbieri, M., Bonafe, M., Franceschi, C. & Paolisso, G. Insulin/IGF-I-signaling
pathway: an evolutionarily conserved mechanism of longevity from yeast to
humans. Am J Physiol Endocrinol Metab 285, E1064-71 (2003).
104. Sajid, W. et al. Structural and Biological Properties of the Drosophila
Insulin-like Peptide 5 Show Evolutionary Conservation. J Biol Chem 286,
661-673 (2011).
105. Gronke, S., Clarke, D.F., Broughton, S., Andrews, T.D. & Partridge, L.
Molecular evolution and functional characterization of Drosophila insulin-like
peptides. PLoS Genet 6, e1000857 (2010).
106. Zhan, S., Merlin, C., Boore, Jeffrey L. & Reppert, Steven M. The Monarch
Butterfly Genome Yields Insights into Long-Distance Migration. Cell 147,
1171-1185 (2011).
107. Brogiolo, W. et al. An evolutionarily conserved function of the Drosophila
insulin receptor and insulin-like peptides in growth control. Curr Biol 11,
213-21 (2001).
108. Pierce, S.B. et al. Regulation of DAF-2 receptor signaling by human insulin and
ins-1, a member of the unusually large and diverse C. elegans insulin gene
family. Genes Dev 15, 672-86 (2001).
109. Van der Horst, D.J. & Rodenburg, K.W. Locust flight activity as a model for
hormonal regulation of lipid mobilization and transport. J Insect Physiol 56,
844-53 (2010).
110. Bickel, P.E., Tansey, J.T. & Welte, M.A. PAT proteins, an ancient family of
lipid droplet proteins that regulate cellular lipid stores. Biochim Biophys Acta
1791, 419-40 (2009).
111. Kimmel, A.R., Brasaemle, D.L., McAndrews-Hill, M., Sztalryd, C. & Londos,
C. Adoption of PERILIPIN as a unifying nomenclature for the mammalian
PAT-family of intracellular lipid storage droplet proteins. J Lipid Res 51,
468-71 (2010).
112. Beller, M. et al. PERILIPIN-dependent control of lipid droplet structure and fat
storage in Drosophila. Cell Metab 12, 521-32 (2010).
113. Miura, S. et al. Functional conservation for lipid storage droplet association
among Perilipin, ADRP, and TIP47 (PAT)-related proteins in mammals,
Drosophila, and Dictyostelium. J Biol Chem 277, 32253-7 (2002).
114. Marchler-Bauer, A. et al. CDD: a Conserved Domain Database for the
functional annotation of proteins. Nucleic Acids Res 39, D225-9 (2011).
115. Teixeira, L., Rabouille, C., Rorth, P., Ephrussi, A. & Vanzo, N.F. Drosophila
Perilipin/ADRP homologue Lsd2 regulates lipid metabolism. Mech Dev 120,
1071-81 (2003).
116. Chmurzynska, A. The multigene family of fatty acid-binding proteins (FABPs):
function, structure and polymorphism. J Appl Genet 47, 39-48 (2006).
117. Barbieri, E. & Sestili, P. Reactive oxygen species in skeletal muscle signaling. J
Signal Transduct 2012, 982794 (2012).
118. Yan, L.J. & Sohal, R.S. Prevention of flight activity prolongs the life span of the
housefly, Musca domestica, and attenuates the age-associated oxidative
damamge to specific mitochondrial proteins. Free Radic Biol Med 29, 1143-50
(2000).
119. Felton, G.W. & Summers, C.B. Antioxidant systems in insects. Arch Insect
Biochem Physiol 29, 187-97 (1995).
120. Corona, M. & Robinson, G.E. Genes of the antioxidant system of the honey bee:
annotation and phylogeny. Insect Mol Biol 15, 687-701 (2006).
121. Koua, D. et al. PeroxiBase: a database with new tools for peroxidase family
classification. Nucleic Acids Res 37, D261-6 (2009).
122. Manevich, Y. et al. 1-Cys peroxiredoxin overexpression protects cells against
phospholipid peroxidation-mediated membrane damage. Proc Natl Acad Sci U
S A 99, 11599-604 (2002).
123. Manevich, Y. & Fisher, A.B. Peroxiredoxin 6, a 1-Cys peroxiredoxin, functions
in antioxidant defense and lung phospholipid metabolism. Free Radic Biol Med
38, 1422-32 (2005).
124. Chen, J.W., Dodia, C., Feinstein, S.I., Jain, M.K. & Fisher, A.B. 1-Cys
peroxiredoxin, a bifunctional enzyme with glutathione peroxidase and
phospholipase A2 activities. J Biol Chem 275, 28421-7 (2000).
125. Gardiner, A., Barker, D., Butlin, R.K., Jordan, W.C. & Ritchie, M.G.
Drosophila chemoreceptor gene evolution: selection, specialization and genome
size. Mol Ecol 17, 1648-57 (2008).
126. Croset, V. et al. Ancient protostome origin of chemosensory ionotropic
glutamate receptors and the evolution of insect taste and olfaction. PLoS Genet
6, e1001064 (2010).
127. Birney, E., Clamp, M. & Durbin, R. GeneWise and Genomewise. Genome Res
14, 988-95 (2004).
128. Altschul, S.F. et al. Gapped BLAST and PSI-BLAST: a new generation of
protein database search programs. Nucleic Acids Res 25, 3389-402 (1997).
129. Keller, O., Kollmar, M., Stanke, M. & Waack, S. A novel hybrid gene
prediction method employing protein multiple sequence alignments.
Bioinformatics 27, 757-63 (2011).
130. Smadja, C., Shi, P., Butlin, R.K. & Robertson, H.M. Large gene family
expansions and adaptive evolution for odorant and gustatory receptors in the pea
aphid, Acyrthosiphon pisum. Mol Biol Evol 26, 2073-86 (2009).
131. Guindon, S. et al. New algorithms and methods to estimate
maximum-likelihood phylogenies: assessing the performance of PhyML 3.0.
Syst Biol 59, 307-21 (2010).
132. Wanner, K.W. & Robertson, H.M. The gustatory receptor family in the
silkworm moth Bombyx mori is characterized by a large expansion of a single
lineage of putative bitter receptors. Insect Mol Biol 17, 621-629 (2008).
133. Jin, X. et al. Expression and immunolocalisation of odorant-binding and
chemosensory proteins in locusts. Cell Mol Life Sci 62, 1156-66 (2005).
134. Vieira, F.G. & Rozas, J. Comparative genomics of the odorant-binding and
chemosensory protein gene families across the Arthropoda: origin and
evolutionary history of the chemosensory system. Genome Biol Evol 3, 476-90
(2011).
135. McGuffin, L.J., Bryson, K. & Jones, D.T. The PSIPRED protein structure
prediction server. Bioinformatics 16, 404-5 (2000).
136. Mackenzie, P.I. et al. Nomenclature update for the mammalian UDP
glycosyltransferase (UGT) gene superfamily. Pharmacogenet Genomics 15,
677-85 (2005).
137. Ahn, S.J. et al. Metabolic detoxification of capsaicin by
UDP-glycosyltransferase in three Helicoverpa species. Arch Insect Biochem
Physiol 78, 104-18 (2011).
138. Ahn, S.J., Vogel, H. & Heckel, D.G. Comparative analysis of the
UDP-glycosyltransferase multigene family in insects. Insect Biochem Mol Biol
42, 133-47 (2012).
139. Hughes, J. & Hughes, M.A. Multiple secondary plant product UDP-glucose
glucosyltransferase genes expressed in cassava (Manihot esculenta Crantz)
cotyledons. Mitochondrial DNA 5, 41-49 (1994).
140. Friedman, R. Genomic organization of the glutathione S-transferase family in
insects. Mol Phylogenet Evol 61, 924-32 (2011).
141. Robinson, J.T. et al. Integrative genomics viewer. Nat Biotechnol 29, 24-6
(2011).
142. Katoh, K., Asimenos, G. & Toh, H. Multiple alignment of DNA sequences with
MAFFT. Methods Mol Biol 537, 39-64 (2009).
143. Darriba, D., Taboada, G.L., Doallo, R. & Posada, D. ProtTest 3: fast selection
of best-fit models of protein evolution. Bioinformatics 27, 1164-5 (2011).
144. Stamatakis, A. RAxML-VI-HPC: maximum likelihood-based phylogenetic
analyses with thousands of taxa and mixed models. Bioinformatics 22, 2688-90
(2006).
145. Singh, S.P., Coronella, J.A., Beneš, H., Cochrane, B.J. & Zimniak, P. Catalytic
function of Drosophila melanogaster glutathione S‐transferase DmGSTS1‐1
(GST‐2) in conjugation of lipid peroxidation end products. Eur J Biochem 268,
2912-2923 (2001).
146. Ishida, Y. & Leal, W.S. Rapid inactivation of a moth pheromone. Proc Natl
Acad Sci U S A 102, 14075-9 (2005).
147. Robin, C., Bardsley, L.M., Coppin, C. & Oakeshott, J.G. Birth and death of
genes and functions in the beta-esterase cluster of Drosophila. J Mol Evol 69,
10-21 (2009).
148. Charpentier, A., Menozzi, P., Marcel, V., Villatte, F. & Fournier, D. A method
to estimate acetylcholinesterase-active sites and turnover in insects. Anal
Biochem 285, 76-81 (2000).
149. Sturm, A., Cunningham, P. & Dean, M. The ABC transporter gene family of
Daphnia pulex. BMC Genomics 10, 170 (2009).
150. Zdobnov, E.M. & Apweiler, R. InterProScan–an integration platform for the
signature-recognition methods in InterPro. Bioinformatics 17, 847-848 (2001).
151. Marchler-Bauer, A. & Bryant, S.H. CD-Search: protein domain annotations on
the fly. Nucleic Acids Res 32, W327-31 (2004).
152. Labbe, R., Caveney, S. & Donly, C. Genetic analysis of the xenobiotic
resistance-associated ABC gene subfamilies of the Lepidoptera. Insect Mol Biol
20, 243-56 (2011).
153. Feyereisen, R. Evolution of insect P450. Biochem Soc Trans 34, 1252-5 (2006).
154. Millar, N.S. & Denholm, I. Nicotinic acetylcholine receptors: targets for
commercially important insecticides. Invert Neurosci 7, 53-66 (2007).
155. Janssen, D., Derst, C., Rigo, J.M. & Van Kerkhove, E. Cys-loop ligand-gated
chloride channels in dorsal unpaired median neurons of Locusta migratoria. J
Neurophysiol 103, 2587-98 (2010).
156. Jones, A.K., Bera, A.N., Lees, K. & Sattelle, D.B. The cys-loop ligand-gated
ion channel gene superfamily of the parasitoid wasp, Nasonia vitripennis.
Heredity (Edinb) 104, 247-59 (2010).
157. Dermauw, W. et al. The cys-loop ligand-gated ion channel gene family of
Tetranychus urticae: implications for acaricide toxicology and a novel mutation
associated with abamectin resistance. Insect Biochem Mol Biol 42, 455-65
(2012).
158. Dale, R.P. et al. Identification of ion channel genes in the Acyrthosiphon pisum
genome. Insect Mol Biol 19 Suppl 2, 141-53 (2010).
159. Jones, A.K. & Sattelle, D.B. The cys-loop ligand-gated ion channel gene
superfamily of the red flour beetle, Tribolium castaneum. BMC Genomics 8,
327 (2007).
160. Bai, H. & Palli, S.R. G Protein-Coupled Receptors as Target Sites for
Insecticide Discovery. in Advanced Technologies for Managing Insect Pests
(eds. Ishaaya, I., Palli, S.R. & Horowitz, A.R.) 57-82 (2012).
161. Brody, T. & Cravchik, A. Drosophila melanogasterG Protein–Coupled
Receptors. J Cell Biol 150, F83-F88 (2000).
162. Stanke, M. & Morgenstern, B. AUGUSTUS: a web server for gene prediction in
eukaryotes that allows user-defined constraints. Nucleic Acids Res 33,
W465-W467 (2005).
163. Price, D.R. & Gatehouse, J.A. RNAi-mediated crop protection against insects.
Trends Biotechnol 26, 393-400 (2008).
164. Casida, J.E. & Quistad, G.B. Golden age of insecticide research: past, present,
or future? Annu Rev Entomol 43, 1-16 (1998).
165. Zlotkin, E. The insect voltage-gated sodium channel as target of insecticides.
Annu Rev Entomol 44, 429-455 (1999).
166. Xue, X.-Y., Mao, Y.-B., Tao, X.-Y., Huang, Y.-P. & Chen, X.-Y. Chapter 3 -
New Approaches to Agricultural Insect Pest Control Based on RNA
Interference. in Advances in Insect Physiology, Vol. Volume 42 (ed. Elizabeth,
L.J.) 73-117 (Academic Press, 2012).
167. Okamura, K., Robine, N., Liu, Y., Liu, Q. & Lai, E.C. R2D2 organizes small
regulatory RNA pathways in Drosophila. Mol Cell Biol 31, 884-96 (2011).
168. Jaubert-Possamai, S. et al. Expansion of the miRNA pathway in the hemipteran
insect Acyrthosiphon pisum. Mol Biol Evol 27, 979-87 (2010).
169. Lund, E., Guttinger, S., Calado, A., Dahlberg, J.E. & Kutay, U. Nuclear export
of microRNA precursors. Science 303, 95-8 (2004).
170. Tomoyasu, Y. et al. Exploring systemic RNA interference in insects: a
genome-wide survey for RNAi genes in Tribolium. Genome Biol 9, R10 (2008).
171. Okamura, K. & Lai, E.C. Endogenous small interfering RNAs in animals. Nat
Rev Mol Cell Biol 9, 673-8 (2008).
172. Hoffmann, J.A. The immune response of Drosophila. Nature 426, 33-8 (2003).
173. Bartholomay, L.C. et al. Pathogenomics of Culex quinquefasciatus and
meta-analysis of infection responses to diverse pathogens. Science 330, 88-90
(2010).
174. Waterhouse, R.M. et al. Evolutionary dynamics of immune-related genes and
pathways in disease-vector mosquitoes. Science 316, 1738-43 (2007).
175. Edgar, R.C. MUSCLE: multiple sequence alignment with high accuracy and
high throughput. Nucleic Acids Res 32, 1792-7 (2004).
176. Eddy, S.R. Profile hidden Markov models. Bioinformatics 14, 755-63 (1998).
177. Cerenius, L., Lee, B.L. & Soderhall, K. The proPO-system: pros and cons for its
role in invertebrate immunity. Trends Immunol 29, 263-71 (2008).
178. Mullen, L.M. & Goldsworthy, G.J. Immune responses of locusts to challenge
with the pathogenic fungus Metarhizium or high doses of laminarin. J Insect
Physiol 52, 389-98 (2006).
179. Wells, K.L. The effects of immune challenge on phenoloxidase activity in
locust salivary glands in vitro. Bioscience Horizons 1, 122-127 (2008).
180. Neville, A.C. Biology of the arthropod cuticle, (Springer-verlag New York:,
1975).
181. Willis, J.H. & Muthukrishnan, S. Insect Cuticle. Foreword. Insect Biochem Mol
Biol 40, 165 (2010).
182. Kramer Karl, J., Hopkins Theodore, L. & Schaefer, J. Insect Cuticle Structure
and Metabolism. in Biotechnology for Crop Protection, Vol. 379 160-185
(American Chemical Society, 1988).
183. Andersen, S.O., Hojrup, P. & Roepstorff, P. Insect cuticular proteins. Insect
Biochem Mol Biol 25, 153-76 (1995).
184. Cornman, R.S. et al. Annotation and analysis of a large cuticular protein family
with the R&R Consensus in Anopheles gambiae. BMC Genomics 9, 22 (2008).
185. Andersen, S.O. Studies on proteins in post-ecdysial nymphal cuticle of locust,
Locusta migratoria, and cockroach, Blaberus craniifer. Insect Biochem Mol Biol
30, 569-77 (2000).
186. Karouzou, M.V. et al. Drosophila cuticular proteins with the R&R Consensus:
annotation and classification with a new tool for discriminating RR-1 and RR-2
sequences. Insect Biochem Mol Biol 37, 754-60 (2007).
187. Merzendorfer, H. & Zimoch, L. Chitin metabolism in insects: structure, function
and regulation of chitin synthases and chitinases. J Exp Biol 206, 4393-412
(2003).
188. Li, J. & Christensen, B. Biological Function of Insect Yellow Gene Family. in
Recent Advances in Entomological Research (eds. Liu, T. & Kang, L.) 121-131
(Springer Berlin Heidelberg, 2012).
189. Ferguson, L.C., Green, J., Surridge, A. & Jiggins, C.D. Evolution of the insect
yellow gene family. Mol Biol Evol 28, 257-72 (2011).
190. Li, Z. et al. Comparison of the two major classes of assembly algorithms:
overlap-layout-consensus and de-bruijn-graph. Brief Funct Genomics 11, 25-37
(2012).
191. Wilmore, P.J. & Brown, A.K. Molecular properties of orthopteran DNA.
Chromosoma 51, 337-45 (1975).
192. Rees, H., Shaw, D.D. & Wilkinson, P. Nuclear DNA Variation among Acridid
Grasshoppers. Proc R Soc Lond B Biol Sci 202, 517-525 (1978).
193. Baker, M. De novo genome assembly: what every biologist should know. Nat
Methods 9, 333-7 (2012).
194. Harris, R.S. Ph.D, The Pennsylvania State University (2007).
195. Kent, W.J., Baertsch, R., Hinrichs, A., Miller, W. & Haussler, D. Evolution's
cauldron: duplication, deletion, and rearrangement in the mouse and human
genomes. Proc Natl Acad Sci U S A 100, 11484-9 (2003).
196. Treangen, T.J. & Salzberg, S.L. Repetitive DNA and next-generation
sequencing: computational challenges and solutions. Nat Rev Genet 13, 36-46
(2012).
197. Mak, H.C. Genome interpretation and assembly-recent progress and next steps.
Nat Biotechnol 30, 1081-3 (2012).
198. Li, H. & Durbin, R. Fast and accurate short read alignment with
Burrows-Wheeler transform. Bioinformatics 25, 1754-60 (2009).
199. Ma, Z., Yu, J. & Kang, L. LocustDB: a relational database for the transcriptome
and biology of the migratory locust (Locusta migratoria). BMC Genomics 7, 11
(2006).
200. Kent, W.J. BLAT--the BLAST-like alignment tool. Genome Res 12, 656-64
(2002).
201. Parra, G., Bradnam, K. & Korf, I. CEGMA: a pipeline to accurately annotate
core genes in eukaryotic genomes. Bioinformatics 23, 1061-7 (2007).
202. Tuskan, G.A. et al. The genome of black cottonwood, Populus trichocarpa (Torr.
& Gray). Science 313, 1596-604 (2006).
203. Trapnell, C., Pachter, L. & Salzberg, S.L. TopHat: discovering splice junctions
with RNA-Seq. Bioinformatics 25, 1105-11 (2009).
204. Trapnell, C. et al. Transcript assembly and quantification by RNA-Seq reveals
unannotated transcripts and isoform switching during cell differentiation. Nat
Biotechnol 28, 511-5 (2010).
205. Hubbard, T.J. et al. Ensembl 2009. Nucleic Acids Res 37, D690-7 (2009).
206. Dessimoz, C. et al. Comparative genomics approach to detecting split-coding
regions in a low-coverage genome: lessons from the chimaera Callorhinchus
milii (Holocephali, Chondrichthyes). Brief Bioinform 12, 474-84 (2011).
207. Mortazavi, A. et al. Scaffolding a Caenorhabditis nematode genome with
RNA-seq. Genome Res 20, 1740-7 (2010).
208. Yu, X.J., Zheng, H.K., Wang, J., Wang, W. & Su, B. Detecting lineage-specific
adaptive evolution of brain-expressed genes in human using rhesus macaque as
outgroup. Genomics 88, 745-51 (2006).
209. UniProt, C. The Universal Protein Resource (UniProt) in 2010. Nucleic Acids
Res 38, D142-8 (2010).
210. Kanehisa, M. et al. KEGG for linking genomes to life and the environment.
Nucleic Acids Res 36, D480-4 (2008).
211. Moriya, Y., Itoh, M., Okuda, S., Yoshizawa, A.C. & Kanehisa, M. KAAS: an
automatic genome annotation and pathway reconstruction server. Nucleic Acids
Res 35, W182-5 (2007).
212. Quevillon, E. et al. InterProScan: protein domains identifier. Nucleic Acids Res
33, W116-20 (2005).
213. Hunter, S. et al. InterPro: the integrative protein signature database. Nucleic
Acids Res 37, D211-5 (2009).
214. Ashburner, M. et al. Gene ontology: tool for the unification of biology. The
Gene Ontology Consortium. Nat Genet 25, 25-9 (2000).
215. Feschotte, C., Keswani, U., Ranganathan, N., Guibotsy, M.L. & Levine, D.
Exploring repetitive DNA landscapes using REPCLASS, a tool that automates
the classification of transposable elements in eukaryotic genomes. Genome Biol
Evol 1, 205-20 (2009).
216. Benson, G. Tandem repeats finder: a program to analyze DNA sequences.
Nucleic Acids Res 27, 573-80 (1999).
217. Abrusan, G., Grundmann, N., DeMester, L. & Makalowski, W. TEclass--a tool
for automated classification of unknown eukaryotic transposable elements.
Bioinformatics 25, 1329-30 (2009).
218. Pons, J. & Vogler, A.P. Complex pattern of coalescence and fast evolution of a
mitochondrial rRNA pseudogene in a recent radiation of tiger beetles. Mol Biol
Evol 22, 991-1000 (2005).
219. Papadopoulou, A., Anastasiou, I. & Vogler, A.P. Revisiting the insect
mitochondrial molecular clock: the mid-Aegean trench calibration. Mol Biol
Evol 27, 1659-72 (2010).
220. Baucom, R.S., Estill, J.C., Leebens-Mack, J. & Bennetzen, J.L. Natural
selection on gene function drives the evolution of LTR retrotransposon families
in the rice genome. Genome Res 19, 243-54 (2009).
221. Smit, A., Hubley, R. & Green, P. RepeatMasker Open-3.0. (1996).
222. Lopez, R., Silventoinen, V., Robinson, S., Kibria, A. & Gish, W. WU-Blast2
server at the European bioinformatics institute. Nucleic Acids Res 31,
3795-3798 (2003).
223. Delsuc, F., Brinkmann, H. & Philippe, H. Phylogenomics and the reconstruction
of the tree of life. Nat Rev Genet 6, 361-75 (2005).
224. Jones, D.T., Taylor, W.R. & Thornton, J.M. The rapid generation of mutation
data matrices from protein sequences. Comput Appl Biosci 8, 275-82 (1992).
225. Yang, Z. PAML 4: phylogenetic analysis by maximum likelihood. Mol Biol
Evol 24, 1586-91 (2007).
226. Yang, Z. & Rannala, B. Molecular phylogenetics: principles and practice. Nat
Rev Genet 13, 303-14 (2012).
227. Regier, J.C., Shultz, J.W. & Kambic, R.E. Phylogeny of basal hexapod lineages
and estimates of divergence times. Ann Entomol Soc Am 97, 411-419 (2004).
228. Rehm, P. et al. Dating the arthropod tree based on large-scale transcriptome
data. Mol Phylogenet Evol 61, 880-7 (2011).
229. Whalley, P. Unfair to ancient fossil springtails. Antenna 19, 2-3 (1995).
230. Grimaldi, D.A. & Engel, M.S. Evolution of the Insects, (Cambridge Univ Press,
2005).
231. Schumacher, P., WeyEneth, A., Weber, D.C. & Dorn, S. Long flights in Cydia
pomonella L. (Lepidoptera: Tortricidae) measured by a flight mill: influence of
sex, mated status and age. Physiol Entomol 22, 149-160 (1997).
232. Anders, S., Reyes, A. & Huber, W. Detecting differential usage of exons from
RNA-seq data. Genome Res 22, 2008-17 (2012).
233. Trapnell, C. et al. Differential analysis of gene regulation at transcript resolution
with RNA-seq. Nat Biotechnol 31, 46-53 (2012).
234. Katz, Y., Wang, E.T., Airoldi, E.M. & Burge, C.B. Analysis and design of RNA
sequencing experiments for identifying isoform regulation. Nat Methods (2010).
235. Anders, S. & Huber, W. Differential expression analysis for sequence count
data. Genome Biol 11, R106 (2010).
236. Benjamini, Y. & Hochberg, Y. Controlling the False Discovery Rate: a Practical
and Powerful Approach to Multiple Testing. J Roy Stat Soc B Met 57, 289-300
(1995).
237. Quinlan, A.R. & Hall, I.M. BEDTools: a flexible suite of utilities for comparing
genomic features. Bioinformatics 26, 841-2 (2010).
238. Beissbarth, T. & Speed, T.P. GOstat: find statistically overrepresented Gene
Ontologies within a group of genes. Bioinformatics 20, 1464-5 (2004).
239. Lohse, M. et al. RobiNA: a user-friendly, integrated software solution for
RNA-Seq-based transcriptomics. Nucleic Acids Res 40, W622-7 (2012).
240. Krueger, F. & Andrews, S.R. Bismark: a flexible aligner and methylation caller
for Bisulfite-Seq applications. Bioinformatics 27, 1571-2 (2011).
241. Langmead, B., Trapnell, C., Pop, M. & Salzberg, S.L. Ultrafast and
memory-efficient alignment of short DNA sequences to the human genome.
Genome Biol 10, R25 (2009).
242. Akalin, A. et al. methylKit: a comprehensive R package for the analysis of
genome-wide DNA methylation profiles. Genome Biol 13, R87 (2012).