Embed Size (px)
Citation preview
www.sciencemag.org/cgi/content/full/science.aad8142/DC1
Supplementary Material for Single-vesicle imaging reveals different transport mechanisms between
glutamatergic and GABAergic vesicles
Zohreh Farsi, Julia Preobraschenski, Geert van den Bogaart, Dietmar Riedel, Reinhard Jahn,* Andrew Woehler
*Corresponding author. E-mail: [email protected]
Published 11 February 2016 on Science Express
DOI: 10.1126/science.aad8142
This PDF file includes:
Materials and Methods Supplementary Text Figs. S1 to S15 Full Reference List
2
Materials and Methods
Animals
Transgenic mice, spH21 (9), were kindly provided by Prof. V.N. Murthy (Department of
Molecular and Cellular Biology, Harvard University, USA) and W. Tyler (Virginia Tech
Carilion Research Institute, USA). Wild type mice were obtained from the animal facility
at the Max-Planck Institute for Biophysical Chemistry, Göttingen, Germany.
Isolation of synaptic vesicles
Synaptic vesicles (SVs) were isolated from brains of mice (6-8 weeks postnatal) using a
protocol described by (23) with following modifications (Fig S1A): 1. To obtain higher
purity, fraction S2 was discarded and LS1 was directly overlaid on the sucrose cushion.
After centrifugation, the gradient was fractionated from top to bottom into 20 fractions of
500 µl. Similar blot patterns of our purified SVs were obtained as in (23) with an
antibody against synaptophysin 1 (1:1,000 dilution, Synaptic Systems) (Fig S1B,
compare with Fig2b in (23)). Fractions 13 to 20 as well as pellets were combined for
subsequent steps. 2. In order to decrease ionic contaminations, SV-P fraction was loaded
on a controlled-pore glass bead (CPG-3000) (24) column (100 cm x 1 cm). This column
allowed for elution of SVs with salt-free buffer (glycine 300 mM, HEPES 5 mM, pH
7.4). The purity of final SV fraction was assessed by electron microscopy (Fig S1C).
Moreover, we tested the functionality of the V-ATPase in purified SVs by performing
conventional bulk acidification assays (Fig S1E).
Immobilization of SVs on glass coverslips
3
Glass coverslips were thoroughly cleaned by sonication for 20 min in 2% (v/v)
Hellmanex-III solution (Hellma Analytics), followed by 20 min-sonication in ultra-pure
water. The coverslips were kept in 70% ethanol until use. Before SV immobilization, the
coverslips were rinsed with water, coated with 0.1% (w/v) poly-L-lysine (Sigma), and
washed with required buffer for subsequent steps. 50-100 ng of purified SVs were
incubated on poly-L-lysine-coated coverslips for 1 hour at 4°C. Non-adsorbed SVs were
removed from coverslips before imaging. Coverslips were then mounted in custom-
designed imaging chambers. The chambers were equipped with three inlets and one
outlet for fast solution exchange (Fig S1F).
Fluorescence imaging of single SVs
SVs were imaged using a home built total-internal reflection fluorescence microscope
(TIRFM) setup based on an Axiovert 200 microscope (Zeiss) equipped with a PLAN-
FLUAR 100x 1.45 NA objective (Zeiss), a 500 mW multiline argon ion laser
(LGK7880ML, National Laser), a 100 mW 641 nm diode laser (Coherent Deutschland
GmbH, Dieburg, Germany) and a back-illuminated EM-CCD (Andor iXON3 897). The
setup was also equipped with a UV-flash lamp (Rapp OptoElectronic) for NPE-ATP
uncaging, a fast solution exchange system (Warner Instruments, Hamden CT) and a
peristaltic pump for fast buffer removal (Fig S1F). spH and VF2.1.Cl-labeled SVs were
excited with the 488 nm line of an argon laser through a 488/10 nm excitation filter and
emission was collected through a 515/30 nm filter. Images were acquired using the Andor
IQ2 software, which also allowed for synchronized control of the laser shutters, valve
system and flash lamp via TTL triggers. Acquisition settings for different experiments
4
were programmed according to the time course of the experiment to minimize
photobleaching of the probes.
pH calibration of super ecliptic-pHluorin
In SVs purified from transgenic mice (spH-SVs), super ecliptic-pHluorin (spH) is tagged
to the luminal C-terminus of VAMP2 making it sensitive to the luminal pH. In order to
correlate the fluorescence change of spH with pH, spH-SVs were incubated for 2 min in
10 mM MOPS, 10 mM MES, 300 mM glycine at different pH (5.5-9.5) supplemented
with 10 µM carbonyl cyanide-4-(trifluoromethoxy) phenylhydrazone (FCCP), a proton
ionophore, to facilitate full proton equilibrium between the lumen of SVs and bath
solution. The averaged intensities of vesicles at all pH points were normalized to
fluorescence at pH 9.5 and plotted as a function of pH (Fig S2A). Data were fit to Eq.1
(25):
𝐹 = 𝐹0 +𝐹max
1 + 10p𝐾a−pH 𝐸𝑞. 1
where F0 and Fmax represent the offset and dynamic range, respectively. The pKa of spH
obtained from the fit was 7.20 ± 0.06 (SD) which is consistent with previously reported
values (26) and similar to the pKa obtained with pH titration of purified spH in solution
(pKa = 7.20 ± 0.05 (SD)) (Fig S2B). As an additional control, we recorded the emission
spectra of spH at different pH at its two excitation peaks at 405 and 488 nm. This allowed
us to perform independent ratiometric measurements to test whether the initial luminal
pH of SVs after purification was 7.4 as in the surrounding buffer. As shown in Fig S2C,
5
we did not observe any difference between ratiometric values of purified SVs before and
after addition of FCCP at pH 7.4 while acidifying the lumen by incubation of vesicles at
pH 5.5 in the presence of FCCP significantly decreased the ratiometric value. This
indicates that during purification of SVs, vesicles lose their luminal proton contents and
reach equilibrium with their surrounding buffer.
Quantification of the number of fluorophores in single spH-SVs
The number of fluorophores per SV was determined by two approaches: step
photobleaching of spH molecules in single SVs and quantitative mass spectrometry.
Photobleaching experiments: To estimate the number of fluorophores in the lumen of
vesicles, we performed photobleaching experiment with spH-SVs. Vesicles were
illuminated with high laser intensity and time-lapse imaging was performed for 100
seconds during which complete photobleaching was observed. Discrete photobleaching
steps were observed in individual fluorescence traces (Fig S2D). In order to determine the
photobleaching step size, the photobleaching image was first divided into 4 regions and
the average size of a single bleaching step was measured from each quadrant, indicating
uniform TIRF illumination. As no significant difference was observed in step size from
different regions of the image (ANOVA one-way analysis at the probability level of
0.05), all the values were pooled and a mean fluorescence intensity per vesicle of 5,262
(a.u.) was obtained (Fig S2E). Next, the total number of bleaching steps for single SVs
was determined by dividing their initial intensity by the size of one photobleaching step.
The values from all the spH-SVs were pooled into a histogram (Fig S2F). Although a
small portion of vesicles (~20%) showed only 1 or 2 bleaching steps, the majority of SVs
6
showed a higher number of bleaching steps. Poisson fitting to the second distribution in
the histogram indicated that on average a single spH-SV contained 4.5 molecules which
corroborates with the previously reported copy-number of spH in purified spH-SVs (27).
Mass spectrometry: We verified the average number of spH molecules per SV by mass
spectrometry. Briefly, the purified spH-vesicles form three SV preparations were run on a
SDS-PAGE. The pHluorin-tagged VAMP2 was clearly separated from the non-tagged
proteins due to difference in molecular weight. spH proteins were then cut out of the gel
and each was run in three replicates in a mass spectrometer. By intensity-based absolute
quantification (iBAQ) the average number of spH molecules in a single SV was
estimated to be 4.1 ± 0.7 (SD), which is close to the results obtained from photobleaching
measurements.
Acidification and potentiometric assays
The pH and potentiometric measurements were performed in glycine buffer (glycine 300
mM, MOPS 10 mM, MgSO4 4 mM, pH 7.4) unless otherwise noted.
In measurements where the luminal pH and membrane potential were compared between
glutamatergic and GABAergic SVs (Fig 2A and B), glycine buffer was used to rule out
the effect of different ionic specious on measured electrochemical gradient. However, to
ensure that the observed difference between these vesicle populations is not affected by
glycine, we also performed the same measurements in K-gluconate buffer (K-gluconate
100 mM, MOPS 10 mM, MgSO4 4mM, pH 7.4) and obtained the same results, ruling out
the effect of glycine on measured ∆pH and ∆ψ.
7
Due to optimal glutamate uptake at 4 mM chloride (7), for measurements that involved
glutamate, 4 mM TEA-Cl was added to the bath solution. In addition, since GABA and
glycine compete for vesicular uptake (28), we used K-gluconate buffer for experiments
that involved GABA.
In order to measure the kinetics of proton pumping in single SVs, we used NPE-ATP in
our study. This caged molecule can release ATP with rate constants ranging from 35 to
250 s-1
at physiological pH (29). In order to measure the uncaging efficiency after a
single UV flash in our setup, we performed acidification experiments with both free ATP
and NPE-ATP, and correlated the concentration of NPE-ATP and free ATP required to
achieve the same luminal pH. This resulted in ~ 60% uncaging efficiency, similar to
reported values (30). All NPE-ATP were converted to free ATP using this determined
uncaging efficiency.
For the potentiometric measurements, we labeled SVs purified from wild type mice with
VF2.1.Cl, a photo-induced electron transfer-based voltage-sensitive dye. For labeling,
100 nM of dye was included in the buffer during the 1 hour immobilization step. The
labeled SVs were then washed to remove excess dye molecules. Due to incompatibility of
VF2.1.Cl with NPE-ATP and other tested caged-ATP molecules, we acidified the SVs
using Mg-ATP (Sigma).
Image analysis
All the images from a time series were loaded in MATLAB (Mathworks, Natick, MA).
The average of the initial frames in each image series was used for spot detection. Single
SVs were detected using a script based on a multiresolution algorithm (31). A cutoff for
8
appropriate size and eccentricity as well as an intensity threshold were applied to remove
nonfunctional and aggregated SVs from the analysis. The background for each SV was
defined locally as the sum intensity of neighboring pixels with the lowest intensity, and
subtracted from the integrated intensity of the vesicles in each frame.
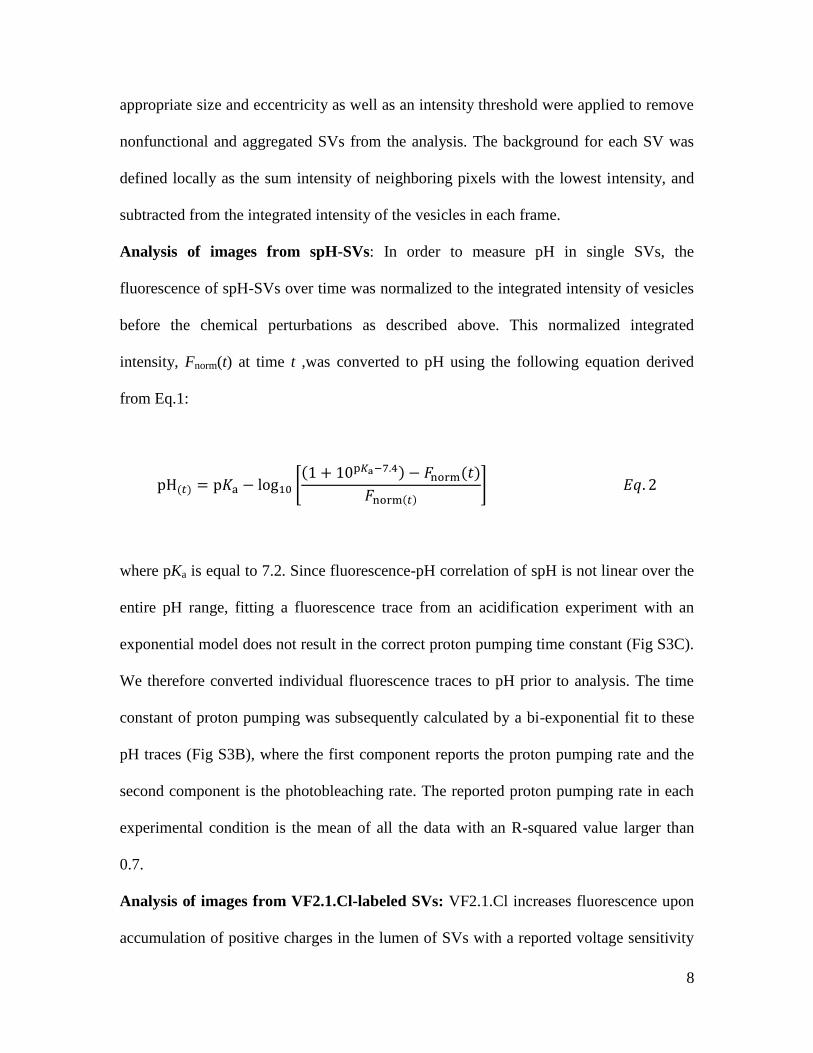
Analysis of images from spH-SVs: In order to measure pH in single SVs, the
fluorescence of spH-SVs over time was normalized to the integrated intensity of vesicles
before the chemical perturbations as described above. This normalized integrated
intensity, Fnorm(t) at time t ,was converted to pH using the following equation derived
from Eq.1:
pH(𝑡) = p𝐾a − log10 [(1 + 10p𝐾a−7.4) − 𝐹norm(𝑡)
𝐹norm(𝑡)] 𝐸𝑞. 2
where pKa is equal to 7.2. Since fluorescence-pH correlation of spH is not linear over the
entire pH range, fitting a fluorescence trace from an acidification experiment with an
exponential model does not result in the correct proton pumping time constant (Fig S3C).
We therefore converted individual fluorescence traces to pH prior to analysis. The time
constant of proton pumping was subsequently calculated by a bi-exponential fit to these
pH traces (Fig S3B), where the first component reports the proton pumping rate and the
second component is the photobleaching rate. The reported proton pumping rate in each
experimental condition is the mean of all the data with an R-squared value larger than
0.7.
Analysis of images from VF2.1.Cl-labeled SVs: VF2.1.Cl increases fluorescence upon
accumulation of positive charges in the lumen of SVs with a reported voltage sensitivity
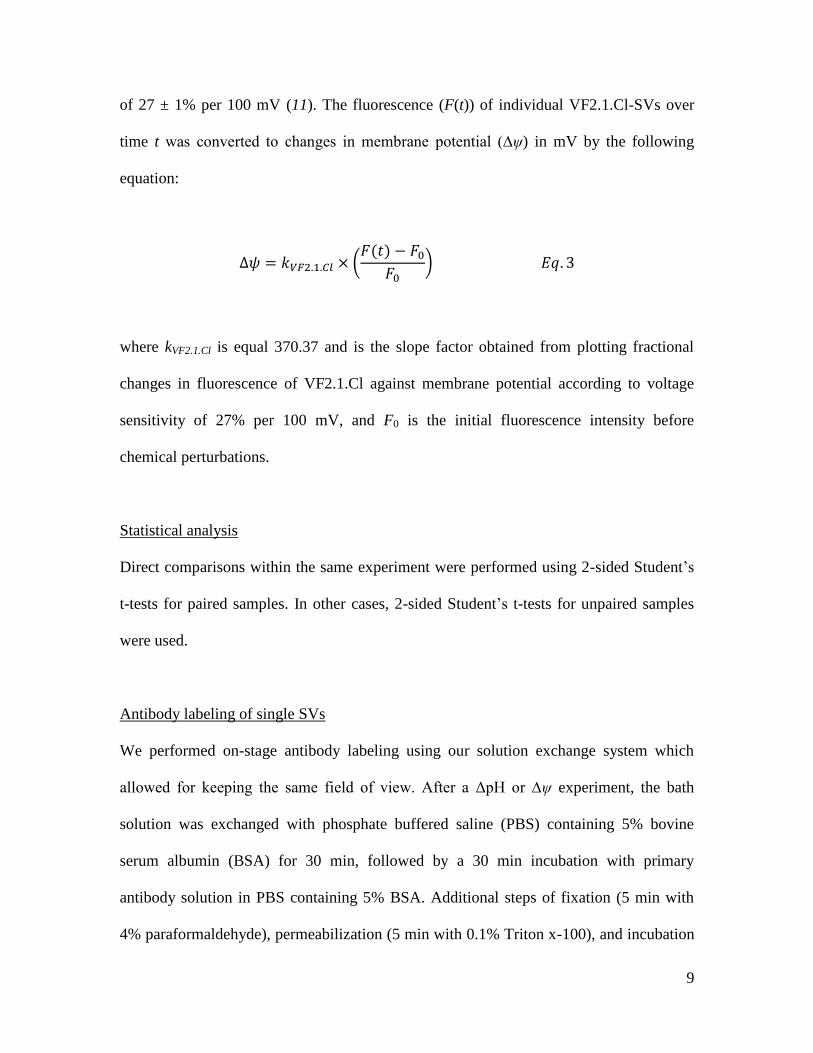
9
of 27 ± 1% per 100 mV (11). The fluorescence (F(t)) of individual VF2.1.Cl-SVs over
time t was converted to changes in membrane potential (∆ψ) in mV by the following
equation:
∆𝜓 = 𝑘𝑉𝐹2.1.𝐶𝑙 × (𝐹(𝑡) − 𝐹0
𝐹0) 𝐸𝑞. 3
where kVF2.1.Cl is equal 370.37 and is the slope factor obtained from plotting fractional
changes in fluorescence of VF2.1.Cl against membrane potential according to voltage
sensitivity of 27% per 100 mV, and F0 is the initial fluorescence intensity before
chemical perturbations.
Statistical analysis
Direct comparisons within the same experiment were performed using 2-sided Student’s
t-tests for paired samples. In other cases, 2-sided Student’s t-tests for unpaired samples
were used.
Antibody labeling of single SVs
We performed on-stage antibody labeling using our solution exchange system which
allowed for keeping the same field of view. After a ΔpH or ∆ψ experiment, the bath
solution was exchanged with phosphate buffered saline (PBS) containing 5% bovine
serum albumin (BSA) for 30 min, followed by a 30 min incubation with primary
antibody solution in PBS containing 5% BSA. Additional steps of fixation (5 min with
4% paraformaldehyde), permeabilization (5 min with 0.1% Triton x-100), and incubation
10
with secondary antibody (30 min in 5% BSA PBS) were included when required. Before
imaging, the coverslips were washed extensively with PBS. In order to distinguish
antibody-labeled from non-labeled SVs, we first detected the spots in the spH or
VF2.1.Cl images as described above and then identified spots labeled with antibodies
within < 2 pixels (i.e. < 300 nm) proximity.
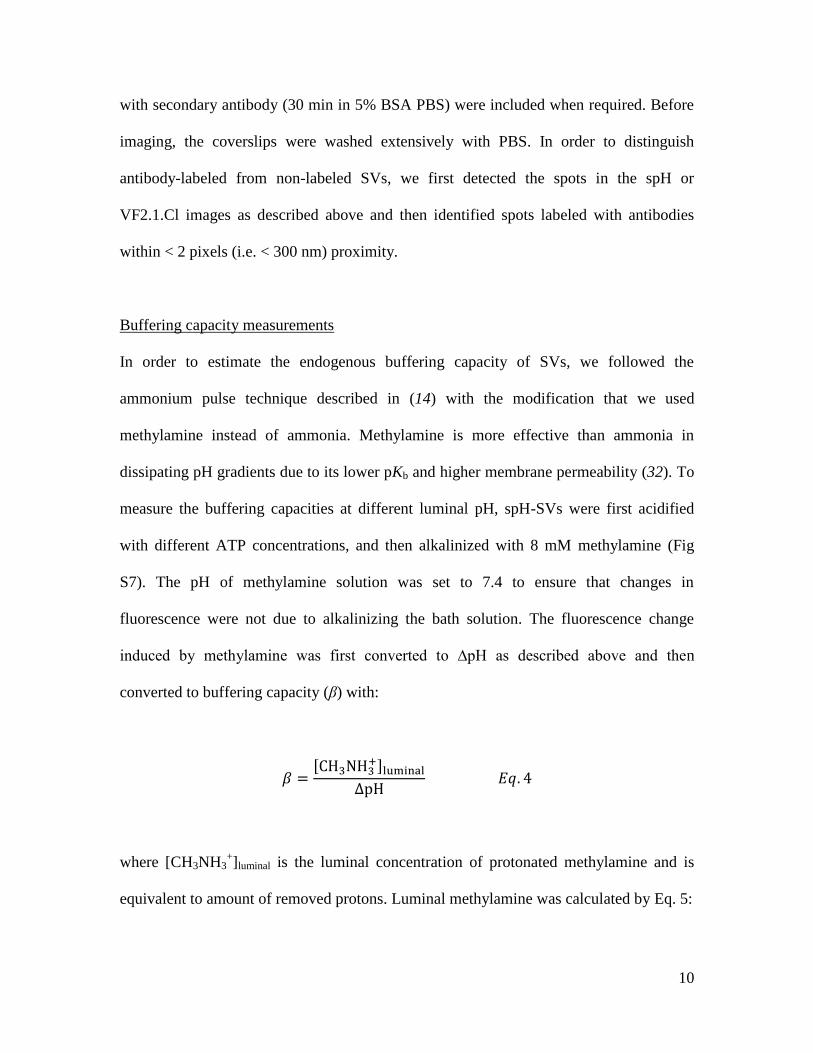
Buffering capacity measurements
In order to estimate the endogenous buffering capacity of SVs, we followed the
ammonium pulse technique described in (14) with the modification that we used
methylamine instead of ammonia. Methylamine is more effective than ammonia in
dissipating pH gradients due to its lower pKb and higher membrane permeability (32). To
measure the buffering capacities at different luminal pH, spH-SVs were first acidified
with different ATP concentrations, and then alkalinized with 8 mM methylamine (Fig
S7). The pH of methylamine solution was set to 7.4 to ensure that changes in
fluorescence were not due to alkalinizing the bath solution. The fluorescence change
induced by methylamine was first converted to ∆pH as described above and then
converted to buffering capacity (β) with:
𝛽 =[CH3NH3
+]luminal
∆pH 𝐸𝑞. 4
where [CH3NH3+]luminal is the luminal concentration of protonated methylamine and is
equivalent to amount of removed protons. Luminal methylamine was calculated by Eq. 5:
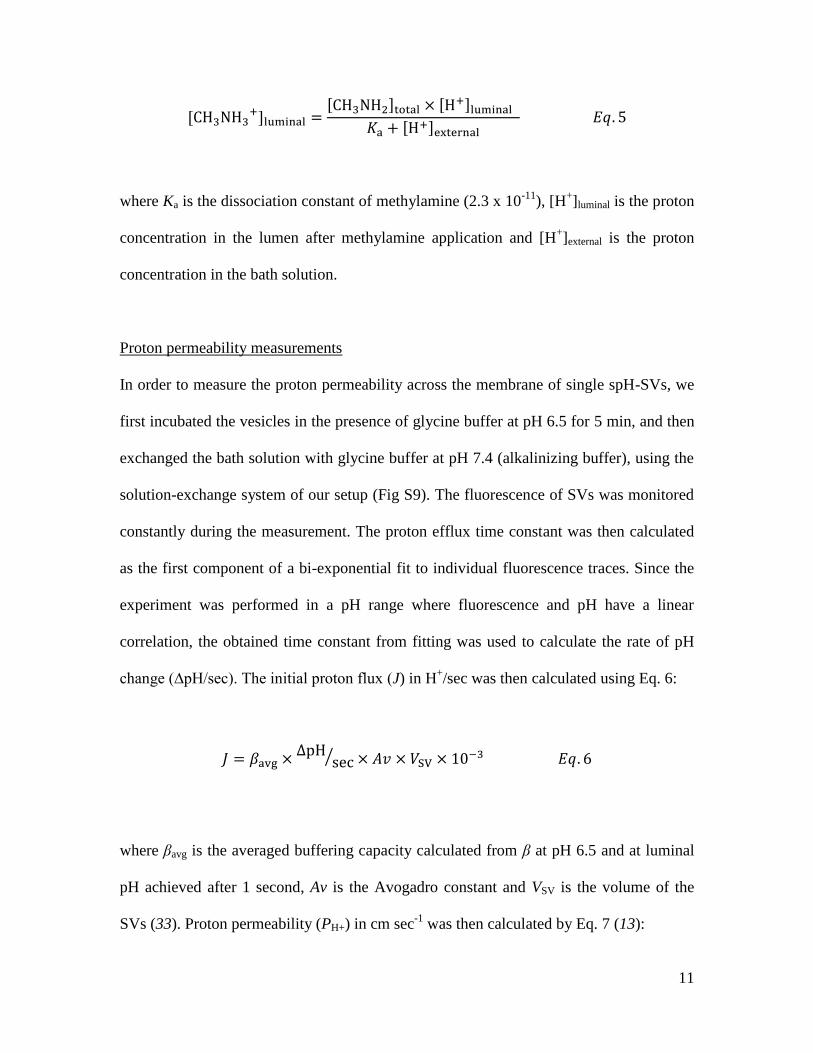
11
[CH3NH3+]luminal =
[CH3NH2]total × [H+]luminal
𝐾a + [H+]external 𝐸𝑞. 5
where Ka is the dissociation constant of methylamine (2.3 x 10⁻¹¹
), [H+]luminal is the proton
concentration in the lumen after methylamine application and [H+]external is the proton
concentration in the bath solution.
Proton permeability measurements
In order to measure the proton permeability across the membrane of single spH-SVs, we
first incubated the vesicles in the presence of glycine buffer at pH 6.5 for 5 min, and then
exchanged the bath solution with glycine buffer at pH 7.4 (alkalinizing buffer), using the
solution-exchange system of our setup (Fig S9). The fluorescence of SVs was monitored
constantly during the measurement. The proton efflux time constant was then calculated
as the first component of a bi-exponential fit to individual fluorescence traces. Since the
experiment was performed in a pH range where fluorescence and pH have a linear
correlation, the obtained time constant from fitting was used to calculate the rate of pH
change (∆pH/sec). The initial proton flux (J) in H+/sec was then calculated using Eq. 6:
𝐽 = 𝛽avg ×∆pH
sec⁄ × 𝐴𝑣 × 𝑉SV × 10−3 𝐸𝑞. 6
where βavg is the averaged buffering capacity calculated from β at pH 6.5 and at luminal
pH achieved after 1 second, Av is the Avogadro constant and VSV is the volume of the
SVs (33). Proton permeability (PH+) in cm sec-1
was then calculated by Eq. 7 (13):
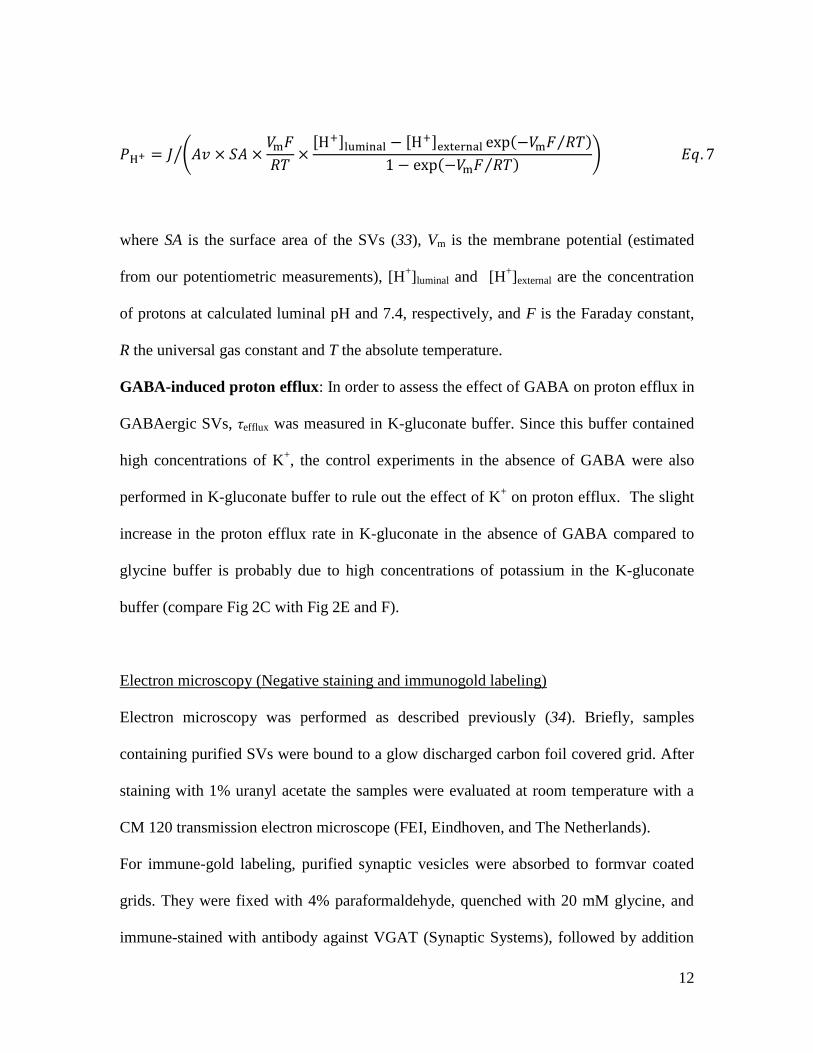
12
𝑃H+ = 𝐽 (𝐴𝑣 × 𝑆𝐴 ×𝑉m𝐹
𝑅𝑇×
[H+]luminal − [H+]external exp(−𝑉m𝐹 𝑅𝑇⁄ )
1 − exp(−𝑉m𝐹 𝑅𝑇⁄ ))⁄ 𝐸𝑞. 7
where SA is the surface area of the SVs (33), Vm is the membrane potential (estimated
from our potentiometric measurements), [H+]luminal and [H
+]external are the concentration
of protons at calculated luminal pH and 7.4, respectively, and F is the Faraday constant,
R the universal gas constant and T the absolute temperature.
GABA-induced proton efflux: In order to assess the effect of GABA on proton efflux in
GABAergic SVs, τefflux was measured in K-gluconate buffer. Since this buffer contained
high concentrations of K+, the control experiments in the absence of GABA were also
performed in K-gluconate buffer to rule out the effect of K+ on proton efflux. The slight
increase in the proton efflux rate in K-gluconate in the absence of GABA compared to
glycine buffer is probably due to high concentrations of potassium in the K-gluconate
buffer (compare Fig 2C with Fig 2E and F).
Electron microscopy (Negative staining and immunogold labeling)
Electron microscopy was performed as described previously (34). Briefly, samples
containing purified SVs were bound to a glow discharged carbon foil covered grid. After
staining with 1% uranyl acetate the samples were evaluated at room temperature with a
CM 120 transmission electron microscope (FEI, Eindhoven, and The Netherlands).
For immune-gold labeling, purified synaptic vesicles were absorbed to formvar coated
grids. They were fixed with 4% paraformaldehyde, quenched with 20 mM glycine, and
immune-stained with antibody against VGAT (Synaptic Systems), followed by addition
13
of Protein A-gold (10 nm). The preparations were then washed repeatedly with TPBS and
high-salt TPBS (0.5 M NaCl), and post-fixed with 2% glutaraldehyde. After
counterstaining with 1% uranyl-acetate, samples were investigated using a CM120
Philips electron microscope using a TemCam F416 CMOS camera (TVIPS, Gauting,
Germany).
14
Supplementary Text
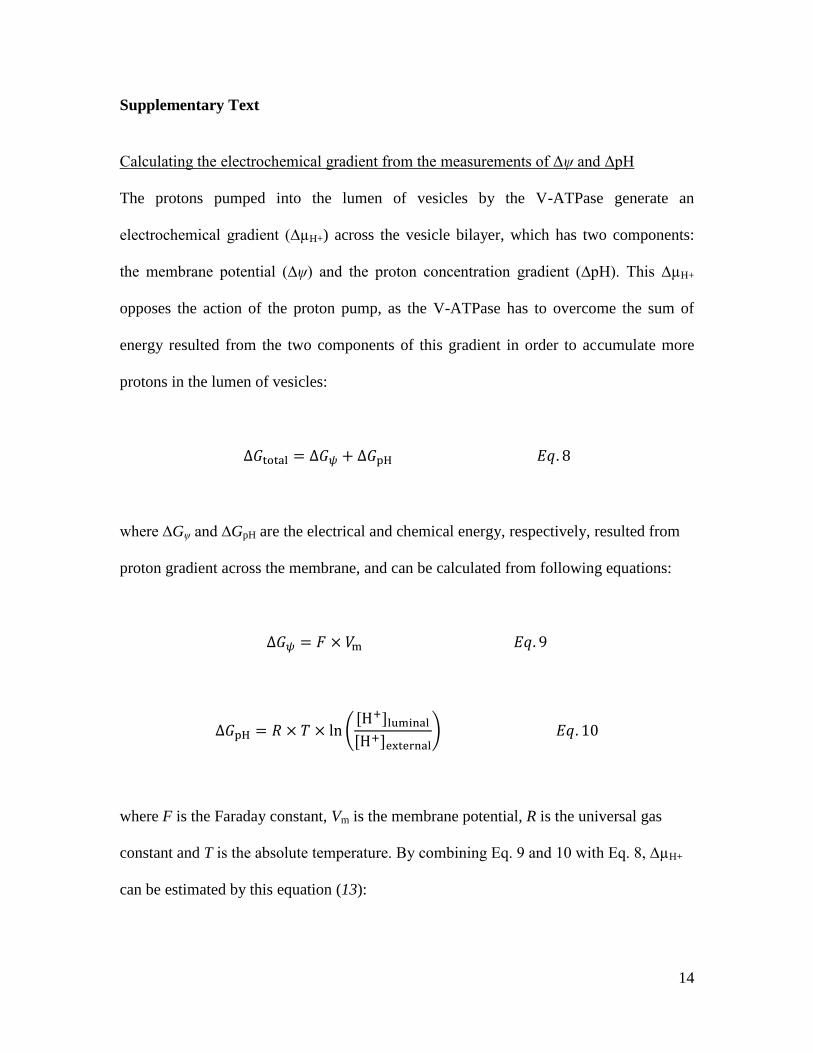
Calculating the electrochemical gradient from the measurements of Δψ and ΔpH
The protons pumped into the lumen of vesicles by the V-ATPase generate an
electrochemical gradient (∆µH+) across the vesicle bilayer, which has two components:
the membrane potential (∆ψ) and the proton concentration gradient (∆pH). This ∆µH+
opposes the action of the proton pump, as the V-ATPase has to overcome the sum of
energy resulted from the two components of this gradient in order to accumulate more
protons in the lumen of vesicles:
∆𝐺total = ∆𝐺𝜓 + ∆𝐺pH 𝐸𝑞. 8
where ∆Gψ and ∆GpH are the electrical and chemical energy, respectively, resulted from
proton gradient across the membrane, and can be calculated from following equations:
∆𝐺𝜓 = 𝐹 × 𝑉m 𝐸𝑞. 9
∆𝐺pH = 𝑅 × 𝑇 × ln ([H+]luminal
[H+]external) 𝐸𝑞. 10
where F is the Faraday constant, Vm is the membrane potential, R is the universal gas
constant and T is the absolute temperature. By combining Eq. 9 and 10 with Eq. 8, ∆µH+
can be estimated by this equation (13):
15
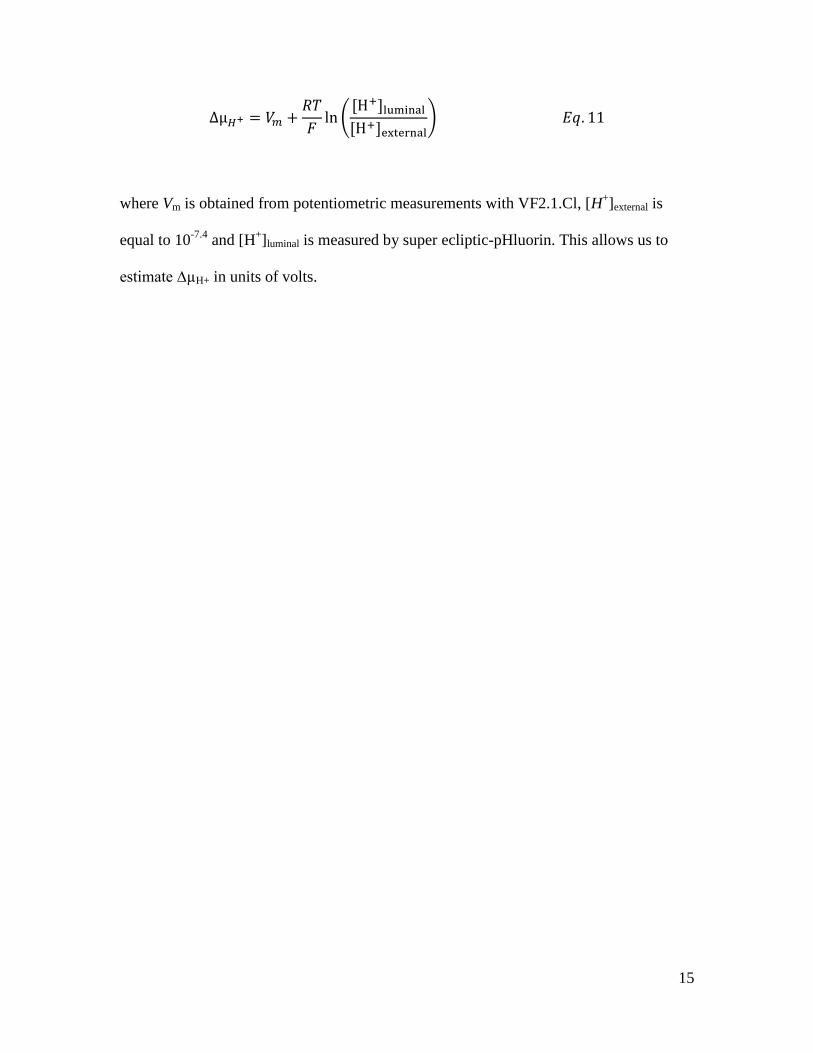
∆µ𝐻+ = 𝑉𝑚 +𝑅𝑇
𝐹ln (
[H+]luminal
[H+]external) 𝐸𝑞. 11
where Vm is obtained from potentiometric measurements with VF2.1.Cl, [H+]external is
equal to 10-7.4
and [H+]luminal is measured by super ecliptic-pHluorin. This allows us to
estimate ∆µH+ in units of volts.
16
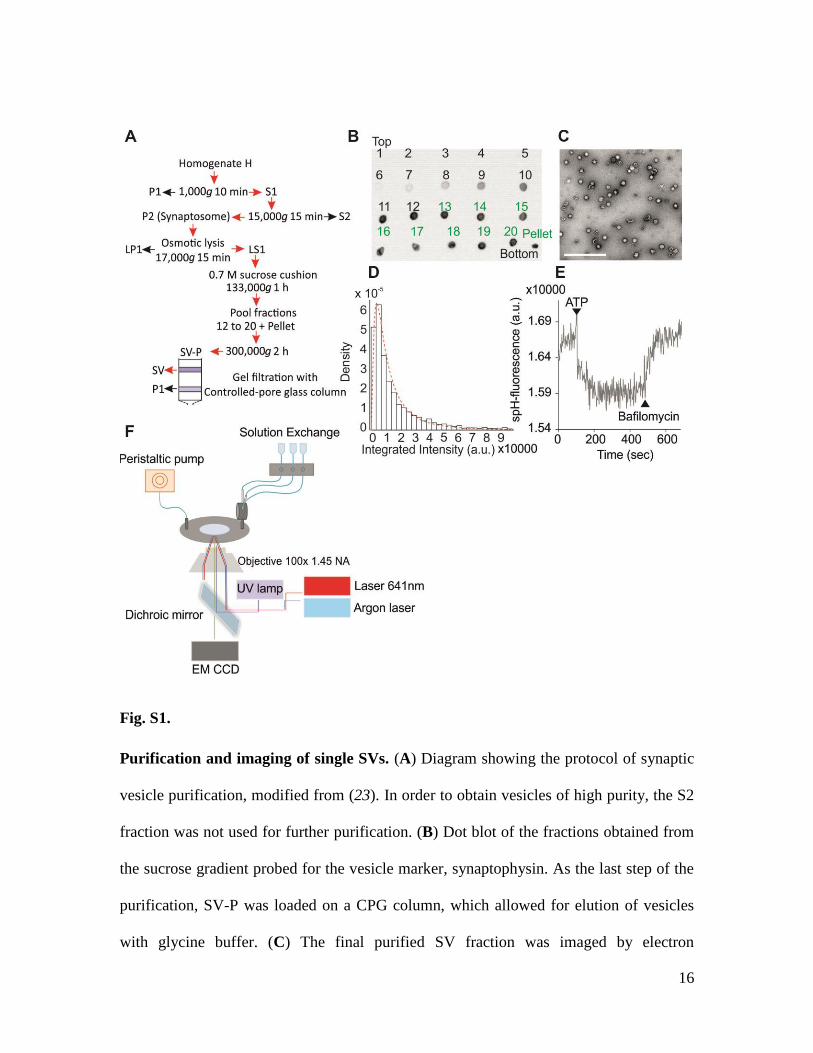
Fig. S1.
Purification and imaging of single SVs. (A) Diagram showing the protocol of synaptic
vesicle purification, modified from (23). In order to obtain vesicles of high purity, the S2
fraction was not used for further purification. (B) Dot blot of the fractions obtained from
the sucrose gradient probed for the vesicle marker, synaptophysin. As the last step of the
purification, SV-P was loaded on a CPG column, which allowed for elution of vesicles
with glycine buffer. (C) The final purified SV fraction was imaged by electron
17
microscopy after negative-staining. The contribution of larger organelles to the final
fraction was negligible. Scale bar is 500 nm. (D) Moreover, we ensured that purified SVs
were free of aggregates by labeling immobilized SVs with 1 µM of the lipophilic
carbocyanine DiD (Invitrogen). The integrated intensities of single particles were pooled
into a histogram and could be well fitted with a lognormal distribution, which is an
intrinsic distribution of single particles when imaged in TIRF microscopy (35). (E) The
acidification capacity of purified SVs was assessed by conventional bulk-assays. Briefly,
spH-SVs were first acidified by 1.2 mM ATP, which resulted in quenching of spH, and
then the V-ATPase was blocked by 100 nM of Bafilomycin, a specific blocker of the V-
ATPase, which reversed the fluorescence change. (F) Diagram of the imaging setup.
Purified SVs were immobilized on poly-L-lysine-coated glass coverslips and imaged
using a custom-built multiwavelength TIRF microscope. The setup was equipped with a
solution exchange system and a flash lamp for NPE-ATP uncaging.
18
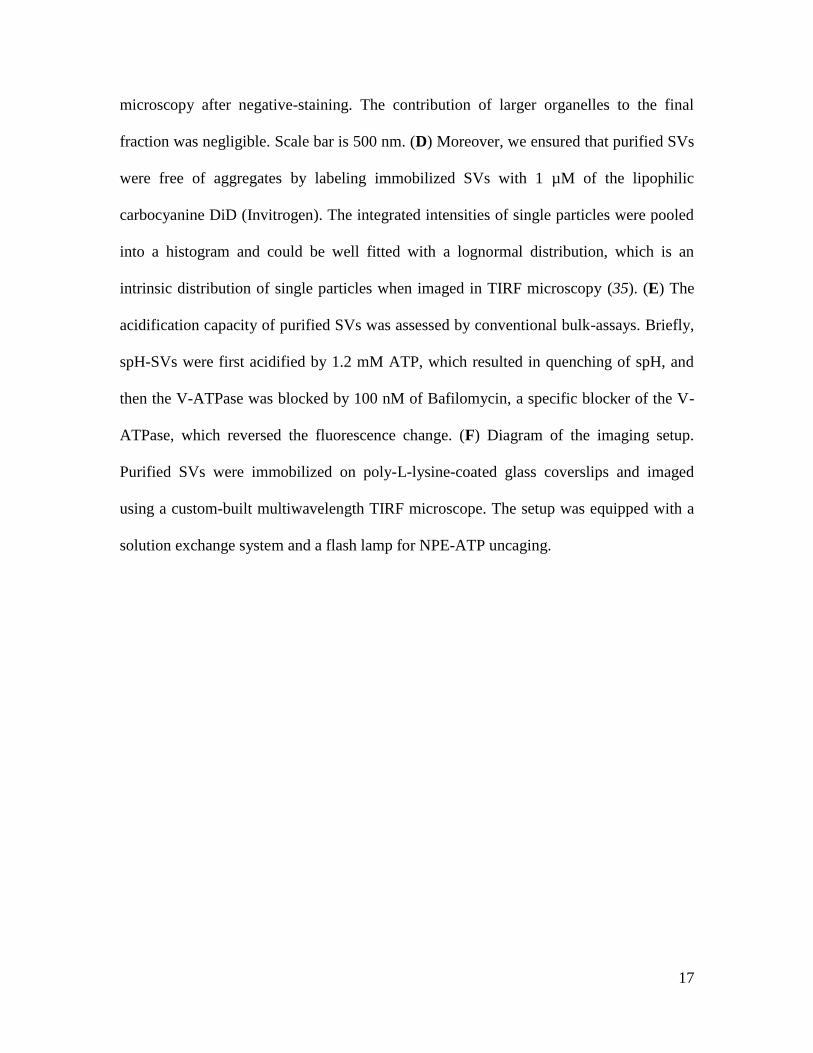
Fig. S2
Characterization of super ecliptic-pHluorin. Fluorescence of spH-SVs was measured
after incubation in MOPS-MES buffers at different pH supplemented with 10 µM FCCP.
(A) Integrated intensities of single SVs were plotted as a function of pH and fitted with
Eq. 1 (dashed line), which resulted in a fitted pKa of 7.20 ± 0.06 (SD). Error bars
represent SD of more than 500 single SVs. (B) The same experiment was performed with
purified spH protein over the same pH range. Fitting the data with Eq.1 resulted in a pKa
of 7.20 ± 0.05 (SD). (C) In order to check for acidity of the lumen of SVs after the
purification, immobilized vesicles were excited with 488 and 405 nm lasers and their
emission was collected in the absence and presence of FCCP at pH 7.4 as well as at pH
5.5. While at pH 5.5 the fluorescence ratios significantly decreased, no difference was
19
observed between values before and after FCCP at pH 7.4. The top and bottom of box
plots are first and third quartiles, and the middle line and spot represent median and mean
of the values, respectively. Whiskers indicate SD of on average 120 single SVs compiled
from 3 independent experiments. (D) The number of fluorophores was determined by
stepwise photobleaching of spH molecules in single SVs. Representative trace of
photobleaching of a single spH-vesicle. Photobleaching steps are indicated by the red
circles. (E) No significant difference was observed in the photobleaching step size from
different quadrants (Q) of the images indicating uniform TIRF illumination. The average
photobleaching step size for all quadrants was 5,262 (a.u.). Error bars represent SEM of
13-20 photobleaching steps compiled from three images. (F) The total number of
bleaching steps for single SVs was determined by dividing their initial intensities by the
size of a single photobleaching step (from panel E). The values from all the spH-SVs
were pooled into a histogram. The red line shows a Poisson fitting to the second
distribution in this histogram, which indicates that on average a single spH-SV contains
4.5 fluorophores.
20
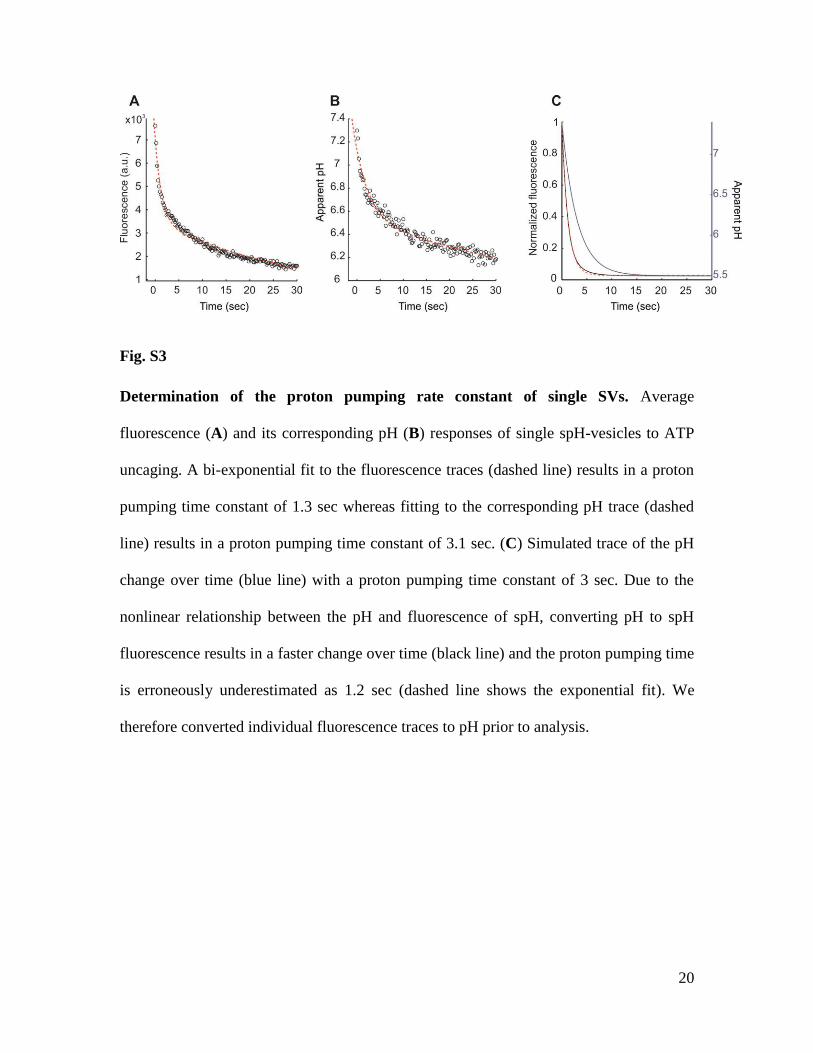
Fig. S3
Determination of the proton pumping rate constant of single SVs. Average
fluorescence (A) and its corresponding pH (B) responses of single spH-vesicles to ATP
uncaging. A bi-exponential fit to the fluorescence traces (dashed line) results in a proton
pumping time constant of 1.3 sec whereas fitting to the corresponding pH trace (dashed
line) results in a proton pumping time constant of 3.1 sec. (C) Simulated trace of the pH
change over time (blue line) with a proton pumping time constant of 3 sec. Due to the
nonlinear relationship between the pH and fluorescence of spH, converting pH to spH
fluorescence results in a faster change over time (black line) and the proton pumping time
is erroneously underestimated as 1.2 sec (dashed line shows the exponential fit). We
therefore converted individual fluorescence traces to pH prior to analysis.
21
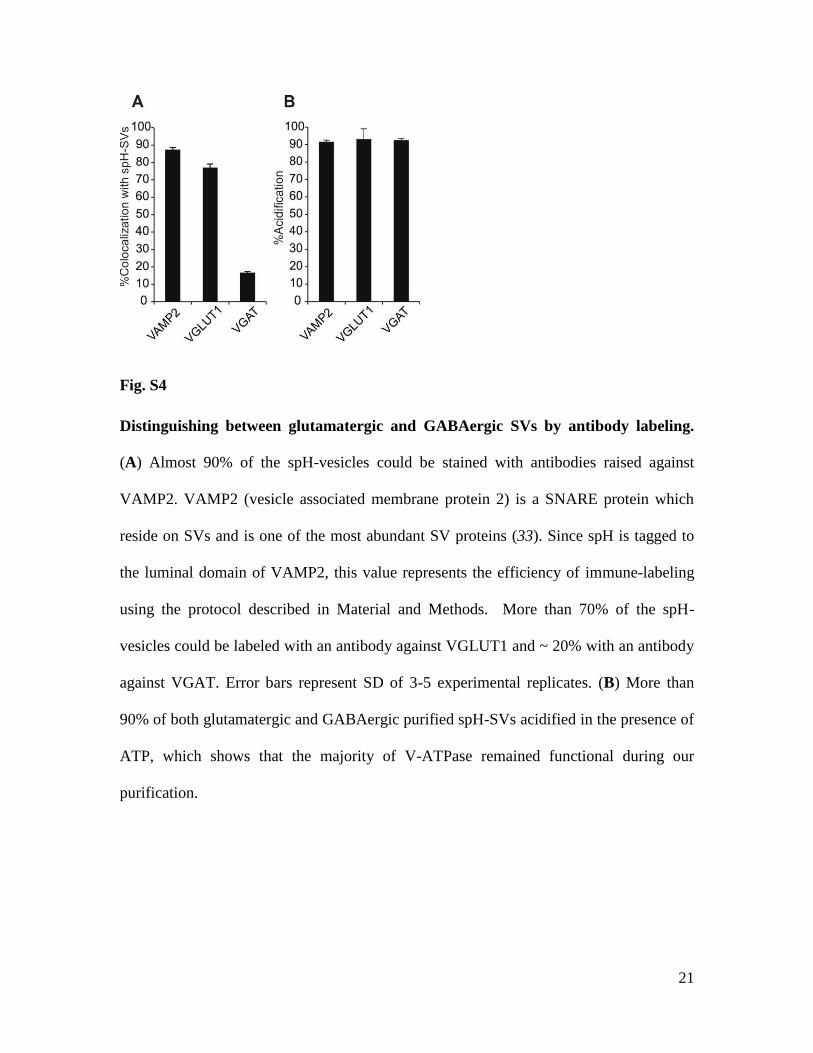
Fig. S4
Distinguishing between glutamatergic and GABAergic SVs by antibody labeling.
(A) Almost 90% of the spH-vesicles could be stained with antibodies raised against
VAMP2. VAMP2 (vesicle associated membrane protein 2) is a SNARE protein which
reside on SVs and is one of the most abundant SV proteins (33). Since spH is tagged to
the luminal domain of VAMP2, this value represents the efficiency of immune-labeling
using the protocol described in Material and Methods. More than 70% of the spH-
vesicles could be labeled with an antibody against VGLUT1 and ~ 20% with an antibody
against VGAT. Error bars represent SD of 3-5 experimental replicates. (B) More than
90% of both glutamatergic and GABAergic purified spH-SVs acidified in the presence of
ATP, which shows that the majority of V-ATPase remained functional during our
purification.

22
Fig. S5
Effects of different ATP concentrations on rate and magnitude of ∆µH+. Effects of
increasing ATP concentrations on luminal pH (A), the proton pumping rate constants (B),
and the membrane potential (C). Error bars in panels A and C represent SDs of 3-5
experimental replicates, and in B represent SEM of on average 100 single SVs with an R-
squared value larger than 0.7 compiled from 3-5 experimental replicates. Red line shows
a Michaelis-Menten fit to the data (Km = 0.63 ± 0.12 mM ATP, Vmax = 1.74 ± 0.10 1/sec).
23
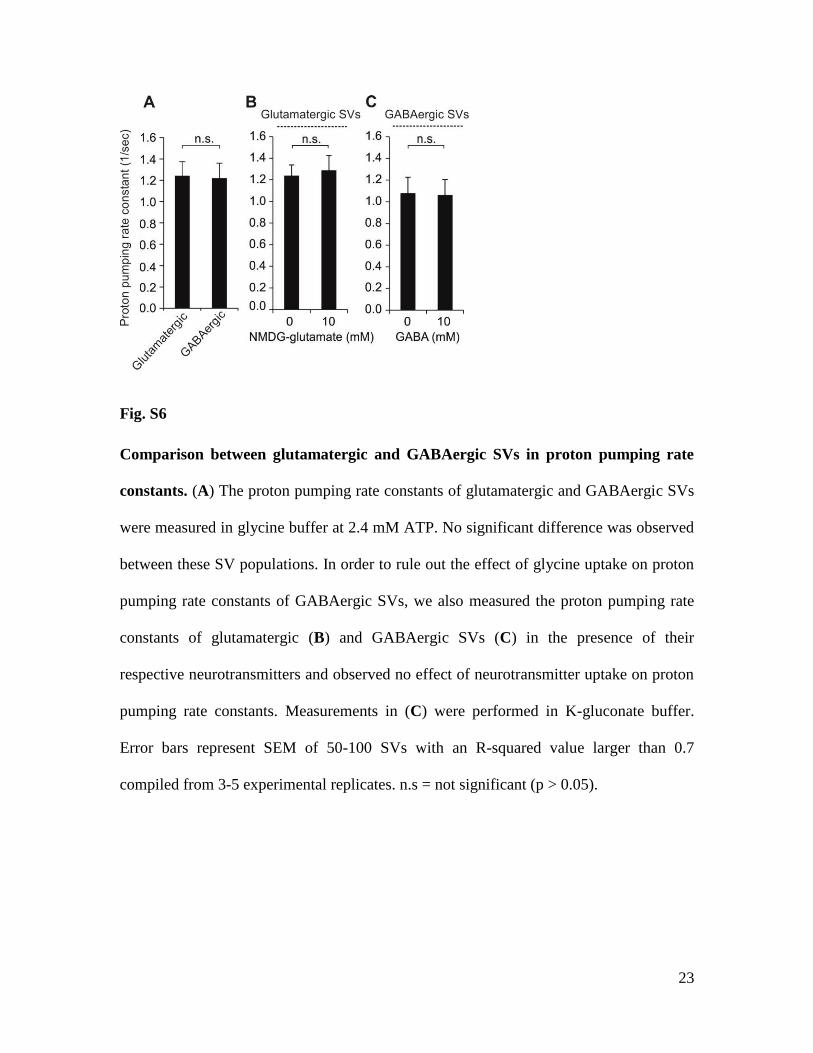
Fig. S6
Comparison between glutamatergic and GABAergic SVs in proton pumping rate
constants. (A) The proton pumping rate constants of glutamatergic and GABAergic SVs
were measured in glycine buffer at 2.4 mM ATP. No significant difference was observed
between these SV populations. In order to rule out the effect of glycine uptake on proton
pumping rate constants of GABAergic SVs, we also measured the proton pumping rate
constants of glutamatergic (B) and GABAergic SVs (C) in the presence of their
respective neurotransmitters and observed no effect of neurotransmitter uptake on proton
pumping rate constants. Measurements in (C) were performed in K-gluconate buffer.
Error bars represent SEM of 50-100 SVs with an R-squared value larger than 0.7
compiled from 3-5 experimental replicates. n.s = not significant (p > 0.05).
24
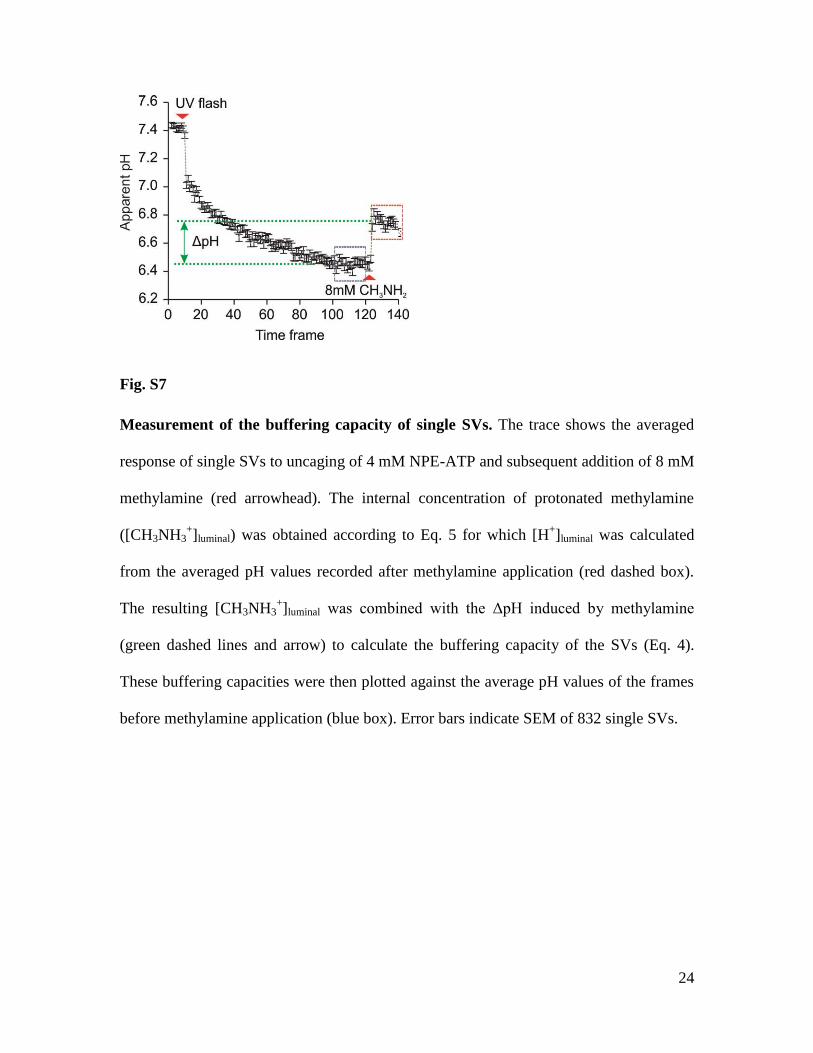
Fig. S7
Measurement of the buffering capacity of single SVs. The trace shows the averaged
response of single SVs to uncaging of 4 mM NPE-ATP and subsequent addition of 8 mM
methylamine (red arrowhead). The internal concentration of protonated methylamine
([CH3NH3+]luminal) was obtained according to Eq. 5 for which [H
+]luminal was calculated
from the averaged pH values recorded after methylamine application (red dashed box).
The resulting [CH3NH3+]luminal was combined with the ΔpH induced by methylamine
(green dashed lines and arrow) to calculate the buffering capacity of the SVs (Eq. 4).
These buffering capacities were then plotted against the average pH values of the frames
before methylamine application (blue box). Error bars indicate SEM of 832 single SVs.
25
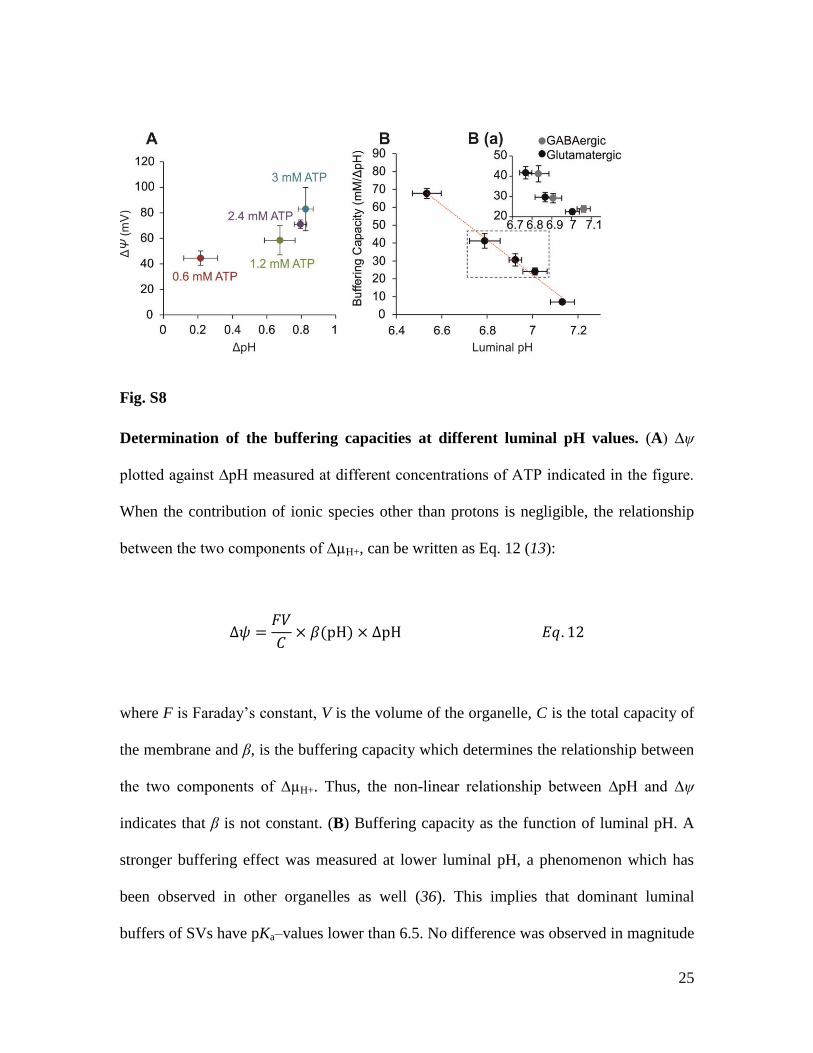
Fig. S8
Determination of the buffering capacities at different luminal pH values. (A) ∆ψ
plotted against ∆pH measured at different concentrations of ATP indicated in the figure.
When the contribution of ionic species other than protons is negligible, the relationship
between the two components of ∆µH+, can be written as Eq. 12 (13):
∆𝜓 =𝐹𝑉
𝐶× 𝛽(pH) × ∆pH 𝐸𝑞. 12
where F is Faraday’s constant, V is the volume of the organelle, C is the total capacity of
the membrane and β, is the buffering capacity which determines the relationship between
the two components of ∆µH+. Thus, the non-linear relationship between ∆pH and ∆ψ
indicates that β is not constant. (B) Buffering capacity as the function of luminal pH. A
stronger buffering effect was measured at lower luminal pH, a phenomenon which has
been observed in other organelles as well (36). This implies that dominant luminal
buffers of SVs have pKa–values lower than 6.5. No difference was observed in magnitude
26
of β between glutamatergic and GABAergic SVs (inset). Red dashed line presents linear
fit to data. All horizontal and vertical error bars represent SD of 3-5 experimental
replicates.
27
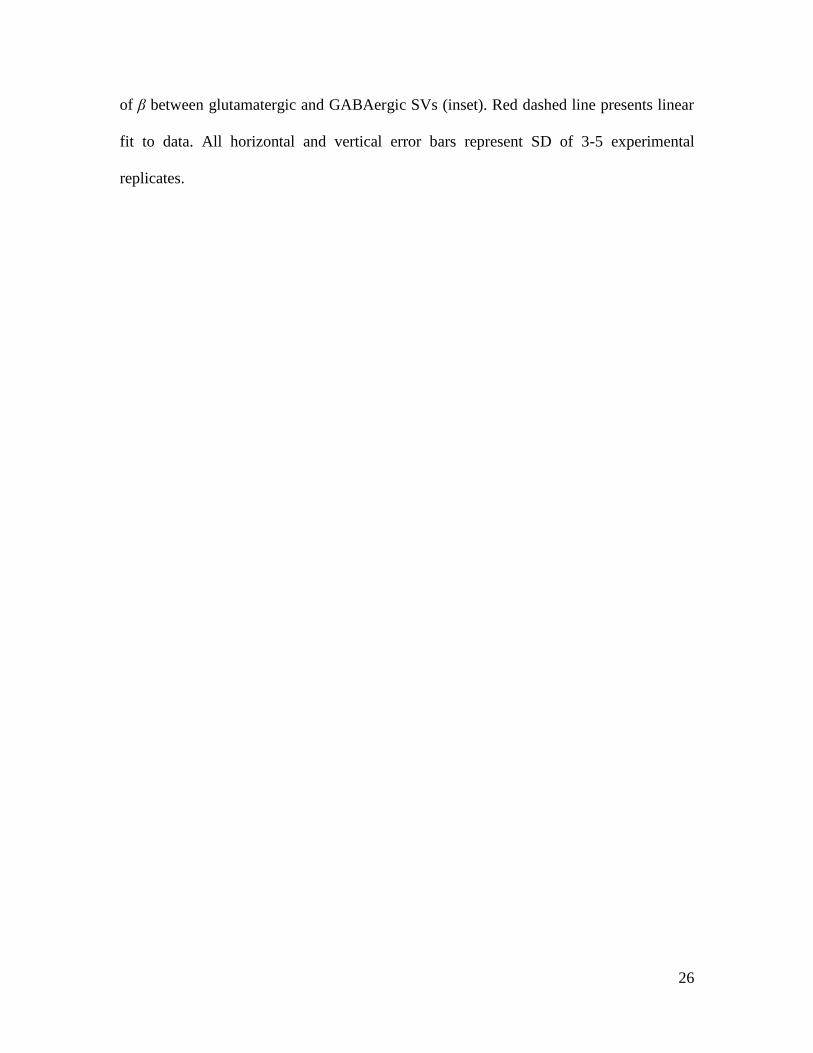
Fig. S9
Measurement of proton permeability of single SVs. Averaged fluorescence trace of
single SVs in response to a pH change in the bath normalized to florescence values after
complete bath exchange (pH 7.4). Immobilized spH-SVs were first equilibrated with a
bath solution pH of 6.5 and then exposed to alkalinizing buffer at pH 7.4 (red arrowhead).
During this solution exchange, the fluorescence of spH-SVs was continuously monitored.
The dashed red line shows a bi-exponential fit to the fluorescence trace. The proton
efflux time constant was then calculated as the first component of the fit. To measure the
effect of GABA, glycine or glutamate on proton efflux, 10 mM GABA, 20 mM glycine
or 10 mM glutamate was included in the alkalinizing buffer, pH 7.4.
28
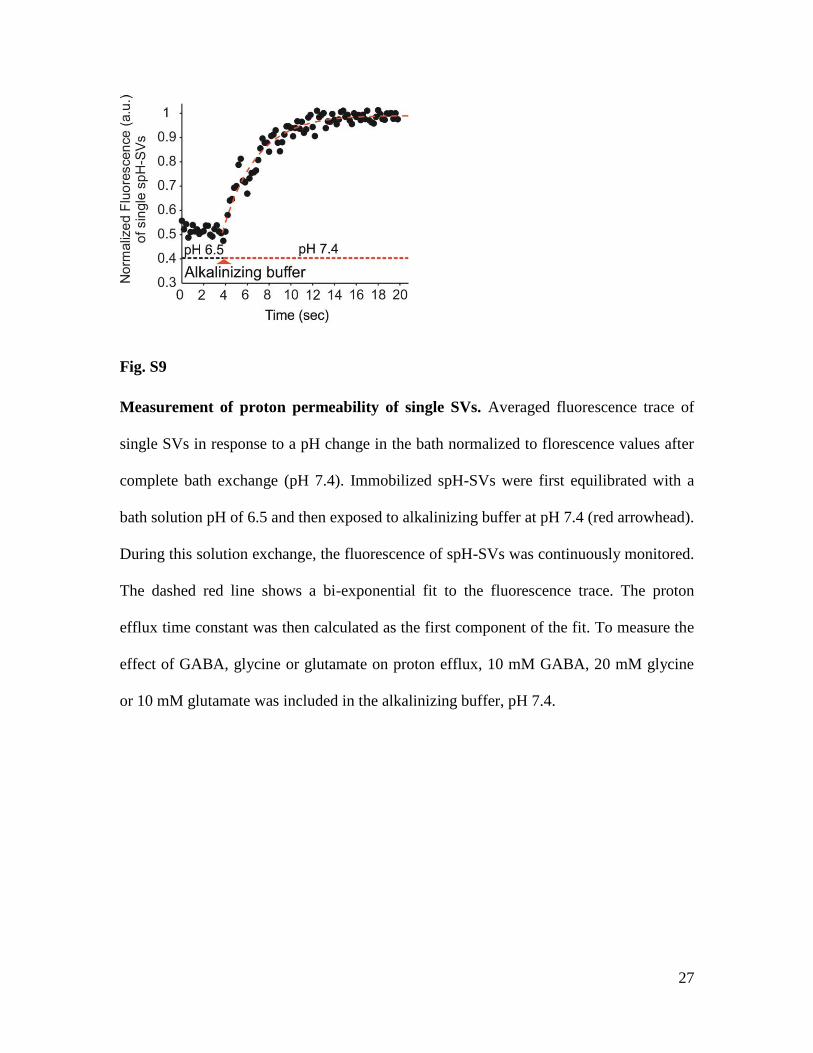
Fig. S10
Size distribution of SVs. A) Representative EM picture of immunogold labeled SVs
(negative staining). Purified SVs from mouse brain were labeled with antibodies against
VGAT (Synaptic Systems). White arrowheads show labeled SVs, non-labeled SVs were
considered glutamatergic (33). Scale bar is 100 nm. The diameter for individual vesicles
was calculated from two measurements orthogonal to each other. All the values for
labeled (GABAergic, n = 510) (B) and non-labeled vesicles (glutamatergic, n = 510) (C)
were pooled and binned into histograms. Averaged diameters were 45.8 ± 10.3 nm for the
GABAergic and 45.5 ± 8.1 nm for the glutamatergic vesicles.
29
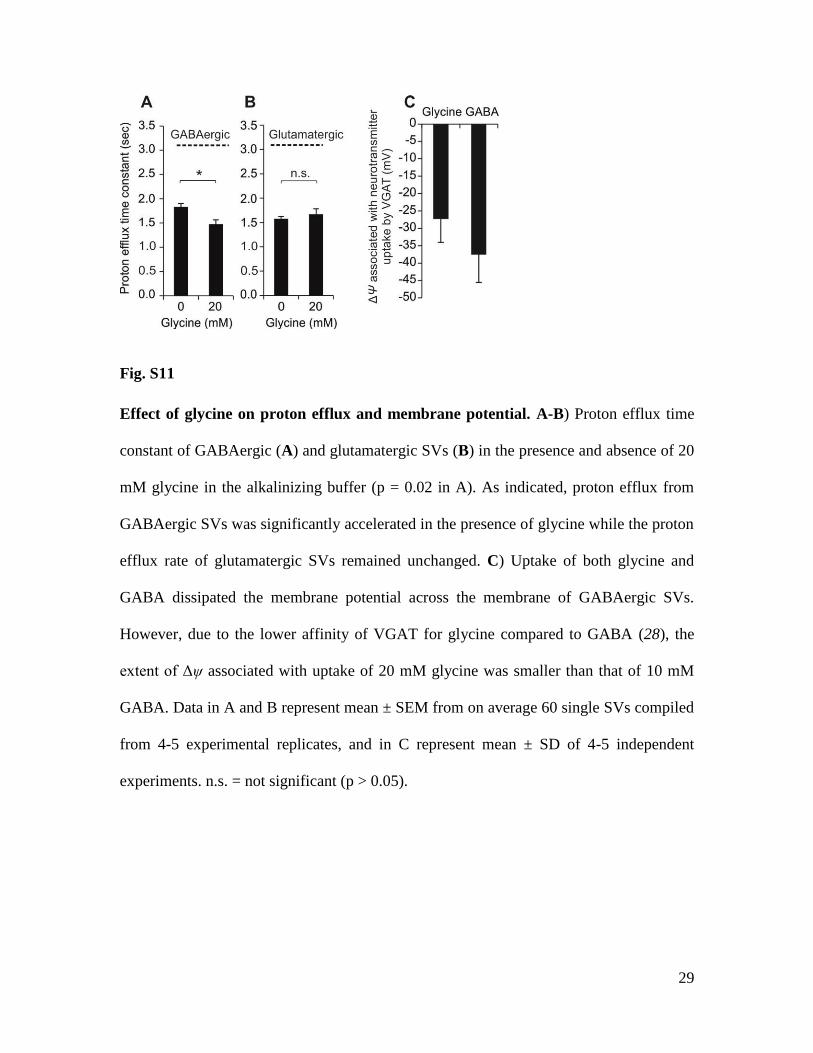
Fig. S11
Effect of glycine on proton efflux and membrane potential. A-B) Proton efflux time
constant of GABAergic (A) and glutamatergic SVs (B) in the presence and absence of 20
mM glycine in the alkalinizing buffer (p = 0.02 in A). As indicated, proton efflux from
GABAergic SVs was significantly accelerated in the presence of glycine while the proton
efflux rate of glutamatergic SVs remained unchanged. C) Uptake of both glycine and
GABA dissipated the membrane potential across the membrane of GABAergic SVs.
However, due to the lower affinity of VGAT for glycine compared to GABA (28), the
extent of Δψ associated with uptake of 20 mM glycine was smaller than that of 10 mM
GABA. Data in A and B represent mean ± SEM from on average 60 single SVs compiled
from 4-5 experimental replicates, and in C represent mean ± SD of 4-5 independent
experiments. n.s. = not significant (p > 0.05).
30
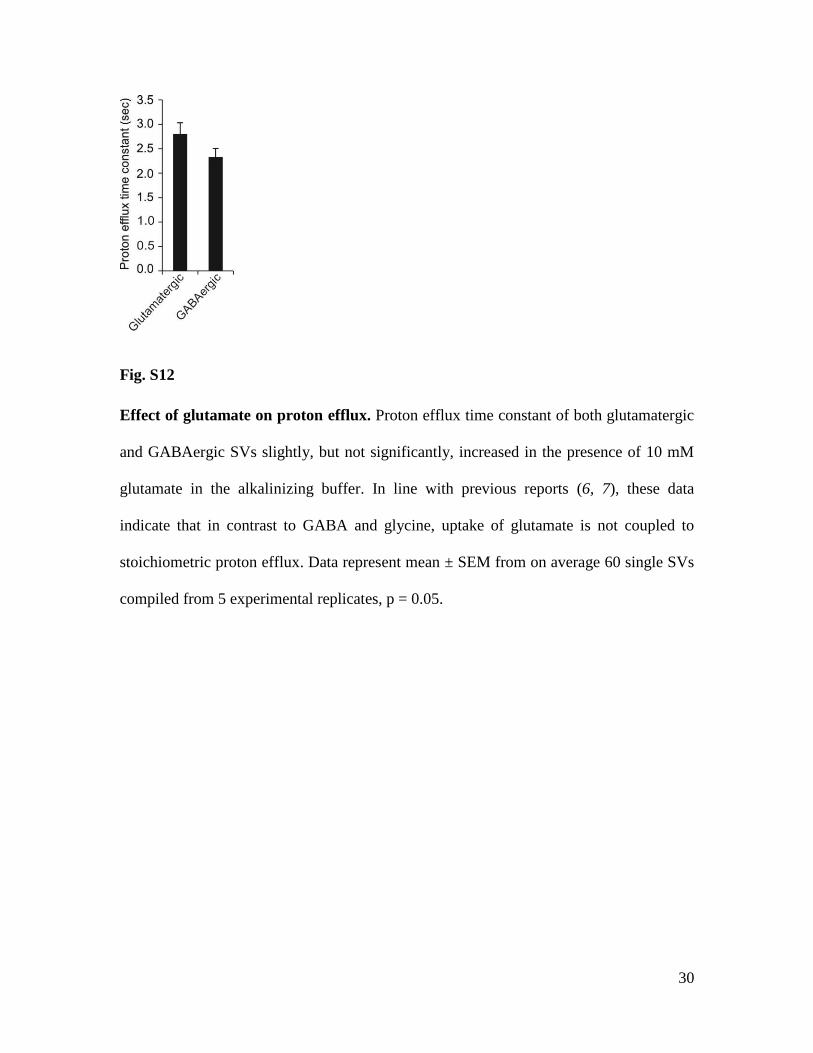
Fig. S12
Effect of glutamate on proton efflux. Proton efflux time constant of both glutamatergic
and GABAergic SVs slightly, but not significantly, increased in the presence of 10 mM
glutamate in the alkalinizing buffer. In line with previous reports (6, 7), these data
indicate that in contrast to GABA and glycine, uptake of glutamate is not coupled to
stoichiometric proton efflux. Data represent mean ± SEM from on average 60 single SVs
compiled from 5 experimental replicates, p = 0.05.
31
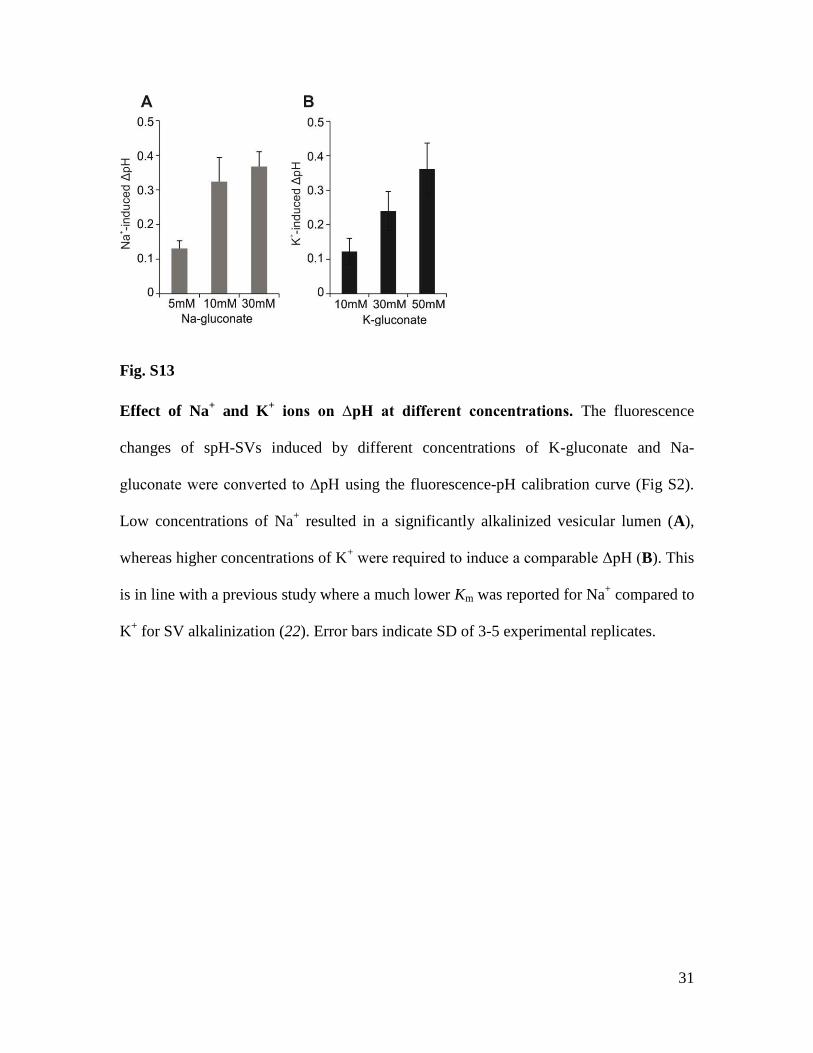
Fig. S13
Effect of Na+ and K
+ ions on ∆pH at different concentrations. The fluorescence
changes of spH-SVs induced by different concentrations of K-gluconate and Na-
gluconate were converted to ΔpH using the fluorescence-pH calibration curve (Fig S2).
Low concentrations of Na+ resulted in a significantly alkalinized vesicular lumen (A),
whereas higher concentrations of K+ were required to induce a comparable ΔpH (B). This
is in line with a previous study where a much lower Km was reported for Na+ compared to
K+ for SV alkalinization (22). Error bars indicate SD of 3-5 experimental replicates.
32
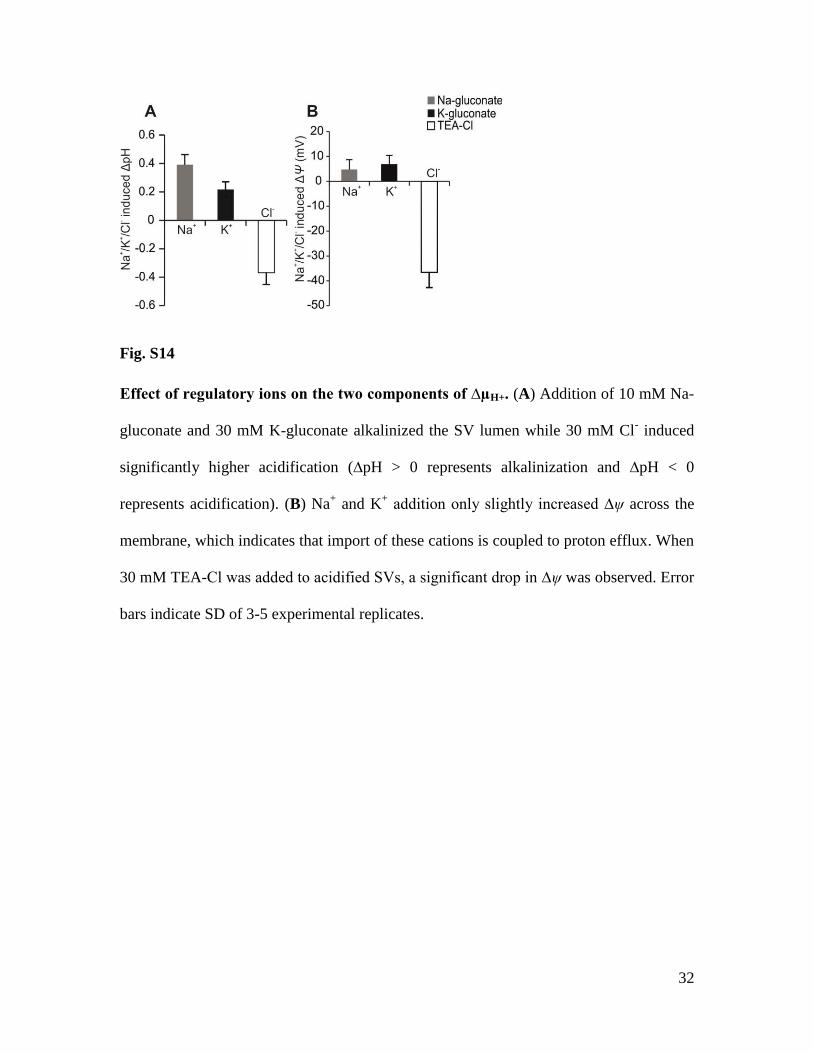
Fig. S14
Effect of regulatory ions on the two components of ∆µH+. (A) Addition of 10 mM Na-
gluconate and 30 mM K-gluconate alkalinized the SV lumen while 30 mM Cl- induced
significantly higher acidification (∆pH > 0 represents alkalinization and ∆pH < 0
represents acidification). (B) Na+ and K
+ addition only slightly increased ∆ψ across the
membrane, which indicates that import of these cations is coupled to proton efflux. When
30 mM TEA-Cl was added to acidified SVs, a significant drop in ∆ψ was observed. Error
bars indicate SD of 3-5 experimental replicates.
33
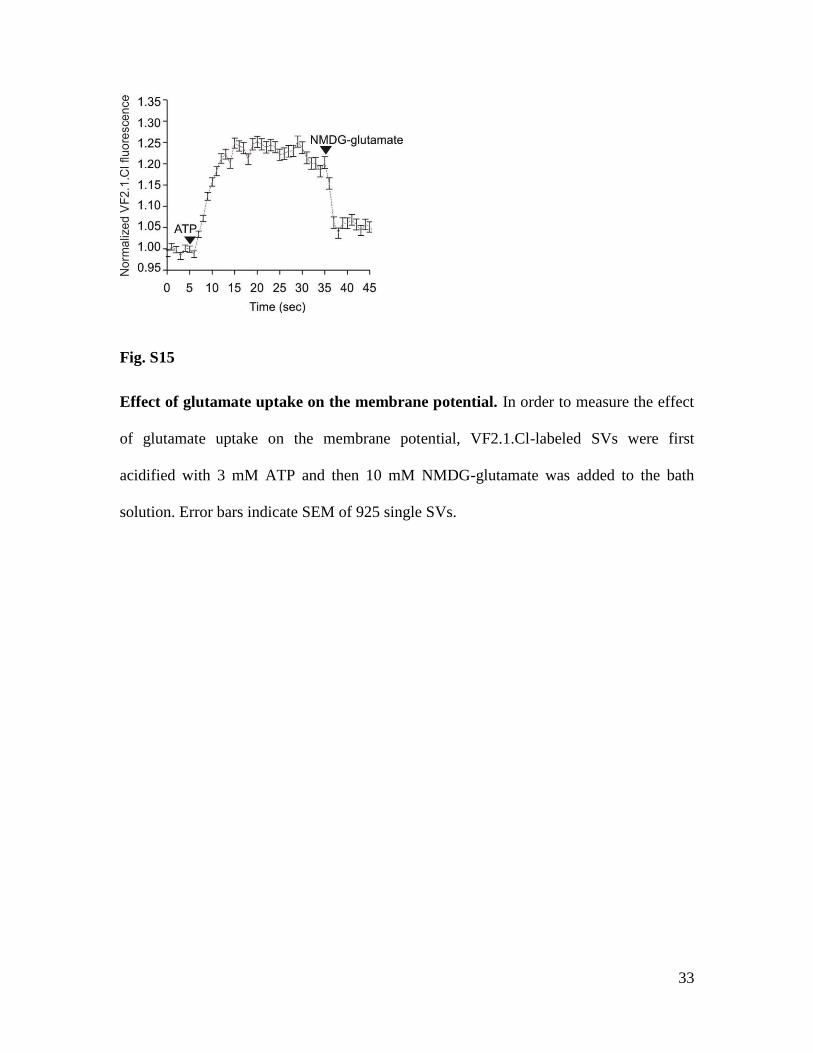
Fig. S15
Effect of glutamate uptake on the membrane potential. In order to measure the effect
of glutamate uptake on the membrane potential, VF2.1.Cl-labeled SVs were first
acidified with 3 mM ATP and then 10 mM NMDG-glutamate was added to the bath
solution. Error bars indicate SEM of 925 single SVs.
References and Notes 1. M. Nakanishi-Matsui, M. Sekiya, R. K. Nakamoto, M. Futai, The mechanism of rotating
proton pumping ATPases. Biochim. Biophys. Acta 1797, 1343–1352 (2010). Medline doi:10.1016/j.bbabio.2010.02.014
2. R. D. Blakely, R. H. Edwards, Vesicular and plasma membrane transporters for neurotransmitters. Cold Spring Harb. Perspect. Biol. 4, a005595 (2012). Medline doi:10.1101/cshperspect.a005595
3. N. Riveros, J. Fiedler, N. Lagos, C. Muñoz, F. Orrego, Glutamate in rat brain cortex synaptic vesicles: Influence of the vesicle isolation procedure. Brain Res. 386, 405–408 (1986). Medline doi:10.1016/0006-8993(86)90181-2
4. P. M. Burger, E. Mehl, P. L. Cameron, P. R. Maycox, M. Baumert, F. Lottspeich, P. De Camilli, R. Jahn, Synaptic vesicles immunoisolated from rat cerebral cortex contain high levels of glutamate. Neuron 3, 715–720 (1989). Medline doi:10.1016/0896-6273(89)90240-7
5. G. Ahnert-Hilger, R. Jahn, CLC-3 spices up GABAergic synaptic vesicles. Nat. Neurosci. 14, 405–407 (2011). Medline doi:10.1038/nn.2786
6. J. Preobraschenski, J. F. Zander, T. Suzuki, G. Ahnert-Hilger, R. Jahn, Vesicular glutamate transporters use flexible anion and cation binding sites for efficient accumulation of neurotransmitter. Neuron 84, 1287–1301 (2014). Medline doi:10.1016/j.neuron.2014.11.008
7. S. Schenck, S. M. Wojcik, N. Brose, S. Takamori, A chloride conductance in VGLUT1 underlies maximal glutamate loading into synaptic vesicles. Nat. Neurosci. 12, 156–162 (2009). Medline doi:10.1038/nn.2248
8. N. Juge, A. Muroyama, M. Hiasa, H. Omote, Y. Moriyama, Vesicular inhibitory amino acid transporter is a Cl-/γ-aminobutyrate Co-transporter. J. Biol. Chem. 284, 35073–35078 (2009). Medline doi:10.1074/jbc.M109.062414
9. Z. Li, J. Burrone, W. J. Tyler, K. N. Hartman, D. F. Albeanu, V. N. Murthy, Synaptic vesicle recycling studied in transgenic mice expressing synaptopHluorin. Proc. Natl. Acad. Sci. U.S.A. 102, 6131–6136 (2005). Medline doi:10.1073/pnas.0501145102
10. K. L. Budzinski, M. Zeigler, B. S. Fujimoto, S. M. Bajjalieh, D. T. Chiu, Measurements of the acidification kinetics of single SynaptopHluorin vesicles. Biophys. J. 101, 1580–1589 (2011). Medline doi:10.1016/j.bpj.2011.08.032
11. E. W. Miller, J. Y. Lin, E. P. Frady, P. A. Steinbach, W. B. Kristan Jr., R. Y. Tsien, Optically monitoring voltage in neurons by photo-induced electron transfer through molecular wires. Proc. Natl. Acad. Sci. U.S.A. 109, 2114–2119 (2012). Medline doi:10.1073/pnas.1120694109
12. Materials and methods are available as supplementary materials on Science Online.
13. M. Grabe, G. Oster, Regulation of organelle acidity. J. Gen. Physiol. 117, 329–344 (2001). Medline doi:10.1085/jgp.117.4.329
14. L. Maresová, B. Hosková, E. Urbánková, R. Chaloupka, H. Sychrová, New applications of pHluorin—Measuring intracellular pH of prototrophic yeasts and determining changes in the buffering capacity of strains with affected potassium homeostasis. Yeast 27, 317–325 (2010). Medline
15. M. Grønborg, N. J. Pavlos, I. Brunk, J. J. Chua, A. Münster-Wandowski, D. Riedel, G. Ahnert-Hilger, H. Urlaub, R. Jahn, Quantitative comparison of glutamatergic and GABAergic synaptic vesicles unveils selectivity for few proteins including MAL2, a novel synaptic vesicle protein. J. Neurosci. 30, 2–12 (2010). Medline doi:10.1523/JNEUROSCI.4074-09.2010
16. S. L. McIntire, R. J. Reimer, K. Schuske, R. H. Edwards, E. M. Jorgensen, Identification and characterization of the vesicular GABA transporter. Nature 389, 870–876 (1997). Medline doi:10.1038/39908
17. P. M. Burger, J. Hell, E. Mehl, C. Krasel, F. Lottspeich, R. Jahn, GABA and glycine in synaptic vesicles: Storage and transport characteristics. Neuron 7, 287–293 (1991). Medline doi:10.1016/0896-6273(91)90267-4
18. V. Riazanski, L. V. Deriy, P. D. Shevchenko, B. Le, E. A. Gomez, D. J. Nelson, Presynaptic CLC-3 determines quantal size of inhibitory transmission in the hippocampus. Nat. Neurosci. 14, 487–494 (2011). Medline doi:10.1038/nn.2775
19. J. W. Hell, P. R. Maycox, R. Jahn, Energy dependence and functional reconstitution of the γ-aminobutyric acid carrier from synaptic vesicles. J. Biol. Chem. 265, 2111–2117 (1990). Medline
20. S. M. Stobrawa, T. Breiderhoff, S. Takamori, D. Engel, M. Schweizer, A. A. Zdebik, M. R. Bösl, K. Ruether, H. Jahn, A. Draguhn, R. Jahn, T. J. Jentsch, Disruption of ClC-3, a chloride channel expressed on synaptic vesicles, leads to a loss of the hippocampus. Neuron 29, 185–196 (2001). Medline doi:10.1016/S0896-6273(01)00189-1
21. J. F. Zander, A. Münster-Wandowski, I. Brunk, I. Pahner, G. Gómez-Lira, U. Heinemann, R. Gutiérrez, G. Laube, G. Ahnert-Hilger, Synaptic and vesicular coexistence of VGLUT and VGAT in selected excitatory and inhibitory synapses. J. Neurosci. 30, 7634–7645 (2010). Medline doi:10.1523/JNEUROSCI.0141-10.2010
22. G. Y. Goh, H. Huang, J. Ullman, L. Borre, T. S. Hnasko, L. O. Trussell, R. H. Edwards, Presynaptic regulation of quantal size: K+/H+ exchange stimulates vesicular glutamate transport. Nat. Neurosci. 14, 1285–1292 (2011). Medline doi:10.1038/nn.2898
23. S. Ahmed, M. Holt, D. Riedel, R. Jahn, Small-scale isolation of synaptic vesicles from mammalian brain. Nat. Protoc. 8, 998–1009 (2013). Medline doi:10.1038/nprot.2013.053
24. A. Nagy, R. R. Baker, S. J. Morris, V. P. Whittaker, The preparation and characterization of synaptic vesicles of high purity. Brain Res. 109, 285–309 (1976). Medline doi:10.1016/0006-8993(76)90531-X
25. S. Sankaranarayanan, D. De Angelis, J. E. Rothman, T. A. Ryan, The use of pHluorins for optical measurements of presynaptic activity. Biophys. J. 79, 2199–2208 (2000). Medline doi:10.1016/S0006-3495(00)76468-X
26. G. Miesenböck, Synapto-pHluorins: Genetically encoded reporters of synaptic transmission. Cold Spring Harb. Protoc. 2012, 213–217 (2012). Medline doi:10.1101/pdb.ip067827
27. J. C. Gadd, B. S. Fujimoto, S. M. Bajjalieh, D. T. Chiu, Single-molecule fluorescence quantification with a photobleached internal standard. Anal. Chem. 84, 10522–10525 (2012). Medline doi:10.1021/ac303032m
28. S. M. Wojcik, S. Katsurabayashi, I. Guillemin, E. Friauf, C. Rosenmund, N. Brose, J. S. Rhee, A shared vesicular carrier allows synaptic corelease of GABA and glycine. Neuron 50, 575–587 (2006). Medline doi:10.1016/j.neuron.2006.04.016
29. J. W. Walker, G. P. Reid, J. A. Mccray, D. R. Trentham, Photolabile 1-(2-Nitropheny1) ethyl phosphate esters of adenine nucleotide analogues: Synthesis and mechanism of photolysis. J. Am. Chem. Soc. 110, 7170–7177 (1988). doi:10.1021/ja00229a036
30. J. A. McCray, L. Herbette, T. Kihara, D. R. Trentham, A new approach to time-resolved studies of ATP-requiring biological systems; Laser flash photolysis of caged ATP. Proc. Natl. Acad. Sci. U.S.A. 77, 7237–7241 (1980). Medline doi:10.1073/pnas.77.12.7237
31. J. C. Olivo-Marin, Extraction of spots in biological images using multiscale products. Pattern Recognit. 35, 1989–1996 (2002). doi:10.1016/S0031-3203(01)00127-3
32. R. J. Ritchie, J. Gibson; J. G. Raymond J. Ritchie, Permeability of ammonia, methylamine and ethylamine in the cyanobacterium,Synechococcus R-2 (Anacystis nidulans) PCC 7942. J. Membr. Biol. 95, 131–142 (1987). doi:10.1007/BF01869158
33. S. Takamori, M. Holt, K. Stenius, E. A. Lemke, M. Grønborg, D. Riedel, H. Urlaub, S. Schenck, B. Brügger, P. Ringler, S. A. Müller, B. Rammner, F. Gräter, J. S. Hub, B. L. De Groot, G. Mieskes, Y. Moriyama, J. Klingauf, H. Grubmüller, J. Heuser, F. Wieland, R. Jahn, Molecular anatomy of a trafficking organelle. Cell 127, 831–846 (2006). Medline doi:10.1016/j.cell.2006.10.030
34. T. W. Groemer, C. S. Thiel, M. Holt, D. Riedel, Y. Hua, J. Hüve, B. G. Wilhelm, J. Klingauf, Amyloid precursor protein is trafficked and secreted via synaptic vesicles. PLOS ONE 6, e18754 (2011). Medline doi:10.1371/journal.pone.0018754
35. S. A. Mutch, B. S. Fujimoto, C. L. Kuyper, J. S. Kuo, S. M. Bajjalieh, D. T. Chiu, Deconvolving single-molecule intensity distributions for quantitative microscopy measurements. Biophys. J. 92, 2926–2943 (2007). Medline doi:10.1529/biophysj.106.101428
36. D. J. Goldsmith, P. J. Hilton, Relationship between intracellular proton buffering capacity and intracellular pH. Kidney Int. 41, 43–49 (1992). Medline doi:10.1038/ki.1992.6