Embed Size (px)
Citation preview
Supplementary Materials for
Computational modeling guides tissue-engineered heart valve design for
long-term in vivo performance in a translational sheep model
Maximilian Y. Emmert, Boris A. Schmitt, Sandra Loerakker, Bart Sanders,
Hendrik Spriestersbach, Emanuela S. Fioretta, Leon Bruder, Kerstin Brakmann,
Sarah E. Motta, Valentina Lintas, Petra E. Dijkman, Laura Frese, Felix Berger,
Frank P. T. Baaijens, Simon P. Hoerstrup*
*Corresponding author. Email: [email protected]
Published 9 May 2018, Sci. Transl. Med. 10, eaan4587 (2018)
DOI: 10.1126/scitranslmed.aan4587
The PDF file includes:
Materials and Methods
Fig. S1. Schematic overview of study concept.
Fig. S2. Gross and histological characterization of a control TEHV.
Fig. S3. Overview of the clinical-grade percutaneous implantation system and the
multimodality imaging protocols to assess TEHV positioning, functionality, and
performance throughout the study.
Fig. S4. Computational predictions of valve remodeling and postmortem analysis
of valve G, which was malpositioned upon implantation.
Fig. S5. Longitudinal cardiac MRI flow measurements for the assessment of
TEHV function and regurgitation fraction over 1 year.
Fig. S6. Postmortem analyses of valve E explanted after 6 months in vivo.
Fig. S7. Additional results on the computational predictions of in vivo strains and
valve remodeling based on initial tissue properties.
Fig. S8. Analysis of collagen alignment.
Fig. S9. Histological evaluation of cellular infiltration in a representative valve
(valve N) using Masson Goldner staining.
Fig. S10. Evaluation of elastogenesis and neosinus formation.
Fig. S11. Assessment of leaflet length and position.
Fig. S12. Evaluation of calcification in different explants with von Kossa staining.
Fig. S13. Histological evaluation of the inflammatory response using H&E
staining.
Fig. S14. Evaluation of leaflet remodeling using Elastica van Gieson staining.
www.sciencetranslationalmedicine.org/cgi/content/full/10/440/eaan4587/DC1

Fig. S15. Postmortem analyses of valve J explanted after 1 year in vivo.
Fig. S16. Immunohistochemical analysis for presence and distribution of αSMA-
positive cells in valve G.
Fig. S17. Schematic representation depicting the functional remodeling process
within the TEHV.
Table S1. In vitro TEHV functionality before implantation.
Table S2. Animal characteristics.
Table S3. Pulmonary dimensions and hemodynamics before and after
implantation.
Table S4. Functional long-term catheter data (invasive hemodynamic
measurements) of TEHVs at baseline and after 1 year.
Table S5. Functional ICE data of TEHVs at baseline and after 1 year.
Table S6. Functional MRI data of TEHV insufficiency at baseline and after 1
year.
Table S7. Leaflet thickness in the explants.
References (50–52)
Other Supplementary Material for this manuscript includes the following:
(available at
www.sciencetranslationalmedicine.org/cgi/content/full/10/440/eaan4587/DC1)
Movie S1 (.mp4 format). In vitro TEHV testing.
Movie S2 (.avi format). Angiography after TEHV implantation.
Movie S3 (.avi format). ICE after implantation.
Movie S4 (.avi format). Color-coded ICE after implantation.
Movie S5 (.avi format). ICE at 6-month follow-up.
Movie S6 (.avi format). Color-coded ICE at 6-month follow-up.
Movie S7 (.avi format). ICE at 12-month follow-up.
Movie S8 (.avi format). Color-coded ICE at 12-month follow-up.

Materials and Methods
Manufacturing of tissue engineered heart valves (TEHVs)
Tri-leaflet heart valves were cut from non-woven polyglycolic-acid meshes (PGA; thickness 1.0 mm;
specific gravity 70 mg/cm3; Cellon), sewn (Prolene 6-0, Ethicon) into a radially self-expandable
nitinol stent (length = 31 mm, ID = 30 mm at 37 °C; PFM-AG), and coated with 1.75% poly-4-
hydroxybutyrate (P4HB; MW: 1 x 10⁶; TEPHA Inc.) in tetrahydrofuran (THF; Sigma-Aldrich). These
constructs were sterilized with 70% ethanol (EtOH, VWR international) followed by an anti-
fungi/bacterial treatment containing 10% penicillin/streptomycin (Pen/Strep) (Lonza), supplemented
with 0.5% Fungin (InvivoGen). Primary isolated ovine vascular-derived cells were seeded (0.3 x 10⁶
cells / cm2, passage 6) onto the valvular shaped scaffolds using fibrin as a cell carrier. The seeded
constructs were placed into the bioreactor system containing growth medium [(Advanced DMEM
(Gibco), supplemented with 0.5-1% lamb serum (Gibco), 1% Pen/Strep and 1% Glutamax (Gibco),
L-ascorbic acid 2-phosphate (0.25 mg/ml, Sigma)] with the addition of geometry constraining inserts
to maintain the imposed leaflet geometry (33) and were then subjected to 1 Hz pulsatile flow (33).
To prevent tissue retraction in radial direction, heart valve leaflets were grown in merged
configuration and supported by an additional insert from below to define and maintain the coaptation
length during the culture procedure. To maintain continued medium supply in both top and bottom
region of the valve, unidirectional pressure driven fluid flow was applied by using one way valves
(Qosina), in which the circulation was split at the pressure tube and directed to both top and bottom
region.
TEHVs were decellularized overnight in detergent solution (0.25% Triton X-100, sodium
deoxycholate and 0.02% EDTA), prior to removal of the inserts. Nucleic remnants were
enzymatically degraded by using Benzonase (EMD Millipore) incubation steps, diluted in 50 mM
TRIS-HCL buffer solution in concentrations of 100 U/ml, 80 U/ml and 20 U/ml for 8, 16 and 8 hours,
respectively, on a shaker at 37 °C. Afterwards, the valves were washed with PBS to remove cellular
remnants, and sterilized with 70% EtOH and an anti-fungi/bacterial solution as described above.

In vitro functionality assessment
TEHVs (n = 11) were placed inside a silicon annulus of 30 mm inner diameter and positioned into a
hydrodynamic pulsatile test system (HDT-500, BDC Laboratories) containing a physiologic saline
solution at 37 °C. Valves were subjected to physiological pulmonary conditions (rate of 72 BPM,
stroke volume of 70 ml, maximum diastolic pressure difference of 25 mmHg) for 1 hour. Flow and
pressures were measured via a transonic sensor (TS410, Transonic Systems) and pressure
sensors (BDC-PT, BDC Laboratories), respectively. Data were collected for 3 seconds at 5 kHz, and
functionality was assessed from an average over 10 cardiac cycles by using Statys software (BDC
Laboratories), to determine the regurgitation fraction defined as the sum of the leakage volume and
the closing volume, expressed as a percentage of the stroke volume. Slow-motion movies were
recorded at high-speed burst mode to assess opening and closing behavior of the valves in motion
(G15 PowerShot, Canon)
Anesthesia
Animals were sedated using intravenous thiopental 7.5–10 mg/kg (Trapanal 0.5 g, Inresa
Arzneimittel GmbH) and propofol 1–2.5 mg/kg (Propofol-Lipuro 1%, Braun). The sheep were pre-
medicated 20 minutes prior to intubation using 0.4 mg/kg Midazolam (Dormicum 5 mg/ml, Roche
Pharma AG), 0.4 mg/kg Butorphanol (Alvegesic 2 mg/ml, Alvetra u. Werfft GmbH) and 0.005 mg/kg
Medetomidin (Domitor 1 mg/ml, Orion Corporation). For sedation, Propofol 1-3.5 mg/kg (Propofol-
Lipuro 1%, Braun) was used. After intubation, a gastric tube was placed into the rumen for gas
evacuation. Total intravenous anesthesia was performed using propofol (6–12 mg/kg/h) and
ketamine (3–5 mg/kg/h) during preparation for implantation and explantation as well as during the
follow-up examinations (cCT and ICE).
For implantation and explantation, a 4 F sizing catheter (PIG-CSC-20, Cook Medical, Bloomington)
was placed into the esophagus to scale measurements in the fluoroscopic images. Animals were
placed in supine position, and were anesthetized and mechanically ventilated using isoflurane
(Forene, Abbott GmbH und Co K) at an expiratory fraction (Fex) of 1.2 to 1.9 % and continuous
infusion of ketamine at 2–5 mg/kg/h (Ketamin-Actavis, Actavis). Invasive arterial blood pressure,
pulse oximetry, rectal temperature and the electrocardiogram were continuously monitored. Animals
were anticoagulated with heparin 50–100 IU/kg (Heparin Natrium 5000-Ratiopharm, Ratiopharm).
Implantation and deployment of TEHVs
The implantation was carried out as previously described (22). In brief, after inspection of the TEHV
to exclude macroscopic damages, the leaflets were separated with a scalpel. Using a crimping tool
(Edwards Lifesciences) the TEHV was crimped stepwise to a minimal diameter of 8 or 10 mm,
depending on its crimpability. The crimped TEHV was front loaded into the capsule of our custom-
made delivery system (51) with an inner/outer diameter of either 8/8.6 mm (24/26 F) or 10/10.6 mm
(30/32 F). The delivery system was sheathlessly inserted into the jugular vein because in the ovine
model the femoral veins are too small. After positioning an ultra-stiff guidewire (Amplatz Ultra-Stiff
Wire Guide, Ultra-Stiff 2, Curved – PTFE-Coated Stainless Steel; William Cook Europe) in the right
or left pulmonary artery, the delivery system was coaxially advanced to the pulmonary valve position
under fluoroscopic guidance. The capsule was then withdrawn and the self-expanding TEHV was
released over-stenting the native pulmonary valve. Instant angiography was used after implantation
to confirm the position of the TEHV. The function was assessed by invasive pressure
measurements and ICE.
Anticoagulation was continued for five days using acetylsalicylic acid 100 mg/day per os (ASS
ratiopharm; ratiopharm GmbH) and dalteparin 350 U/kg/day subcutaneously (Fragmin; Pfizer
Pharma GmbH). All animals received humane care in compliance with the “Principles of Laboratory
Animal Care” and according to the Guide to the Care and Use of Experimental Animals published
by the U.S. National Institutes of Health (NIH Publication 85-23;revised 1996).
Hemodynamics
Pulmonary artery, right ventricular, right atrial and central venous pressures were assessed and
recorded (Eagle 4000, Marquette Hellige) before and after implantation using a 5.2 F 145 pigtail
catheter (Cordis). After implantation of the TEHV these measurements were repeated.
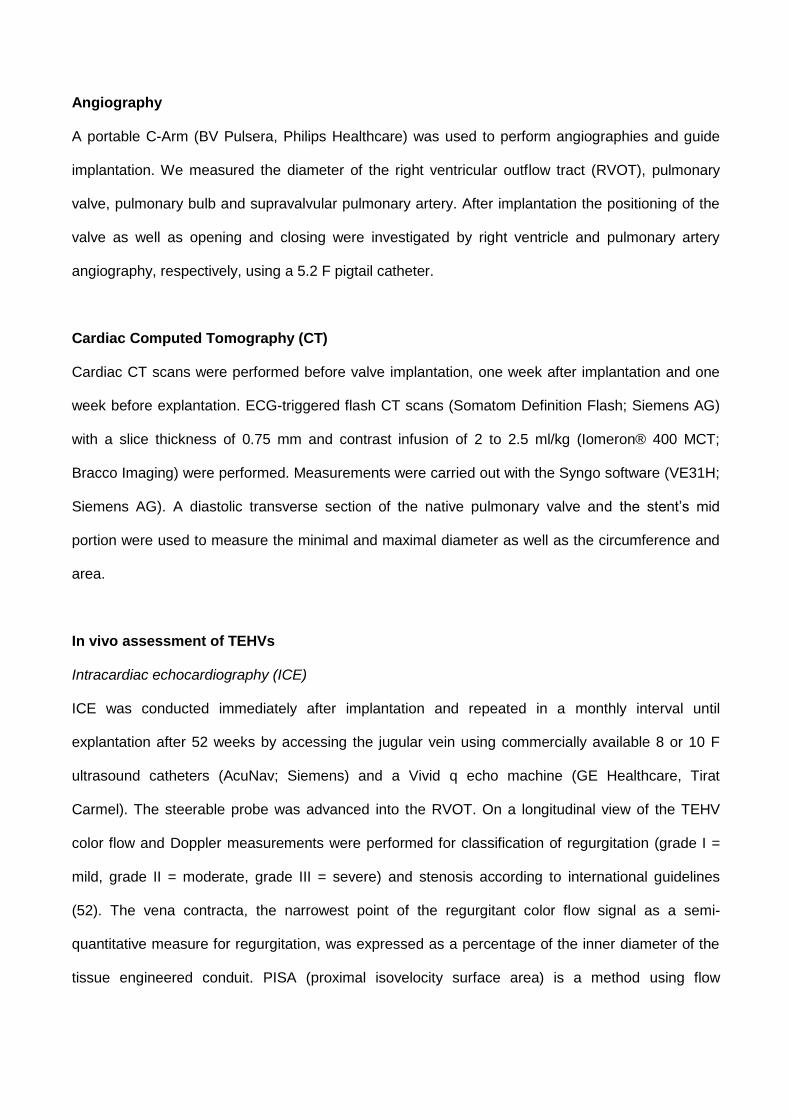
Angiography
A portable C-Arm (BV Pulsera, Philips Healthcare) was used to perform angiographies and guide
implantation. We measured the diameter of the right ventricular outflow tract (RVOT), pulmonary
valve, pulmonary bulb and supravalvular pulmonary artery. After implantation the positioning of the
valve as well as opening and closing were investigated by right ventricle and pulmonary artery
angiography, respectively, using a 5.2 F pigtail catheter.
Cardiac Computed Tomography (CT)
Cardiac CT scans were performed before valve implantation, one week after implantation and one
week before explantation. ECG-triggered flash CT scans (Somatom Definition Flash; Siemens AG)
with a slice thickness of 0.75 mm and contrast infusion of 2 to 2.5 ml/kg (Iomeron® 400 MCT;
Bracco Imaging) were performed. Measurements were carried out with the Syngo software (VE31H;
Siemens AG). A diastolic transverse section of the native pulmonary valve and the stent’s mid
portion were used to measure the minimal and maximal diameter as well as the circumference and
area.
In vivo assessment of TEHVs
Intracardiac echocardiography (ICE)
ICE was conducted immediately after implantation and repeated in a monthly interval until
explantation after 52 weeks by accessing the jugular vein using commercially available 8 or 10 F
ultrasound catheters (AcuNav; Siemens) and a Vivid q echo machine (GE Healthcare, Tirat
Carmel). The steerable probe was advanced into the RVOT. On a longitudinal view of the TEHV
color flow and Doppler measurements were performed for classification of regurgitation (grade I =
mild, grade II = moderate, grade III = severe) and stenosis according to international guidelines
(52). The vena contracta, the narrowest point of the regurgitant color flow signal as a semi-
quantitative measure for regurgitation, was expressed as a percentage of the inner diameter of the
tissue engineered conduit. PISA (proximal isovelocity surface area) is a method using flow

convergence zones. Radius of PISA was assessed during diastole at the first aliasing in doppler
imaging and correlates with a valve coaptation deficit.
MRI
Cardiac MRI was performed monthly on a 1.5 Tesla machine (Achieva 2.6, 5-channel cardiac coil;
Philips Medical Systems). Velocity-encoded phase-contrast sequences for measurement of two-
dimensional quantitative flow (2D-QF) were conducted in the main pulmonary artery beyond the
distal end of the stent and in the ascending aorta beyond the ostia of the coronary arteries. The
regurgitation fraction (RF) resulted from the retrograde flow divided by the antegrade flow. A
pulmonary RF below 30% was considered as mild to moderate TEHV insufficiency. A pulmonary RF
above 30% in two consecutive monthly examinations was considered as moderate to severe
insufficiency and served as stop criterion for the trial on the respective animal.
Histology and Immunohistochemistry
From all explanted TEHVs and control valves, representative parts were taken and fixed in formalin,
paraffin-embedded and prepared in 2-5 μm sections. To assess for tissue morphology and cell
infiltration, Hematoxylin (Byosystems AG) and Eosin (Eosin-y-Phloxin, Byosystems AG) and
Masson Goldner (handmade staining solution) staining were performed. Next, Elastica van Gieson
[consisting of resorcin fuchsin (Byosystems AG), Weigert's iron hematoxylin (handmade)
picrofuchsin (Byosystems AG), and 70% ethanol with picric acid (handmade)] staining was carried
out to evaluate collagen and elastic fiber distribution, while Von Kossa [(handmade solution with
nuclear fast red (Byosystems AG)] staining was used to detect calcification.
To characterize the phenotype of the infiltrated cells within the explanted TEHVs,
immunohistochemistry was performed using the Sequenza Coverplate staining system (Thermo
Scientific) and 3,3'Diaminobenzidine (DAB) substrate as chromogen (K3468, Dako). Non specific
staining was prevented by using Protein block serum-free solution (X0909, Dako). Upon antigen
retrival (using handmade target retrieval solution PT-link at pH 6.0 or 9.0), cells were then
characterized for α-Smooth Muscle Actin (αSMA, IR611; Dako; no antigen retrieval), vimentin
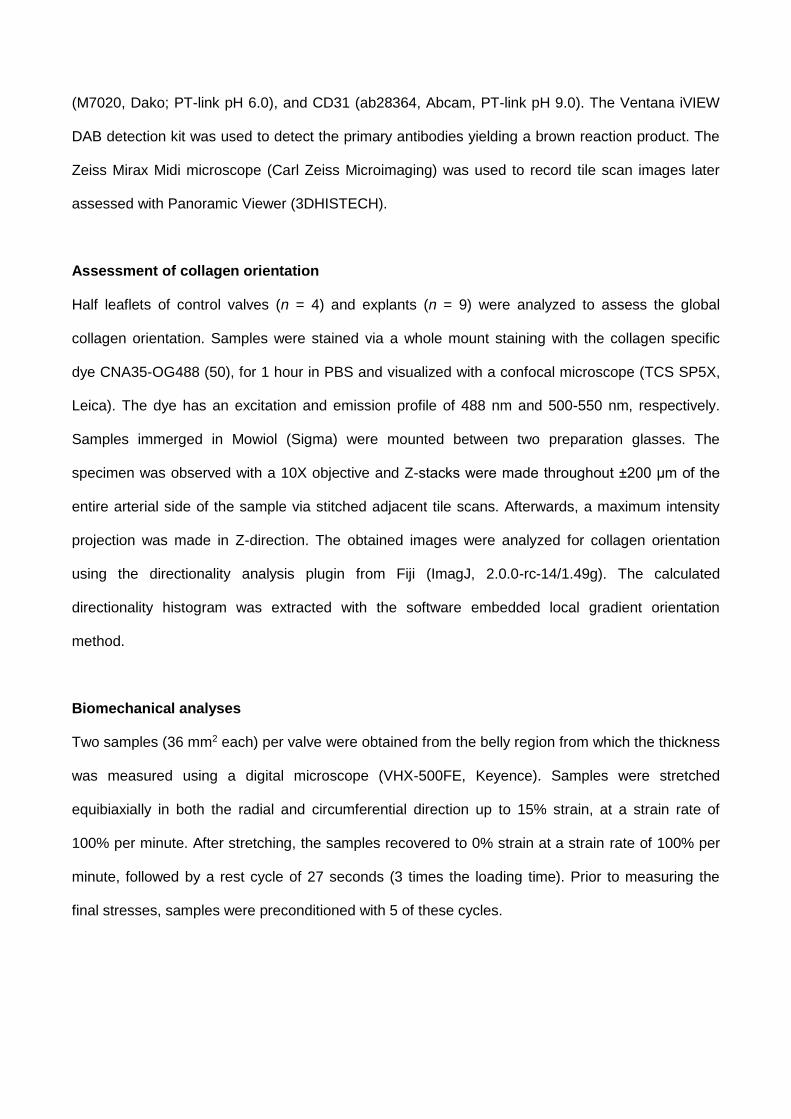
(M7020, Dako; PT-link pH 6.0), and CD31 (ab28364, Abcam, PT-link pH 9.0). The Ventana iVIEW
DAB detection kit was used to detect the primary antibodies yielding a brown reaction product. The
Zeiss Mirax Midi microscope (Carl Zeiss Microimaging) was used to record tile scan images later
assessed with Panoramic Viewer (3DHISTECH).
Assessment of collagen orientation
Half leaflets of control valves (n = 4) and explants (n = 9) were analyzed to assess the global
collagen orientation. Samples were stained via a whole mount staining with the collagen specific
dye CNA35-OG488 (50), for 1 hour in PBS and visualized with a confocal microscope (TCS SP5X,
Leica). The dye has an excitation and emission profile of 488 nm and 500-550 nm, respectively.
Samples immerged in Mowiol (Sigma) were mounted between two preparation glasses. The
specimen was observed with a 10X objective and Z-stacks were made throughout ±200 μm of the
entire arterial side of the sample via stitched adjacent tile scans. Afterwards, a maximum intensity
projection was made in Z-direction. The obtained images were analyzed for collagen orientation
using the directionality analysis plugin from Fiji (ImagJ, 2.0.0-rc-14/1.49g). The calculated
directionality histogram was extracted with the software embedded local gradient orientation
method.
Biomechanical analyses
Two samples (36 mm2 each) per valve were obtained from the belly region from which the thickness
was measured using a digital microscope (VHX-500FE, Keyence). Samples were stretched
equibiaxially in both the radial and circumferential direction up to 15% strain, at a strain rate of
100% per minute. After stretching, the samples recovered to 0% strain at a strain rate of 100% per
minute, followed by a rest cycle of 27 seconds (3 times the loading time). Prior to measuring the
final stresses, samples were preconditioned with 5 of these cycles.
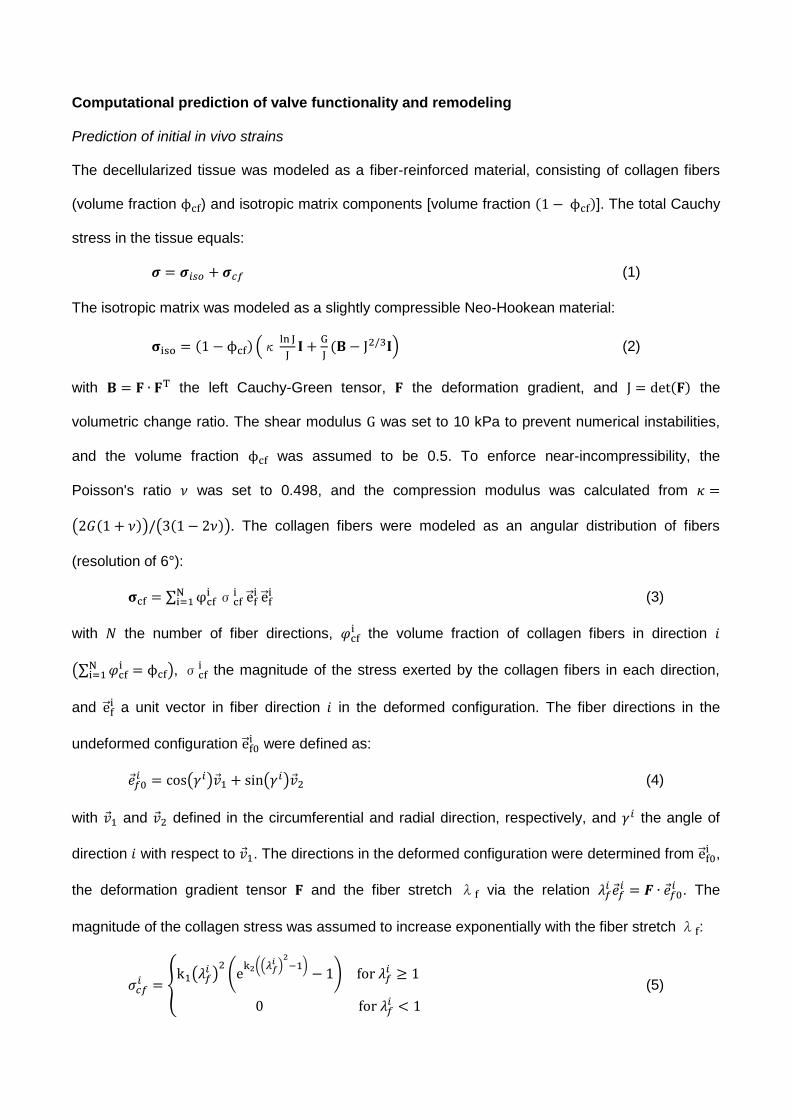
Computational prediction of valve functionality and remodeling
Prediction of initial in vivo strains
The decellularized tissue was modeled as a fiber-reinforced material, consisting of collagen fibers
(volume fraction ϕcf) and isotropic matrix components [volume fraction (1 − ϕcf)]. The total Cauchy
stress in the tissue equals:
𝝈 = 𝝈𝑖𝑠𝑜 + 𝝈𝑐𝑓 (1)
The isotropic matrix was modeled as a slightly compressible Neo-Hookean material:
𝛔iso = (1 − ϕcf) (κln J
J𝐈 +
G
J(𝐁 − J2/3𝐈) (2)
with 𝐁 = 𝐅 ∙ 𝐅T the left Cauchy-Green tensor, 𝐅 the deformation gradient, and J = det(𝐅) the
volumetric change ratio. The shear modulus G was set to 10 kPa to prevent numerical instabilities,
and the volume fraction ϕcf was assumed to be 0.5. To enforce near-incompressibility, the
Poisson's ratio 𝜈 was set to 0.498, and the compression modulus was calculated from 𝜅 =
(2𝐺(1 + 𝜈))/(3(1 − 2𝜈)). The collagen fibers were modeled as an angular distribution of fibers
(resolution of 6°):
𝛔cf = ∑ φcfiN
i=1 σcfi e⃗ f
i e⃗ fi (3)
with 𝑁 the number of fiber directions, 𝜑cfi the volume fraction of collagen fibers in direction 𝑖
(∑ 𝜑cfiN
i=1 = ϕcf), σcfi the magnitude of the stress exerted by the collagen fibers in each direction,
and e⃗ fi a unit vector in fiber direction 𝑖 in the deformed configuration. The fiber directions in the
undeformed configuration e⃗ f0i were defined as:
𝑒 𝑓0𝑖 = cos(𝛾𝑖)𝑣 1 + sin(𝛾𝑖)𝑣 2 (4)
with 𝑣 1 and 𝑣 2 defined in the circumferential and radial direction, respectively, and 𝛾𝑖 the angle of
direction 𝑖 with respect to 𝑣 1. The directions in the deformed configuration were determined from e⃗ f0i ,
the deformation gradient tensor 𝐅 and the fiber stretch λf via the relation 𝜆𝑓𝑖 𝑒 𝑓
𝑖 = 𝑭 ∙ 𝑒 𝑓0𝑖 . The
magnitude of the collagen stress was assumed to increase exponentially with the fiber stretch λf:
𝜎𝑐𝑓𝑖 = {
k1(𝜆𝑓𝑖 )
2(e
k2((𝜆𝑓𝑖 )
2−1)
− 1) for 𝜆𝑓𝑖 ≥ 1
0 for 𝜆𝑓𝑖 < 1
(5)
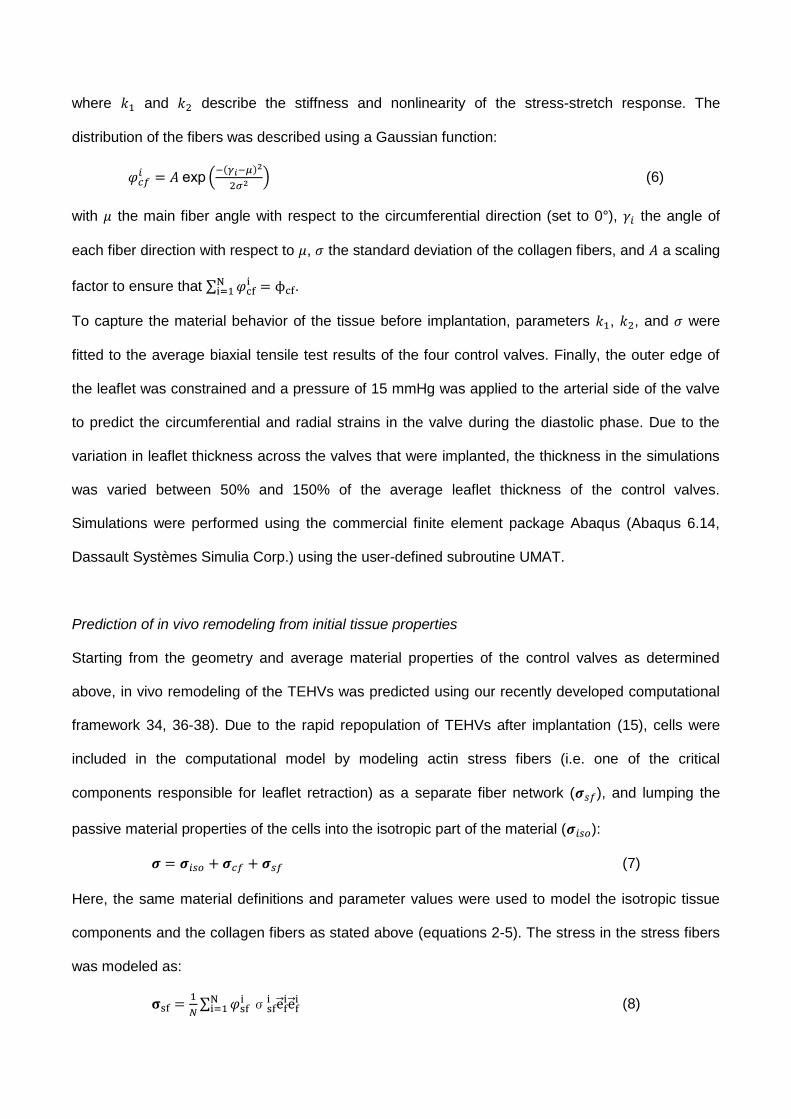
where 𝑘1 and 𝑘2 describe the stiffness and nonlinearity of the stress-stretch response. The
distribution of the fibers was described using a Gaussian function:
𝜑𝑐𝑓𝑖 = 𝐴 exp (
−(𝛾𝑖−𝜇)2
2𝜎2 ) (6)
with 𝜇 the main fiber angle with respect to the circumferential direction (set to 0°), 𝛾𝑖 the angle of
each fiber direction with respect to 𝜇, 𝜎 the standard deviation of the collagen fibers, and 𝐴 a scaling
factor to ensure that ∑ 𝜑cfiN
i=1 = ϕcf.
To capture the material behavior of the tissue before implantation, parameters 𝑘1, 𝑘2, and 𝜎 were
fitted to the average biaxial tensile test results of the four control valves. Finally, the outer edge of
the leaflet was constrained and a pressure of 15 mmHg was applied to the arterial side of the valve
to predict the circumferential and radial strains in the valve during the diastolic phase. Due to the
variation in leaflet thickness across the valves that were implanted, the thickness in the simulations
was varied between 50% and 150% of the average leaflet thickness of the control valves.
Simulations were performed using the commercial finite element package Abaqus (Abaqus 6.14,
Dassault Systèmes Simulia Corp.) using the user-defined subroutine UMAT.
Prediction of in vivo remodeling from initial tissue properties
Starting from the geometry and average material properties of the control valves as determined
above, in vivo remodeling of the TEHVs was predicted using our recently developed computational
framework 34, 36-38). Due to the rapid repopulation of TEHVs after implantation (15), cells were
included in the computational model by modeling actin stress fibers (i.e. one of the critical
components responsible for leaflet retraction) as a separate fiber network (𝝈𝑠𝑓), and lumping the
passive material properties of the cells into the isotropic part of the material (𝝈𝑖𝑠𝑜):
𝝈 = 𝝈𝑖𝑠𝑜 + 𝝈𝑐𝑓 + 𝝈𝑠𝑓 (7)
Here, the same material definitions and parameter values were used to model the isotropic tissue
components and the collagen fibers as stated above (equations 2-5). The stress in the stress fibers
was modeled as:
𝛔sf =1
𝑁∑ 𝜑sf
iNi=1 σsf
i e⃗ fie⃗ f
i (8)
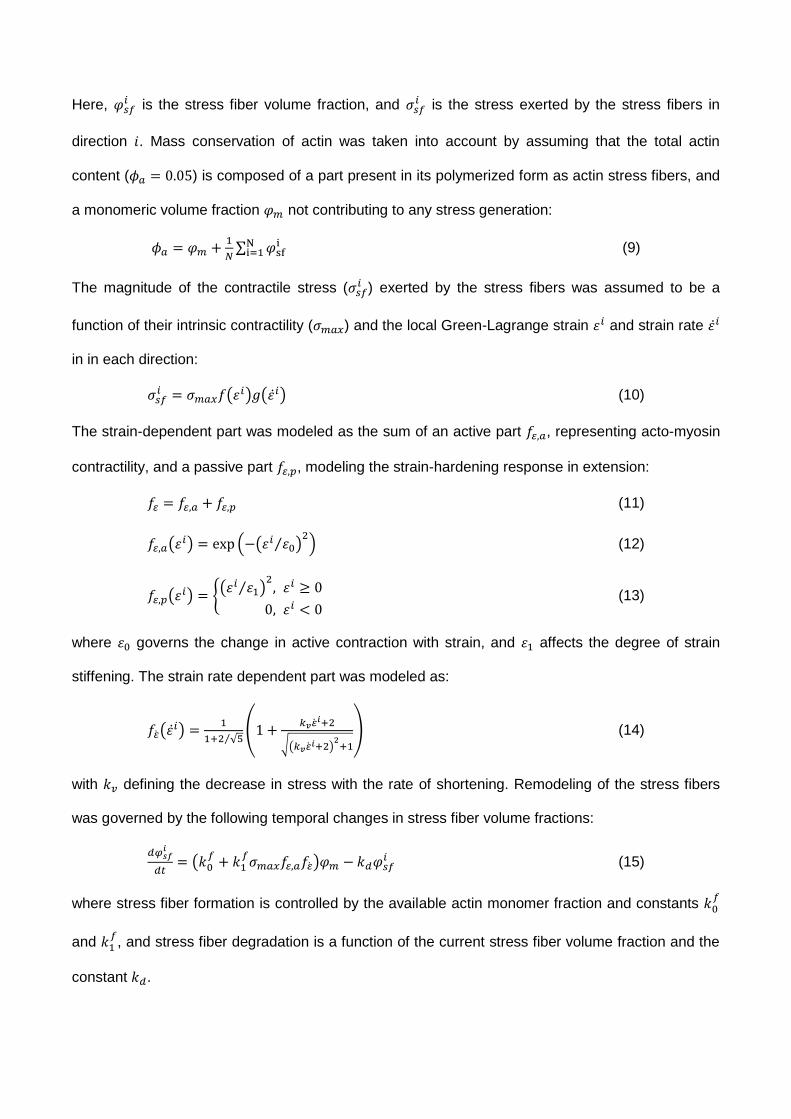
Here, 𝜑𝑠𝑓𝑖 is the stress fiber volume fraction, and 𝜎𝑠𝑓
𝑖 is the stress exerted by the stress fibers in
direction 𝑖. Mass conservation of actin was taken into account by assuming that the total actin
content (𝜙𝑎 = 0.05) is composed of a part present in its polymerized form as actin stress fibers, and
a monomeric volume fraction 𝜑𝑚 not contributing to any stress generation:
𝜙𝑎 = 𝜑𝑚 +1
𝑁∑ 𝜑sf
iNi=1 (9)
The magnitude of the contractile stress (𝜎𝑠𝑓𝑖 ) exerted by the stress fibers was assumed to be a
function of their intrinsic contractility (𝜎𝑚𝑎𝑥) and the local Green-Lagrange strain 𝜀𝑖 and strain rate 𝜀̇𝑖
in in each direction:
𝜎𝑠𝑓𝑖 = 𝜎𝑚𝑎𝑥𝑓(𝜀𝑖)𝑔(𝜀̇𝑖) (10)
The strain-dependent part was modeled as the sum of an active part 𝑓𝜀,𝑎, representing acto-myosin
contractility, and a passive part 𝑓𝜀,𝑝, modeling the strain-hardening response in extension:
𝑓𝜀 = 𝑓𝜀,𝑎 + 𝑓𝜀,𝑝 (11)
𝑓𝜀,𝑎(𝜀𝑖) = exp (−(𝜀𝑖 𝜀0⁄ )
2) (12)
𝑓𝜀,𝑝(𝜀𝑖) = {
(𝜀𝑖 𝜀1⁄ )2, 𝜀𝑖 ≥ 0
0, 𝜀𝑖 < 0 (13)
where 𝜀0 governs the change in active contraction with strain, and 𝜀1 affects the degree of strain
stiffening. The strain rate dependent part was modeled as:
𝑓�̇�(𝜀̇𝑖) =
1
1+2 √5⁄(1 +
𝑘𝑣�̇�𝑖+2
√(𝑘𝑣�̇�𝑖+2)
2+1
) (14)
with 𝑘𝑣 defining the decrease in stress with the rate of shortening. Remodeling of the stress fibers
was governed by the following temporal changes in stress fiber volume fractions:
𝑑𝜑𝑠𝑓𝑖
𝑑𝑡= (𝑘0
𝑓+ 𝑘1
𝑓𝜎𝑚𝑎𝑥𝑓𝜀,𝑎𝑓�̇�)𝜑𝑚 − 𝑘𝑑𝜑𝑠𝑓
𝑖 (15)
where stress fiber formation is controlled by the available actin monomer fraction and constants 𝑘0𝑓
and 𝑘1𝑓, and stress fiber degradation is a function of the current stress fiber volume fraction and the
constant 𝑘𝑑.
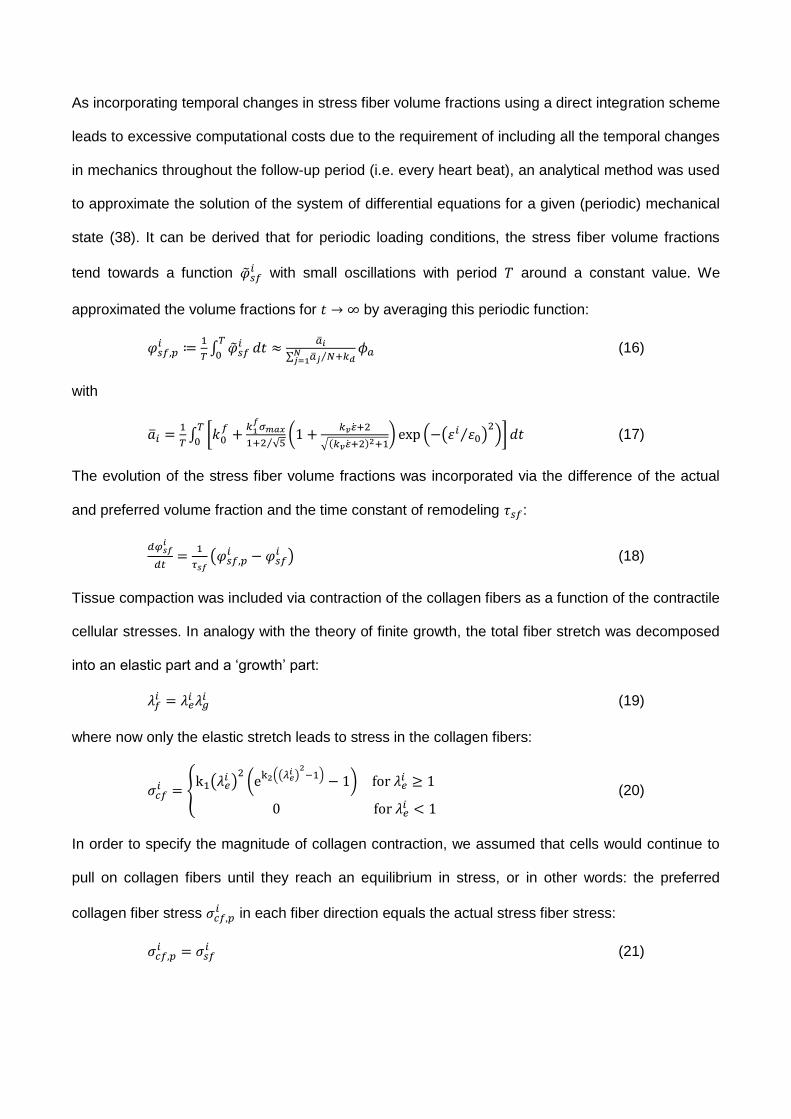
As incorporating temporal changes in stress fiber volume fractions using a direct integration scheme
leads to excessive computational costs due to the requirement of including all the temporal changes
in mechanics throughout the follow-up period (i.e. every heart beat), an analytical method was used
to approximate the solution of the system of differential equations for a given (periodic) mechanical
state (38). It can be derived that for periodic loading conditions, the stress fiber volume fractions
tend towards a function �̃�𝑠𝑓𝑖 with small oscillations with period 𝑇 around a constant value. We
approximated the volume fractions for 𝑡 → ∞ by averaging this periodic function:
𝜑𝑠𝑓,𝑝𝑖 ≔
1
𝑇∫ �̃�𝑠𝑓
𝑖𝑇
0𝑑𝑡 ≈
�̅�𝑖
∑ �̅�𝑗 𝑁⁄ +𝑘𝑑𝑁𝑗=1
𝜙𝑎 (16)
with
�̅�𝑖 =1
𝑇∫ [𝑘0
𝑓+
𝑘1𝑓𝜎𝑚𝑎𝑥
1+2 √5⁄(1 +
𝑘𝑣�̇�+2
√(𝑘𝑣�̇�+2)2+1) exp (−(𝜀𝑖 𝜀0⁄ )
2)]
𝑇
0𝑑𝑡 (17)
The evolution of the stress fiber volume fractions was incorporated via the difference of the actual
and preferred volume fraction and the time constant of remodeling 𝜏𝑠𝑓:
𝑑𝜑𝑠𝑓𝑖
𝑑𝑡=
1
𝜏𝑠𝑓(𝜑𝑠𝑓,𝑝
𝑖 − 𝜑𝑠𝑓𝑖 ) (18)
Tissue compaction was included via contraction of the collagen fibers as a function of the contractile
cellular stresses. In analogy with the theory of finite growth, the total fiber stretch was decomposed
into an elastic part and a ‘growth’ part:
𝜆𝑓𝑖 = 𝜆𝑒
𝑖 𝜆𝑔𝑖 (19)
where now only the elastic stretch leads to stress in the collagen fibers:
𝜎𝑐𝑓𝑖 = {
k1(𝜆𝑒𝑖 )
2(e
k2((𝜆𝑒𝑖 )
2−1)
− 1) for 𝜆𝑒𝑖 ≥ 1
0 for 𝜆𝑒𝑖 < 1
(20)
In order to specify the magnitude of collagen contraction, we assumed that cells would continue to
pull on collagen fibers until they reach an equilibrium in stress, or in other words: the preferred
collagen fiber stress 𝜎𝑐𝑓,𝑝𝑖 in each fiber direction equals the actual stress fiber stress:
𝜎𝑐𝑓,𝑝𝑖 = 𝜎𝑠𝑓
𝑖 (21)
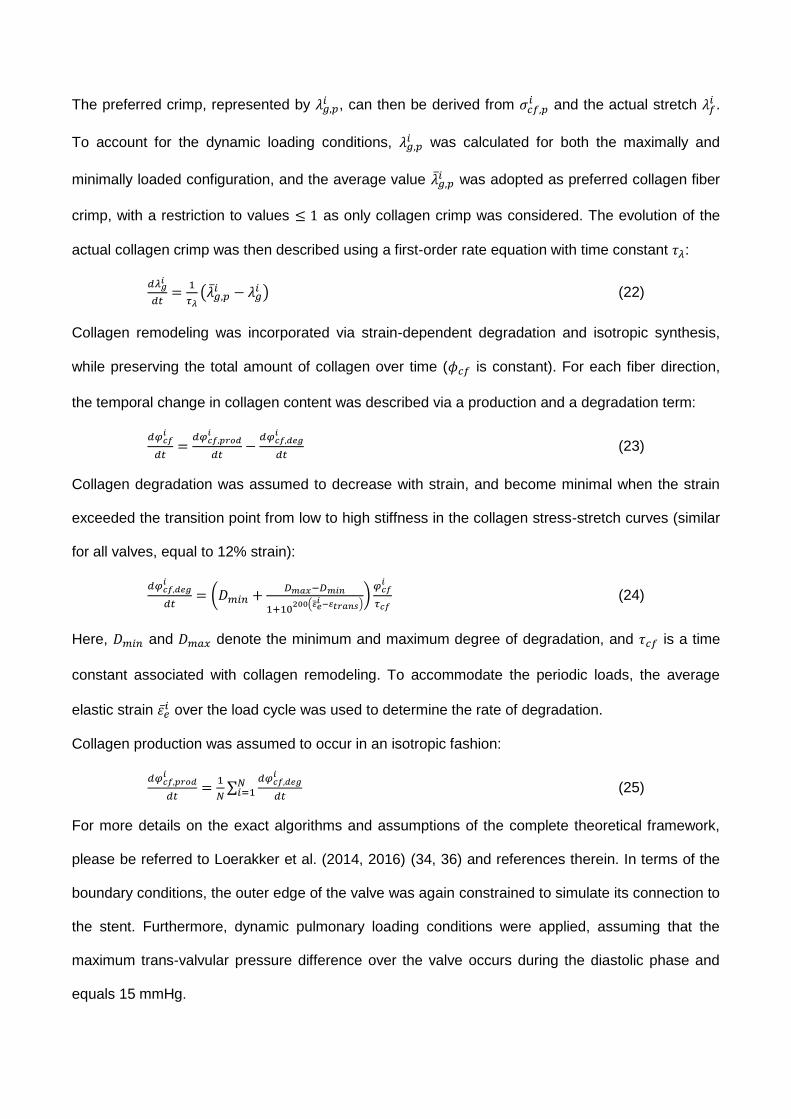
The preferred crimp, represented by 𝜆𝑔,𝑝𝑖 , can then be derived from 𝜎𝑐𝑓,𝑝
𝑖 and the actual stretch 𝜆𝑓𝑖 .
To account for the dynamic loading conditions, 𝜆𝑔,𝑝𝑖 was calculated for both the maximally and
minimally loaded configuration, and the average value �̅�𝑔,𝑝𝑖 was adopted as preferred collagen fiber
crimp, with a restriction to values ≤ 1 as only collagen crimp was considered. The evolution of the
actual collagen crimp was then described using a first-order rate equation with time constant 𝜏𝜆:
𝑑𝜆𝑔𝑖
𝑑𝑡=
1
𝜏𝜆(�̅�𝑔,𝑝
𝑖 − 𝜆𝑔𝑖 ) (22)
Collagen remodeling was incorporated via strain-dependent degradation and isotropic synthesis,
while preserving the total amount of collagen over time (𝜙𝑐𝑓 is constant). For each fiber direction,
the temporal change in collagen content was described via a production and a degradation term:
𝑑𝜑𝑐𝑓𝑖
𝑑𝑡=
𝑑𝜑𝑐𝑓,𝑝𝑟𝑜𝑑𝑖
𝑑𝑡−
𝑑𝜑𝑐𝑓,𝑑𝑒𝑔𝑖
𝑑𝑡 (23)
Collagen degradation was assumed to decrease with strain, and become minimal when the strain
exceeded the transition point from low to high stiffness in the collagen stress-stretch curves (similar
for all valves, equal to 12% strain):
𝑑𝜑𝑐𝑓,𝑑𝑒𝑔𝑖
𝑑𝑡= (𝐷𝑚𝑖𝑛 +
𝐷𝑚𝑎𝑥−𝐷𝑚𝑖𝑛
1+10200(�̅�𝑒
𝑖 −𝜀𝑡𝑟𝑎𝑛𝑠))
𝜑𝑐𝑓𝑖
𝜏𝑐𝑓 (24)
Here, 𝐷𝑚𝑖𝑛 and 𝐷𝑚𝑎𝑥 denote the minimum and maximum degree of degradation, and 𝜏𝑐𝑓 is a time
constant associated with collagen remodeling. To accommodate the periodic loads, the average
elastic strain 𝜀�̅�𝑖 over the load cycle was used to determine the rate of degradation.
Collagen production was assumed to occur in an isotropic fashion:
𝑑𝜑𝑐𝑓,𝑝𝑟𝑜𝑑𝑖
𝑑𝑡=
1
𝑁∑
𝑑𝜑𝑐𝑓,𝑑𝑒𝑔𝑖
𝑑𝑡𝑁𝑖=1 (25)
For more details on the exact algorithms and assumptions of the complete theoretical framework,
please be referred to Loerakker et al. (2014, 2016) (34, 36) and references therein. In terms of the
boundary conditions, the outer edge of the valve was again constrained to simulate its connection to
the stent. Furthermore, dynamic pulmonary loading conditions were applied, assuming that the
maximum trans-valvular pressure difference over the valve occurs during the diastolic phase and
equals 15 mmHg.
To obtain a mechanistic understanding of the in vivo remodeling process, different simulations were
performed with leaflet thickness varying between 50% and 150% of the average thickness of the
control valves. In addition, for each thickness the contractility 𝜎𝑚𝑎𝑥 of the cells was varied between
the original value (34), mostly resembling a myofibroblast phenotype, and 20% of the original value,
resembling a fibroblast phenotype with low levels of SMA expression.
Predicting differences in outcome between explants
To understand differences in outcome between the different explants, animal-specific simulations
were performed using the methods described above. In this case, however, stiffness parameters (𝑘1
and 𝑘2) were fitted to biaxial tensile tests of the explants to provide animal-specific material
behavior. In addition, measured differences in leaflet thickness were incorporated, although no
differences in initial valve geometry were assumed, as this was imposed via the geometrical
constraints before implantation.

Supplementary Figures
Fig. S1. Schematic overview of study concept. (A) computational modeling was used to propose a valve design that can guide functional remodeling based on the initial mechanical behavior of the valve. (B) Next, tissue engineered heart valves (TEHVs) were manufactured under standardized conditions using inserts as constraints to control the valve geometry. (C) Thereafter, using a translational sheep model, TEHVs were implanted as pulmonary valve replacements in a minimally-invasive, transcatheter fashion. Serial in vivo follow-up with state-of-the-art imaging (ICE, cardiac MRI and angiographic hemodynamic assessments) was performed over the course of one year to assess the in vivo functionality and remodeling of the implanted TEHVs. (D) In a final step, all valves underwent comprehensive postmortem assessment to compare the in vivo remodeling data one year after implantation to the computational predictions of tissue remodeling and corresponding valve functionality.

Fig. S2. Gross and histological characterization of a control TEHV. (A) Side and distal view of the TEHV after culture, with the insert in position. (B) Distal and proximal view after insert removal and decellularization. (C) Tile scan of the Haematoxylin & Eosin (H&E) staining of the longitudinal transection of a leaflet. 20x magnification images of the wall, leaflet and hinge areas of the valve stained for (D) H&E and (E) Elastica Van Gieson (ELVG). (F) SEM image of the surface of the valve and corresponding magnifications of the insets.
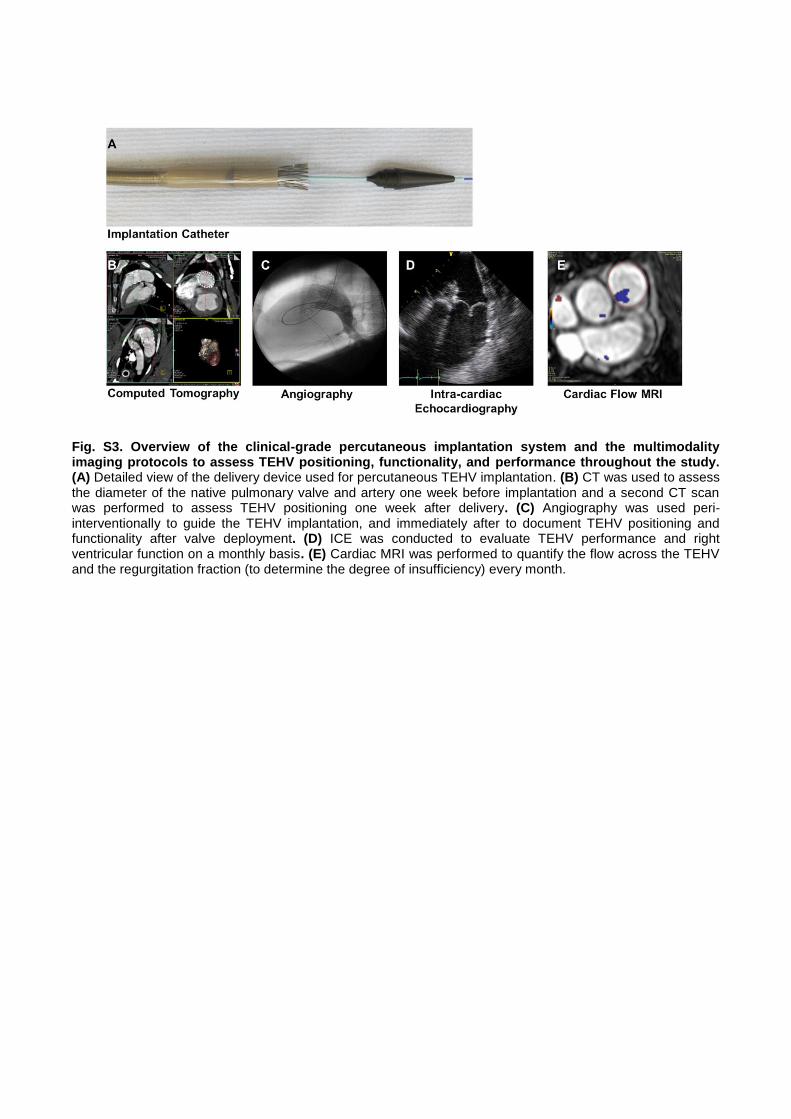
Fig. S3. Overview of the clinical-grade percutaneous implantation system and the multimodality imaging protocols to assess TEHV positioning, functionality, and performance throughout the study. (A) Detailed view of the delivery device used for percutaneous TEHV implantation. (B) CT was used to assess the diameter of the native pulmonary valve and artery one week before implantation and a second CT scan was performed to assess TEHV positioning one week after delivery. (C) Angiography was used peri-interventionally to guide the TEHV implantation, and immediately after to document TEHV positioning and functionality after valve deployment. (D) ICE was conducted to evaluate TEHV performance and right ventricular function on a monthly basis. (E) Cardiac MRI was performed to quantify the flow across the TEHV and the regurgitation fraction (to determine the degree of insufficiency) every month.

Fig. S4. Computational predictions of valve remodeling and postmortem analysis of valve G, which was malpositioned upon implantation. The same computational framework (see Fig. 5) was used except no hemodynamic loading conditions were applied to account for the disturbed loading conditions. (A) Predicted circumferential and (B) radial strains after remodeling. (C) A top view of the remodeled valve with its considerable central opening. (D) The collagen architecture was predicted to remodel towards an isotropic network, as also quantified experimentally for Valve G. (E) Gross images of the distal and proximal side of the valve and (F) of the cut open valve. (G) H&E staining of the longitudinal transection of a leaflet. (H) Histological overview for the wall, leaflet and hinge area of the valve stained with H&E, ELVG, αSMA and Vimentin. The presence of a large-scale calcified spot is marked by * and confirmed by (I) Von Kossa staining of the leaflet tip. (J) SEM images of the leaflet surface of the valve at different magnification.
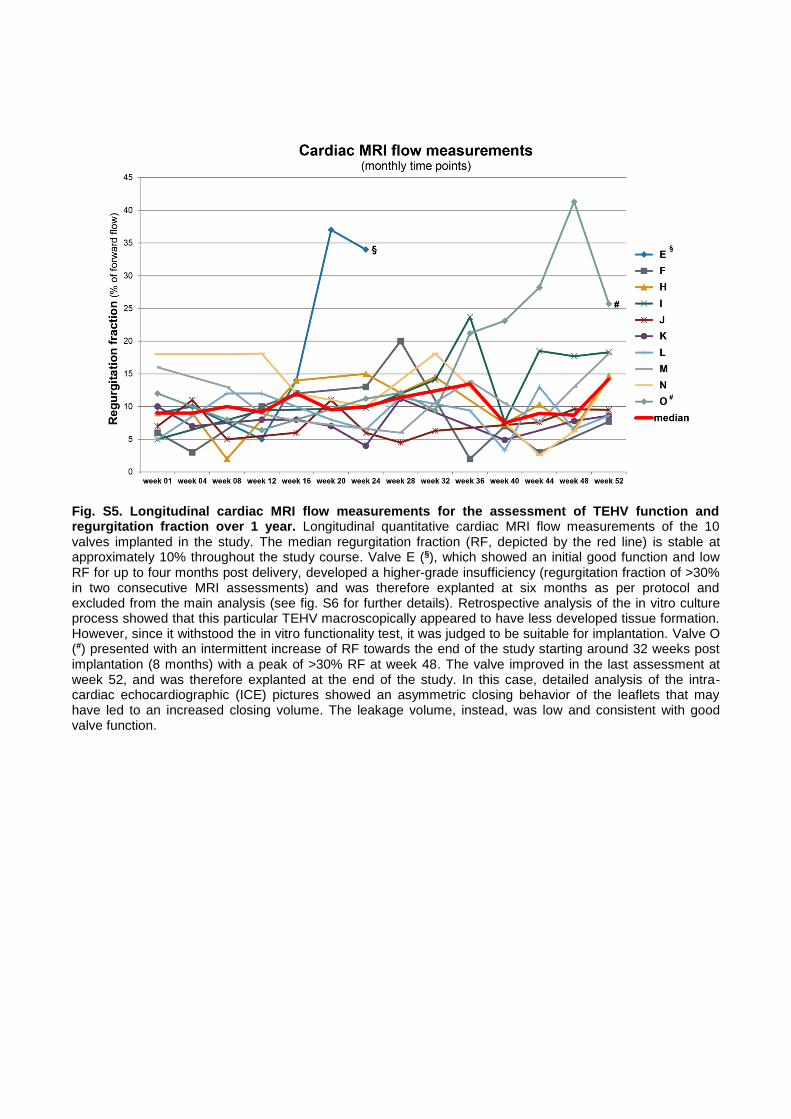
Fig. S5. Longitudinal cardiac MRI flow measurements for the assessment of TEHV function and regurgitation fraction over 1 year. Longitudinal quantitative cardiac MRI flow measurements of the 10 valves implanted in the study. The median regurgitation fraction (RF, depicted by the red line) is stable at approximately 10% throughout the study course. Valve E (§), which showed an initial good function and low RF for up to four months post delivery, developed a higher-grade insufficiency (regurgitation fraction of >30% in two consecutive MRI assessments) and was therefore explanted at six months as per protocol and excluded from the main analysis (see fig. S6 for further details). Retrospective analysis of the in vitro culture process showed that this particular TEHV macroscopically appeared to have less developed tissue formation. However, since it withstood the in vitro functionality test, it was judged to be suitable for implantation. Valve O (#) presented with an intermittent increase of RF towards the end of the study starting around 32 weeks post implantation (8 months) with a peak of >30% RF at week 48. The valve improved in the last assessment at week 52, and was therefore explanted at the end of the study. In this case, detailed analysis of the intra-cardiac echocardiographic (ICE) pictures showed an asymmetric closing behavior of the leaflets that may have led to an increased closing volume. The leakage volume, instead, was low and consistent with good valve function.
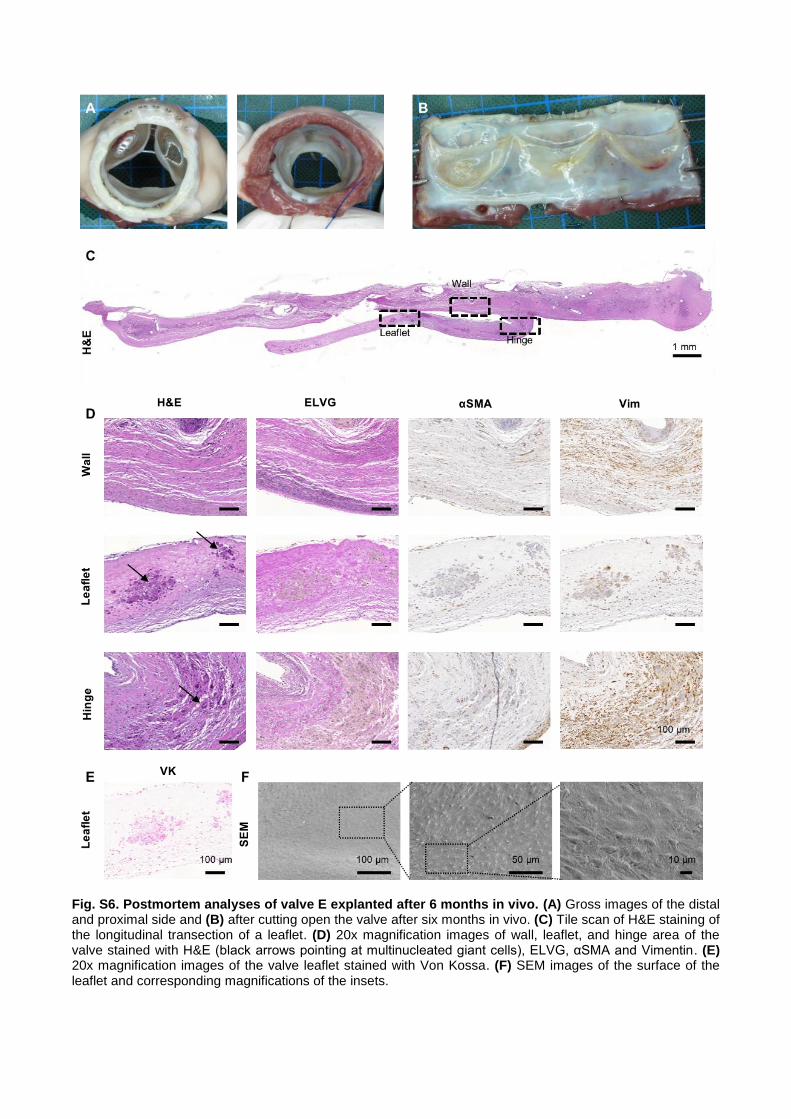
Fig. S6. Postmortem analyses of valve E explanted after 6 months in vivo. (A) Gross images of the distal and proximal side and (B) after cutting open the valve after six months in vivo. (C) Tile scan of H&E staining of the longitudinal transection of a leaflet. (D) 20x magnification images of wall, leaflet, and hinge area of the valve stained with H&E (black arrows pointing at multinucleated giant cells), ELVG, αSMA and Vimentin. (E) 20x magnification images of the valve leaflet stained with Von Kossa. (F) SEM images of the surface of the leaflet and corresponding magnifications of the insets.
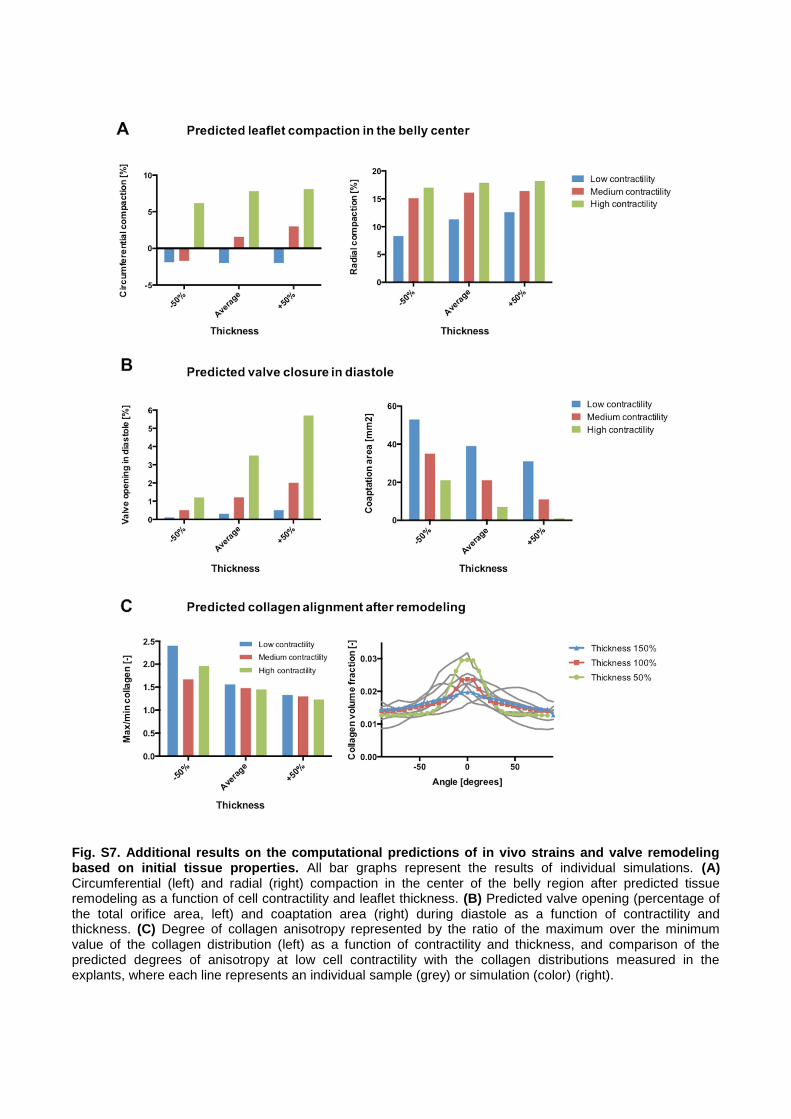
Fig. S7. Additional results on the computational predictions of in vivo strains and valve remodeling based on initial tissue properties. All bar graphs represent the results of individual simulations. (A) Circumferential (left) and radial (right) compaction in the center of the belly region after predicted tissue remodeling as a function of cell contractility and leaflet thickness. (B) Predicted valve opening (percentage of the total orifice area, left) and coaptation area (right) during diastole as a function of contractility and thickness. (C) Degree of collagen anisotropy represented by the ratio of the maximum over the minimum value of the collagen distribution (left) as a function of contractility and thickness, and comparison of the predicted degrees of anisotropy at low cell contractility with the collagen distributions measured in the explants, where each line represents an individual sample (grey) or simulation (color) (right).
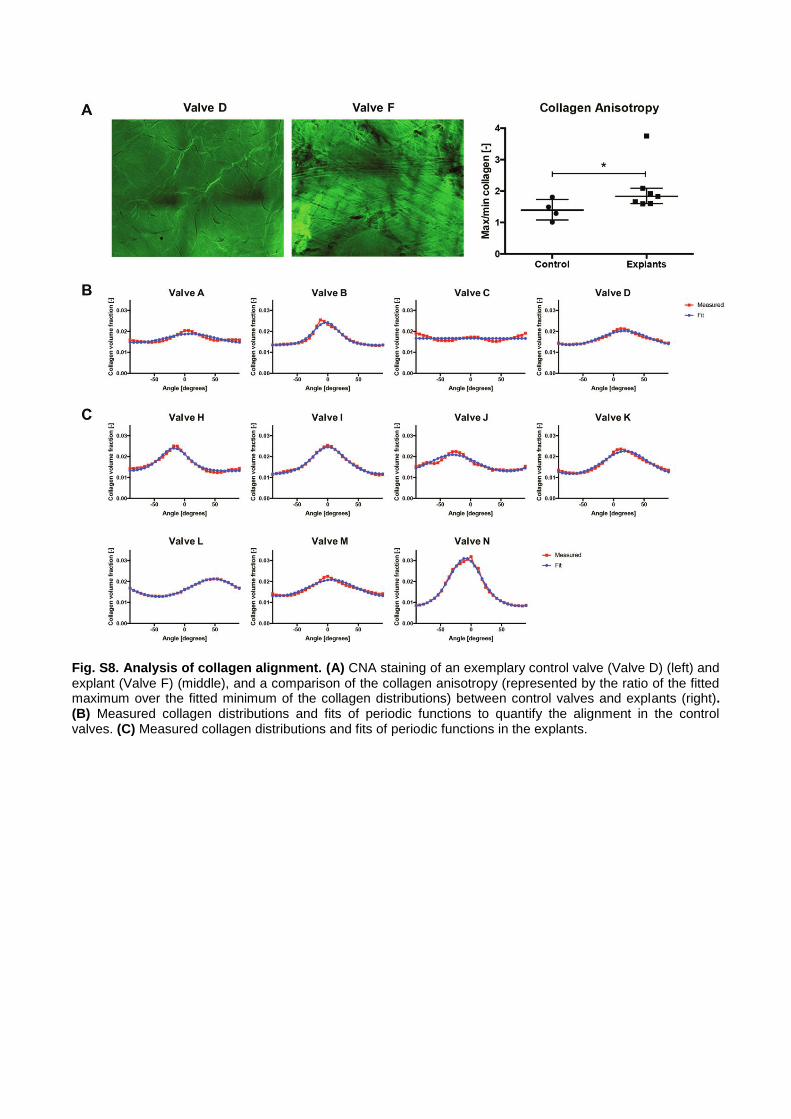
Fig. S8. Analysis of collagen alignment. (A) CNA staining of an exemplary control valve (Valve D) (left) and explant (Valve F) (middle), and a comparison of the collagen anisotropy (represented by the ratio of the fitted maximum over the fitted minimum of the collagen distributions) between control valves and explants (right). (B) Measured collagen distributions and fits of periodic functions to quantify the alignment in the control valves. (C) Measured collagen distributions and fits of periodic functions in the explants.

Fig. S9. Histological evaluation of cellular infiltration in a representative valve (valve N) using Masson Goldner staining. (A) The lower wall and (B) hinge regions of the valve show abundant cell repopulation. (B) The hinge and (C) middle part of the leaflet have more cells on the ventricular side (indicated by “ventricularis”). (D) On the leaflet tip, instead, cells are mainly distributed in the tissue surrounding polymeric remnants (marked with “p”).
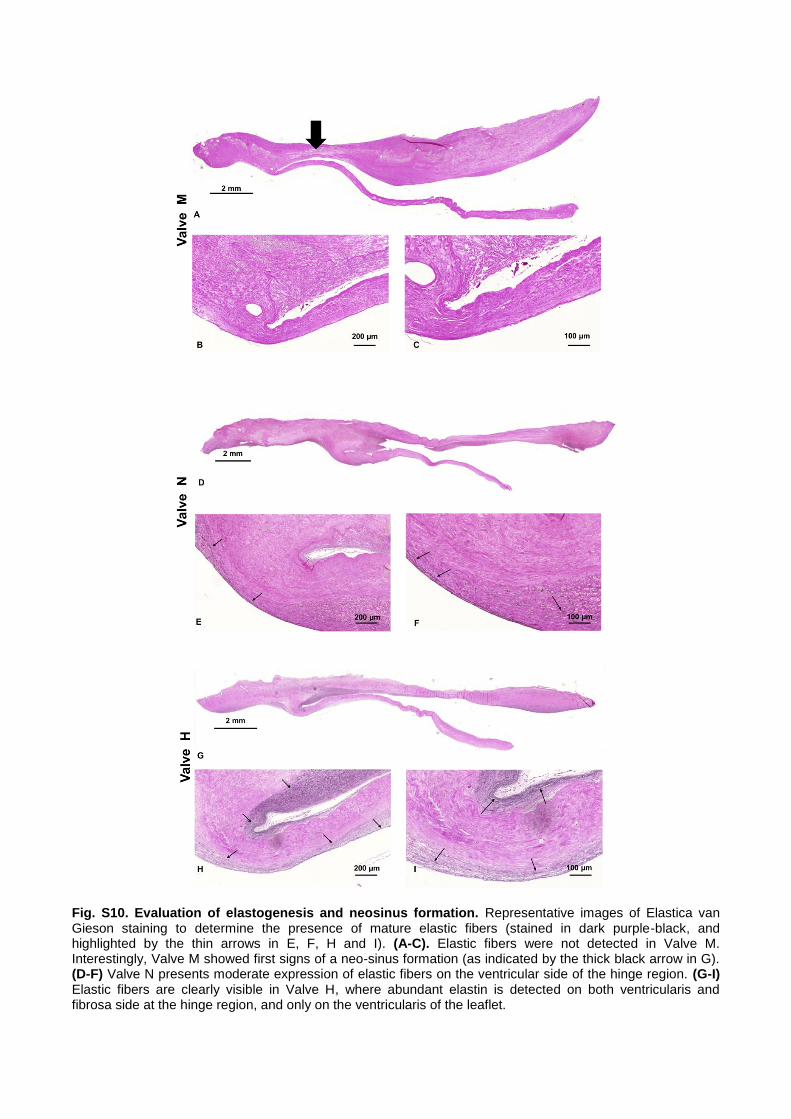
Fig. S10. Evaluation of elastogenesis and neosinus formation. Representative images of Elastica van Gieson staining to determine the presence of mature elastic fibers (stained in dark purple-black, and highlighted by the thin arrows in E, F, H and I). (A-C). Elastic fibers were not detected in Valve M. Interestingly, Valve M showed first signs of a neo-sinus formation (as indicated by the thick black arrow in G). (D-F) Valve N presents moderate expression of elastic fibers on the ventricular side of the hinge region. (G-I) Elastic fibers are clearly visible in Valve H, where abundant elastin is detected on both ventricularis and fibrosa side at the hinge region, and only on the ventricularis of the leaflet.
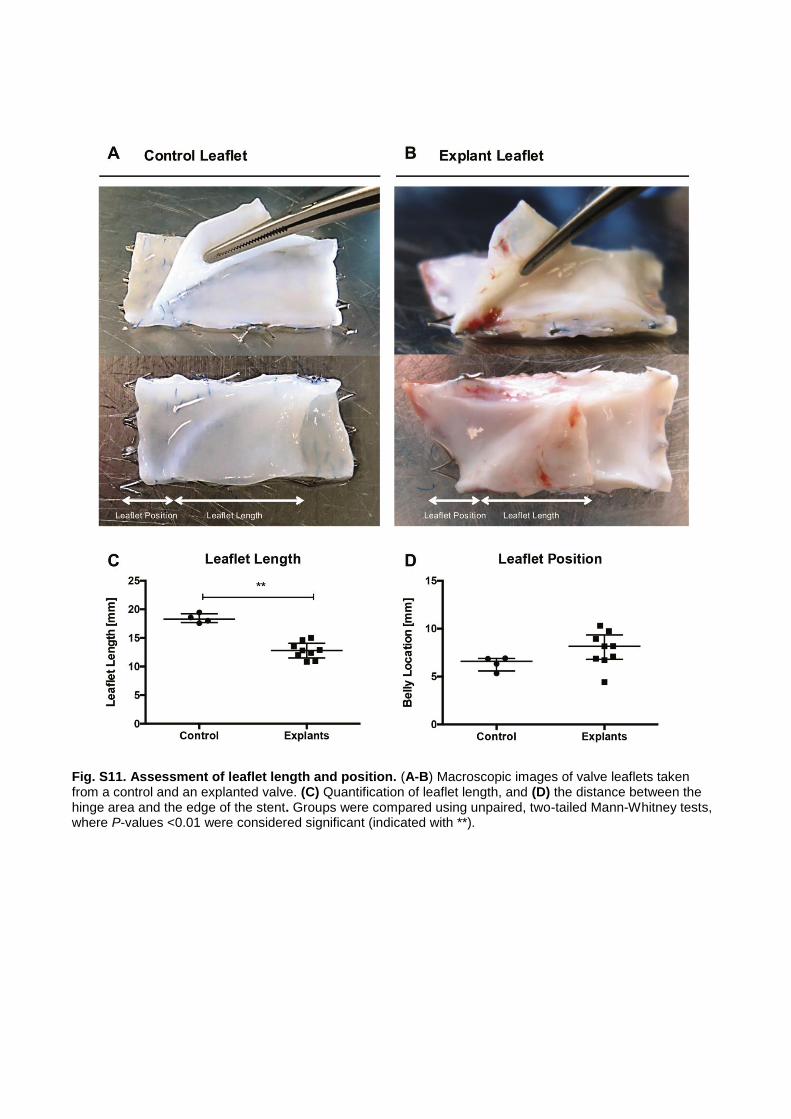
Fig. S11. Assessment of leaflet length and position. (A-B) Macroscopic images of valve leaflets taken from a control and an explanted valve. (C) Quantification of leaflet length, and (D) the distance between the hinge area and the edge of the stent. Groups were compared using unpaired, two-tailed Mann-Whitney tests, where P-values <0.01 were considered significant (indicated with **).
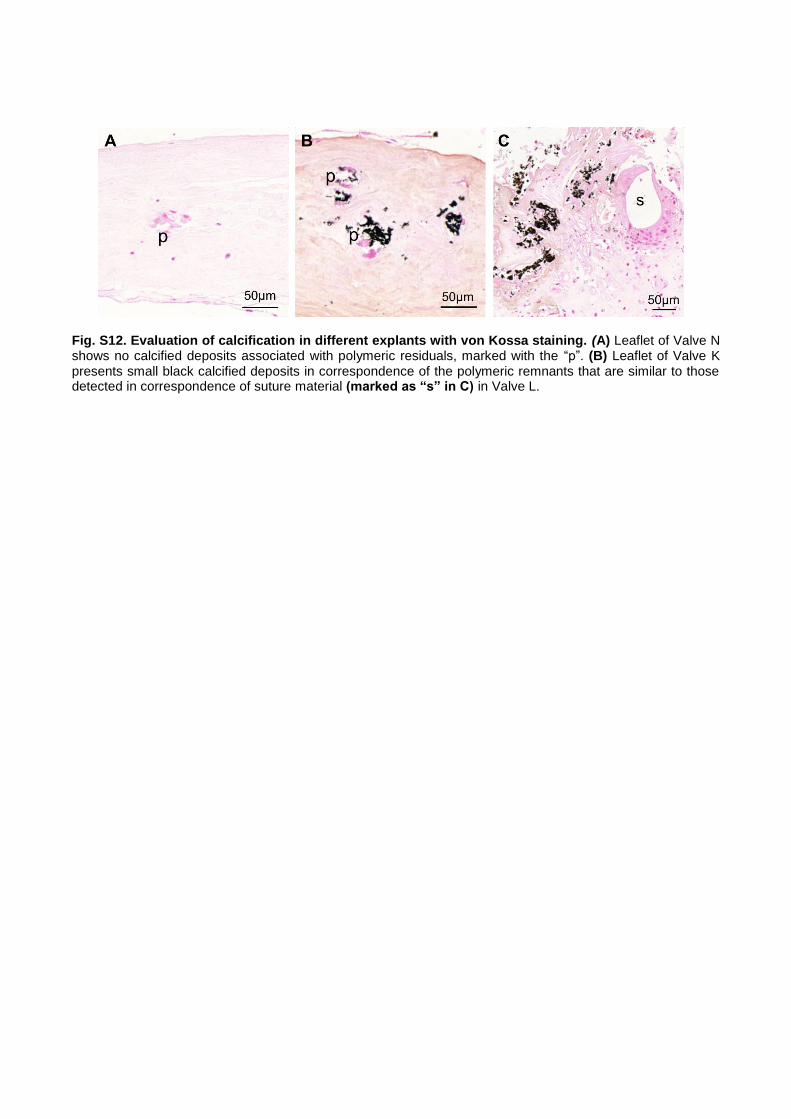
Fig. S12. Evaluation of calcification in different explants with von Kossa staining. (A) Leaflet of Valve N shows no calcified deposits associated with polymeric residuals, marked with the “p”. (B) Leaflet of Valve K presents small black calcified deposits in correspondence of the polymeric remnants that are similar to those detected in correspondence of suture material (marked as “s” in C) in Valve L.
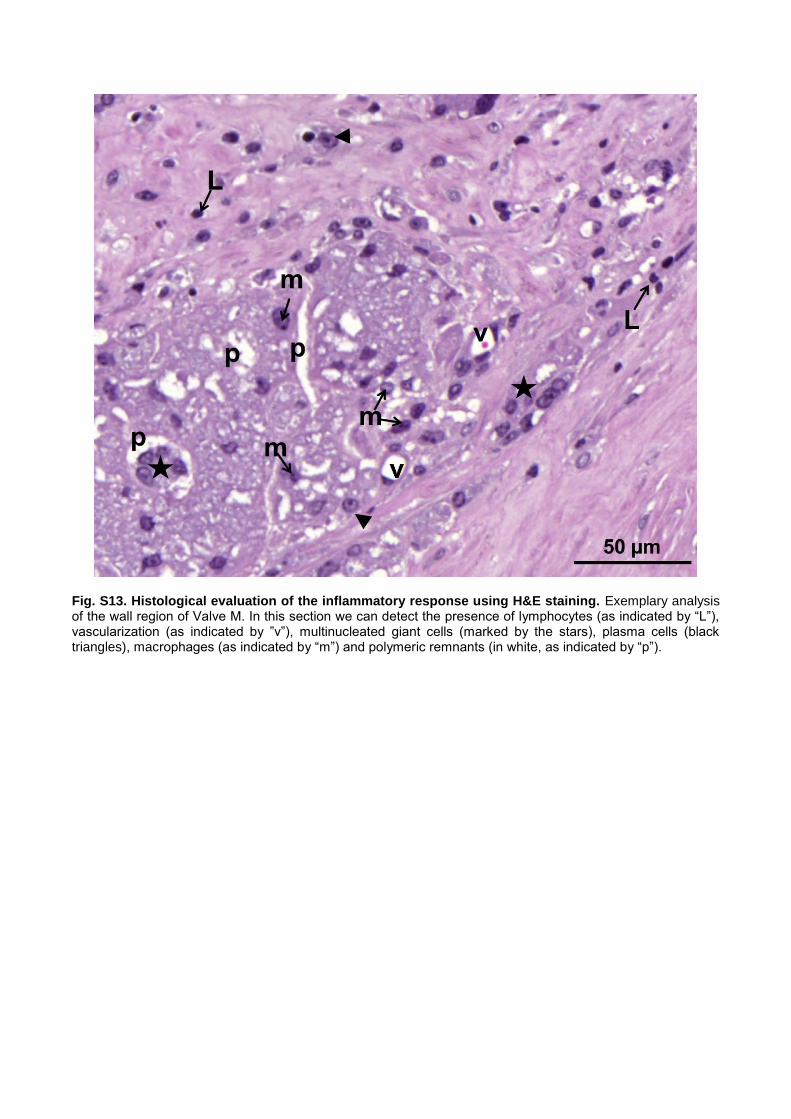
Fig. S13. Histological evaluation of the inflammatory response using H&E staining. Exemplary analysis of the wall region of Valve M. In this section we can detect the presence of lymphocytes (as indicated by “L”), vascularization (as indicated by ”v”), multinucleated giant cells (marked by the stars), plasma cells (black triangles), macrophages (as indicated by “m”) and polymeric remnants (in white, as indicated by “p”).
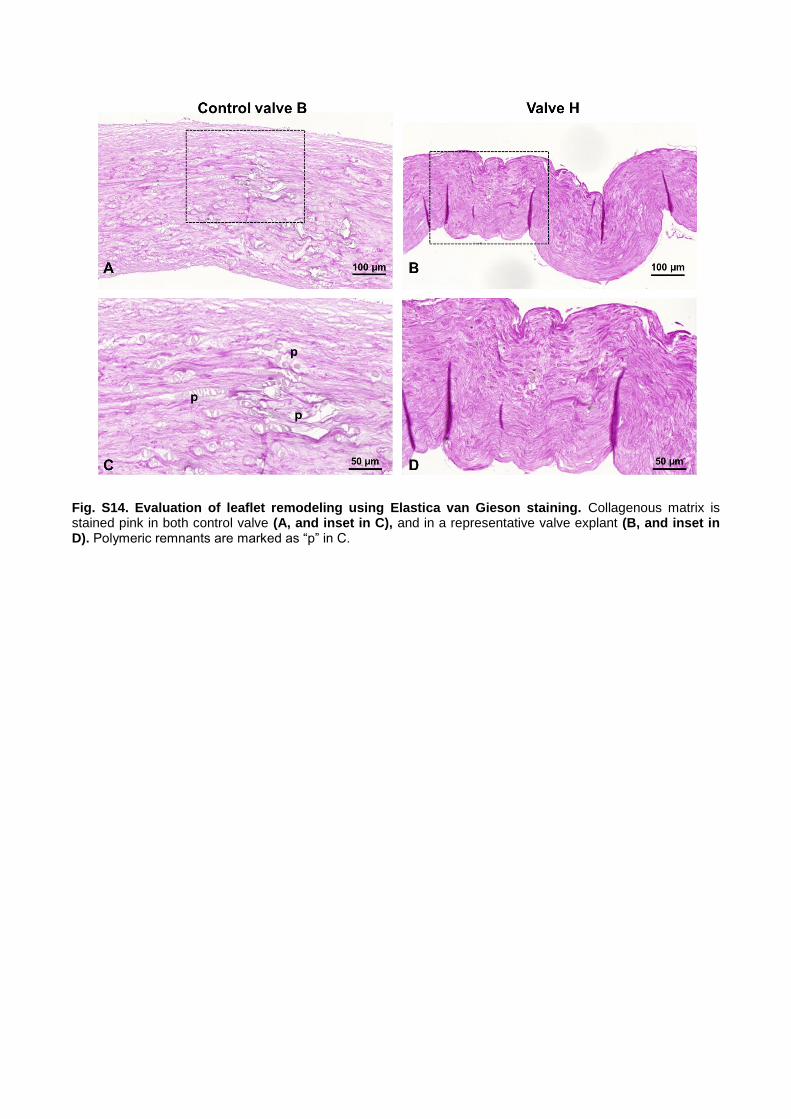
Fig. S14. Evaluation of leaflet remodeling using Elastica van Gieson staining. Collagenous matrix is stained pink in both control valve (A, and inset in C), and in a representative valve explant (B, and inset in D). Polymeric remnants are marked as “p” in C.

Fig. S15. Postmortem analyses of valve J explanted after 1 year in vivo. (A) Gross images of the distal
and proximal side and (B) after cutting open the valve. (C) Tile scan of H&E staining of the longitudinal
transection of a leaflet. (D) 20x magnification images of wall, leaflet, and hinge areas of the valve stained with
H&E, ELVG, αSMA and Vimentin. (E) 20x magnification images of the valve leaflet stained with Von Kossa.
(F) SEM images of the surface of the leaflet and corresponding magnifications of the insets.
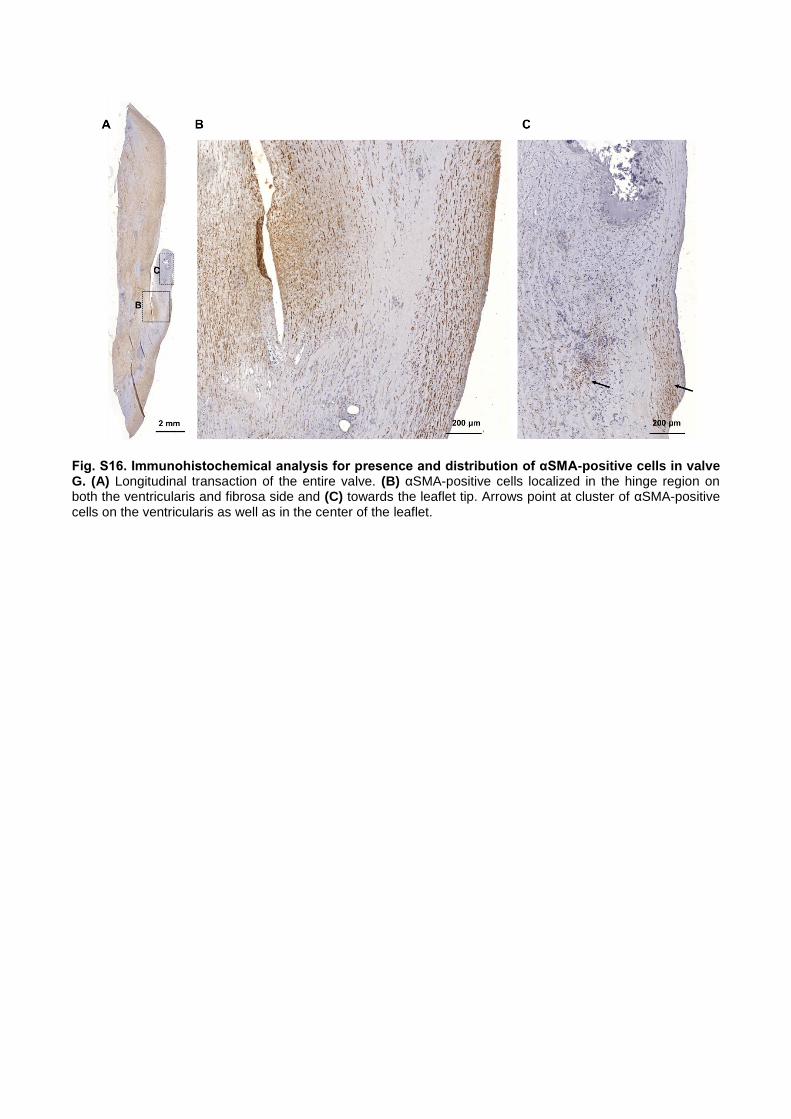
Fig. S16. Immunohistochemical analysis for presence and distribution of αSMA-positive cells in valve G. (A) Longitudinal transaction of the entire valve. (B) αSMA-positive cells localized in the hinge region on both the ventricularis and fibrosa side and (C) towards the leaflet tip. Arrows point at cluster of αSMA-positive cells on the ventricularis as well as in the center of the leaflet.

Fig. S17. Schematic representation depicting the functional remodeling process within the TEHV. A: Before implantation, the TEHV is acellular and characterized by a combination of ECM components (mainly collagen) and polymeric remnants of the initial PGA/P4HB scaffold. B: After implantation, immediate and comprehensive remodeling occurs: infiltrating cells originating from the adjacent vascular tissue as well as the circulating blood migrate into the TEHV and start producing new ECM components (collagen, elastin). At the same time, the scaffold remnants are slowly degraded and endothelial cells start to cover the wall and leaflet of TEHV. C: One year after implantation, additional collagen and elastin fibers have been deposited, cells have differentiated into the characteristic vascular components in the wall (smooth muscle cells) and complete endothelialization of the TEHV is evident. In addition, functional remodeling of the TEHV is visible, represented by the formation of a neo-sinus (indicated by black star, and shown in fig. S10 A) and the shortening of the leaflet to a more physiological coaptation area (see also Fig. 2).
Supplementary Tables
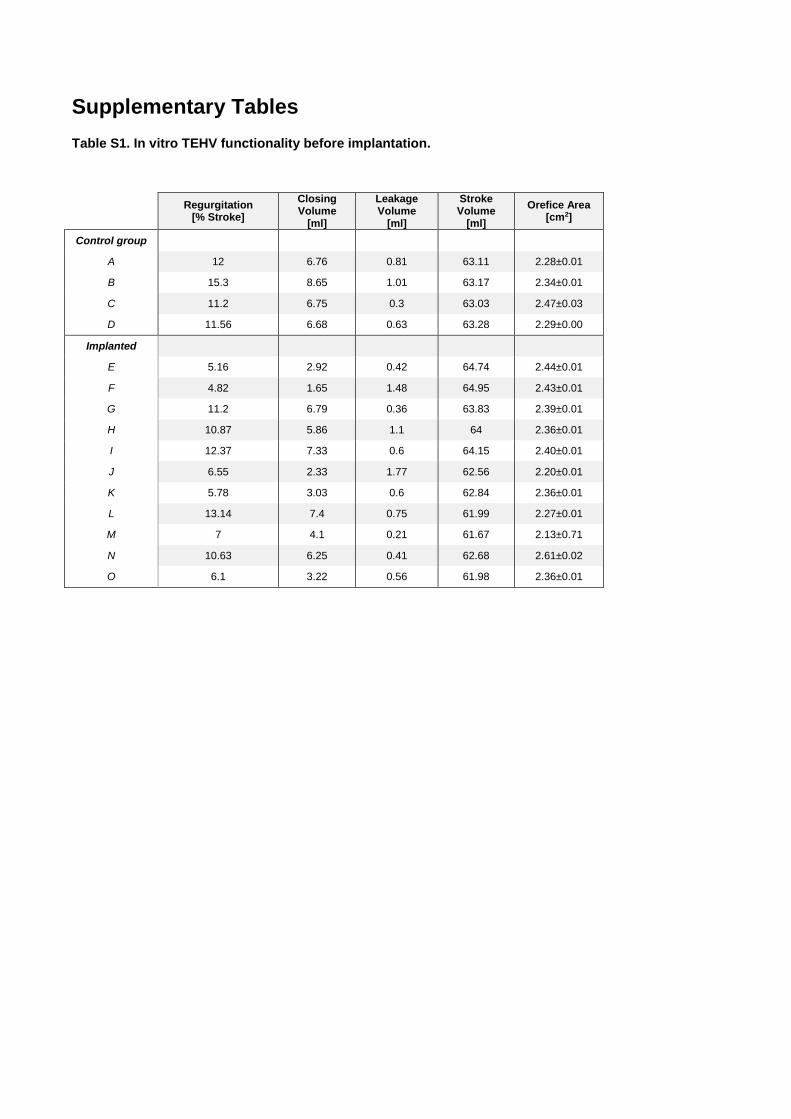
Table S1. In vitro TEHV functionality before implantation.
Regurgitation [% Stroke]
Closing Volume
[ml]
Leakage Volume
[ml]
Stroke Volume
[ml]
Orefice Area [cm2]
Control group
A 12 6.76 0.81 63.11 2.28±0.01
B 15.3 8.65 1.01 63.17 2.34±0.01
C 11.2 6.75 0.3 63.03 2.47±0.03
D 11.56 6.68 0.63 63.28 2.29±0.00
Implanted
E 5.16 2.92 0.42 64.74 2.44±0.01
F 4.82 1.65 1.48 64.95 2.43±0.01
G 11.2 6.79 0.36 63.83 2.39±0.01
H 10.87 5.86 1.1 64 2.36±0.01
I 12.37 7.33 0.6 64.15 2.40±0.01
J 6.55 2.33 1.77 62.56 2.20±0.01
K 5.78 3.03 0.6 62.84 2.36±0.01
L 13.14 7.4 0.75 61.99 2.27±0.01
M 7 4.1 0.21 61.67 2.13±0.71
N 10.63 6.25 0.41 62.68 2.61±0.02
O 6.1 3.22 0.56 61.98 2.36±0.01
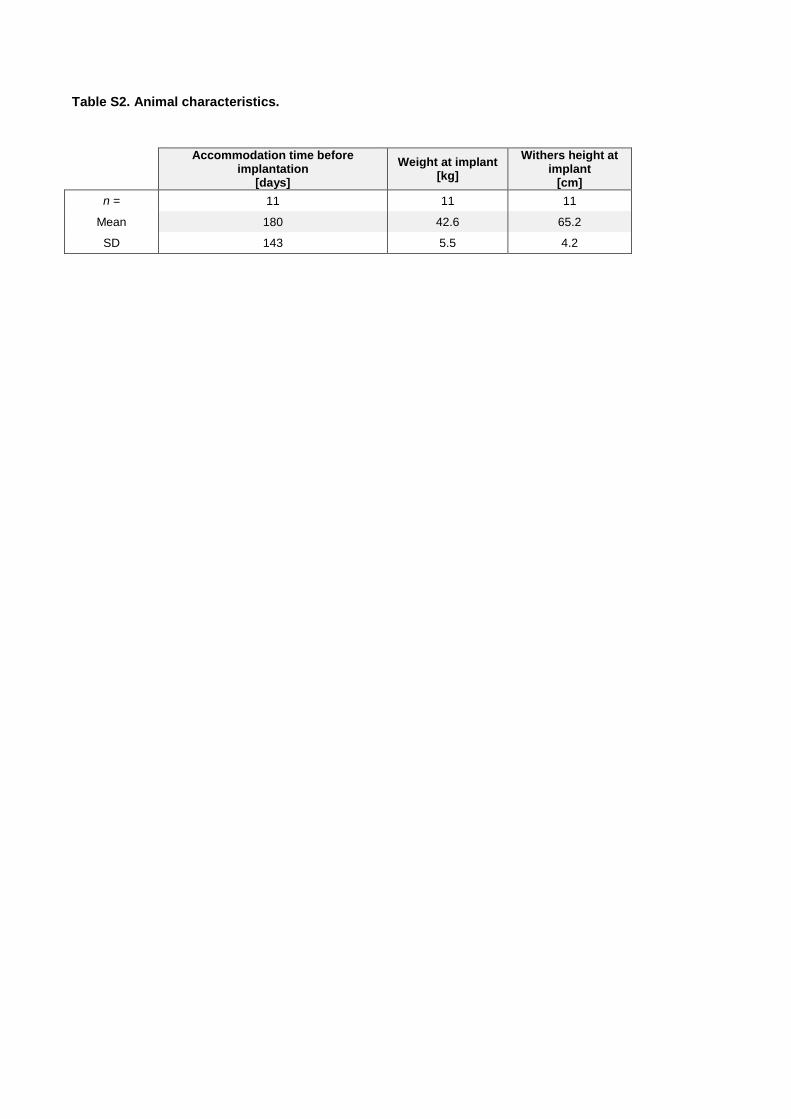
Table S2. Animal characteristics.
Accommodation time before implantation
[days]
Weight at implant [kg]
Withers height at implant
[cm]
n = 11 11 11
Mean 180 42.6 65.2
SD 143 5.5 4.2
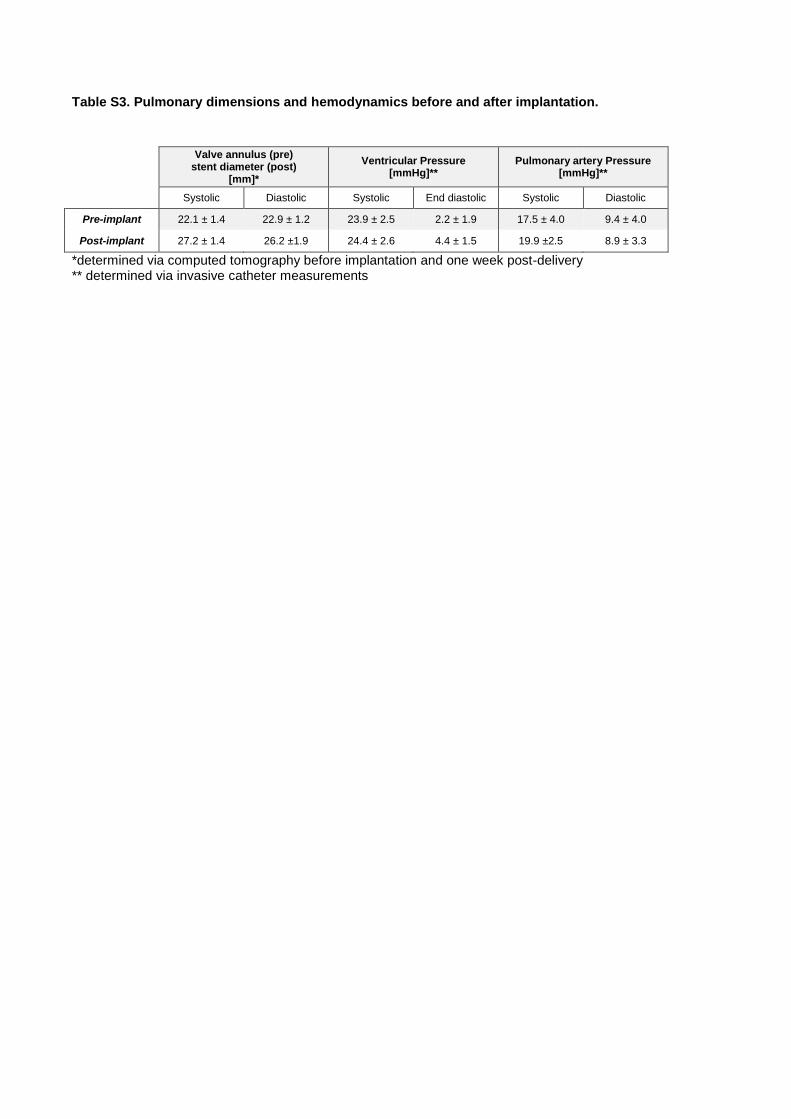
Table S3. Pulmonary dimensions and hemodynamics before and after implantation.
Valve annulus (pre) stent diameter (post)
[mm]*
Ventricular Pressure [mmHg]**
Pulmonary artery Pressure [mmHg]**
Systolic Diastolic Systolic End diastolic Systolic Diastolic
Pre-implant 22.1 ± 1.4 22.9 ± 1.2 23.9 ± 2.5 2.2 ± 1.9 17.5 ± 4.0 9.4 ± 4.0
Post-implant 27.2 ± 1.4 26.2 ±1.9 24.4 ± 2.6 4.4 ± 1.5 19.9 ±2.5 8.9 ± 3.3
*determined via computed tomography before implantation and one week post-delivery ** determined via invasive catheter measurements
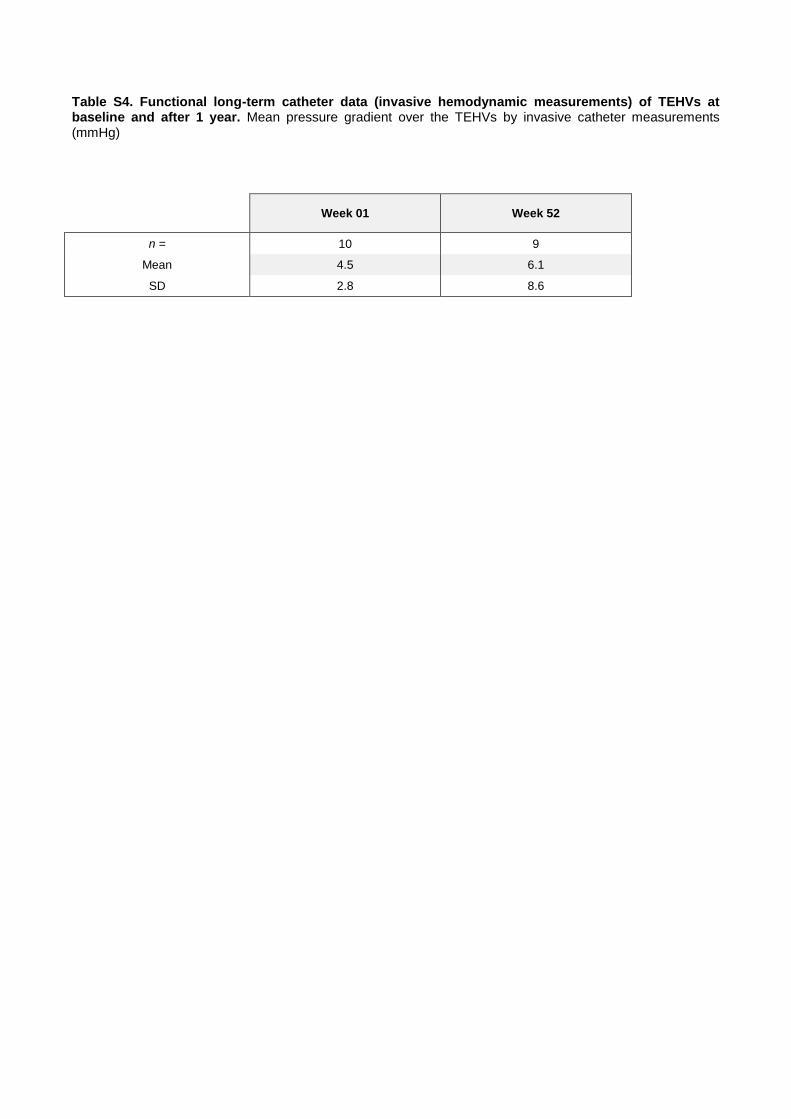
Table S4. Functional long-term catheter data (invasive hemodynamic measurements) of TEHVs at baseline and after 1 year. Mean pressure gradient over the TEHVs by invasive catheter measurements (mmHg)
Week 01 Week 52
n = 10 9
Mean 4.5 6.1
SD 2.8 8.6
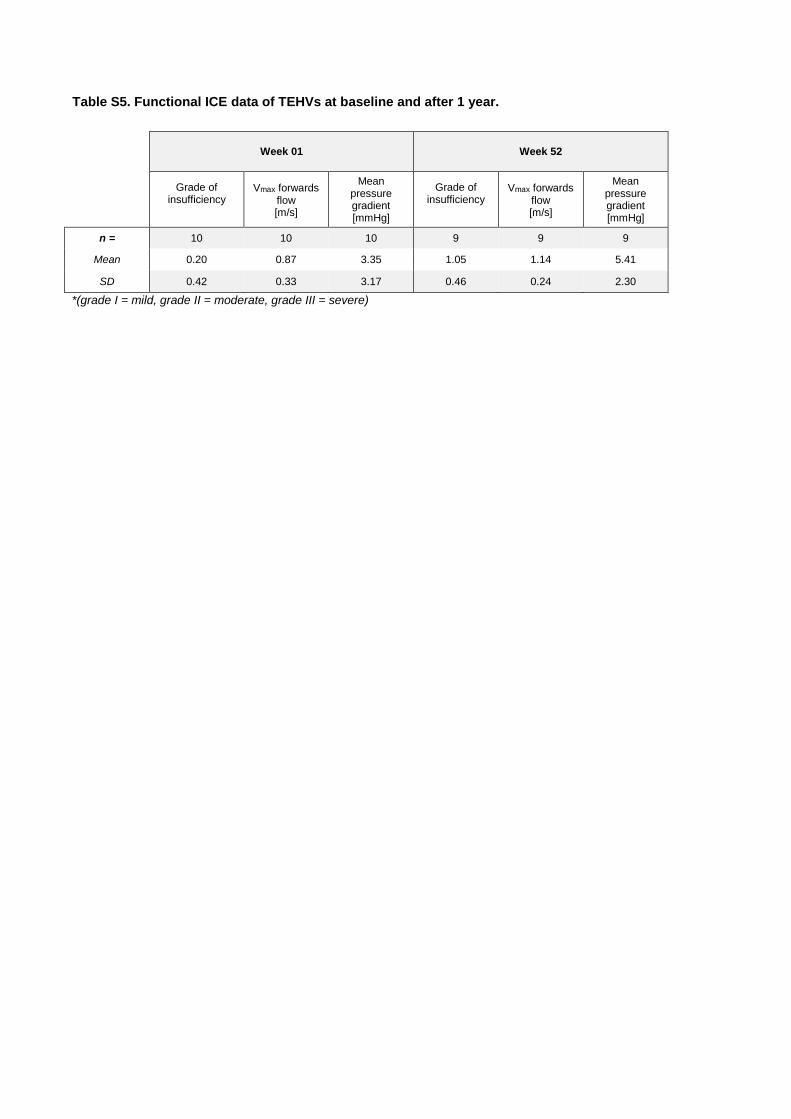
Table S5. Functional ICE data of TEHVs at baseline and after 1 year.
Week 01 Week 52
Grade of insufficiency
Vmax forwards flow [m/s]
Mean pressure gradient [mmHg]
Grade of insufficiency
Vmax forwards flow [m/s]
Mean pressure gradient [mmHg]
n = 10 10 10 9 9 9
Mean 0.20 0.87 3.35 1.05 1.14 5.41
SD 0.42 0.33 3.17 0.46 0.24 2.30
*(grade I = mild, grade II = moderate, grade III = severe)
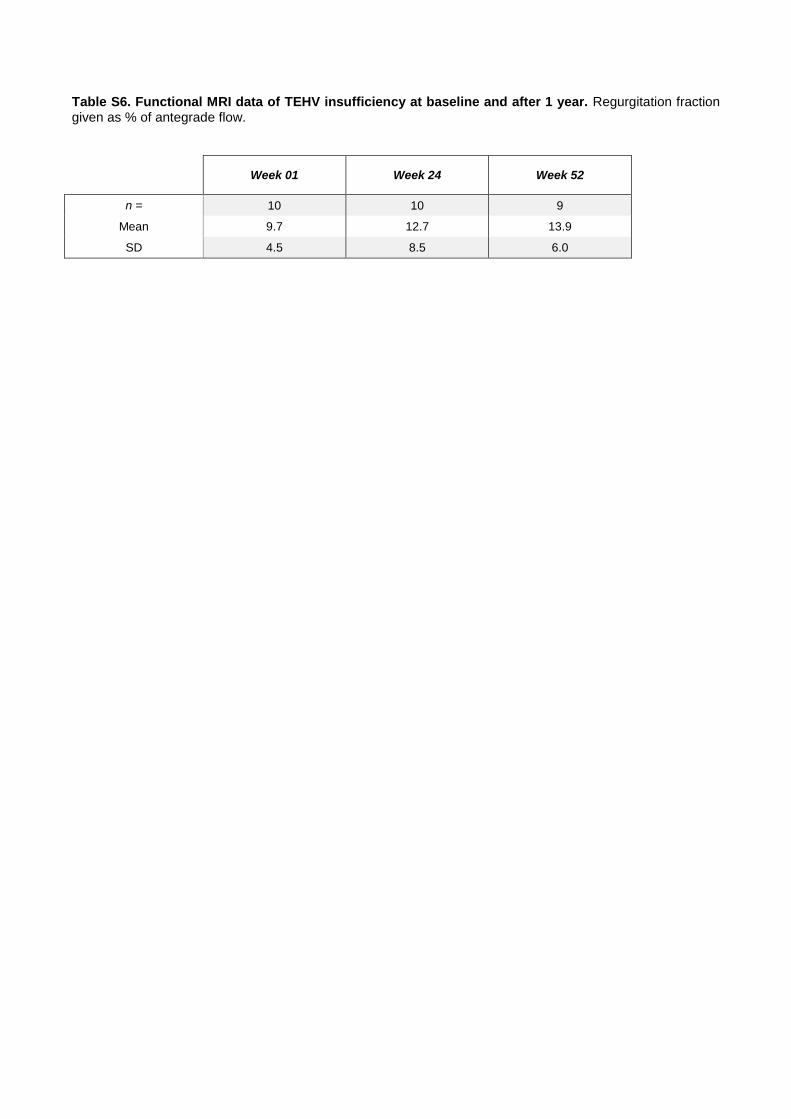
Table S6. Functional MRI data of TEHV insufficiency at baseline and after 1 year. Regurgitation fraction given as % of antegrade flow.
Week 01 Week 24 Week 52
n = 10 10 9
Mean 9.7 12.7 13.9
SD 4.5 8.5 6.0
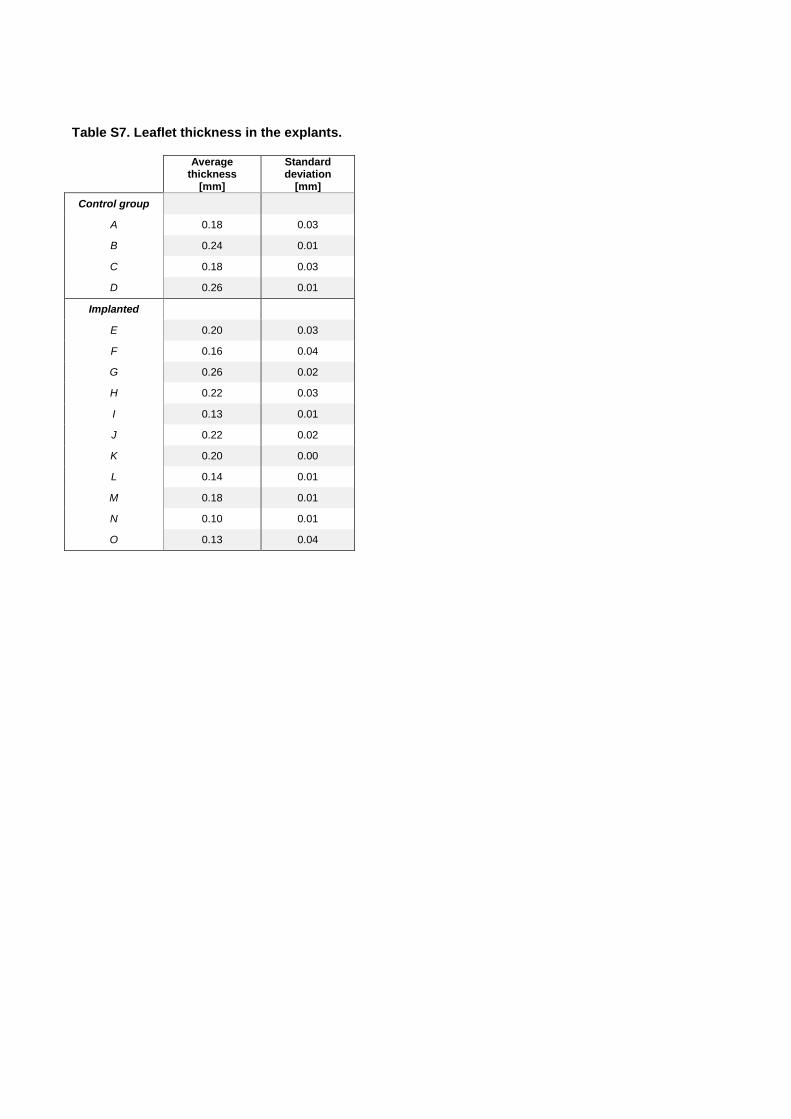
Table S7. Leaflet thickness in the explants.
Average thickness
[mm]
Standard deviation
[mm]
Control group
A 0.18 0.03
B 0.24 0.01
C 0.18 0.03
D 0.26 0.01
Implanted
E 0.20 0.03
F 0.16 0.04
G 0.26 0.02
H 0.22 0.03
I 0.13 0.01
J 0.22 0.02
K 0.20 0.00
L 0.14 0.01
M 0.18 0.01
N 0.10 0.01
O 0.13 0.04
Supplementary Movie Files
Movie S1. In vitro TEHV testing. Slow-motion movie showing the opening and closing behavior of
a TEHV tested in the hydrodynamic pulsatile test system under physiological pulmonary conditions.
Movie S2. Angiography after TEHV implantation. Angiographic assessment of a representative TEHV
shows proper positioning and good functionality immediately upon implantation.
Movie S3. ICE after implantation. ICE of a representative TEHV immediately upon implantation
demonstrates good leaflet mobility and coaptation.
Movie S4. Color-coded ICE after implantation. Doppler ICE of a representative TEHV immediately
upon implantation demonstrates good functionality.
Movie S5. ICE at 6-month follow-up. ICE of a representative TEHV after 6 months in vivo
demonstrates good leaflet mobility and coaptation.
Movie S6. Color-coded ICE at 6-month follow-up. Doppler ICE of a representative TEHV after 6
months in vivo demonstrates good functionality.
Movie S7. ICE at 12-month follow-up. ICE of a representative TEHV after 12 months in vivo
demonstrates good leaflet mobility and coaptation.
Movie S8. Color-coded ICE at 12-month follow-up. Doppler ICE of a representative TEHV after 12
months in vivo demonstrates good functionality.