Embed Size (px)
Citation preview
Institute of Chemical Engineering & Technology
University of the Punjab, Lahore.
Submitted To:
Mr. Hassan Altaf
(Assistant Manager Planning
Submitted By:
Muhammad Umer Chishty
& Technology
Planning, ICP)
Umer Chishty (Intern: Supply Chain Planning, EFL, Sahiwal)
INTERNSHIP REPORT
(JUNE
(Intern: Supply Chain Planning, EFL, Sahiwal)
INTERNSHIP REPORT
UNE-AUGUST 2010)
CONTENTSACKNOWLEDGEMENTS................................
Executive Summary: ................................
ENGRO at a Glance: ................................
Overview of Ice Cream Plant: ................................
Process Description: ................................
Raw Materials / Warehouse and PLANNING:
Mix Processing: ................................
Types of Mixing and Equipments used:
Mixing................................................................
PFD of mix processing hall: ................................
Pasteurizer: ................................................................
Homogenizer: ................................
Aging Vessels & Production Hall:
Description of Six Production Lines:
Comet Machine:................................
Freezers and their constraints: ................................
Maintenance Issues:................................
Overall Equipment Efficiency: ................................
Targets of Production: ................................
Some Tidbits: ................................................................
Engro Foods Supply Chain Limited:
Supply Chain Overview................................
F.M.C.G:................................................................
Business / Organizational Setup: ................................
...........................................................................................................................
................................................................................................................................
................................................................................................................................
.........................................................................................................................
................................................................................................................................
Raw Materials / Warehouse and PLANNING:................................................................................................
................................................................................................................................
Types of Mixing and Equipments used: ................................................................................................
............................................................................................................................
..........................................................................................................................
................................................................................................
................................................................................................................................
................................................................................................
Description of Six Production Lines: ................................................................................................
................................................................................................................................
.......................................................................................................................
................................................................................................................................
......................................................................................................................
................................................................................................................................
................................................................................................
Engro Foods Supply Chain Limited: ................................................................................................
................................................................................................................................
........................................................................................................................
................................................................................................
i
........................... iii
....................................... iv
......................................... 1
......................... 6
................................... 7
..................................7
............................................. 11
........................................ 12
............................ 12
.......................... 13
.................................................... 14
................................................ 15
................................................ 15
............................................ 18
............................................ 19
....................... 22
....................................... 22
...................... 23
................................... 25
................................................. 26
............................................. 27
.................................. 27
........................ 28
................................................... 28
Supply Chain Planning: ................................
Types of Planning:................................
Demand Planning: ................................
Supply Planning: ................................
Supply Planning Constraints: ................................
Production Planning: ................................
Production Planning Constraints: ................................
Inventory handling in system (SAP):
Role of Marketing, Brands and Finance in or outside Supply Chain:
Central Locating Testing: ................................
Finance: ................................................................
VMI Implementation: ................................
ROP & EOQ: ................................................................
Formula of Economic Order Quantity (EOQ):
Continuous Review System ................................
Safety Stock in case of Inventory Levels of RM & PM:
Reasons for safety stock ................................
Inventory policy ................................
Days Cover and Lead Time concept:
YTD Production Plans and MPS: ................................
SKU Trends: ................................................................
BIBLIOGRAPHY: ................................
................................................................................................................................
................................................................................................................................
................................................................................................................................
................................................................................................................................
.........................................................................................................................
................................................................................................................................
................................................................................................
Inventory handling in system (SAP): ................................................................................................
Role of Marketing, Brands and Finance in or outside Supply Chain: ...........................................................
...............................................................................................................................
.........................................................................................................................
................................................................................................................................
................................................................................................
der Quantity (EOQ):................................................................................................
...........................................................................................................................
Safety Stock in case of Inventory Levels of RM & PM: ................................................................
...........................................................................................................................
................................................................................................................................
Days Cover and Lead Time concept:................................................................................................
................................................................................................
................................................................................................
................................................................................................................................
ii
................................. 29
......................................... 30
......................................... 31
........................................... 32
......................... 32
..................................... 34
.................................................. 35
............................................ 36
........................... 37
............................... 37
......................... 38
.................................... 38
................................................. 39
................................ 39
........................... 40
............................................... 42
........................... 43
........................................ 43
............................................. 44
.................................................. 45
.................................................. 46
........................................ 47
ACKNOWLEDGEMENTS
I AM OBLIGED TO HAVE S
MADE MY WORK EASIER
PASSION FOR LEARNING IN AN
GUIDING ME THOROUGHLY
I AM THANKFUL TO MRAZA, MR. AHMAD
REHMAN GHOURI
AHMAD, MR. ALTAF
SUPPLY CHAIN IS A DIFFERENT
BESIDES TECHNICAL KN
PLANT. MR. HASSAN
HELPED ME OUT THROUG
PLANNING KNOWLEDGE
MARKETING AND FINANCE DEPARTMEN
DIFFICULT TO LEARN I
WITHOUT OBSERVING PL
OTHERS HELPED ME IN U
PROCESSING, PROCESS FLOWS
ACKNOWLEDGEMENTS
AM OBLIGED TO HAVE SUCH ENERGY PROVOKING MENTORS WHO
MADE MY WORK EASIER BY ENHANCING MY ENTHUSIASM AND
LEARNING IN AN INDUSTRIAL ENVIRONME
E THOROUGHLY.
MR. HASSAN ALTAF, MR. MIAN
HMAD ABDUL JAMEEL, MR.HOURI, MR. UMER FAROOQ, MR.
LTAF, AND MR. SHAHID MANZOOR
HAIN IS A DIFFERENT PERSPECTIVE OF LEARNING
BESIDES TECHNICAL KNOWLEDGE LEARNT FROM THE ICE CREAM
ASSAN ALTAF AND MR. ABRAR AHMAD
HELPED ME OUT THROUGH THIS PHASE OF SEEKING SUPPLY
LANNING KNOWLEDGE, BUSINESS SENSE, HOW PURCHASE
ND FINANCE DEPARTMENTS WORK. IT WAS FAR
DIFFICULT TO LEARN IT WITHOUT HAVING TECHNICAL SKILLS AND
WITHOUT OBSERVING PLANT AND ITS CONSTRAINTS AS WELL
THERS HELPED ME IN UNDERSTANDING THE PLANT AND
PROCESS FLOWS, MACHINES’ OPERATIONS
iii
MENTORS WHO
USIASM AND
INDUSTRIAL ENVIRONMENT AND
IAN AHMED
ABDUL
. ABRAR
ANZOOR.
SPECTIVE OF LEARNING FOR ME
THE ICE CREAM
HMAD WHO
UPPLY CHAIN
HOW PURCHASE, BRANDS,T WAS FAR
HNICAL SKILLS AND
NTS AS WELL.
NT AND ITS
OPERATIONS, ETC.
EXECUTIVE SUMMARY
SECOND LARGEST PLAYER
HAVING SUCH AN ENTHU
PROGRESSING BY LEAPS
PAKISTANI ORGANIZATIO
FOODS LIMITED GOING TO BE KNOWN
CHAIN LIMITED.
I WORKED AS AN INTERNE
PLANNING.
SPENT TIME AND WORKED
EFFICIENCIES OF MACH
PRODUCTION LINES AND THEIR EFFECTS ON
IN PLANNING, I GATHERED HISTORICAL
IMPLEMENTATION, WORKED ON
PRODUCTION PLANS
QUARTERLY AND HALF YEARLY
SKU TRENDS BY THE YEAR
UMMARY:
ECOND LARGEST PLAYERS OF BUSINESS IN ICE CREAM IN
HAVING SUCH AN ENTHUSIASTIC, ENERGETIC AND PASSIONATE TEAM
PROGRESSING BY LEAPS AND BOUNDS TO BECOME THE PREMIE
AKISTANI ORGANIZATION WITH A GLOBAL OUTREACH
GOING TO BE KNOWN AS ENGRO FOODS
WORKED AS AN INTERNEE AT ICE CREAM PLANT IN SUPPLY
PENT TIME AND WORKED UPON CALCULATING CAPACITIES AND
EFFICIENCIES OF MACHINES. WORKED UPON THE CONST
AND THEIR EFFECTS ON FINISHED GOOD
GATHERED HISTORICAL DATA, STUDIES
WORKED ON ROP, EOQ, FG SAFETY
LANS, INVENTORY LEVELS OF RMALF YEARLY OEE FROM HISTORICAL DATA
RENDS BY THE YEAR
iv
REAM IN PAKISTAN
NATE TEAM
TO BECOME THE PREMIER
EACH. ENGRO
OODS SUPPLY
UPPLY CHAIN
ACITIES AND
ORKED UPON THE CONSTRAINTS IN
OOD.
ON VMIAFETY STOCK,
& PM,FROM HISTORICAL DATA AND
RENDS BY THE YEAR 2011.
ENGRO AT A GLANCE
In 1957, the search for oil by Pak Stanvac, an Esso/Mobil joint venture led to the discovery of the Mari Gas field near Daharki, a small, remote area in Upper Sindh province at the time. Esso proposed the establishment of a urea plant in that area which leplant agreement signed in 1964. In the subsequent year, Esso Pakistan Fertilizer Company Limited was incorporated, with 75% of the shares owned by Esso and 25% by the general public.
The construction of a urea plant commenced at Daharki iproduction began in 1968 with an annual production capacity of 173,000 tons. It was the single largest foreign investment by a multinational corporation in Pakistan at the time.
A full-fledged marketing organization was established which undertagronomic programs to educate the farmers of Pakistan. As the nation’s first fertilizer brand, Engro helped modernize traditional farming practices to boost farm yields, directly impacting the quality of life not only for farmers and their families, buefforts, consumption of fertilizers increased in Pakistan, paving the way for the Company’s branded urea called “Engro”, an acronym for “Energy for Growth”.
LANCE:
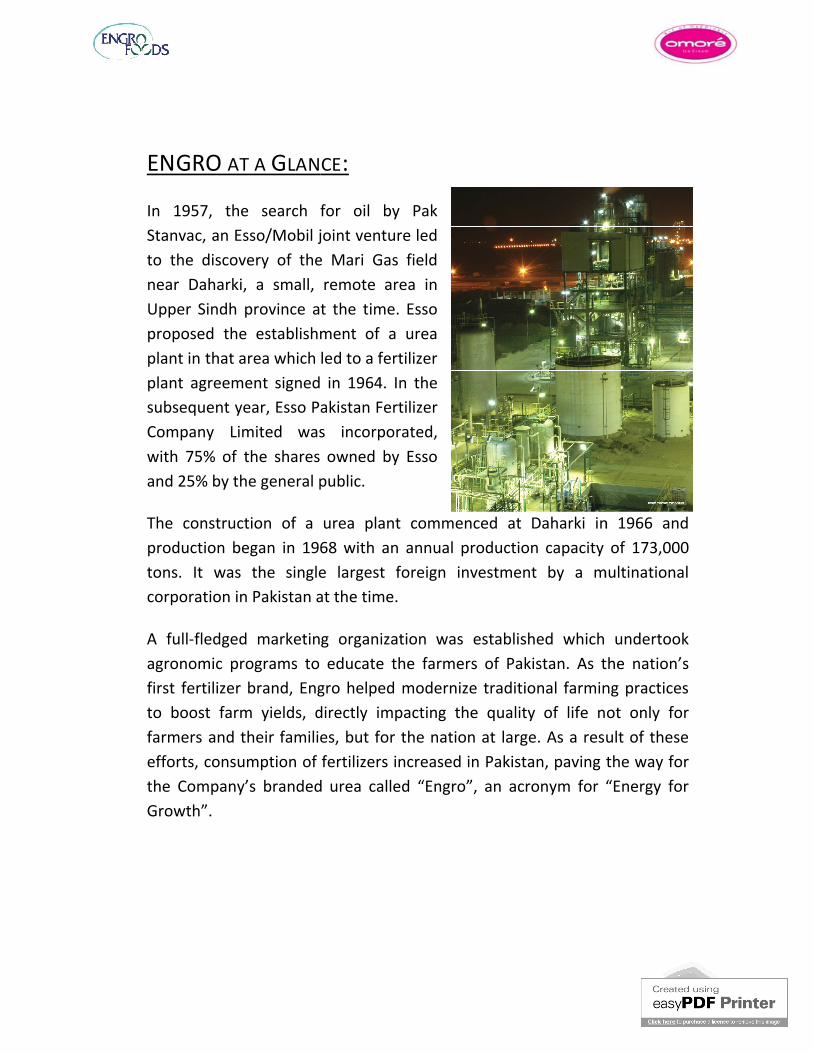
In 1957, the search for oil by Pak Stanvac, an Esso/Mobil joint venture led to the discovery of the Mari Gas field near Daharki, a small, remote area in Upper Sindh province at the time. Esso proposed the establishment of a urea plant in that area which led to a fertilizer plant agreement signed in 1964. In the subsequent year, Esso Pakistan Fertilizer Company Limited was incorporated, with 75% of the shares owned by Esso and 25% by the general public.
The construction of a urea plant commenced at Daharki in 1966 and production began in 1968 with an annual production capacity of 173,000 tons. It was the single largest foreign investment by a multinational corporation in Pakistan at the time.
fledged marketing organization was established which undertagronomic programs to educate the farmers of Pakistan. As the nation’s first fertilizer brand, Engro helped modernize traditional farming practices to boost farm yields, directly impacting the quality of life not only for farmers and their families, but for the nation at large. As a result of these efforts, consumption of fertilizers increased in Pakistan, paving the way for the Company’s branded urea called “Engro”, an acronym for “Energy for
1
n 1966 and production began in 1968 with an annual production capacity of 173,000 tons. It was the single largest foreign investment by a multinational
fledged marketing organization was established which undertook agronomic programs to educate the farmers of Pakistan. As the nation’s first fertilizer brand, Engro helped modernize traditional farming practices to boost farm yields, directly impacting the quality of life not only for
t for the nation at large. As a result of these efforts, consumption of fertilizers increased in Pakistan, paving the way for the Company’s branded urea called “Engro”, an acronym for “Energy for
The Company continued to prosper as it relentlesslygains and strived to attain professional excellence. In 1991, it was renamed as Engro Chemical Pakistan Limitedto strength, reflected in its consistent financial performance, growth of the core fertilizer business, and diversification into other businesses.
Engro Chemical Pakistan Limited then started a journey of venturing into other sectors including foods, energy, industrial control and automation, PVC resin manufacturing and marketing, and chemi
Engro Foods Limited was officially launched as a fully owned subsidiary of Engro in 2004. Using dairy as a stepping stone to enter into the food business, the Company has established state of the art processing units in Sukkur and Sahiwal, along with an ice cream production facility in Sahiwal
Top quality brands like been successfully launched under the helm of Company’s dairy products. To support these brands and their highest standarhas invested heavily in milk processing and milk collection infrastructure.
After the success of our dairy products, to which our customers testify, Engro Foods now plans to venture beyond the dairy sector. In this pursuit, grain and fruit markets have been analyzed in great detail.
Engro Foods’ vision is “Elevating Consumer Delight Worldwide”Company aims to generate a significant portion of its revenue from foreign operations.
The Company continued to prosper as it relentlessly pursued productivity gains and strived to attain professional excellence. In 1991, it was renamed
Engro Chemical Pakistan Limited; the company has gone from strength to strength, reflected in its consistent financial performance, growth of the
tilizer business, and diversification into other businesses.
Engro Chemical Pakistan Limited then started a journey of venturing into other sectors including foods, energy, industrial control and automation, PVC resin manufacturing and marketing, and chemical terminal and storage.
was officially launched as a fully owned subsidiary of Engro in 2004. Using dairy as a stepping stone to enter into the food business, the Company has established state of the art processing units in
d Sahiwal, along with an ice cream production facility in Sahiwal
Top quality brands like Olper’s, Olwell, Tarang, Omore and Owsumbeen successfully launched under the helm of Company’s dairy products. To support these brands and their highest standards of quality, Engro Foods has invested heavily in milk processing and milk collection infrastructure.
After the success of our dairy products, to which our customers testify, Engro Foods now plans to venture beyond the dairy sector. In this pursuit,
and fruit markets have been analyzed in great detail.
“Elevating Consumer Delight Worldwide”Company aims to generate a significant portion of its revenue from foreign
2
pursued productivity gains and strived to attain professional excellence. In 1991, it was renamed
; the company has gone from strength to strength, reflected in its consistent financial performance, growth of the
Engro Chemical Pakistan Limited then started a journey of venturing into other sectors including foods, energy, industrial control and automation,
cal terminal and storage.
was officially launched as a fully owned subsidiary of Engro in 2004. Using dairy as a stepping stone to enter into the food business, the Company has established state of the art processing units in
d Sahiwal, along with an ice cream production facility in Sahiwal
Owsum have been successfully launched under the helm of Company’s dairy products. To
ds of quality, Engro Foods has invested heavily in milk processing and milk collection infrastructure.
After the success of our dairy products, to which our customers testify, Engro Foods now plans to venture beyond the dairy sector. In this pursuit,
“Elevating Consumer Delight Worldwide” and the Company aims to generate a significant portion of its revenue from foreign
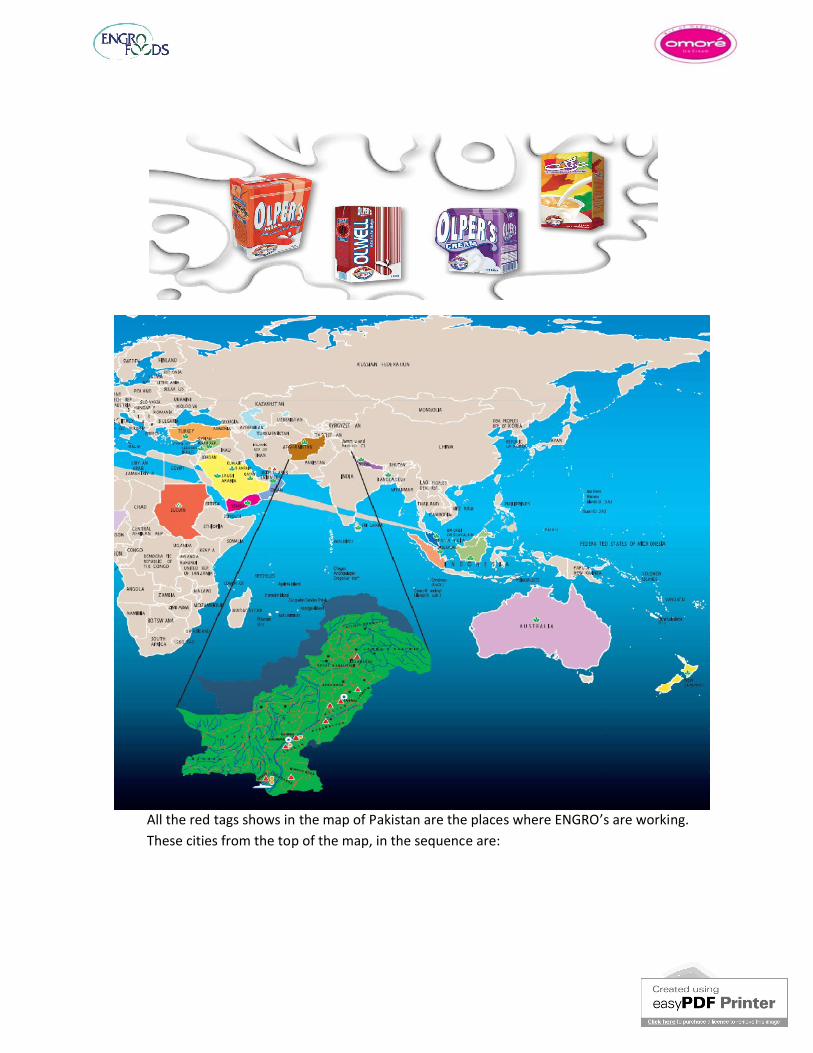
All the red tags shows in the map of PakiThese cities from the top of the map, in the sequence are:All the red tags shows in the map of Pakistan are the places where ENGRO’s are working. These cities from the top of the map, in the sequence are:
3
stan are the places where ENGRO’s are working.
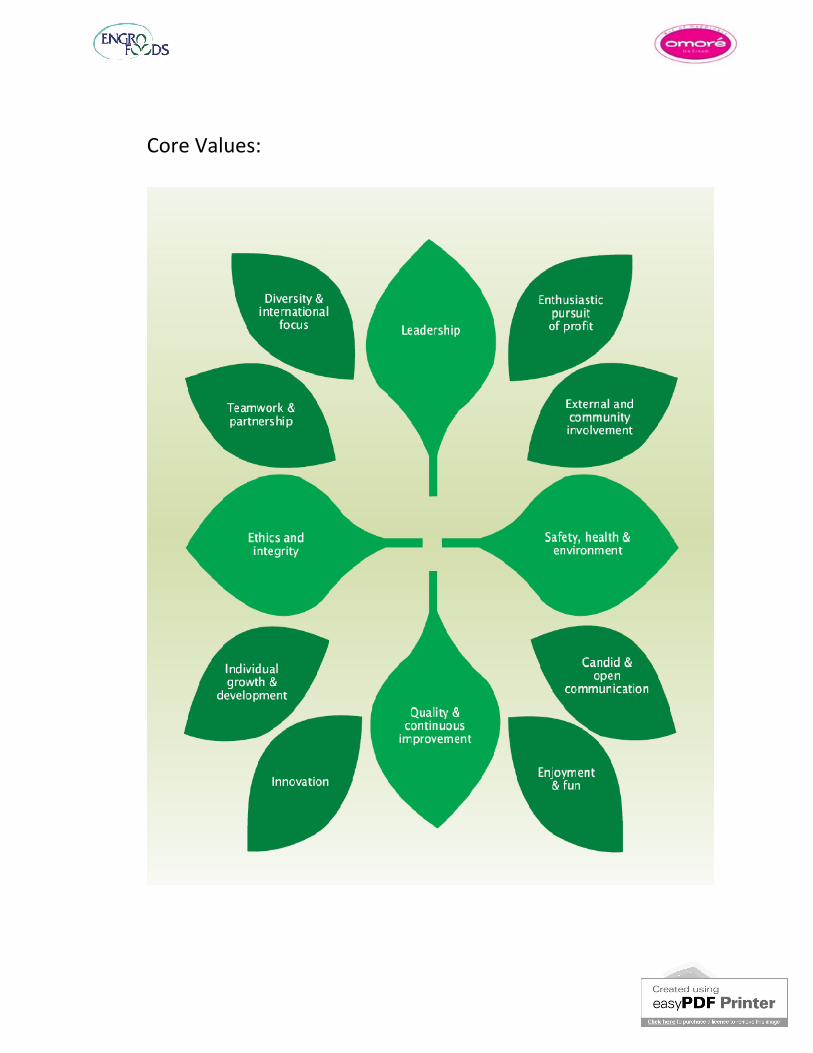
Islamabad
Lahore
Sahiwal
Multan
Bahawalpur
Daharki
Qadirpur
Sukkur
Hyderabad
Karachi
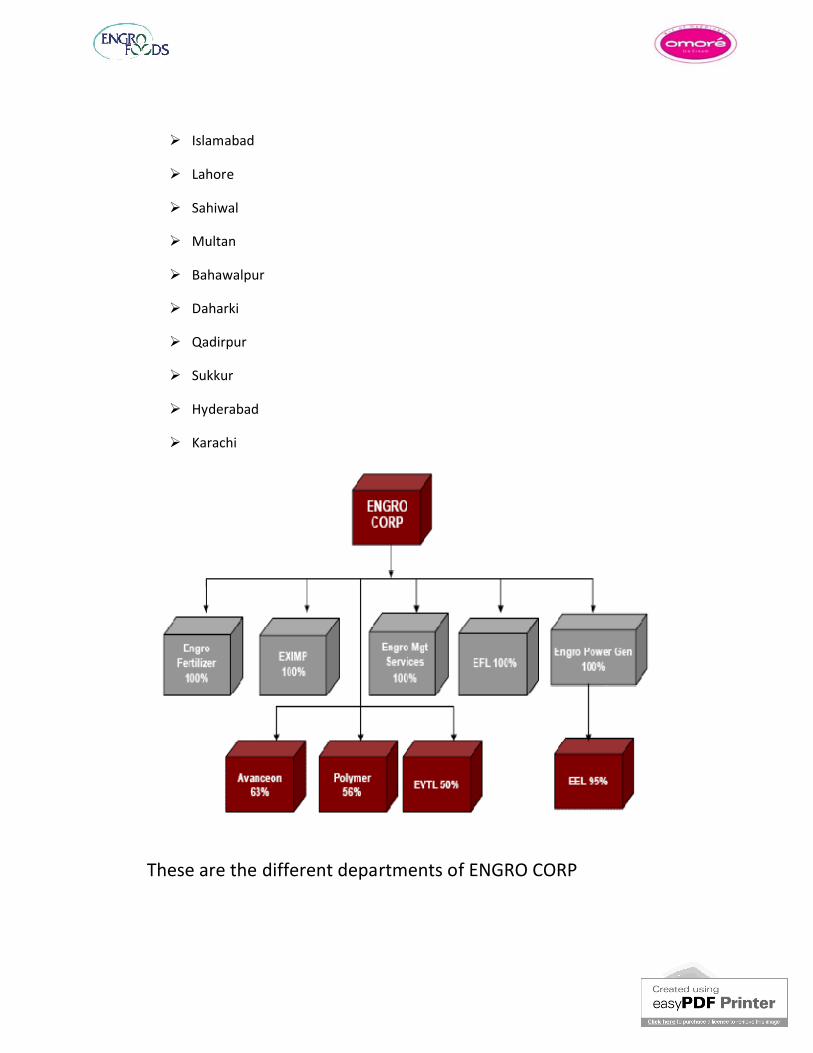
These are the different departments of ENGRO CORPThese are the different departments of ENGRO CORP
4
Detailed Plant Visit:
OVERVIEW OF
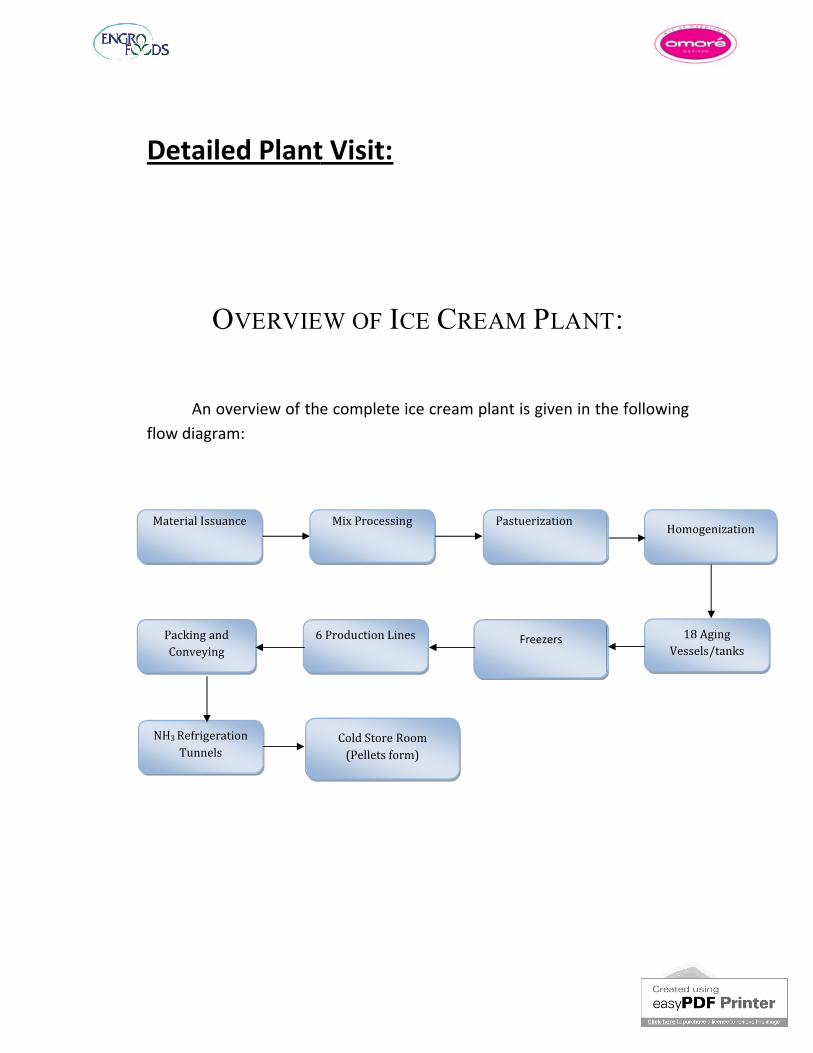
An overview of the complete ice creamflow diagram:
6 Production LinesPacking and Conveying
NH3 RefrigerationTunnels
Material Issuance
Detailed Plant Visit:
VERVIEW OF ICE CREAM PLANT
n overview of the complete ice cream plant is given in the following
Freezers6 Production Lines
Cold Store Room (Pellets form)
Mix Processing Pastuerization
6
LANT:
plant is given in the following
Homogenization
18 Aging Vessels/tanks
PROCESS DESCRIPTION
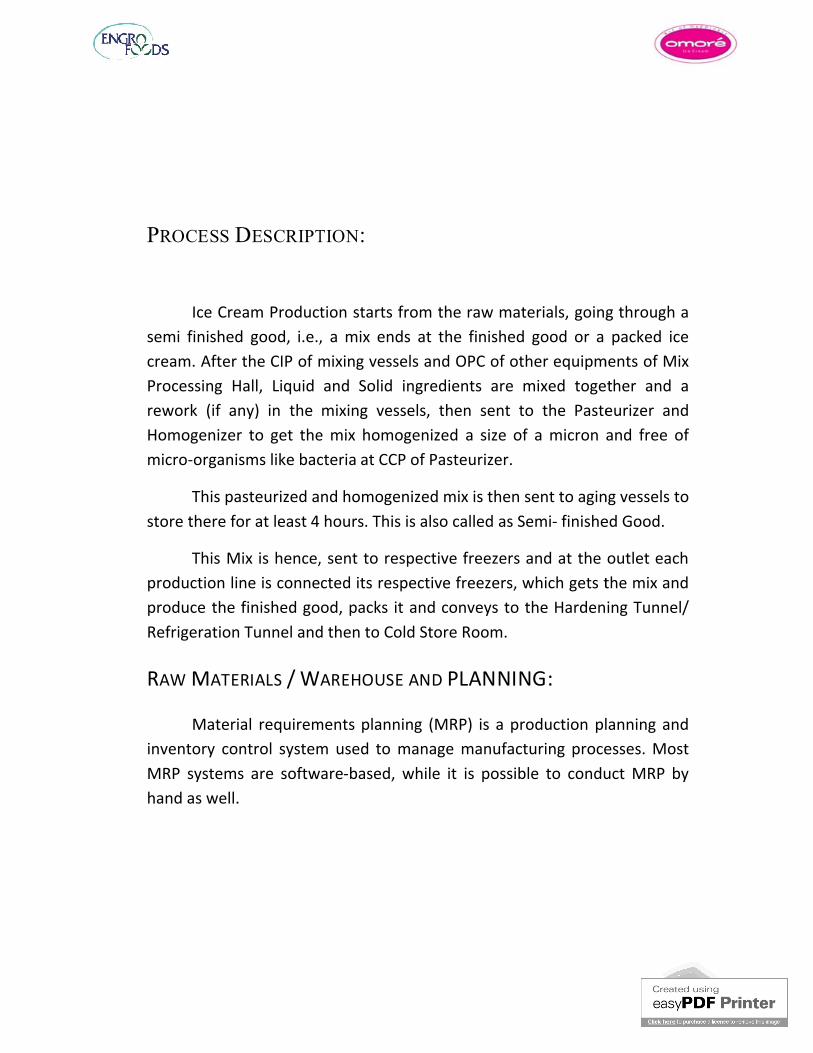
Ice Cream Production starts from the raw materials, going through a semi finished good, i.e., cream. After the CIP of mixing vessels and OPC of other equipments of Mix Processing Hall, Liquid and Solid ingredients are mixed together and a rework (if any) in the mixing vessels, then sent to the PasteurHomogenizer to get the mix homogenized a size of a micron and free of micro-organisms like bacteria at CCP of Pasteurizer.
This pasteurized and homogenized mix is then sent to aging vesselsstore there for at least 4 hours
This Mix is hence, sent to respective freezers and at the outlet each production line is connected its respective freezers, which gets the mix and produce the finished good, packs it and conveys to the Hardening Tunnel/ Refrigeration Tunnel and then to Cold Store Room.
RAW MATERIALS / WAREHOUSE
Material requirements planning (MRP)inventory control system used to MRP systems are softwarehand as well.
ESCRIPTION:
Ice Cream Production starts from the raw materials, going through a semi finished good, i.e., a mix ends at the finished good or a packed ice cream. After the CIP of mixing vessels and OPC of other equipments of Mix Processing Hall, Liquid and Solid ingredients are mixed together and a rework (if any) in the mixing vessels, then sent to the PasteurHomogenizer to get the mix homogenized a size of a micron and free of
organisms like bacteria at CCP of Pasteurizer.
This pasteurized and homogenized mix is then sent to aging vessels4 hours. This is also called as Semi- finished Good.
This Mix is hence, sent to respective freezers and at the outlet each production line is connected its respective freezers, which gets the mix and produce the finished good, packs it and conveys to the Hardening Tunnel/ Refrigeration Tunnel and then to Cold Store Room.
AREHOUSE AND PLANNING:
Material requirements planning (MRP) is a production planning and control system used to manage manufacturing processes. Most
software-based, while it is possible to conduct MRP by
7
Ice Cream Production starts from the raw materials, going through a a mix ends at the finished good or a packed ice
cream. After the CIP of mixing vessels and OPC of other equipments of Mix Processing Hall, Liquid and Solid ingredients are mixed together and a rework (if any) in the mixing vessels, then sent to the Pasteurizer and Homogenizer to get the mix homogenized a size of a micron and free of
This pasteurized and homogenized mix is then sent to aging vessels to finished Good.
This Mix is hence, sent to respective freezers and at the outlet each production line is connected its respective freezers, which gets the mix and produce the finished good, packs it and conveys to the Hardening Tunnel/
is a production planning and processes. Most
based, while it is possible to conduct MRP by
An MRP system is intended to simultaneously meet three objectives:
Ensure materials are available for for delivery to customers.
Maintain the lowest possible level of inventory. Plan manufacturing activities, delivery schedules and purchasing
activities.
At Ice Cream Plant, core parts of aRoom and Cold Store Room
Dry Store consist all the dry raw materials such as nuts, chocolate spray and chocolate coating as well as all the packaging materials, etc. Storing is done in the form of shelves and pellets.
"Manufacturing organizations, whatever their products, face the same daily practical problem products to be available in a shorter time than it takes to make them. This means that some level of planning is required."
Similarly, Cold Store Room is comprised of all the finished good, i.e. Ice Cream. ICP has the 3 cold store rooms (recently expanded 3of 1000 pellets. The temperature of Cold Store Room is negative 28cooling is done with the help of NH
All the constraints are taken into account, i.e. if the packaging material and raw material is provided in time to fulfill the production plan or not. Expiry dates for each raw material may not exceed the production date or it may be dumped before. Otherwise it will affect the production and hence production may be stopped due to shortage or lack of materials. Each and everything works upon the criteria of Lead Time of each material.
An MRP system is intended to simultaneously meet three objectives:
are available for production and products are available to customers.
Maintain the lowest possible level of inventory. Plan manufacturing activities, delivery schedules and purchasing
At Ice Cream Plant, core parts of a Material Warehouse are Dry Store Room and Cold Store Room.
Dry Store consist all the dry raw materials such as nuts, chocolate spray and chocolate coating as well as all the packaging materials, etc. Storing is done in the form of shelves and pellets.
"Manufacturing organizations, whatever their products, face the same daily practical problem - that customers want products to be available in a shorter time than it takes to make them. This means that some level of planning is required."
tore Room is comprised of all the finished good, i.e. Ice Cream. ICP has the 3 cold store rooms (recently expanded 3rd
of 1000 pellets. The temperature of Cold Store Room is negative 28cooling is done with the help of NH3 Compressors and refrigeration system.
All the constraints are taken into account, i.e. if the packaging material and raw material is provided in time to fulfill the production plan or not. Expiry dates for each raw material may not exceed the production
e dumped before. Otherwise it will affect the production and hence production may be stopped due to shortage or lack of materials. Each and everything works upon the criteria of Lead Time of each material.
8
An MRP system is intended to simultaneously meet three objectives:
are available
Plan manufacturing activities, delivery schedules and purchasing
are Dry Store
Dry Store consist all the dry raw materials such as nuts, chocolate spray and chocolate coating as well as all the packaging materials, etc.
"Manufacturing organizations, whatever their products, that customers want
products to be available in a shorter time than it takes to make them. This means that some level of planning is required."
tore Room is comprised of all the finished good, i.e. rd one), each
of 1000 pellets. The temperature of Cold Store Room is negative 28oC. This d refrigeration system.
All the constraints are taken into account, i.e. if the packaging material and raw material is provided in time to fulfill the production plan or not. Expiry dates for each raw material may not exceed the production
e dumped before. Otherwise it will affect the production and hence production may be stopped due to shortage or lack of materials. Each and everything works upon the criteria of Lead Time of each material.
The cold store room must contain at least day’s coeach product (Finished Good). Or it may be considered as safety stock and production will be done in order to fulfill the requirement of sales. But unnecessary planning of production must be prohibited, so the extra and unnecessary stock may not be stored in cold store such that the required product may not get the desired place in
Making a bad decision in any of these areas will make the company lose money. A few examples are given below:
If a company purchases insufficimanufacturing (or the wrong item) it may be unable to meet contract obligations to supply products on time.
If a company purchases excessive quantities of an item, money is wasted - the excess quantity ties up cash while itand may never even be used at all.
Beginning production of an order at the wrong time can cause customer deadlines to be missed.
MRP is a tool to deal with these problems. It provides answers for several questions:
What items are required?
How many are required?
When are they required?
MRP can be applied both to items that are purchased from outside suppliers and to sub-assemblies, produced internally, that are components of more complex items.
The cold store room must contain at least day’s covers of 15 days of each product (Finished Good). Or it may be considered as safety stock and production will be done in order to fulfill the requirement of sales. But unnecessary planning of production must be prohibited, so the extra and
may not be stored in cold store such that the required product may not get the desired place in that store room.
Making a bad decision in any of these areas will make the company lose money. A few examples are given below:
If a company purchases insufficient quantity of an item used in manufacturing (or the wrong item) it may be unable to meet contract obligations to supply products on time.
If a company purchases excessive quantities of an item, money is the excess quantity ties up cash while it remains as stock
and may never even be used at all.
Beginning production of an order at the wrong time can cause customer deadlines to be missed.
MRP is a tool to deal with these problems. It provides answers for several
items are required?
are required?
are they required?
MRP can be applied both to items that are purchased from outside assemblies, produced internally, that are components
9
vers of 15 days of each product (Finished Good). Or it may be considered as safety stock and production will be done in order to fulfill the requirement of sales. But unnecessary planning of production must be prohibited, so the extra and
may not be stored in cold store such that the required
Making a bad decision in any of these areas will make the company lose
ent quantity of an item used in manufacturing (or the wrong item) it may be unable to meet contract
If a company purchases excessive quantities of an item, money is remains as stock
Beginning production of an order at the wrong time can cause
MRP is a tool to deal with these problems. It provides answers for several
MRP can be applied both to items that are purchased from outside assemblies, produced internally, that are components
The data that must be considered include:
The end item (or items) being created. This is sometimes called Independent Demand or Level “0 on BOM (
How much is required at a time.
When the quantities are required to meet demand.
Shelf life of stored materials.
Inventory status records. Records of already in stock (on hand) and materials on order from suppliers.
Bills of materials. Details of the materials, components and subassemblies required to make each product.
Planning Data. This includes all the restraints and directions to produce the end items. This includes such items as: Routings, Labor and Machine StandaCell and Push commands, Lot sizing techniques (i.e. Fixed Lot Size, Lot-For-Lot, and Economic Order Quantity), Scrap Percentages, and other inputs.
Outputs
There are two outputs and a variety of messages/repor
Output 1 is the "Recommended Production Schedule" which lays out a detailed schedule of the required minimum start and completion dates, with quantities, for each step of the Routing and Bill Of Material required to satisfy the demand from the Schedule (MPS).
Output 2 is the "Recommended Purchasing Schedule". This lays out both the dates that the purchased items should be received int
considered include:
(or items) being created. This is sometimes called Independent Demand or Level “0 on BOM (Bill of materials
How much is required at a time.
When the quantities are required to meet demand.
Shelf life of stored materials.
Inventory status records. Records of net materials availablealready in stock (on hand) and materials on order from suppliers.
s of materials. Details of the materials, components and subassemblies required to make each product.
Planning Data. This includes all the restraints and directions to produce the end items. This includes such items as: Routings, Labor and Machine Standards, Quality and Testing Standards, Pull/Work Cell and Push commands, Lot sizing techniques (i.e. Fixed Lot Size,
Lot, and Economic Order Quantity), Scrap Percentages, and
There are two outputs and a variety of messages/reports:
Output 1 is the "Recommended Production Schedule" which lays out a detailed schedule of the required minimum start and completion dates, with quantities, for each step of the Routing and Bill Of Material required to satisfy the demand from the Master Production
Output 2 is the "Recommended Purchasing Schedule". This lays out both the dates that the purchased items should be received int
10
(or items) being created. This is sometimes called Bill of materials).
available for use already in stock (on hand) and materials on order from suppliers.
s of materials. Details of the materials, components and sub-
Planning Data. This includes all the restraints and directions to produce the end items. This includes such items as: Routings, Labor
rds, Quality and Testing Standards, Pull/Work Cell and Push commands, Lot sizing techniques (i.e. Fixed Lot Size,
Lot, and Economic Order Quantity), Scrap Percentages, and
Output 1 is the "Recommended Production Schedule" which lays out a detailed schedule of the required minimum start and completion dates, with quantities, for each step of the Routing and Bill Of
Master Production
Output 2 is the "Recommended Purchasing Schedule". This lays out both the dates that the purchased items should be received into the
facility AND the dates that the Release should occur to match the production schedules.
Messages and Reports:
Purchase orders. An order to a supplier to provide materials.
Reschedule notices. These delaying or speeding up existing orders.
MIX PROCESSING:The backbone of Ice Cream Production
from the material issuance from the warehouse and hence these materials are in dry /solid form, such as sugar, wheat flour, etc. other Liquid Ingredients are stored in LIA (Liquid IngredGlucose, Cream, Vegetable Oil
Mixing at ICP is totally controlled with the help of PLC and HMIthe dosing of solid ingredients is done by the man power /manually. This mixing is done in 2 mixing vessels, each of 2000 kg/
Total time taken to form a mix and then deliver to aging vessels is about 35 – 40 minutes.
This mix is then sent to the pasteurizer with the help of pumps. All the equipments are installed on the basis of PNEUMATIC or HYDRAULIC CONVEYING of substances/ mix.
Pasteurizer kills the bacteria, if pasteurization is carried for 29 sec at about 80oC and hence th
facility AND the dates that the Purchase orders, or Blanket Order Release should occur to match the production schedules.
. An order to a supplier to provide materials.
Reschedule notices. These recommend cancelling, increasing, delaying or speeding up existing orders.
The backbone of Ice Cream Production is “Mixing”. This process starts from the material issuance from the warehouse and hence these materials are in dry /solid form, such as sugar, wheat flour, etc. other Liquid Ingredients are stored in LIA (Liquid Ingredients Area) which includes
Cream, Vegetable Oil, etc.
Mixing at ICP is totally controlled with the help of PLC and HMIthe dosing of solid ingredients is done by the man power /manually. This mixing is done in 2 mixing vessels, each of 2000 kg/0.5hr (average)
Total time taken to form a mix and then deliver to aging vessels is about 35
is then sent to the pasteurizer with the help of pumps. All the equipments are installed on the basis of PNEUMATIC or HYDRAULIC CONVEYING of substances/ mix.
Pasteurizer kills the bacteria, if pasteurization is carried for 29 sec at C and hence the desired food product is safe from getting
11
, or Blanket Order
. An order to a supplier to provide materials.
cancelling, increasing,
is “Mixing”. This process starts from the material issuance from the warehouse and hence these materials are in dry /solid form, such as sugar, wheat flour, etc. other Liquid
which includes
Mixing at ICP is totally controlled with the help of PLC and HMI but the dosing of solid ingredients is done by the man power /manually. This
(average) capacity.
Total time taken to form a mix and then deliver to aging vessels is about 35
is then sent to the pasteurizer with the help of pumps. All the equipments are installed on the basis of PNEUMATIC or HYDRAULIC
Pasteurizer kills the bacteria, if pasteurization is carried for 29 sec at e desired food product is safe from getting
contaminated. Mix is then homogenized with the help of a will be discussed in later section in detail.
Other areas of Mix Processing Hall includes CIP Room, in which tanks and vessels full of CIP,chlorinated), and washing water (chlorinated), cleansing and jacketed oil tank (hot water tank) are kept, sent pneumatically wherever they are used.
LIA: Liquid Ingredients Area is the area comprised of Glucose, Vegand Cream tanks which are also controlled pneumatically and used as per recipe.
The total mixing capacity of this hall is about calculated through proper calculations, but it varies every year accordingly changing with process and shifts
TYPES OF MIXING AND
MIXING is usually of three types:
1. Convective; in which groups of particles are moved from one position to another.
2. Diffusion; where the particles are distributed over a freshly developed interface.
3. Shear; where slipping
Blending or mixing which occurs at ice cream plant in mixing vessels is of 1st type, i.e. convective mixing.
This blending occurs, in which fats and oils are mixed in water with the help of emulsifiers and stabilizers, hence the known as Emulsification.
contaminated. Mix is then homogenized with the help of a homogenizer;will be discussed in later section in detail.
Other areas of Mix Processing Hall includes CIP Room, in which tanks and vessels full of CIP, OPC, detergents, product water tank (dechlorinated), and washing water (chlorinated), cleansing and jacketed oil tank (hot water tank) are kept, sent pneumatically wherever they are used.
LIA: Liquid Ingredients Area is the area comprised of Glucose, Vegand Cream tanks which are also controlled pneumatically and used as per
The total mixing capacity of this hall is about 29 Mi kg/yearcalculated through proper calculations, but it varies every year accordingly changing with process and shifts time.
IXING AND EQUIPMENTS USED:is usually of three types:
; in which groups of particles are moved from one position to another.
; where the particles are distributed over a freshly developed interface.
slipping planes are formed
Blending or mixing which occurs at ice cream plant in mixing vessels is of type, i.e. convective mixing.
This blending occurs, in which fats and oils are mixed in water with the help of emulsifiers and stabilizers, hence the process thus occurs is known as Emulsification.
12
homogenizer; it
Other areas of Mix Processing Hall includes CIP Room, in which tanks OPC, detergents, product water tank (de-
chlorinated), and washing water (chlorinated), cleansing and jacketed oil tank (hot water tank) are kept, sent pneumatically wherever they are used.
LIA: Liquid Ingredients Area is the area comprised of Glucose, Veggie and Cream tanks which are also controlled pneumatically and used as per
29 Mi kg/year, calculated through proper calculations, but it varies every year accordingly
; in which groups of particles are moved from one
; where the particles are distributed over a freshly
Blending or mixing which occurs at ice cream plant in mixing vessels is of
This blending occurs, in which fats and oils are mixed in water with process thus occurs is
Blades of these two mixing vessels are thin and fan shaped due to a reason that the sugar is thoroughly mixed in hot water.
Coloring agents are not added in the mixing vessels due to high temperature of about 60
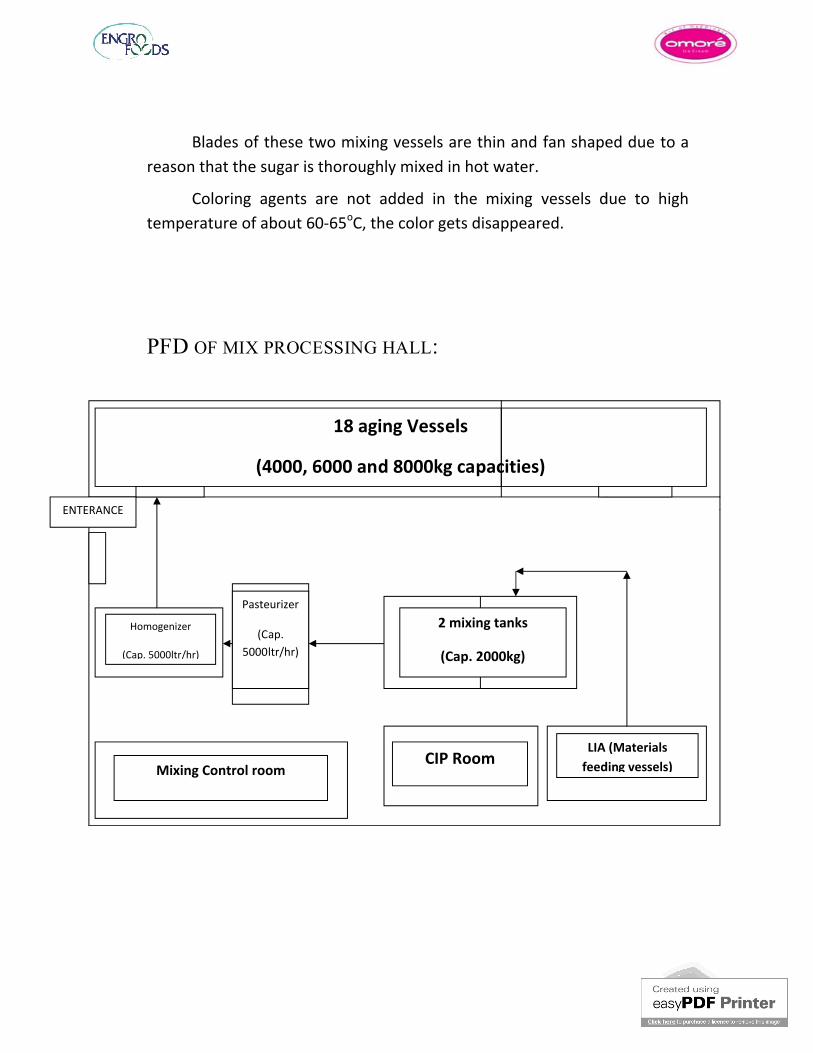
PFD OF MIX PROCESSING HA
(4000, 6000 and 8000kg capacities)
Homogenizer
(Cap. 5000ltr/hr)
Pasteurizer
(Cap. 5000ltr/hr)
Mixing Control room
ENTERANCE
Blades of these two mixing vessels are thin and fan shaped due to a reason that the sugar is thoroughly mixed in hot water.
Coloring agents are not added in the mixing vessels due to high 0-65oC, the color gets disappeared.
OF MIX PROCESSING HALL:
18 aging Vessels
(4000, 6000 and 8000kg capacities)
2 mixing tanks
(Cap. 2000kg)
CIP RoomLIA (Materials
feeding vessels)
13
Blades of these two mixing vessels are thin and fan shaped due to a
Coloring agents are not added in the mixing vessels due to high
LIA (Materials feeding vessels)
PASTEURIZER:This equipment works on the principle of a scientist named Louis
Pasteur, who discovered a phenomenon named
In this process the substance is heated to about 79 or 80 to kill the pathogenic bacteria.
There is a hazard at this stage, if not controlled properly can be fatal as well. A terminology devised internationally by (Hazard Analysis Critical Control Point) is divided into two stages, CCP 1 and CCP2.
If, for example, the mix is not passed yet through Pasteurizer it is CCP1, because it must be passed after passing through PHE (Plate Heat Exchanger) and then Pasteurizer, thus the germs and microbe killed.
But, after that it would be CCP2, it gets the probability to be contaminated and there is no other pasteurizer in next stage. CCP 2 is more hazardous as compared to CCP1.
100% pasteurization is not achievable or impossible. It is named by two kinds:
I. HTST (High Temperature for Short Time)II. LTLT (Low Temperature for Longer Time)
This equipment works on the principle of a scientist named Louis Pasteur, who discovered a phenomenon named after him “Pasteurization”.
In this process the substance is heated to about 79 or 80 oC for 29 sec to kill the pathogenic bacteria.
There is a hazard at this stage, if not controlled properly can be fatal as well. A terminology devised internationally by a technology called HACCP (Hazard Analysis Critical Control Point) is divided into two stages, CCP 1 and
If, for example, the mix is not passed yet through Pasteurizer it is CCP1, because it must be passed after passing through PHE (Plate Heat
ger) and then Pasteurizer, thus the germs and micro-organisms will
But, after that it would be CCP2, it gets the probability to be contaminated and there is no other pasteurizer in next stage. CCP 2 is more hazardous as compared to CCP1.
steurization is not achievable or impossible. It is named by two
(High Temperature for Short Time)--- 72oC for 15 sec(Low Temperature for Longer Time)---62.5oC 30 min
14
This equipment works on the principle of a scientist named Louis after him “Pasteurization”.
C for 29 sec
There is a hazard at this stage, if not controlled properly can be fatal a technology called HACCP
(Hazard Analysis Critical Control Point) is divided into two stages, CCP 1 and
If, for example, the mix is not passed yet through Pasteurizer it is CCP1, because it must be passed after passing through PHE (Plate Heat
organisms will
But, after that it would be CCP2, it gets the probability to be contaminated and there is no other pasteurizer in next stage. CCP 2 is more
steurization is not achievable or impossible. It is named by two
HOMOGENIZER:In homogenizer, large pressure breaks the fat
mixing vessels and makes them homogeneous. Its basic use is to homogenize the whole mix, so that a customer may eat ice cream and could able to taste the homogenized each and every bit of ingredient used in it.
Optimal speed of Homogenpressure thus maintained is about 150 bars.
Note: All of these equipments installed in Mix Processing Hall and the Production Hall are of Tetra Pak, Limited.
AGING VESSELS &When the mix is
vessels, aging means “a period of stay”. There are 18 vessels of different capacities, ranging from 4000kg to 8000 kg.
These 18 vessels are named with model numbers, i.e. Vs# 5100
Capacities with respect to model numbers are as followed:
Vs# 5100 - 5400 Vs# 5500 – 5800 Vs# 5900 – 6800
In homogenizer, large pressure breaks the fat molecules made up in mixing vessels and makes them homogeneous. Its basic use is to homogenize the whole mix, so that a customer may eat ice cream and could able to taste the homogenized each and every bit of ingredient used in it.
Optimal speed of Homogenizer and Pasteurizer is 5000 kg/hr and the pressure thus maintained is about 150 bars.
Note: All of these equipments installed in Mix Processing Hall and the Production Hall
PRODUCTION HALL:When the mix is ready in 35-40 minutes, it is sent to the aging
vessels, aging means “a period of stay”. There are 18 vessels of different capacities, ranging from 4000kg to 8000 kg.
are named with model numbers, i.e. Vs# 5100- Vs#6800
espect to model numbers are as followed:
00: 6000kg
5800: 4000kg
6800: 8000kg
15
molecules made up in mixing vessels and makes them homogeneous. Its basic use is to homogenize the whole mix, so that a customer may eat ice cream and could able to taste the homogenized each and every bit of ingredient used in it.
izer and Pasteurizer is 5000 kg/hr and the
Note: All of these equipments installed in Mix Processing Hall and the Production Hall
, it is sent to the aging vessels, aging means “a period of stay”. There are 18 vessels of different
Vs#6800.
In aging vessels, mix is stored for at least 2of 4oC. The mix is then conveyed to respective freezers where the deemulsification process takes place, i.e. the proteins, fats, oils, water ice, air, emulsifiers separates and then they give each taste in the ice cream. Air is basically used to harden the ice cream, to held it in a specific shape.
Talking about the aging Tanks’ blades; it is due to the fact that flavors with greater viscosity are added in the mix at the stage of aging.
Colors and flavors are not added in the mixing tank because it works at a higher temperature aging vessels this temperature dosed here.
If colors are to be added in the aging tank, first of all their solution is made in hot water and then introduced (mechanicall
Here comes the next part of the production athe basic equipment whercontrols the temperature and viscosity of the mix converting it into either ice cream or water ice. There are nine in production hall, all installed by Tetra Pak, Limitedconnected to two aging vessels via pipes that convey their respective mixes pneumatically. Names of models of freezers of specified machines (production lines), their flow rate capacities and attached aging vessels are mentioned below:
In aging vessels, mix is stored for at least 2-4 hours at a temperature C. The mix is then conveyed to respective freezers where the de
ulsification process takes place, i.e. the proteins, fats, oils, water ice, air, emulsifiers separates and then they give each taste in the ice cream. Air is basically used to harden the ice cream, to held it in a specific
Talking about the aging vessels, there blades are thicker than Mixing Tanks’ blades; it is due to the fact that flavors with greater viscosity are added in the mix at the stage of aging.
Colors and flavors are not added in the mixing tank because it works at a higher temperature of about 65-70oC, where they decolorize, but in aging vessels this temperature are controlled and these additives are
If colors are to be added in the aging tank, first of all their solution is made in hot water and then introduced (mechanically).
Here comes the next part of the production a FREEZER
the basic equipment where de-emulsification takes place and which controls the temperature and viscosity of the mix converting it into either ice cream or water ice. There are nine different kinds of freezers in production hall, all installed by Tetra Pak, Limited. Each freezer is connected to two aging vessels via pipes that convey their respective mixes pneumatically. Names of models of freezers of specified machines
ines), their flow rate capacities and attached aging vessels are mentioned below:
16
4 hours at a temperature C. The mix is then conveyed to respective freezers where the de-
ulsification process takes place, i.e. the proteins, fats, oils, water ice, air, emulsifiers separates and then they give each taste in the ice cream. Air is basically used to harden the ice cream, to held it in a specific
vessels, there blades are thicker than Mixing Tanks’ blades; it is due to the fact that flavors with greater viscosity are
Colors and flavors are not added in the mixing tank because it works C, where they decolorize, but in
controlled and these additives are
If colors are to be added in the aging tank, first of all their solution is
REEZER which is emulsification takes place and which
controls the temperature and viscosity of the mix converting it into different kinds of freezers
. Each freezer is connected to two aging vessels via pipes that convey their respective mixes pneumatically. Names of models of freezers of specified machines
ines), their flow rate capacities and attached aging vessels
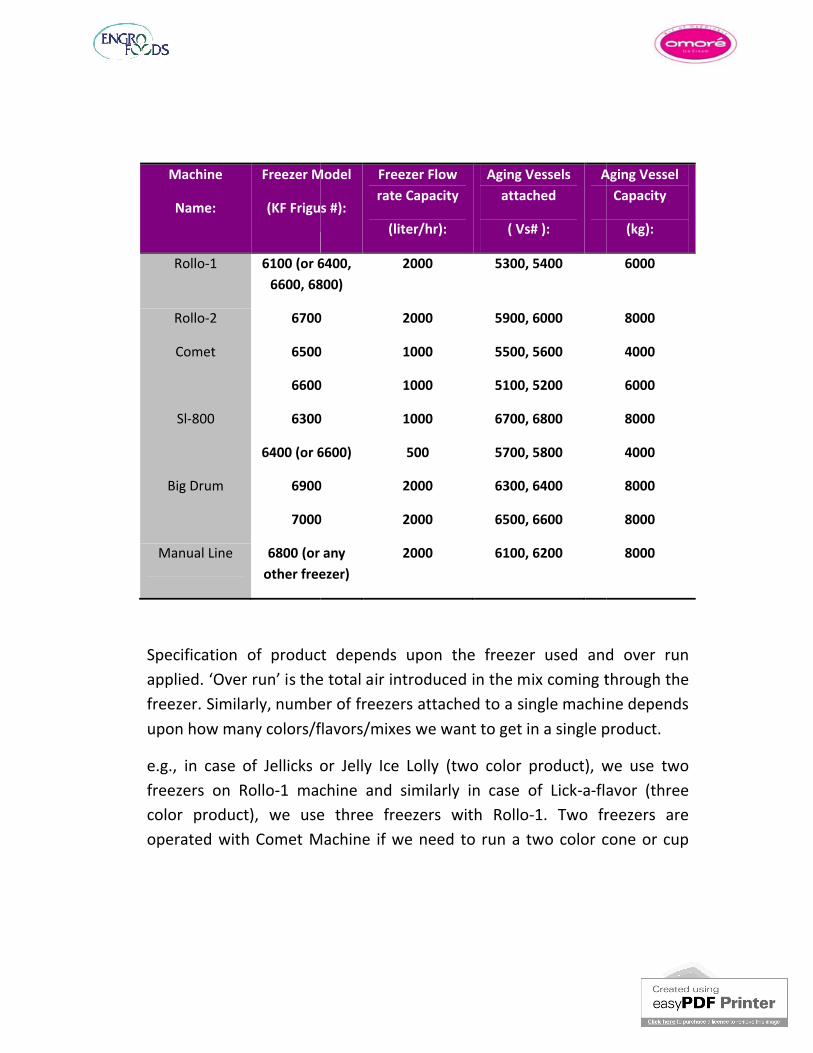
Machine
Name:
Freezer Model
(KF Frigus
Rollo-1 6100 (or 6400, 6600, 6800
Rollo-2 6700
Comet 6500
6600
Sl-800 6300
6400 (or 6600)
Big Drum 6900
7000
Manual Line 6800 (or any other freezer)
Specification of product depends upon the freezer used and over run applied. ‘Over run’ is the total air introduced in the mix coming through the freezer. Similarly, number of freezers attachedupon how many colors/flavors/mixes we want to get in a single product.
e.g., in case of Jellicks or Jelly Ice Lolly (two color product), we use two freezers on Rollo-1 machine and similarly in case of Lickcolor product), we use three freezers with Rollooperated with Comet Machine if we need to run a two color cone or cup
Freezer Model
(KF Frigus #):
Freezer Flow rate Capacity
(liter/hr):
Aging Vessels attached
( Vs# ):
Aging Vessel
or 6400, 6800)
2000 5300, 5400
6700 2000 5900, 6000
6500
6600
1000
1000
5500, 5600
5100, 5200
6300
6400 (or 6600)
1000
500
6700, 6800
5700, 5800
6900
7000
2000
2000
6300, 6400
6500, 6600
(or any other freezer)
2000 6100, 6200
Specification of product depends upon the freezer used and over run applied. ‘Over run’ is the total air introduced in the mix coming through the
Similarly, number of freezers attached to a single machine depends upon how many colors/flavors/mixes we want to get in a single product.
e.g., in case of Jellicks or Jelly Ice Lolly (two color product), we use two 1 machine and similarly in case of Lick-a-flavor (three
product), we use three freezers with Rollo-1. Two freezers are operated with Comet Machine if we need to run a two color cone or cup
17
Aging Vessel Capacity
(kg):
6000
8000
4000
6000
8000
4000
8000
8000
8000
Specification of product depends upon the freezer used and over run applied. ‘Over run’ is the total air introduced in the mix coming through the
to a single machine depends upon how many colors/flavors/mixes we want to get in a single product.
e.g., in case of Jellicks or Jelly Ice Lolly (two color product), we use two flavor (three
1. Two freezers are operated with Comet Machine if we need to run a two color cone or cup
and on SL-800, in case of Car and Dasher (two color products), respective two freezers are attached with it.
DESCRIPTION OF SIX
Rollo-1 & 2:
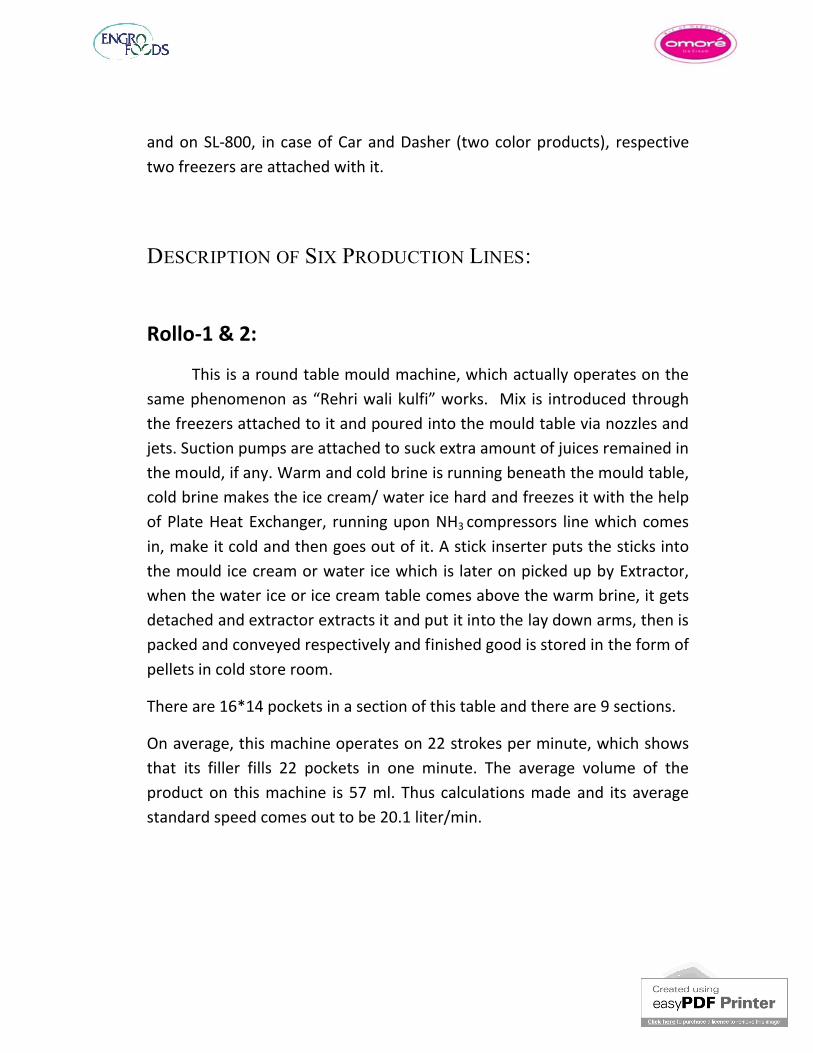
This is a round table mould machine, which actually operates on the same phenomenon as “Rehri wali kulfi” works. Mix is introduced through the freezers attached to it and poured into the mould table via nozzles and jets. Suction pumps are attached to suck extra amount of juices remained in the mould, if any. Warm and cold brine is running beneath the mould table, cold brine makes the ice cream/ water ice hard and freezes itof Plate Heat Exchanger, running upon NHin, make it cold and then goes out of it.the mould ice cream or water ice which is later on picked up by Extractorwhen the water ice or ice cream table comes above the warm brine, it gets detached and extractor extracts it and put it into the lay down arms, then is packed and conveyed respectively and finished good is stored in the form of pellets in cold store room.
There are 16*14 pockets in a section of this table and there are 9 sections.
On average, this machine operates on 22 strokes per minute, which shows that its filler fills 22 pockets in one minute. The average volume of the product on this machine is 57 ml. Thus calculatistandard speed comes out to be 20.1 liter/min.
800, in case of Car and Dasher (two color products), respective two freezers are attached with it.
IX PRODUCTION LINES:
This is a round table mould machine, which actually operates on the same phenomenon as “Rehri wali kulfi” works. Mix is introduced through the freezers attached to it and poured into the mould table via nozzles and jets. Suction pumps are attached to suck extra amount of juices remained in the mould, if any. Warm and cold brine is running beneath the mould table, cold brine makes the ice cream/ water ice hard and freezes it with the help of Plate Heat Exchanger, running upon NH3 compressors line which comes in, make it cold and then goes out of it. A stick inserter puts the sticks into the mould ice cream or water ice which is later on picked up by Extractor
ice or ice cream table comes above the warm brine, it gets detached and extractor extracts it and put it into the lay down arms, then is packed and conveyed respectively and finished good is stored in the form of pellets in cold store room.
pockets in a section of this table and there are 9 sections.
On average, this machine operates on 22 strokes per minute, which shows that its filler fills 22 pockets in one minute. The average volume of the product on this machine is 57 ml. Thus calculations made and its average standard speed comes out to be 20.1 liter/min.
18
800, in case of Car and Dasher (two color products), respective
This is a round table mould machine, which actually operates on the same phenomenon as “Rehri wali kulfi” works. Mix is introduced through the freezers attached to it and poured into the mould table via nozzles and jets. Suction pumps are attached to suck extra amount of juices remained in the mould, if any. Warm and cold brine is running beneath the mould table,
with the help compressors line which comes
A stick inserter puts the sticks into the mould ice cream or water ice which is later on picked up by Extractor,
ice or ice cream table comes above the warm brine, it gets detached and extractor extracts it and put it into the lay down arms, then is packed and conveyed respectively and finished good is stored in the form of
pockets in a section of this table and there are 9 sections.
On average, this machine operates on 22 strokes per minute, which shows that its filler fills 22 pockets in one minute. The average volume of the
ons made and its average
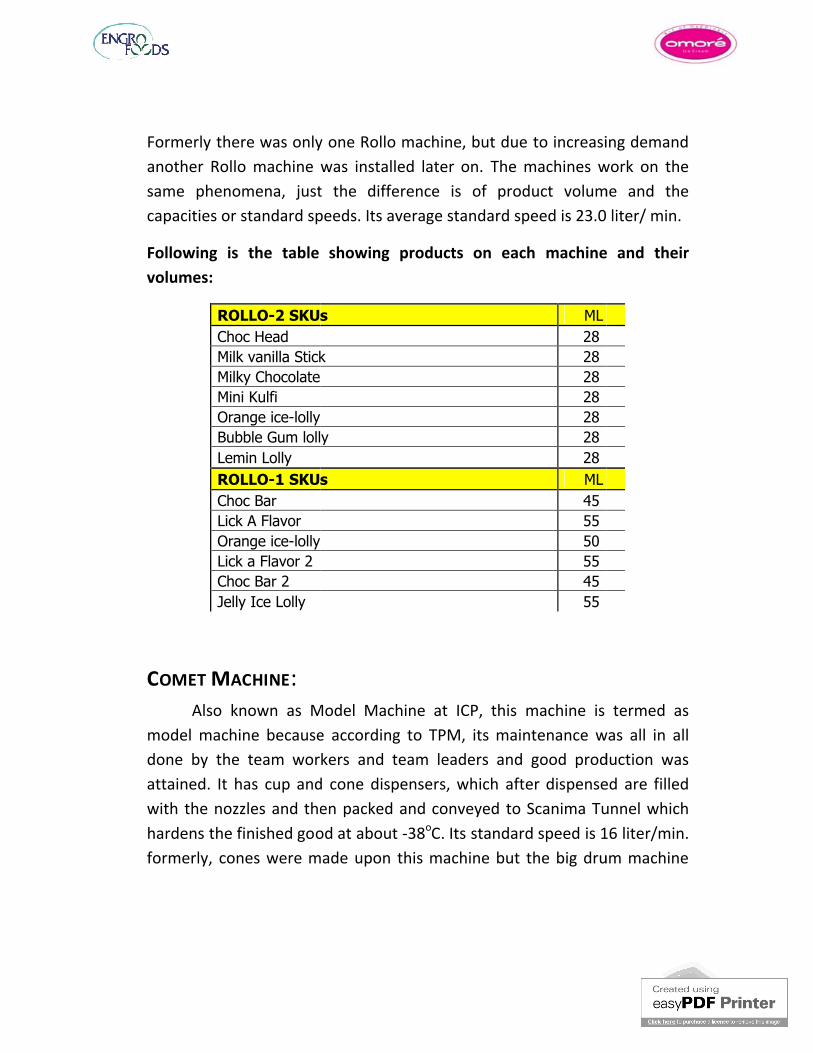
Formerly there was only one Rollo machine, but due to increasing demand another Rollo machine was installed later on. same phenomena, just the difference is ofcapacities or standard speeds. Its average standard speed is 23.0 liter/ min.
Following is the table showing products on each machine and their volumes:
ROLLO-2 SKUsChoc HeadMilk vanilla StickMilky ChocolateMini KulfiOrange ice-lollyBubble Gum lollyLemin LollyROLLO-1 SKUsChoc BarLick A FlavorOrange ice-lollyLick a Flavor 2Choc Bar 2Jelly Ice Lolly
COMET MACHINE:Also known as Model Machine at ICP, this machine is termed as
model machine because done by the team workers and team leaders and good production was attained. It has cup and cone dispensers, which after diswith the nozzles and then packed and conveyedhardens the finished good at about formerly, cones were made upon this machine but the big drum machine
Formerly there was only one Rollo machine, but due to increasing demand another Rollo machine was installed later on. The machines work on the
, just the difference is of product volume and the capacities or standard speeds. Its average standard speed is 23.0 liter/ min.
Following is the table showing products on each machine and their
SKUs ML28
Milk vanilla Stick 28282828
Bubble Gum lolly 2828
SKUs ML455550554555
Also known as Model Machine at ICP, this machine is termed as model machine because according to TPM, its maintenance was all in all done by the team workers and team leaders and good production was attained. It has cup and cone dispensers, which after dispensed are filled with the nozzles and then packed and conveyed to Scanima Tunnel which hardens the finished good at about -38oC. Its standard speed is 16 liter/min.formerly, cones were made upon this machine but the big drum machine
19
Formerly there was only one Rollo machine, but due to increasing demand machines work on the
product volume and the capacities or standard speeds. Its average standard speed is 23.0 liter/ min.
Following is the table showing products on each machine and their
Also known as Model Machine at ICP, this machine is termed as according to TPM, its maintenance was all in all
done by the team workers and team leaders and good production was pensed are filled
to Scanima Tunnel which 16 liter/min.
formerly, cones were made upon this machine but the big drum machine
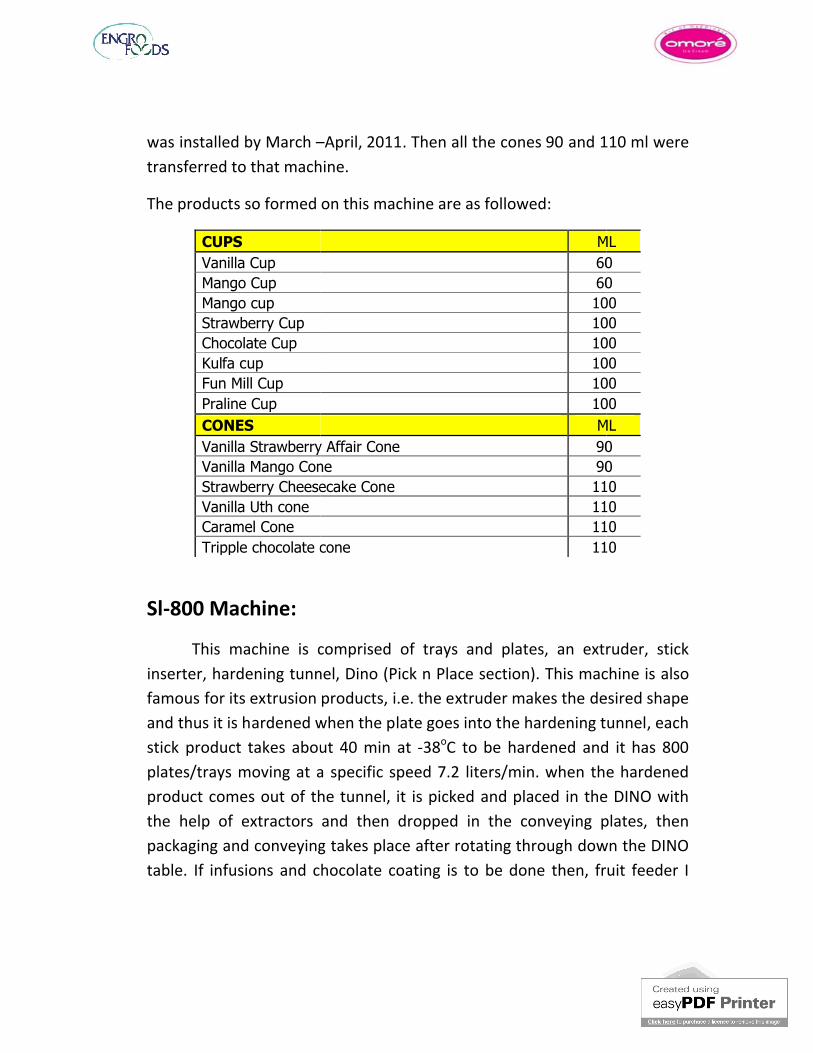
was installed by March –transferred to that machine.
The products so formed on this machine are as followed:
CUPSVanilla CupMango CupMango cupStrawberry CupChocolate CupKulfa cupFun Mill Cup Praline CupCONESVanilla Strawberry Affair ConeVanilla Mango ConeStrawberry Cheesecake ConeVanilla Uth coneCaramel ConeTripple chocolate cone
Sl-800 Machine:
This machine is comprised of trays and plates, an extruder, stick inserter, hardening tunnel, Dino (Pick n Place section). This machine is also famous for its extrusion products, i.e. the extruder makes the desired shape and thus it is hardened when the plstick product takes about 40 min plates/trays moving at a specific speed 7.2 liters/min. when the hardened product comes out of the tunnel, it is picked and placed in the DINO the help of extractors and then dropped in the conveying plates, then packaging and conveying takes place after rotating through down the DINO table. If infusions and chocolate coating is to be done then, fruit feeder I
–April, 2011. Then all the cones 90 and 110 ml were transferred to that machine.
so formed on this machine are as followed:
ML6060100100100100100100ML
Vanilla Strawberry Affair Cone 90Vanilla Mango Cone 90Strawberry Cheesecake Cone 110
110110
Tripple chocolate cone 110
This machine is comprised of trays and plates, an extruder, stick inserter, hardening tunnel, Dino (Pick n Place section). This machine is also famous for its extrusion products, i.e. the extruder makes the desired shape and thus it is hardened when the plate goes into the hardening tunnel, each stick product takes about 40 min at -38oC to be hardened and it has 800 plates/trays moving at a specific speed 7.2 liters/min. when the hardened product comes out of the tunnel, it is picked and placed in the DINO the help of extractors and then dropped in the conveying plates, then packaging and conveying takes place after rotating through down the DINO
If infusions and chocolate coating is to be done then, fruit feeder I
20
April, 2011. Then all the cones 90 and 110 ml were
ML6060100100100100100100ML9090110110110110
This machine is comprised of trays and plates, an extruder, stick inserter, hardening tunnel, Dino (Pick n Place section). This machine is also famous for its extrusion products, i.e. the extruder makes the desired shape
ate goes into the hardening tunnel, each to be hardened and it has 800
plates/trays moving at a specific speed 7.2 liters/min. when the hardened product comes out of the tunnel, it is picked and placed in the DINO with the help of extractors and then dropped in the conveying plates, then packaging and conveying takes place after rotating through down the DINO
If infusions and chocolate coating is to be done then, fruit feeder I
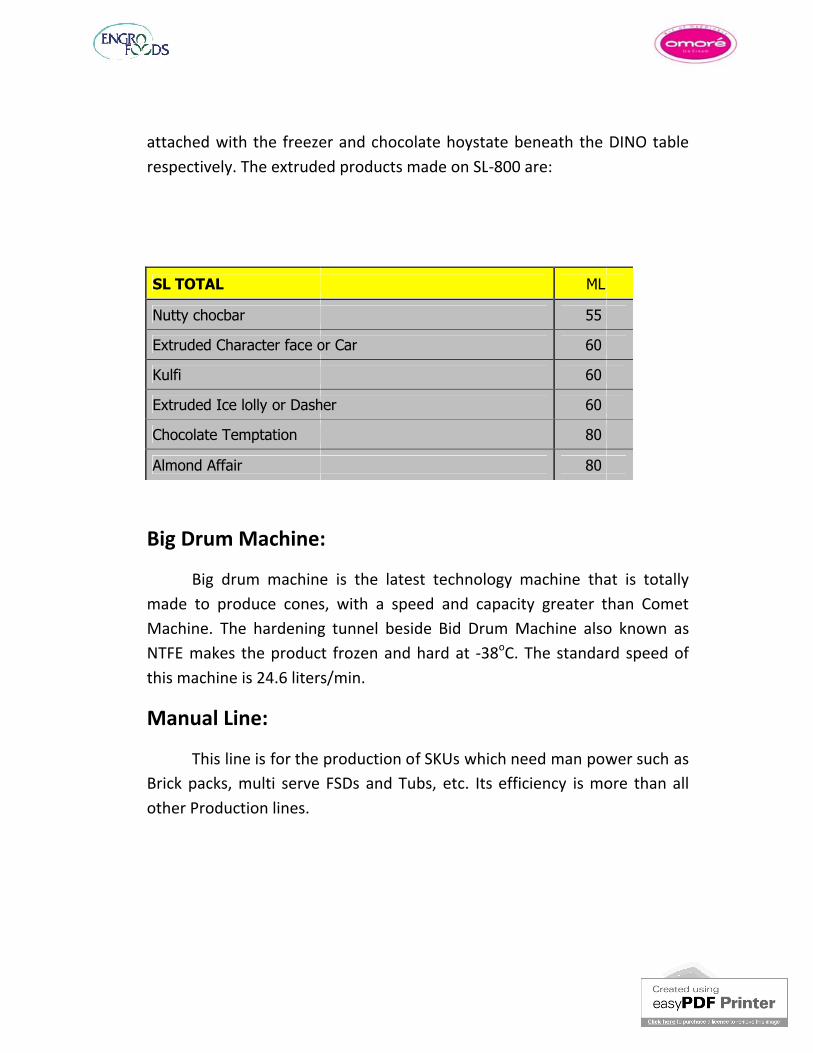
attached with the freezer and crespectively. The extruded products made on SL
SL TOTAL
Nutty chocbar
Extruded Character face or Car
Kulfi
Extruded Ice lolly or Dasher
Chocolate Temptation
Almond Affair
Big Drum Machine:
Big drum machine is the latest technology machine that is totally made to produce cones, with a speed and capacity greater than Comet Machine. The hardening tunnel beside Bid Drum Machine also known as NTFE makes the product frozen and hardthis machine is 24.6 liters/min.
Manual Line:
This line is for the production of SKUs which need man power such as Brick packs, multi serve FSDs and Tubs, etc. Its efficiency is more than all other Production lines.
attached with the freezer and chocolate hoystate beneath the DINO table respectively. The extruded products made on SL-800 are:
ML
55
or Car 60
60
or Dasher 60
80
80
Drum Machine:
Big drum machine is the latest technology machine that is totally made to produce cones, with a speed and capacity greater than Comet Machine. The hardening tunnel beside Bid Drum Machine also known as
makes the product frozen and hard at -38oC. The standard speed of this machine is 24.6 liters/min.
This line is for the production of SKUs which need man power such as Brick packs, multi serve FSDs and Tubs, etc. Its efficiency is more than all
21
the DINO table
Big drum machine is the latest technology machine that is totally made to produce cones, with a speed and capacity greater than Comet Machine. The hardening tunnel beside Bid Drum Machine also known as
standard speed of
This line is for the production of SKUs which need man power such as Brick packs, multi serve FSDs and Tubs, etc. Its efficiency is more than all
FREEZERS AND THEIR CONST
As the freezers are discussed in the previous section, here we shall talk about the constraints regarding these freezers, which affect the plan and production consequently. machines, using all the freezers, which is not possible. Because sometimes we are producing three layer/color products on Rollocone/cup on Comet and 2 color products on SLfreezers get busy and we cannot use the other production lfreezers are utilized in the production at these machines.Sometimes viscosity issues and over run are also seemed to be the constraints in production.
MAINTENANCE ISSUES
Maintenance is of two types at production site:
1. Preventive Maintenance2. Planned Maintenance
The first one may be a part of changeovers or before startup of production to avoid any losses during production.
Second one is planned by keeping in mind all the constraints and production plans.
Maintenance issues are very important OEE is, the better would the plan will work and the production output reliability will be greater and stronger as well.
ZERS AND THEIR CONSTRAINTS:As the freezers are discussed in the previous section, here we shall
talk about the constraints regarding these freezers, which affect the plan and production consequently. If talking about the production on all
all the freezers, which is not possible. Because sometimes we are producing three layer/color products on Rollo-1 and 2 color cone/cup on Comet and 2 color products on SL-800 as well, hence all the freezers get busy and we cannot use the other production lines whose freezers are utilized in the production at these machines.Sometimes viscosity issues and over run are also seemed to be the constraints in production.
SSUES:Maintenance is of two types at production site:
Preventive MaintenancePlanned Maintenance
The first one may be a part of changeovers or before startup of production to avoid any losses during production.
Second one is planned by keeping in mind all the constraints and
Maintenance issues are very important part in calculating OEE. Better the OEE is, the better would the plan will work and the production output reliability will be greater and stronger as well.
22
As the freezers are discussed in the previous section, here we shall talk about the constraints regarding these freezers, which affect the plan
If talking about the production on all all the freezers, which is not possible. Because sometimes
1 and 2 color 800 as well, hence all the
ines whose
Sometimes viscosity issues and over run are also seemed to be the
The first one may be a part of changeovers or before startup of production
Second one is planned by keeping in mind all the constraints and
part in calculating OEE. Better the OEE is, the better would the plan will work and the production output
OVERALL EQUIPMENT
It is the ratio of actual production to standard production and shows the efficiency of a machine that how well does it work in producing the required product. The followings should be taken into account to calculate and enhance OEE:
1. Operating/Total Loading time.2. Downtime Losses (in minutes)
i. Loss due to No ii. Loss due Planned Maintenanceiii. Mix/Batch Availability Lossiv. No Packing Material v. No Raw Materialvi. Management or Line Organizational Lossvii. CIP Time Lossviii. Machine Breakdown Lossix. Changeoversx. Machine Adjustment / Startup Lossxi. Utility Failure
3. Standard Speed of the machine in 4. Utilization (Running) Time in minutes = Loading Time
Downtime Losses5. Standard Production in liters6. Actual Production in liters7. Set Speed (liters/min)8. Set Production (liters/min)9. Speed Rate (%)10.Speed Loss (min)11. Performance Rate (%) = Actual Production/Standard Production12. Performance Losses (min) = (1
QUIPMENT EFFICIENCY:It is the ratio of actual production to standard production and
s the efficiency of a machine that how well does it work in producing . The followings should be taken into account to
calculate and enhance OEE:
Operating/Total Loading time.(in minutes), which include:
Loss due to No Plan availableLoss due Planned MaintenanceMix/Batch Availability LossNo Packing Material No Raw MaterialManagement or Line Organizational LossCIP Time LossMachine Breakdown LossChangeoversMachine Adjustment / Startup LossUtility Failure
Standard Speed of the machine in liters/minUtilization (Running) Time in minutes = Loading Time
Standard Production in litersActual Production in litersSet Speed (liters/min)
(liters/min)
Performance Rate (%) = Actual Production/Standard ProductionPerformance Losses (min) = (1- Performance rate) *Utilization Time
23
It is the ratio of actual production to standard production and s the efficiency of a machine that how well does it work in producing
. The followings should be taken into account to
Utilization (Running) Time in minutes = Loading Time – Total
Performance Rate (%) = Actual Production/Standard ProductionPerformance rate) *Utilization Time
13. Total Losses (min) = Performance Losses + Downtime Losses + Speed Loss
Then OEE is calculated after getting all the reqabout the machine from Log Books or daily production notes.
OEE (%) = Actual Production / (Standard Speed * Loading Time)
Targeted OEE is taken as basis which is usually 80 %
Planned OEE = (Total Volumes per week) / (Rated Capaci
Rated capacity is basically the capacity of the machine (per day).
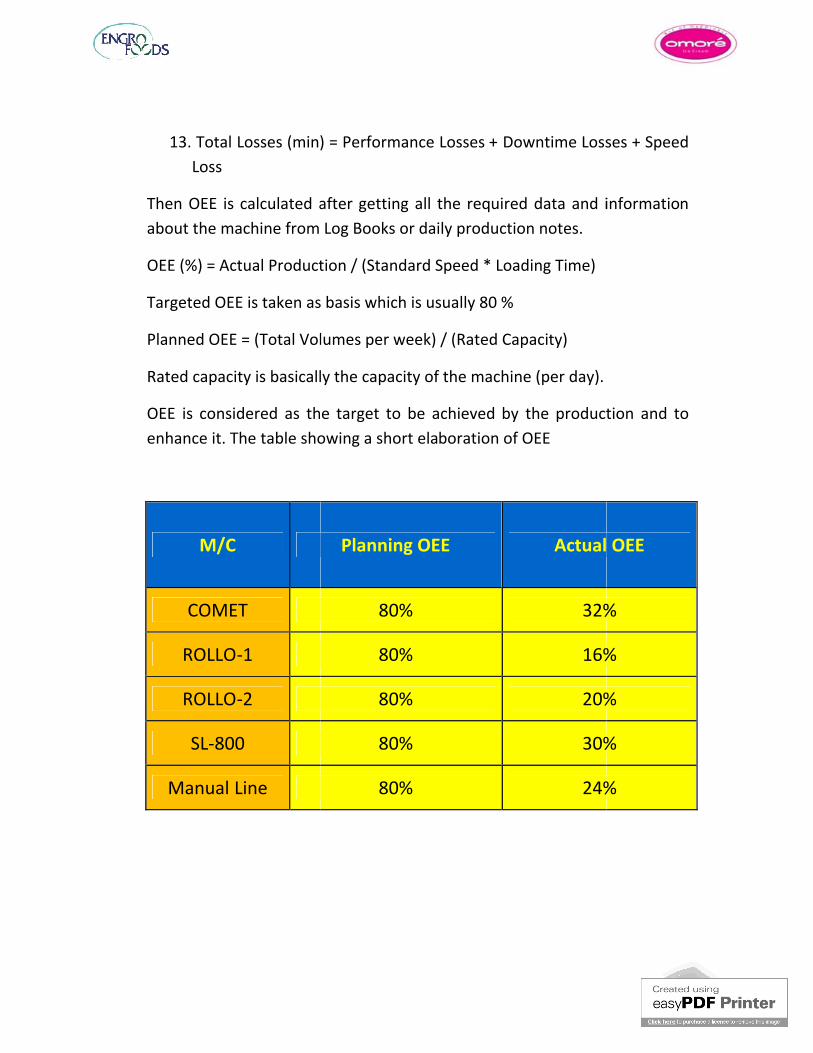
OEE is considered as the target to be achieved by the production and to enhance it. The table showing a short elaboration of OEE
M/C
COMET
ROLLO-1
ROLLO-2
SL-800
Manual Line
Total Losses (min) = Performance Losses + Downtime Losses + Speed
Then OEE is calculated after getting all the required data and information about the machine from Log Books or daily production notes.
OEE (%) = Actual Production / (Standard Speed * Loading Time)
Targeted OEE is taken as basis which is usually 80 %
(Total Volumes per week) / (Rated Capacity)
Rated capacity is basically the capacity of the machine (per day).
OEE is considered as the target to be achieved by the production and to table showing a short elaboration of OEE
Planning OEE Actual OEE
80% 32%
80% 16%
80% 20%
80% 30%
80% 24%
24
Total Losses (min) = Performance Losses + Downtime Losses + Speed
uired data and information
OEE is considered as the target to be achieved by the production and to
Actual OEE
32%
16%
20%
30%
24%
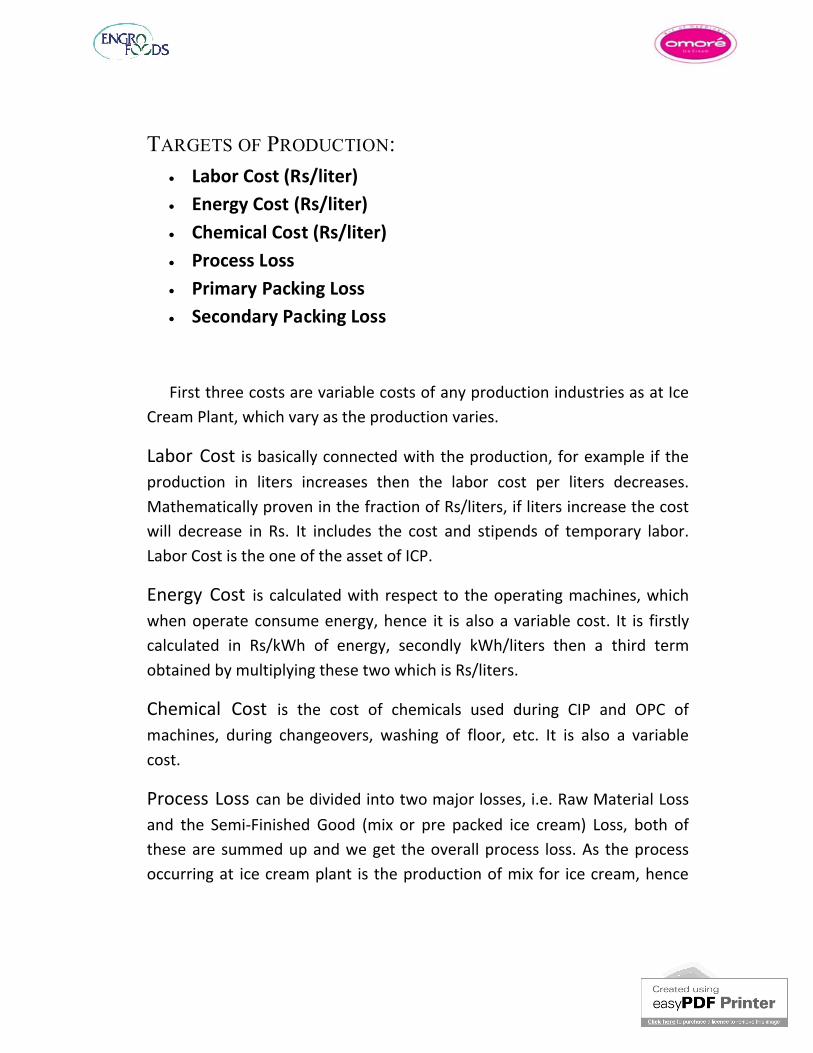
TARGETS OF PRODUCTION
Labor Cost (Rs/liter) Energy Cost (Rs/liter) Chemical Cost (Rs/liter) Process Loss Primary Packing Loss Secondary Packing Los
First three costs are variable costs of Cream Plant, which vary as the production varies
Labor Cost is basically connected with the production, for example if the production in liters increases then the labor cost per liters decreases. Mathematically proven in twill decrease in Rs. It includes the cost and stipends of temporary labor. Labor Cost is the one of the asset of ICP.
Energy Cost is calculated with respect to the operating machines, which when operate consume energy, hence it is also a variable cost. It is firstly calculated in Rs/kWh of energy, secondly kWh/liters then a third term obtained by multiplying these two which is Rs/liters.
Chemical Cost is the cost of chemicals used during CIP and OPC of machines, during changeovers, washing of floor, etc. It is also a variable cost.
Process Loss can be divided into two major losses, i.e. Raw Material Loss and the Semi-Finished Good (mix or pre packed ice cream) Loss, both of these are summed up and we get occurring at ice cream plant is the production of mix for ice cream, hence
RODUCTION:Labor Cost (Rs/liter)Energy Cost (Rs/liter)Chemical Cost (Rs/liter)
Primary Packing LossSecondary Packing Loss
First three costs are variable costs of any production industries as at Ice Cream Plant, which vary as the production varies.
is basically connected with the production, for example if the production in liters increases then the labor cost per liters decreases. Mathematically proven in the fraction of Rs/liters, if liters increase the cost
It includes the cost and stipends of temporary labor. Labor Cost is the one of the asset of ICP.
is calculated with respect to the operating machines, which consume energy, hence it is also a variable cost. It is firstly
calculated in Rs/kWh of energy, secondly kWh/liters then a third term obtained by multiplying these two which is Rs/liters.
is the cost of chemicals used during CIP and OPC of achines, during changeovers, washing of floor, etc. It is also a variable
can be divided into two major losses, i.e. Raw Material Loss Finished Good (mix or pre packed ice cream) Loss, both of
these are summed up and we get the overall process loss. As the process occurring at ice cream plant is the production of mix for ice cream, hence
25
production industries as at Ice
is basically connected with the production, for example if the production in liters increases then the labor cost per liters decreases.
he fraction of Rs/liters, if liters increase the cost It includes the cost and stipends of temporary labor.
is calculated with respect to the operating machines, which consume energy, hence it is also a variable cost. It is firstly
calculated in Rs/kWh of energy, secondly kWh/liters then a third term
is the cost of chemicals used during CIP and OPC of achines, during changeovers, washing of floor, etc. It is also a variable
can be divided into two major losses, i.e. Raw Material Loss Finished Good (mix or pre packed ice cream) Loss, both of
the overall process loss. As the process occurring at ice cream plant is the production of mix for ice cream, hence
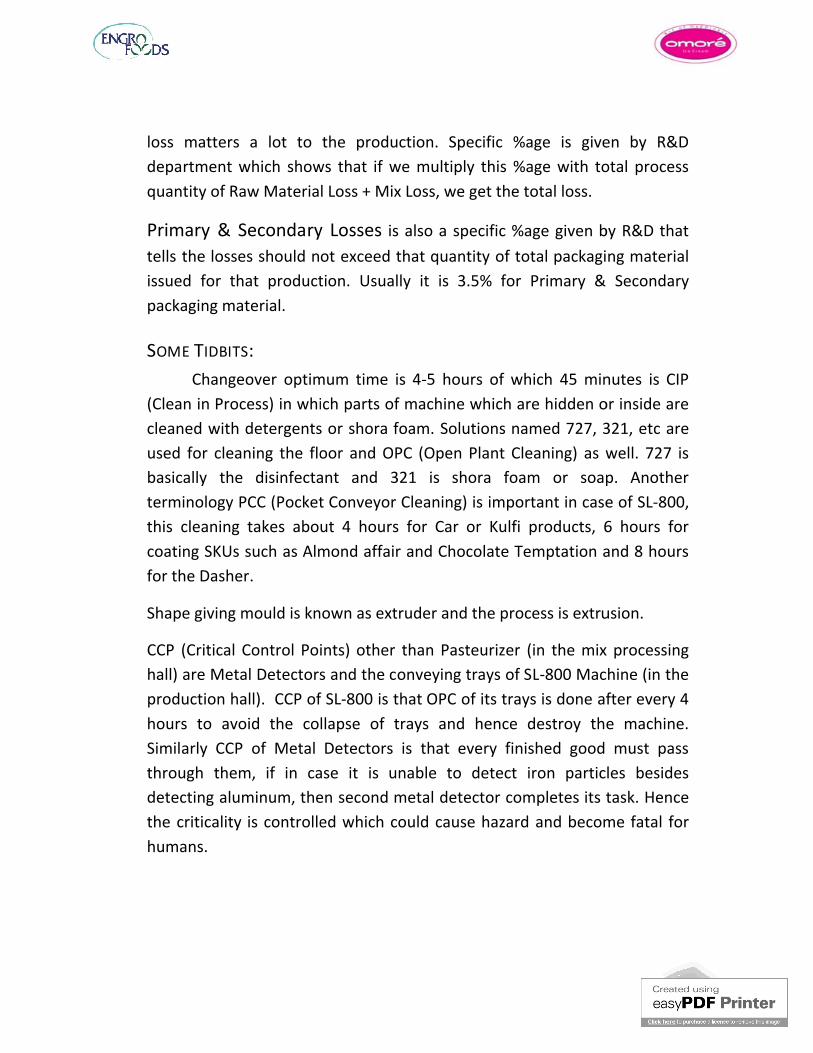
loss matters a lot to the production. Specific %age is given by R&D department which shows that if we multiply this %age with total process quantity of Raw Material Loss + Mix Loss, we get the total loss.
Primary & Secondary Lossestells the losses should not exceed that quantity of total packaging material issued for that production. Usually it is 3.5packaging material.
SOME TIDBITS:Changeover optimum time is 4
(Clean in Process) in which parts of machine which are hidden or inside are cleaned with detergents or shora foam. Solutions named 7used for cleaning the floor and OPC (Open Plant Cleaning) as well. 727 is basically the disinfectant and 321 is shora foam or soap. Another terminology PCC (Pocket Conveyor Cleaning) is important in case of SLthis cleaning takes aboucoating SKUs such as Almond affair and Chocolate Temptation and 8 hours for the Dasher.
Shape giving mould is known as extruder and the process is extrusion.
CCP (Critical Control Points) other than Pasteurihall) are Metal Detectors and the conveying trays of SLproduction hall). CCP of SLhours to avoid the collapse of trays and hence destroy the machine.Similarly CCP of Metal Detectors is that every finished good must pass through them, if in case it is unable to detect iron particles besides detecting aluminum, then second metal detector completes its task. Hence the criticality is controlled which could caushumans.
loss matters a lot to the production. Specific %age is given by R&D rtment which shows that if we multiply this %age with total process
quantity of Raw Material Loss + Mix Loss, we get the total loss.
Primary & Secondary Losses is also a specific %age given by R&D that tells the losses should not exceed that quantity of total packaging material issued for that production. Usually it is 3.5% for Primary & Secondary
Changeover optimum time is 4-5 hours of which 45 minutes is CIP (Clean in Process) in which parts of machine which are hidden or inside are cleaned with detergents or shora foam. Solutions named 727, 321, etc are used for cleaning the floor and OPC (Open Plant Cleaning) as well. 727 is basically the disinfectant and 321 is shora foam or soap. Another terminology PCC (Pocket Conveyor Cleaning) is important in case of SLthis cleaning takes about 4 hours for Car or Kulfi products, 6 hours for coating SKUs such as Almond affair and Chocolate Temptation and 8 hours
Shape giving mould is known as extruder and the process is extrusion.
CCP (Critical Control Points) other than Pasteurizer (in the mix processing hall) are Metal Detectors and the conveying trays of SL-800 Machine (in the production hall). CCP of SL-800 is that OPC of its trays is done after every 4 hours to avoid the collapse of trays and hence destroy the machine.
arly CCP of Metal Detectors is that every finished good must pass through them, if in case it is unable to detect iron particles besides detecting aluminum, then second metal detector completes its task. Hence the criticality is controlled which could cause hazard and become fatal for
26
loss matters a lot to the production. Specific %age is given by R&D rtment which shows that if we multiply this %age with total process
is also a specific %age given by R&D that tells the losses should not exceed that quantity of total packaging material
% for Primary & Secondary
5 hours of which 45 minutes is CIP (Clean in Process) in which parts of machine which are hidden or inside are
27, 321, etc are used for cleaning the floor and OPC (Open Plant Cleaning) as well. 727 is basically the disinfectant and 321 is shora foam or soap. Another terminology PCC (Pocket Conveyor Cleaning) is important in case of SL-800,
t 4 hours for Car or Kulfi products, 6 hours for coating SKUs such as Almond affair and Chocolate Temptation and 8 hours
Shape giving mould is known as extruder and the process is extrusion.
zer (in the mix processing 800 Machine (in the
800 is that OPC of its trays is done after every 4 hours to avoid the collapse of trays and hence destroy the machine.
arly CCP of Metal Detectors is that every finished good must pass through them, if in case it is unable to detect iron particles besides detecting aluminum, then second metal detector completes its task. Hence
e hazard and become fatal for
ENGRO FOODS SUPPLY
SUPPLY CHAIN OA supply chain is a network of the entities
companies—involved in producing,Each entity is a link in the movement of a product from its rawstage to its consumption by the customer. A typical supply chain has the following entities:
The manufacturer's suppliers The manufacturer Transportation and logistics companies Distribution centers Customers
We often hear an entity inside supply chain, but outside called a partner, or a trading partner. For example, a supplier that provides materials to a manufacturer could be itshas three main functions:
Procurement – Manufacturing Fulfillment – delivering (moving and storing) the product
Supply chain planning integrates the functions both operationally (daily activities) and strategicallyparticipants and overlapping functions, the planning processactivity seamless to customers.
UPPLY CHAIN LIMITED:
OVERVIEW
A supply chain is a network of the entities—within and across involved in producing, shipping, and distributing products.
the movement of a product from its rawstage to its consumption by the customer. A typical supply chain has the
The manufacturer's suppliers
Transportation and logistics companiesDistribution centers
often hear an entity inside supply chain, but outside our company, a trading partner. For example, a supplier that provides
materials to a manufacturer could be its partner. Our typical supply chain has three main functions:
– buying materials to support a manufacturerManufacturing – making the product
delivering (moving and storing) the product
Supply chain planning integrates the functions both operationally (daily activities) and strategically (long-term planning). Despite multiple participants and overlapping functions, the planning process makes all this activity seamless to customers.
27
within and across shipping, and distributing products.
the movement of a product from its raw materials stage to its consumption by the customer. A typical supply chain has the
our company, a trading partner. For example, a supplier that provides
ur typical supply chain
buying materials to support a manufacturer
delivering (moving and storing) the product
Supply chain planning integrates the functions both operationally rm planning). Despite multiple
akes all this
F.M.C.G:The basic theme of SUPPLY CHAIN is FMCG i
Good. Four steps lead to the accomplishmMarketing or Sales department in Supply chain, and they are:
Plan
Make
Source
Deliver
BUSINESS / ORGANIZATIONAL
The basic four steps are taken to build, expand and then to be called organizations are:
EntrepreneurshipCollecting/ gatheringExpansion (Spreading)No more penetration
It can explained such that, the idea is presented at the start to build an organization and then people nodding in positive response to that idea and agreeing to it are gathered and collected idea and the people expand the setup with commitments and make the demand of their organization in the market accomplished.
After some years passed and expansions done, setup need to stop its penetration of the business knowmarket and need no more expansion or to penetrate.
The basic theme of SUPPLY CHAIN is FMCG i.e., Fast Moving Consumers Four steps lead to the accomplishment of the tasks assigned by
Marketing or Sales department in Supply chain, and they are:
RGANIZATIONAL SETUP:The basic four steps are taken to build, expand and then to be called
Expansion (Spreading)
It can explained such that, the idea is presented at the start to build an organization and then people nodding in positive response to that idea and agreeing to it are gathered and collected at a common place. Later on the idea and the people expand the setup with commitments and make the demand of their organization in the market accomplished.
After some years passed and expansions done, setup need to stop its penetration of the business knowing that it is fully fledged settled in the market and need no more expansion or to penetrate.
28
.e., Fast Moving Consumers ent of the tasks assigned by
The basic four steps are taken to build, expand and then to be called
It can explained such that, the idea is presented at the start to build an organization and then people nodding in positive response to that idea and
at a common place. Later on the idea and the people expand the setup with commitments and make the
After some years passed and expansions done, setup need to stop its ing that it is fully fledged settled in the
SUPPLY CHAIN PLANNING
Companies manage their supply chains by linking all the entities via a common planning process. Aintegrates, the functions performed within and across
Buying materials:manufacturing requirements.
Making the product:manufacture the product to meet plan and actual customer demand.
Moving the product:distribution centers and customers.
Storing the product:maintained to meet actual customer demand.
Delivering the product:want, how much and when.
Supply chain planning (SCP) matches supply and demand:
The right product At the right time At the right place Delivered to the right customer At the lowest total cost With the best possible return on asset investment
Supply chain planning (SCP) grouped into four main
a. Demandb. Supplyc. Productiond. Fulfillment
LANNING:Companies manage their supply chains by linking all the entities via a
common planning process. A common planning process aligns, or rates, the functions performed within and across companies
Buying materials: Plan what materials will be required to meet manufacturing requirements.Making the product: Plan where, when and how to manufacture the product to meet plan and actual customer
Moving the product: Plan how to distribute the product to distribution centers and customers.Storing the product: Plan how much inventory should be maintained to meet actual customer demand.Delivering the product: Plan and project what customers want, how much and when.
chain planning (SCP) matches supply and demand:
Delivered to the right customerAt the lowest total costWith the best possible return on asset investment
pply chain planning (SCP) grouped into four main planning processes:
29
Companies manage their supply chains by linking all the entities via a common planning process aligns, or
companies.
Plan what materials will be required to meet
Plan where, when and how to manufacture the product to meet plan and actual customer
Plan how to distribute the product to
Plan how much inventory should be
Plan and project what customers will
planning processes:
TYPES OF PLANNING
Production Planning
I. To plan what materials will be required to meet manufacturing requirements.
II. To plan how to manufacture the customer demand.
Supply Planning
I. To plan where to manufacture the product to meet actual customer demand.
II. To plan when to manufacture the product to meet actual customer demand.
III. To plan how to distribute the product to distribution cand customers.
IV. To plan how much inventory should be maintained to meet customer demand.
Demand Planning
I. To plan and project what customers will want, how much and when.
Fulfillment Planning
I. To plan what inventory or capacity is used to fulfill orderII. To plan how to transport or deliver product throughout the
supply chain.
LANNING:
lan what materials will be required to meet manufacturing requirements.
lan how to manufacture the product to meet actual customer demand.
lan where to manufacture the product to meet actual customer demand.
lan when to manufacture the product to meet actual customer demand.
lan how to distribute the product to distribution c
lan how much inventory should be maintained to meet customer demand.
lan and project what customers will want, how much
lan what inventory or capacity is used to fulfill orderlan how to transport or deliver product throughout the
30
lan what materials will be required to meet
product to meet actual
lan where to manufacture the product to meet actual
lan when to manufacture the product to meet actual
lan how to distribute the product to distribution centers
lan how much inventory should be maintained to meet
lan and project what customers will want, how much
lan what inventory or capacity is used to fulfill order.lan how to transport or deliver product throughout the
DEMAND PLANNING
The first step and a key input in the SCP prus forecast the following:
o What customers will wanto How much they will wanto When they will want it
With demand planning, wecompany. To achieve a single view of demand, companies must develop one or more of the following
Statistical Forecasting
Use historical data and other factors, sustatistical forecast.
Multidimensional View of Data
Allow views of demand from different perspectives. The sales manager for the Northern region, forhis region only. He then wants tocustomers. The Chief Operating Officer, on the other hand, is interested incomparing this quarter's total demand with that of the last six quarters.
Product Life Cycle Planning
Analyze and adjust demand forecasts for change across its life cycle. ForBut, if demand then falls off sharply when a competitor introduces a extruded product.
LANNING:
The first step and a key input in the SCP process, demand planning helps forecast the following:
customers will wantmuch they will want
will want it
With demand planning, we create a single view of demand across the To achieve a single view of demand, companies must develop
one or more of the following capabilities:
Statistical Forecasting
Use historical data and other factors, such as seasonality, to create a
Multidimensional View of Data
Allow views of demand from different perspectives. The sales manager region, for example, wants to see customer de
then wants to see demand for just her five largest customers. The Chief Operating Officer, on the other hand, is interested incomparing this quarter's total demand with that of the last six quarters.
Product Life Cycle Planning
Analyze and adjust demand forecasts for a product as its patterns change across its life cycle. For example, SL-800 SKUs have heavy de
falls off sharply when a competitor introduces a
31
ocess, demand planning helps
single view of demand across the To achieve a single view of demand, companies must develop
ch as seasonality, to create a
Allow views of demand from different perspectives. The sales manager example, wants to see customer demand for
her five largest customers. The Chief Operating Officer, on the other hand, is interested incomparing this quarter's total demand with that of the last six quarters.
a product as its patterns heavy demand.
falls off sharply when a competitor introduces a newer
Promotion Planning
Fully utilize available information on promcan affect demand forecasts.
Exception Management
Manage plans by resolving any variances to those plans.
SUPPLY PLANNING
Once we forecast demand, and time to meet that demand. The this through the following types of plans:
a. Inventory Plan – To dfinished goods to hold and
b. Distribution Plan –this inventory
c. Sourcing Plan –manufacture it
d. Materials Plan – To d
SUPPLY PLANNING CONSTRAINTS
Every company is restricted in some ways in its deliver goods. This conceptplanning process. For something to qualify as adefinable in terms of a resourcemanufacturing, labor—and aaddressed and is no longer an issue.
Fully utilize available information on promotions, prices, and events that affect demand forecasts.
Exception Management
Manage plans by resolving any variances to those plans.
LANNING:
forecast demand, we need enough supply at the right place demand. The supply planning process helps
this through the following types of plans:
To determine and plan for how much inventory or finished goods to hold and where to place the inventory
– To determine how, when, and where to replenish
To plan what product, and when and where to
To determine what materials are needed and when
ONSTRAINTS:Every company is restricted in some ways in its ability to produce and
deliver goods. This concept called "constraints" is central to the supply planning process. For something to qualify as a constraint, it must be definable in terms of a resource—for example, transportation,
and a given time period. Eventually, a constraint is addressed and is no longer an issue.
32
ns, prices, and events that
need enough supply at the right place supply planning process helps us do
etermine and plan for how much inventory or
and where to replenish
lan what product, and when and where to
etermine what materials are needed and when.
ability to produce and called "constraints" is central to the supply
constraint, it must be for example, transportation,
given time period. Eventually, a constraint is
Constraints can take several forms. For example:
i. A manufacturing line can run at a certain rate. This is its capacity constraint.
ii. The number of outersSKUs the line can produce. This is both a materials constraint for the manufacturer and a capacity constraint for the fender supplier.
iii. How fast the product can be transported over a given period is limited. Any plan must conside
To manage constraints and achieve supplycompanies must develop supplyfollowing:
Set inventory targets
Determine the amount of inventory buffer required to meet slevel targets.
Define distribution approach
Determine which locations fill which customer orders.
Determine net finished goods requirements
Decide what finished goods to produce (or purchase) and what materials are required based on
Determine optimal sourcing
Specify which plant will manufacture a product and to which distribution center to route it.
Constraints can take several forms. For example:
A manufacturing line can run at a certain rate. This is its capacity
outers available from a supplier limits the number of the line can produce. This is both a materials constraint for the
manufacturer and a capacity constraint for the fender supplier.How fast the product can be transported over a given period is limited. Any plan must consider transportation constraints.
To manage constraints and achieve supply-planning objectives, companies must develop supply planning capabilities. These include the
Determine the amount of inventory buffer required to meet s
Define distribution approach
Determine which locations fill which customer orders.
Determine net finished goods requirements
Decide what finished goods to produce (or purchase) and what materials are required based on current inventory levels and targets.
Determine optimal sourcing
Specify which plant will manufacture a product and to which distribution center to route it.
33
A manufacturing line can run at a certain rate. This is its capacity
pplier limits the number of the line can produce. This is both a materials constraint for the
manufacturer and a capacity constraint for the fender supplier.How fast the product can be transported over a given period is
r transportation constraints.
planning objectives, capabilities. These include the
Determine the amount of inventory buffer required to meet service
Decide what finished goods to produce (or purchase) and what inventory levels and targets.
Specify which plant will manufacture a product and to which
Manage exceptions
Support manufacturing decisionsproduct will be prebuilt or if the
Monitor and track inventory
Set acceptable ranges and ensure that inventthem.
PRODUCTION PLANNING
Once you have demand and supply plans, the next step is to plan how to manufacture the product.
Production planning has two components:
o Production Schedule machines), and the sequence/timing of the manufacturing operations.
o Detailed Materials Plan materials or subcomponents) to meet manufacturing requirements. For example, while the Materials Plan (from supply plannspecify "1000 liters Kulfi 60 mlapproximately 17 wrappers
Support manufacturing decisions—for example, determine if the or if the order will be satisfied late.
Monitor and track inventory
acceptable ranges and ensure that inventory is maintained within
LANNING:Once you have demand and supply plans, the next step is to plan how
product.
Production planning has two components:
Production Schedule – Determine the resources required (labor and machines), and the sequence/timing of the manufacturing
Detailed Materials Plan – Identify the materials needed (raw subcomponents) to meet manufacturing requirements.
For example, while the Materials Plan (from supply plannspecify "1000 liters Kulfi 60 ml" this detailed plan specifies approximately 17 wrappers, 17 sticks, and so on.
34
for example, determine if the
ory is maintained within
Once you have demand and supply plans, the next step is to plan how
Determine the resources required (labor and machines), and the sequence/timing of the manufacturing
Identify the materials needed (raw subcomponents) to meet manufacturing requirements.
For example, while the Materials Plan (from supply planning) may " this detailed plan specifies
PRODUCTION PLANNING
As in supply planning, production planning has constraints. For example, the production schedule is constrained by the maximum of items a machine can produce per hour week a machine is set to runproduction plan. This differs from supply planning constraints in the level of detail: a supply planning constraint is the daily production line. A production planning constraint is the rate of operation for station on that line.
To manage constraints and achieve productioncompanies must developthe following:
Schedule production activities
Determine what operations will be performed on whichtimes, or in what order.
Define net material requirements
Specify required materials for manufacturing, taking into account the current raw materials inventory.
Recommend purchase orders
Communicate required materials to the purchasing de
Manage exceptions
Balance resource and material constraints.
LANNING CONSTRAINTS:As in supply planning, production planning has constraints. For
example, the production schedule is constrained by the maximum of items a machine can produce per hour or by the number of times per week a machine is set to run. Constraints on materials also affect the production plan. This differs from supply planning constraints in the level of
a supply planning constraint is the daily production capacity of one . A production planning constraint is the rate of operation for
To manage constraints and achieve production-planning objectives, companies must develop Production-planning capabilities. These include
Schedule production activities
Determine what operations will be performed on which machines at what
Define net material requirements
Specify required materials for manufacturing, taking into account the current raw materials inventory.
Recommend purchase orders
Communicate required materials to the purchasing department.
Balance resource and material constraints.
35
As in supply planning, production planning has constraints. For example, the production schedule is constrained by the maximum number
number of times per materials also affect the
production plan. This differs from supply planning constraints in the level of capacity of one
. A production planning constraint is the rate of operation for one
planning objectives, planning capabilities. These include
machines at what
Specify required materials for manufacturing, taking into account the
INVENTORY HANDLING IN
SAP encounters with till ordering, receiving and then to finished goods production.
Purchase requisition is done with the help of SAP, keeping in view the BOM of required product to produce a specified plan to raise the MRP. Purchase department is responsible for the delivery and receiving of those inventory levels, whether Raw Materials
Cycle Count is the assessment of system and the actual production floor materials quantities. For example, if the raw materials consumed in making a batch of the mix for the ice cream is system tells us that it was 8000kg, then we may have a loss on our production floor, hence to reduce that loss and to cover some production losses of mix in ice cream handling, we produce more mix otherwise it is a gain.
There is a term output reliability or reliability anaas the reliability of production upon the plan and vice versa. Planner keeping in view all the facts and figures, constraints and other a healthy and suitable plan so that it could work and fulfill demands but production does produces exceeds the plan, in both the cases output reliability is less.
NVENTORY HANDLING IN SYSTEM (SAP):SAP encounters with the entire inventory from purchase requisition
receiving and then to finished goods production.
Purchase requisition is done with the help of SAP, keeping in view the BOM of required product to produce a specified plan to raise the MRP. Purchase department is responsible for the delivery and receiving of those inventory levels, whether Raw Materials or Packaging Materials.
Cycle Count is the assessment of system and the actual production floor materials quantities. For example, if the raw materials consumed in making a batch of the mix for the ice cream is 10000kg per month but the
at it was 8000kg, then we may have a loss on our production floor, hence to reduce that loss and to cover some production losses of mix in ice cream handling, we produce more mix otherwise it is a
There is a term output reliability or reliability analysis, i.e. as the reliability of production upon the plan and vice versa. Planner keeping in view all the facts and figures, constraints and other issuesa healthy and suitable plan so that it could work and fulfill demands but
n does produces up to the mark or on the other hand production exceeds the plan, in both the cases output reliability is less.
36
inventory from purchase requisition
Purchase requisition is done with the help of SAP, keeping in view the BOM of required product to produce a specified plan to raise the MRP. Purchase department is responsible for the delivery and receiving of those
or Packaging Materials.
Cycle Count is the assessment of system and the actual production floor materials quantities. For example, if the raw materials consumed in
10000kg per month but the at it was 8000kg, then we may have a loss on our
production floor, hence to reduce that loss and to cover some production losses of mix in ice cream handling, we produce more mix otherwise it is a
lysis, i.e. referred toas the reliability of production upon the plan and vice versa. Planner
issues makes a healthy and suitable plan so that it could work and fulfill demands but
the mark or on the other hand production
ROLE OF MARKETING
OUTSIDE SUPPLY CBrands play an important role in the marketing department. As
decide ups and downs of seasonal changes and innovative products to attract the customer. They play with the innovations and new ideas just to increase the sale and make all in all “a profitable game” for the company.
Sometimes they increase the volamount but price by a contribution margin per product and get the desired profit. Similarly, sometimes they decide (in cocheaper raw material would be suitable for the product or not. For examplSMP (Skim Milk Powder) cost Rs. 340/kg replaced by NOLLIBEL cost Rs. 160/kg does not alter the product quality to a greater extent. Hence it is used instead or another one replacer Malto Dextrin (Rs. 100/kg).
CENTRAL LOCATING
product Sales department put the following product on their core retailing/ consumer units for free price and try to get answers (results) from the people, whether the product with cheaper RM is good enough or not. If the margin is negligible then the cheaper RM product is preferred.
Contribution Margin is calculated as followed:
1. Production Cost2. Selling Price3. Take their difference4. Now take the ratio of difference and Selling Price, we shall get
the contribution margin.
ARKETING, BRANDS AND FINANCE IN OR
CHAIN:Brands play an important role in the marketing department. As
decide ups and downs of seasonal changes and innovative products to attract the customer. They play with the innovations and new ideas just to increase the sale and make all in all “a profitable game” for the company.
Sometimes they increase the volume of a single SKU by a smaller amount but price by a contribution margin per product and get the desired
Similarly, sometimes they decide (in co-ordination with R&D) that a cheaper raw material would be suitable for the product or not. For examplSMP (Skim Milk Powder) cost Rs. 340/kg replaced by NOLLIBEL cost Rs.
does not alter the product quality to a greater extent. Hence it is used instead or another one replacer Malto Dextrin (Rs. 100/kg).
OCATING TESTING: To check out the quality of that product Sales department put the following product on their core retailing/ consumer units for free price and try to get answers (results) from the people, whether the product with cheaper RM is good enough or not. If the
then the cheaper RM product is preferred.
Contribution Margin is calculated as followed:
Production CostSelling PriceTake their differenceNow take the ratio of difference and Selling Price, we shall get the contribution margin.
37
INANCE IN OR
Brands play an important role in the marketing department. As they decide ups and downs of seasonal changes and innovative products to attract the customer. They play with the innovations and new ideas just to increase the sale and make all in all “a profitable game” for the company.
ume of a single SKU by a smaller amount but price by a contribution margin per product and get the desired
ordination with R&D) that a cheaper raw material would be suitable for the product or not. For example SMP (Skim Milk Powder) cost Rs. 340/kg replaced by NOLLIBEL cost Rs.
does not alter the product quality to a greater extent. Hence it is
ality of that product Sales department put the following product on their core retailing/ consumer units for free price and try to get answers (results) from the people, whether the product with cheaper RM is good enough or not. If the
Now take the ratio of difference and Selling Price, we shall get
FINANCE:The department which controls the assets of an organization and
deals with the budgeting and financing.
It actually gathers month on month numbers from sales department in the form of volumes (in liters). Then the Production, Utility, Warehouse, Planning, Marketing, etc. present their budget comprising of all fixed and variable costs of the year. Management Committee presents all these costs, budgets and profit margins in front of Finance, hence they work it on.
VMI IMPLEMENTATION
VMI stands for Vendor Managed Inventory, in which the whole inventory is managed and back to back provided by the vendor which is a contract based relation, either for a season or may be a year.
It is only implemented where the process is continuous and traw material is needed everyday as in Dairy Production or Fertilizer Plants.
In ice cream, VMI was implemented for outers, sticks & wrappers (packaging material) but due to different items “Periodic Review of Inventory” was implemented then.
VMI is very good for the vendor in perspective of a very good business. Because it gets the whole money and payment at once in the start, no matter the prices fluctuate in the market for a prethe purchaser.
VMI, in a continuous production vto review their inventory itself.
t which controls the assets of an organization and deals with the budgeting and financing.
It actually gathers month on month numbers from sales department in the form of volumes (in liters). Then the all other departments including
Warehouse, Planning, Marketing, etc. present their budget comprising of all fixed and variable costs of the year. Management Committee presents all these costs, budgets and profit margins in front of Finance, hence they work it on.
MPLEMENTATION:VMI stands for Vendor Managed Inventory, in which the whole
inventory is managed and back to back provided by the vendor which is a contract based relation, either for a season or may be a year.
It is only implemented where the process is continuous and traw material is needed everyday as in Dairy Production or Fertilizer Plants.
In ice cream, VMI was implemented for outers, sticks & wrappers but due to different items “Periodic Review of
Inventory” was implemented then.
is very good for the vendor in perspective of a very good business. Because it gets the whole money and payment at once in the start, no matter the prices fluctuate in the market for a pre-paid material by
VMI, in a continuous production very helpful cause they don’t need to review their inventory on the daily basis which is done by the vendor
38
t which controls the assets of an organization and
It actually gathers month on month numbers from sales department all other departments including
Warehouse, Planning, Marketing, etc. present their budget comprising of all fixed and variable costs of the year. Management Committee presents all these costs, budgets and profit margins in front of
VMI stands for Vendor Managed Inventory, in which the whole inventory is managed and back to back provided by the vendor which is a
It is only implemented where the process is continuous and the same raw material is needed everyday as in Dairy Production or Fertilizer Plants.
In ice cream, VMI was implemented for outers, sticks & wrappers but due to different items “Periodic Review of
is very good for the vendor in perspective of a very good business. Because it gets the whole money and payment at once in the
paid material by
ery helpful cause they don’t need on the daily basis which is done by the vendor
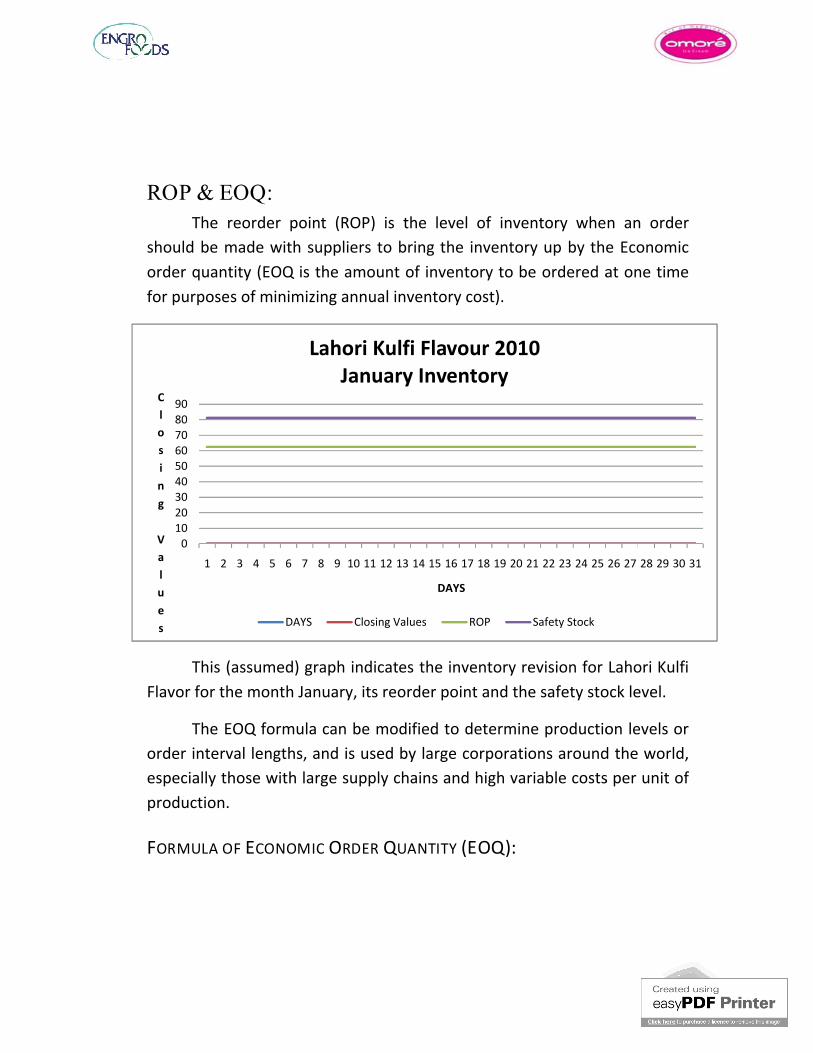
0102030405060708090
1 2 3 4 5 6 7 8
Closing
Values
Lahori Kulfi Flavour 2010
DAYS
ROP & EOQ:The reorder point (ROP
should be made with suppliers to bring the inventory up by the order quantity (EOQ is the amount of inventory to be ordered at one time for purposes of minimizing annual inventory cost
This (assumed) graph indicates the inventory revision for Lahori Kulfi Flavor for the month January, its reorder point and the safety stock level.
The EOQ formula can be modified to determine production order interval lengths, and is used by large corporations around the world, especially those with large supply chains and high variable costs per unit of production.
FORMULA OF ECONOMIC
8 9 10 11 12 13 14 15 16 17 18 19 20 21 22 23 24 25
DAYS
Lahori Kulfi Flavour 2010January Inventory
Closing Values ROP Safety Stock
The reorder point (ROP) is the level of inventory when an orshould be made with suppliers to bring the inventory up by the
is the amount of inventory to be ordered at one time inimizing annual inventory cost).
This (assumed) graph indicates the inventory revision for Lahori Kulfi Flavor for the month January, its reorder point and the safety stock level.
The EOQ formula can be modified to determine production order interval lengths, and is used by large corporations around the world, especially those with large supply chains and high variable costs per unit of
CONOMIC ORDER QUANTITY (EOQ):
39
26 27 28 29 30 31
when an order should be made with suppliers to bring the inventory up by the Economic
is the amount of inventory to be ordered at one time
This (assumed) graph indicates the inventory revision for Lahori Kulfi Flavor for the month January, its reorder point and the safety stock level.
The EOQ formula can be modified to determine production levels or order interval lengths, and is used by large corporations around the world, especially those with large supply chains and high variable costs per unit of
The different formulas have been deveeconomic order quantity (EOQ). The following formula is usually used for the calculation of EOQ.
A = Demand for the year
Cp = Cost to place a single order
Ch = Cost to hold one unit inventory for a year
* = ×
CONTINUOUS REVIEW SYSTEM
The reorder point for replenishment of stock occurs when the level of inventory drops down to zero. In view of instantaneous replenishment of stock the level of inventory jumps to the original level from zero level.
In real life situations one never encounters a zero always a time lag from the date of placing an order for materiadate on which materials are received. As a result the reorder point is always higher than zero, and if the firm places the order when the inventory reaches the reorder point, the new goods will arrive before the firm runs out of goods to sell. The decision on how much stock to hold is generally referred to as the order point problem, that is, how low should the inventory be depleted before it is reordered.
The different formulas have been developed for the calculation of economic order quantity (EOQ). The following formula is usually used for
Demand for the year
Cost to place a single order
Cost to hold one unit inventory for a year
YSTEM
The reorder point for replenishment of stock occurs when the level of drops down to zero. In view of instantaneous replenishment of
ventory jumps to the original level from zero level.
In real life situations one never encounters a zero lead timealways a time lag from the date of placing an order for materiadate on which materials are received. As a result the reorder point is always higher than zero, and if the firm places the order when the inventory reaches the reorder point, the new goods will arrive before the firm runs
e decision on how much stock to hold is generally referred to as the order point problem, that is, how low should the inventory be depleted before it is reordered.
40
loped for the calculation of economic order quantity (EOQ). The following formula is usually used for
The reorder point for replenishment of stock occurs when the level of drops down to zero. In view of instantaneous replenishment of
ventory jumps to the original level from zero level.
lead time. There is always a time lag from the date of placing an order for material and the date on which materials are received. As a result the reorder point is always higher than zero, and if the firm places the order when the inventory reaches the reorder point, the new goods will arrive before the firm runs
e decision on how much stock to hold is generally referred to as the order point problem, that is, how low should the
The two factors that determine the appropriate order point are
o The delivery time stock whicthe lead time (i.e., the difference between the order date and the receipt of the inventory ordered)
o The safety stockheld as a protection against shortages due to fluctuations in demand.
Therefore:
Reorder Point = Normal consumption during lead
Several factors determine how much delivery time stock and stock should be held. In summary, the efficiency of a replenishment system affects how much delivery time is needed. Since the delivery time stock is the expected inventory usage between ordering and receiving inventory, efficient replenishment of itime stock. And the determination of level of safety stock involves a basic trade-off between the risk of dissatisfaction and lost sales, and the increased costs associated with carrying additional inventory.
Another method of calculating reorder level involves the calculation of usage rate per day, lead time which is the amount of time between placing an order and receiving the goods and the safety stock level expressed in terms of several days' sales.
Reorder level = Average daily usage rate x lead
From the above formula it can be easily deduced that an order for replenishment of materials beadequate to meet the needs of production during lead
The two factors that determine the appropriate order point are
The delivery time stock which is the Inventory needed during the lead time (i.e., the difference between the order date and the receipt of the inventory ordered)
safety stock which is the minimum level of inventory that is held as a protection against shortages due to fluctuations in
Reorder Point = Normal consumption during lead-time + Safety Stock
Several factors determine how much delivery time stock and stock should be held. In summary, the efficiency of a replenishment system affects how much delivery time is needed. Since the delivery time stock is the expected inventory usage between ordering and receiving inventory, efficient replenishment of inventory would reduce the need for delivery time stock. And the determination of level of safety stock involves a basic
off between the risk of stock out, resulting in possible customedissatisfaction and lost sales, and the increased costs associated with carrying additional inventory.
Another method of calculating reorder level involves the calculation of usage rate per day, lead time which is the amount of time between
order and receiving the goods and the safety stock level expressed in terms of several days' sales.
Reorder level = Average daily usage rate x lead-time in days
From the above formula it can be easily deduced that an order for replenishment of materials be made when the level of inventory is just adequate to meet the needs of production during lead-time.
41
The two factors that determine the appropriate order point are:
h is the Inventory needed during the lead time (i.e., the difference between the order date and
which is the minimum level of inventory that is held as a protection against shortages due to fluctuations in
time + Safety Stock
Several factors determine how much delivery time stock and safety stock should be held. In summary, the efficiency of a replenishment system affects how much delivery time is needed. Since the delivery time stock is the expected inventory usage between ordering and receiving inventory,
nventory would reduce the need for delivery time stock. And the determination of level of safety stock involves a basic
, resulting in possible customer dissatisfaction and lost sales, and the increased costs associated with
Another method of calculating reorder level involves the calculation of usage rate per day, lead time which is the amount of time between
order and receiving the goods and the safety stock level
time in days
From the above formula it can be easily deduced that an order for made when the level of inventory is just
For example: If the average daily usage rate of a material is 50 units and the lead-time is seven days, then:
Reorder level = Average daily usage rate x Ledays = 350 units
When the inventory level reaches 350 units an order should be placed for material. By the time the inventory level reaches zero towards the end of the seventh day from placing the order materials will reach acause for concern.
Underlying Assumptions of Economic Order Quantity:
The ordering cost is constant.
The rate of demand is constant
The lead time is fixed
The purchase price of the item is constant i.e. no discount is available
The replenishment is made instantaneously; the whole batch is delivered at once.
SAFETY STOCK IN CASE OF
Safety stock (also called describe a level of extra stock that is maintained to mitigate risk of outs (shortfall in raw material or packaging) due to uncertainties in supply and demand. Adequateproceed according to their plansuncertainty in the demand level or insurance against stock outs.
If the average daily usage rate of a material is 50 units time is seven days, then:
Reorder level = Average daily usage rate x Lead time in days = 50 units x 7
When the inventory level reaches 350 units an order should be placed for material. By the time the inventory level reaches zero towards the end of the seventh day from placing the order materials will reach and there is no
Underlying Assumptions of Economic Order Quantity:
The ordering cost is constant.
The rate of demand is constant
The lead time is fixed
The purchase price of the item is constant i.e. no discount is available
nishment is made instantaneously; the whole batch is delivered at once.
TOCK IN CASE OF INVENTORY LEVELS OF RM
(also called buffer stock) is a term used by logisticiansdescribe a level of extra stock that is maintained to mitigate risk of
(shortfall in raw material or packaging) due to uncertainties in supply safety stock levels permit business operations to
proceed according to their plans. Safety stock is held when there is uncertainty in the demand level or lead time for the product; it ser
outs.
42
If the average daily usage rate of a material is 50 units
ad time in days = 50 units x 7
When the inventory level reaches 350 units an order should be placed for material. By the time the inventory level reaches zero towards the end of
nd there is no
The purchase price of the item is constant i.e. no discount is available
nishment is made instantaneously; the whole batch is
& PM:
logisticians to describe a level of extra stock that is maintained to mitigate risk of stock
(shortfall in raw material or packaging) due to uncertainties in supply safety stock levels permit business operations to
Safety stock is held when there is for the product; it serves as an
REASONS FOR SAFETY STOCK
Safety stocks are mainly used in a "Make tstrategy. This strategy is employed when the lead time of manufacturing is too long to satisfy the customer demand at the rtime.
The main goal of safety stocks is to absorb the variability of the customer demand. Indeed, the Production Planning is based on a forecast, which is (by definition) different form the real demand. By absorbing these variations, safety stock improves the customer service level.
INVENTORY POLICY
The size of the safety stock depends on the type of inventory policy that is in effect. An inventory node is supplied from a "source" which fulfills orders for the considered product afIn a "periodic review" inventory policy the inventory level is checked periodically (such as once a month) and an order is placed at that time if necessary; in this case the risk period is equal to the time until the next review plus the replenishment lead time. On the other hand, if the inventory policy is a "continuous review" policy (such as an Order PointOrder Up To policy) the inventory level is orders can be placed immediately, so the risk period is just the replenishment lead time. Therefore continuous reviewcan make do with a smaller safety stock.
OCK
cks are mainly used in a "Make to Stock" manufacturing strategy. This strategy is employed when the lead time of manufacturing is too long to satisfy the customer demand at the right cost/quality/waiting
The main goal of safety stocks is to absorb the variability of the customer demand. Indeed, the Production Planning is based on a forecast, which is (by definition) different form the real demand. By absorbing these
ns, safety stock improves the customer service level.
The size of the safety stock depends on the type of inventory policy that is in effect. An inventory node is supplied from a "source" which fulfills orders for the considered product after a certain replenishment In a "periodic review" inventory policy the inventory level is checked periodically (such as once a month) and an order is placed at that time if
essary; in this case the risk period is equal to the time until the next review plus the replenishment lead time. On the other hand, if the inventory policy is a "continuous review" policy (such as an Order PointOrder Up To policy) the inventory level is being check continuously and orders can be placed immediately, so the risk period is just the
e. Therefore continuous review inventory policies can make do with a smaller safety stock.
43
o Stock" manufacturing strategy. This strategy is employed when the lead time of manufacturing is
ight cost/quality/waiting
The main goal of safety stocks is to absorb the variability of the customer demand. Indeed, the Production Planning is based on a forecast, which is (by definition) different form the real demand. By absorbing these
The size of the safety stock depends on the type of inventory policy that is in effect. An inventory node is supplied from a "source" which fulfills
ter a certain replenishment lead time. In a "periodic review" inventory policy the inventory level is checked periodically (such as once a month) and an order is placed at that time if
essary; in this case the risk period is equal to the time until the next review plus the replenishment lead time. On the other hand, if the inventory policy is a "continuous review" policy (such as an Order Point-
being check continuously and orders can be placed immediately, so the risk period is just the
inventory policies
DAYS COVER AND
The inventory type of planning consisted of
o MRP (Material Requirement Planning)
o Pipeline Management
Pipeline Management is further taken into consideration by three measures:
Stock-in-hand
On-order
Lead time
We have discussed MRP in the previous pages of thishall mention Pipeline Management
The days cover, lead time and the stock in hand are the things that should be kept in mind while ordering a specific material.
Days cover shows that how much stock is left in the warehouse for the sales to go smoothly for a particular product or SKU in the market and production as well.
Lead time is the time required/taken by the supplier to produce & deliver the required quantity to the factory.local items and 30 -35 days time greater because they are delivered via either airlift or shipments.
Stock in hand is the stock already present in warehouse and on order is the one, which is not delivered yet.
OVER AND LEAD TIME CONCEPT:type of planning consisted of two steps:
MRP (Material Requirement Planning)
Pipeline Management
Pipeline Management is further taken into consideration by three
We have discussed MRP in the previous pages of this report. Here we shall mention Pipeline Management.
The days cover, lead time and the stock in hand are the things that should be kept in mind while ordering a specific material.
Days cover shows that how much stock is left in the warehouse for the to go smoothly for a particular product or SKU in the market and
Lead time is the time required/taken by the supplier to produce & deliver the required quantity to the factory. It must not exceed 15 days for
35 days for imported items. Imported items have lead time greater because they are delivered via either airlift or shipments.
Stock in hand is the stock already present in warehouse and on order is the one, which is not delivered yet.
44
Pipeline Management is further taken into consideration by three
s report. Here we
The days cover, lead time and the stock in hand are the things that
Days cover shows that how much stock is left in the warehouse for the to go smoothly for a particular product or SKU in the market and
Lead time is the time required/taken by the supplier to produce & It must not exceed 15 days for
Imported items have lead time greater because they are delivered via either airlift or shipments.
Stock in hand is the stock already present in warehouse and on order
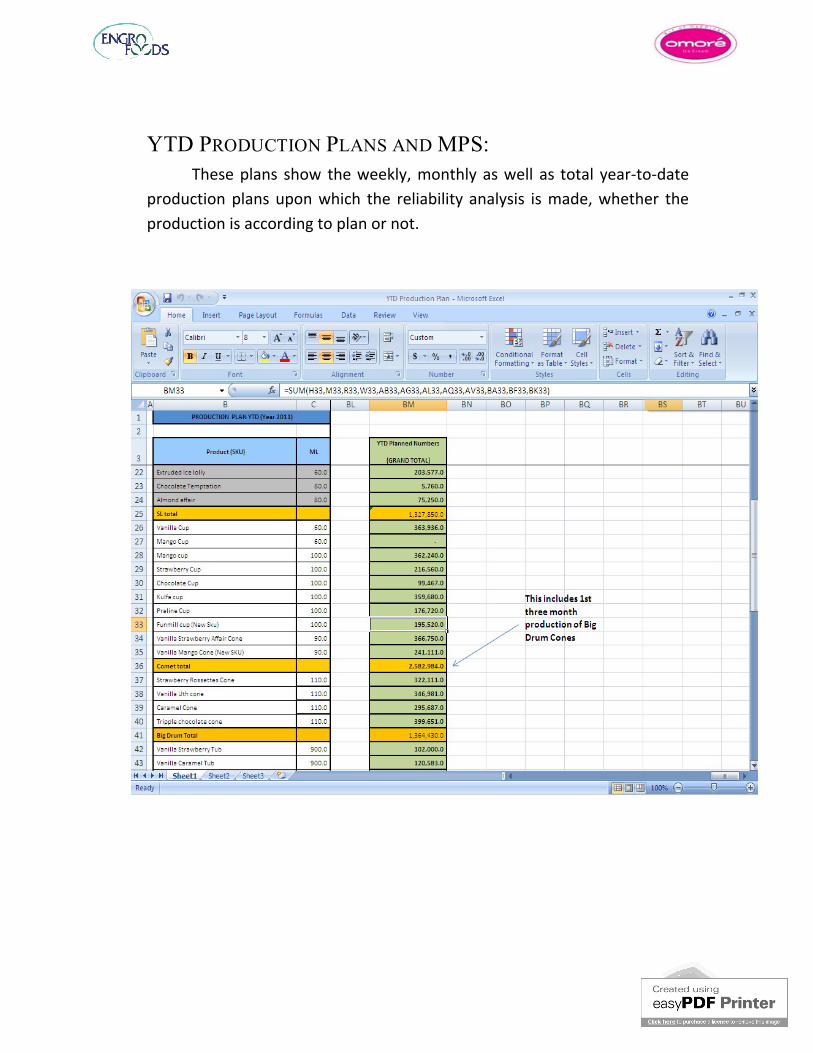
YTD PRODUCTION
These plans show the weekly, monthly as well as total yearproduction plans upon which the reliability analysis is made, whether the production is according to plan or not.
RODUCTION PLANS AND MPS:These plans show the weekly, monthly as well as total year
production plans upon which the reliability analysis is made, whether the production is according to plan or not.
45
These plans show the weekly, monthly as well as total year-to-date production plans upon which the reliability analysis is made, whether the
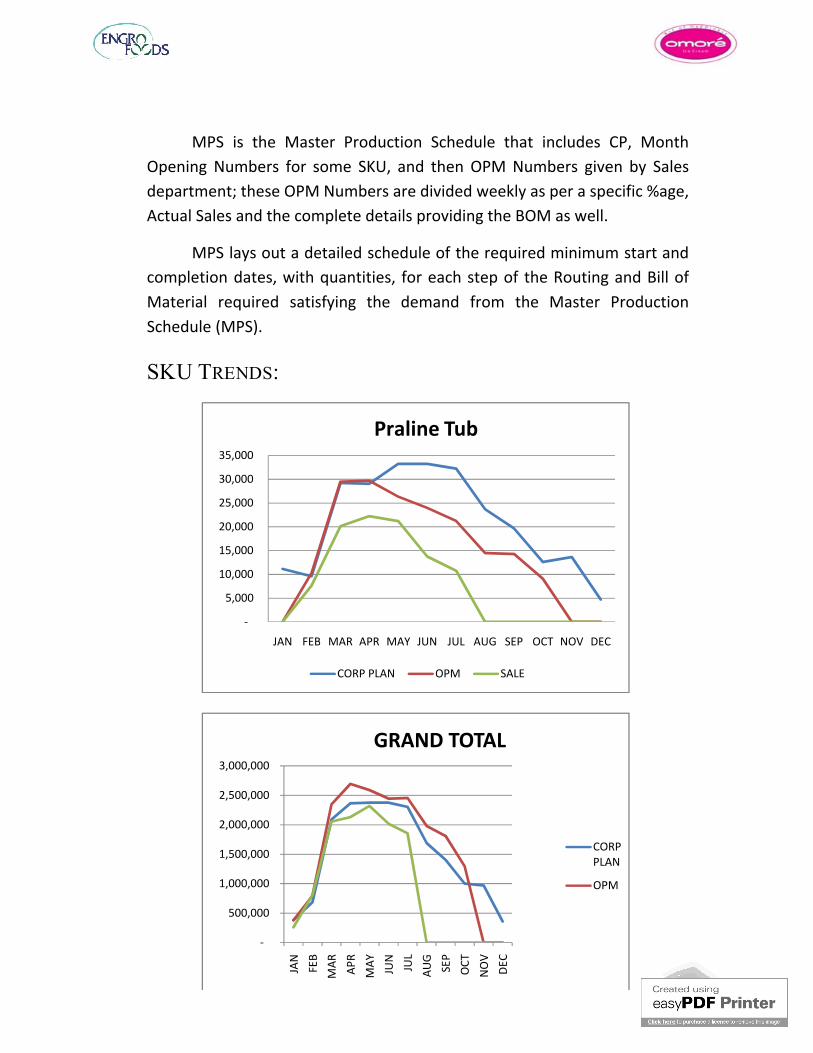
-
5,000
10,000
15,000
20,000
25,000
30,000
35,000
JAN FEB
-
500,000
1,000,000
1,500,000
2,000,000
2,500,000
3,000,000
JAN
FEB
MPS is the MasterOpening Numbers for some SKU, and then OPM Numbers given by Sales department; these OPM Numbers are divided weekly as per a specific %age, Actual Sales and the complete details providing the BOM as well.
MPS lays out a detailed schedule of the required minimum start and completion dates, with quantities, for eachMaterial required satisfying the demand from the Schedule (MPS).
SKU TRENDS:
FEB MAR APR MAY JUN JUL AUG SEP OCT NOV DEC
Praline Tub
CORP PLAN OPM SALE
MAR AP
RM
AY JUN
JUL
AUG
SEP
OCT
NO
VD
EC
GRAND TOTAL
CORP PLAN
OPM
MPS is the Master Production Schedule that includes CP, Month Opening Numbers for some SKU, and then OPM Numbers given by Sales department; these OPM Numbers are divided weekly as per a specific %age, Actual Sales and the complete details providing the BOM as well.
s out a detailed schedule of the required minimum start and completion dates, with quantities, for each step of the Routing and Bill ofMaterial required satisfying the demand from the Master Production
46
DEC
CORP PLAN
OPM
Production Schedule that includes CP, Month Opening Numbers for some SKU, and then OPM Numbers given by Sales department; these OPM Numbers are divided weekly as per a specific %age, Actual Sales and the complete details providing the BOM as well.
s out a detailed schedule of the required minimum start and step of the Routing and Bill of
Master Production
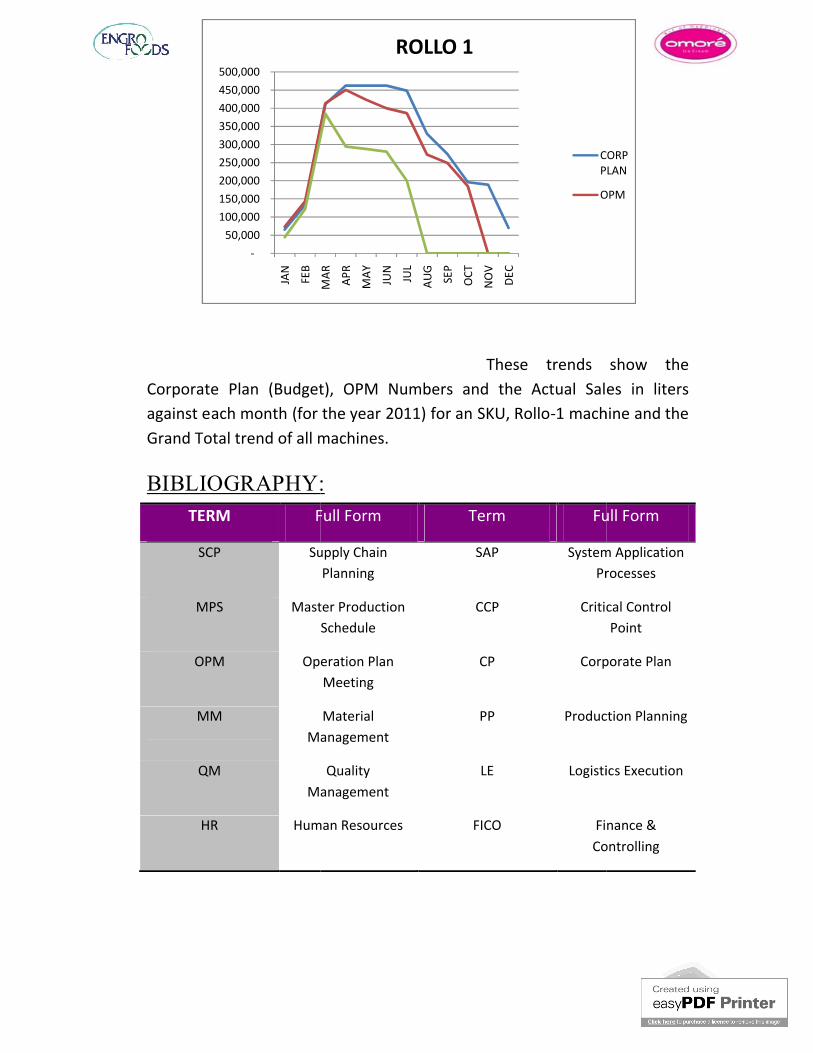
-50,000
100,000 150,000 200,000 250,000 300,000 350,000 400,000 450,000 500,000
JAN
FEB
MAR
Corporate Plan (Budget), OPM Numbers and the Actual Sales in liters against each month (for the year 2011) for an SKU, RolloGrand Total trend of all machines.
BIBLIOGRAPHY:TERM Full Form
SCP Supply Chain
MPS Master Production
OPM Operation Plan
MMManagement
QMManagement
HR Human Resources
MAR AP
R
MAY JUN
JUL
AUG
SEP
OCT
NO
V
DEC
ROLLO 1
CORP PLAN
OPM
These trends show the Corporate Plan (Budget), OPM Numbers and the Actual Sales in liters
for the year 2011) for an SKU, Rollo-1 machine and the Grand Total trend of all machines.
BIBLIOGRAPHY:Full Form Term Full Form
Supply Chain Planning
SAP System Application Processes
Master Production Schedule
CCP Critical Control
Operation Plan Meeting
CP Corporate
Material Management
PP Production Planning
Quality Management
LE Logistics Execution
Human Resources FICO Finance & Controlling
47
CORP PLAN
OPM
These trends show the Corporate Plan (Budget), OPM Numbers and the Actual Sales in liters
machine and the
Full Form
System Application Processes
Critical Control Point
Corporate Plan
Production Planning
Logistics Execution
Finance & Controlling
PIRIndependent Requirement
MRPRequirement
CIP Clean in Place
PLC Programming Logical Control
OEE Overall Equipment Efficiency
SMP Skim Milk Powder
SOP Sales
APO Advanced Planning Operator
CSR Corporate Social Responsibility
ROP Reorder Point
VMI Vendor Managed Inventory
ETA Estimated time of
Planned Independent Requirement
ERP Enterprise Resource Planning
Material Requirement
Planning
IR Incident Report
Clean in Place OPC Open Plant Cleaning
Programming Logical Control
HMI Human Machine Interface
Overall Equipment Efficiency
TPM Total Productive Maintenance
Skim Milk Powder SOP Safe Operating Procedures
Sales Operation Plan
UHT Ultra High Temperature
Advanced Planning Operator
BOM Bill of Material
Corporate Social Responsibility
CLT Central Location Testing
Reorder Point EOQ Economic order Quantity
Vendor Managed Inventory
ETD Estimated timedeparture
Estimated time of arrival
FNR Factory Need Rate
48
Enterprise Resource Planning
Incident Report
Open Plant Cleaning
Human Machine Interface
Total Productive Maintenance
Safe Operating Procedures
Ultra High Temperature
Bill of Material
Central Location Testing
Economic order Quantity
Estimated time of departure
Factory Need Rate