Embed Size (px)
Citation preview
Supported by 1
Supply Side Economic and the Need for Energy Diversification
Rajan Gupta1,2
and Thomas Elmar Schuppe2
1Theoretical Division, Los Alamos National Laboratory, New Mexico, USA
2Observer Research Foundation, New Delhi, India
Introduction:
In order to understand the supply side economics of energy resources, diversification by both
suppliers and consumers, and trade we will examine, in this paper, the following issues.
1) Current status of global resources and how they are evolving. This part will include
estimating which countries will have significant resources left by 2050 based on an
understanding of reserves and production trends. Based on such an analysis we will
project, in cases where trends are relatively robust, what countries will control
significant resources by 2050 or earlier.
2) How will the supply side evolve driven by technology, economic, political, social, and
environmental considerations and what changes will this force on the consumers?
3) What options and opportunities for diversification are likely to become available over
time for both suppliers and consumers and what are their likely drivers and long-term
consequences?
At different points in this paper we will examine specific countries to highlight and exemplify
the points we make. Our discussion is informed by four trends that stand out throughout the
history of energy use:
The amount of energy used per person and social and economic development have been
studied extensively and a strong correlation is observed between the two throughout
historyi. Access to energy has been a primary enabling factor in human development.
Humankind has simultaneously exploited all possible forms of energy sources
available, often using each for multiple purposes.
New fuels/power have been integrated into existing mix depending on the ease of
recovery, distribution and use and the technology available for using them. Examples
are the overlapping use of human muscle power, wind, wood, coal, diesel, and nuclear
for the propulsion of ships, and the evolution from coal to diesel to electricity for
powering trains.
Fuel switch has taken place when a cleaner or cheaper or more convenient to use
fuel/power has become available. Examples are cooking fuels that evolved from wood,
peat, coal char and animal dung found naturally on earth’s surface to coal to oil to
natural gas and propane. Today, many cooking appliances run on electric power.
We contend that these trends will continue. For example, bio-mass from forests and all other
burnable waste, historically collected and used for heating and cooking or put into landfills, is
Supported by 2
now being combusted in thermal power plants and classified as renewable fuel. In the future,
once the conversion of lignocellulose to ethanol (cellulosic ethanol) becomes economical,
these resources might also be used to produce high value bio-fuels. Animal dung, which was
used for fertilizer and cooking fuel, is now also being used to produce bio-gas.
We also contend that the drivers of change will continue to be technological innovations,
cost, access, and ease of distribution and use. Social and international political pressure,
driven by considerations of climate change and environmental pollution, will play an
increasing role and could significantly change the picture especially as technological
innovations provide new options for non-fossil fuel based dispatchable electricity generation
and efficient transportation.
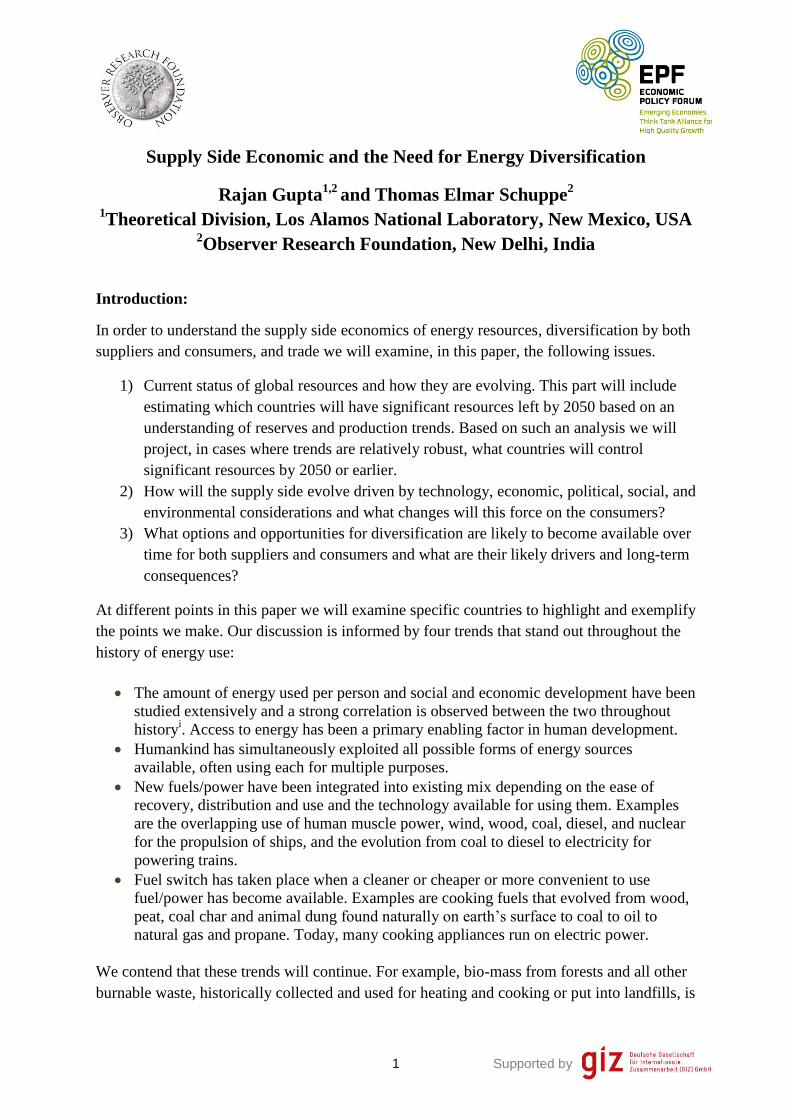
To mitigate climate change, emissions of greenhouse gases have to be reduced drastically.
The last time in history that CO2 concentrations in the atmosphere were stable was pre-
industrialization at about 280 ppm. Pre-industrial annual emissions of CO2 are estimated at 2-
3 gigatons (Gt) whereas today they have reached around 33 Gt (this estimate does not include
contributions from other greenhouse gases) as shown in Figure 1. To stabilize CO2 levels at
current levels (400 ppm in 2013), emissions have, therefore, to be reduced by over 90%
overnight. Stablizing at even 450 ppm (450 Scenario in Figure 1) is a daunting challenge
which will require international agreements on emissions of greenhouse gases that are far
more restrictive and effective than the Kyoto Protocolii. On the other hand mitigation
measures will have to take into account economic realities and the development needs of both
developing and developed countries. Also, based on recent examples of public discussions
and rejection of energy from bio-fuels, fracking and nuclear power in many parts of the
world, one should expect all future fuel/power options to face public scrutiny regarding cost-
effectiveness, safety and lifetime environmental impacts. Transitioning away from status-quo,
energy systems based on fossil fuels, will, therefore, not be achieved easily.

Supported by 3
Figure 1: Historic annual Primary Energy Demand (PED) in million tons oil equivalent
(Mtoe) and CO2 emissions in gigatons (Gt) and projections up to 2035 based on 3 scenarios
by IEA. (i) Currect policies with PED growing at 1.6% per year ; (ii) New policies scenario
with PED growing at 1.2% per year; and (iii) 450 scenario that would stabilize CO2
concentration at 450 ppm.
[Source: IEA WEO 2013]

Supported by 4
Global Demand and Supply:
Global energy needs are staggering. In 2011, about 5 Terawatt (TW) of installed power
capacity generated about 22,000 TW hours (TWh) of electricity as shown in Figure 2. By
2050, an anticipated population of 9-10 billion will require twice this: about 10 TW
supplying about 45,000 TWh per year. This doubling represents an annual 1.8% growth in
energy demand over 37 years and includes the 1% business-as-usual decrease in energy
intensity due to increased efficiency. We anticipate the 10 TW generation capacity will be
composed of the following wedges: coal (2 TW), gas (2 TW), nuclear (1 TW), hydro (1.5
TW), wind (2 TW), solar (1 TW), and “others” (0.5 TW). During this period, CO2 emissions
are projected to grow by only 30% due to fuel switching, increased efficiency and growth in
renewable generation by OECD countries as also shown in Figure 2.
Supported by 5
Figure 2: Global electricity usage, CO2 emissions intensity (grams CO2/kWh) and total CO2
emissions from the electricity generation sector in Gt of carbon in (a) 2011 and (b) projected
estimates for 2035. [Source IEA WEO (2013) p. 191]
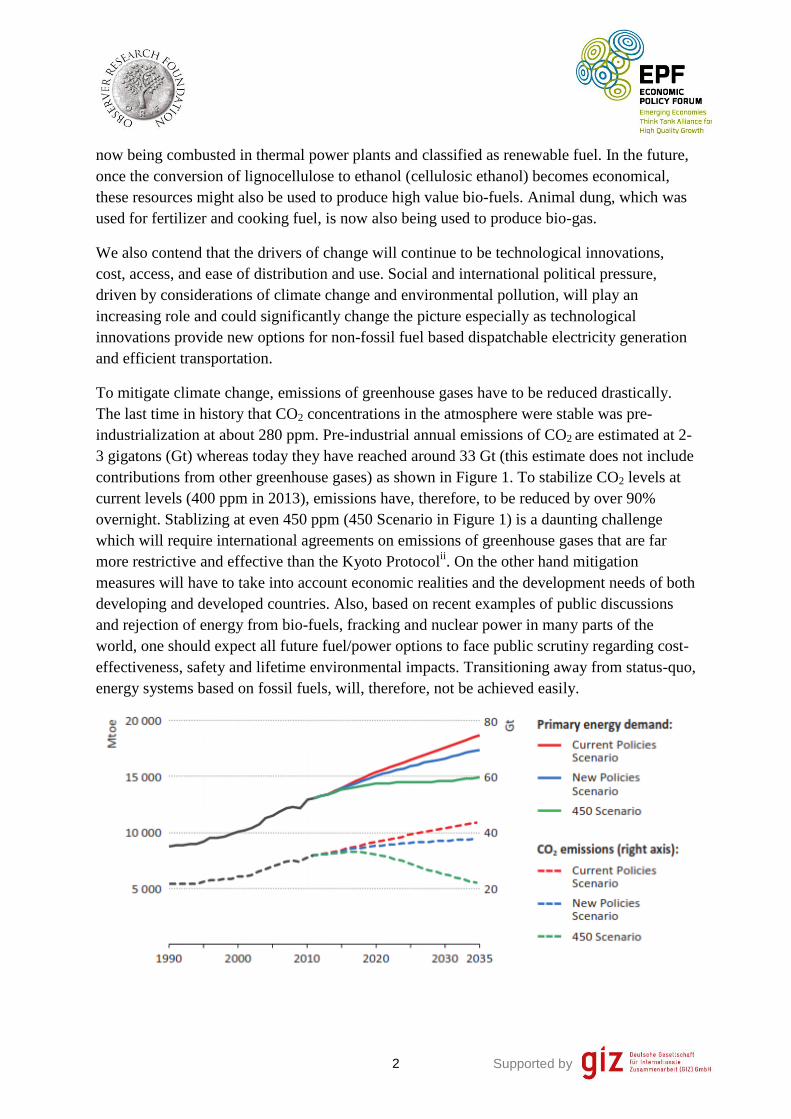
Similarly, for liquid fuels the WEO projections are 101 MMbl/day by 2035iii
as shown in
Figure 3 (BP’s projection in the Energy Outlook 2035 is 108 MMbl/day). Unfortunately,
there is no alternative to oil at the scale of an oil-wedge (we define an oil-wedge to be
10 MMbl/day), and from present perspective it is unlikely that one will emerge by 2035. The
total sum of all biofuels may reach 5 MMbl/day, as shown in Figure 4, if cost of production
of cellulosic ethanol and algal oil becomes competitive with fossil oil as projected by IEA in
WEO 2013. Dwindling water resources, competition with food and environmental impacts
will be major factors limiting the amount of biofuels that can/will be produced. The best
option for eliminating greenhouse gas emissions from the transport sector is a transition to
electric vehicles. In this eventuality, to cut emissions of greenhouse gases would require the
additional electricity be generated by non-fossil sources. In that case only the demands of the
petrochemical industry will need to be met by fossil oil and gas.
Figure 3: Projected demand of 101 MMbl/day of oil in 2035 by IEA in the WEO 2013
includes impacts of fuel switching and efficiency gains.
[Source IEA WEO (2013) p. 509]
Today, petroleum products dominate fuels used for transportation (light vehicles, trucks,
airplanes and ships). Significant reduction in usage of oil is possible by gains in efficiency
and fuel switching. Future fossil-fuel based options with lower emissions include CNG/LNG
(compressed/liquefied natural gas) fueled cars, train engines and long-haul trucks;
hybrid/electric vehicles; and more efficient and convenient public transport systems.
Electric power generation is currently dominated by coal, natural-gas, nuclear and
hydroelectric systems. These are likely to grow until countries achieve adequate total
capacity and energy security. Of these, nuclear and hydroelectric are essentially carbon
Supported by 6
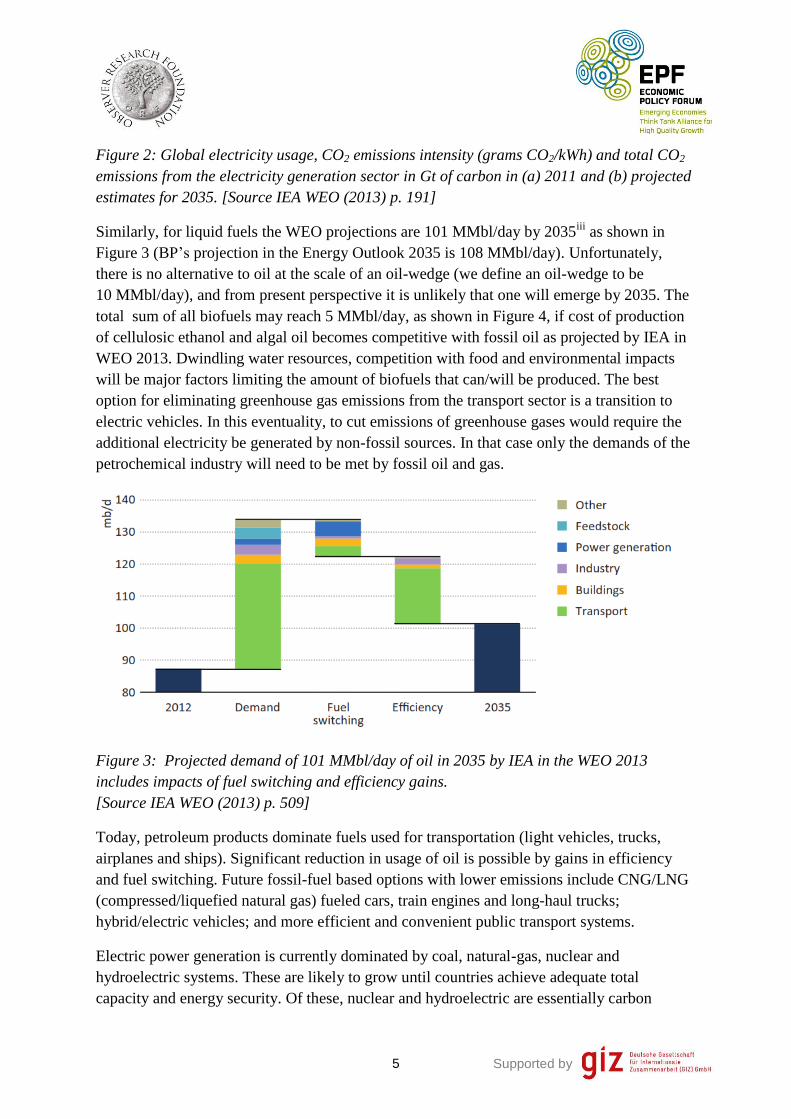
neutral, at least during production. Wind and solar present the largest opportunity for growth.
It is unlikely that the total capacity of other low-carbon systems such as geothermal, bio-mass
fired power plants, tidal and wave energy systems, etc., will scale to more than a few hundred
gigawatts by 2050. Their contribution will be important and constitutes part of the last wedge
called “others” but since current trends in their growth rate indicate that these will continue to
present a local and limited opportunity in the near to mid-term we do not discuss them further
in this paper. Similarly, the probability of fusion technology maturing to the point that
commercial fusion reactors will be operating by 2050 is tiny.
Figure 4: Biofuels (ethanol and biodiesel) production in selected regions of the world as
projected by IEA in the WEO 2013. [Source IEA WEO (2013) p. 388]
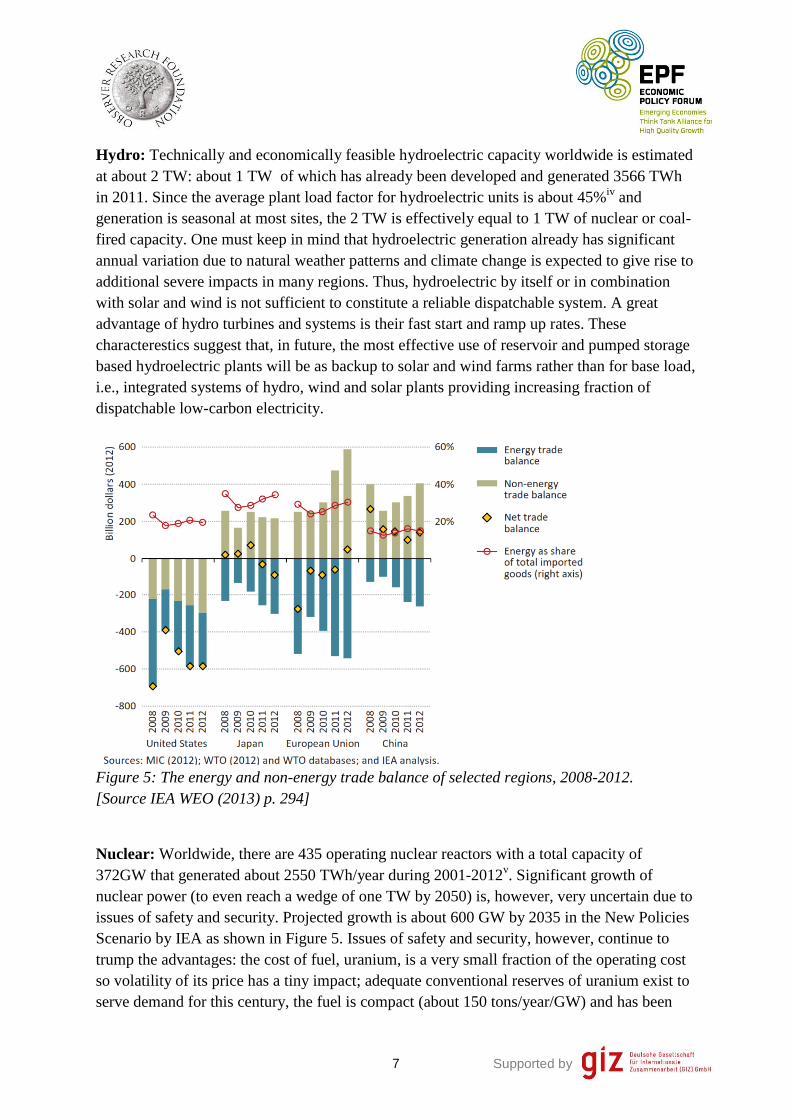
The greatest challenge for countries that import a significant fraction of the fossil fuels they
consume is the ability to pay for the imports if prices stay high and volatile. Many countries
are already accumulating large trade deficits driven mostly by the cost of importing fossil
fuels as shown in Figure 5 (other prominent examples not shown in the figure include India,
Spain and Italy). Such a foreseeable financial burden would suggest that all countries without
adequate reserves of fossil fuels would have compelling economic incentives to make the
transition to renewables independent of considerations of climate change. Three major
reasons why this is not happening fast enough are (i) the enormous existing energy and
transportation infrastructure and investment in fossil fuels, (ii) easily accessable fossil fuels
continue to provide the fastest and surest path of development and (iii) because solar and
wind are more expensive and do not, on their own, provide baseload generation. As a result,
the business-as-usual scenario is persisting even under the threat of global warming, and the
transition to low-carbon options is proving to be slow and challenging especially with nuclear
power generation capacity not growing significantly.
Low Carbon Options for Baseload Power Generation:
Supported by 7
Hydro: Technically and economically feasible hydroelectric capacity worldwide is estimated
at about 2 TW: about 1 TW of which has already been developed and generated 3566 TWh
in 2011. Since the average plant load factor for hydroelectric units is about 45%iv
and
generation is seasonal at most sites, the 2 TW is effectively equal to 1 TW of nuclear or coal-
fired capacity. One must keep in mind that hydroelectric generation already has significant
annual variation due to natural weather patterns and climate change is expected to give rise to
additional severe impacts in many regions. Thus, hydroelectric by itself or in combination
with solar and wind is not sufficient to constitute a reliable dispatchable system. A great
advantage of hydro turbines and systems is their fast start and ramp up rates. These
characterestics suggest that, in future, the most effective use of reservoir and pumped storage
based hydroelectric plants will be as backup to solar and wind farms rather than for base load,
i.e., integrated systems of hydro, wind and solar plants providing increasing fraction of
dispatchable low-carbon electricity.
Figure 5: The energy and non-energy trade balance of selected regions, 2008-2012.
[Source IEA WEO (2013) p. 294]
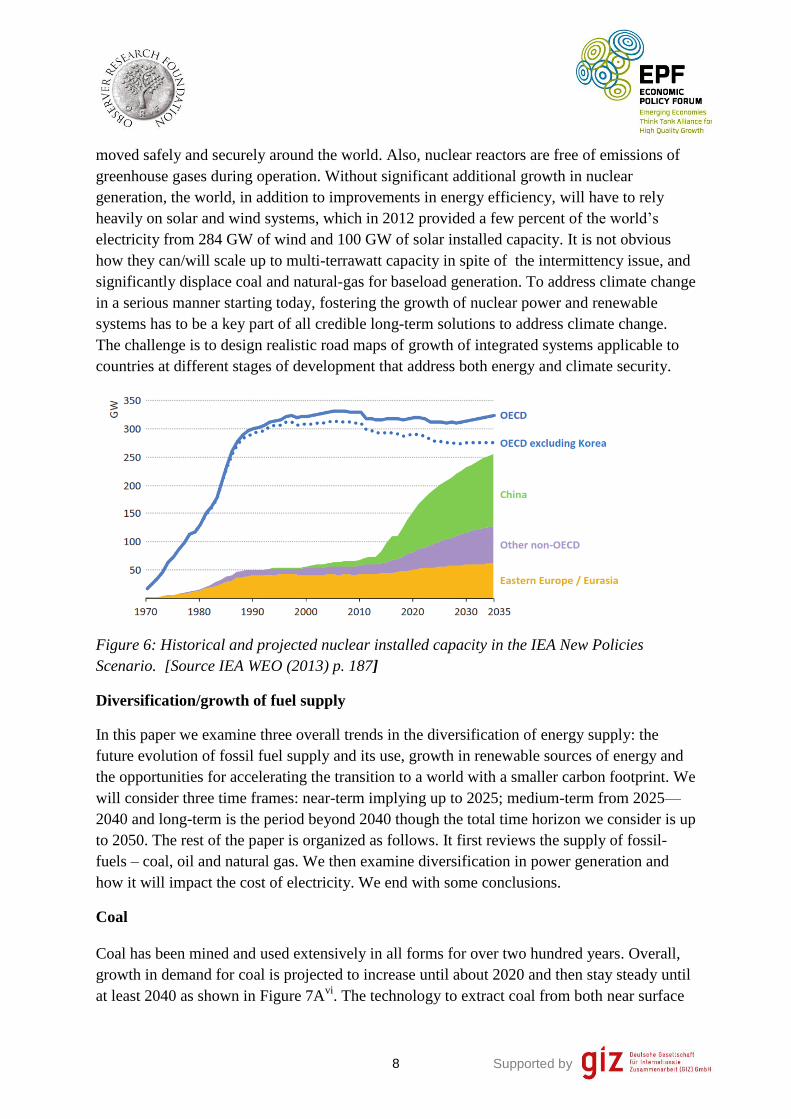
Nuclear: Worldwide, there are 435 operating nuclear reactors with a total capacity of
372GW that generated about 2550 TWh/year during 2001-2012v. Significant growth of
nuclear power (to even reach a wedge of one TW by 2050) is, however, very uncertain due to
issues of safety and security. Projected growth is about 600 GW by 2035 in the New Policies
Scenario by IEA as shown in Figure 5. Issues of safety and security, however, continue to
trump the advantages: the cost of fuel, uranium, is a very small fraction of the operating cost
so volatility of its price has a tiny impact; adequate conventional reserves of uranium exist to
serve demand for this century, the fuel is compact (about 150 tons/year/GW) and has been
Supported by 8
moved safely and securely around the world. Also, nuclear reactors are free of emissions of
greenhouse gases during operation. Without significant additional growth in nuclear
generation, the world, in addition to improvements in energy efficiency, will have to rely
heavily on solar and wind systems, which in 2012 provided a few percent of the world’s
electricity from 284 GW of wind and 100 GW of solar installed capacity. It is not obvious
how they can/will scale up to multi-terrawatt capacity in spite of the intermittency issue, and
significantly displace coal and natural-gas for baseload generation. To address climate change
in a serious manner starting today, fostering the growth of nuclear power and renewable
systems has to be a key part of all credible long-term solutions to address climate change.
The challenge is to design realistic road maps of growth of integrated systems applicable to
countries at different stages of development that address both energy and climate security.
Figure 6: Historical and projected nuclear installed capacity in the IEA New Policies
Scenario. [Source IEA WEO (2013) p. 187]
Diversification/growth of fuel supply
In this paper we examine three overall trends in the diversification of energy supply: the
future evolution of fossil fuel supply and its use, growth in renewable sources of energy and
the opportunities for accelerating the transition to a world with a smaller carbon footprint. We
will consider three time frames: near-term implying up to 2025; medium-term from 2025—
2040 and long-term is the period beyond 2040 though the total time horizon we consider is up
to 2050. The rest of the paper is organized as follows. It first reviews the supply of fossil-
fuels – coal, oil and natural gas. We then examine diversification in power generation and
how it will impact the cost of electricity. We end with some conclusions.
Coal
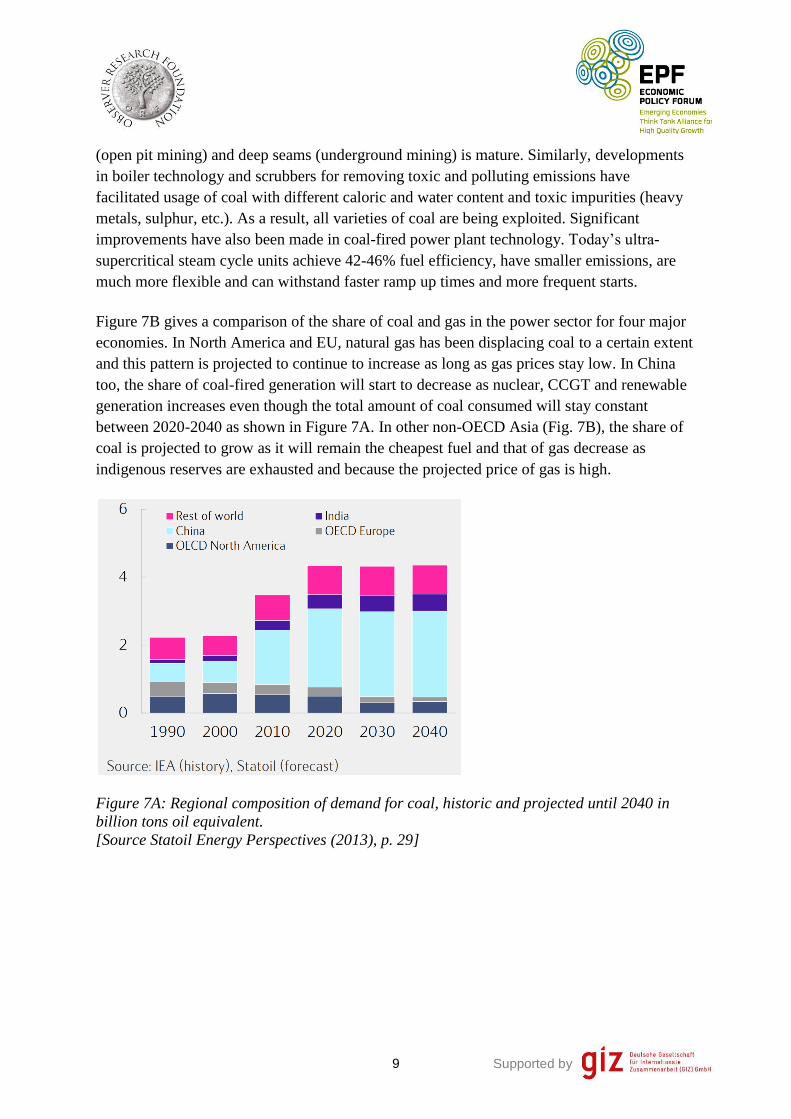
Coal has been mined and used extensively in all forms for over two hundred years. Overall,
growth in demand for coal is projected to increase until about 2020 and then stay steady until
at least 2040 as shown in Figure 7Avi
. The technology to extract coal from both near surface
Supported by 9
(open pit mining) and deep seams (underground mining) is mature. Similarly, developments
in boiler technology and scrubbers for removing toxic and polluting emissions have
facilitated usage of coal with different caloric and water content and toxic impurities (heavy
metals, sulphur, etc.). As a result, all varieties of coal are being exploited. Significant
improvements have also been made in coal-fired power plant technology. Today’s ultra-
supercritical steam cycle units achieve 42-46% fuel efficiency, have smaller emissions, are
much more flexible and can withstand faster ramp up times and more frequent starts.
Figure 7B gives a comparison of the share of coal and gas in the power sector for four major
economies. In North America and EU, natural gas has been displacing coal to a certain extent
and this pattern is projected to continue to increase as long as gas prices stay low. In China
too, the share of coal-fired generation will start to decrease as nuclear, CCGT and renewable
generation increases even though the total amount of coal consumed will stay constant
between 2020-2040 as shown in Figure 7A. In other non-OECD Asia (Fig. 7B), the share of
coal is projected to grow as it will remain the cheapest fuel and that of gas decrease as
indigenous reserves are exhausted and because the projected price of gas is high.
Figure 7A: Regional composition of demand for coal, historic and projected until 2040 in
billion tons oil equivalent.
[Source Statoil Energy Perspectives (2013), p. 29]

Supported by 10
Figure 7B: The historical and projected share of coal and natural gas in the power sector.
Projected changes in fuel mix have regional drivers. Cheap gas in the U.S., environmental
and climate change policies in EU, rising incomes giving rise to environmental concerns and
development of nuclear and gas in China, and economic in other non-OECD Asia.
[Source: BP Energy Outlook 2035, p. 86.]
China is the largest producer and consumer of coal (about 3.5 billion tons in 2011vii
) with
imports meeting around 6% of total demand. China’s marginal cost of production for thermal
coal, around $US80-$US100 a ton, is driving international spot prices (at least the cost of
seaborne coal in Asia) as Chinese importers opportunistically switch between domestic and
imported coal. This cost and fraction of imported coal is likely to change as the need to mine
deeper mines and exploit deposits in Western provinces (adding to cost because an extensive
transportation infrastructure will need to be built) grows. Given the current consumption,
installed coal-fired power generation capacity (about 700 GW, most of which uses super-
critical technology and was installed after 2006), and continued increase in demand of
electric power, China will most likely continue to consume at least 4 Gt of coal per year over
the next thirty years – until about 2040 as shown in Figure 7A – the earliest timeframe by
which growth of installed renewable, combined cycle gas turbine and nuclear generation
capacity could exceed growth in demand and significantly reduce dependence on coal.
Maintaining 4Gt/year during this period already takes into account decrease in growth in
demand due to a projected transition from a manufacturing economy to a larger service
sectorv. This scenario is remarkable in that the cumulative consumption at 4 Gt per year for
30 years amounts to China’s total estimated reserves of about 115 Gt. If this scenario unfolds,
then China’s imports of coal will continue to increase as its domestic reserves, particularly
those easier to access, are exhausted and remaining reserves/resources (particularly those in
Western China) become more expensive to produce.
Supported by 11
The second country that will significantly impact the price and volume of internationally
traded coal is India. The growth in its coal-fired generation capacity has been accelerating
since about 2006, and in 2013 there was about 150 GW of captive and grid-connected coal-
fired generating capacity but with an average energy conversion efficiency of only about
25%. Unfortunately, the enabling infrastructure (coal mining and transport and the electric
grid) has not kept pace and the supply of domestic coal is already falling short due to
inadequate mining and transport capacity. Because of the low caloric value (about 3500
Kcal/kg), India’s reserves of about 60 Gt can sustain 300 GW of supercritical generation
capacity for about 30 years if mining and distribution capacity can be ramped up to 1.5 Gt per
year. In addition, many large (called Mega and Ultra) coal-fired power plants are being
developed along coastal areas that have been designed to consume only imported coal. Thus,
if India’s power generation stays reliant on coal, then the most likely scenario is that it will
need to import over a Gt per year by 2040.
In short, China and India’s reserves of 115 and 60 Gt, respectively, imply that domestic coal
can provide them with a thirty-year window of opportunity for a fully operating coal-fired
generation capacity of 700 and 300 GW respectively. Highlighting such a 30-year window
for China and India ignores many factors such as evolving cost of coal, technological
breakthroughs facilitating resource to reserves conversion opportunities, of local pollution
and environmental impacts, and global climate change. It is meant to emphasize that the
existence of large global reserves should not lead to complacency. Any given consumer
country relying on large-scale imports may not be able to afford them and suppliers may
choose not to export in a carbon constrained world. In a scenario that coal remains a major
fuel for power generation in China and India, one can conservatively assume that together
they will need to import over 2 Gt of coal per year by 2040. Only a handful of countries have
large enough reservesvii
to meet this kind of demand and even these countries will need to
significantly ramp up production and the associated infrastructure for exporting coal.
Analyzing historic trends and projected growth in coal usage/exports, and assuming that no
significant new reserves are located, current estimatesvii
show that only 7 countries will have
significant reserves remaining post 2040 (countries with more than 10 Gt in reserves in 2012)
to supply a significant fraction of the over 2 Gt per year of thermal coal needed by just China
and India. (As discussed above, in this scenario, China and India will have largely depleted
their indigenous reserves by 2040.) These 7 countries are the U.S., Russia, Australia,
Germany, Ukraine, Kazakhstan and South Africa. Since German reserves are mostly lignite,
in which there has not been significant international trade, the other six countries will have to
be the major suppliers. With so few suppliers, the coal outlook can range from a no coal
economy in compliance with a carbon constrained world to a market-driven one with high
prices correlated with the price of natural gas or marginal price of coal (incl./excl. external
costs).

Supported by 12
If large-scale import is not an option then to guarantee long-term energy security based on
coal-fired generation, China and India in particular will increasingly need to develop cost-
effective capacity to mine thinner and/or deeper seams. One promising but yet to be
demonstrated at scale technology to exploit thin and/or deep seams is in situ gasification.
However, its environmental impacts are large and cost-effective methods to mitigate them
need to be developed.
An interesting test case of how the market will adjust to depleting reserves will arise in the
near-term when Indonesia can no longer export significant quantities of thermal coal. It has
increased production by 340% between 2003 and 2012 and is currently the largest exporter of
thermal coal. Unless new reserves are located/developed, at current production rates its
estimated coal reserves of 5 Gtvii
will run out in 14 years!
Geography too will play an important role in determining the supply chain. Coal from Russia,
Ukraine and Kazakhstan will most likely go to countries connected to them by railways, i.e.,
Eastern Europe and China. Rest of the world will, therefore, have to rely on the U.S.,
Australia and South Africa for coal. In a carbon constrained world, it is very unlikely that
these three democratic countries with environmentally enlightened public could justify
exporting Gt of coal. For example, will the public in the U.S., which today mines and
consumes about 1 Gt of coal per year and has 243 Gt in reserves, allow companies to build
the railway and port capacity to export 1 Gt or more of coal per year as their own
consumption decreases? One should note that the U.S. exported only about 40 Mt of steam
coal in 2012 and 2013viii
and the public opposition to building new export infrastucture is
growing . Our contention is that in a CO2 constrained world, as domestic supplies of coal
dwindle in most countries, there will be severe constraints in supply leading to high volatility
in price. At that point, international bodies regulating greenhouse gas emissions would need
the support of only a few exporting countries to force major coal importing countries to
transition to other forms of power generation. We contend that such a CO2 constrained world
is the more likely scenario; therefore, countries dependent on imports for coal-fired
generation must develop a roadmap to complete the transition to other sources of power by
2050. In this scenario, the two ways in which coal would remain a defensible fuel for power
generation are (i) Carbon Capture and Storage (CCS) is scaled up from current demonstration
projects to sequestering over 10 Gt of CO2 per year. In addition to the cost of building the
infrastructure, the public will have to be convinced that risks of leakage and subterranean
migration of CO2 and toxins are small and the environmental impacts of the associated
infrastructure such as pipelines are acceptable. (ii) In situ coal gasification technology
becomes cost-effective and its environmental impacts are understood and mitigated.
Almost all developed countries have already crossed the peak of their coal-fired generation
capacity and thus annual coal usage. Over the coming decades they can start reducing CO2
emissions by increasing the efficiency of their coal-fired plants and by replacing the least
Supported by 13
efficient by a combination of CCGT, nuclear, hydro, solar and wind systems. All such
countries at or past the peak in their installed coal-fired capacity can, therefore, afford to
agree to international agreements capping CO2 emissions at current levels. Even China,
having already reached close to our anticipated maximum sustainable usage of about 4 Gt of
coal per year, is in a position to participate in such agreements. Only countries such as India,
that are still in early stages of using coal to facilitate development, will have a very difficult
time agreeing to cap CO2 emissions at current levels. However, as they get increasingly
isolated in the international arena, they may be forced to comply with caps on total emissions
at current levels. As a result, they may face very serious impediments to development since it
is highly unlikely that they can bring alternative sources – CCGT, nuclear, hydro, solar and
wind systems – on line fast enough to keep pace with the growth in demand. Such countries
face a tough uphill battle. They need to develop a detailed and realistic backup roadmap that
provides needed growth in power generation capacity to address development needs and at
the same time is also accepted by the international community in a carbon-constrained world
and by local populations rebelling against environmental pollution and water shortages.
Oil
Fossil oil is used primarily for transportation driven by internal combustion engines and for
petrochemicals. Eighty-six of the roughly 88 million barrels per day (mbpd) of oil used
worldwide in 2012 (i.e. 98%) came from fossil fuels, and the rest, used for transportation, is
either bio-ethanol or bio-diesel. These biofuels are unlikely to grow to more than three
million barrels per day of oil equivalent (mboe) in the next two to three decadesix
(see Figure
3). Thus, the primary emphasis of planners and policy makers for reduction of oil use has
been on efficiency, including transition to hybrid and/or electric cars and building public
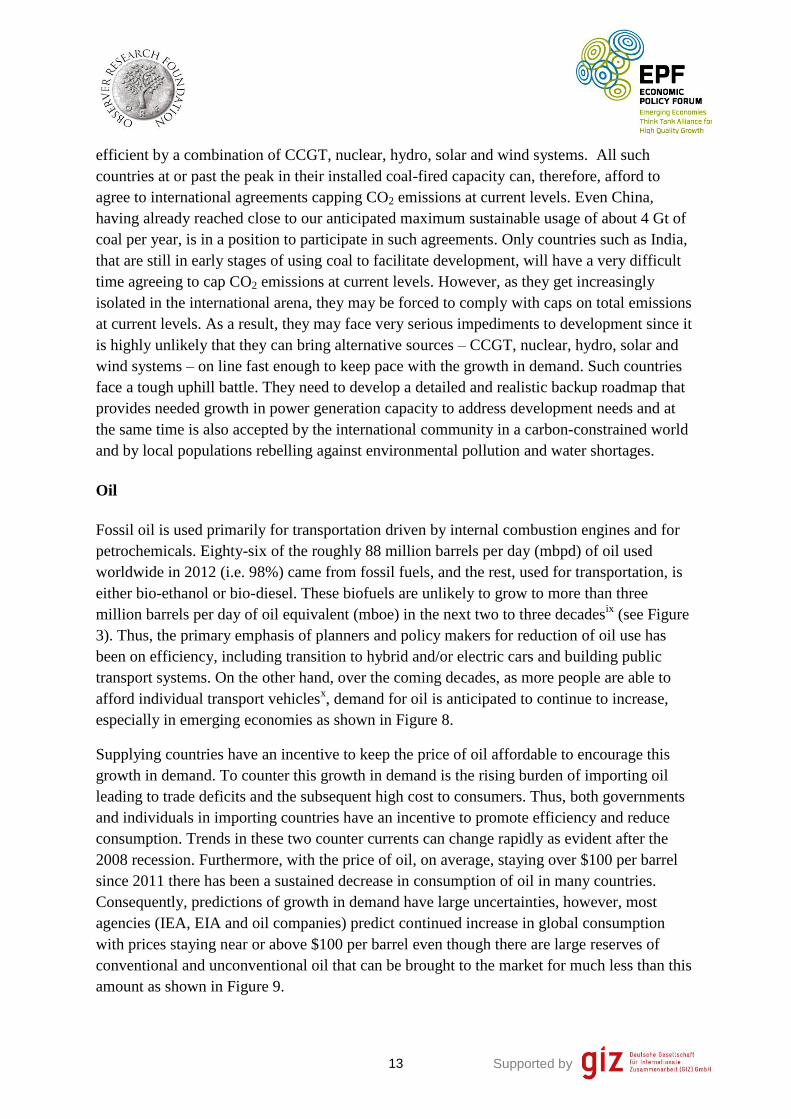
transport systems. On the other hand, over the coming decades, as more people are able to
afford individual transport vehiclesx, demand for oil is anticipated to continue to increase,
especially in emerging economies as shown in Figure 8.
Supplying countries have an incentive to keep the price of oil affordable to encourage this
growth in demand. To counter this growth in demand is the rising burden of importing oil
leading to trade deficits and the subsequent high cost to consumers. Thus, both governments
and individuals in importing countries have an incentive to promote efficiency and reduce
consumption. Trends in these two counter currents can change rapidly as evident after the
2008 recession. Furthermore, with the price of oil, on average, staying over $100 per barrel
since 2011 there has been a sustained decrease in consumption of oil in many countries.
Consequently, predictions of growth in demand have large uncertainties, however, most
agencies (IEA, EIA and oil companies) predict continued increase in global consumption
with prices staying near or above $100 per barrel even though there are large reserves of
conventional and unconventional oil that can be brought to the market for much less than this
amount as shown in Figure 9.
Supported by 14
Figure 8: History of oil production (left) and consumption (right) by region in mbpd.
[Source: BP Statistical Review 2013].
Over the last decade, oil companies have developed and deployed the technology to exploit
unconventional resources – deep sea, arctic, heavy oil, tar sands and tight or shale oil – and
are beginning to realize their enormous potential. Even a very conservative estimate of
conventional and unconventional resources suggests that up to 2050 and even beyond,
possible short-term shortages in supply of oil would most likely be due to economic factors
(e.g. uncertainty in demand leading to inadequate investment in exploration and recovery)
and geopolitics since most (80%) of the conventional reserves are controlled by national
companies and are in politically unstable regions. In the absence of major political
instabilities, and without scale up of alternatives, the amount of oil extracted annually will
depend on demand and producing countries and companies will respond to this growing
demand by bringing more resources online.
In a carbon-constrained world, unconventional oil may have a finite window of opportunity.
At some point in time as the global population stabilizes, shares of renewable generation and
high mileage/electric cars increase, the demand for fossil-oil, especially expensive un-
conventional oil, will start to decrease. Countries with large conventional reserves could then
squeeze out investment in exploration, production and export of unconventional oil and gas.
For example, after the growth in production of pre-salt oil in Brazil over the next ten years,
conventional production from OPEC countries is projected to rise and could squeeze out
more expensive unconventional oil if growth in demand stalls. We contend that this could
start happening as early as 2030!
production consumption

Supported by 15
Figure 9: Break-even price of conventional and unconventional oil and the size of
economically recoverable resources. [Source: IEA WEO (2013)]
Since the development of unconventional resources is relatively new, estimates of global
reserves have large uncertainties; nevertheless, given the long lead-time (5-10 years) needed
to bring new resources online, one can assess, based on history, who will be the major
suppliers and importers of oil over the next three decades. Europe, South Asia, China, the
Asian Tigers and the U.S. will remain the major importers and the Persian Gulf and Caspian
Supported by 16
Sea countries, Russia, West Africa (Nigeria and Angola), North Africa, Venezuela, Mexico
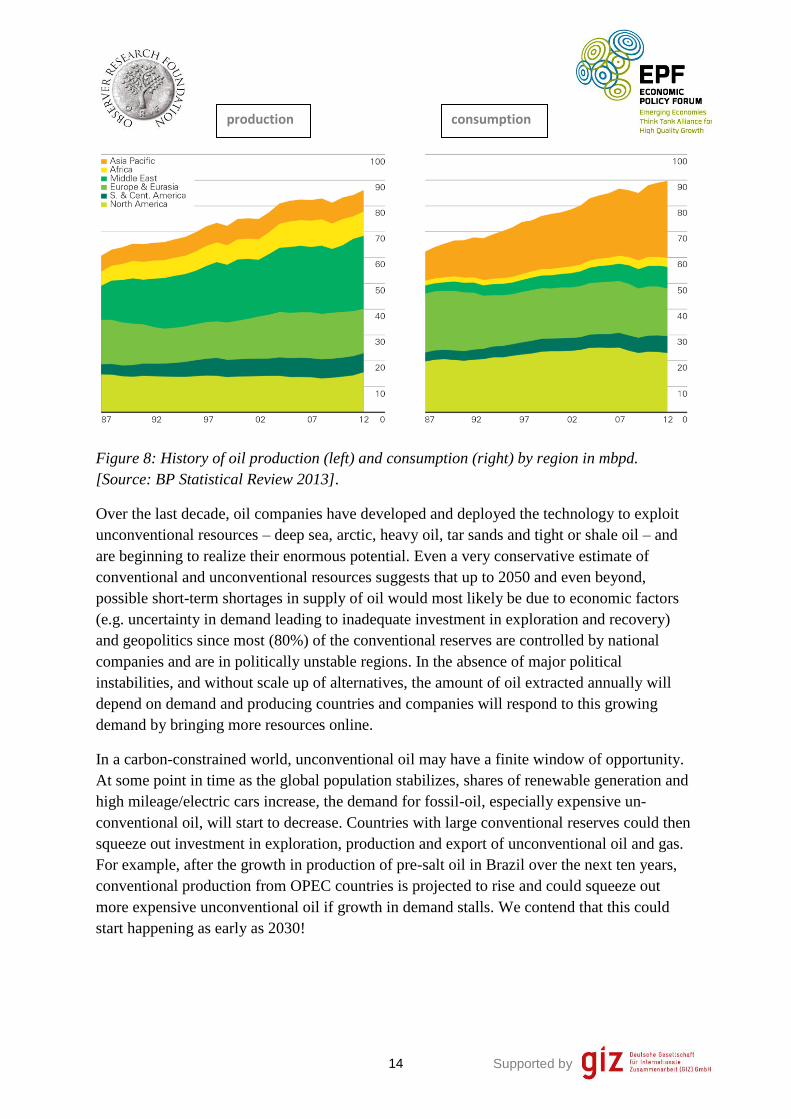
and Canada will remain the main exporters. The most significant changes anticipated, as
illustrated in Figure 10 by IEA, are the decreasing imports by the U.S. due to its development
of unconventional sources; continued increase in consumption in China, India, South-East
Asia and exporting countries; and increase in exports of pre-salt oil from Brazilxi
.
Figure 10: Change between 2011-2035 in the share of net oil and gas imports/export in
selected regions in the IEA WEO New Policies Scenario. The percentages of exports and
imports are calculated from the following ratios (export/total produced) and (imports/total
consumed), respectively.
[Source: IEA WEO (2013) p. 77]
Price and its stability are harder to predict. In a purely market driven economy, the supposed
driver of international price is the marginal cost of production, shown in Figure 9, that varies
significantly between conventional and non-conventional sources. Unconventional oil is more
expensive, partly because more expensive technology is required and also because continuous
investment is required over the lifetime of a well to maintain production. Countries with large
conventional reserves can more easily increase production and influence the price to
discourage investment in unconventional exploration. It is in the interest of all exporters,
however, to keep the oil price high to maximize profits and in order to attract investment in
exploration and production, but not too high to cause an economic recession and make
investments in alternatives attractive as OPEC has operated in the past. They want to
maintain a sustained demand for oil. In the near to mid-term, keeping unconventional oil in
the supply mix to set the marginal cost of production helps keep the prices high.
Supported by 17
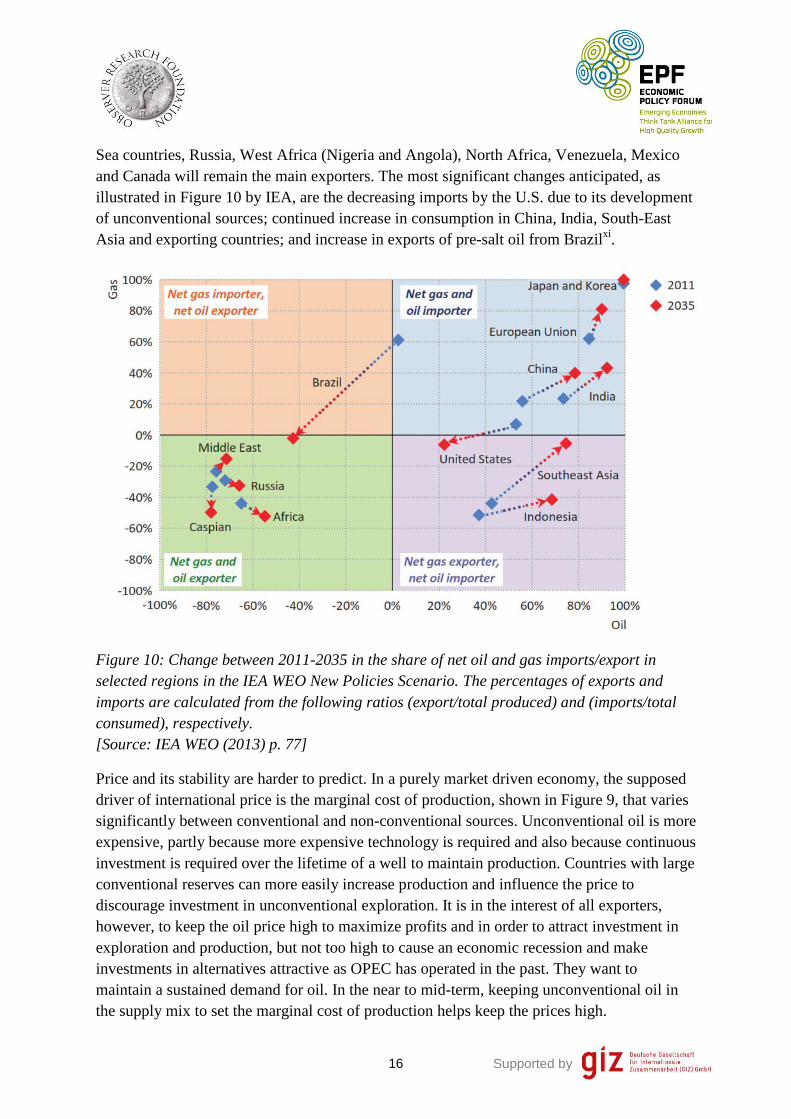
Volatility in the market has historically been correlated with political instability and/or lower
production due to under-investment in exploration and recovery (poor governance in
producing countries) than due to any real shortages in reserves as shown in Figure 11. For
example, declining production in Mexico and Venezuela is due to poor governance –
inadequate investment and driving out companies with the latest technology.
Figure 11: Crude oil prices ($/barrel) and world events that influenced major changes.
[Source: BP Statistical Review of World Energy 2013].
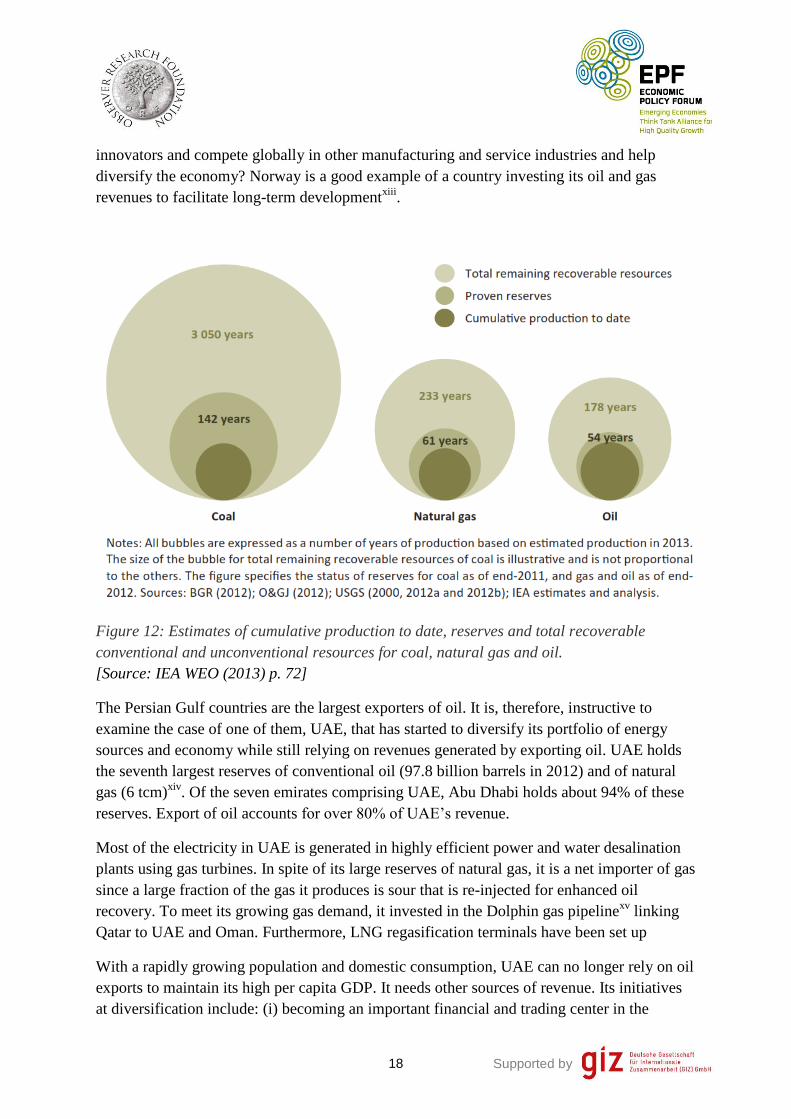
One must also always keep in mind the existence of extensive additional resources globally,
as shown in Figure 12, which can/will be exploited as prices rise. With growing demand and
improvements in recovery technology, the only foreseeable impediment to their development
(converting these resources to reserves) could be cost or public/political opposition in
response to environmental impacts and climate change due to greenhouse gas emissions.
In short, on the supply side, there is little incentive for countries and companies that can
produce and export oil/gas competitively in the international market to not continue to
develop these resources since it is unlikely that the transportation sector will transition away
from liquid fuels any time soon. The use of hybrid and higher mileage vehicles will grow, as
will those running on CNG or LNG, however, it is unlikely that these will grow fast enough
to result in a decrease in demand for oil in the coming decades. Unfortunately, the investment
in public transport systems is small compared to the growing demand for mobility driven by
rapid urbanization in the developing world. As long as the only other option is poor/unsafe
public transport, people will continue to invest in individual transportxii
. With little or no
threat to their bonanza in the near-term, the important question for oil exporting countries is:
are they investing the oil revenues in broad based development so that their citizens become
Supported by 18
innovators and compete globally in other manufacturing and service industries and help
diversify the economy? Norway is a good example of a country investing its oil and gas
revenues to facilitate long-term developmentxiii
.
Figure 12: Estimates of cumulative production to date, reserves and total recoverable
conventional and unconventional resources for coal, natural gas and oil.
[Source: IEA WEO (2013) p. 72]
The Persian Gulf countries are the largest exporters of oil. It is, therefore, instructive to
examine the case of one of them, UAE, that has started to diversify its portfolio of energy
sources and economy while still relying on revenues generated by exporting oil. UAE holds
the seventh largest reserves of conventional oil (97.8 billion barrels in 2012) and of natural
gas (6 tcm)xiv
. Of the seven emirates comprising UAE, Abu Dhabi holds about 94% of these
reserves. Export of oil accounts for over 80% of UAE’s revenue.
Most of the electricity in UAE is generated in highly efficient power and water desalination
plants using gas turbines. In spite of its large reserves of natural gas, it is a net importer of gas
since a large fraction of the gas it produces is sour that is re-injected for enhanced oil
recovery. To meet its growing gas demand, it invested in the Dolphin gas pipelinexv
linking
Qatar to UAE and Oman. Furthermore, LNG regasification terminals have been set up
With a rapidly growing population and domestic consumption, UAE can no longer rely on oil
exports to maintain its high per capita GDP. It needs other sources of revenue. Its initiatives
at diversification include: (i) becoming an important financial and trading center in the

Supported by 19
Middle East; (ii) developing its gas fields and processing of sour gas for export; (iii)
commissioning in 2012 of the Habshan-to-Fujairah oil pipeline to bypass the strategic Straits
of Hormuz, a potential choke point due to regional conflicts; (iv) integration of its electric
grid and gas supply with the other members of the Gulf Cooperation Council (GCC); (v)
Commissioned construction of the Barakah 5.6 GW nuclear power plant (four AP-1400
reactors) west of Al Ruwais in Abu Dhabi by Korea Electric Power Company (KEPCO); (vi)
invested in power intensive heavy industry such as the EMAL Aluminum smelterxvi
.
In addition to investments in infrastructure and industry, development of human resources is
of equal importance for diversification of the economy. Progress in this area is much harder
to quantify. A long-term challenge before all six members of the GCC is the reliance on
foreign workers and an underutilized indigenous population. It is too early to assess how long
it will take before the establishment of world-class universities by Qatar and Saudi Arabia to
create an indigenous highly skilled workforce will bear fruit. Meanwhile, they will need to
partner with foreign companies and attract talent to grow and sustain a diverse economic
portfolio. Oil and gas exports provide them with the revenue to pursue both strategies
simultaneously – attracting foreign workers and developing their own.
Natural Gas
Natural gas is widely hailed as the bridge fuel between the fossil-fuel (mostly coal and oil)
dominated economy of the 20th
century and the future zero-carbon economy based on
renewable sources. Even though it is a relative newcomer vis-à-vis coal and oil, it is the
cleanest burning and most multipurpose fuel of the three. It is used widely for home,
commercial and industrial use. It is an efficient transportation fuel in the form of CNG or
LNG, and used extensively for generating power using combustion turbines. It is also a key
feedstock in the fertilizer and petrochemical industry. After processing, natural gas burns
with relatively little pollution, nevertheless, it is a fossil fuel that produces CO2 when burned,
and methane is a powerful greenhouse gas and any leakages during production, processing
and/or transport contribute to global warming. From an economic and logistics perspective it
has two major drawbacks because it is a gas – transport and storage. The cost of transport
when a pipeline is not an option, for example exporting gas from the U.S. to China, is large,
about $4-8/MMBtu as discussed in Referencexvii
, and storage of natural gas as LNG is
expensive and limited in scope. The questions we would like to address with respect to the
realization of the full potential of using natural gas as a multipurpose fuel, are (i) is there
sufficient economically recoverable reserve of natural gas (and its geographic distribution)
that the industry will invest in enlarging not just production but the natural gas based
economy as a whole, for example CNG cars, (ii) where will the price stabilize with respect to
coal and oil, and (iii) can the production, especially of shale gas, be made more
environmentally benign to overcome the environmental impacts and objections regarding
current practice of hydraulic fracturing?

Supported by 20
Most of natural gas production in 2013 was from the exploitation of conventional reserves
and the geographic trade in 2012 is illustrated in Figure 13. Four countries – Russia,
Turkmenistan, Iran and Qatar account for about 60% of current conventional reservesvii
. The
next largest reserves, about 4% each, are in the U.S. and Saudi Arabia. After these there are
11 countries, each with 1–3% of the world’s total, and these include many of the current
exporters: Trinidad and Tobago, Norway, Algeria, Australia, Indonesia and Malaysia.
Historically, European countries and the Asian Tigers (Japan, Taiwan, South Korea and
Singapore) have dominated imports of natural gas. Recent growth in demand has been mostly
in producing countries and Asia-Pacific and has been driven by the power generation sector.
Outside of North America, export of natural gas is dominated by the Netherlands, Norway,
Russia, Turkmenistan (mostly by pipelines); Trinidad and Tobago, Nigeria, Qatar, Indonesia,
Malaysia and Australia (mostly as LNG); and by Algeria through pipelines and as LNG. The
development of new pipelines and LNG terminals takes between 5-10 years and requires very
significant investment. So growth in supply is incremental and most of the LNG terminals
under construction are in Australia, East-Africa and Asia-Pacificxviii
, the new centers of
export and of demand, respectively.
Figure 13: Global flows of international trade in natural gas in billion cubic meters/year
during 2012. [Source: BP Statistical review of World Energy 2013, p. 29]
Most developed countries have over built capacity in both gas and coal-fired power plants, so
they can balance their energy portfolio by increasing coal-fired generation when the price of
natural gas is high and vice-versa. This is evident in Europe since 2010, where demand of gas
has not taken off due to high relative price, and many countries, for example Germany as we

Supported by 21
discuss later in this paper, have expanded their coal-fired power generation instead. Because
of this elasticity in demand for natural gas, producing countries are developing their export
capacity incrementally, and in sync with the construction of new pipelines and/or LNG
facilities. Even then, as price fluctuates and demand varies, these facilities go through periods
of underutilization, for example LNG regasification terminals in Europe since 2011xix
. A
second strategy that countries importing natural gas, especially as LNG, follow to ward
against disruptions in supply is to maintain a diverse portfolio of sources. Large importers,
for example Japan, South Korea and Spain, have spread their purchases over many
suppliersvii
.
Post Fukushima, landed price of LNG in Japan reached about $20 per MMBtu as a result of
sudden increase in demand due to the shutting down of all nuclear reactors. In terms of stored
chemical energy, this price is equivalent to that for oil (the conversion factor for oil is 1 toe is
equivalent to 40MMBtu and we use $800/ton for the price of oil) and about 7-8 times that of
coal (using 1 tce = 30 MMBtu and $80/ton for the price of coal). At these prices coal-fired
generation becomes much more attractive in the absence of a carbon tax or trading scheme
and in spite of its environmental impacts. Three changes can tip the scale back in favor of
natural gas: (i) a significant carbon tax that makes coal more expensive, (ii) global
development of shale gas resources leading to lower prices and (iii) a global rejection of
nuclear power.
The first and third are mostly policy issues, albeit driven by economics and energy security.
In this paper we review the second issue – development of shale gas resources in Europe,
which currently imports most of the natural gas it consumes. Since European countries are
also leading the world in experimenting with a carbon pricing and in rejecting nuclear power,
the question is – is Europe on a fast track to repeat the success of shale gas production in the
U.S. or will it remain dependent on imports for gas?
Prospects for shale gas production in Europe: According the recent study by ARIxx
,
Europe holds about 25 tcm of technically recoverable shale gas. This is about a third of
conventional reserves in Europe and Eurasia that are essentially all concentrated in Russia
and Turkmenistan. The region’s shale gas resources are located in three major areas that
contain multiple basins, sub-basins and different plays as shown in Figure 14. One area of
prospective gas runs from eastern Denmark and southern Sweden (Alum shales) across
northern and eastern Poland (Silurian shales) into the Ukraine; the second stretches from
northwest UK, through the Netherlands and northwest Germany to southwest Poland; and the
third from southern UK through France (Paris basin), the Netherlands, northern Germany
and Switzerland. According to assessments, southern Europe does not have large basins. It
should be noted, however, that with limited validated drilling results, overview maps such as
the one shown in Figure 14 are largely based upon geological evidence and do not provide a
statement on commercial viability of gas extraction.

Supported by 22
Figure 14: Map of shale gas and coal bed methane basin from OECD/IEA 2012.
[Source: IEA (2012), Golden Rules for a Golden Age of Gas, p. 121]
In addition to the lack of adequate data from drilled-wells, there are many geological, social
and economic reasons why Europe is likely to be less prospective than North America. These
reasons include:
A more fragmented geology (volume and area), and less mature and more
geologically active basins resulting in smaller sweet spot areas than in the U.S.
The depth of shale formations ranges from 2500 to 3700 meters below the surface,
significantly deeper than the formations in North America. Also, many promising
ones are offshore in the North Sea.
Higher population density limits both access to promising drilling sites and also
constrains large-scale closely spaced drilling sites.
Stricter environmental regulations, higher public awareness and active opposition.
The public is sensitized to the disruptive impacts of the truck traffic associated with
the wells for transporting water and equipment.
State ownership of oil and gas rights versus landowner’s rights in the U.S. might limit
the incentives for private landowners and communities to accept and benefit from
local shale gas development.
Legislation and regulations regarding upstream unconventional gas production is
highly fragmented and nationalised within Europe.
Shale production costs are assumed to be significantly higher in Europe compared to
the U.S. due to geological and technical reasons as well as higher regulatory and
environmental expenses.

Supported by 23
Europe is lacking the dynamic investment and production stimulating factor of
continuous drilling obligations.
Shale gas in Europe will have to be competitive versus imports of conventional gas
from Russia, the Caspian Sea basin and North Africa to which it is connected via an
extensive network of pipelines.
Keeping these challenges in mind, the state of affairs in selected European nations is as
follows.
France with estimated reserves of about 4 tcm (compared to annual consumption of
0.04 tcm and negligible indigenous production of conventional gas) was expected to
be one of the first countries to develop its shale gas resources. However, in 2011 the
government banned shale gas production using hydraulic fracturing (fracking)
because of public and political concerns over the environmental impacts and
furthermore cancelled the exploration permits issued in 2010 to Schuepbach Energy
and Total. President Hollande confirmed the ban in 2012 and France’s highest court
upheld the government ban on October 11, 2013xxi
.
UK (0.75 tcm): shale gas activities are strongly backed by the British Prime Minister
Cameron, however, it is unlikely to be a game changer as the estimated reserves are
less than 1Tcm and public discussion on its need is ongoing. After promising first
drillings by Cuadrilla Resources, public opposition due to environmental and seismic
concerns has led to a temporary moratorium on fracking pending investigation into
induced seismic activity.
Germany, with about 0.5 tcm listed, is in a similar boat as the U.K. and faces strong
public awareness and opposition.
Scandinavia (1.2 tcm) sits on top of the large and promising Alum Basin, however,
after some test wells in Sweden, Shell stopped activities there. The 2013 updated
assessments from ARI has eliminated speculative area for Alum Shale in Norway and
put reserves down to zero from a promising 2.3tcm in the former version.
Poland, with its promising Baltic Basin, was the designated European champion and
the Polish government has been actively boosting the shale gas industry to reduce its
unwelcomed dependence on Russian gas and to diversify away from coal. Several
setbacks and problems have dampened Poland’s hopes. A series of first test drills did
not prove viable for commercial shale gas production and some multinational players
(ExxonMobil, Talisman and Marathon) exited. Recent reassessments by the Polish
Geological Institute and EIA have scaled down the expectations. Furthermore, a
number of hurdles exist regarding geology, gas transmission and distribution
infrastructure, legislation and bureaucracy and last but not least the questionable
profitability of shale gas production. The Polish government is keen on addressing
some of these issues and recently presented two bills to cope with some weaknesses in
legislation (temporary reduction of hydrocarbon tax and weakened intervention rights
of state institutions). Current assessment is that even with strong political support,

Supported by 24
large-scale production is not expected much before 2020 even though Prime Minister
Tusk has indicated that commercial production could begin as early as 2014.
Ukraine with estimated 3.5 tcm is also keen to exploit its shale gas resources to reduce
dependence on Russia. In 2013 it signed a contract with Royal Dutch Shell allowing
them to explore the Yuviska block, and ENI, Chevron and other majors are said to be
ready to join in. While encouraging, it is too early to assess how shale gas recovery
will evolve in Ukraine, especially in light of the current political instability.
The upshot is that shale gas is unlikely to be a game changer in Europe in the near-term.
Nevertheless, the very potential of shale gas is likely to improve trade relations with Russia
that is keen to maintain its strong position vis-à-vis gas and oil exports to Europe and does
not view the development of shale gas as being in its best interest.
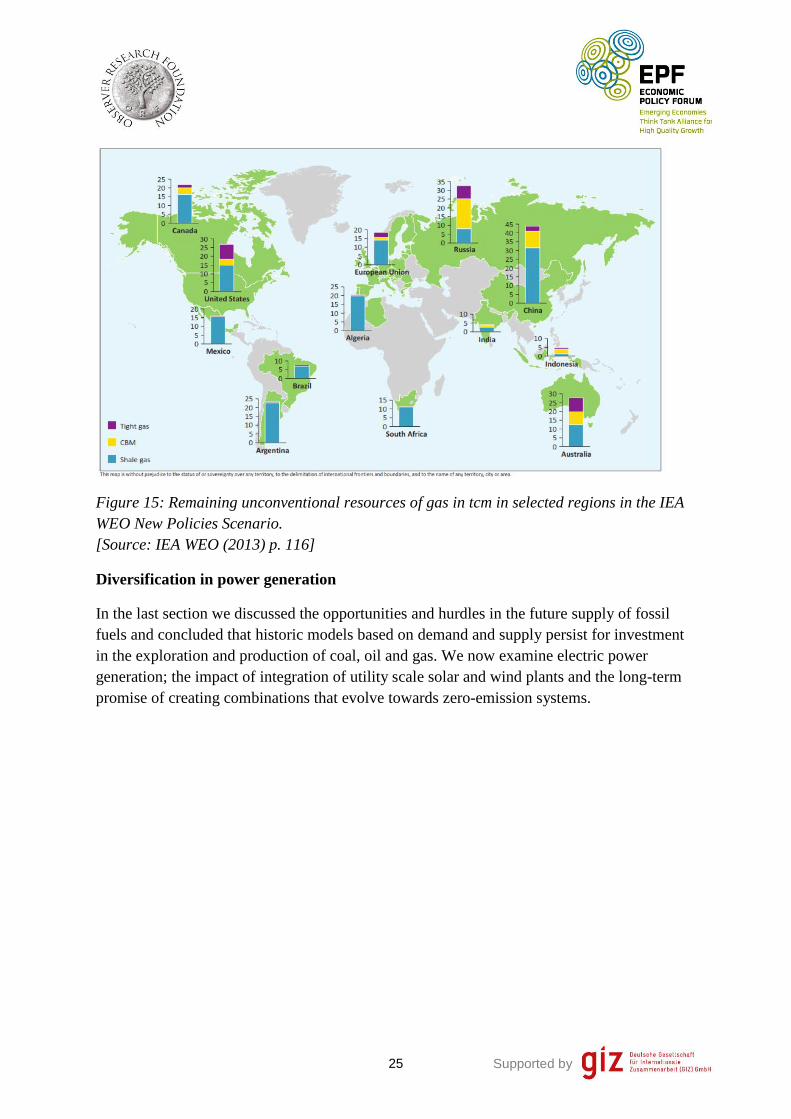
Figure 15 gives the IEA assessment of the global geographic distribution of remaining
unconventional gas resources in tcm at the end of 2012. According to such assessments,
Argentina and China have amongst the largest predicted resources of shale gas and they have
the motivation to exploit them because of a large growing demand for gas. Again, both
countries face serious social, infrastructure and technological challenges and regulatory
impediments to attracting investment and international participation. Argentina will have to
address issues of populist government policies and price controls and an unattractive business
climate for foreign companiesxxii
. Chinese government is committed to rapid development of
its shale gas resources, however, their reserves are again deeper than in the U.S. and in less
accessible and more water stressed areas (mountainous, arid West and Southwest or
overlapping with conventional oil/gas fields) that will need larger investment in exploration
and infrastructure. The regulatory and business climate for foreign companies also needs to
be improvedxxiii
. As a result, the growth in exploration and production is much slower than
expected. The bottom line is that it remains to be seen how soon any country outside North
America can join in the shale-gas revolution.
Supported by 25
Figure 15: Remaining unconventional resources of gas in tcm in selected regions in the IEA
WEO New Policies Scenario.
[Source: IEA WEO (2013) p. 116]
Diversification in power generation
In the last section we discussed the opportunities and hurdles in the future supply of fossil
fuels and concluded that historic models based on demand and supply persist for investment
in the exploration and production of coal, oil and gas. We now examine electric power
generation; the impact of integration of utility scale solar and wind plants and the long-term
promise of creating combinations that evolve towards zero-emission systems.
Supported by 26
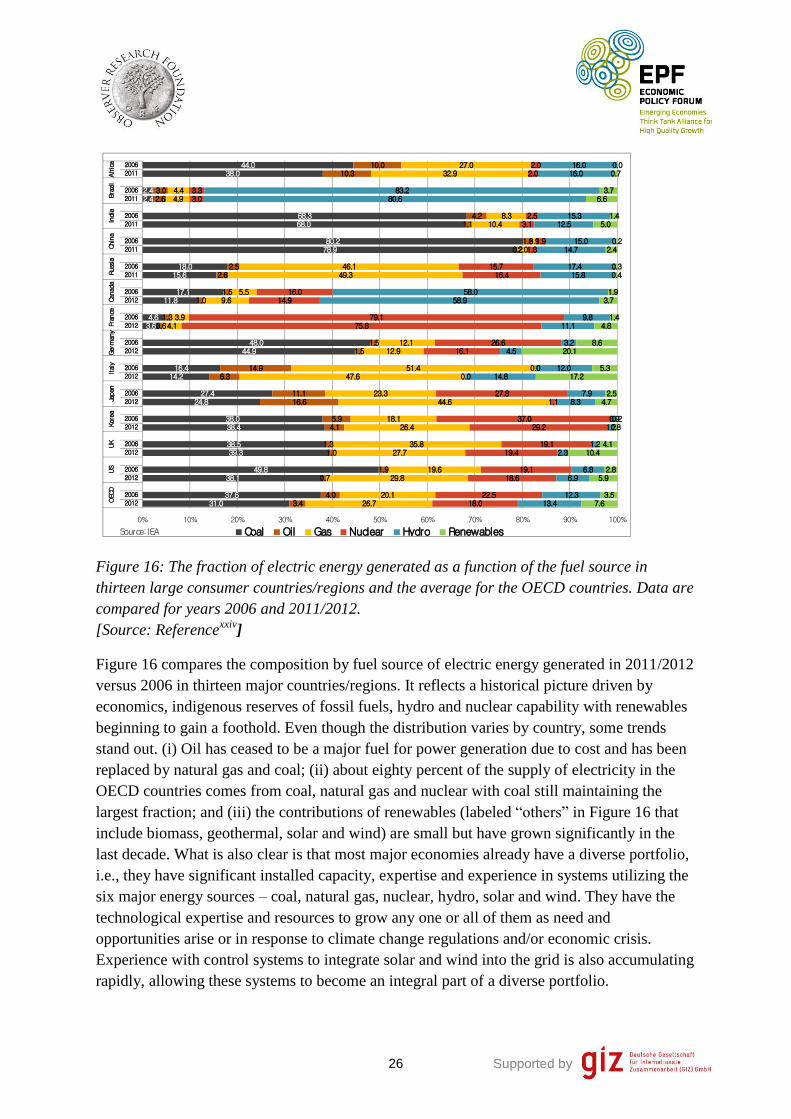
Figure 16: The fraction of electric energy generated as a function of the fuel source in
thirteen large consumer countries/regions and the average for the OECD countries. Data are
compared for years 2006 and 2011/2012.
[Source: Referencexxiv
]
Figure 16 compares the composition by fuel source of electric energy generated in 2011/2012
versus 2006 in thirteen major countries/regions. It reflects a historical picture driven by
economics, indigenous reserves of fossil fuels, hydro and nuclear capability with renewables
beginning to gain a foothold. Even though the distribution varies by country, some trends
stand out. (i) Oil has ceased to be a major fuel for power generation due to cost and has been
replaced by natural gas and coal; (ii) about eighty percent of the supply of electricity in the
OECD countries comes from coal, natural gas and nuclear with coal still maintaining the
largest fraction; and (iii) the contributions of renewables (labeled “others” in Figure 16 that
include biomass, geothermal, solar and wind) are small but have grown significantly in the
last decade. What is also clear is that most major economies already have a diverse portfolio,
i.e., they have significant installed capacity, expertise and experience in systems utilizing the
six major energy sources – coal, natural gas, nuclear, hydro, solar and wind. They have the
technological expertise and resources to grow any one or all of them as need and
opportunities arise or in response to climate change regulations and/or economic crisis.
Experience with control systems to integrate solar and wind into the grid is also accumulating
rapidly, allowing these systems to become an integral part of a diverse portfolio.
3.64.6
11.817.1
15.618.0
78.980.2
68.068.3
2.42.4
38.044.0
0.61.3
1.01.5
2.62.5
0.21.8
1.14.2
2.63.0
10.310.0
4.13.9
9.65.5
49.346.1
2.00.9
10.48.3
4.94.4
32.927.0
75.879.1
14.916.0
16.415.7
1.81.9
3.12.5
3.03.3
2.02.0
11.19.8
58.958.0
15.817.4
14.715.0
12.515.3
80.683.2
16.016.0
4.81.4
3.71.9
0.40.3
2.40.2
5.01.4
6.63.7
0.70.0
2012
2006
2012
2006
2011
2006
2011
2006
2011
2006
2011
2006
2011
2006
Germ
any
Fran
ceCan
ada
Russ
iaChin
aIn
dia
Bra
zil
Africa
31.037.6
38.149.8
39.338.5
38.438.0
24.827.4
14.216.4
44.948.0
3.44.0
0.71.9
1.01.3
4.15.9
16.611.1
6.314.9
1.51.5
26.720.1
29.819.6
27.735.8
26.418.1
44.623.3
47.651.4
12.912.1
18.022.5
18.619.1
19.419.1
29.237.0
1.127.8
0.00.0
16.126.6
13.412.3
6.96.8
2.31.2
1.20.9
8.37.9
14.812.0
4.53.2
7.63.5
5.92.8
10.44.1
0.80.2
4.72.5
17.25.3
20.18.6
0% 10% 20% 30% 40% 50% 60% 70% 80% 90% 100%
2012
2006
2012
2006
2012
2006
2012
2006
2012
2006
2012
2006
2012
2006
OEC
DUS
UK
Kore
aJa
pan
Ital
yGerm
any
Coal Oil Gas Nuclear Hydro RenewablesSource: IEA
Supported by 27
Mitigation of climate change requires that these fractions transition from the current
domination by fossil-fuels to one with renewable generation. Before examining how these
fractions could evolve in the future, it is instructive to examine the potential for such changes
by reviewing recent significant changes in Japan, Germany and the U.S.
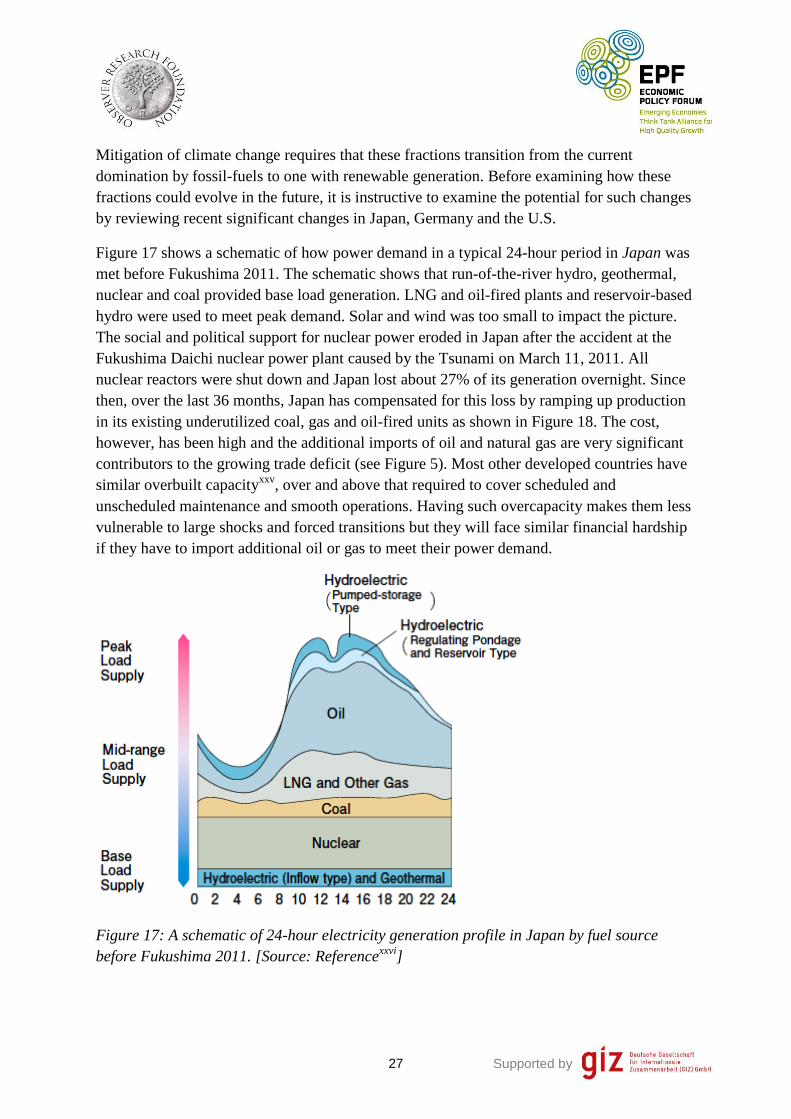
Figure 17 shows a schematic of how power demand in a typical 24-hour period in Japan was
met before Fukushima 2011. The schematic shows that run-of-the-river hydro, geothermal,
nuclear and coal provided base load generation. LNG and oil-fired plants and reservoir-based
hydro were used to meet peak demand. Solar and wind was too small to impact the picture.
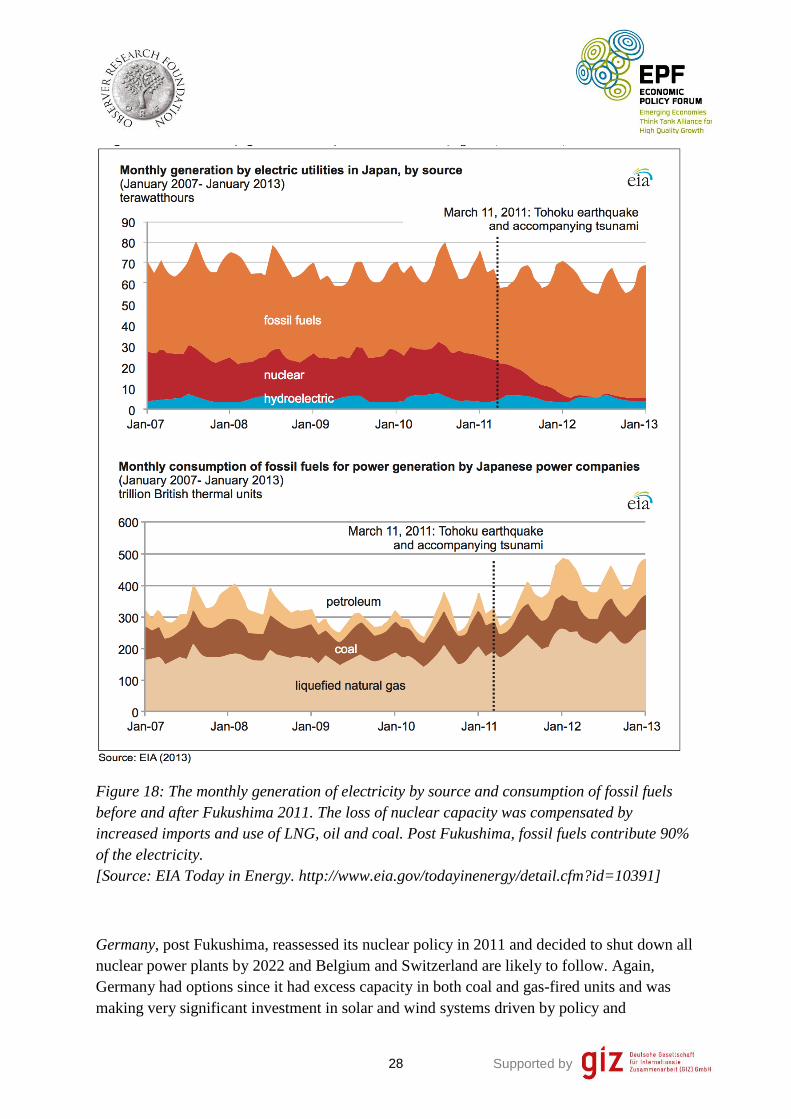
The social and political support for nuclear power eroded in Japan after the accident at the
Fukushima Daichi nuclear power plant caused by the Tsunami on March 11, 2011. All
nuclear reactors were shut down and Japan lost about 27% of its generation overnight. Since
then, over the last 36 months, Japan has compensated for this loss by ramping up production
in its existing underutilized coal, gas and oil-fired units as shown in Figure 18. The cost,
however, has been high and the additional imports of oil and natural gas are very significant
contributors to the growing trade deficit (see Figure 5). Most other developed countries have
similar overbuilt capacityxxv
, over and above that required to cover scheduled and
unscheduled maintenance and smooth operations. Having such overcapacity makes them less
vulnerable to large shocks and forced transitions but they will face similar financial hardship
if they have to import additional oil or gas to meet their power demand.
Figure 17: A schematic of 24-hour electricity generation profile in Japan by fuel source
before Fukushima 2011. [Source: Referencexxvi
]
Supported by 28
Figure 18: The monthly generation of electricity by source and consumption of fossil fuels
before and after Fukushima 2011. The loss of nuclear capacity was compensated by
increased imports and use of LNG, oil and coal. Post Fukushima, fossil fuels contribute 90%
of the electricity.
[Source: EIA Today in Energy. http://www.eia.gov/todayinenergy/detail.cfm?id=10391]
Germany, post Fukushima, reassessed its nuclear policy in 2011 and decided to shut down all
nuclear power plants by 2022 and Belgium and Switzerland are likely to follow. Again,
Germany had options since it had excess capacity in both coal and gas-fired units and was
making very significant investment in solar and wind systems driven by policy and

Supported by 29
incentives. The guaranteed tariffs to solar and wind operators (part of the “Energiewende”
policyxxvii
that set the goal of 80% share of renewable energy in electricity generation by
2050) meant that power companies were obliged to first absorb generation from these and
run-of-the-river hydroelectric power plants. For the rest, the way the German system evolved,
however, included surprises. In the short term due to the collapse of the EU ETS (Emission
Trading Scheme), the higher costs of power from natural gas versus coal (see Figure 19)
favored higher utilization of coal-fired units, many of which are the recently built high
efficiency supercritical units (those burning domestic lignite are called BoA, short for
Braunkohlenkraftwerk mit optimierter Anlangentechnik). The result is that natural gas units
(cleaner and more energy efficient) have been squeezed out. Even recently commissioned
high efficiency CCGT units, such as the latest SGT5-8000H turbines by Siemens at Irsching,
are highly underutilized as a resultxxviii
.
Figure 19: Development of clean dark and spark spreads in Germany 2007-2013. The upper
curves show the evolution of the clean dark spread (blue) and clean spark spread (orange) in
EUR/MWh. The spreads are the difference between the price received for electricity
produced and the cost of the natural gas (coal) needed to produce that electricity and include
CO2 emissions (allowance) cost. If the spread turns negative (orange) the power station loses
money by operating. The bottom (black) curve highlights the growing divergence (blue minus
orange) between clean dark and spark spread since 2003, making investments in coal power
plants (relatively) more and more attractive since 2010.
[Source: Referencexxix
]

Supported by 30
In Figure 20, we show electricity demand over a typical week in Germany and the
composition of the supply. To accommodate the large generation from wind turbines during
that weekend, energy companies scaled back generation from black coal and natural gas since
these fuels are imported and more costly. To optimally reduce costs power plants using them
are the first to be scaled back independent of conversion efficiency. Also, grid connections to
neighboring countries allow Germany to export excess generation, which was substantial and
comparable to the sum of wind and solar generation throughout the week. Integration at the
system level allowed it to maintain energy security and export excess generation.
Figure 20: Actual Electricity generation in Germany by fuel source and exports during a
week in March, 2013. [Source: Referencexxx
]
Germany has taken a bold step towards zero-carbon generation by promoting renewables and
closing the option of nuclear power. The initial transformation towards renewables has been
achieved with a price tag in the form of the EEG surcharge. So, the near- and medium-term
questions for even Germany, with its high technology industry, ground up activism by the
municipal corporations and citizens, and willingness of the citizens to pay higher price for
green energy is whether the renewable subsidies can be phased away and will the economy
be able to withstand the impacts of higher cost of electricityxxxi
? Already, protests against
high household energy costs have lead to sweeping reforms of renewable energy laws to keep
power prices from spiralling out of controlxxxii
.
The U.S. has historically obtained about 50% of its electric power from coal-fired units. The
boom in shale gas production has made natural gas-fired generation highly competitive since
2008. Serendipitously, the U.S. had overbuilt CCGT capacity during 1995-2004 when gas
was cheap, so in 2008 it was in a position to rapidly transition from coal to gas-fired units and
reduce its coal-fired generation fraction to about 37% by 2012xxxiii
. (Also note that a GW
capacity CCGT power plant can now be brought online in about 18-24 months and the

Supported by 31
regulatory requirements are fewer). As a result, the two goals, profit and reducing the carbon
and environmental footprint, became aligned.
The examples of these three countries highlight the advantages of a diversified portfolio of
generation, integrated systems and of maintaining excess capacity. Countries with large fuel
reserves and/or overbuilt capacity have options and can exploit them quickly - the natural gas
rich U.S.A. could make the transition from coal to gas overnight, whereas Germany could
renounce nuclear power in response to public pressure and go back to a higher fraction of
coal-fired generation. Germany could have equally well increased gas-fired generation but
chose coal because it is the much cheaper option. Similarly, overbuilt capacity allowed Japan
to substitute nuclear by fossil fuel systems in a short time in response to a crisis.
In a carbon constrained world, the question, however, is – how can countries starting with
distributions similar to those shown in Figure 16 accelerate the transition to carbon neutral
systems? Installations of wind and solar systems are growing and wind is now price
competitive with natural gas on total energy generated ($/kWh) basis (see, for example, the
analysis of levelized cost of generation by EIAxxxiv
). Nevertheless the challenge of integrating
intermittent and fluctuating generation from solar and wind, real-time management of
economics of different systems and the long experience with and investment in existing
fossil-fuel based systems makes the transition difficult. Countries, therefore, maintain the full
diversity of generating options to ensure energy security under rare disruptive events and
integrate renewable generation in small increments to ensure reliability of supply at each step.
Below are example of three countries, Brazil, Canada and Denmark, which have the
resources to follow credible roadmaps towards zero-carbon systems while preserving energy
security and yet have not stopped installing/using fossil-fuel based units.
Brazil generates about 80% of its electricity from hydro, and a large fraction of these projects
are reservoir basedxxxv
. It can therefore integrate very substantial amounts of solar and wind
energy into the grid with hydro providing backup and stability. So it should come as no
surprise that the availability of inexpensive backup power from hydro allowed a large number
of wind farms to win bids at the annual energy auctions at rates that made bids from coal and
gas based plants less competitive. The government, however, wants to maintain a diverse
portfolio, to ward against times when the wind does not blow or a year with low rainfall or in
the event of any other emergency. So, it is revising its rules for energy auction starting in
2013 by creating different categories of plants so that fossil-fuel fired plants do not compete
against wind and there is development of bothxxxvi
. New installations of CCGT plants that
provide additional generation capacity for meeting peak demand and as backup to renewables
have also been facilitated by the linking of the natural gas pipelines in the Northeast and
Southeast by the Southeast Northeast Integration Gas Pipeline (GASENE) in March
2010xxxvii
. (The GASENE pipeline will also reduce the amount of natural gas that Brazil
imports by transporting gas from new fields in the Campos Basin to Rio de Janeiro.) Adding
to this mix, Brazil plans to enlarge its nuclear power fleet, starting with the 1350 MW Angra-

Supported by 32
3 reactor that is expected to come online in 2016, as an important part of its diverse portfolio
to ensure long-term energy security and to meet its growing demand for electricity.
Brazil could provide an example of an emerging economy that is rich in fossil fuels and yet
chooses to meet its electric demand through a combination of hydro, nuclear, solar and wind
systems. Achieving this would require significant investment in the transmission grid. Or it
can continue with the current policy of opportunistically installing CCGT (and even coal)
plants near demand centres along with hydro, wind and solar. The question for the future,
assuming continuation of demand growth at about 7% per year seen over the last decade, is
whether the public will advocate for a mix including significant fossil-fuel based generation
that results in a lower tariff or will the public be willing to pay higher rates and require utility
companies to work towards a zero-carbon system and, at the same time, maintain
underutilized fossil-fuel based capacity to be used only for backup to provide high-quality
reliable power? Brazil has the resources and the revenue from growing oil exports to try the
bolder approach, similar to what Germany is trying under a different economic, social and
resource environment.
Canada presents a different case study. It gets about 60% of electricity from hydro and has
vast untapped hydroelectric potential concentrated in British Columbia, Ontario and Quebec,
whereas Alberta has large deposits of coal, gas and tar sands. The electric power grid in each
state is mostly oriented North-South, so it is much easier to export power to the U.S. than to
even a neighbouring state. As a result, for example, Quebec cannot easily export power to its
neighbours or further develop its hydro potential in response to demand growth in other states
without significant investment in an East-West transmission grid. Ontario, with a diverse
portfolio, has decided to eliminate coal-fired generation by 2014 and is investing in CCGT,
hydroelectric and wind projects. It has also recommissioned mothballed nuclear reactors.
Alberta is modernizing its coal-fired units. As a result Canada is, overall, consuming less coal
but the fall in coal production is much less. The savings in coal that used to be consumed in
Alberta and the coal that used to be transported from Alberta to Ontario is now being
exported to Asian markets. Thus, while Canada is making serious efforts to reduce its carbon
footprint in the power generation sector, it is at the same time capitalizing on the opportunity
to export the “saved” coal to be burned elsewhere. Will this story be repeated by other
countries with multiple options as they transition away from coal-fired generation? The
answer most likely is yes as long as China and India continue to rely on coal.
Lastly, we consider the well-publicized success story of wind-power in Denmark, which in
2013 provided almost 30% of its electricity and this percentage has been growingxxxviii
. This
growth is, however, not occurring in isolation as many favorable conditions exist. Denmark
is, in fact, a good example of what needs to happen for renewable generation to become a
significant fraction of the total. First, Denmark has very good on-shore and off-shore wind
resources with a country average turbine load factor of more than 25%. Second, it has two
pioneering state-of-the-art turbine manufacturing companies, Vestas and Siemens Wind
Supported by 33
Power, that are creating new opportunities with the development of high capacity on-shore
and off-shore systems. Third, the integration of wind is facilitated by the Danish grid being
part of the Scandinavian grid, which allows fluctuations in wind energy to be balanced by
hydro generation in Norway and Sweden and nuclear power from Finland and Sweden.
Fourth, there is active electricity trade with Germany, Sweden and Norway providing an
outlet for excess generation from wind. The integration of wind power is, in fact, into a larger
well-integrated system. Fifth, Denmark takes climate change very seriously and has
formulated a very aggressive Energy Strategy 2050xxxix
, with the target of full phase out of
fossil fuels for electricity and transport purposes by 2050. It strongly supports aggressive
reductions of greenhouse gas emissions in international meetings and is developing a detailed
implementation plan to meet its zero-carbon goal. Lastly, the public is very supportive of
wind farms in their backyards and is willing to pay a higher price for electricity to promote
them. Looking ahead, it will be instructive to see how, given all the favorable conditions, it
replaces the current share of generation by fossil fuels, about 45% of the electricity comes
from coal and another 20% from natural gas, by low-carbon options.
The Future of Nuclear Power:
No discussion on power generation and a zero-emission economy is complete without a peek
into the crystal ball of nuclear energy. The legacy of the Three Mile Island and Chernobyl
accidents and the recent meltdown at the Fukushima Daichi plant have created very
significant setbacks to the growth of nuclear power. The challenges are largely economic,
relatively high cost of new builds in the absence of a carbon tax, and public perceptions. Even
if one makes a convincing case that modern generation III and III+ reactors are overdesigned
and safe, the public is not convinced that the cadre of operators are well trained in safety and
security procedures and the utility companies sufficiently well-motivated (regulated) to not
cut corners vis-à-vis operations and maintenance over the lifetime of the plant. Such a
visceral lack of trust by the public played a very significant role in forcing the German
government to shut down all nuclear reactors by 2022. One question that the global public is
now asking is – if the Japanese and Germans operators and utility companies cannot be
trusted to follow safety and security procedures, then who can be trusted? They question the
basic premise that a workforce that is adequately steeped in a culture of safety and security
can be trained and maintained globally. Lastly, there is the additional issue of waste disposal,
for which technical options exist but the public is not convinced of their long-term safety. In
short, they do not want reactors or waste-disposal sites “in their backyard”.
Addressing all the safety, security and liability concerns has contributed very significantly to
price escalation and delays in constructionxl
. As a result, nuclear power and nuclear industry
in 2013 is mostly growing in four countries in which government controlled companies play a
major role – Russia, China, India and South Korea. Large-scale growth of nuclear power
worldwide remains uncertain. Without significant growth of nuclear power, the remaining
near-term options to transition to a zero-carbon economy are increases in efficiency, terawatt

Supported by 34
scale installations of hydro (with a totel pontential of about 2 TW of which about one has
been realized), solar and wind, and fossil-fuel fired plants with carbon capture and storage.
Cost of Electricity:
One must, in addition to an analysis of the fraction of energy generated by source as shown in
Figure 16, discuss the cost of electricity. Household electricity prices (in Euro cents/kWh and
including all taxes) in European countries are shown in Figure 21 for the second semester of
2012xli
. A comparison of the 2011 prices in US-cents/kWh for major economies is shown in
Figure 22. It is evident from these figures that the public in countries that take climate change
seriously are willing to live with (or at least experiment with for the time being) higher cost
of electricity. Three countries that strongly support measures to reduce emissions of
greenhouse gases, Denmark, Germany and Spain, have the highest prices. Their experience
suggests that the sustainable cost of electricity with about 30% renewable generation is
between $0.3-0.4/kWh. Environmentalists contend that this is indeed the true sustainable cost
of electricity and if fossil-fuel based generation is cheaper it is because it is subsidized and
because externalities (such as climate change, environmental and health impacts) have not
been accounted for.

Supported by 35
Figure 21: The cost of electricity in various European countries in Euro cents/kWh for the
second semester of 2012.
[Source: Referencexli
]
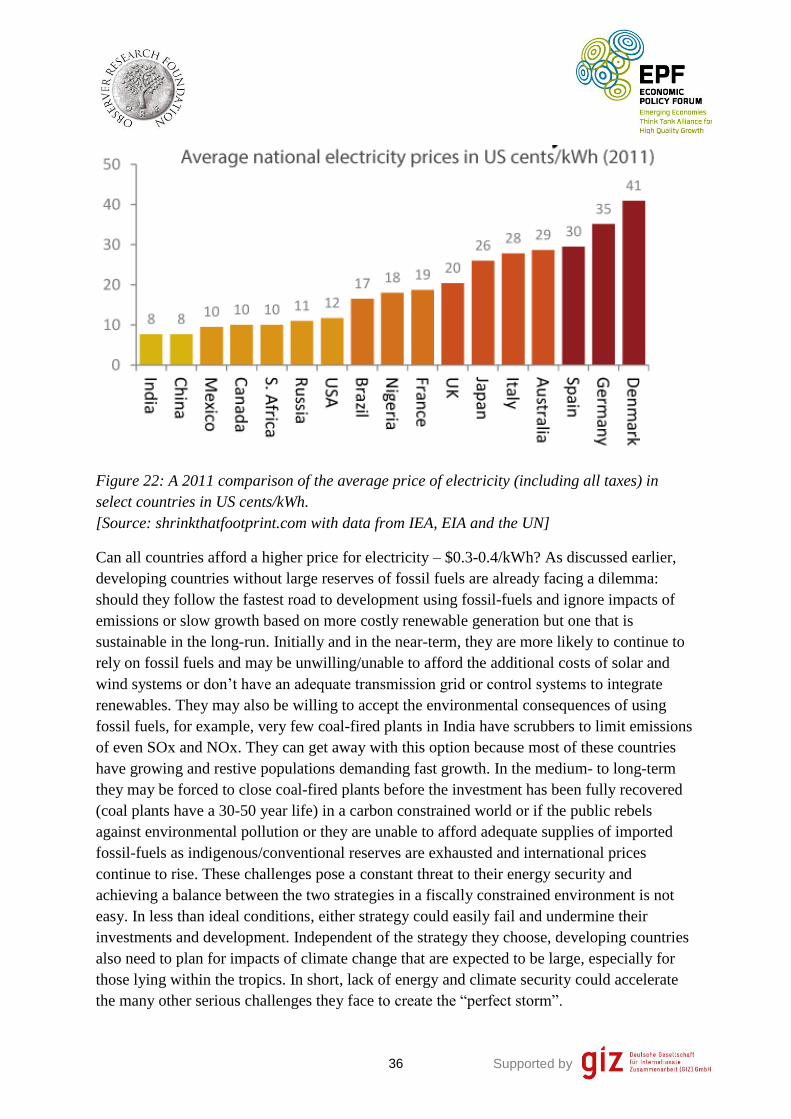
Supported by 36
Figure 22: A 2011 comparison of the average price of electricity (including all taxes) in
select countries in US cents/kWh.
[Source: shrinkthatfootprint.com with data from IEA, EIA and the UN]
Can all countries afford a higher price for electricity – $0.3-0.4/kWh? As discussed earlier,
developing countries without large reserves of fossil fuels are already facing a dilemma:
should they follow the fastest road to development using fossil-fuels and ignore impacts of
emissions or slow growth based on more costly renewable generation but one that is
sustainable in the long-run. Initially and in the near-term, they are more likely to continue to
rely on fossil fuels and may be unwilling/unable to afford the additional costs of solar and
wind systems or don’t have an adequate transmission grid or control systems to integrate
renewables. They may also be willing to accept the environmental consequences of using
fossil fuels, for example, very few coal-fired plants in India have scrubbers to limit emissions
of even SOx and NOx. They can get away with this option because most of these countries
have growing and restive populations demanding fast growth. In the medium- to long-term
they may be forced to close coal-fired plants before the investment has been fully recovered
(coal plants have a 30-50 year life) in a carbon constrained world or if the public rebels
against environmental pollution or they are unable to afford adequate supplies of imported
fossil-fuels as indigenous/conventional reserves are exhausted and international prices
continue to rise. These challenges pose a constant threat to their energy security and
achieving a balance between the two strategies in a fiscally constrained environment is not
easy. In less than ideal conditions, either strategy could easily fail and undermine their
investments and development. Independent of the strategy they choose, developing countries
also need to plan for impacts of climate change that are expected to be large, especially for
those lying within the tropics. In short, lack of energy and climate security could accelerate
the many other serious challenges they face to create the “perfect storm”.
Supported by 37
Serious challenges to integration of solar and wind systems
We give two examples to illustrate why integration of wind and solar systems above a certain
percentage poses an economic challenge. These examples also highlight the observation that,
if significant reservoir based hydro or nuclear capacity does not exist and fossil-fuel fired
plants are used for backup then reductions in greenhouse emissions will continue to be
limited.
Consider a grid-connected community in which every household has installed solar
photovoltaic systems that under net-metering makes their electricity bill zero. The utility
company then has no revenue generation from this community. Its function is to absorb all
the extra production from solar during the day and supply backup power (largely from fossil-
fuel based generation) during the times when there is no sunlight, and do this without any
compensation. To survive, the utility company needs to export the extra power to other
communities during the day and/or charge all customers for providing backup power.
Assuming that on average there are six hours of sunshine in a day, to absorb the extra power
generated by the enlightened community would require the utility company provides this
power to another 2-3 similar communities that do not have any solar installations.
Furthermore, the company would also need to maintain the original generation capacity as
“backup” to cover all the non-daylight hours and cloudy days without much PV generation.
Alternately, charging for backup, either on a per kWh basis (amounting to negating the net-
metering agreement) or as a fixed monthly connection charge would increase the cost to the
consumer. In this scenario, with only about a third of the people installing solar PV systems,
net-metering would not be sustainable and utility companies would need to charge a higher
tariff to survive.
Off-grid solar and wind systems are an invaluable resource for communities that today have
no electricity. However, as their expectations grow beyond low power applications (solar
lanterns, LEDs, fans, battery chargers) to fully switched systems, solar power or small wind
turbines with battery storage become too expensive. As mentioned earlier, even when solar
PV and wind systems become cost competitive, storage/backup remains the key hurdle to
large scale integration.
Furthermore, the rising shares of renewable generation and characteristics of conventional
generators are already challenging the usual business models of power companies at various
levels. For instance, Europe is discussing establishing a capacity market for power generators
that are severely impacted by current market conditions. The idea is to compensate power
plants with (too) low load factors for providing capacity, therefore making them financially
viable for the long-term. The markets would be setup via auctions: the first such auction by
the UK power market is scheduled for November 2014xlii
.
Supported by 38
The second example is Denmark, which we have already discussed. It, as well as Norway,
Sweden, and Finland, can continue to install more wind capacity because they are part of the
larger Scandinavian grid. Hydro generation from Norway and Sweden and nuclear from
Sweden and Finland can provide low-emissions backup. Also, Denmark can trade electricity
with Germany. This is a low-carbon system but can it be reproduced globally? The answer is
yes for regions with large hydroelectric (or CCGT) capacity and for regions in which
countries (provinces) are willing to cooperate and agree on a common reasonable tariff. In the
absence of cooperation, countries with large baseload generation capacity can blackmail
those with only solar and wind systems. Unfortunately, such favorable conditions of trade
and cooperation do not exist in the most populous continent with the highest growing demand
for energy – Asia. Even in the case of Denmark, it will be interesting to see how, having
demonstrated 30% integration of wind, it replaces its coal and gas-fired generation, which
today provides about 65% of the electricity, without further large increases in the tariff. Also,
will Denmark retire its fossil-fuel based capacity if Norway develops its wind resources and
offers to export more power to Denmark? More generally, will countries even within the
European market be willing to accept long-term reliance on other countries for majority of
their electricity?
Potential game changing technologies
What novel technologies can help overcome current limitations of energy systems? We
briefly state four amongst many (see Table 1.6 and section 7 in WEO 2013), which in our
opinion are low probability possibilities in the near- to medium-term, but may provide large-
scale options in the long-term.
A hydrogen economy: if hydrogen can be produced cost-effectively from non-fossil sources
(bio-inspired or by electrolosis using inexpensive electrodes and electricity generated by
wind and solar systems), then it can be used for both power generation and transport and also
for producing hydrocarbons. Achieving industrial scale production, however, needs major
technological breakthroughs.
Carbon capture and storage (CCS) on gigaton scale from large point sources such as fossil-
fuel fired power plants would allow them to become part of the low-emissions generation
mix. For CCS to become the norm, breakthroughs are needed for cost-effective technologies
for separation of CO2 from flue gases emitted by conventional coal and gas-fired power
plants and from syngas in case of IGCC plants. In addition, extensive risk analysis and
characterization of each storage site needs to be done. Even when these hurdles are overcome
there will be an economic and environmental cost: the additional cost of CCS is expected to
double the cost of electricity even in regions with nearby storage sites and an extensive
network of pipelines will need to be built to transport the CO2.
The third, most likely long-term innovation is in situ gasification for the utilization of
coalxliii
. Breakthroughs in technology for controlling the burn and mitigation of
Supported by 39
environmental impacts would open up new large resources that would otherwise not be cost-
effective. Produced syngas would fuel IGCC power plants which have lower carbon intensity
and the separation of greenhouse gases from syngas and exhaust gases is easier. The
environmental impacts of in situ gasification could be less as production would not involve
strip mining or processing of coal and much less water will be needed. One has to, however,
ensure that the many toxic sustances such as phenol and heavy metals left behind
underground after the burn do not migrate and pollute aquafers. While many countries with
large coal reserves/resources such as China, India, South Africa, New Zealand and Australia
are pushing such unconventional technologies, especially after the success of deep horizontal
drilling and hydraulic fracturing techniques leading to cost-effective production of shale gas
and oil, the prospects of their large-scale implementation remain uncertain.
The last technology we highlight is the transmission grid that needs to be modernized and
evolved towards a smart grid. The ultimate goal of a smart grid is incorporation of four
novel characteristics: sensors monitoring performance and utilization along the entire
network and at the load; information flow in both directions from control centers to end-users
and back; accessible controls at the load to manage demand; and the ability to seamlessly
integrate distributed, intermittent and fluctuating generation (solar and wind). Development
of smart grids poses technological, financial and social challenges. Low-cost and robust
monitors need to be developed for mass deployment at all levels of the grid of which smart
meters are the first step. Control (SCADA) systems to collect and integrate data securely and
process it in real time need to be developed as well as the human resource to manage and
operate them. Lastly, the end-users have to allow dispatch centers and utility companies
cyber access to control load (raising serious legal and emotional issues of privacy, control,
accidents and abuse) and to manage demand in exchange for lower rates, which realistically
could be much higher than current rates due to the additional instrumentation needed and its
management, maintenance and operation. Research and prototype development of these
technologies has begun, however, large-scale implementation is not expected in the near-
term.

Supported by 40
Conclusions
A diverse portfolio of energy sources, supplies and technologies are being pursued by all
countries to address their energy security needs and to ward against price volatility and
possible disruptions in supply. In addition to a discussion of evolving supply and demand, we
have abstracted some features common to countries that have large renewable generation and
have stringent climate change mitigation policies. The key features examined and highlighted
in this study include:
Fossil fuels will remain the backbone of energy systems for the next 20-30 years at least. In
addition to large conventional reserves of coal, oil and natural gas, there exist extensive
unconventional resources and the technology to exploit them is being developed steadily.
Exports of coal and natural gas are dominated by very few countries. Importing countries
seek to establish a diverse portfolio of suppliers, but many have established long-term
contracts with one or two suppliers due to geographic or economic constraints. Stable spot
market prices and the development of coal ports and LNG terminals allow countries to
maintain a larger portfolio of suppliers.
It is unlikely that there will be a significant competitor to oil for transportation in the near- or
medium-term. Gains in efficiency (high mileage cars and hybrids) and increase in the number
of vehicles powered by natural gas will be countered by the increase in the number of
vehicles on the roads and total miles driven. Significant penetration by electric cars is
unlikely in the near- or medium-term. Thus, oil producing companies and exporting countries
do not see a threat to their market in the near- or medium-term.
Countries that earn a significant fraction of their revenues from the export of oil and gas have
not been able to diversify their economies.
The success of shale gas and oil in the U.S. and Canada is unlikely to be duplicated in other
countries in the short-term. China is the most likely country to make the investments in the
near-term. It, however, needs to develop the required infrastructure and partner with
international companies to repeat the success story. In the near-term, new producers (LNG
from conventional reserves in Australia, Tanzania and Mosambique and pre-salt oil from
Brazil) are best poised to help meet the growing demand.
The future of nuclear power remains very uncertain. Most of the growth is projected to be in
four countries – China, India, Russia and South Korea – with state owned/supported nuclear
power companies.
There continue to be steady incremental improvements in energy efficiency, both in energy
generation and in use. As a result, the developed nations with stabilized populations and
peaked primary energy demand are reducing their energy intensity and their carbon footprint.
Supported by 41
The installation and integration of wind and solar systems without government subsidies is a
very significant addition to the cost of electricity due to the capital costs, needed
enhancements to the grid and the cost of backup. With backup provided by existing
hydroelectric and gas turbines, countries can generate up to about 30% of the electricity from
wind and solar but at a higher average cost of about $0.35/kWh. Lifecycle cost analyses of
fossil-fuel based generation show that this is the true cost of electricity and that current rates
are cheaper only because external costs (pollution, climate change, environmental impacts)
have not been adequately accounted for.
Countries with very favourable incentives for the development of wind and solar power, for
example Denmark and Germany, have attained significant capacity. For these to be
sustainable without subsidies, the public has to be willing to pay (and is paying) a higher
tariff for electricity.
Countries which generate a large fraction of their electricity from wind and solar (for
example, Denmark and Germany) are part of a larger grid and have active trade in electricity
with their neighbours that significantly helps balance supply and demand. A well connected
grid, large reservoir based hydroelectric generation and gas turbine based generation capacity
facilitate the integration of utility scale solar and wind plants.
Industrialized countries have overbuilt capacity of power generation spread over multiple fuel
sources. This excess capacity provides resilience against volatility in price of fossil fuels and
against disruptive consequences of disasters such as Fukushima 2011. Developing countries
do not have this flexibility as demand exceeds supply by a large amount. Developing new
capacity is already limited by the cost of the plant and the investment required to build and
maintain the enabling infrastructure and the human resources. They need technical and
financial assistance to develop low-carbon systems.
The world is faced with an enormous challenge – to provide 9 billion people with 21st century
opportunities in an environmentally responsible and sustainable manner. While technological
innovations are our default hope, social responsibility and lifestyle changes leading to
efficient use of resources have an equally large role to play. Nature is being pushed to, and in
many cases beyond, limits of sustainability. The impacts are long term, and in many cases
such as loss of species and desertification are irreversible. The decisions made in this century
will impact life on Earth for centuries to come.
Supported by 42
iSteckel et.al. “Development without energy?” Avaialble at
http://www.pik-potsdam.de/members/steckel/publications/development_energy_new.
IIASA Global Energy Assessment Chapter 2 presentation slides available at
http://www.iiasa.ac.at/web/home/research/Flagship-Projects/Global-Energy-
Assessment/GEA_Chapter2.pdf.
iiThe Kyoto Protocol framwework, http://unfccc.int/kyoto_protocol/items/2830.php.
iiiWorld Energy Outlook 2013 Factsheet. http://www.iea.org/media/files/WEO2013_factsheets.pdf.
ivREN21, Renewables Global Status Report 3013. Available at http://www.ren21.net/ .
vIEA World Energy Outlook 2013. Key World Energy Statistics 2013. Available at
http://www.iea.org/. vi Statoil Energy Perspectives. Long-term macro and market outlook, June 2013.
http://www.statoil.com/en/NewsAndMedia/News/EnergyPerspectives/Downloads/Energy%20Perspec
tives%202013.pdf. vii
BP statistical review of world energy 2013: available at
http://www.bp.com/en/global/corporate/about-bp/statistical-review-of-world-energy-2013.html viii
EIA quarterly coal report. http://www.eia.gov/coal/production/quarterly/. ixRenewable Fuel Standards. Report by CRS at http://www.fas.org/sgp/crs/misc/R40155.pdf.
xStatistics on cars produced. http://www.worldometers.info/cars/ and
http://en.wikipedia.org/wiki/Automotive_industry. xiGrowth of pre-salt oil production in Brazil. http://www.eia.gov/todayinenergy/detail.cfm?id=13771.
xiiPublic transport factsheets athttp://www.uitp.org/Public-Transport/why-public-transport/index.cfm.
http://www.unep.org/transport/Programmes/PUBLICTRANSPORT/index.asp. xiii
The Government Pension Fund of Norway.http://www.regjeringen.no/en/dep/fin/selected-
topics/the-government-pension-fund.html?id=1441 and
http://en.wikipedia.org/wiki/The_Government_Pension_Fund_of_Norway xiv
See UAE country report at http://www.eia.gov/countries/. xv
The Dolphin natural gas pipeline. http://www.dolphinenergy.com/en/13/operations/qatar-operations xvi
http://www.powermag.com/top-plantemirates-aluminum-smelter-complex-emal-al-taweelah-abu-
dhabi-united-arab-emirates/?pagenum=1. xvii
http://pipelineandgasjournal.com/issues-facing-us-shale-gas-exports-japan. xviii
Existing, under construction and planned LNG facilities available at
http://www.globallnginfo.com/World%2520LNG%2520Plants%2520%26%2520Terminals.pdf and
www.zeusintel.com/LNG/WorldLNGExportTerminalListing.aspx. xix
Many European LNG terminals idling, seek new activities.
http://www.reuters.com/article/2013/09/20/energy-lng-europe-idUSL5N0HF3KD20130920 xx
Advanced Resources International (ARI) 2013, “EIA/ARI World Shale Gas and Shale Oil Resource
Assessment”. Available at
http://www.adv-
res.com/pdf/A_EIA_ARI_2013%20World%20Shale%20Gas%20and%20Shale%20Oil%20Resource
%20Assessment.pdf] xxi
France upholds ban on fracking.
http://www.nytimes.com/2013/10/12/business/international/france-upholds-fracking-ban.html. xxii
Some recent developments in shale gas E&P in Argentina. http://www.platts.com/latest-
news/natural-gas/washington/argentinas-shale-gas-holds-promise-but-better-21607352. xxiii
Challenges China faces in developing its shale gas resources.
http://about.bloomberglaw.com/practitioner-contributions/shale-gas-in-asia-significant-reserves-

Supported by 43
substantial-challenges/ and http://www.forbes.com/sites/simonmontlake/2013/10/30/shale-gas-
revolution-not-coming-to-china-anytime-soon/. xxiv Federation of Electric Power Companies of Japan flip charts and data from IEA. Figure compiled
by authors. xxv
This overbuilt capacity is much larger than required for scheduled and unscheduled outages and
maintenance.The exact amount as a function of the share of renewable generation remains to be
determined. xxvi
http://www.fepc.or.jp/english/library/graphical_flip-
chart/__icsFiles/afieldfile/2013/06/13/all_english_2013_r1.pdf xxvii
http://erneuerbare-energien.de/files/pdfs/allgemein/application/pdf/leitstudie2011_bf.pdf xxviii
See http://www.reuters.com/article/2013/04/25/germany-eon-irsching-
idUSL6N0DC47N20130425. xxix Timera Energy, A tough Spread Environment, Blog Posted on March 5, 2012,
http://www.timera-energy.com/commodity-prices/a-tough-spread-environment/ xxx
Fraunhofer Institute for Solar Energy Systems ISE (2014), Electricity production from
solar and wind in Germany in 2013, Prof. Dr. Bruno Burger, January 09, 2014; Figure
compiled by authors. xxxi
Volatility in German power-price. http://www.bloomberg.com/news/2013-10-16/german-power-
price-swings-threaten-growth-engine-energy-markets.html. xxxii http://in.reuters.com/article/2014/04/07/germany-energy-idINL6N0MZ3EL20140407 xxxiii
See http://www.eia.gov/tools/faqs/faq.cfm?id=427&t=3. xxxiv Levelized cost of new generation, EIA Annual Energy Outlook 2013. Available at
http://www.eia.gov/forecasts/aeo/electricity_generation.cfm, and the OpenEI application at
http://en.openei.org/apps/TCDB/ xxxv
EIA report on Brazil. http://www.eia.gov/countries/cab.cfm?fips=BR. xxxvi
http://www.bloomberg.com/news/2013-04-12/brazil-seeks-higher-power-auction-rate-to-spur-use-
of-coal-gas.html. xxxvii
The Southeast Northeast Natural Gas Pipeline in Brazil. http://www.hydrocarbons-
technology.com/projects/southeastnortheastga/. xxxviii
Wind energy in Denmark. http://denmark.dk/en/green-living/wind-energy/ and
http://en.wikipedia.org/wiki/Wind_power_in_Denmark xxxix
http://www.iea.org/publications/freepublications/publication/Denmark2011_unsecured.pdf xl For example the delays in the construction of the EPR reactors Olkiluoto-III (Finland) and
Flamanville-III (France) by Areva. xli
http://ec.europa.eu/energy/observatory/electricity/doc/20130814_q2_quarterly_report_on_european
_electricity_markets.pdf xlii
http://www.timera-energy.com/uk-power/commercial-implications-of-the-uk-capacity-market/ xliii
Burton, E., Friedman, J., Upadhye, R. Best practices in underground coal gasification.
https://www.purdue.edu/discoverypark/energy/assets/pdfs/cctr/BestPracticesinUCG-draft.pdf


![arXiv:2009.10082v1 [astro-ph.HE] 21 Sep 2020 · 1Theoretical Astrophysics, Mail Code 350-17, Caltech, Pasadena, CA 91125, USA 23 September 2020 ABSTRACT The LIGO-Virgo collaboration](https://img.pdfslide.net/doc/110x75/600b8e3281fc0a4fa7453674/arxiv200910082v1-astro-phhe-21-sep-2020-1theoretical-astrophysics-mail-code.jpg)