Embed Size (px)
Citation preview
1
Supply-side Reform & China’s Steel Industry --Darkness before Dawn
12th Annual Platts Steel Markets Asia Conference
Nov 17th, 2016, Mumbai, India
JIANG Li
Baosteel, China
2
Current & Future China Steel Market
Supply-side Reform & China Steel Industry
BAOSTEEL & WISCO
Conclusion
Agenda
3
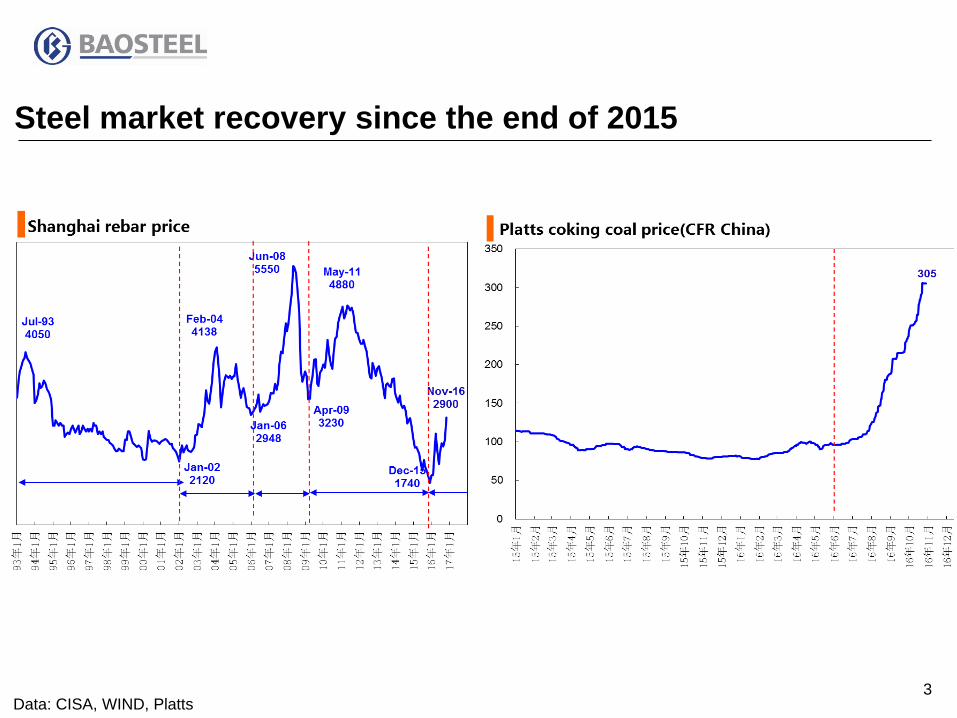
Steel market recovery since the end of 2015
Data: CISA, WIND, Platts
4
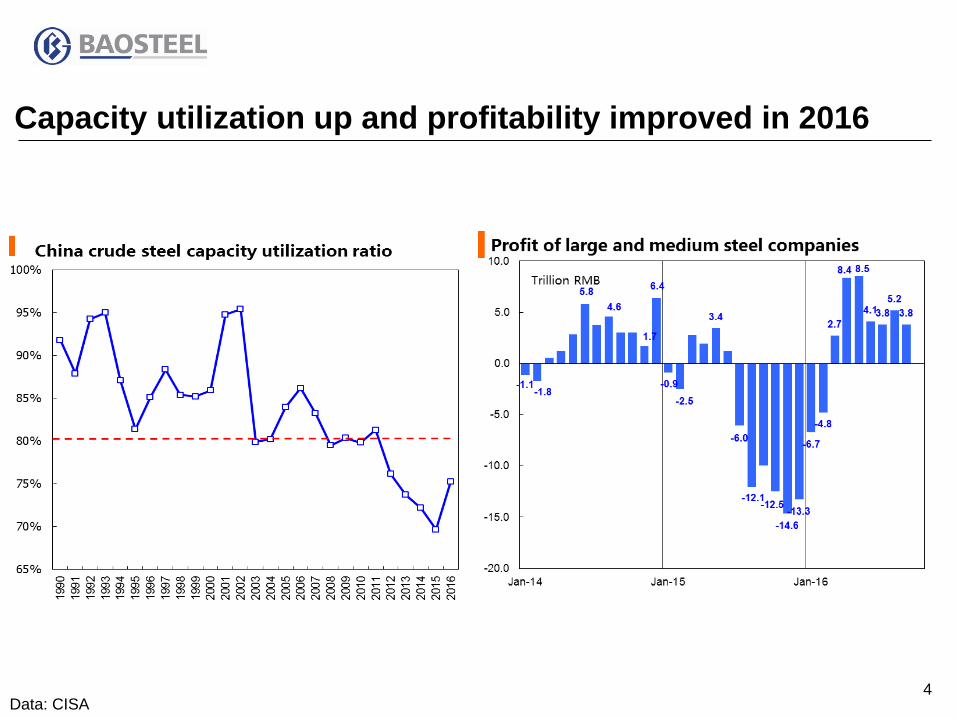
Capacity utilization up and profitability improved in 2016
Data: CISA
5
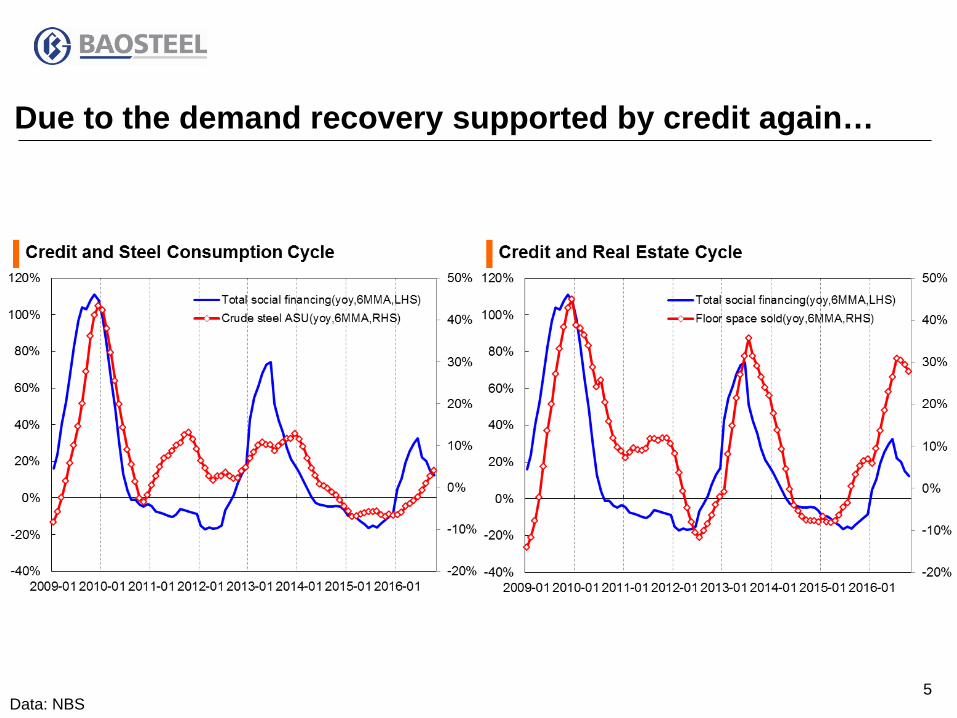
Due to the demand recovery supported by credit again…
Data: NBS
6
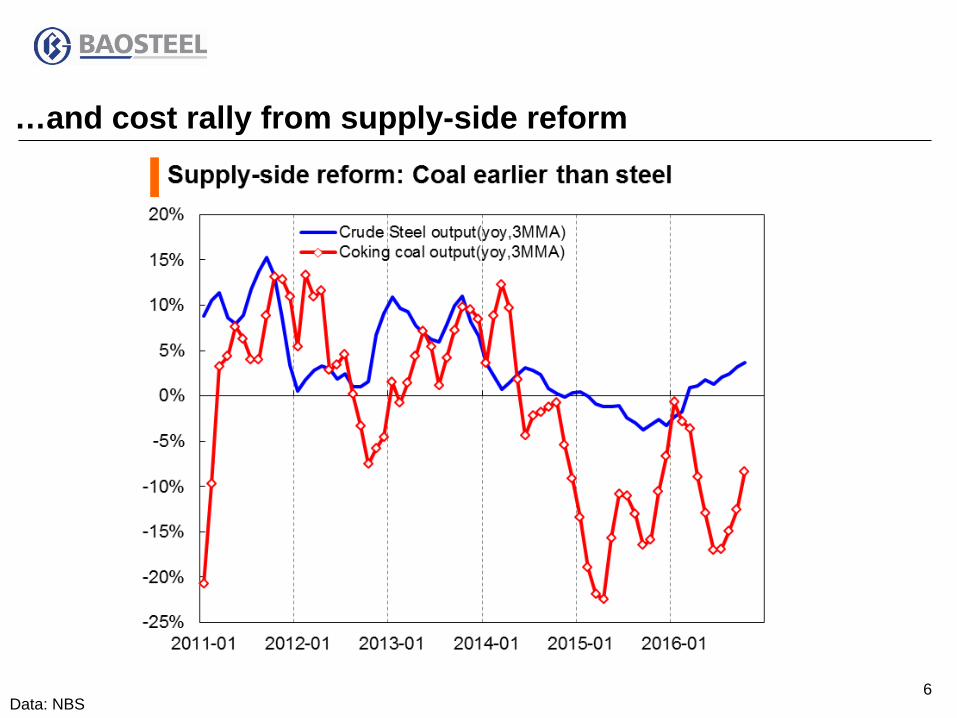
…and cost rally from supply-side reform
Data: NBS
7
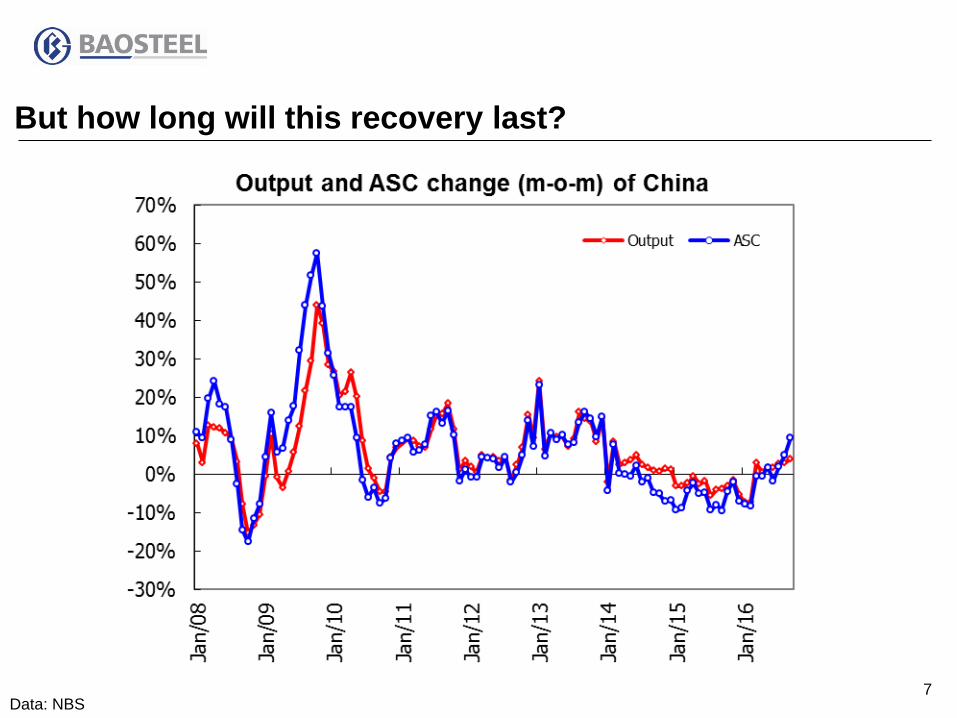
But how long will this recovery last?
Data: NBS
8
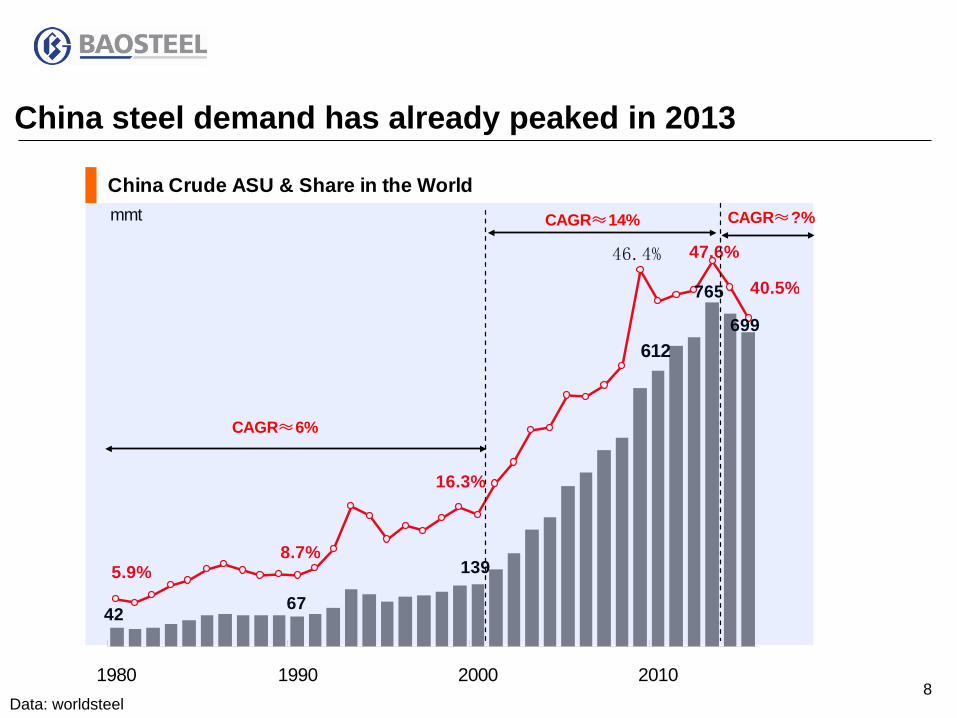
China steel demand has already peaked in 2013
Data: worldsteel
China Crude ASU & Share in the World
765
612
139
6742
699
47.6%46.4%
16.3%
8.7%5.9%
40.5%
1980 1990 2000 2010
mmt
CAGR≈6%
CAGR≈14% CAGR≈?%
9
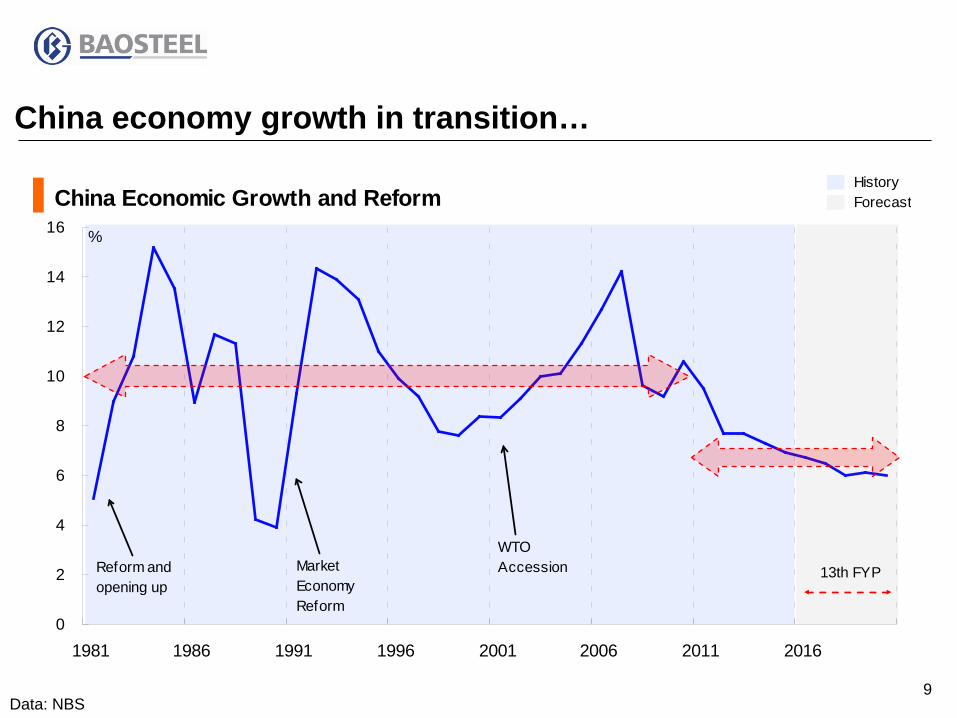
China economy growth in transition…
Data: NBS
China Economic Growth and Reform
0
2
4
6
8
10
12
14
16
1981 1986 1991 1996 2001 2006 2011 2016
%
Reform andopening up
MarketEconomyReform
WTOAccession
HistoryForecast
13th FYP
10
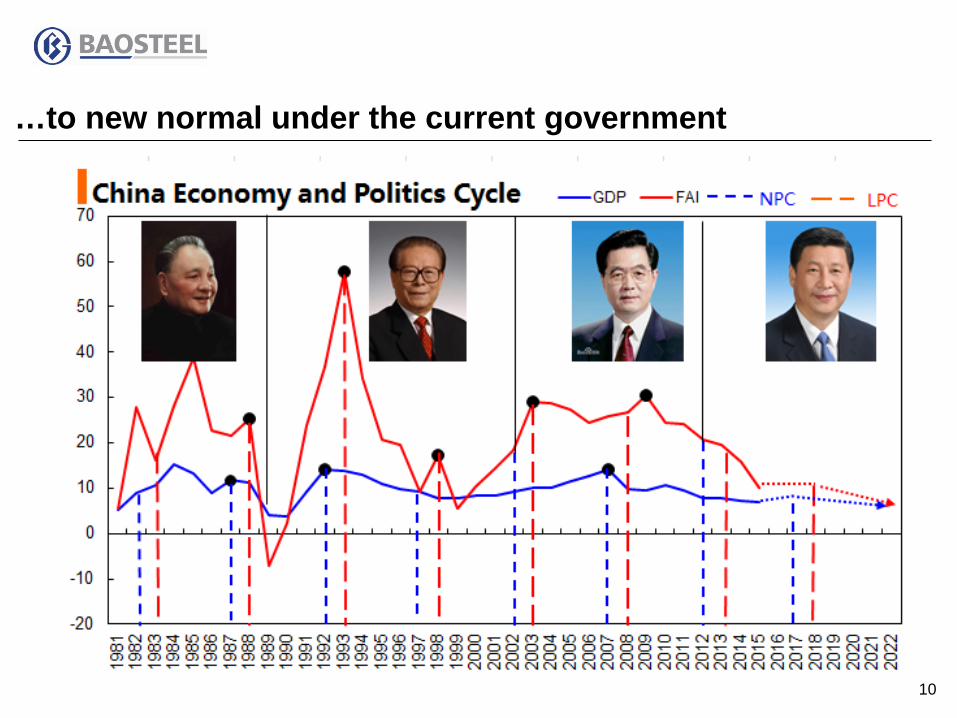
…to new normal under the current government
11
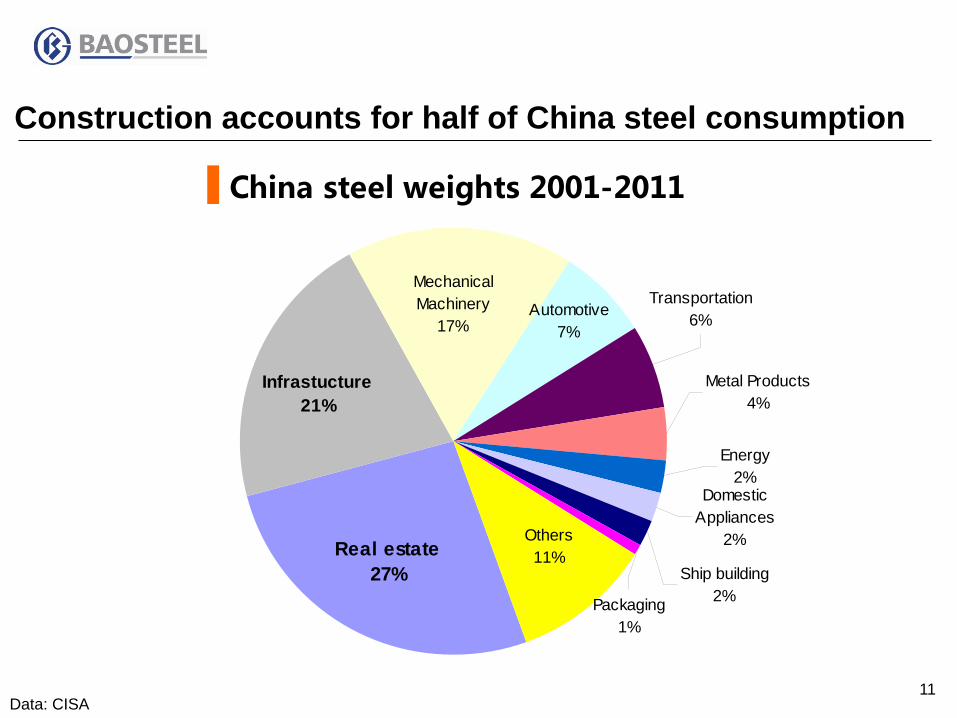
Construction accounts for half of China steel consumption
Data: CISA
China steel weights 2001-2011
Energy2%
Metal Products4%
DomesticAppliances
2%
Ship building2%Packaging
1%
Others11%Real estate
27%
Infrastucture21%
MechanicalMachinery
17%Automotive
7%
Transportation6%
12
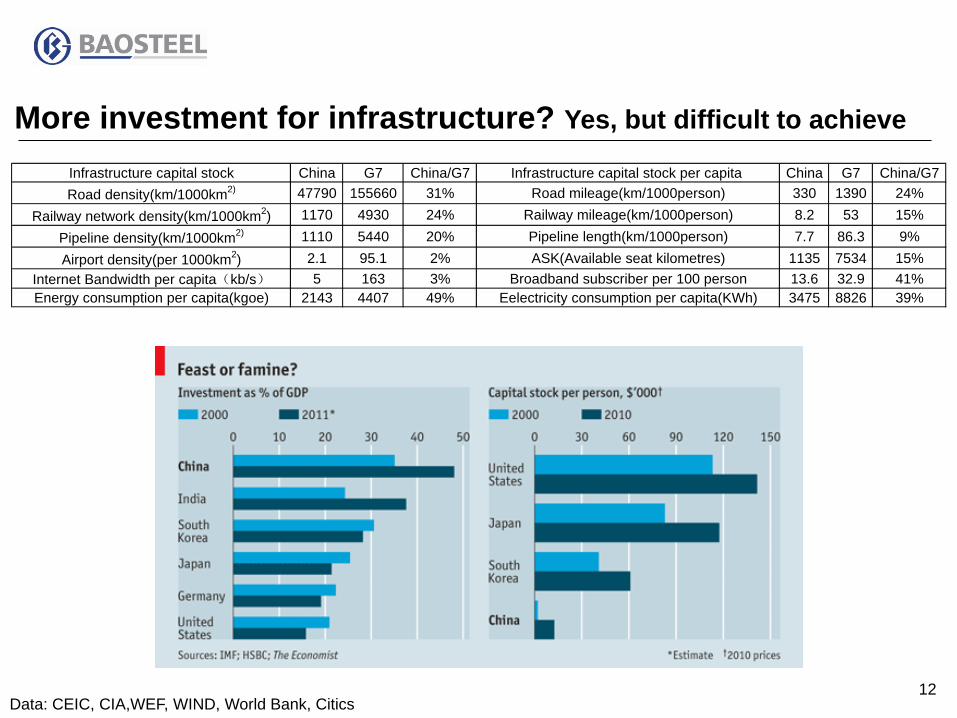
More investment for infrastructure? Yes, but difficult to achieve
Data: CEIC, CIA,WEF, WIND, World Bank, Citics
Infrastructure capital stock China G7 China/G7 Infrastructure capital stock per capita China G7 China/G7Road density(km/1000km2) 47790 155660 31% Road mileage(km/1000person) 330 1390 24%
Railway network density(km/1000km2) 1170 4930 24% Railway mileage(km/1000person) 8.2 53 15%Pipeline density(km/1000km2) 1110 5440 20% Pipeline length(km/1000person) 7.7 86.3 9%Airport density(per 1000km2) 2.1 95.1 2% ASK(Available seat kilometres) 1135 7534 15%
Internet Bandwidth per capita(kb/s) 5 163 3% Broadband subscriber per 100 person 13.6 32.9 41%Energy consumption per capita(kgoe) 2143 4407 49% Eelectricity consumption per capita(KWh) 3475 8826 39%
13 Data: WIND, NBS
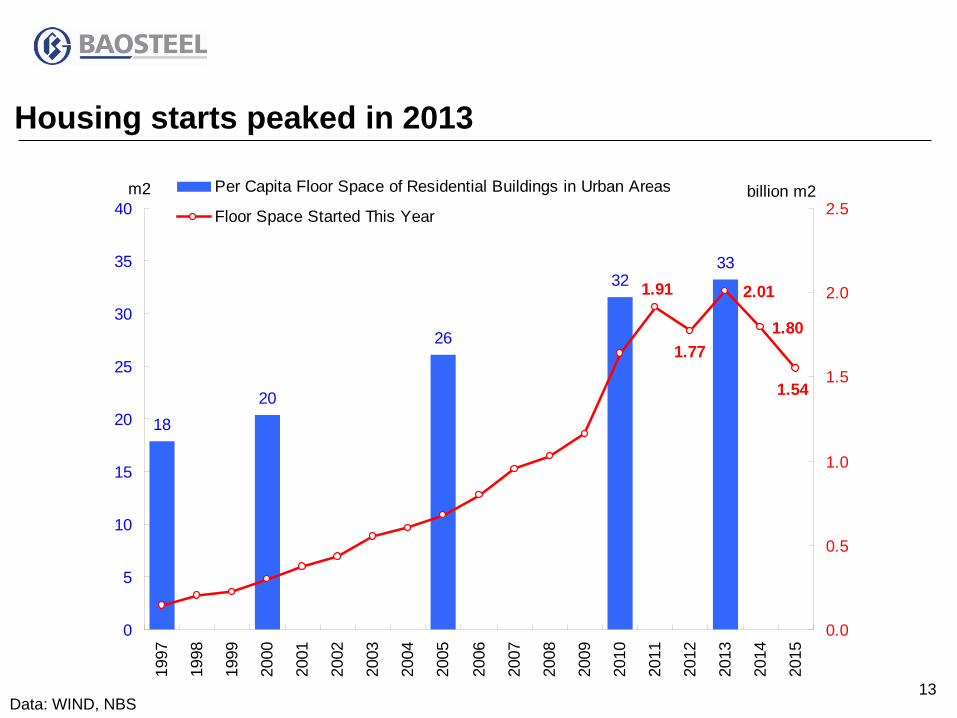
Housing starts peaked in 2013
1820
26
3233
1.801.77
1.91
1.54
2.01
0
5
10
15
20
25
30
35
40
1997
1998
1999
2000
2001
2002
2003
2004
2005
2006
2007
2008
2009
2010
2011
2012
2013
2014
2015
0.0
0.5
1.0
1.5
2.0
2.5Per Capita Floor Space of Residential Buildings in Urban Areas
Floor Space Started This Yearbillion m2m2
14
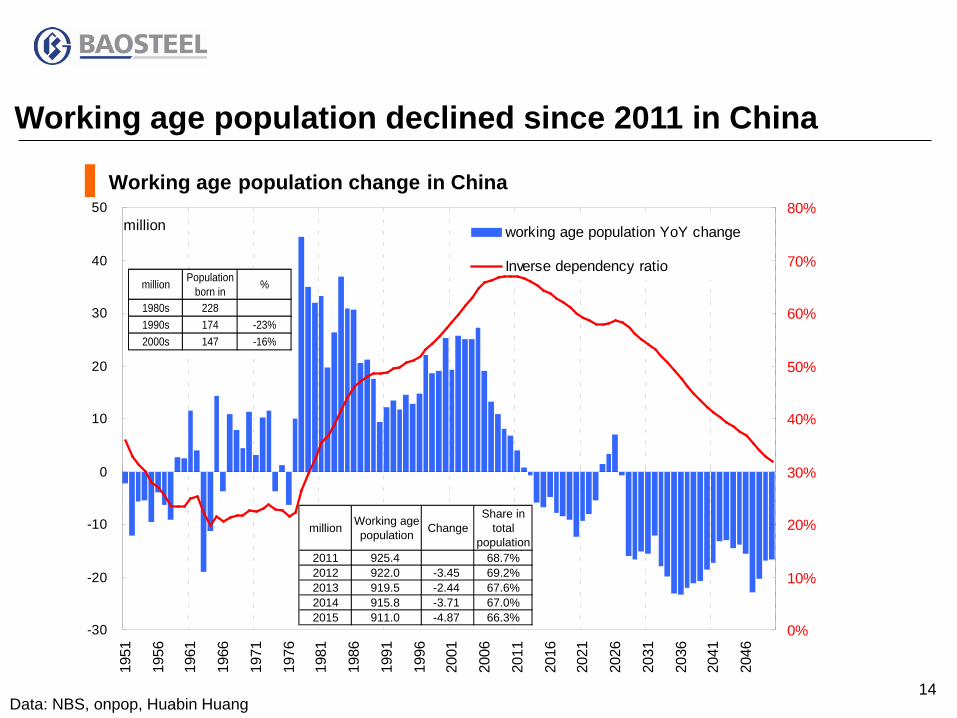
Working age population declined since 2011 in China
Data: NBS, onpop, Huabin Huang
Working age population change in China
-30
-20
-10
0
10
20
30
40
50
1951
1956
1961
1966
1971
1976
1981
1986
1991
1996
2001
2006
2011
2016
2021
2026
2031
2036
2041
2046
0%
10%
20%
30%
40%
50%
60%
70%
80%working age population YoY change
Inverse dependency ratio
million
million Populationborn in %
1980s 2281990s 174 -23%2000s 147 -16%
million Working agepopulation Change
Share intotal
population2011 925.4 68.7%2012 922.0 -3.45 69.2%2013 919.5 -2.44 67.6%2014 915.8 -3.71 67.0%2015 911.0 -4.87 66.3%
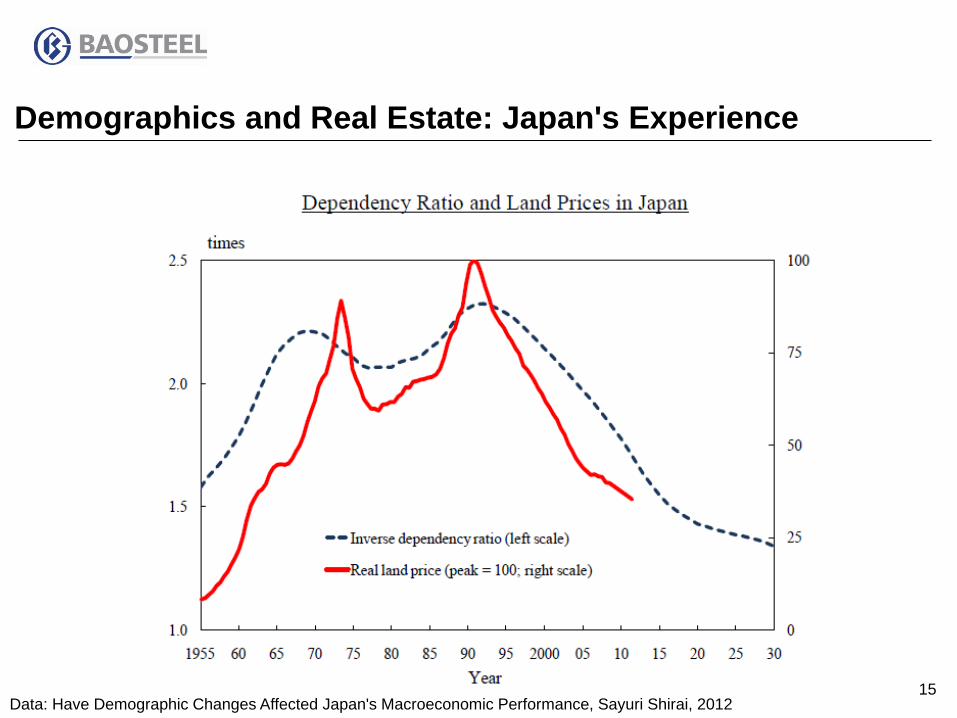
15 Data: Have Demographic Changes Affected Japan's Macroeconomic Performance, Sayuri Shirai, 2012
Demographics and Real Estate: Japan's Experience
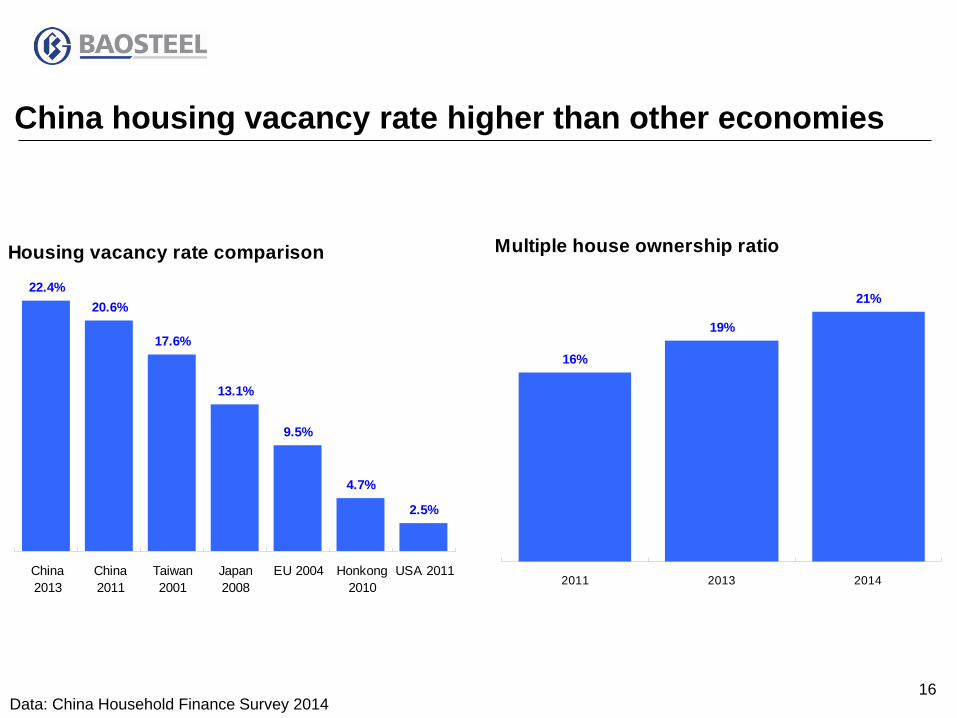
16 Data: China Household Finance Survey 2014
China housing vacancy rate higher than other economies
Housing vacancy rate comparison22.4%
20.6%
17.6%
13.1%
9.5%
4.7%
2.5%
China2013
China2011
Taiwan2001
Japan2008
EU 2004 Honkong2010
USA 2011
Multiple house ownership ratio
16%
19%
21%
2011 2013 2014
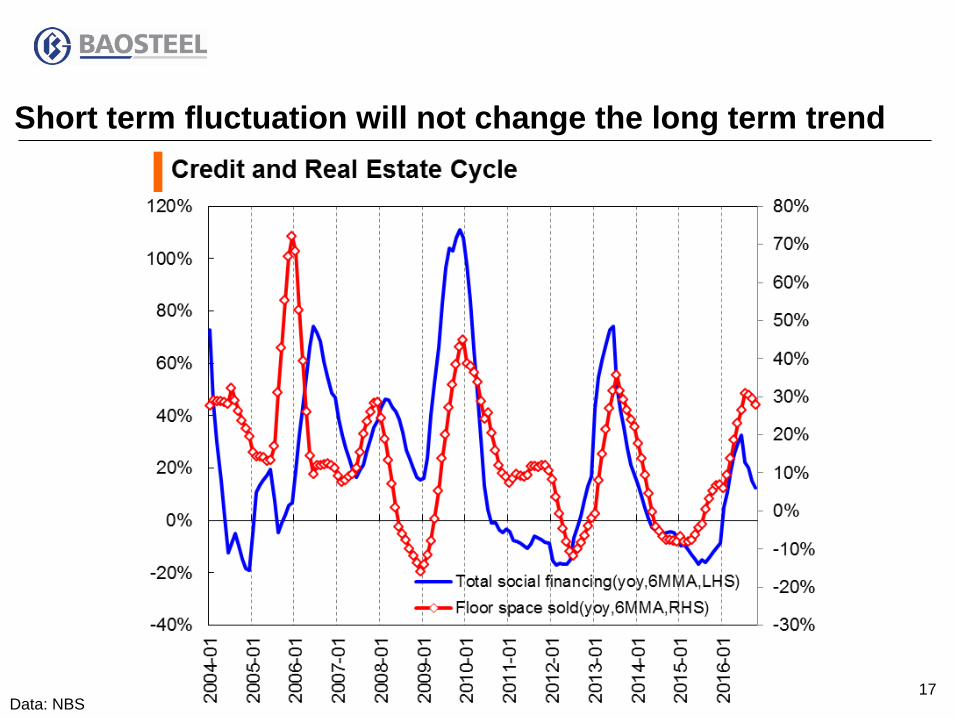
17 Data: NBS
Short term fluctuation will not change the long term trend
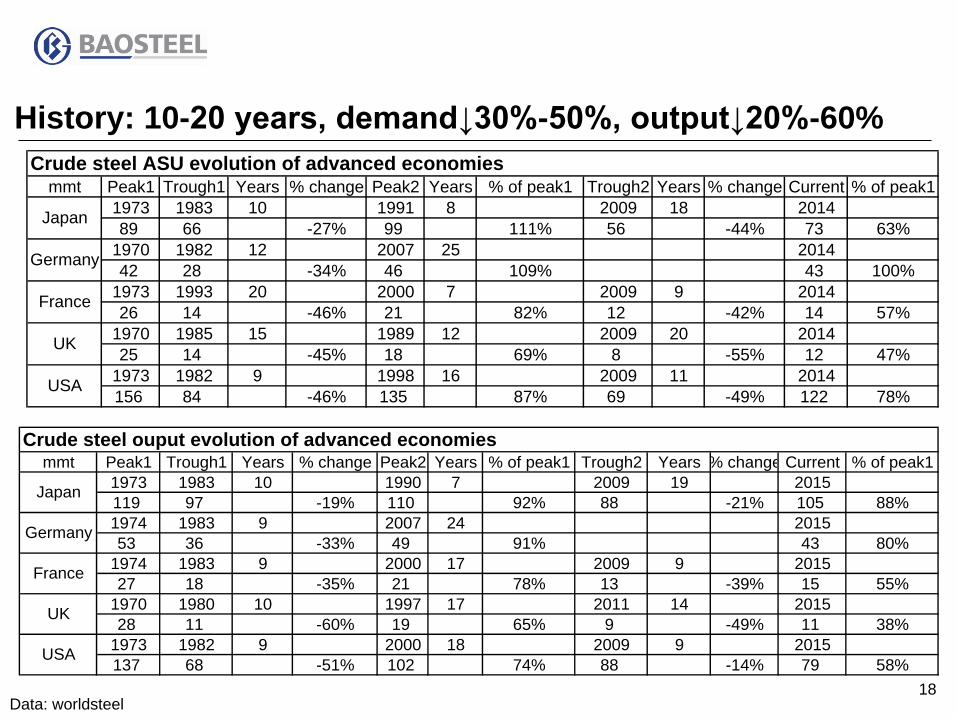
18 Data: worldsteel
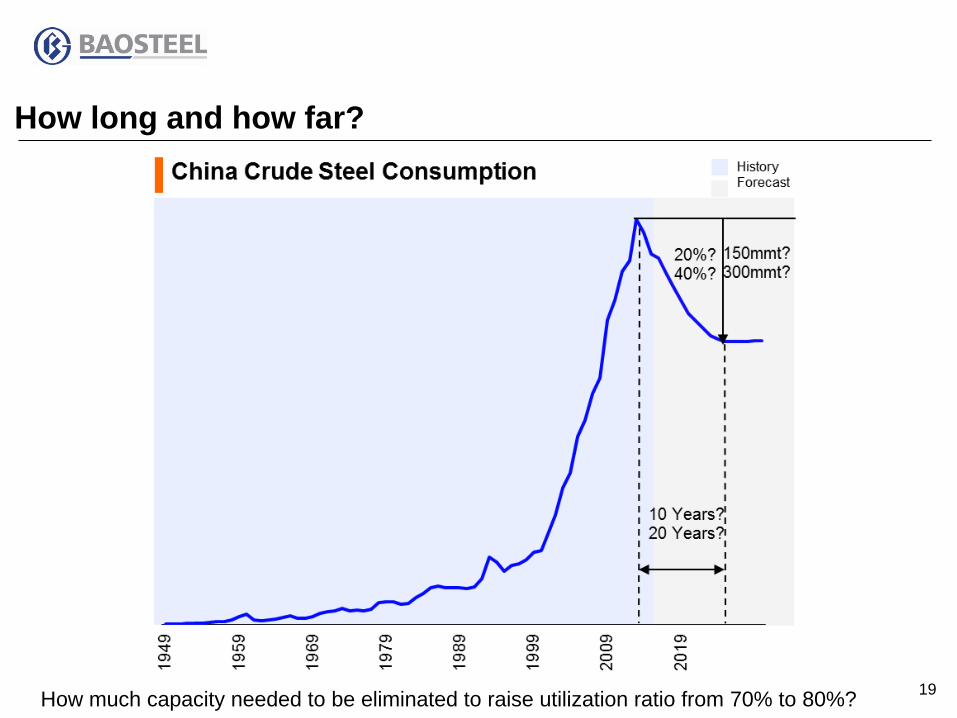
History: 10-20 years, demand↓30%-50%, output↓20%-60%
mmt Peak1 Trough1 Years % change Peak2 Years % of peak1 Trough2 Years % change Current % of peak11973 1983 10 1991 8 2009 18 201489 66 -27% 99 111% 56 -44% 73 63%
1970 1982 12 2007 25 201442 28 -34% 46 109% 43 100%
1973 1993 20 2000 7 2009 9 201426 14 -46% 21 82% 12 -42% 14 57%
1970 1985 15 1989 12 2009 20 201425 14 -45% 18 69% 8 -55% 12 47%
1973 1982 9 1998 16 2009 11 2014156 84 -46% 135 87% 69 -49% 122 78%USA
Crude steel ASU evolution of advanced economies
Japan
Germany
France
UK
mmt Peak1 Trough1 Years % change Peak2 Years % of peak1 Trough2 Years % change Current % of peak11973 1983 10 1990 7 2009 19 2015119 97 -19% 110 92% 88 -21% 105 88%1974 1983 9 2007 24 201553 36 -33% 49 91% 43 80%
1974 1983 9 2000 17 2009 9 201527 18 -35% 21 78% 13 -39% 15 55%
1970 1980 10 1997 17 2011 14 201528 11 -60% 19 65% 9 -49% 11 38%
1973 1982 9 2000 18 2009 9 2015137 68 -51% 102 74% 88 -14% 79 58%USA
Crude steel ouput evolution of advanced economies
Japan
Germany
France
UK
19
How long and how far?
How much capacity needed to be eliminated to raise utilization ratio from 70% to 80%?
20
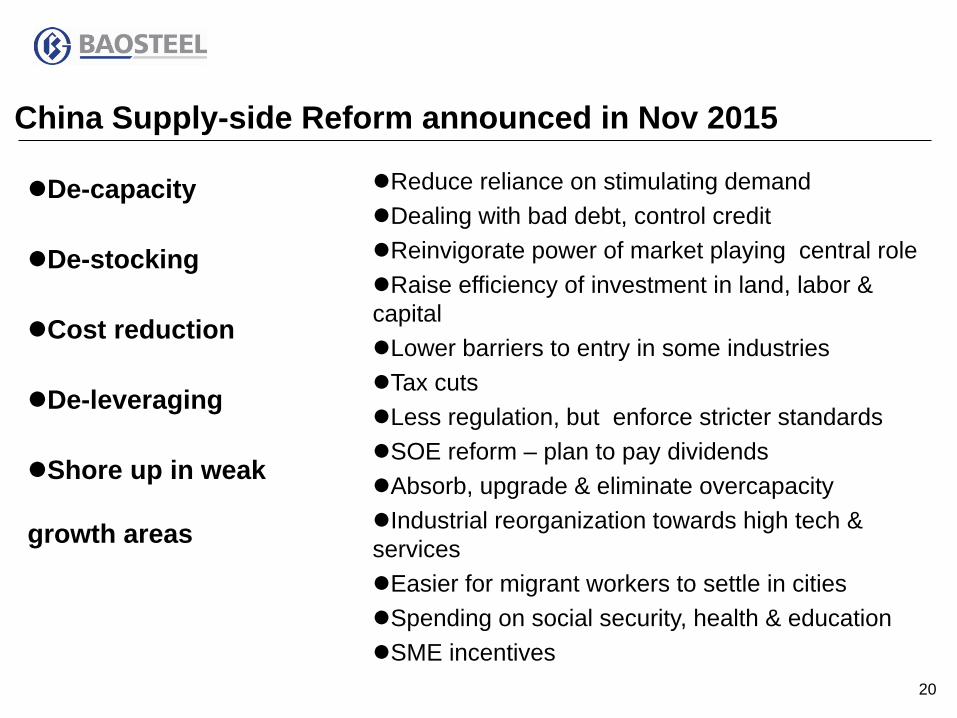
China Supply-side Reform announced in Nov 2015
De-capacity
De-stocking
Cost reduction
De-leveraging
Shore up in weak
growth areas
Reduce reliance on stimulating demand Dealing with bad debt, control credit Reinvigorate power of market playing central role Raise efficiency of investment in land, labor & capital Lower barriers to entry in some industries Tax cuts Less regulation, but enforce stricter standards SOE reform – plan to pay dividends Absorb, upgrade & eliminate overcapacity Industrial reorganization towards high tech & services Easier for migrant workers to settle in cities Spending on social security, health & education SME incentives
21
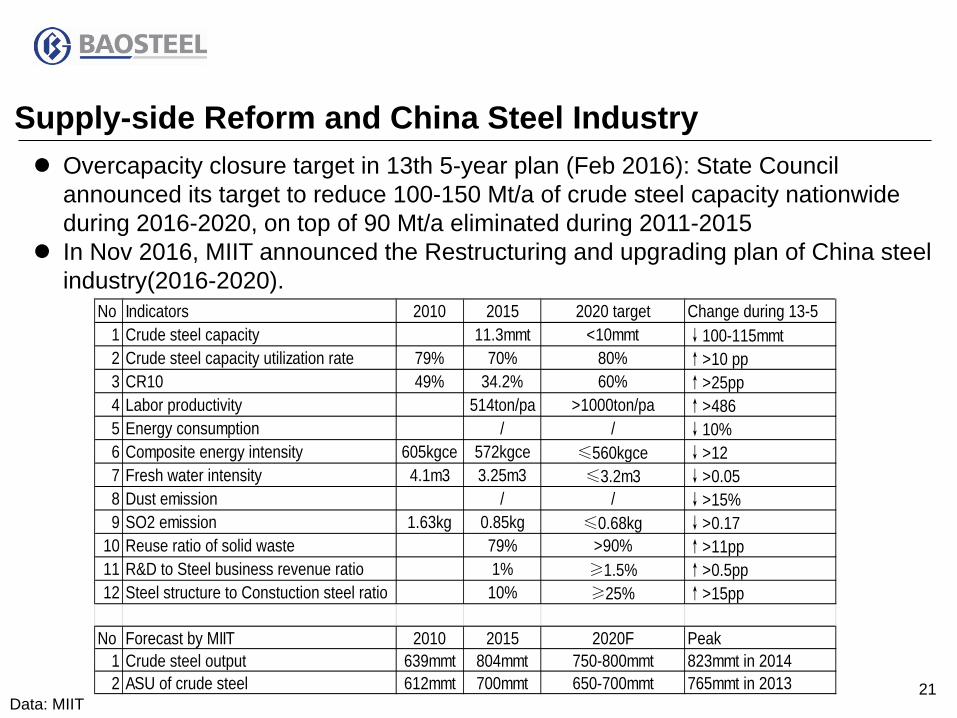
Supply-side Reform and China Steel Industry
Data: MIIT
No Indicators 2010 2015 2020 target Change during 13-51 Crude steel capacity 11.3mmt <10mmt ↓100-115mmt2 Crude steel capacity utilization rate 79% 70% 80% ↑>10 pp3 CR10 49% 34.2% 60% ↑>25pp4 Labor productivity 514ton/pa >1000ton/pa ↑>4865 Energy consumption / / ↓10%6 Composite energy intensity 605kgce 572kgce ≤560kgce ↓>127 Fresh water intensity 4.1m3 3.25m3 ≤3.2m3 ↓>0.058 Dust emission / / ↓>15%9 SO2 emission 1.63kg 0.85kg ≤0.68kg ↓>0.17
10 Reuse ratio of solid waste 79% >90% ↑>11pp11 R&D to Steel business revenue ratio 1% ≥1.5% ↑>0.5pp12 Steel structure to Constuction steel ratio 10% ≥25% ↑>15pp
No Forecast by MIIT 2010 2015 2020F Peak1 Crude steel output 639mmt 804mmt 750-800mmt 823mmt in 20142 ASU of crude steel 612mmt 700mmt 650-700mmt 765mmt in 2013
Overcapacity closure target in 13th 5-year plan (Feb 2016): State Council announced its target to reduce 100-150 Mt/a of crude steel capacity nationwide during 2016-2020, on top of 90 Mt/a eliminated during 2011-2015
In Nov 2016, MIIT announced the Restructuring and upgrading plan of China steel industry(2016-2020).
22
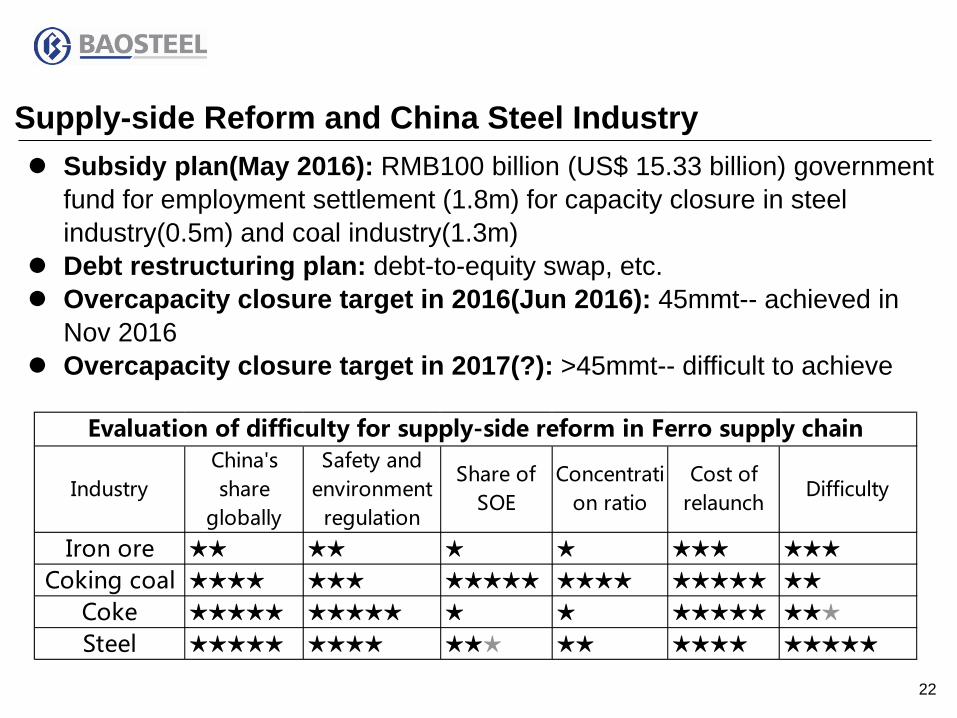
Supply-side Reform and China Steel Industry Subsidy plan(May 2016): RMB100 billion (US$ 15.33 billion) government
fund for employment settlement (1.8m) for capacity closure in steel industry(0.5m) and coal industry(1.3m)
Debt restructuring plan: debt-to-equity swap, etc. Overcapacity closure target in 2016(Jun 2016): 45mmt-- achieved in
Nov 2016 Overcapacity closure target in 2017(?): >45mmt-- difficult to achieve
IndustryChina'sshare
globally
Safety andenvironment
regulation
Share ofSOE
Concentration ratio
Cost ofrelaunch
Difficulty
Iron ore ★★ ★★ ★ ★ ★★★ ★★★Coking coal ★★★★ ★★★ ★★★★★ ★★★★ ★★★★★ ★★
Coke ★★★★★ ★★★★★ ★ ★ ★★★★★ ★★★Steel ★★★★★ ★★★★ ★★★ ★★ ★★★★ ★★★★★
Evaluation of difficulty for supply-side reform in Ferro supply chain
23
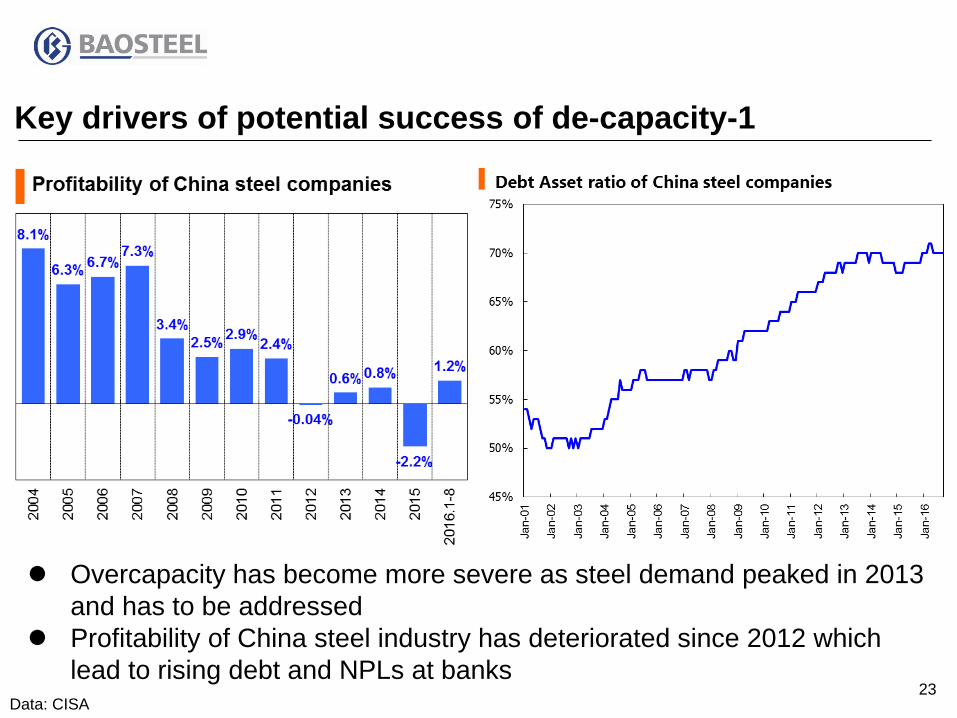
Key drivers of potential success of de-capacity-1
Data: CISA
Overcapacity has become more severe as steel demand peaked in 2013 and has to be addressed
Profitability of China steel industry has deteriorated since 2012 which lead to rising debt and NPLs at banks
24
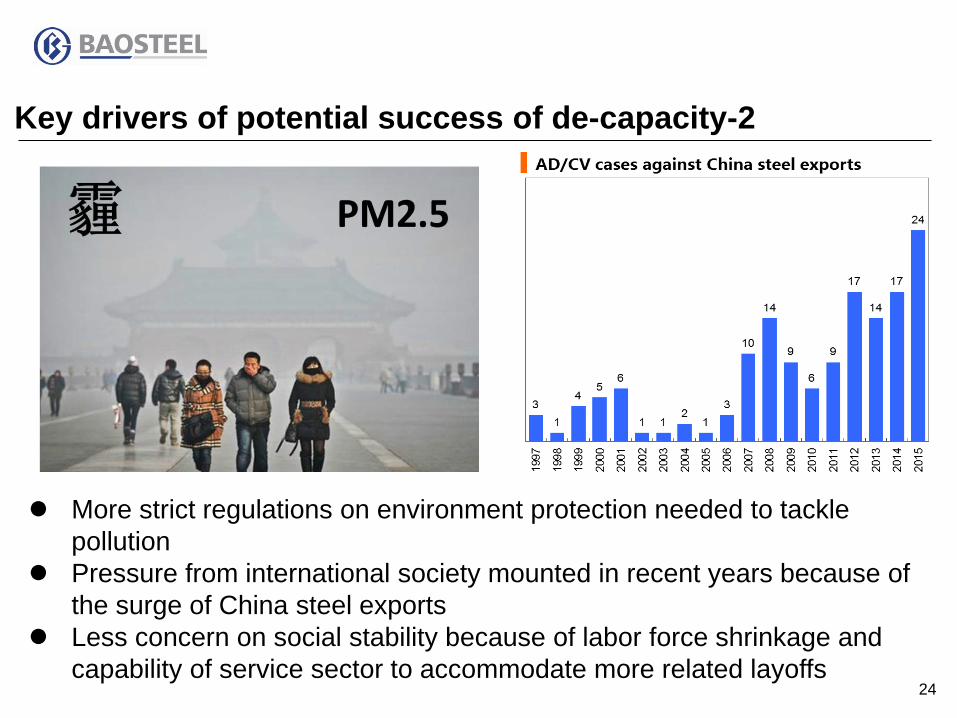
More strict regulations on environment protection needed to tackle pollution
Pressure from international society mounted in recent years because of the surge of China steel exports
Less concern on social stability because of labor force shrinkage and capability of service sector to accommodate more related layoffs
Key drivers of potential success of de-capacity-2
25
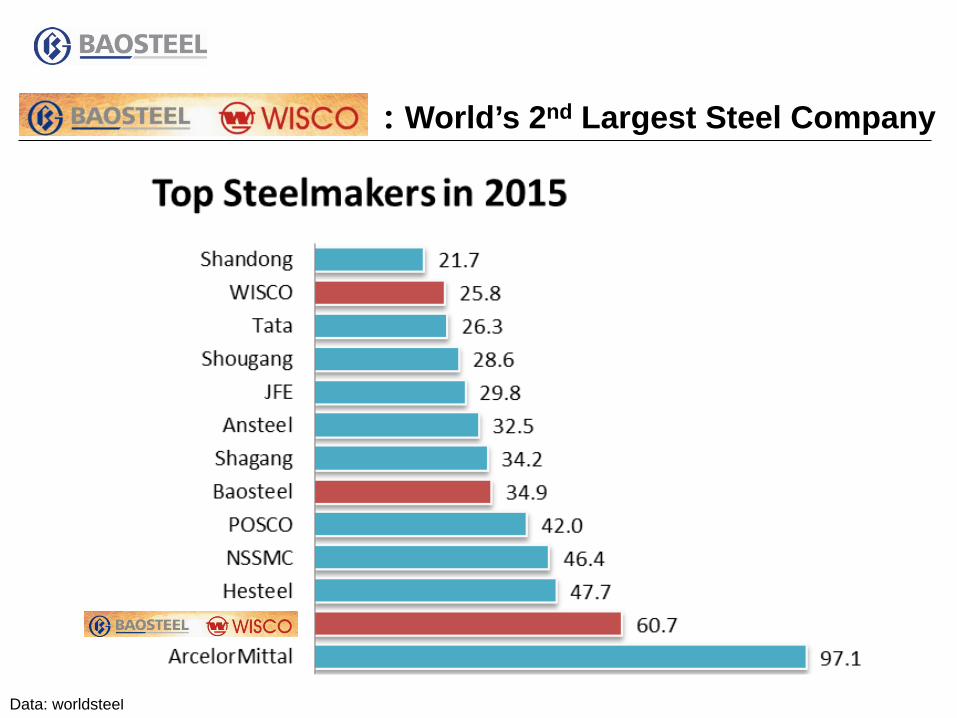
:World’s 2nd Largest Steel Company
Data: worldsteel
26
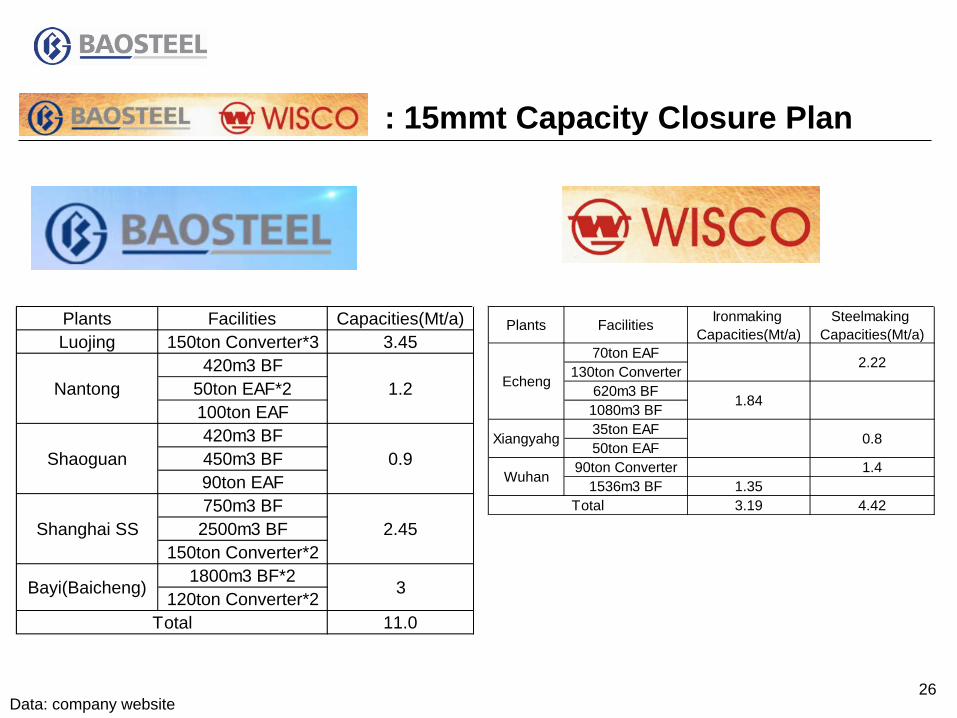
: 15mmt Capacity Closure Plan
Data: company website
Plants Facilities Capacities(Mt/a)Luojing 150ton Converter*3 3.45
420m3 BF50ton EAF*2100ton EAF420m3 BF450m3 BF90ton EAF750m3 BF2500m3 BF
150ton Converter*21800m3 BF*2
120ton Converter*211.0
1.2
0.9
2.45
3
Total
Nantong
Shaoguan
Shanghai SS
Bayi(Baicheng)
Plants Facilities Ironmaking Capacities(Mt/a)
Steelmaking Capacities(Mt/a)
70ton EAF130ton Converter
620m3 BF1080m3 BF35ton EAF50ton EAF
90ton Converter 1.41536m3 BF 1.35
3.19 4.42
Echeng2.22
0.8Xiangyahg
Wuhan
Total
1.84
27 Data: company report
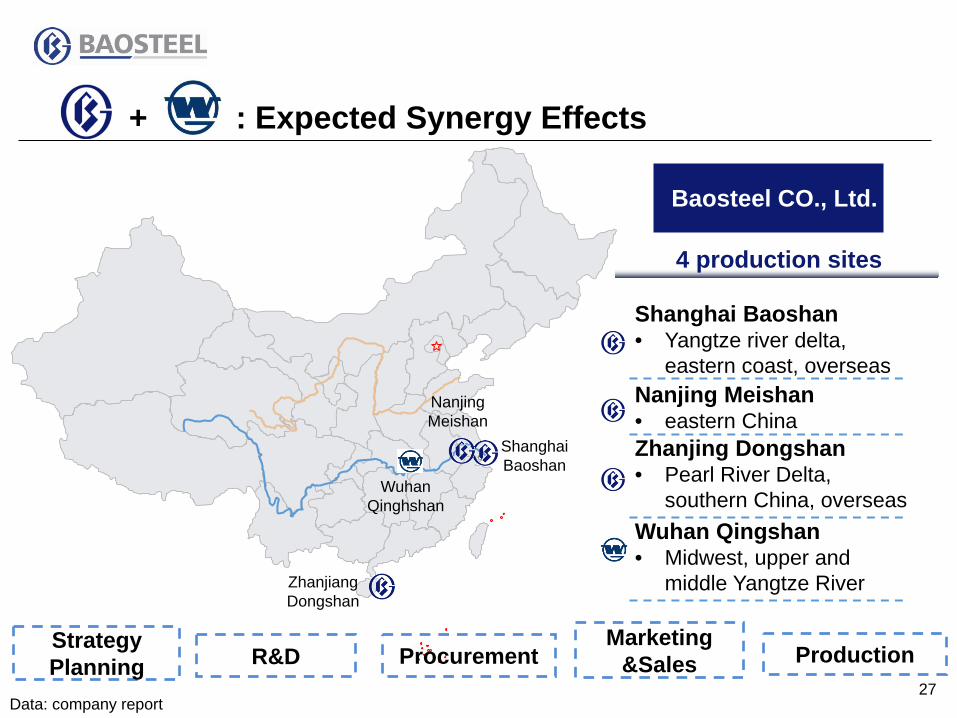
Wuhan Qinghshan
Nanjing Meishan
Zhanjiang Dongshan
Shanghai Baoshan
R&D Procurement Marketing
&Sales Production Strategy Planning
4 production sites
Shanghai Baoshan • Yangtze river delta,
eastern coast, overseas Nanjing Meishan • eastern China Zhanjing Dongshan • Pearl River Delta,
southern China, overseas Wuhan Qingshan • Midwest, upper and
middle Yangtze River
+ : Expected Synergy Effects
Baosteel CO., Ltd.
28 Data: company report
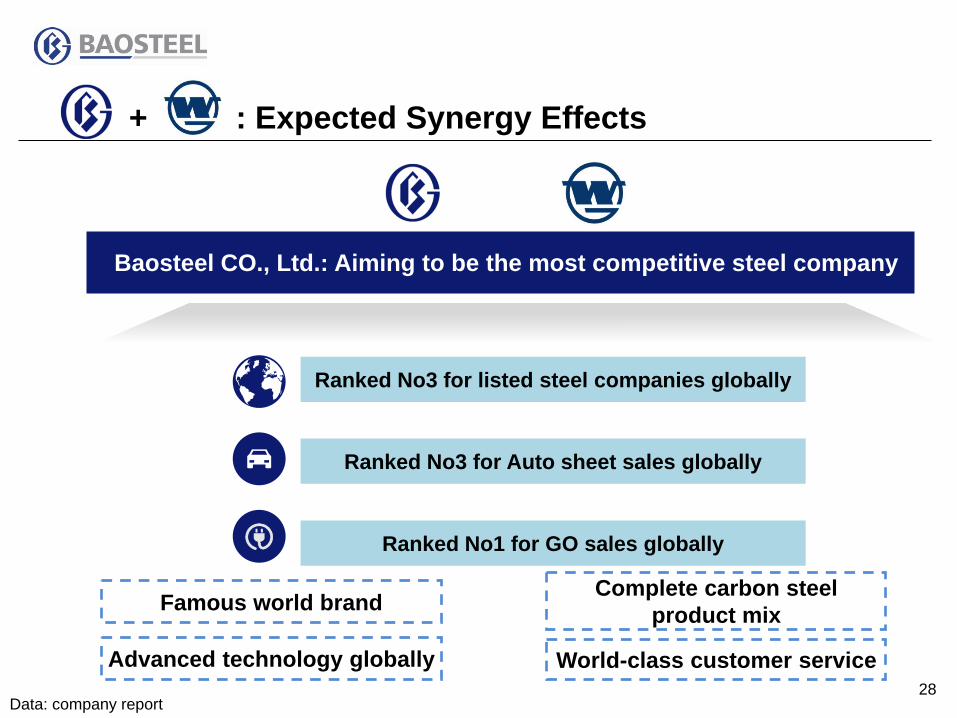
Baosteel CO., Ltd.: Aiming to be the most competitive steel company
Ranked No3 for Auto sheet sales globally
Ranked No3 for listed steel companies globally
Ranked No1 for GO sales globally
Famous world brand
World-class customer service
Complete carbon steel product mix
Advanced technology globally
+ : Expected Synergy Effects
29
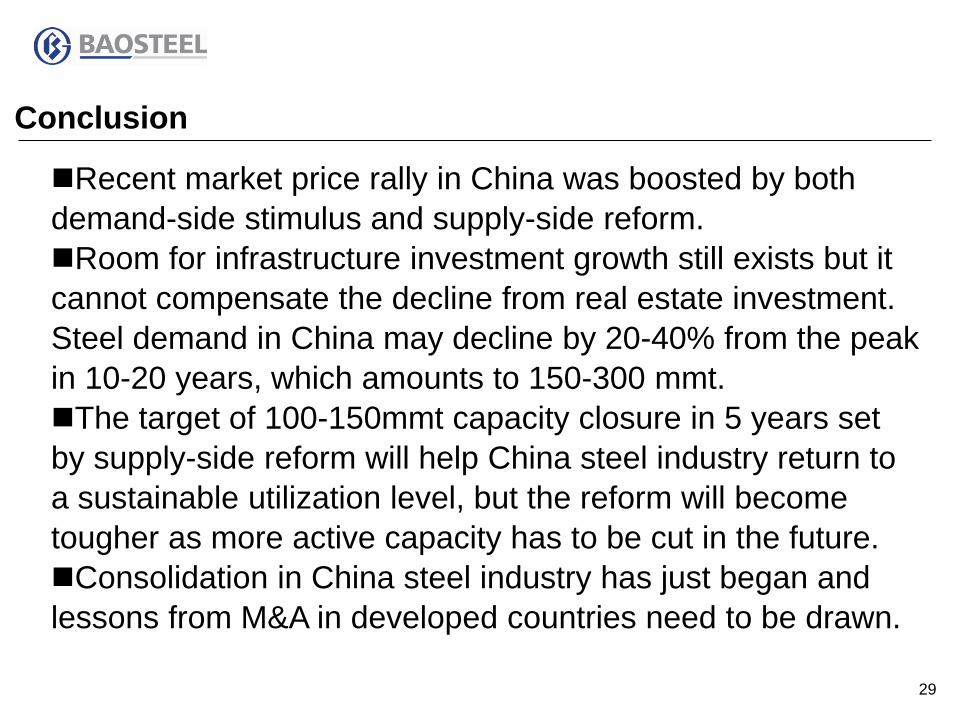
Recent market price rally in China was boosted by both demand-side stimulus and supply-side reform. Room for infrastructure investment growth still exists but it cannot compensate the decline from real estate investment. Steel demand in China may decline by 20-40% from the peak in 10-20 years, which amounts to 150-300 mmt. The target of 100-150mmt capacity closure in 5 years set by supply-side reform will help China steel industry return to a sustainable utilization level, but the reform will become tougher as more active capacity has to be cut in the future. Consolidation in China steel industry has just began and lessons from M&A in developed countries need to be drawn.
Conclusion
30
Thank you
JIANG, Li Email: [email protected]
Disclaimer: The views expressed here are solely those of the author and do not represent the official views of the company.


![SK하이닉스 (000660)file.mk.co.kr/imss/write/20190401130910__00.pdf · 29 기업분석[sk하이닉스] 재무상태표 포괄손익계산서 (십억원) 2016 2017 2018 2019f 2020f](https://img.pdfslide.net/doc/110x75/5e22072f213d79460e3f6c1d/ske-000660filemkcokrimsswrite2019040113091000pdf-29-eeske.jpg)