Embed Size (px)
Citation preview

Environment, Energy, and Economic Development Program
For More InformationVisit RAND at www.rand.org
Explore the RAND Environment, Energy, and Economic Development Program
View document details
Support RANDBrowse Reports & Bookstore
Make a charitable contribution
Limited Electronic Distribution RightsThis document and trademark(s) contained herein are protected by law as indicated in a notice appearing later in this work. This electronic representation of RAND intellectual property is provided for non-commercial use only. Unauthorized posting of RAND electronic documents to a non-RAND website is prohibited. RAND electronic documents are protected under copyright law. Permission is required from RAND to reproduce, or reuse in another form, any of our research documents for commercial use. For information on reprint and linking permissions, please see RAND Permissions.
Skip all front matter: Jump to Page 16
The RAND Corporation is a nonprofit institution that helps improve policy and decisionmaking through research and analysis.
This electronic document was made available from www.rand.org as a public service of the RAND Corporation.
CHILDREN AND FAMILIES
EDUCATION AND THE ARTS
ENERGY AND ENVIRONMENT
HEALTH AND HEALTH CARE
INFRASTRUCTURE AND TRANSPORTATION
INTERNATIONAL AFFAIRS
LAW AND BUSINESS
NATIONAL SECURITY
POPULATION AND AGING
PUBLIC SAFETY
SCIENCE AND TECHNOLOGY
TERRORISM AND HOMELAND SECURITY

This report is part of the RAND Corporation research report series. RAND reports present research findings and objective analysis that address the challenges facing the public and private sectors. All RAND reports undergo rigorous peer review to ensure high standards for research quality and objectivity.
Environment, Energy, and Economic Development Program
Prepared for the California Energy Commission
Addressing Climate Change in Local Water Agency PlansDemonstrating a Simplified Robust Decision Making Approach in the California Sierra Foothills
David G. Groves, Evan Bloom, David R. Johnson, David Yates, Vishal Mehta
The RAND Corporation is a nonprofit institution that helps improve policy and decisionmaking through research and analysis. RAND’s publications do not necessarily reflect the opinions of its research clients and sponsors.
Support RAND—make a tax-deductible charitable contribution atwww.rand.org/giving/contribute.html
R® is a registered trademark.
© Copyright 2013 RAND Corporation
This document and trademark(s) contained herein are protected by law. This representation of RAND intellectual property is provided for noncommercial use only. Unauthorized posting of RAND documents to a non-RAND website is prohibited. RAND documents are protected under copyright law. Permission is given to duplicate this document for personal use only, as long as it is unaltered and complete. Permission is required from RAND to reproduce, or reuse in another form, any of our research documents for commercial use. For information on reprint and linking permissions, please see the RAND permissions page (www.rand.org/pubs/permissions.html).
RAND OFFICES
SANTA MONICA, CA • WASHINGTON, DC
PITTSBURGH, PA • NEW ORLEANS, LA • JACKSON, MS • BOSTON, MA
DOHA, QA • CAMBRIDGE, UK • BRUSSELS, BE
www.rand.org
The research described in this report was sponsored by the California Energy Commission and conducted in the Environment, Energy, and Economic Development Program within RAND Justice, Infrastructure, and Environment.
iii
Preface
About This Document
This document is the final report for award PIR-08-002 from the California Energy Commission’s Public Interest Energy Research Grants program. This project was intended to demonstrate a quantitative, analytic approach for addressing climate change in water and energy resource planning. This report documents a case study with a local water agency in the Sierra Nevada in California. The method described has broad applicability to other natural resource planning agencies. The intended audience includes water and energy planners and their stakeholders.
The RAND Environment, Energy, and Economic Development Program The research reported here was conducted in the RAND Environment, Energy, and
Economic Development Program, which addresses topics relating to environmental quality and regulation, water and energy resources and systems, climate, natural hazards and disasters, and economic development, both domestically and internationally. Program research is supported by government agencies, foundations, and the private sector.
This program is part of RAND Justice, Infrastructure, and Environment, a division of the RAND Corporation dedicated to improving policy and decisionmaking in a wide range of policy domains, including civil and criminal justice, infrastructure protection and homeland security, transportation and energy policy, and environmental and natural resource policy.
Questions or comments about this report should be sent to the project leader, David Groves ([email protected]). For more information about the Environment, Energy, and Economic Development Program, see http://www.rand.org/energy or contact the director at [email protected].


v
Contents
Preface ............................................................................................................................................ iii About This Document ............................................................................................................................. iii The RAND Environment, Energy, and Economic Development Program ............................................. iii
Figures........................................................................................................................................... vii Tables ............................................................................................................................................. ix Summary ........................................................................................................................................ xi
Introduction ............................................................................................................................................. xi Use of Robust Decision Making to Evaluate Vulnerabilities and Adaptation Strategies ...................... xii Results ................................................................................................................................................... xiii
How Reliable Is EID’s Current Plan Under a Wide Range of Plausible Assumptions About the Future? ........................................................................................................................................ xiii
Under What Conditions Is EID’s Current Plan Most Vulnerable? ................................................... xiv How Can EID’s Vulnerabilities Be Reduced Through Additional Management Options? ............... xv What Are the Key Tradeoffs and How Can They Inform Decisions? .............................................. xvi
Conclusion ............................................................................................................................................ xvii Acknowledgments ........................................................................................................................ xix Abbreviations ............................................................................................................................... xxi 1. Introduction ............................................................................................................................... 1 2. An Approach for Addressing Climate Change by Local Water Agencies ............................... 3 3. Application to Local Water Agency Planning .......................................................................... 9
El Dorado Irrigation District and Its Long-Term Planning ...................................................................... 9 EID Overview ....................................................................................................................................... 9 EID Management Challenges and Opportunities ............................................................................... 11 EID Master Plan ................................................................................................................................. 12
Incorporating Climate and Other Uncertainty into EID’s Planning ....................................................... 12 XLRM Framework for Structuring Uncertainty Analysis .................................................................. 13 Relationships (R) ................................................................................................................................ 14 Uncertainties (X) ................................................................................................................................ 17 Management Options and Strategies (L) ............................................................................................ 21 Performance Metrics (M) ................................................................................................................... 22 Experimental Design .......................................................................................................................... 23 Interactive Visualizations ................................................................................................................... 23
4. Results ..................................................................................................................................... 25 How Reliable Is EID’s Current Plan Under Standard Planning Assumptions? ..................................... 25 How Reliable Is EID’s Current Plan Under Alternative but Plausible Assumptions About the Future?27 To Which Conditions Is EID’s Current Plan Most Vulnerable? ............................................................ 29 How Can EID’s Vulnerabilities Be Reduced Through Additional Management Options? ................... 34
vi
What Are the Key Tradeoffs Among EID’s Strategies for Reducing Vulnerability? ............................ 38 How Can Expectations of the Future Inform EID Planning Decisions? ................................................ 42
5. Discussion ............................................................................................................................... 47 References ..................................................................................................................................... 51

vii
Figures
Figure S-1: Reliability for Each Future Disaggregated by Region and UARP Availability Scenario ................................................................................................................................ xiv
Figure S-2: “UARP Supplies Not Available or Drying Climate” Vulnerable Conditions for Eastern Region ...................................................................................................................... xv
Figure S-3: Percentage of Vulnerable Scenarios by Region, by UARP Scenario, and by Strategy.............................................................................................................................................. xvi
Figure S-4: Tradeoffs Between Ranked Costs and Percentage of Vulnerable Futures .............. xvii Figure 2-1: Emerging Adaptive Decision Making Framework ...................................................... 3 Figure 2-2: Process Graph for Robust Decision Making ................................................................ 5 Figure 3-1: Location of EID Service Area in California .............................................................. 10 Figure 3-2: Major Regions Within EID Service Area .................................................................. 11 Figure 3-3: Illustrative Screenshot of WEAP EID Model ............................................................ 16 Figure 3-4: Modeled and Observed Flows Near Kyburz for Both the Calibration and Validation
Periods................................................................................................................................... 17 Figure 3-5: EID Demand Projected for the Master Plan and by the WEAP EID Model Under
Baseline Assumptions ........................................................................................................... 17 Figure 3-6: Characterization of Watersheds and Sub-Watersheds ............................................... 19 Figure 3-7: Monthly Precipitation for the SRES A2/CNRM-CM3 Climate Simulation from 2021
to 2040 for a Single Sub-Catchment ..................................................................................... 20 Figure 4-1: Supply, Demand, and Unmet Demand over Time for Historical Climate and Baseline
Demand and UARP Supplies Available ............................................................................... 26 Figure 4-2: Percentage of Years in Which Demand Exceeds a Specified Percentage of Demand
by Region .............................................................................................................................. 27 Figure 4-3: Percentage of Years in Which Demand Exceeds a Particular Percentage of Demand
Across Climate and Growth Scenarios by Region (rows) and With and Without UARP Supplies (columns) ................................................................................................................ 28
Figure 4-4: Reliability for Each Future Disaggregated by Region and UARP Availability Scenario ................................................................................................................................. 29
Figure 4-5: Reliability for Each Future Disaggregated by Region and UARP Availability Scenario with 90-Percent Vulnerability Threshold Indicated ............................................... 30
Figure 4-6: Percentage of Futures Leading to Non-Vulnerable Outcomes by Region and UARP Scenario ................................................................................................................................. 31
Figure 4-7: Change in Precipitation from the Historical Baseline and Temperature Trend for the 12 Climate Scenarios ............................................................................................................ 32
Figure 4-8: “UARP Supplies Not Available” Vulnerable Conditions for Western Regions ........ 33

viii
Figure 4-9: “UARP Supplies Not Available or Drying Climate” Vulnerable Conditions for Eastern Region ...................................................................................................................... 34
Figure 4-10: Percentage of Vulnerable Futures by Region, UARP Scenario, and Strategy ......... 35 Figure 4-11: Vulnerabilities in Western Regions for EID Strategies ........................................... 37 Figure 4-12: Vulnerabilities in Eastern Region for EID Strategies .............................................. 39 Figure 4-13: Least Costly Strategies for Specific Future Conditions (Western Regions) ............ 40 Figure 4-14: Least Costly Strategies for Specific Future Conditions (Eastern Region) ............... 41 Figure 4-15: Tradeoffs Between Ranked Costs and Percentage of Futures Vulnerable ............... 42 Figure 4-16: Expected Vulnerability for Three Strategies as a Function of the Subjective
Probability of Facing “UARP Not Available” Vulnerable Conditions (Western Regions) . 44 Figure 4-17: Expected Vulnerability for Three Strategies as a Function of the Subjective
Probability of Facing “UARP Not Available and Drying Climate” Vulnerable Conditions (Eastern Region) ................................................................................................................... 45
Figure 4-18: Least Costly Strategies that Lead to Expected Vulnerabilities of Less than 20 Percent for Western Regions (top) and Eastern Region (bottom) ........................................ 46
Figure 5-1: Simple Recipe for Augmenting a Planning Process with Robust Decision Making . 48
ix
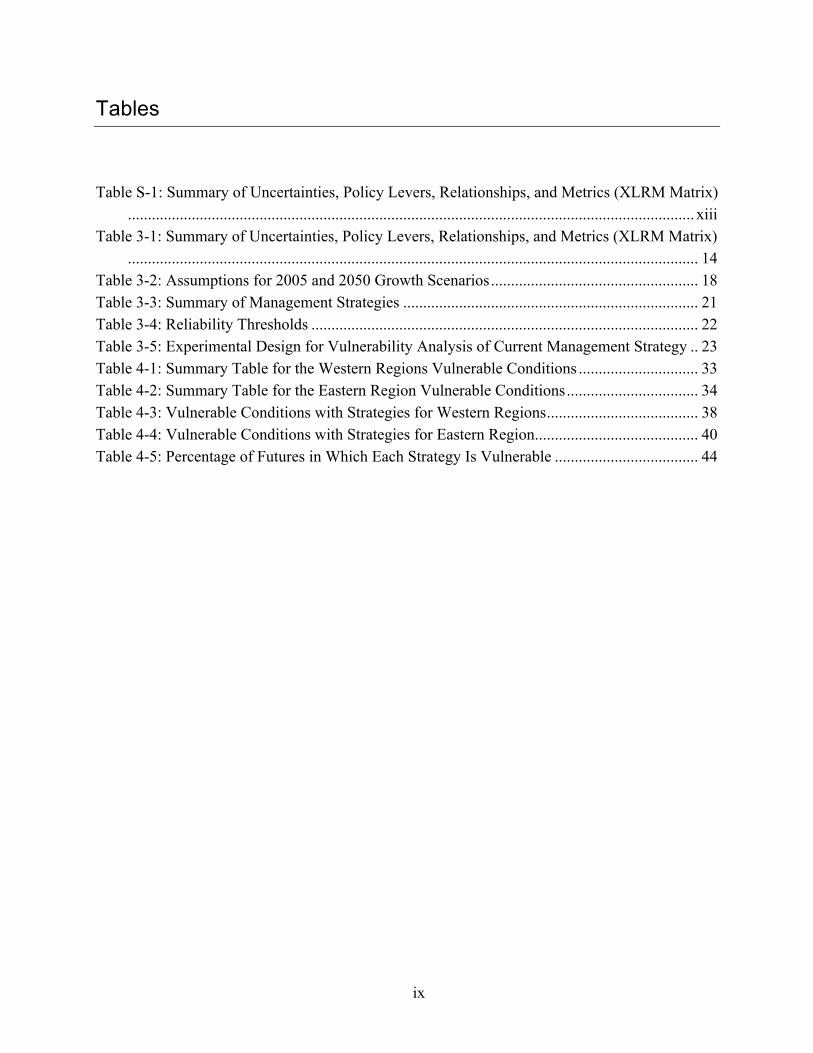
Tables
Table S-1: Summary of Uncertainties, Policy Levers, Relationships, and Metrics (XLRM Matrix).............................................................................................................................................. xiii
Table 3-1: Summary of Uncertainties, Policy Levers, Relationships, and Metrics (XLRM Matrix)............................................................................................................................................... 14
Table 3-2: Assumptions for 2005 and 2050 Growth Scenarios .................................................... 18 Table 3-3: Summary of Management Strategies .......................................................................... 21 Table 3-4: Reliability Thresholds ................................................................................................. 22 Table 3-5: Experimental Design for Vulnerability Analysis of Current Management Strategy .. 23 Table 4-1: Summary Table for the Western Regions Vulnerable Conditions .............................. 33 Table 4-2: Summary Table for the Eastern Region Vulnerable Conditions ................................. 34 Table 4-3: Vulnerable Conditions with Strategies for Western Regions ...................................... 38 Table 4-4: Vulnerable Conditions with Strategies for Eastern Region ......................................... 40 Table 4-5: Percentage of Futures in Which Each Strategy Is Vulnerable .................................... 44


xi
Summary
Introduction
Water agencies have always faced uncertainty when developing programmatic plans and constructing infrastructure. Today’s water agencies use computer models of their systems to calculate future water supply, demand, and infrastructure needs. Mindful of the effects that new investments have on the water rates they must charge their customers, they seek solutions that will ensure reliable future supplies of water but that are not overly costly.
This study describes an analytic and objective approach for (1) evaluating how plausible changes in the climate and other uncertain factors would impact an agency’s long-term plans and (2) understanding the key tradeoffs among adaptation options. This approach, called Robust Decision Making (RDM), is designed to use estimates about future climatic and hydrologic conditions without committing to the veracity of any particular estimate. Instead, it supports a systematic exploration of plausible climate effects and impacts, identifies vulnerabilities—or the specific scenario conditions that would lead agencies plans to perform unacceptably, provides information to compare options that could alleviate these vulnerabilities, and ultimately defines a robust strategy—one that will perform well over a wide range of plausible future conditions. Importantly, it supports an analysis of uncertainties related to climate change alongside other factors that may be just as important to the success of the long-term plans.
RDM is increasingly being used to support long-term water planning activities. The U.S. Bureau of Reclamation and the Metropolitan Water District of Southern California, for example, have recently completed extensive studies that use RDM to evaluate the vulnerabilities and adaptation options for the Colorado River Basin and the Metropolitan service area, respectively (Bureau of Reclamation, 2012; Groves et al., 2013; Groves et al., submitted). These applications used sophisticated simulation models to evaluate management strategies across thousands of plausible future conditions, employed statistical analyses to identify and define key vulnerabilities, and in the case of the Colorado River Basin, evaluated tradeoffs among different portfolios of water management strategies.
This study, in contrast, demonstrates a relatively simple application of RDM for the El Dorado Irrigation District (EID)—a local water agency in the foothills of California’s Sierra Nevada Mountains.1 The analysis is deliberately designed to be straightforward so that it can be replicated by other local water agencies. It illustrates how agencies can use climate data that are readily available and develop simple assumptions to explore uncertainty that is often ignored in
1 The study team included researchers from RAND Corporation and the Stockholm Environment Institute (SEI). Staff from EID provided data, advice, and reviews.
xii
long-term planning exercises—in this case, future demand and the availability of a critical new supply. Lastly, it illustrates an RDM analysis through a series of planning questions that will resonate with water agencies and can be adapted for other applications. While this analysis uses a water management simulation model to quantitatively assess outcomes in about 50 different future scenarios, many of the RDM concepts could be used to inform less quantitative assessments.
EID faces many of the same challenges facing other water utilities in the Western United States—increasing population, limited new local supply opportunities, and potential reductions in and altered availability of supplies due to climate change. EID has several opportunities for addressing these challenges. Its recently developed Master Plan (El Dorado Irrigation District, 2013) identifies a number of different strategies including developing additional programs that increase the efficiency of water use, acquiring new water supplies through arrangements with other agencies (e.g., the Sacramento Municipal Utility District [SMUD]), and constructing new reservoir facilities.
Use of Robust Decision Making to Evaluate Vulnerabilities and Adaptation Strategies
This study uses RDM to analyze the potential vulnerabilities of EID’s current water management plan to future climate, demographic growth, and availability of external new supplies. Table S-1 summarizes the key elements of the RDM analysis of the EID system—key uncertainties, management strategies, performance metrics, and systems models. This study uses a water-planning model developed in the Water Evaluation And Planning (WEAP) modeling environment. The model evaluates water management conditions using climate drivers (i.e., temperature and precipitation), rather than historical stream flows, and is thus ideally suited for evaluating the effects of climate change on the management system. The model was calibrated to project future supply and demand levels that are consistent with the assumptions used by EID for their recently completed master planning process. This study, however, explores a broader set of scenarios to encompass additional uncertainties and focuses on different performance metrics and management strategies than the Master Plan.2
2 Some of the differences between the assumptions used in the Master Plan analysis and this study arise from the different timing of the two efforts.

xiii
Table S-1: Summary of Uncertainties, Policy Levers, Relationships, and Metrics (XLRM Matrix)
Uncertainties or Scenario Factors (X) Management Strategies or Levers (L)
Future climate conditions Demographics Availability of new supplies
2010 Urban Water Management Plan Additional Management Strategies • Additional urban water use efficiency • New reservoir
Relationships or Systems Model (R) Performance Metrics (M)
Water planning model of EID Unmet Water Demand and Reliability Notional Strategy Costs
Results
This study addresses several key long-term planning questions using the RDM iterative methodology.
How Reliable Is EID’s Current Plan Under a Wide Range of Plausible Assumptions About the Future?
We simulated EID’s current plan under historical climate conditions and with access to new supplies from the Upper American River Project (UARP) in 2020. We found that under these baseline-planning assumptions, EID’s current plan is 100-percent reliable in EID’s Western Regions (i.e., El Dorado Hills and Western Region) and 94-percent reliable in the EID’s Eastern Region. The Eastern Region is less reliable as it does not have access to many of the supplies available in the west. Reliability in this study is defined as the percentage of years in which demand is largely met. The thresholds for a year to be considered reliable are 85 percent of demand for the Western Regions and 90 percent for the Eastern Region.
We next explored how well EID’s current plan would perform under different but plausible assumptions about future climate, demand growth rates, and the availability of UARP supplies. We found that reliability for both regions would be substantially degraded.
Figure S-1 shows the reliability for the Western Regions and Eastern Region for each future, separated by the UARP supply assumption. Each square represents reliability results for one of the 52 simulation results. Results for the baseline growth scenario are shown in light red. Overlapping results appear darker in the figure. Without UARP supplies available (bottom rows for each region), reliability in both regions varies significantly across the climate and demand scenarios. If UARP supplies are not available, the most stressing scenario reduces reliability in the Western Regions to about 10 percent, and to 0 percent for the Eastern Region. The most favorable climate and demand assumptions, however, lead reliability to exceed 75 percent and 45 percent for the Western Regions and Eastern Region, respectively, for the given thresholds. The reliability of supply in the Eastern Region with UARP supplies is also sensitive to climate and growth assumptions—reliability ranges between about 65 percent and 95 percent.

xiv
Figure S-1: Reliability for Each Future Disaggregated by Region and UARP Availability Scenario
NOTES: Each square represents reliability results for one of the 52 futures evaluated. Results for the baseline assumptions (historical climate, baseline growth) are indicated in light red.
Under What Conditions Is EID’s Current Plan Most Vulnerable?
In order to focus the analysis on outcomes that would not meet EID broad planning goals, we defined a vulnerability threshold of 90 percent—reliability outcomes less than this threshold for either region indicate a vulnerability. Through iteration, we identify two sets of conditions—one for the Western Regions and one for the Eastern Region—that lead to a high number of vulnerable cases and relatively few non-vulnerable cases. For the Western Regions, 26 of the 52 futures evaluated are vulnerable, and they all correspond to futures in which there is no new UARP supply. These conditions are called “UARP Supplies Not Available” and describe all the vulnerable outcomes (100-percent coverage) and none of the non-vulnerable outcomes (100-percent density).
The vulnerable conditions are more nuanced for the Eastern Region and include all futures in which UARP supplies are not available. For those futures in which UARP supplies are available, however, the vulnerable conditions include futures in which precipitation declines by more than 3 percent over the historical average of 1,070 millimeters (mm)/year. The assumptions about future growth in the region do not distinguish between scenarios that are vulnerable and those that are not. We call these conditions “UARP Supplies Not Available or Drying Climate.” They describe 96 percent of the vulnerable outcomes and include no non-vulnerable outcomes. Figure S-2 shows the vulnerable conditions graphically in terms of precipitation and temperature (horizontal and vertical axes), with and without UARP supply (left and right graphs), and demographic growth rates (symbols). Results colored red are those that are vulnerable. The shaded region corresponds to the definition of the vulnerable conditions.

xv
Figure S-2: “UARP Supplies Not Available or Drying Climate” Vulnerable Conditions for Eastern Region
In summary, the vulnerability analysis determined that the Western Regions are primarily vulnerable to the availability of supplies from UARP, regardless of climate and growth rates. For the East, vulnerable outcomes occur even with UARP supply available; these outcomes are associated with conditions that are only slightly drier than those in the historical record. These results suggest that climate uncertainty is more critical to determining the success of EID’s plans than the assumptions about demographic growth.
How Can EID’s Vulnerabilities Be Reduced Through Additional Management Options?
Following the iterative RDM steps, we reevaluated EID’s system under the 52 scenarios three more times—once for each of three strategies. We found that increasing efficiency reduces vulnerabilities in the Western Regions when UARP supplies are not available and significantly reduces vulnerabilities in the Eastern Region when UARP supplies are available (Figure S-3). Constructing a new reservoir (Alder Reservoir) does not reduce the vulnerabilities in the Western Regions, but in the Eastern Region it does reduce vulnerabilities when UARP supplies are available from 69 percent to 46 percent of futures. Increasing efficiency and constructing the Alder Reservoir provide reductions in vulnerability for both the Western Regions when UARP supplies are not available and for the Eastern Region when UARP supplies are available. Note that while increasing efficiency and constructing the Alder Reservoir benefit the Eastern Region when UARP supplies are not available, the Eastern Region is still vulnerable in 100 percent of the scenarios evaluated. This indicates that none of the additional strategies evaluated in this

xvi
study improve reliability enough in the Eastern Region under futures in which the UARP supplies are not available.
Figure S-3: Percentage of Vulnerable Scenarios by Region, by UARP Scenario, and by Strategy
What Are the Key Tradeoffs and How Can They Inform Decisions?
Decision makers never have perfect foresight; they have to consider the full range of possible conditions that they may face and the tradeoffs among strategies. In this case, the tradeoffs are simplified to be vulnerabilities in the Western and Eastern Regions versus cost of implementing additional options. Figure S-4 plots each strategy by the percentage of futures that are vulnerable (vertical axis) and the ranked cost (horizontal axis).3 The Construct Alder Reservoir Only strategy entails more effort and costs and reduces vulnerability less than the Increase Efficiency Only strategy; hence it is a dominated strategy.4 The other strategies form a tradeoff curve between effort and percentage of futures that are vulnerable, with the current plan requiring the least effort but leading to the greatest percentage of futures vulnerable in both regions.
In the final step of the RDM analysis, we combine the empirically derived information about vulnerabilities and the conditions that lead to them with subjective information about how likely are the conditions to which the system is vulnerable. Together this information provides guidance on how much to invest to reduce vulnerabilities.
3 This study considered only ranked costs since actual costs for increasing efficiency were not available. 4 A dominated strategy is one that is inferior to others in all dimensions under consideration—in this case, reduction in vulnerability and cost.

xvii
Figure S-4: Tradeoffs Between Ranked Costs and Percentage of Vulnerable Futures
Increasing Costs Increasing Costs
NOTES: Strategies with a diamond shape are those on the frontier of the cost and vulnerability tradeoff curve. Strategies with a circular shape are dominated by alternative strategies. The horizontal axis indicates ranking of costs
only.
Conclusion This study illustrates how RDM can be used in water agency planning to consider climate
and other deep uncertainties. In this case, the study considers uncertainty about future climate and hydrologic conditions, urban growth rates, and success in developing a new, large water supply. The approach can be easily expanded to consider many more uncertainties of concern. While the results are largely demonstrative, they confirm the importance of the UARP supplies that EID is seeking for supply augmentation. This new supply alone, however, will not ensure robustness to climate change in the Eastern Region. Increasing efficiency could be an important hedge.


xix
Acknowledgments
The authors would like to thank several organizations and individuals that assisted us in this effort. For the main study report, we received substantial assistance and information from El Dorado Irrigation District staff Cindy Megerdigian and Sharon Fraser. We are grateful to staff members of the El Dorado National Forest, U.S. Department of Agriculture Forest Service Pacific Southwest Research Station, and the California Department of Forestry and Fire Protection. Finally, we appreciate the financial support of Guido Franco through the California Energy Commission’s Public Interest Energy Research (PIER) Program.


xxi
Abbreviations
AF acre-feet
CART Classification and Regression Tree
DWR California Department of Water Resources
EID El Dorado Irrigation District
ENF El Dorado National Forest
ET evapotranspiration
EV expected vulnerability
FERC Federal Energy Regulatory Commission
FFS Fire and Fire Surrogates Study
GCM general circulation model
Kc crop coefficient
LTER Long-Term Ecological Research
mm millimeter
NCAR National Center for Atmospheric Research
PIER Public Interest Energy Research
PRIM Patient Rule Induction Method
RDM Robust Decision Making
RRF runoff resistance factor
sd standard deviation
SEI Stockholm Environment Institute

xxii
SMUD Sacramento Municipal Utility District
SRO surface runoff
SRT soil recovery time
TAF thousand acre-feet
UARP Upper American River Project
USDA U.S. Department of Agriculture
UWMP Urban Water Management Plan
VRT vegetation recovery time
WEAP Water Evaluation And Planning
XLRM matrix of uncertainties or scenario factors (X), management strategies or levers (L), relationships or systems model (R), and performance metrics (M)

1
1. Introduction
Water agencies have always faced uncertainty when developing programmatic plans and constructing infrastructure. Never certain as to the hydrologic conditions in the coming years, they make educated guesses based on historical observation. They plan in advance for future water needs by estimating future water demand and then using these estimates to determine necessary infrastructure and changes in programs. Today’s water agencies use computer models of their systems to calculate future water supply, demand, and infrastructure needs. Mindful of the effects that new investments have on the water rates they must charge their customers, they seek solutions that will ensure reliable future supply of water but that are not overly costly. In some instances, this approach does not guarantee that needs will be completely met under all future conditions.
Traditional planning methods are based on the assumption of hydrologic stationarity—that is that future hydrologic conditions will be statistically similar to those recorded in the recent historical record (beginning typically sometime in the 1900s). Scientific evidence is mounting, however, that future climate and hydrologic conditions will be significantly different than those in the past because of the continued global accumulation of greenhouse gases in the atmosphere and the associated changes in climate (Milly et al., 2008).
The timing, magnitude, spatial patterns, and dynamic feedbacks that climate change will have on future hydrologic conditions are highly uncertain. Addressing these uncertainties in water planning is a significant challenge. Without knowing the statistical properties of future conditions, the application of standard reliability analyses is less appropriate than in the past (Brown, 2010b; Deser et al., 2012). For agencies that face tightening supplies in future years due to demand growth and limited options for developing new supplies, these uncertainties can have a material effect on the success of long-term plans (Groves et al., 2008; Lempert and Groves, 2010).
To begin considering climate change in long-term water plans, many agencies develop future scenarios reflecting possible changes to climate and hydrology. Although it would be desirable to develop probabilities for each scenario and employ this information using traditional reliability analysis, there is no single accepted, valid approach for doing so (Groves et al., 2008). Instead, these scenarios are often used to stress test plans developed based on historical conditions—an analysis that can be performed without ascribing any particular confidence intervals to the accuracy of the scenario forecasts. In some cases, an agency can use this information to begin formulating contingency plans. However, in many cases it is not clear how to use this information in agency decision making as agencies grapple with questions such as:
• Should we prepare for the worst scenario or the middle scenario? • Are these the best scenarios to use for our planning?

2
• What if there are other important scenarios that we did not consider? This study describes an analytic and objective approach for (1) evaluating how plausible
changes in the climate and other uncertain factors would impact an agency’s long-term plans and (2) understanding the key tradeoffs among adaptation options. This approach, called Robust Decision Making (RDM), is designed to use estimates about future climatic and hydrologic conditions without committing to the veracity of any particular estimate (Groves and Lempert, 2007; Lempert, Popper, and Bankes, 2003). Instead, it supports a systematic exploration of plausible climate effects and impacts, identifying vulnerabilities—or the specific scenario conditions that would lead agencies plans to perform unacceptably; provides information to compare options that could alleviate these vulnerabilities; and ultimately defines a robust strategy—one that will perform well over a wide range of plausible future conditions. Importantly, it supports an analysis of uncertainties related to climate change alongside other factors that may be just as important to the success of the long-term plans.
The RDM approach described and applied here represents one example of a new class of decision making approaches labeled in the literature with names such as “context-first” (Ranger et al., 2010), “decision scaling” (Brown, 2010a), “assess risk of policy” (Carter et al., 2007; Dessai and Hulme, 2007; Lempert et al., 2004), and “vulnerability and robust response” (Weaver et al., 2013). These approaches all share the central idea of beginning with a proposed policy or policies, identifying future conditions in which the policy fails to meet its goals, and then organizing available information about the future to help policy makers identify potential policy responses to those vulnerabilities and decide whether and when to adopt these responses. This ordering of analytic steps stands in contrast to the commonly practiced alternative underlying much traditional water planning, which begins with quantitative statements about relevant climate and socioeconomic factors and then uses these projections to help decision makers rank the desirability of alternative decision options. Such approaches, which follow the conceptual structure of traditional probabilistic decision and risk analysis, work well when there is widespread confidence and consensus among parties to the decision on the projected likelihood of future conditions. But such approaches can prove problematic when these conditions do not hold (Brown, 2010b; Morgan, 2009).
The study demonstrates a simplified version of RDM that can be used by local water agencies using climate data that are readily available for assimilation into models that are typically used for water supply reliability analyses. It demonstrates the approach for the El Dorado Irrigation District (EID)—a local water agency in the foothills of California’s Sierra Nevada Mountains. Researchers from the RAND Corporation and Stockholm Environment Institute (SEI) adapted the planning model used in the study and performed the analysis with the support of EID staff. The Appendix also includes a description of a preliminary investigation of fire impacts on the EID that was developed under this project.
3
2. An Approach for Addressing Climate Change by Local Water Agencies
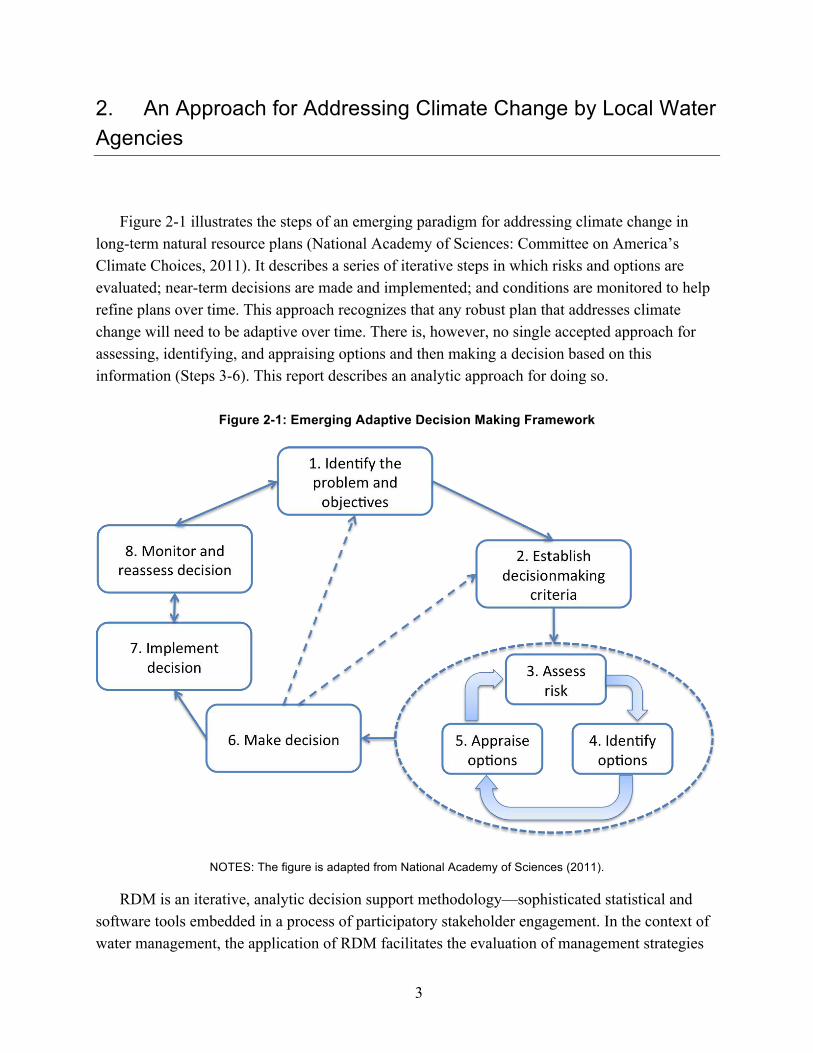
Figure 2-1 illustrates the steps of an emerging paradigm for addressing climate change in long-term natural resource plans (National Academy of Sciences: Committee on America’s Climate Choices, 2011). It describes a series of iterative steps in which risks and options are evaluated; near-term decisions are made and implemented; and conditions are monitored to help refine plans over time. This approach recognizes that any robust plan that addresses climate change will need to be adaptive over time. There is, however, no single accepted approach for assessing, identifying, and appraising options and then making a decision based on this information (Steps 3-6). This report describes an analytic approach for doing so.
Figure 2-1: Emerging Adaptive Decision Making Framework
NOTES: The figure is adapted from National Academy of Sciences (2011).
RDM is an iterative, analytic decision support methodology—sophisticated statistical and software tools embedded in a process of participatory stakeholder engagement. In the context of water management, the application of RDM facilitates the evaluation of management strategies

4
under a wide range of futures—conditions reflecting uncertainty in future climate, economic, regulatory, and other uncertainties (Groves and Lempert, 2007; Lempert, Popper, and Bankes, 2003). RDM has been applied with increasing frequency to water management applications (Groves et al., 2008; Lempert, Popper, and Bankes, 2003; Means et al., 2010; Schwarz et al., 2011), including to the U.S. Bureau of Reclamation’s 2012 Colorado River Basin Study (Bureau of Reclamation, 2012; Groves et al., 2013).
RDM helps water managers iteratively identify and evaluate robust strategies—those that perform well in terms of management objectives over a wide-range of plausible futures but may perform less well under an assumption that one future may be most likely to occur. Trading off optimality for adequacy across many possible conditions is referred to as “satisficing” (Simon, 1956). Often, the robust strategies identified by RDM are adaptive and thus designed to evolve over time in response to new information. RDM also can be used to facilitate group decision making in contentious situations where parties to the decision have strong disagreements about assumptions and values (Groves and Lempert, 2007; Lempert and Popper, 2005).
RDM helps resource managers develop adaptive strategies by iteratively evaluating the performance of leading options against a wide array of plausible futures, systematically identifying the key vulnerabilities of those strategies using statistical “scenario discovery” algorithms (Bryant and Lempert, 2010; Groves and Lempert, 2007), and using this information to suggest responses to the vulnerabilities identified (Lempert and Collins, 2007; Lempert, Popper, and Bankes, 2003; Means et al., 2010). Successive iterations develop and refine strategies that are increasingly robust. Final decisions among strategies are made by considering a few robust choices and weighing their remaining vulnerabilities. More information on RDM and descriptions of its application to a variety of policy challenges can be found at RAND’s RDMlab website (www.rand.org/rdmlab).
RDM follows an interactive series of steps consistent with the “deliberation with analysis” decision support process described by the National Research Council (National Research Council, 2009) (Figure 2-2). Deliberation with analysis begins with the participants to a decision working together to define the policy questions and develop the scope of the analysis to be performed. Subsequent steps involve data collection, modeling, and analysis, along with deliberations based on this information in which choices and objectives are revisited.

5
Figure 2-2: Process Graph for Robust Decision Making
The RDM process begins at the top of Figure 2-2 with a participatory scoping activity in which stakeholders and decision makers define their objectives and metrics, strategies that could be used to meet these objectives, the uncertainties that could affect the success of these strategies, and the relationships that govern how strategies would perform with respect to the metrics (Step 1). This scoping activity often uses a framework called “XLRM” to structure the information discussed during scoping workshops or meetings. In an XLRM framework (Lempert, Popper, and Bankes, 2003) “X” stands for the uncertain factors that are used to develop the uncertain futures; “L” stands for management strategies (or levers) in response to the various scenarios; “R” is the relationships among these elements that are reflected in the planning models; and “M” consists of the performance metrics that are used to evaluate and compare response packages. Importantly, it distinguishes between future conditions that agencies have little or no control over—e.g., climate, economics, regulatory requirements, and demand projections—and the decisions that could be made to ensure successful outcomes over whatever conditions the agency will face. XLRM usefully summarizes the information needed to organize the simulation modeling of the water system under different future conditions and management strategies.
In Step 2, analysts use the simulation model or models to evaluate the strategy or strategies in each of many plausible futures. This step in the analysis generates a large database of simulation model results (or cases). In Step 3, analysts and decision makers explore the scenario results and identify vulnerabilities—the key combinations of future conditions in which one or more candidate strategies might not meet the agency’s objectives. The information on potential vulnerabilities provides the foundation for evaluating potential modifications of the candidate

6
strategy or strategies that might reduce these vulnerabilities (Step 4). Based on this tradeoff analysis, decision makers may decide on a robust strategy, or they may decide that none of the strategies under consideration is sufficiently robust and return to the scoping exercise, this time with deeper insight into the strengths and weaknesses of the strategies initially considered.
There are also other paths through the RDM process. For instance, information in the database of model results may be used to identify the initial candidate strategy. In other situations, information about the vulnerabilities of the candidate strategy may lead directly to another scoping exercise to revisit objectives, uncertainties, or strategies.
Step 3 of RDM—characterizing vulnerabilities of strategies—often employs statistical methods called Scenario Discovery. In some applications, it may be useful to refer to this step as Vulnerability Analysis. This analysis provides concise descriptions of the combinations of future conditions that would lead a strategy to fail to meet its objectives. These descriptions of conditions can usefully be considered as decision-relevant scenarios in a decision support process because they focus decision makers’ attention on the uncertain future conditions most important to the challenges they face and help facilitate discussions regarding the best ways to respond to those challenges (Bryant and Lempert, 2010; Groves and Lempert, 2007). In other words, decision-relevant scenarios arise from a systematic analysis of performance under a wide range of future conditions. The method contrasts with efforts by analysts to handcraft traditional scenarios based on intuition about the important factors driving performance.
Scenario discovery begins with the database of simulation model results (or cases) generated in Step 2 of the RDM analysis. Users define minimally acceptable outcomes or satisficing thresholds for one or more performance metrics. These thresholds distinguish among cases in which a strategy does or does not meet the objectives.
In many analyses, algorithms such as the Patient Rule Induction Method (PRIM) (Friedman and Fisher, 1999) are used to identify decision-relevant scenarios.5 Three measures of merit help guide this process:
• Coverage: the fraction of all the vulnerable cases in the database that are contained within the scenario. (A vulnerable case is one in which the strategy does not meet its objectives.) Ideally, the scenario would contain all the vulnerable cases in the database, and coverage would be 100 percent.
• Density: the fraction of all the cases within the scenario that is vulnerable. Ideally, all the cases within the scenario would be vulnerable, and density would be 100 percent.
• Interpretability: the ease with which users can understand the information conveyed by the scenario. The number of uncertain conditions used to define the scenario serves as a proxy for interpretability. The smaller the number of parameters, the higher the interpretability.
These three measures are generally in tension with one another. For instance, increasing density may decrease coverage and interpretability. PRIM thus generates a set of decision- 5 Scenario discovery can similarly be used to identify scenarios in which a strategy performs especially well.
7
relevant scenarios and allows the users to choose the one with the combination of density, coverage, and interpretability most suitable for their application. Other algorithms, such as Classification and Regression Tree (CART) or principal component analysis, have also been used; for analyses with a small number of uncertain factors, manual inspection can be used.
Scenario discovery is most useful in situations in which some combinations of uncertain factors are significantly more important than others in determining whether or not a strategy meets its goals. In such situations, the analysis can help decision makers recognize those combinations of uncertainties that require their attention and those they can more safely ignore.


9
3. Application to Local Water Agency Planning
El Dorado Irrigation District and Its Long-Term Planning
EID Overview
This study demonstrates the use of RDM for incorporating climate change into the long-term planning of a California local water agency—EID, which lies within El Dorado County on the west slope of the Sierra Nevada Mountains (Figure 3-1). The east end of the county lies in the Sierra Nevada Mountains, where winter snow accumulation and spring and summer snowmelt constitute an important element of the regional hydrology. The western end of the district is characterized by increasing suburban and peri-urban development. In between these two extremes, the main rivers of El Dorado County run through deep, picturesque canyons where recreational activities, such as whitewater rafting and kayaking and cold-water fishing, are common and valued for both aesthetic and economic reasons. In addition to growing communities of the Sierra Nevada Foothill Region, El Dorado County also includes important agricultural regions where fruit tree orchards and vineyards generate economic value through the sale of agricultural commodities and by the visitors they draw to the region.
In addition, the EID began operating in 1999 the Project 184 Hydropower facility under a 40-year license from the Federal Energy Regulatory Commission (FERC). The new license contains requirements for operating a 21-megawatt El Dorado hydroelectric power generation project that includes provisions for maintaining year-round minimum flows and existing recreation, regulating lake levels, monitoring of aquatic conditions, enhancing fish habitats, adding a boat launch facility at Caples Lake, and other actions.

10
Figure 3-1: Location of EID Service Area in California
SOURCE: Map courtesy of EID.
EID was constituted in 1925, largely to meet the water supply needs of agricultural interests in the watershed. In earlier years, EID relied upon a network of old mining ditches and flumes to convey water from source to field. Over time, additional infrastructure was added:
• Reservoirs in the upper South Fork American River watershed (Aloha, Caples, and Silver Lakes) that provide water to EID and support Project 184, a hydropower facility licensed to EID by FERC.
• Jenkinson Reservoir, a large storage facility in the adjacent Cosumnes River watershed that supplies water.
• Conveyance and water treatment networks used to move water back and forth across the American-Cosumnes watershed divide and down slope to the concentration of EID customers in the western half of the county.
In addition to its water rights in the upper American and Cosumnes River watersheds, EID also contracts for water from the U.S. Bureau of Reclamation, which operates Folsom Reservoir adjacent to suburban communities at the extreme western edge of El Dorado County. Different parts of EID access water from different sources because of the distributed nature of the sources of supply and areas of demand. A key element of the systems operations is level of storage in Jenkinson Reservoir, which dictates from which source certain parts of the district are supplied with water. Figure 3-2 shows the geographic extent of the three major regions:
• El Dorado Hills • Eastern Region • Western Region.6
6 In this report, we call the El Dorado Hills and the Western Region EID’s “Western Regions.”

11
Figure 3-2: Major Regions Within EID Service Area
SOURCE: Map courtesy of EID.
While areas of agricultural water use still remain within the EID service area, particularly in the central part of El Dorado County, over the past several decades the development of suburban communities and the expansion of Sierra foothills communities have created what is currently the largest class of water users serviced by EID. EID now serves over 100,000 people and has operating revenue of about $55 million (El Dorado Irrigation District, 2012). Single family residential customers collectively represent roughly 67 percent of total EID water demand on an annual basis. For comparison, agricultural water users account for 14 percent of annual demand. EID expects a continued shift from the agricultural to urban use into the future.
EID Management Challenges and Opportunities
EID faces many of the same challenges facing other water districts in the West—increasing population, limited new local supply opportunities, and potential reductions in and timing of supply due to climate change. In addition, the EID service area is at risk from large wildfires.
EID has several opportunities for addressing these challenges. The Integrated Water Resources Master Plan and Wastewater Facilities Master Plan (hereafter the Master Plan) (El Dorado Irrigation District, 2013) identifies a number of different strategies including developing additional programs that increase the efficiency of water use, acquiring new water supplies through arrangements with other agencies (e.g., the Sacramento Municipal Utility District [SMUD]), and constructing reservoir facilities such as the Alder Reservoir.
El Dorado Hills
Western Region
Eastern Region
12
EID Master Plan
EID embarked on two long-term planning processes during the time this project was conducted. The first was its 2010 Urban Water Management Plan (UWMP), a prerequisite to receive state water resources funding of all urban water agencies that serve 3,000 or more customers or provide more than 3,000 acre-feet (AF) of water annually. UWMPs provide 25-year projections of agency demands and supplies under standard planning assumptions, including historical climate conditions (El Dorado Irrigation District, 2011). This document, submitted to the California Department of Water Resources (DWR), does not require, but can include a discussion of potential climate change effects on an agency’s system.
The second planning process was its the Master Plan) (El Dorado Irrigation District, 2013). The Master Plan is an EID-initiated integrated assessment of long-term future water supply, infrastructure, and maintenance needs. This study also is based primarily on historical assumptions about hydrologic conditions.
The Master Plan has a variety of objectives:
• Evaluate future water supply reliability and water supply and infrastructure constraints. • Balance water resource uses. • Consider the role of recycled water. • Develop a list of capital improvement projects and evaluate a range of new water supply
options. • Analyze potential future wastewater discharge requirements, treatment alternatives, and
costs. • Evaluate wastewater collection system capacity for existing and future average day and
peak wet weather events. • Provide a phasing schedule for collection system and treatment plant
improvement/capacity projects that will be utilized as a basis for the Capital Improvement Program.
Incorporating Climate and Other Uncertainty into EID’s Planning Prior to this study, EID worked with SEI to develop a new water management model to
assess historical hydrologic variability in support of EID’s Drought Preparedness Plan (El Dorado Irrigation District, 2008). The model was used to help identify triggers and actions to respond to drought conditions in an economically efficient manner (Yates et al., forthcoming). This project’s study team (researchers from RAND and the SEI) recognized an opportunity to use a modified version of this model to address climate change and other uncertainty in EID’s long-term planning. EID agreed to participate in this study in order to learn how to incorporate climate change into their long-term planning efforts. This report summarizes this collaboration.
The work proceeded in two phases. The first phase was conducted from the fall of 2009 through the spring of 2011. During this time, the study team worked with EID staff to update a
13
model of the EID system for use with this study and incorporate information about climate change. A concurrent analysis of fire risk was also performed (see the Appendix).
Three public workshops were held during this time, hosted by EID. Each workshop was attended by between 20 and 40 stakeholders and EID staff. The workshops were designed to follow RDM’s “deliberation with analysis” approach and provide opportunities for EID stakeholders to engage with the study and provide key inputs into the process.
During the first workshop, the study team introduced the project, the RDM methodology, and elicited feedback regarding the scope of the analysis (Step 1 of RDM, Figure 2-2). The workshop used the XLRM framework, described below, to help structure the discussion about key uncertainties, performance metrics, and management strategies to address in the study. In the second workshop, the water management model was described and demonstrated. The study team showed the graphical interface of the model and key results through the modeling interface to help the participants better understand how the model represented the EID system. The third workshop presented preliminary results from a preliminary scenario analysis that would inform the RDM analysis (Step 2 of RDM). This workshop used new visualization software (described below) to interactively demonstrate how the EID system would perform under different scenarios.
Based on feedback received from the participants, the workshops were informative and of interest. The stakeholders appreciated the opportunity to provide input into the project scoping as well as review interim outputs from the modeling and findings. The extended time between the workshops, however, limited the engagement of stakeholders and led to participant turnover between workshops. When implementing RDM in support of a formal planning process, it is important to time the model building and analysis so that periodic workshops can be convened in support of each of the four stages of the RDM process (Figure 2-2).
The second phase of the study was performed in 2012 by the study team. During this time, the study team revised the EID model to be more consistent with the Master Planning process and implemented the complete RDM analysis, as described in later sections of the report.
The analysis presented in this report has been designed to demonstrate the methodology for incorporating climate effects in agency long-term planning. Due to the concurrent timing of the Master Plan analysis, which largely followed a traditional methodology, the research presented here has been reviewed by the Master Plan analysis team but has not been endorsed or yet assimilated into EID planning processes or documents.
XLRM Framework for Structuring Uncertainty Analysis
The following subsections describe the scope of the RDM analysis using an XLRM matrix (Lempert, Popper and Bankes, 2003). It is designed to clearly distinguish among the uncertain factors (X) that are used to develop the uncertainty scenarios, available water management strategies under consideration (L), the relationships (R) among these elements that are reflected in the planning models, and the performance metrics (M) that are used to evaluate and compare

14
response packages (Table 3-1). The details of this table are described in the following subsections.
Table 3-1: Summary of Uncertainties, Policy Levers, Relationships, and Metrics (XLRM Matrix)
Uncertainties or Scenario Factors (X) Management Strategies or Levers (L)
Future climate conditions Demographics Availability of new supplies
2010 Urban Water Management Plan Additional management strategies • Additional urban water use efficiency • New reservoir
Relationships or Systems Model (R) Performance Metrics (M)
Water planning model of EID Unmet water demand and reliability Notional strategy costs
Relationships (R)
Relationships refer to the interconnections among the different components of the climate and hydrologic systems, facilities, and operational rules and management strategies. The analysis uses a water management model of the EID service area developed as part of an earlier study by SEI (Stockholm Environment Institute, 2013) in the Water Evaluation And Planning (WEAP) software package. This study augmented the WEAP model to permit a preliminary assessment of fire risk, evaluate a range of climate and demand scenarios, and evaluate additional management strategies.
WEAP EID Model
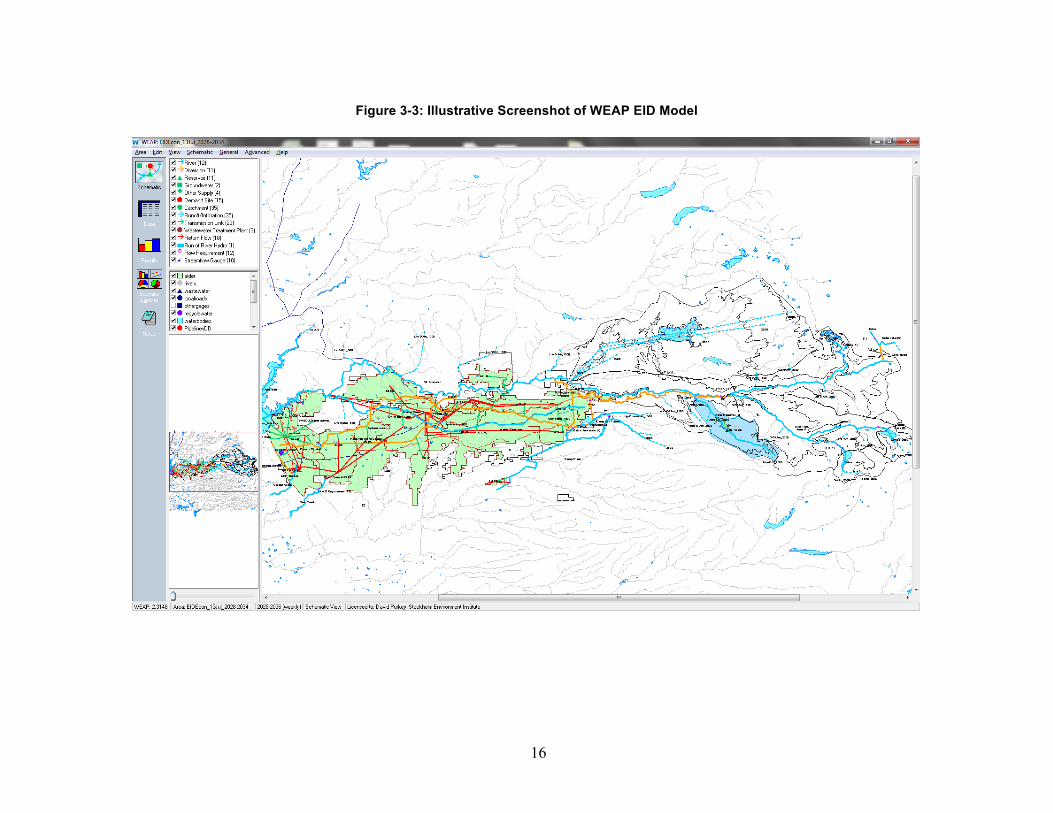
The WEAP EID model simulates weekly hydrologic flows through the system, beginning with rain and snowfall at 34 geographically distinct catchment objects, which then feeds into the major rivers and streams in the region. The model includes representations of nine reservoirs, the major transmission facilities, and system operations. Figure 3-3 shows a screenshot of the model’s user interface.
The WEAP EID model estimates demand across the service area, disaggregated by 12 different use classes and across 15 accounting zones. Single-family residential household demand is the largest class in the service area and is calculated using an econometric-based model that reflects the observed demand differences due to pricing, weather, time of year, and other factors. The model was constructed using a database of over one million bimonthly billing records from EID (Stockholm Environment Institute, 2013). The WEAP-projected future demand thus depends upon the number of users, which is expected to increase gradually over time as people and businesses move into the service area, and temperature and precipitation factors, which vary weekly.
The hydrologic component of the WEAP EID model was calibrated and validated to the naturalized flows on the South Fork of the American near Kyburz using a 20-year period from a
15
split sample (1982 to 1992 for calibration and 1993 to 2000 for validation). Several scaling parameters were adjusted to minimize the weighted least squares difference between the simulated and observed inflows. Figure 3-4 graphs the average weekly flow for the calibration and validation series, and it shows that the model adequately reproduces flows near Kyburz quite well. The validation series tends to overpredict the high flows in the spring, and underpredicts a week of extremely high flows in January 1997 (week 1).
Calibration to EID Master Plan Demand Forecast
The WEAP EID model was calibrated so that its baseline demand projection is consistent with the EID Master Plan demand forecast (Figure 3-5). Note that the WEAP demand forecast exhibits inter-annual variability because demand is estimated to vary because of weekly climate conditions. Demand is higher during dry and hot weeks.
16
Figure 3-3: Illustrative Screenshot of WEAP EID Model

17
Figure 3-4: Modeled and Observed Flows Near Kyburz for Both the Calibration and Validation Periods
NOTES: Obs Calib = observed flows during the calibration period; Mod = model predictions; Obs Valid = observed flows during the validation period.
Figure 3-5: EID Demand Projected for the Master Plan and by the WEAP EID Model Under Baseline Assumptions
Uncertainties (X)
Three scenario factors were explicitly modeled in the RDM analysis—rate of growth in the number of households in EID’s service area, climate conditions in terms of weekly temperature
South Fork American
0
10
20
30
40
50
60
70
Wk 40Wk 4
3Wk 4
6Wk 4
9Wk 5
2Wk 3 Wk 6 Wk 9
Wk 12
Wk 15Wk 1
8Wk 2
1Wk 2
4Wk 2
7Wk 3
0Wk 3
3Wk 3
6Wk 3
9
m^3
/sec
82-92 Obs Calib 82-92 Mod 93-00 Obs Valid 93-00 Mod

18
and precipitation, and the availability of the Upper American River Project (UARP) water supply (described below).
Household Growth Rate Scenarios
The baseline household growth rate was specified so that household growth matches the EID Master Plan—ranging from between 2 and 4 percent over the years and category. The high-growth scenario was specified to increase the rate of growth to 120 percent of the baseline rate (Table 3-2).
Table 3-2: Assumptions for 2005 and 2050 Growth Scenarios
Demographic Factor 20051
2030
Baseline1 High
Growth
Single-family households 32,236 64,796 71,308
Multi-family households 1,216 1,503 1,560
Commercial and industrial accounts 1,298 2,719 3,003
Other accounts 2,541 3,510 3,704
Total accounts 37,201 72,529 79,595 1 Data for the 2005 and Baseline accounts were provided by EID.
Climate Scenarios
Uncertain future climate conditions are represented by diverse sequences of temperature and precipitation applied to geographically disaggregated catchment areas in the water management model. As described below, the WEAP application of the EID system includes ten rivers, 24 sub-catchments, 15 unique demand zones, and nine reservoirs. Each sub-catchment assimilates a unique climate sequence of weekly precipitation and temperature for each simulation.
Watersheds that contribute to the EID water supply were defined based on important management or water rights points or the availability of stream gauges. Individual watersheds are a collection of sub-watersheds that connect to the main surface hydrology at a “pour point.” They are principally defined by elevation band and land use, with unique climate factors defined for each sub-watershed. A Geographic Information System process was used to compute the total area of each banded sub-catchment and the fractional land cover it contained according to four land cover classes that include barren, forested, non-forested, and urban. The latitude-longitude centroid of each sub-catchment was approximated by visual inspection and then used to retrieve the closest daily climate record from a climate dataset for both the historical period 1950 through 2005 and the climate change scenarios, which include both the historical period and a future projection out to 2100. A weekly average of temperature and total weekly precipitation was then computed for each banded sub-catchment and entered into WEAP (Figure 3-6).

19
Figure 3-6: Characterization of Watersheds and Sub-Watersheds
One set of sequences is based on historical observations and is derived from a gridded historical data set from 1950 to 2005 (Maurer et al., 2002). These historical temperature and precipitation estimates include two recent, significant droughts—from 1976–1977 and from 1987–1992.
The analysis also evaluated 12 other sets of sequences of downscaled global predictions of temperature and precipitation, corresponding to the 12 model-emissions scenario combinations selected by the Governor’s Climate Action Team (Maurer and Hidalgo, 2008). The general circulation models (GCMs) used were the following:
1. CNRM-CM3 (France) 2. GFDL-CM21 (USA) 3. Micro32med (Japan) 4. MPI-ECHAM5 (Germany) 5. NCAR-CCSM3 (USA)
Watershed
+Pour Points
Sub-watersheds
A. Sub-watershed Delineation
B. Elevation Banding
CatchmentsSub-watersheds Elevation Bands
+1
23
4 1250m 1000m 750m 500m
C. Final Catchments
01_1250 01_100001_0750
01_0500
02_0500
02_0750 02_1000
02_1250
04_1250 04_1000 04_075004_0500
03_0500
03_0750 03_1000
03_1250
Watershed
+Pour Points
Sub-watersheds
A. Sub-watershed Delineation
Watershed
+Pour PointsWatershed
+Pour PointsPour Points
Sub-watershedsSub-watersheds
A. Sub-watershed Delineation
B. Elevation Banding
CatchmentsSub-watersheds Elevation Bands
+1
23
4 1250m 1000m 750m 500m
Sub-watershedsSub-watersheds Elevation Bands
+1
23
4 1250m 1000m 750m 500m
C. Final Catchments
01_1250 01_100001_0750
01_0500
02_0500
02_0750 02_1000
02_1250
04_1250 04_1000 04_075004_0500
03_0500
03_0750 03_1000
03_1250
01_1250 01_100001_0750
01_0500
02_0500
02_0750 02_1000
02_1250
04_1250 04_1000 04_075004_0500
03_0500
03_0750 03_1000
03_1250

20
6. NCAR-PCM1 (USA). The two emissions scenarios used were the A2 and B1 scenarios (Nakicenovic et al., 2000):
The A2 SRES global emissions scenario represents a heterogeneous world with respect to demographics, economic growth, resource use and energy systems, and cultural factors. There is a de-emphasis on globalization, reflected in heterogeneity of economic growth rates and rates and directions of technological change. These and other factors imply continued growth throughout the 21st century of global GHG [greenhouse gas] emissions. By contrast, B1 is a “global sustainability” scenario. Worldwide, environmental protection and quality and human development emerge as key priorities, and there is an increase in international cooperation to address them as well as to convergence in other dimensions. Neither scenario entails explicit climate mitigation policies. The A2 and B1 global emission scenarios were selected to bracket the potential range of emissions and the availability of outputs from global climate models (California Climate Action Team, 2009).
Downscaled weekly temperature and climate projections were obtained from the California Climate Change Center. An example time series of precipitation out to 2030 for a single sub-catchment and the SRES A2/CNRM-CM3 scenario is shown in Figure 3-7.
Figure 3-7: Monthly Precipitation for the SRES A2/CNRM-CM3 Climate Simulation from 2021 to 2040 for a Single Sub-Catchment

21
Availability of UARP Supplies
The EID Urban Water Management Plan describes an agreement with SMUD to allow for storage of up to 30 thousand acre-feet (TAF) of storage in SMUD reservoirs, known as UARP water. This supply, to be first available in 2020, would provide a maximum supply in a single dry year of 15 TAF (El Dorado Irrigation District, 2011). Although EID has an agreement signed with SMUD to provide both the water and adequate storage, policy and legal issues remain. EID still must obtain the “legal right to divert the water” and “pay SMUD for foregone power revenues” (El Dorado Irrigation District, 2013). EID’s 2010 Urban Water Management Plan characterizes this project as “likely to occur,” but given its overall importance to EID’s ability to meet their objectives, we found value in considering futures where it does not.
Management Options and Strategies (L)
A wide range of water management options are available to EID to respond to future challenges. This analysis simply considers two such options to demonstrate how RDM tools can help consider the tradeoffs among options.
The first is a 20-percent increase in the efficiency of water use by 2020. This option decreases water demand in EID by 2020 over 2005, consistent with the 20x2020 Water Conservation Plan enacted by California in 2007.
The second option is to construct the new Alder Reservoir, located in the Eastern Region of EID. According to the 2005 UWMP and 2008 Drought Preparedness Plans, the Alder Reservoir would store about 31 TAF and could supply up to 11 TAF during a dry year. The WEAP model, however, estimates lower yields from this facility to meet urban demand because of a variety of operational constraints and instream flow requirements represented by the model.
This analysis considers a baseline strategy or current plan, consistent with the 2010 UWMP. It also considers three additional management strategies: (1) increase efficiency only, (2) construct Alder Reservoir only, and (3) increase efficiency and construct Alder Reservoir (Table 3-3).
Table 3-3: Summary of Management Strategies
Strategies Additional Water
Use Efficiency Construct
Alder Reservoir
Baseline (or current plan) 0% No
Increase efficiency only +20% No
Construct Alder Reservoir only 0% Yes
Increase efficiency and construct Alder Reservoir
+20% Yes
NOTE: The “Additional Water Use Efficiency” column (middle) indicates the percentage of water use efficiency over 2005 levels implemented. The “Construct Alder Reservoir” column (right) indicates if the Alder Reservoir is constructed by 2020.

22
Performance Metrics (M)
In the first project workshop, a variety of performance metrics were proposed and described:
• changes in reliability and shortages • cost of strategies • environmental impacts (flows, temperature, and qualitative impacts) • recreation • power production • fire risk. This study focuses primarily upon supply reliability and the relative costs of strategies.
Supply reliability is quantified by calculating the percentage of years in which EID can supply its demand from 2020–2050. Reliability is calculated separately for the two local regions within EID—Western Regions and Eastern Region, as they have access to different supplies.7
In practice, EID has some more flexibility in meeting demands than is captured by the WEAP model used in this study. For example, the version of the EID model used in this study does not reflect EID’s drought management plan, which can be used to manage some amount of supply shortfall. Therefore, the study defines for each region a reliability threshold—the amount of water demand that must be supplied for the system to be considered reliable. This factor allows for some small amount of supply shortfall to exist during a year without affecting the reliability calculation.
For this study, the reliability threshold percentages were set such that under the baseline planning assumptions (see Section 4), reliability in the Western Regions would be 100 percent and reliability in the Eastern Region would be 95 percent (Table 3-4). These baseline reliability levels are consistent with the observed reliability of the system over the past several decades.
Table 3-4: Reliability Thresholds
Region Reliability Threshold
Western Regions 85% Eastern Region 90%
The costs of strategies were evaluated via a very simple proxy measure that orders the
strategies by their likely costs. Based on estimates of the cost of the Alder Reservoir, we
7 The model used in this study, developed before the finalization of the agreement with SMUD, allows for a portion of the Eastern Region to receive supply from UARP, a potential major new supply source for EID. EID now expects for this supply to be available to only the Western Regions.

23
assumed that increasing efficiency is less expensive than constructing Alder Reservoir, leading to the following ranking of strategies by effort:8
1. Current plan (least expensive) 2. Increase Efficiency 3. Construct Alder Reservoir 4. Increase Efficiency and Construct Alder Reservoir (most expensive).
Fire risk was evaluated separately from the main RDM analysis and is described in the Appendix.
Experimental Design
This RDM analysis uses a full factorial experimental design across the climate, growth, and UARP scenarios to evaluate the vulnerability of the baseline strategy (Table 3-5). This same experimental design is used to evaluate the effects of each additional management strategy.
Table 3-5: Experimental Design for Vulnerability Analysis of Current Management Strategy
Climate Scenarios
Household Growth Rate Scenarios
UARP Supply Availability
Sampled Futures
13 X 2 X 2 = 52
Interactive Visualizations
An important aspect of an RDM analysis is the evaluation of large ensembles of simulations regarding how different decisions would perform under different assumptions about the future. The WEAP modeling software includes a graphical front end that supports interactive exploration of the results for a small number of simulations. To augment these capabilities, interactive visualization software is used to compile and present results from tens to thousands of different simulations.
For this study, the study team developed several visualization workbooks within the Tableau Software environment. These workbooks enabled the research team to interactively show results in the workshop setting as well as provide results among the researchers and EID collaborators.
8 The most recent cost estimates of constructing Alder Creek Reservoir is around $100 million, with significant ongoing operations and maintenance costs (El Dorado Irrigation District, 2013). Amortizing the construction costs over the 30 years of the analysis and conservatively assuming the full dry-year yield is delivered every five years and 50 percent of the dry-year yield is delivered in other years lead to unit costs of $530/AF, excluding operations and maintenance costs. This is higher than cost estimates for water efficiency that range from $233/AF to $522/AF (CALFED, 2006).


25
4. Results
In this section, we describe the results of the RDM analysis, addressing key questions that follow the iterative, analytic RDM steps shown in Figure 2-2:
• How reliable is EID’s current plan under standard planning assumptions? (Step 2) • How reliable is EID’s current plan under alternative but plausible assumptions about the
future? (Step 2) • Under what conditions is EID’s current plan most vulnerable? (Step 3) • How can EID’s vulnerabilities be reduced through additional management options?
(Steps 2 and 3) • What are the key tradeoffs among EID’s strategies for reducing its vulnerability? (Step 4) • How can expectations of the future inform decisions? (Step 4) Note that these results are based on EID baseline planning assumptions but are evaluated
using a different water management model with respect to different metrics and over a broader set of scenarios than the Master Plan. The results presented in this report, therefore, are not commensurate with the simulation results presented in the Master Plan (El Dorado Irrigation District, 2013).
How Reliable Is EID’s Current Plan Under Standard Planning Assumptions?
To provide a baseline understanding of EID’s planning challenge, this section presents an analysis of EID’s current plan (with UARP supplies available) based on only historical climate conditions and a single projection of demand. These results approximate a traditional deterministic analysis of supply and demand over time. The top panel of Figure 4-1 shows the total demand disaggregated by region (colored bars) and total supply (line) for each year from 2020 to 2050. The bottom panel shows the corresponding percentage of demand that is unmet. For all years, unmet demand is minimal—less than 4 percent. Note that these results do not reflect rationing that is a strategy pursued as part of EID’s drought management plan (El Dorado Irrigation District, 2011).

26
Figure 4-1: Supply, Demand, and Unmet Demand over Time for Historical Climate and Baseline Demand and UARP Supplies Available
NOTE: Supply—line; Demand by Region—top bars; Unmet Demand by Region—bottom bars.
To summarize unmet demand over time for the 2020–2050 time period, Figure 4-2 presents an exceedance plot for the Western Regions (dashed line) and Eastern Region (blue line). This plot shows the percentage of years (horizontal axis) in which the met demand percentage exceeds a particular percentage of demand that is met (vertical axis). The horizontal axis can be interpreted as the level of reliability in meeting the demand implied by the vertical axis. For example, under the baseline assumptions, EID’s system meets more than 90 percent of demand in the Eastern Regions in about 95 percent of the years in the forecast. For the Western Regions, the system is 100 percent reliable under any unmet demand threshold.
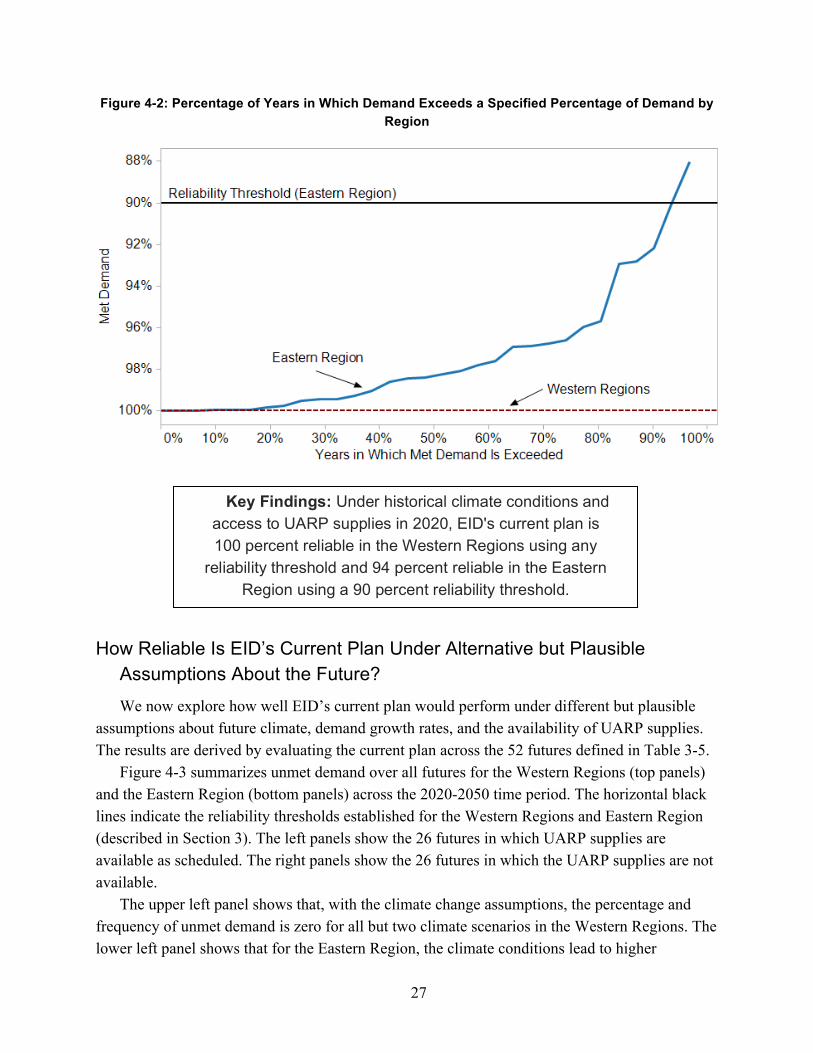
27
Figure 4-2: Percentage of Years in Which Demand Exceeds a Specified Percentage of Demand by Region
How Reliable Is EID’s Current Plan Under Alternative but Plausible Assumptions About the Future?
We now explore how well EID’s current plan would perform under different but plausible assumptions about future climate, demand growth rates, and the availability of UARP supplies. The results are derived by evaluating the current plan across the 52 futures defined in Table 3-5.
Figure 4-3 summarizes unmet demand over all futures for the Western Regions (top panels) and the Eastern Region (bottom panels) across the 2020-2050 time period. The horizontal black lines indicate the reliability thresholds established for the Western Regions and Eastern Region (described in Section 3). The left panels show the 26 futures in which UARP supplies are available as scheduled. The right panels show the 26 futures in which the UARP supplies are not available.
The upper left panel shows that, with the climate change assumptions, the percentage and frequency of unmet demand is zero for all but two climate scenarios in the Western Regions. The lower left panel shows that for the Eastern Region, the climate conditions lead to higher
Key Findings: Under historical climate conditions and access to UARP supplies in 2020, EID's current plan is 100 percent reliable in the Western Regions using any
reliability threshold and 94 percent reliable in the Eastern Region using a 90 percent reliability threshold.

28
percentages of unmet demand than the historical conditions (shown in black). There is a wide range of impacts, however, as summarized below. The results are observably different for futures in which the UARP supplies are not available (right panels in Figure 4-3). The Western Regions, which are the primary recipients of these supplies, show significant levels of unmet demand without the UARP supplies in a very high percentage of years. For example, there is less than 85 percent met demand between 20 percent and 80 percent of years, depending upon the climate and growth scenario. In the Eastern Region there are also higher levels of unmet demand, under the different climate and growth scenarios. These shortages are further exacerbated under the no UARP scenarios (lower right).
Figure 4-3: Percentage of Years in Which Demand Exceeds a Particular Percentage of Demand Across Climate and Growth Scenarios by Region (rows) and With and Without UARP Supplies
(columns)
NOTE: Each line represents one future corresponding to a single climate, growth, and UARP supply scenario.

29
To summarize the unmet demand results across the scenarios, Figure 4-4 shows the reliability for the Western Regions (using the 15-percent unmet demand threshold) and Eastern Regions (using the 10-percent unmet demand threshold) for each future, separated by the UARP supply scenario. Each square represents reliability results for one of the 52 simulation results. Results for the baseline growth scenario are shown in light red. Overlapping results appear darker in the figure. Without UARP supplies available (bottom rows for each region), reliability in both regions varies significantly across the climate and demand scenarios. If UARP supplies are not available, the most stressing scenario reduces reliability in the Western Regions to about 10 percent (assuming an 85-percent reliability threshold), and to 0 percent for the Eastern Region, (assuming a 90-percent reliability threshold). The most favorable climate and demand assumptions, however, lead reliability to exceed 75 percent and 45 percent for the Western Regions and Eastern Regions, respectively, for the given thresholds. The reliability of supply in the Eastern Region with UARP supplies is also sensitive to climate and growth assumptions—reliability ranges between about 65 percent and 95 percent.
Figure 4-4: Reliability for Each Future Disaggregated by Region and UARP Availability Scenario
NOTES: Each square represents reliability results for one of the 52 futures evaluated. Results for the baseline assumptions (historical climate, baseline growth) are indicated in light red.
To Which Conditions Is EID’s Current Plan Most Vulnerable?
RDM next analyzes the scenario results to determine which conditions lead to poor performance. We define a vulnerability threshold that indicates the minimum level of acceptable
Key Findings: Evaluating the EID system across a wide range of climate, growth, and UARP scenarios shows that for many plausible futures, reliability for both regions would be substantially degraded.

30
reliability. For this analysis, we specify a 90-percent vulnerability threshold for both regions.9 This represents a balance between seeking complete reliability, which is desirable but often cost prohibitive, and of failing to completely meet supply. The same threshold is used for both regions to reflect consistent EID robustness goals across its service area. Figure 4-5 repeats the information in Figure 4-4 but shades the results that fall below the 90-percent vulnerability threshold and thus constitute unacceptable outcomes.
Figure 4-5: Reliability for Each Future Disaggregated by Region and UARP Availability Scenario with 90-Percent Vulnerability Threshold Indicated
NOTE: Each square represents reliability results for one of the 52 futures evaluated. Results for the baseline assumptions (historical climate, baseline growth) are indicated in light red.
Figure 4-6 summarizes the percentage of futures that are vulnerable (those to the left of the vulnerability threshold in Figure 4-5). Based on the 90-percent threshold, the Western Regions are not vulnerable as long as UARP supplies are available. For the Eastern Region, if UARP supply is not available, it is vulnerable in 69 percent of the futures. If UARP supply is not available, it is vulnerable in all futures.
9 This threshold was set by the study team and viewed appropriate by EID planners.

31
Figure 4-6: Percentage of Futures Leading to Non-Vulnerable Outcomes by Region and UARP Scenario
The results above clearly indicate that the current plan is vulnerable to many of the plausible future conditions, as represented by the scenarios. However, not all futures lead to poor outcomes. We next perform a statistical analysis of the simulation results to understand which external conditions lead to vulnerabilities. This information is useful in three ways:
• to guide the exploration of additional strategies • to specify signposts or conditions to monitor that should trigger a reassessment of
strategy • to generate scenarios relevant for decisions, which can be a used to assess tradeoffs
among strategies. To describe future vulnerable conditions, we first characterize the scenarios by primary
driving factors. For the growth and UARP scenarios, the scenario definitions already describe the primary driving factors—the growth rate and availability of UARP, respectively. The climate scenarios, however, are defined by their data source—downscaled results from six different global climate models and two global emissions scenarios and the historical record. To keep the example simple, we characterize each climate scenario by its long-term temperature trend and the percentage differences in long-term mean annual precipitation from the historical record—arguably the coarsest measure of temperature and precipitation change for one particular location in EID.10 Figure 4-7 graphs each climate scenario with respect to these two factors. Note that all but three climate scenarios exhibit declines in precipitation, and half show increased rates of warming over the historical trend.
In RDM analyses with a large number of uncertain factors, statistical “scenario discovery” methods can be used to identify the ranges of uncertain factors that lead to vulnerable conditions
10 In other applications, one might test a variety of different types of climate characterizations and use algorithms such as PRIM (see Section 2) to identify those most useful in describing vulnerable outcomes.

32
(Groves and Lempert, 2007; Bryant and Lempert, 2010). For more simple applications in which only a few uncertainties are varied across the scenarios, visual inspection can identify vulnerable conditions.
For this study, we examined how demand variation, the availability of UARP supplies, and the temperature and precipitation characteristics of the climate scenarios varied for vulnerable outcomes. Through this inspection process, we identified two sets of vulnerable conditions—one for the Western Regions and one for the Eastern Region. The vulnerable conditions are descriptions of external conditions that lead to a high number of vulnerable cases (i.e., coverage) and not many non-vulnerable cases (i.e., density).
Figure 4-7: Change in Precipitation from the Historical Baseline and Temperature Trend for the 12 Climate Scenarios
For the Western Regions, 26 of the 52 futures are vulnerable and they all correspond to futures in which there is no UARP supply. These conditions can be simply called “UARP Supplies Not Available” and describe all the vulnerable outcomes (100-percent coverage) and none of the non-vulnerable outcomes (100-percent density) (Table 4-1). Figure 4-8 shows the definition of these vulnerable conditions graphically in terms of precipitation and temperature (horizontal and vertical axes), with and without UARP supply (left and right graphs), and demographic growth rates (symbols). Results colored red are those that are vulnerable. The shaded region corresponds to the definition of the vulnerable conditions.

33
Table 4-1: Summary Table for the Western Regions Vulnerable Conditions
Vulnerable Conditions Name: UARP Supplies Not Available
Metric: Supply reliability—Western Regions Definition: • UARP supplies not available Vulnerable cases: 26 of 52
Scenario statistics: • Density: 100% • Coverage: 100%
Figure 4-8: “UARP Supplies Not Available” Vulnerable Conditions for Western Regions
The vulnerable conditions are more nuanced for the Eastern Region. Table 4-2 shows that these conditions include all futures in which UARP supplies are not available. For those futures with UARP supplies available, however, the vulnerable conditions include futures in which precipitation declines by more than 3 percent from the historical average of 1,070 millimeters (mm)/year. These conditions can be called “UARP Supplies Not Available or Drying Climate.” They describe 96 percent of the vulnerable outcomes and include no non-vulnerable outcomes (i.e., 100-percent density). Figure 4-9 shows the vulnerable conditions graphically.
Although it is intuitive that the current plan is vulnerable in both regions if UARP supplies are not available, the analysis helps identify the extent and nature of the vulnerabilities when UARP supplies are available. In this case, the results suggest that climate uncertainty is more critical in determining the success of EID’s plans than the growth assumptions. The next sections will explore how additional investments can reduce vulnerabilities to both climate conditions and the availability of UARP supplies.

34
Table 4-2: Summary Table for the Eastern Region Vulnerable Conditions
Vulnerable Conditions Name: UARP Supplies Not Available or Drying Climate
Metric: Supply reliability—Eastern Region Definition: • UARP supplies not available
OR • UARP supplies available and decline from
historical baseline in precipitation more than 3% per year
Vulnerable cases: 46 of 52
Scenario statistics: • Density: 100% • Coverage: 96%
Figure 4-9: “UARP Supplies Not Available or Drying Climate” Vulnerable Conditions for Eastern Region
How Can EID’s Vulnerabilities Be Reduced Through Additional Management Options?
The preceding subsection analyzed how well EID’s current plan would perform across a wide range of futures. This subsection analyzes EID’s additional options and describes the potential of these options to reduce vulnerabilities.
Key Findings: Vulnerability analysis determined that the Western Regions are primarily vulnerable to the availability of supplies from UARP, regardless of climate and growth rates. For the East, vulnerable outcomes occur even with
UARP supply availability, and they are associated with conditions that are only slightly drier than those in the historical record.

35
Following the iterative RDM steps in Figure 2-2, we reevaluate EID’s system under the 52 scenarios three more times—once for each of the other strategies defined in Table 3-3. Figure 4-10 expands on Figure 4-6 and shows how the vulnerabilities decline under the three strategies: (1) increase efficiency only, (2) construct Alder Reservoir only, and (3) increase efficiency and construct Alder Reservoir.
Increasing efficiency reduces vulnerabilities in the Western Regions when UARP supplies are not available and significantly reduces vulnerabilities in the Eastern Region when UARP supplies are available. The Construct Alder Reservoir Only strategy does not reduce the vulnerabilities in the Western Regions,11 but in the Eastern Region it does reduce them when UARP supplies are available: from 69 percent to 46 percent of futures. The Increase Efficiency and Construct Alder Reservoir strategy provides reductions in vulnerability for both the Western Regions when UARP supplies are not available (to 54 percent of futures)12 and for the Eastern Region when UARP supplies are available (to only 12 percent of futures). Note that while increasing efficiency and constructing the Alder Reservoir benefits the Eastern Region when UARP supplies are not available, it is still vulnerable in 100 percent of the futures evaluated. This indicates that none of the additional strategies evaluated in this study address reliability challenges in the Eastern Region under futures in which the UARP supplies are not available.
Figure 4-10: Percentage of Vulnerable Futures by Region, UARP Scenario, and Strategy
11 Although constructing the Alder Reservoir alone does not reduce the number of futures in which reliability is below the vulnerability threshold, it does improve reliability across the simulations. 12 Increasing efficiency and constructing the Alder Reservoir together reduce the number of futures in which reliability is below the vulnerability threshold more than the sum of the individual reductions due to the Increase Efficiency Only and Construct Alder Reservoir Only strategies. This shows how in many futures, both options are needed to ensure adequate reliability.

36
To help EID decision makers and stakeholders weigh the relative merits of implementing the other strategies, the analysis not only describes changes in the number of vulnerable futures, but also shows how the conditions to which EID is vulnerable change. Figure 4-11 and Figure 4-12 show updated vulnerable conditions for the Current Plan, the Increase Efficiency Only, and the Increase Efficiency and Construct Alder Reservoir strategies for the Western and Eastern Regions, respectively. Table 4-3 and Table 4-4 define the vulnerable conditions for the same strategies.
In the Western Regions, increasing efficiency improves the resilience of EID’s current plan to include some futures in which there is no UARP supply. Specifically, precipitation must increase by more than between 2 and 10 percent for the regions to not be vulnerable. Constructing Alder Reservoir as well reduces the vulnerable conditions even further, however, to only those futures in which precipitation declines by more than 2 percent.

37
Figure 4-11: Vulnerabilities in Western Regions for EID Strategies

38
Table 4-3: Vulnerable Conditions with Strategies for Western Regions
Strategy Definition of Vulnerable Conditions Statistics
Current plan UARP supplies not available Vulnerable cases: 26 of 52 (50%) Density: 100% Coverage: 100%
Increase Efficiency Only
UARP supplies not available OR Precipitation increases by less than between 2% and 10%
Vulnerable cases: 20 of 52 (38%) Density: 83% Coverage: 100%
Increase Efficiency and Construct Alder Reservoir
UARP supplies not available OR Precipitation decreases by more than 2%
Vulnerable cases: 14 of 52 (27%) Density: 88% Coverage: 100%
In the Eastern Region, the strategies have no effect on the vulnerability if the UARP supply
is not available. For those futures in which UARP supply is available, the strategies expand the range of climate scenarios to which the system is resilient. Increasing efficiency reduces vulnerable conditions to only those in which precipitation declines more than 15 percent and temperatures increase more than 0.16 degrees F/year. Constructing Alder Reservoir as well further increases resilience by including all climate conditions for the baseline growth scenario.
What Are the Key Tradeoffs Among EID’s Strategies for Reducing Vulnerability? Each of the strategies analyzed would reduce EID’s vulnerability, but not without costs to
EID and its customers. With perfect foresight about future conditions, the information above identifies the strategy that eliminates the vulnerabilities at the least cost. This analysis is based on the ranking of strategy costs described in Section 3.
For the Western Regions, the current plan is adequate when UARP supplies are available, but an alternative strategy is necessary when they are not (Figure 4-13). The Increase Efficiency Only strategy eliminates vulnerabilities as long as precipitation increases by more than 2 percent. The Increase Efficiency and Construct Alder Reservoir strategy is required if precipitation trends are greater than about –2 percent. If climate conditions lead to precipitation declines more than 2 percent, however, then additional options would be necessary for the Western Regions to be resilient.

39
Figure 4-12: Vulnerabilities in Eastern Region for EID Strategies

40
Table 4-4: Vulnerable Conditions with Strategies for Eastern Region
Strategy Definition of Vulnerable Conditions Statistics
Current plan UARP supplies not available OR Precipitation decreases by more than 3%
Vulnerable cases: 26 of 52 (50%) Density: 100% Coverage: 96%
Increase Efficiency Only
UARP supplies not available OR Precipitation decreases by more than 16% AND Temperature increases by more than 0.16° F per year
Vulnerable cases: 6 of 52 (12%) Density: 100% Coverage: 94%
Increase Efficiency and Construct Alder Reservoir
UARP supplies not available OR Precipitation decreases by more than 16% AND Temperature increases by more than 0.16° F/year AND High demographic growth
Vulnerable cases: 3 of 52 (6%) Density: 93% Coverage: 97%
Figure 4-13: Least Costly Strategies for Specific Future Conditions (Western Regions)
Figure 4-14 shows the same type of information for the Eastern Region. For the Eastern Region, all strategies are vulnerable if UARP supplies are not available. If UARP supplies are available, then the current plan is adequate as long as annual precipitation is greater than about –2 percent of the historical estimates. If precipitation declines more than that, then the other strategies are needed. The Increase Efficiency Only strategy is sufficient as long as precipitation declines and temperature increases are not greater than –16% and +0.16 degrees F/year,

41
respectively.13 In these cases, the Increase Efficiency and Construct Alder Reservoir strategy is sufficient as long as the growth rate does not exceed the baseline rate. If growth does, then another strategy would be required.
Figure 4-14: Least Costly Strategies for Specific Future Conditions (Eastern Region)
Decision makers never have perfect foresight, and they must consider instead the full range of possible conditions that they may face and the tradeoffs among strategies. In this case, the tradeoffs are simplified to be vulnerabilities in the Western and Eastern Regions versus the costs of implementing additional options. Figure 4-15 plots each strategy by the percentage of futures that are vulnerable (vertical axis) and the ranked cost (horizontal axis). The Construct Alder Reservoir Only strategy entails more effort and reduced vulnerability less than the Increase Efficiency Only strategy; hence it is a dominated strategy.14 The other strategies form a tradeoff curve between effort and percentage of futures that are vulnerable, with the current plan requiring the least effort but leading to the greatest percentage of futures vulnerable in both regions. Note that this curve does not provide information about the numerical tradeoffs between vulnerability reduction and cost, since the cost information is represented only by their rankings. With cost information for each strategy, these types of graphs can provide such tradeoff information (see Lempert and Groves, 2010).
13 There is one climate scenario, A2 CNRM-CM3, which is vulnerable even with the additional strategies implemented (see Figure 4-7 and Figure 4-12). 14 The Construct Alder Reservoir Only strategy is dominated by the other strategies because other strategies can provide the same or more vulnerability reduction for lower costs.

42
Figure 4-15: Tradeoffs Between Ranked Costs and Percentage of Futures Vulnerable
Increasing Costs Increasing Costs
NOTES: Strategies with a diamond shape are those on the frontier of the cost and vulnerability tradeoff curve. Strategies with a circular shape are dominated by alternative strategies. The horizontal axis indicates ranking of costs
only.
How Can Expectations of the Future Inform EID Planning Decisions? In the previous section, we assembled tradeoff information to support a notional choice
among augmentation strategies. In a policy context, the decision maker would need to consider the following five factors:
1. The risks of doing nothing 2. The extent that risks are reduced through different augmentation strategies 3. The cost or level of effort to implement the strategies 4. The decision maker’s expectations of the likelihood of different futures and predicted
outcomes 5. The value placed on each metric. The results presented up to this point provide information relative to the first three factors.
That information alone is not sufficient to support a decision among different strategies. Information about future expectations for the vulnerable conditions and preferences over outcomes, if there are multiple performance metrics, are also required (Factors 4 and 5).

43
The RDM methodology provides a means for considering this information not at the beginning of a decision analysis, as is common in a traditional analysis, but at the end. The advantage of this approach is that the preceding analysis first identifies which conditions are relevant to the decisions—these are the vulnerable conditions. This helps focus the sometimes-difficult process of defining likelihoods for future conditions upon only those conditions that matter. Furthermore, the implications of different stakeholder and decision maker expectations can be made explicit. This information can then help support the necessary deliberations needed to finalize a decision.
In the final step of the RDM analysis, we combine the empirically derived information about vulnerabilities and the conditions that lead to them with subjective information about how likely the key vulnerabilities could be. Together this information can provide guidance on how much to invest to reduce vulnerabilities.
In this study, since we do not quantify monetary costs or impacts, we identify the least costly strategy that would lead to vulnerabilities no more than 2 out of 10 times (or 20 percent), based on a subjective assessment of how likely the key vulnerable conditions are. The 20-percent robustness threshold was set to demonstrate one possible way for EID to balance between investing to eliminate all possibilities of incurring a vulnerable outcome with the costs of doing so. A 10-percent threshold would suggest more investment, whereas a 25-percent threshold would suggest less. Future work with EID decision makers is required to understand whether a different threshold would be more appropriate.
We first conduct the analysis separately for the Western and Eastern Regions and then describe how EID might reconcile the best strategies across both regions. Table 4-5 reports for each strategy the percentage of futures that are vulnerable for the two defined vulnerable conditions. By definition, the current plan strategy is vulnerable to most or all futures within the vulnerable conditions and vulnerable to few futures outside the vulnerable conditions. Implementing the other strategies reduces the percentage of futures that lead to vulnerabilities.
The percentage vulnerable is then multiplied by different subjective probabilities about the likelihood of facing the two key vulnerable conditions. This calculation yields the expected vulnerability, expressed in terms of a percentage of futures in which the vulnerability would occur, contingent upon the subjective probability of facing the vulnerable conditions (Figure 4-16 and Figure 4-17). This calculation assumes an equal weighting of futures that are in the vulnerable conditions and those that are out of the vulnerable conditions. The 20-percent robustness threshold is indicated in the figures below.

44
Table 4-5: Percentage of Futures in Which Each Strategy Is Vulnerable
Region Vulnerable Conditions
Strategy
Baseline Increase Efficiency
Only
Increase Efficiency and Construct Alder
Reservoir
Western Regions
In “UARP Supplies Not Available”
100% 81% 54%
Not in “UARP Supplies Not Available”
0% 0% 0%
Eastern Region
In “UARP Supplies Not Available or Climate Drying”
100% 76% 69%
Not in “UARP Supplies Not Available or Climate Drying”
10% 0% 0%
Figure 4-16: Expected Vulnerability for Three Strategies as a Function of the Subjective Probability of Facing “UARP Not Available” Vulnerable Conditions (Western Regions)
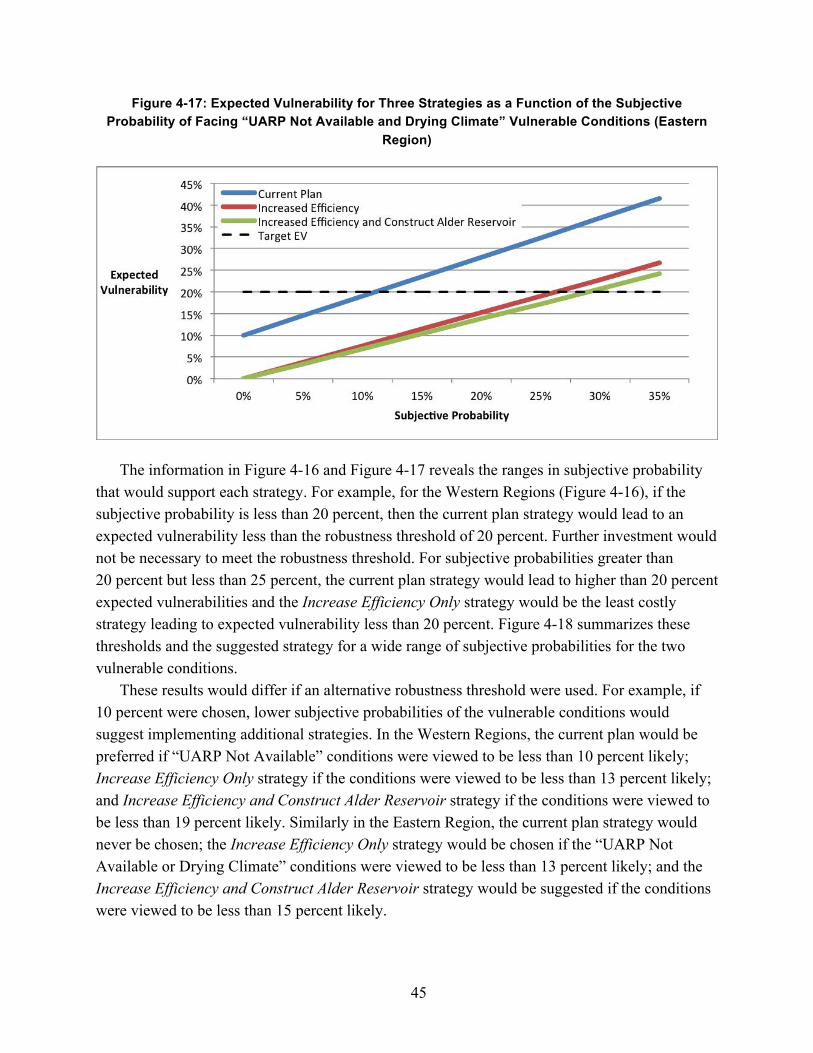
45
Figure 4-17: Expected Vulnerability for Three Strategies as a Function of the Subjective Probability of Facing “UARP Not Available and Drying Climate” Vulnerable Conditions (Eastern
Region)
The information in Figure 4-16 and Figure 4-17 reveals the ranges in subjective probability that would support each strategy. For example, for the Western Regions (Figure 4-16), if the subjective probability is less than 20 percent, then the current plan strategy would lead to an expected vulnerability less than the robustness threshold of 20 percent. Further investment would not be necessary to meet the robustness threshold. For subjective probabilities greater than 20 percent but less than 25 percent, the current plan strategy would lead to higher than 20 percent expected vulnerabilities and the Increase Efficiency Only strategy would be the least costly strategy leading to expected vulnerability less than 20 percent. Figure 4-18 summarizes these thresholds and the suggested strategy for a wide range of subjective probabilities for the two vulnerable conditions.
These results would differ if an alternative robustness threshold were used. For example, if 10 percent were chosen, lower subjective probabilities of the vulnerable conditions would suggest implementing additional strategies. In the Western Regions, the current plan would be preferred if “UARP Not Available” conditions were viewed to be less than 10 percent likely; Increase Efficiency Only strategy if the conditions were viewed to be less than 13 percent likely; and Increase Efficiency and Construct Alder Reservoir strategy if the conditions were viewed to be less than 19 percent likely. Similarly in the Eastern Region, the current plan strategy would never be chosen; the Increase Efficiency Only strategy would be chosen if the “UARP Not Available or Drying Climate” conditions were viewed to be less than 13 percent likely; and the Increase Efficiency and Construct Alder Reservoir strategy would be suggested if the conditions were viewed to be less than 15 percent likely.

46
Figure 4-18: Least Costly Strategies that Lead to Expected Vulnerabilities of Less than 20 Percent for Western Regions (top) and Eastern Region (bottom)

47
5. Discussion
This study illustrates how RDM can be used in water agency planning to consider climate and other deep uncertainties. In this case, the study considers uncertainty about future climate and hydrologic conditions, urban growth rates, and success in developing a new, large water supply. The approach can be easily expanded to consider many more uncertainties of concern.
A key feature of this approach is the use of simulation models to estimate future outcomes for a baseline strategy and proposed alternative strategies under a large set of future scenarios that capture a plausible range of future conditions. Rather than assigning probabilities to these scenarios—a potentially contentious and controversial endeavor—RDM instead analyzes the simulation results to identify those scenarios that lead to unacceptable outcomes. RDM next uses statistical tools to define the conditions that lead to these vulnerabilities. If these vulnerable conditions were to transpire, alternative strategies would be preferred. These conditions thus describe those scenarios that should be of concern to water managers and are thus most relevant for decisions about strategies.
RDM then presents key tradeoffs for water planners and stakeholders to consider in order to make a final determination about strategy. In this analysis, how much additional investment is needed in conservation or the construction of a new reservoir depends upon the likelihood EID might ascribe to either not successfully obtaining additional supplies from UARP or receiving 97 percent or less precipitation than the past average in the future. The more likely these conditions are expected to be, the more prudent additional investment would be.
A robust strategy can be developed using this information. For example, under many plausible conditions, EID’s current plan provides adequate reliability in both the Western and Eastern Regions. A key vulnerability is the development of UARP supplies. Therefore, the analysis suggests that if it becomes increasingly less likely that these supplies will be developed, then EID could hedge by increasing investments in efficiency programs. The analysis shows that as long as precipitation does not decline, then developing UARP supplies would ensure sufficient water for the Western Regions. Additional actions would be needed to improve reliability in the Eastern Region. The analysis also suggests that EID could benefit from the construction of the Alder Reservoir, particularly in cases in which UARP supplies are unavailable and climate conditions become drier. A robust, adaptive strategy would thus include not only monitoring the progress of the UARP program but also carefully monitoring climate trends and model forecasts of precipitation trends in the EID watershed.
This approach for developing robust water management plans has been used to support large-scale water planning efforts. The California Water Plan, for example, is using RDM to structure an analysis of the vulnerabilities to the California Central Valley region, and then to evaluate and compare a set of water management response packages to reduce these vulnerabilities

48
(Department of Water Resources, 2012b; Department of Water Resources, 2012a). The Bureau of Reclamation used RDM to help structure an extensive analysis of vulnerabilities and adaptation strategies for the Colorado River Basin Study (Bureau of Reclamation, 2012). For both these efforts, substantial amounts of data were compiled to simulate hundreds to thousands of futures. RDM provides a rigorous approach to interpreting these results and distilling their findings to the most important policy-relevant conclusions.
As shown in this study, however, RDM can be applied as part of routine long-term planning studies by agencies with more modest means. Any water planning agency that uses simulation models to develop long-term plans can use RDM to evaluate the robustness of its plans. In this EID case study, the costs and analytic requirements for the RDM analysis were small compared to the costs and effort to develop the concurrent EID Master Plan. Figure 5-1 presents a simple recipe to augmenting a planning activity using RDM.
Figure 5-1: Simple Recipe for Augmenting a Planning Process with Robust Decision Making
Implementing these steps requires more extensive scoping, additional modeling, and new analyses of results than what is needed in a traditional analysis, even just a modest inclusion of additional uncertainties can usefully augment a planning study. Specifically, this additional analysis can identify important vulnerabilities that are likely to represent concerns already held

49
by some stakeholders and decision makers. The additional robustness analysis can thus help provide a framework for evaluating these contingencies and ensuring that those of import are elevated and addressed by the planning process. The end result will be long-term plans that are more robust to the many uncertain future challenges facing today’s water agencies.


51
References
Brown, C., “Decision-Scaling for Robust Planning and Policy Under Climate Uncertainty,” Expert Perspectives Series Written for the World Resources Report, Vol. 2011, 2010a.
———, “The End of Reliability,” Journal of Water Resources Planning and Management, Vol. 136, No. 2, 2010b, pp. 143–145.
Bryant, Benjamin P., and Robert J. Lempert, “Thinking Inside the Box: A Participatory, Computer-Assisted Approach to Scenario Discovery,” Technological Forecasting and Social Change, Vol. 77, No. 1, 2010, pp. 34–49.
Bureau of Reclamation, Colorado River Basin Water Supply and Demand Study: Study Report, U.S. Department of the Interior, updated December 2012. As of March 14, 2013: http://www.usbr.gov/lc/region/programs/crbstudy/finalreport/studyrpt.html
CALFED, Water Use Efficiency Comprehensive Evaluation: CALFED Bay-Delta Program Water Use Efficiency Element, Sacramento, Calif.: California Bay-Delta Authority, August 2006. As of May 10, 2013: http://www.calwater.ca.gov/content/Documents/library/WUE/2006_WUE_Public_Final.pdf
California Climate Action Team, Draft 2009 Climate Action Team Biennial Report to the Governor and Legislature, March 2009. As of April 26, 2012: http://www.energy.ca.gov/2009publications/CAT-1000-2009-003/CAT-1000-2009-003-D.PDF
Carter, T. R., R. N. Jones, X. Lu, S. Bhadwal, C. Conde, L. O. Mearns, B. C. O’Neill, M. D. A. Rounsevell, and M. B. Zurek, “Chapter 2: New Assessment Methods and the Characterisation of Future Conditions,” in S. Solomon, D. Qin, M. Manning, Z. Chen, M. Marquis, K. B. Averyt, M. Tignor, and H. L. Miller, eds., Climate Change 2007: The Physical Science Basis. Contribution of Working Group I to the Fourth Assessment Report of the Intergovernmental Panel on Climate Change, Cambridge University Press, 2007.
Department of Water Resources, “Draft Assumptions and Estimates Report for California Water Plan Update 2013,” 2012a. As of March 14, 2013: http://www.waterplan.water.ca.gov/cwpu2013/ae/index.cfm
———, “Evaluating Response Packages for the California Water Plan Update 2013: Plan of Study,” 2012b. As of March 14, 2013: http://www.waterplan.water.ca.gov/docs/cwpu2013/ae/future_scenarios-plan_of-study.pdf
52
Deser, Clara, Reto Knutti, Susan Solomon, and Adam S. Phillips, “Communication of the Role of Natural Variability in Future North American Climate,” Nature Climate Change, Vol. 2, 2012, pp. 775–779.
Dessai, S., and M. Hulme, “Assessing the Robustness of Adaptation Decisions to Climate Change Uncertainties: A Case Study on Water Resources Management in the East of England,” Global Environmental Change, Vol. 17, No. 1, 2007, pp. 59–72.
El Dorado Irrigation District, El Dorado Irrigation District Drought Preparedness Plan, 2008.
———, El Dorado Irrigation District Urban Water Management Plan: 2010 Update, July 2011. As of March 15, 2013: http://www.water.ca.gov/urbanwatermanagement/2010uwmps/El%20Dorado%20Irrigation%20District/El%20Dorado%20Irrigation%20District%202010%20UWMP.pdf
———, El Dorado Irrigation District 2011 Comprehensive Annual Financial Report, 2012. As of April 23, 2013: http://www.eid.org/modules/showdocument.aspx?documentid=2296
———, El Dorado Irrigation District Integrated Water Resources Master Plan, March 8, 2013. As of April 23, 2013: http://www.eid.org/modules/showdocument.aspx?documentid=3484
Friedman, Jerome H., and Nicholas I. Fisher, “Bump Hunting in High-Dimensional Data,” Statistics and Computing, Vol. 9, No. 2, 1999, pp. 123–143.
Groves, David G., Evan Bloom, Robert J. Lempert, Jordan R. Fischbach, Jennifer Nevills, Brandon Goshi, “Developing Key Indicators for Adaptive Water Planning,” submitted.
Groves, David G., Jordan Fischbach, Evan Boom, Debra Knopman, and Ryan Keefe, Adapting to a Changing Colorado River: Making Future Water Deliveries More Reliable Through Robust Management Strategies, Santa Monica, Calif.: RAND Corporation, RR-242-BOR, 2013.
Groves, David G., and Robert J. Lempert, “A New Analytic Method for Finding Policy-Relevant Scenarios,” Global Environmental Change Part A: Human & Policy Dimensions, Vol. 17, No. 1, 2007, pp. 73–85.
Groves, David G., Robert J. Lempert, Debra Knopman, and Sandra H. Berry, Preparing for an Uncertain Future Climate in the Inland Empire: Identifying Robust Water-Management Strategies, Santa Monica, Calif.: RAND Corporation, DB-550-NSF, 2008. As of April 5, 2012: http://www.rand.org/pubs/documented_briefings/DB550

53
Lempert, Robert J., and Myles T. Collins, “Managing the Risk of Uncertain Threshold Responses: Comparison of Robust, Optimum, and Precautionary Approaches,” Risk Analysis: An International Journal, Vol. 27, No. 4, 2007, pp. 1009–1026.
Lempert, Robert J., and David G. Groves, “Identifying and Evaluating Robust Adaptive Policy Responses to Climate Change for Water Management Agencies in the American West,” Technological Forecasting and Social Change, Vol. 77, No. 6, 2010, pp. 960–974.
Lempert, Robert, Nebojsa Nakicenovic, Daniel Sarewitz, and Michael Schlesinger, “Characterizing Climate-Change Uncertainties for Decision-Makers: An Editorial Essay,” Climatic Change, Vol. 65, No. 1, 2004, pp. 1–9.
Lempert, Robert J., and Steven W. Popper, “High-Performance Government in an Uncertain World,” in Robert Klitgaard and Paul C. Light, eds., High Performance Government: Structure, Leadership, Incentives, Santa Monica, Calif.: RAND Corporation, MG-256-PRGS, 2005. As of May 7, 2012: http://www.rand.org/pubs/monographs/MG256.html
Lempert, Robert J., Steven W. Popper, and Steven C. Bankes, Shaping the Next One Hundred Years: New Methods for Quantitative, Long-Term Policy Analysis, Santa Monica, Calif.: RAND Corporation, MR-1626-RPC, 2003. As of May 4, 2012: http://www.rand.org/pubs/monograph_reports/MR1626
Maurer, E. P., A. W. Wood, J. C. Adam, D. P. Lettenmaier, and B. Nijssen, “A Long-Term Hydrologically Based Dataset of Land Surface Fluxes and States for the Conterminous United States,” Journal of Climate, Vol. 15, No. 22, 2002, p. 3237.
Maurer, E. P., and H. G. Hidalgo, “Utility of Daily Vs. Monthly Large-Scale Climate Data: An Intercomparison of Two Statistical Downscaling Methods,” Hydrology and Earth System Science, Vol. 12, 2008, pp. 551–563.
Means, Edward, Maryline Laugier, Jennifer Daw, Laurna Kaatz, and Marc Waage, Decision Support Planning Methods: Incorporating Climate Change Uncertainties into Water Planning, San Francisco, Calif.: Water Utility Climate Alliance, January 2010. As of May 7, 2012: http://www.wucaonline.org/assets/pdf/actions_whitepaper_012110.pdf
Milly, P. C. D., Julio Betancourt, Malin Falkenmark, Robert M. Hirsch, Zbigniew W. Kundzewicz, Dennis P. Lettenmaier, and Ronald J. Stouffer, “Stationarity Is Dead: Whither Water Management?” Science, Vol. 319, No. 5863, 2008, pp. 573–574.
Morgan, M. G., Best Practice Approaches for Characterizing, Communicating and Incorporating Scientific Uncertainty in Climate Decision Making: Synthesis and Assessment Product 5.2 Report, Vol. 5: U.S. Climate Change Science Program, 2009.

54
Nakicenovic, Nebojsa, Joseph Alcamo, Gerald Davis, Bert de Vries, Joergen Fenhann, Stuart Gaffin, Kenneth Gregory, Arnulf Grübler, Tae Yong Jung, Tom Kram, Emilio Lebre La Rovere, Laurie Michaelis, Shunsuke Mori, Tsuneyuki Morita, William Pepper, Hugh M. Pitcher, Lynn Price, Keywan Riahi, Alexander Roehrl, Hans-Holger Rogner, Alexei Sankovski, Michael Schlesinger, Priyadarshi Shukla, Steven J. Smith, Robert Swart, Sascha van Rooijen, Nadejda Victor, and Zhou Dadi, Special Report on Emissions Scenarios: A Special Report of Working Group III of the Intergovernmental Panel on Climate Change, The Hague, November 2000. As of May 8, 2012: http://www.osti.gov/energycitations/servlets/purl/15009867-Kv00FB/native/
National Academy of Sciences: Committee on America’s Climate Choices, America’s Climate Choices, Washington, D.C.: The National Academies Press, 2011. As of March 15, 2013: http://www.nap.edu/openbook.php?record_id=12781
National Research Council, Informing Decisions in a Changing Climate, Washington, D.C.: The National Academies Press, 2009. As of April 30, 2012: http://www.nap.edu/openbook.php?record_id=12626
Ranger, N., A. Millner, S. Dietz, S. Fankhauser, A. Lopez, and G. Ruta, Adaptation in the UK: A Decision-Making Process, Environment Agency, 2010.
Schwarz, Andrew, Suzanne Marr, Karen Schwinn, Edwin S. Townsley, Aaron O’Callaghan, John Andrew, Tom Quasebarth, Enrique Lopez-Calva, Paula Kulis, Gwen Pelletier, Tim Cox, Dan Rodrigo, Barbara Brown, Julie Hinchcliff, and Juan Tijero, Climate Change Handbook for Regional Water Planning, Sacramento, Calif.: Department of Water Resources, November 2011. As of April 26, 2012: http://www.water.ca.gov/climatechange/CCHandbook.cfm
Simon, Herbert A., “Rational Choice and the Structure of the Environment,” Psychological Review, Vol. 63, No. 2, 1956, pp. 129–138.
Stockholm Environment Institute, “WEAP: Water Evaluation and Planning [Software],” 2013. As of March 14, 2013: http://www.weap21.org
Weaver, C. P., R. J. Lempert, C. Brown, J. A. Hall, D. Revell, and D. Sarewitz, “Improving the Contribution of Climate Model Information to Decision Making: The Value and Demands of Robust Decision Frameworks,” Wiley Interdisciplinary Reviews: Climate Change, Vol. 4, No. 1, 2013, pp. 39–60.
Yates, D., F. V. Lavin, D. Purkey, S. Guerrero, M. Hanemann, and J. Sieber, “Using Economic and Other Performance Measures to Evaluate a Municipal Drought Plan,” Water Policy, forthcoming.


![RDM [module] RDM-[module]-1… · medium rdm-[module]-15 aheeehapkfgloppjljhoekmmlaanogfkbpaheeeha bnfffnbpepadepelacadbhecbkjpbhfgnpbnfffnb jaibeeflfohfjhjkaphgbjahblpaggncggelagnep](https://img.pdfslide.net/doc/110x75/5fa322a37cebb95cfe55ebc7/rdm-module-rdm-module-1-medium-rdm-module-15-aheeehapkfgloppjljhoekmmlaanogfkbpaheeeha.jpg)


![IMP - MML IMP - MML IMP - MML IMP - IPDU[SA-5] CVCZ [EA-3] [EA-5] ZRP E1 RDM ZRP RDM CZ OU I1 VT E1 RDM PTP PTP E1 ZRP RDM E1 RDM PTP PTP E1 CZ RDM CV RDM RDM E1 E1 CV CZ RDM CV …](https://img.pdfslide.net/doc/110x75/613f5e17a7a58608c268e102/imp-mml-imp-mml-imp-mml-imp-sa-5-cvcz-ea-3-ea-5-zrp-e1-rdm-zrp-rdm.jpg)