Embed Size (px)
Citation preview

Protein Charge Transfer Absorption Spectra: An Intrinsic Probe to Monitor Structural and Oligomeric Transitions in Proteins, Ansari et. al., Submitted to Faraday Discussions in September 2017
Supporting Information
Protein Charge Transfer Absorption Spectra: An Intrinsic Probe to Monitor Structural and Oligomeric Transitions in Proteins
Mohd. Ziauddin Ansaria, Amrendra Kumara, Dileep Aharia, Anurag Priyadarshia,
Padmavathi Lollab, Rashna Bhandarib and Rajaram Swaminathan*a
aDepartment of Biosciences & Bioengineering, Indian Institute of Technology Guwahati,
Guwahati 781039, Assam, India.E-mail: [email protected] bLaboratory of Cell Signalling, Centre for DNA Fingerprinting and Diagnostics (CDFD),
Hyderabad 500001, India
Electronic Supplementary Material (ESI) for Faraday Discussions.This journal is © The Royal Society of Chemistry 2017

Protein Charge Transfer Absorption Spectra: An Intrinsic Probe to Monitor Structural and Oligomeric Transitions in Proteins, Ansari et. al., Submitted to Faraday Discussions in September 2017
Page2of19
CONTENTS
Page Number Figure S1 Disorder prediction plots 3 Figure S2 Purification of PEST Wt and PEST M1 4 Figure S3 Mass Spectra of PEST Wt and PEST M1 5 Figure S4 Purification of DHN1 6 Figure S5 Mass Spectrum of DHN1 7 Figure S6 Comparison of absorption spectra with simulated scatter 8 Figure S7 PEST Wt, PEST M1 and DHN1 exist as a monomer in solution 9 Figure S8 Absorption spectrum of DHN1 in 0.1 N NaOH 10 Figure S9 Percent change in absorbance at different pH with respect to pH 7 11 Figure S10 Secondary structure content of PEST Wt and M1 at various pH 12 Figure S11 Fitted CD Spectra of PEST Wt and M1 at various pH 13 Figure S12 CD spectra of DHN1 and α3C at various pH 14 Figure S13 Percent change in absorbance at different temperatures with 15
respect to 25 °C Figure S14 Secondary structure content of PEST Wt and M1 at various 16
temperatures Figure S15 Fitted CD Spectra of PEST Wt and M1 at various temperatures 17 Figure S16 Percent change in absorbance with NaCl and KCl with respect 18
to water Figure S17 Concentration dependence of ProCharTS in HEWL aggregates 19

Protein Charge Transfer Absorption Spectra: An Intrinsic Probe to Monitor Structural and Oligomeric Transitions in Proteins, Ansari et. al., Submitted to Faraday Discussions in September 2017
Page3of19
Figure S1 Disorder prediction plots
Figure S1: Intrinsic disorder prediction plots of the proteins for [A] PEST Wt; [B] PEST M1 and [C] DHN1 as obtained by various predictors. Disorder prediction was determined using Genesilico MetaDisorder server. (L. P. Kozlowski and J. M. Bujnicki, BMC Bioinformatics, 2012, 13, 111.)

Protein Charge Transfer Absorption Spectra: An Intrinsic Probe to Monitor Structural and Oligomeric Transitions in Proteins, Ansari et. al., Submitted to Faraday Discussions in September 2017
Page4of19
Figure S2 Purification of PEST Wt and PEST M1
Figure S2: 15 % Reducing SDS-PAGE showing a single band of purified proteins for [A] PEST Wt and [B] PEST M1. Apparent molecular weight of PEST proteins on SDS-PAGE is approximately 15 kDa because of its anomalous mobility.

Protein Charge Transfer Absorption Spectra: An Intrinsic Probe to Monitor Structural and Oligomeric Transitions in Proteins, Ansari et. al., Submitted to Faraday Discussions in September 2017
Page5of19
Figure S3 Mass Spectra of PEST Wt and PEST M1
Figure S3: Mass spectra of [A] PEST Wt and [B] PEST M1. The mass calculated from sequence were 8341.61 and 8527.82 Da.
Protein Charge Transfer Absorption Spectra: An Intrinsic Probe to Monitor Structural and Oligomeric Transitions in Proteins, Ansari et. al., Submitted to Faraday Discussions in September 2017
Page6of19
Figure S4 Purification of DHN1
Figure S4: 15% Reducing SDS-PAGE shows the single band of purified DHN1 at 19 kDa. Higher molecular weight of DHN1 on SDS-PAGE is observed due to its anomalous mobility.
Protein Charge Transfer Absorption Spectra: An Intrinsic Probe to Monitor Structural and Oligomeric Transitions in Proteins, Ansari et. al., Submitted to Faraday Discussions in September 2017
Page7of19
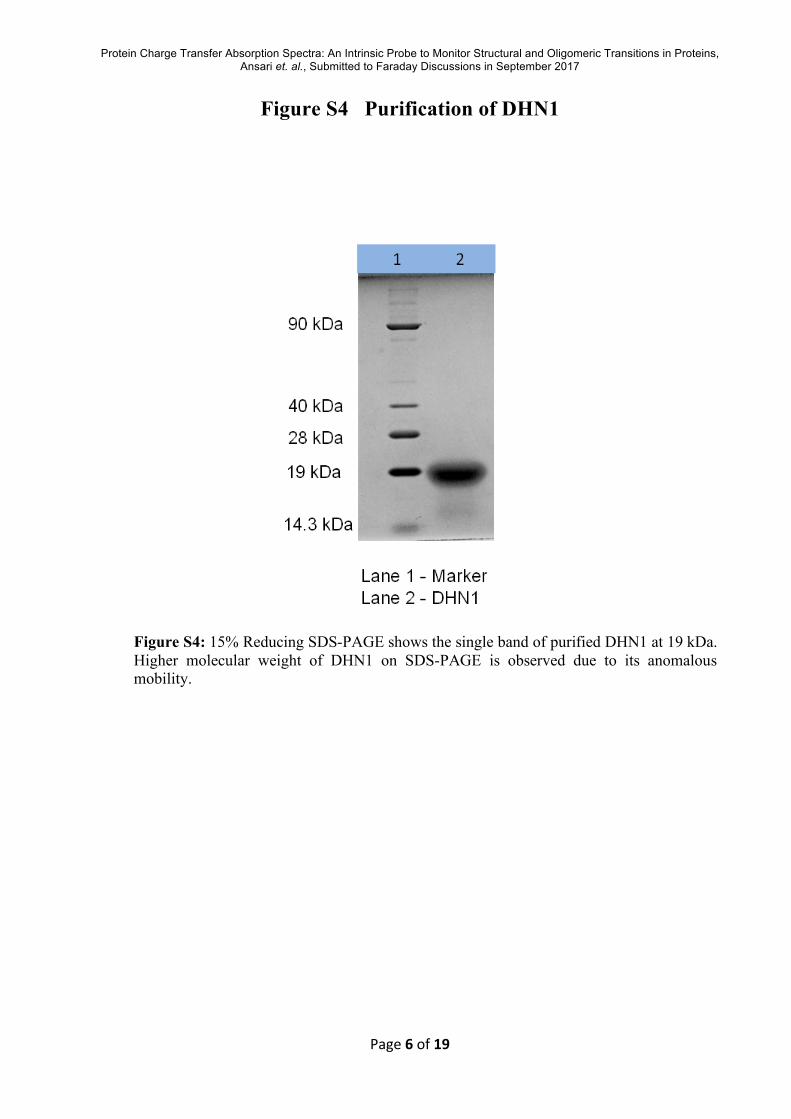
Figure S5 Mass Spectrum of DHN1
Figure S5: Mass spectrum of Dehydrin (DHN1). The mass calculated from sequence was 16955.33 Da.

Protein Charge Transfer Absorption Spectra: An Intrinsic Probe to Monitor Structural and Oligomeric Transitions in Proteins, Ansari et. al., Submitted to Faraday Discussions in September 2017
Page8of19
Figure S6 Comparison of absorption spectra with simulated scatter
Figure S6: Comparision of absorbance spectra with simulated Rayleigh scatter (using 1/λ4 dependence) for [A] PEST Wt; [B] PEST M1; [C] DHN1 and [D] HEWL aggregate formed in Glycine buffer (pH 2.0).

Protein Charge Transfer Absorption Spectra: An Intrinsic Probe to Monitor Structural and Oligomeric Transitions in Proteins, Ansari et. al., Submitted to Faraday Discussions in September 2017
Page9of19
Figure S7 PEST Wt, PEST M1 and DHN1 exist as a monomer in solution
Figure S7: Variation of ProCharTS absorbance with protein concentration for [A] PEST Wt; [B] PEST M1 and [C] DHN1 at chosen wavelengths.

Protein Charge Transfer Absorption Spectra: An Intrinsic Probe to Monitor Structural and Oligomeric Transitions in Proteins, Ansari et. al., Submitted to Faraday Discussions in September 2017
Page10of19
Figure S8 Absorption spectrum of DHN1 in 0.1 N NaOH
Figure S8: Absorption spectrum of DHN1 in 0.1 N NaOH. Inset shows DHN1 spectrum after subtracting contribution of Phe and Tyr (260 to 326 nm).
Protein Charge Transfer Absorption Spectra: An Intrinsic Probe to Monitor Structural and Oligomeric Transitions in Proteins, Ansari et. al., Submitted to Faraday Discussions in September 2017
Page11of19
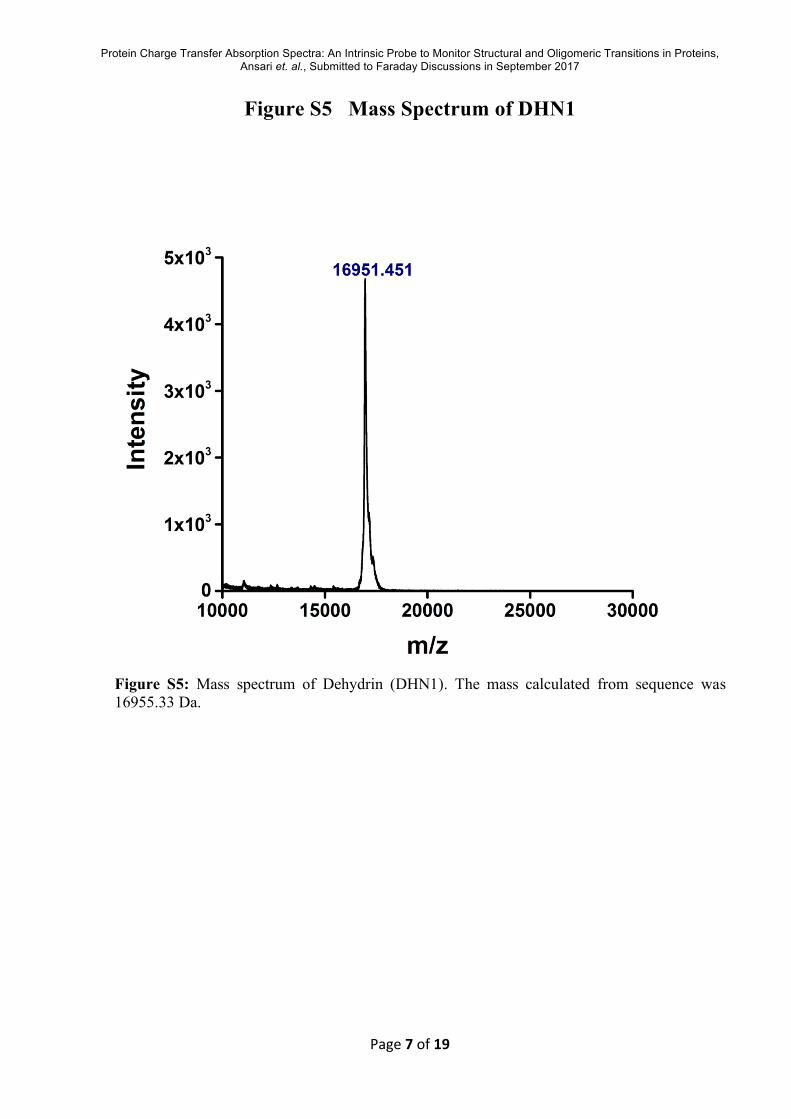
Figure S9 Percent change in absorbance at different pH with respect to pH 7
Figure S9: Percent change in absorption intensity measured every 25 nm at specified pH among the proteins [A] PEST Wt; [B] PEST M1; [C] DHN1 and [D] α3C with respect to pH 7. The change in absorbance at selected wavelengths were calculated as [(Absorbance at chosen pH – Absorbance at pH 7)/Absorbance at pH 7]×100.

Protein Charge Transfer Absorption Spectra: An Intrinsic Probe to Monitor Structural and Oligomeric Transitions in Proteins, Ansari et. al., Submitted to Faraday Discussions in September 2017
Page12of19
Figure S10 Secondary structure content of PEST Wt and M1 at various pH
Figure S10: Change in secondary structure content in [A] PEST Wt and [B] PEST M1 at various pH and in deionized water.

Protein Charge Transfer Absorption Spectra: An Intrinsic Probe to Monitor Structural and Oligomeric Transitions in Proteins, Ansari et. al., Submitted to Faraday Discussions in September 2017
Page13of19
Figure S11 Fitted CD Spectra of PEST Wt and M1 at various pH
Figure S11: Fitted CD spectra of [A] PEST Wt and [B] PEST M1 by using DichroWeb server at pH 3 and 9.

Protein Charge Transfer Absorption Spectra: An Intrinsic Probe to Monitor Structural and Oligomeric Transitions in Proteins, Ansari et. al., Submitted to Faraday Discussions in September 2017
Page14of19
Figure S12 CD spectra of DHN1 and α3C at various pH
Figure S12: CD spectra of [A] 12.5 µM DHN1 and [B] 30 µM α3C at various pH.

Protein Charge Transfer Absorption Spectra: An Intrinsic Probe to Monitor Structural and Oligomeric Transitions in Proteins, Ansari et. al., Submitted to Faraday Discussions in September 2017
Page15of19
Figure S13 Percent change in absorbance at different temperatures with respect to room temperature (25 °C)
Figure S13: Percent change in absorption intensity measured every 25 nm at specified temperature among the proteins [A] PEST Wt; [B] PEST M1 and [C] DHN1 with respect to room temperature (25 ˚C). The change in absorbance at selected wavelengths were calculated as [(Absorbance at chosen temperature – Absorbance at 25°C)/Absorbance at 25 °C]×100.

Protein Charge Transfer Absorption Spectra: An Intrinsic Probe to Monitor Structural and Oligomeric Transitions in Proteins, Ansari et. al., Submitted to Faraday Discussions in September 2017
Page16of19
Figure S14 Secondary structure content of PEST Wt and M1 at various temperatures
Figure S14: Change in secondary structure content in [A] PEST Wt and [B] PEST M1 at different temperatures.

Protein Charge Transfer Absorption Spectra: An Intrinsic Probe to Monitor Structural and Oligomeric Transitions in Proteins, Ansari et. al., Submitted to Faraday Discussions in September 2017
Page17of19
Figure S15 Fitted CD Spectra of PEST Wt and M1 at various temperatures
Figure S15: Fitted CD spectra of [A] PEST Wt and [B] PEST M1 by using DichroWeb server at 25 and 85 °C.

Protein Charge Transfer Absorption Spectra: An Intrinsic Probe to Monitor Structural and Oligomeric Transitions in Proteins, Ansari et. al., Submitted to Faraday Discussions in September 2017
Page18of19
Figure S16 Percent change in absorbance with NaCl and KCl with respect to water
Figure S16: Percent change in absorption intensity measured at 25 nm intervals among the proteins [A] PEST Wt; [B] PEST M1; [C] DHN1 and [D] α3C in 250 mM NaCl and 250 mM KCl with respect to absorption of proteins in deionised water. The change in absorbance were calculated at selected wavelengths as [(Absorbance in salt – Absorbance in water)/Absorbance in water]×100.

Protein Charge Transfer Absorption Spectra: An Intrinsic Probe to Monitor Structural and Oligomeric Transitions in Proteins, Ansari et. al., Submitted to Faraday Discussions in September 2017
Page19of19
Figure S17 Concentration dependence of ProCharTS on concentration of HEWL aggregates
Figure S17: ProCharTS of HEWL aggregates formed at pH 12.2: Difference absorption spectra of 10 day old HEWL aggregates for different monomer concentrations is shown. All absorbance measurements were done immediately after transfer in 0.1 M sodium bicarbonate buffer (pH 9.3). Difference spectra are generated by subtracting the spectra of fresh HEWL monomer of same concentration in the same buffer as the transferred aggregates.


![13172 PP Collection 14_[LowRes]](https://img.pdfslide.net/doc/110x75/55cf999e550346d0339e4db7/13172-pp-collection-14lowres.jpg)