Embed Size (px)
Citation preview
S1
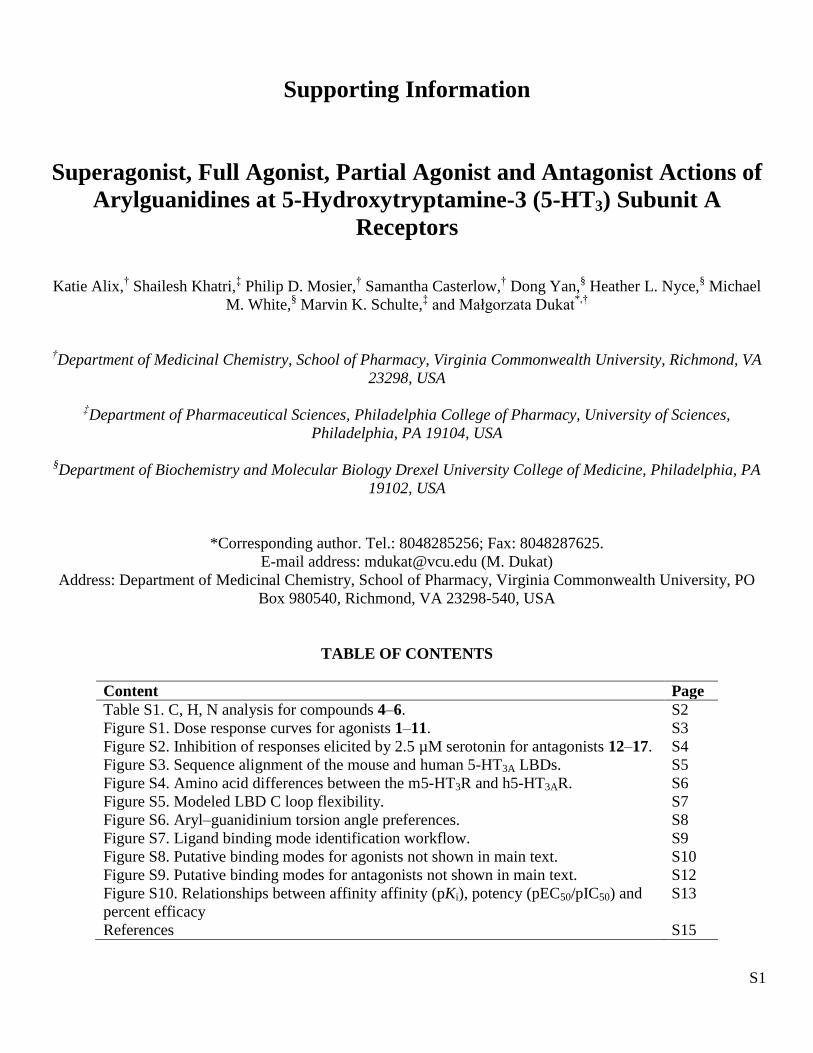
Supporting Information
Superagonist, Full Agonist, Partial Agonist and Antagonist Actions of
Arylguanidines at 5-Hydroxytryptamine-3 (5-HT3) Subunit A
Receptors
Katie Alix,† Shailesh Khatri,
‡ Philip D. Mosier,
† Samantha Casterlow,
† Dong Yan,
§ Heather L. Nyce,
§ Michael
M. White,§ Marvin K. Schulte,
‡ and Małgorzata Dukat
*,†
†Department of Medicinal Chemistry, School of Pharmacy, Virginia Commonwealth University, Richmond, VA
23298, USA
‡Department of Pharmaceutical Sciences, Philadelphia College of Pharmacy, University of Sciences,
Philadelphia, PA 19104, USA
§Department of Biochemistry and Molecular Biology Drexel University College of Medicine, Philadelphia, PA
19102, USA
*Corresponding author. Tel.: 8048285256; Fax: 8048287625.
E-mail address: [email protected] (M. Dukat)
Address: Department of Medicinal Chemistry, School of Pharmacy, Virginia Commonwealth University, PO
Box 980540, Richmond, VA 23298-540, USA
TABLE OF CONTENTS
Content Page
Table S1. C, H, N analysis for compounds 4–6. S2
Figure S1. Dose response curves for agonists 1–11. S3
Figure S2. Inhibition of responses elicited by 2.5 µM serotonin for antagonists 12–17. S4
Figure S3. Sequence alignment of the mouse and human 5-HT3A LBDs. S5
Figure S4. Amino acid differences between the m5-HT3R and h5-HT3AR. S6
Figure S5. Modeled LBD C loop flexibility. S7
Figure S6. Aryl–guanidinium torsion angle preferences. S8
Figure S7. Ligand binding mode identification workflow. S9
Figure S8. Putative binding modes for agonists not shown in main text. S10
Figure S9. Putative binding modes for antagonists not shown in main text. S12
Figure S10. Relationships between affinity affinity (pKi), potency (pEC50/pIC50) and
percent efficacy
S13
References S15
S2
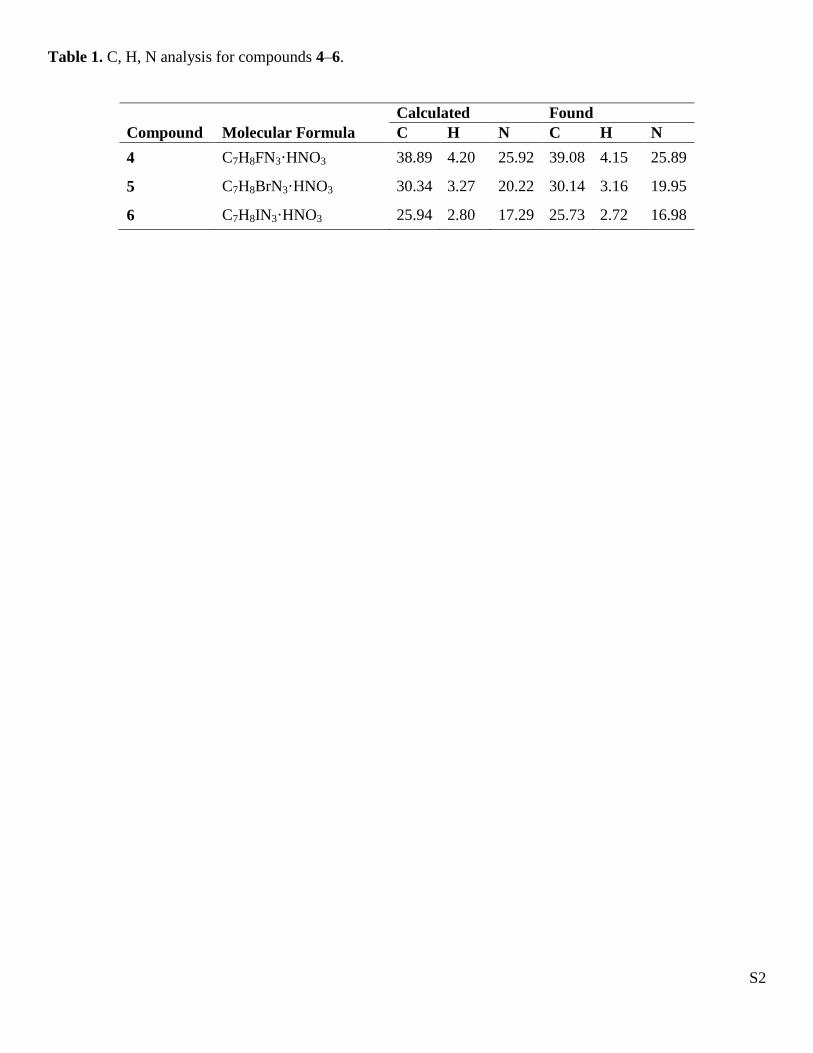
Table 1. C, H, N analysis for compounds 4–6.
Calculated Found
Compound Molecular Formula C H N C H N
4 C7H8FN3·HNO3 38.89 4.20 25.92 39.08 4.15 25.89
5 C7H8BrN3·HNO3 30.34 3.27 20.22 30.14 3.16 19.95
6 C7H8IN3·HNO3 25.94 2.80 17.29 25.73 2.72 16.98
S3
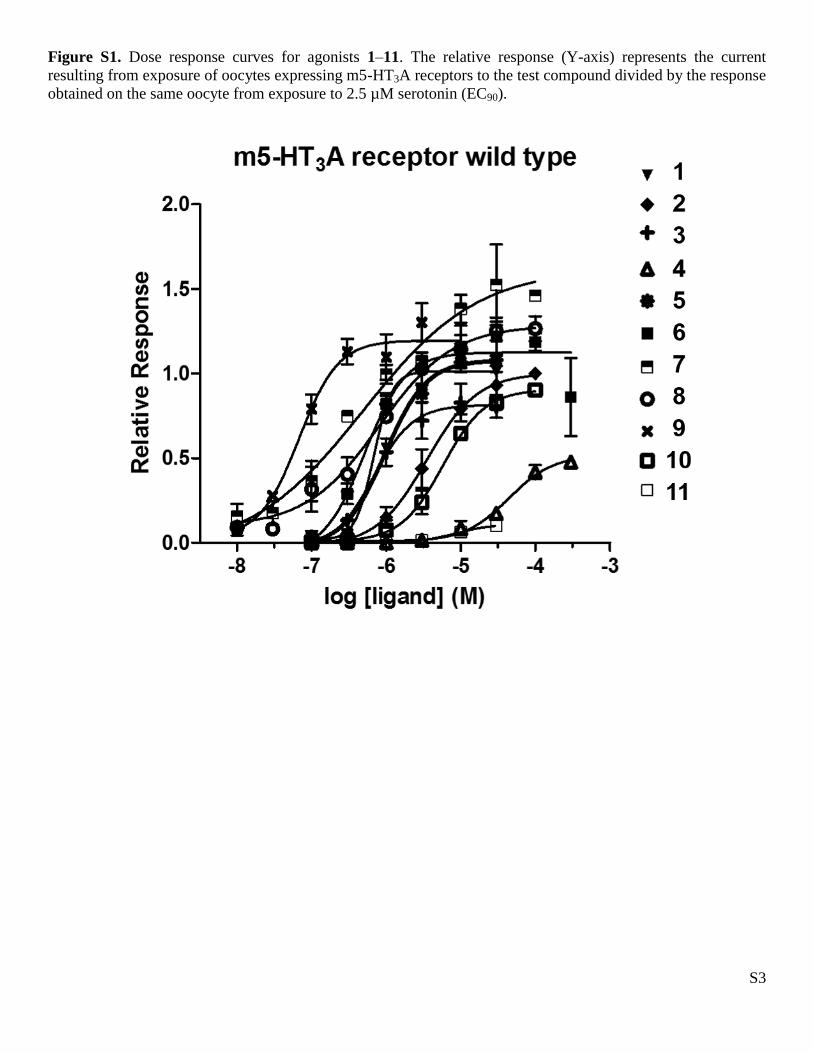
Figure S1. Dose response curves for agonists 1–11. The relative response (Y-axis) represents the current
resulting from exposure of oocytes expressing m5-HT3A receptors to the test compound divided by the response
obtained on the same oocyte from exposure to 2.5 µM serotonin (EC90).
S4
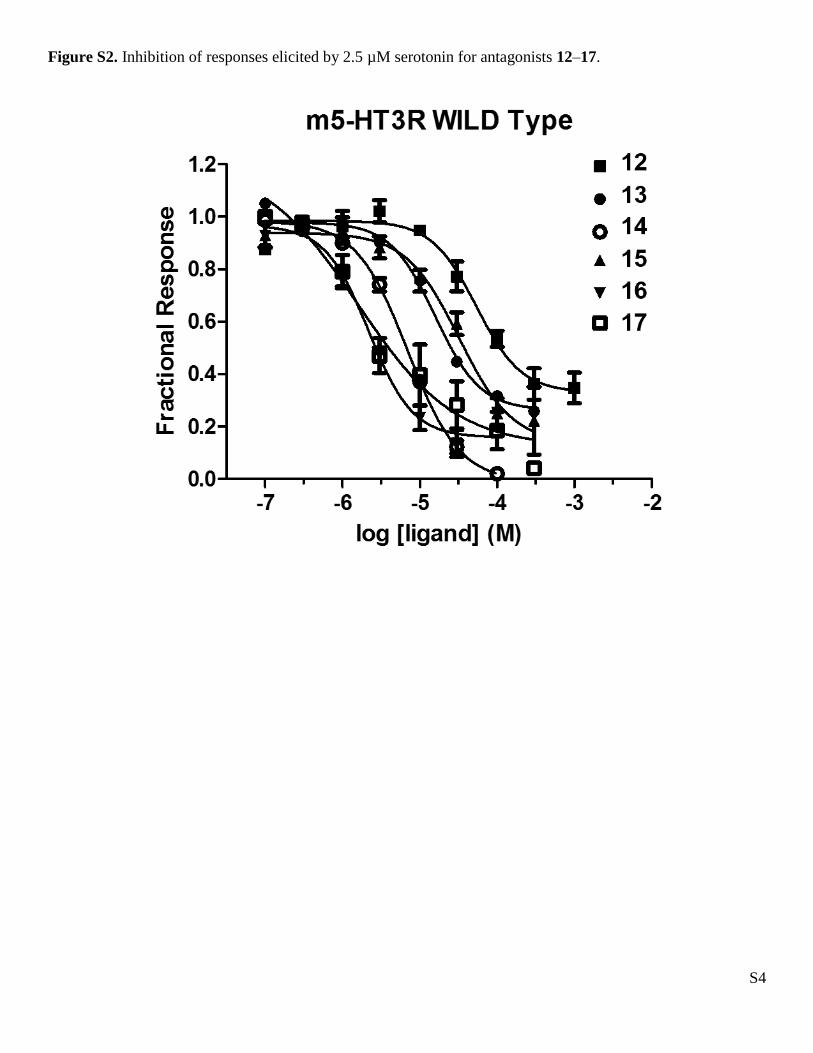
Figure S2. Inhibition of responses elicited by 2.5 µM serotonin for antagonists 12–17.
S5
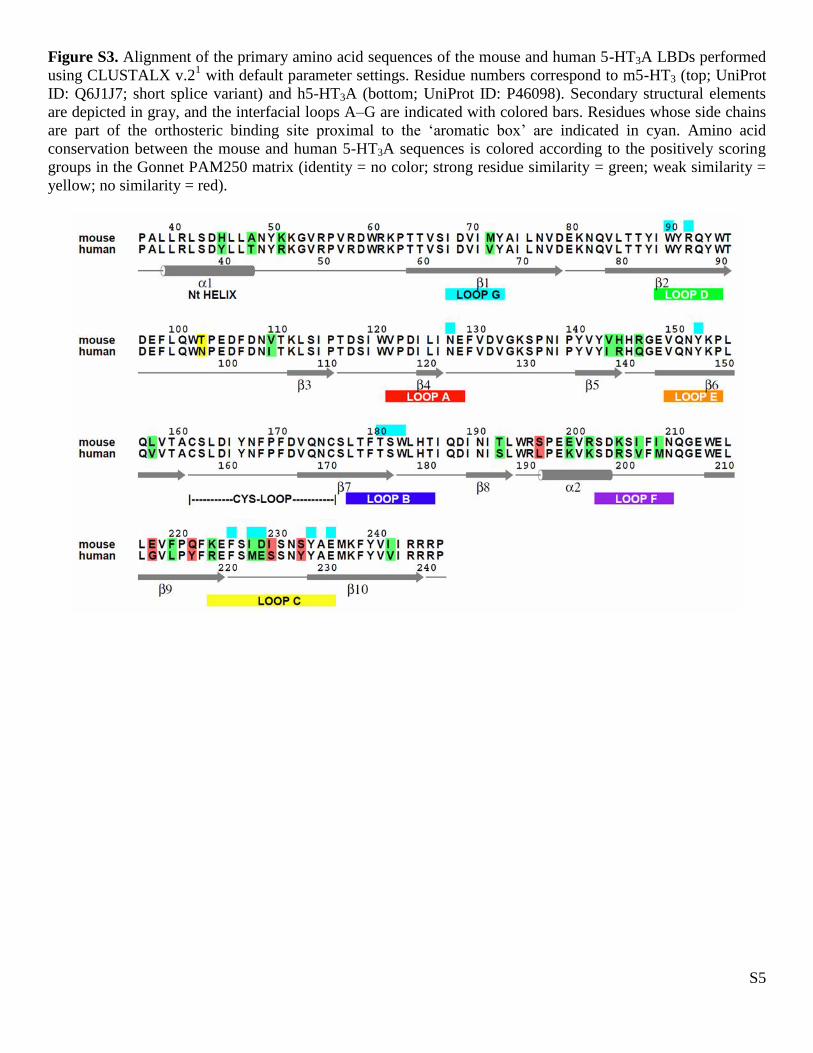
Figure S3. Alignment of the primary amino acid sequences of the mouse and human 5-HT3A LBDs performed
using CLUSTALX v.21 with default parameter settings. Residue numbers correspond to m5-HT3 (top; UniProt
ID: Q6J1J7; short splice variant) and h5-HT3A (bottom; UniProt ID: P46098). Secondary structural elements
are depicted in gray, and the interfacial loops A–G are indicated with colored bars. Residues whose side chains
are part of the orthosteric binding site proximal to the ‘aromatic box’ are indicated in cyan. Amino acid
conservation between the mouse and human 5-HT3A sequences is colored according to the positively scoring
groups in the Gonnet PAM250 matrix (identity = no color; strong residue similarity = green; weak similarity =
yellow; no similarity = red).
S6
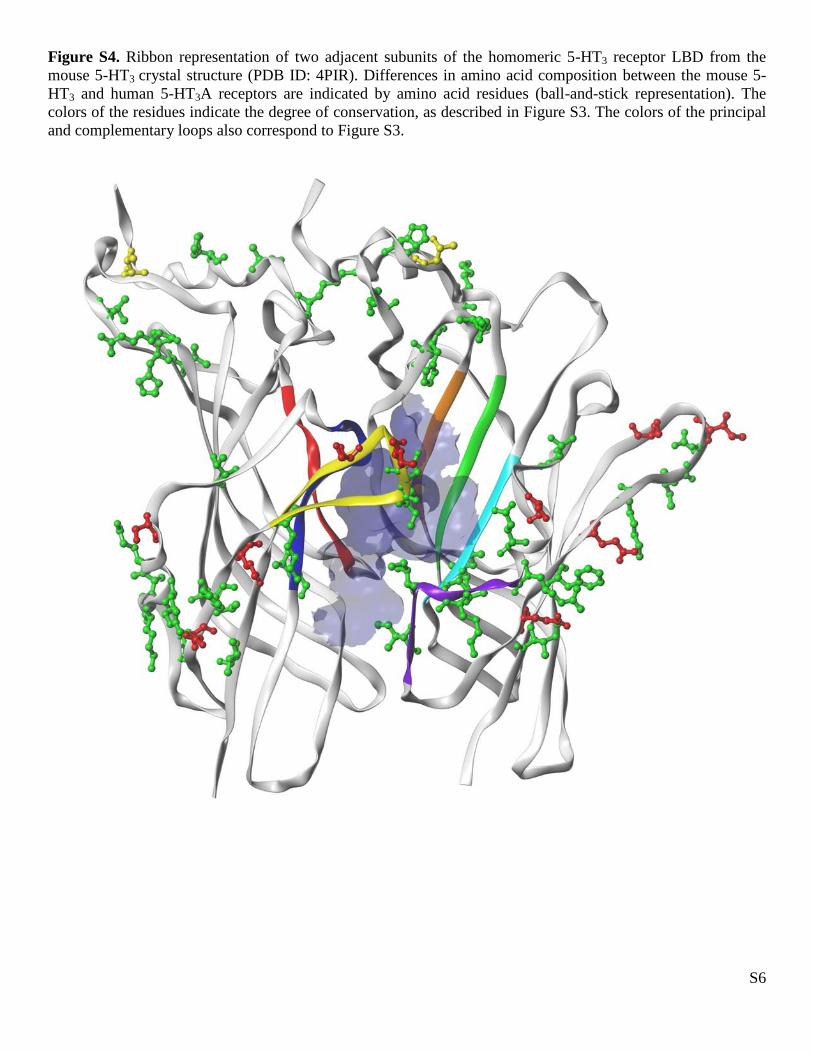
Figure S4. Ribbon representation of two adjacent subunits of the homomeric 5-HT3 receptor LBD from the
mouse 5-HT3 crystal structure (PDB ID: 4PIR). Differences in amino acid composition between the mouse 5-
HT3 and human 5-HT3A receptors are indicated by amino acid residues (ball-and-stick representation). The
colors of the residues indicate the degree of conservation, as described in Figure S3. The colors of the principal
and complementary loops also correspond to Figure S3.
S7
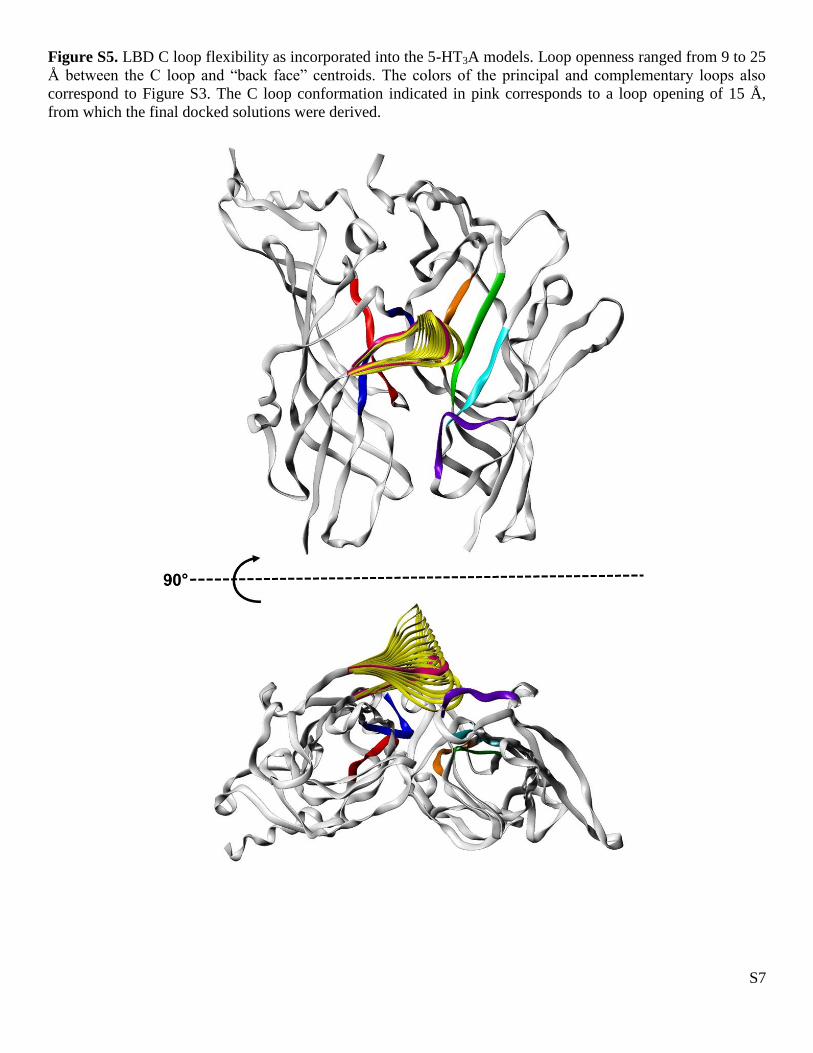
Figure S5. LBD C loop flexibility as incorporated into the 5-HT3A models. Loop openness ranged from 9 to 25
Å between the C loop and “back face” centroids. The colors of the principal and complementary loops also
correspond to Figure S3. The C loop conformation indicated in pink corresponds to a loop opening of 15 Å,
from which the final docked solutions were derived.
S8
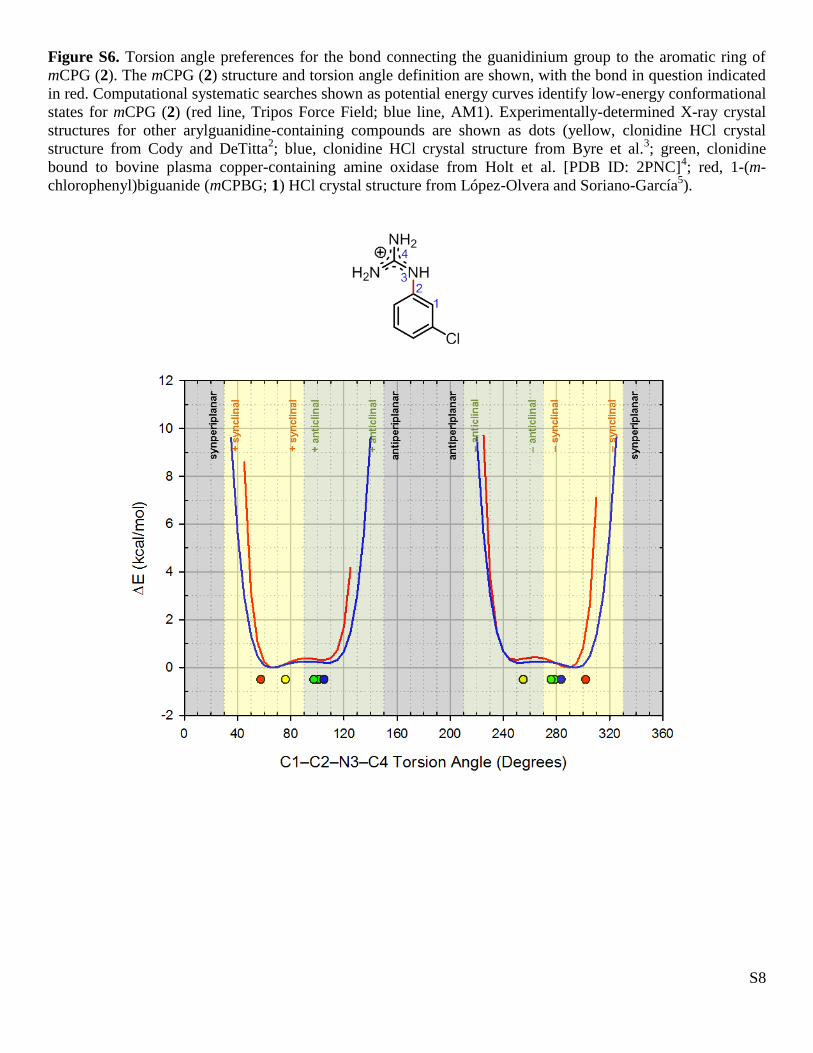
Figure S6. Torsion angle preferences for the bond connecting the guanidinium group to the aromatic ring of
mCPG (2). The mCPG (2) structure and torsion angle definition are shown, with the bond in question indicated
in red. Computational systematic searches shown as potential energy curves identify low-energy conformational
states for mCPG (2) (red line, Tripos Force Field; blue line, AM1). Experimentally-determined X-ray crystal
structures for other arylguanidine-containing compounds are shown as dots (yellow, clonidine HCl crystal
structure from Cody and DeTitta2; blue, clonidine HCl crystal structure from Byre et al.
3 ; green, clonidine
bound to bovine plasma copper-containing amine oxidase from Holt et al. [PDB ID: 2PNC]4; red, 1-(m-
chlorophenyl)biguanide (mCPBG; 1) HCl crystal structure from López-Olvera and Soriano-García5).
S9
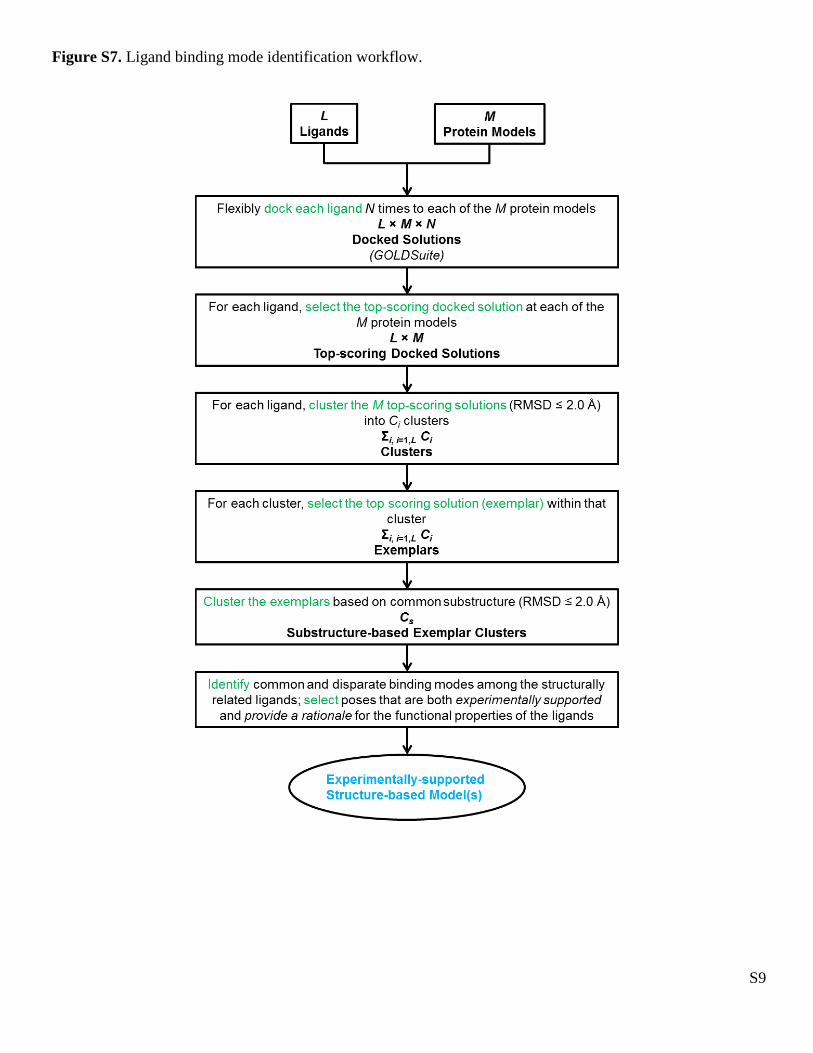
Figure S7. Ligand binding mode identification workflow.
S10
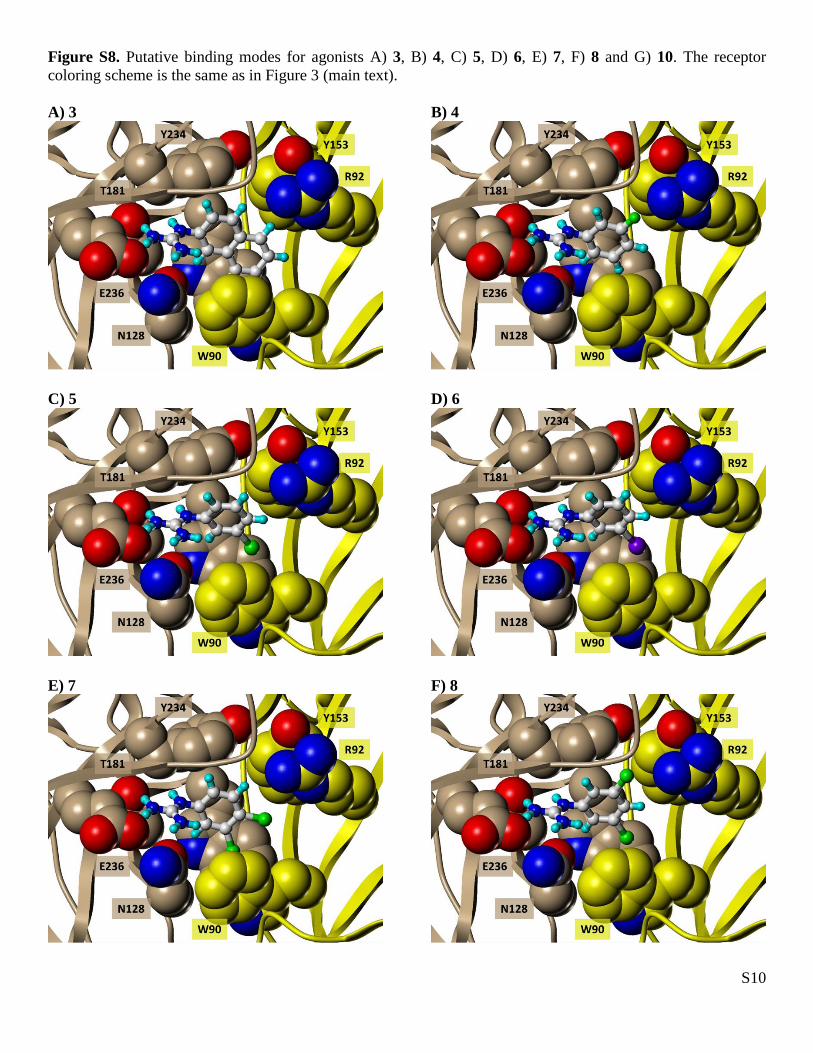
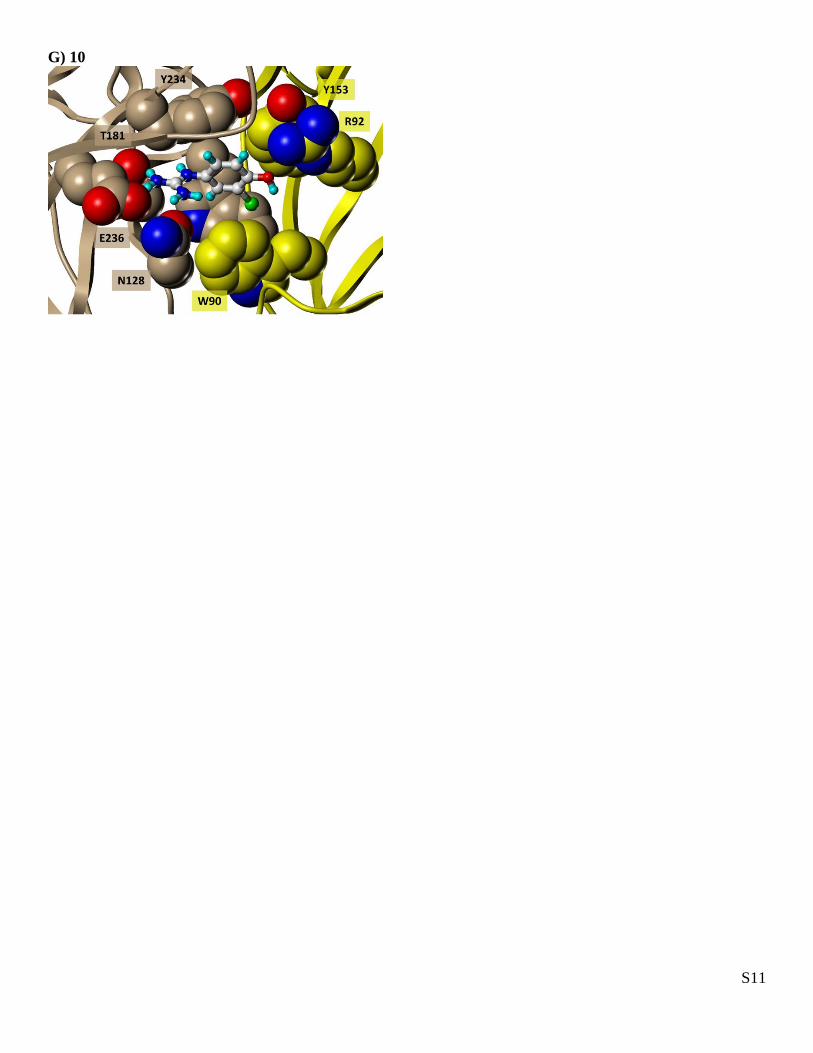
Figure S8. Putative binding modes for agonists A) 3, B) 4, C) 5, D) 6, E) 7, F) 8 and G) 10. The receptor
coloring scheme is the same as in Figure 3 (main text).
A) 3 B) 4
C) 5 D) 6
E) 7 F) 8
S11
G) 10
S12
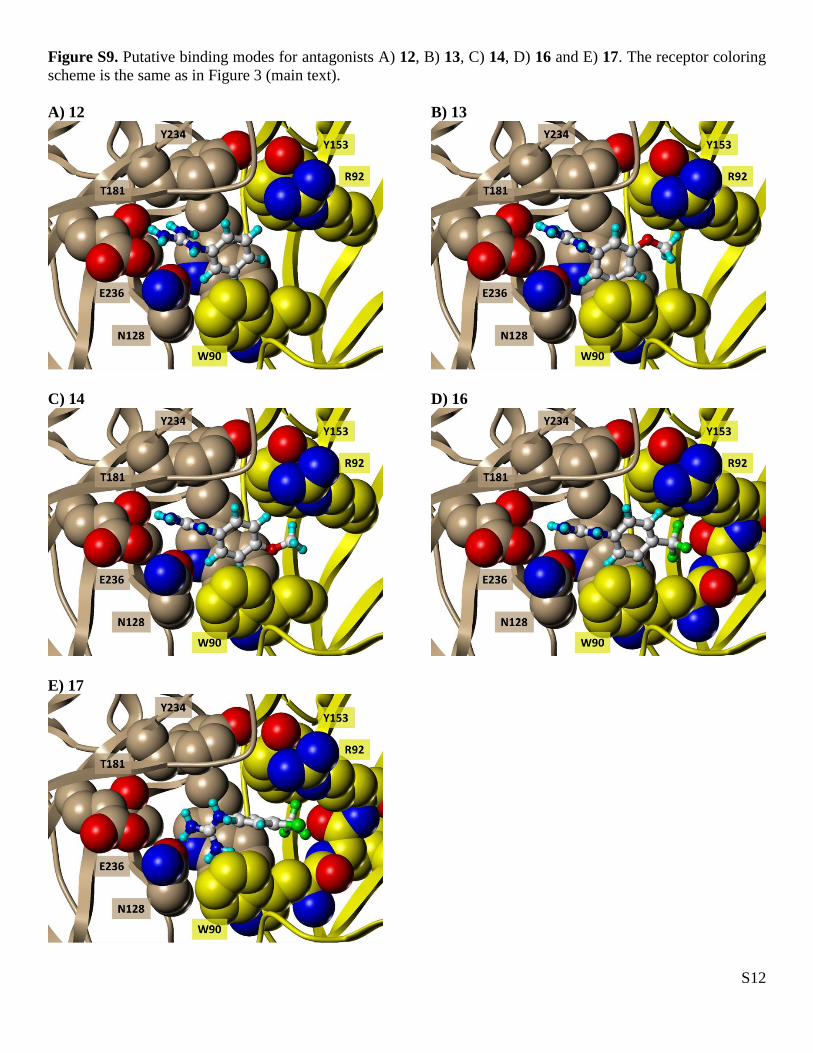
Figure S9. Putative binding modes for antagonists A) 12, B) 13, C) 14, D) 16 and E) 17. The receptor coloring
scheme is the same as in Figure 3 (main text).
A) 12 B) 13
C) 14 D) 16
E) 17
S13
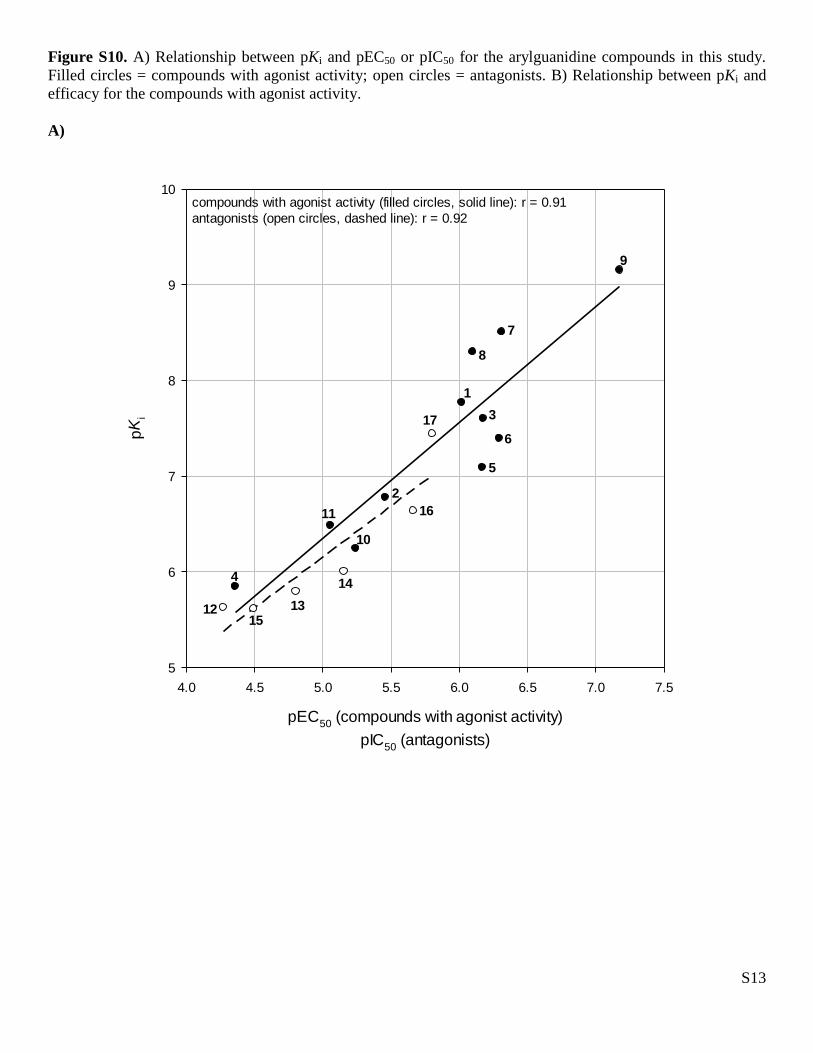
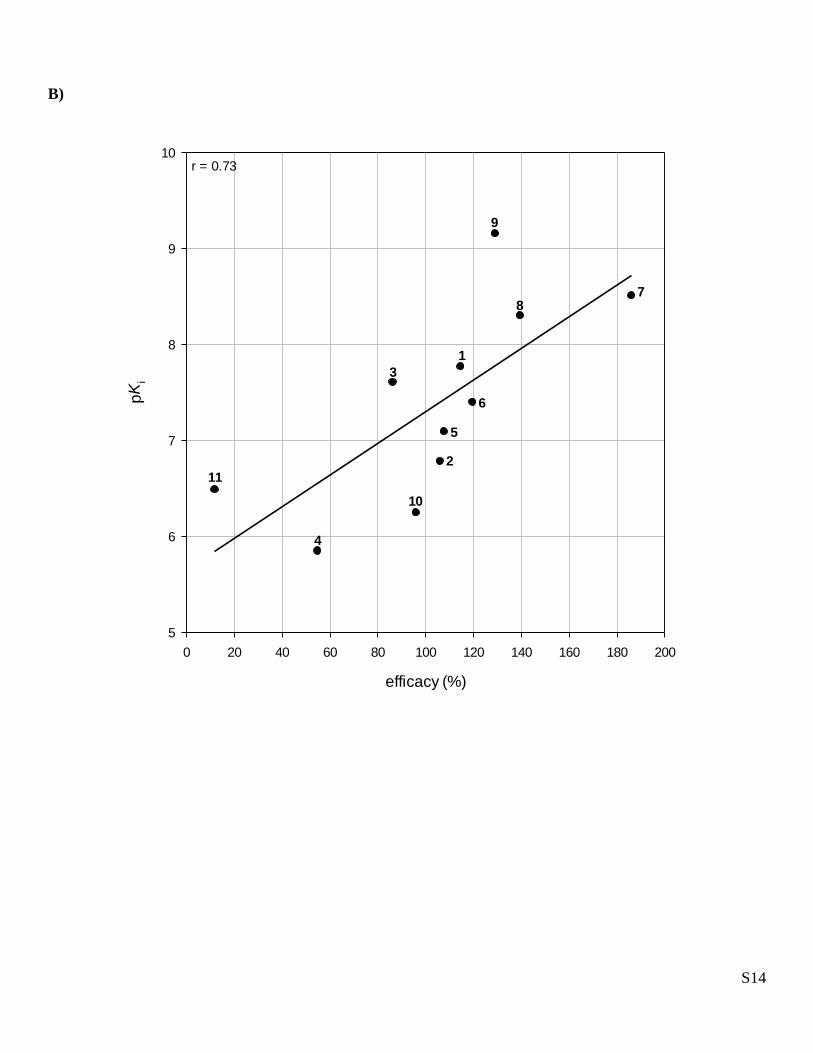
Figure S10. A) Relationship between pKi and pEC50 or pIC50 for the arylguanidine compounds in this study.
Filled circles = compounds with agonist activity; open circles = antagonists. B) Relationship between pKi and
efficacy for the compounds with agonist activity.
A)
pEC50
(compounds with agonist activity)
pIC50
(antagonists)
4.0 4.5 5.0 5.5 6.0 6.5 7.0 7.5
pK
i
5
6
7
8
9
10
4
3
2
1
5
6
7
8
9
10
11
12 13
14
15
16
17
compounds with agonist activity (filled circles, solid line): r = 0.91
antagonists (open circles, dashed line): r = 0.92
S14
B)
efficacy (%)
0 20 40 60 80 100 120 140 160 180 200
pK
i
5
6
7
8
9
10
4
3
2
1
5
6
78
9
10
11
r = 0.73
S15
REFERENCES
(1) Larkin, M. A., Blackshields, G., Brown, N. P., Chenna, R., McGettigan, P. A., McWilliam, H., Valentin,
F., Wallace, I. M., Wilm, A., Lopez, R., Thompson, J. D., Gibson, T. J.;,Higgins, D. G. (2007) Clustal W and
Clustal X version 2.0. Bioinformatics 23, 2947–2948.
(2) Cody, V., DeTitta, G. T. (1979) The molecular conformation of clonidine hydrochloride, an α-
adrenergic agonist. J. Cryst. Mol. Struct. 9, 33–43.
(3) Byre, G., Mostad, A., Rømming, C. (1976) Crystal structure of clonidine hydrochloride, 2-(2,6-
dichlorophenylamino)-2-imidazoline hydrochloride. Acta Chem. Scand. B 30, 843–846. (4) Holt, A., Smith, D. J., Cendron, L., Zanotti, G., Rigo, A., Di Paolo, M. L. (2008) Multiple binding sites
for substrates and modulators of semicarbazide-sensitive amine oxidases: kinetic consequences. Mol.
Pharmacol. 73, 525–538.
(5) López-Olvera, G., Soriano-García, M. (2004) Crystal structure of 1-(m-chlorophenyl)biguanide
hydrochloride. Anal. Sci. 20, x151–x152.