Embed Size (px)
Citation preview
COMP. SET: All areas YEAR(S): 2010 DATABASE: str_database_v5.xls
Doncaster PCT area
Review of services for people who have had a stroke and their carers
SUPPORTING LIFE AFTER STROKE LOCAL ASSESSMENT REPORT

SUPPORTING LIFE AFTER STROKE
Doncaster PCT area 2
CQC Stroke Review 2010
Introduction This review looks at the care experienced by people who have had a stroke (or TIA– which is similar to a stroke, but the symptoms disappear within 24 hours) and their carers. It starts from the point people prepare to leave hospital, to the long-term care and support that people may need to cope with stroke-related disabilities. It looks at both health and adult social care, as well as links to other relevant services, such as local support groups and services to help people participate in community life. As the Quality Markers (QMs) set out in the National Stroke Strategy are now well established, they form the basis of the ‘assessment framework’ for this review. We used the QMs to create a set of 15 scored indicators, which we combined to give an overall assessment for each local area, with four categories:
• ‘Best performing’ – on average these areas scored the top two marks across 8 or 9 of the 15 scored indicators and only scored low marks in 1 or 2.
• ‘Better performing’ – with more areas of strength than weakness. • ‘Fair performing’ – with more areas of weakness than strength. • ‘Least well performing’ – typically scored low marks in 8 or 9 of the 15 scored
indicators and only scored high marks in 1 or 2. For this review, the areas we used for our assessments were based on the boundaries of primary care trusts (PCTs). PCTs are the main organisations responsible for commissioning care for people who have had a stroke and their carers, although local councils, in particular adult social services departments, also have an important role in assessing people’s needs and commissioning a range of community-based support, care and advice services. This detailed report is intended primarily for professionals involved in stroke care. We have also produced a summary report designed for people who have had a stroke and their carers. Both versions show how well the area performs in each of the scored indicators, and are available (from mid January 2011) on the review webpage cqc.org.uk/stroke. The webpage includes a link to the assessment framework, which includes the definitions of the review’s scored indicators and explains how they are combined to produce the scored assessment for each area. Understanding the results for an area The table on page three sets out the list of scored indicators, along with the scores for this area. The following pages consider each scored indicator in turn, with charts showing the distribution of values or scores for the constituent parts for each indicator. In order to keep this report to a reasonable length only a selection of the available data is shown. The remaining data will be released as benchmarking data for the services that took part. The position of this area within most charts (graphs) is shown by the asterisk below the horizontal axis and the vertical line. In charts showing the results of multiple-choice questions, the value for this area is shown as “(This site)” against the response that applies. Many of the question descriptors shown on charts are abbreviated versions of the full question wording. For the majority of charts higher values indicate better performance (any exceptions are noted in the text next to the relevant chart).

CQC Stroke Review 2010 SUPPORTING LIFE AFTER STROKE
Ref Scored indicator Score Page
12 Management of transfer home 5 5-6
10 Early Supported Discharge 2 7
13a Community-based services 4 8-9
13b Services for carers 4 10-11
13c Secondary prevention 4 12
13d Meeting individuals’ needs 5 13-14
13e Outcomes at 1 year 3 15
15 Support for participation in community life 4 16-17
6 TIA care and support 3 18
14 Reviews and assessments after transfer home 4 19-20
3a Range of info provided 3 21
3b Signposting, coordination and personalisation 4 22-24
11 End of life care 4 25
4 Involvement in planning and monitoring 5 26-27
17 Working together 3 28
Average score 3.8
Overall assessment Best Performing Further details about this review can be found at http://www.cqc.org.uk/stroke
Doncaster PCT area 3
CQC Stroke Review 2010 SUPPORTING LIFE AFTER STROKE
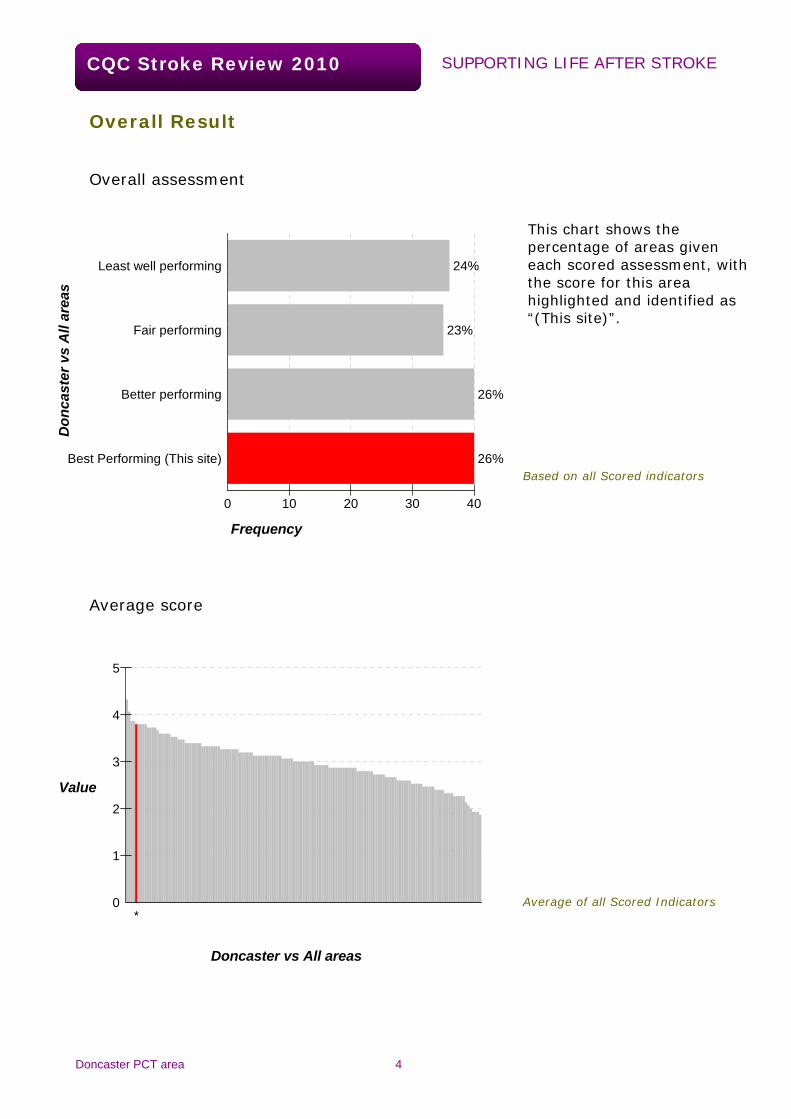
Overall Result
Overall assessment
This chart shows the percentage of areas given each scored assessment, with the score for this area highlighted and identified as “(This site)”.
Don
cast
er v
s A
ll ar
eas
Frequency
26%
26%
24%
Best Performing (This site)
Better performing
Fair performing
Least well performing
23%
0 10 20 30 40
Based on all Scored indicators
Average score
Value
Doncaster vs All areas
0
1
2
3
4
5
Average of all Scored Indicators *
Doncaster PCT area 4

CQC Stroke Review 2010 SUPPORTING LIFE AFTER STROKE
Management of transfer home 1 (of 2)
Total points for Transfer Home
Total
Doncaster vs All areas
0
5
10
15
20
All inputs to Scored Indicator 12
*
Transfer home (PCT Questions)
Answers for this area shown in brackets. Includes answers to Qs:
2c: Are there policies in place re transfer home of stroke patients?
2d: Are these polices stroke-specific?
Do they state that:
2e: Patients and carers should be involved in discharge planning?
2f: Patients should agree/write the goals in the discharge plan?
2g: Community stroke team should be involved?
2h: Patients should be given a copy of the discharge summary?
2i: Patients should be followed up in 72 hrs by stroke rehab services?
No
Yes - withsome
Yes - withmost
Yes - with all
Don
cast
er v
s A
ll ar
eas
Percentages
PCT2i (No)
PCT2h (Yes - with all)
PCT2g (Yes - with all)
PCT2f (Yes - with all)
PCT2e (Yes - with all)
PCT2d (No)
PCT2c (Yes - with all)
0 20 40 60 80 100
PCT2c - PCT2i
Doncaster PCT area 5
CQC Stroke Review 2010 SUPPORTING LIFE AFTER STROKE
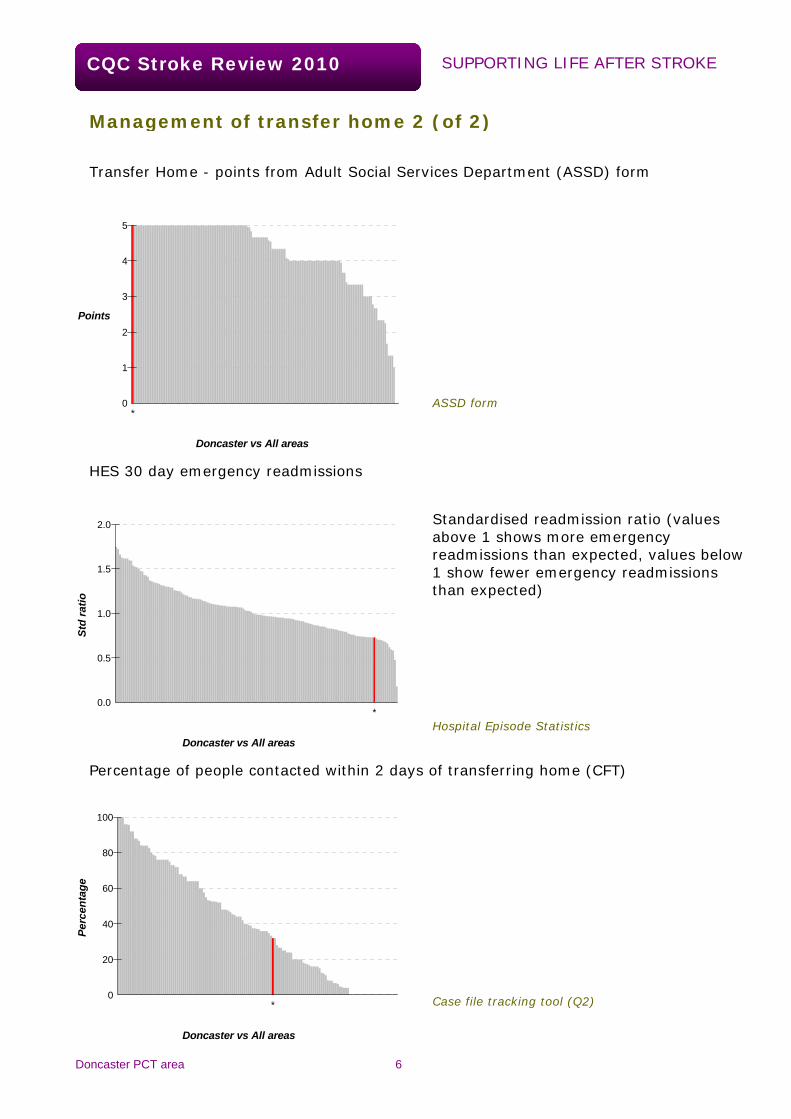
Management of transfer home 2 (of 2)
Transfer Home - points from Adult Social Services Department (ASSD) form
Points
Doncaster vs All areas
0
1
2
3
4
5
*
ASSD form
HES 30 day emergency readmissions
Standardised readmission ratio (values above 1 shows more emergency readmissions than expected, values below 1 show fewer emergency readmissions than expected)
Std
ratio
Doncaster vs All areas
0.0
0.5
1.0
1.5
2.0
*
Hospital Episode Statistics
Percentage of people contacted within 2 days of transferring home (CFT)
Perc
enta
ge
Doncaster vs All areas
0
20
40
60
80
100
Case file tracking tool (Q2) *
Doncaster PCT area 6
CQC Stroke Review 2010 SUPPORTING LIFE AFTER STROKE
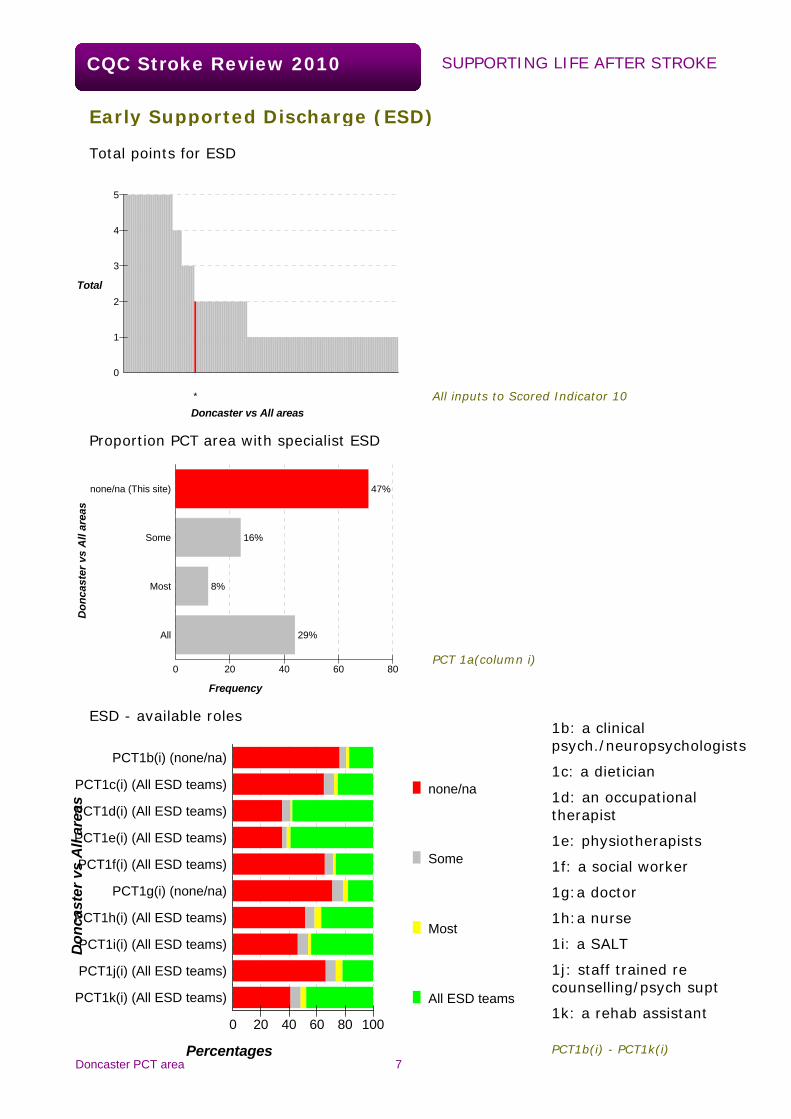
Early Supported Discharge (ESD)
Total points for ESD
1b: a clinical psych./neuropsychologists
1c: a dietician
1d: an occupational therapist
1e: physiotherapists
1f: a social worker
1g:a doctor
1h:a nurse
1i: a SALT
1j: staff trained re counselling/psych supt
1k: a rehab assistant
Total
Doncaster vs All areas
0
1
2
3
4
5
*
All inputs to Scored Indicator 10
Proportion PCT area with specialist ESD
Don
cast
er v
s A
ll ar
eas
Frequency
29%
8%
16%
All
Most
Some
none/na (This site) 47%
0 20 40 60 80
PCT 1a(column i)
ESD - available roles
none/na
Some
Most
All ESD teams
Don
cast
er v
s A
ll ar
eas
Percentages
PCT1k(i) (All ESD teams)
PCT1j(i) (All ESD teams)
PCT1i(i) (All ESD teams)
PCT1h(i) (All ESD teams)
PCT1g(i) (none/na)
PCT1f(i) (All ESD teams)
PCT1e(i) (All ESD teams)
PCT1d(i) (All ESD teams)
PCT1c(i) (All ESD teams)
PCT1b(i) (none/na)
0 20 40 60 80 100
PCT1b(i) - PCT1k(i)
Doncaster PCT area 7
CQC Stroke Review 2010 SUPPORTING LIFE AFTER STROKE
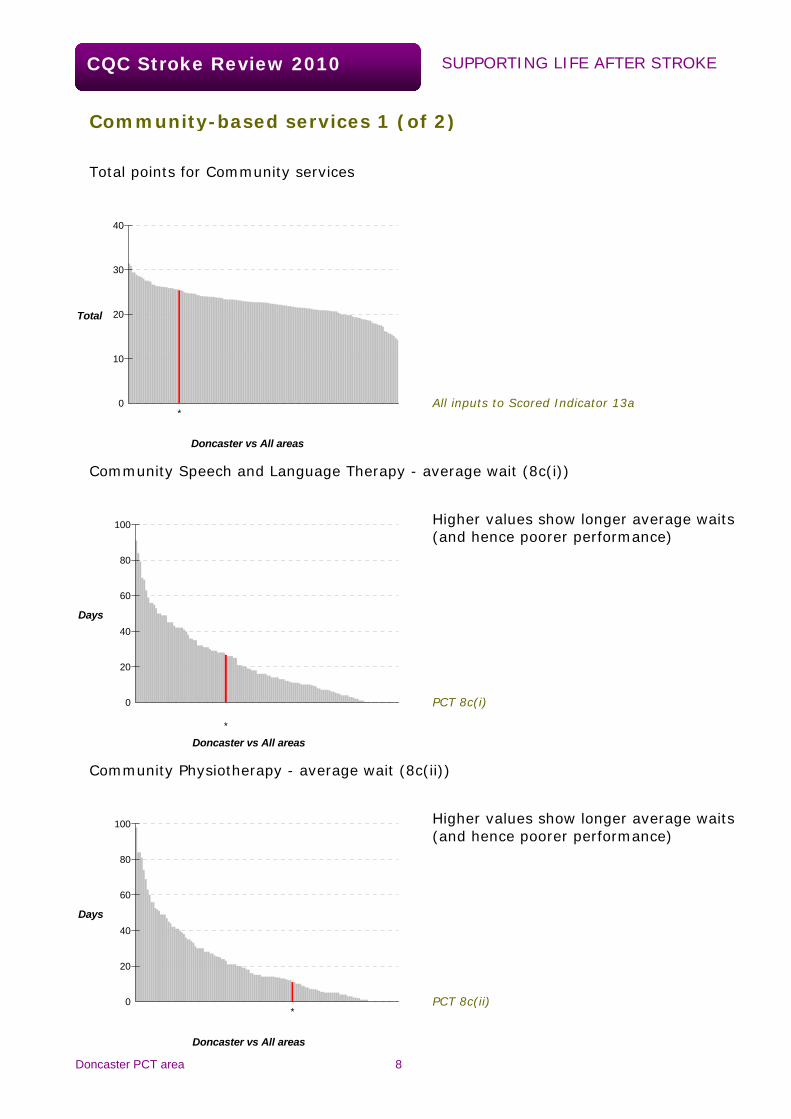
Community-based services 1 (of 2)
Total points for Community services
Total
Doncaster vs All areas
0
10
20
30
40
*
All inputs to Scored Indicator 13a
Community Speech and Language Therapy - average wait (8c(i))
Higher values show longer average waits (and hence poorer performance)
Days
Doncaster vs All areas
0
20
40
60
80
100
*
PCT 8c(i)
Community Physiotherapy - average wait (8c(ii))
Higher values show longer average waits (and hence poorer performance)
Days
Doncaster vs All areas
0
20
40
60
80
100
PCT 8c(ii) *
Doncaster PCT area 8

CQC Stroke Review 2010 SUPPORTING LIFE AFTER STROKE
Community-based services 2 (of 2)
Specialist rehab services available
7j: Orthoptics
7k: Orthotics
7l: Spasticity clinics
7m: Support for home enteral feeding/PEG
7n: Dietetics
7o: Specific vocational rehabilitation
7p: Specific rehabilitation re driving
7q: Stroke nurses
No
yes - some
yes - most
yes - all
Don
cast
er v
s A
ll ar
eas
Percentages
PCT7q(i) (yes - all)
PCT7p(i) (yes - all)
PCT7o(i) (yes - all)
PCT7n(i) (yes - all)
PCT7m(i) (yes - all)
PCT7l(i) (yes - all)
PCT7k(i) (yes - all)
PCT7j(i) (yes - all)
0 20 40 60 80 100
PCT7j(i) - PCT7q(i)
Peer support etc available
7r: 1-1 befriending service
7s: Peer support groups
7t: Dysphasia/aphasia support groups
7u: Conversation partners in care homes
7v: Stroke support groups for adults of working age
7w: Help with ad hoc information needs
7x: Other peer support
No
yes - some
yes - most
yes - all
Don
cast
er v
s A
ll ar
eas
Percentages
PCT7x(i) (yes - all)
PCT7w(i) (yes - all)
PCT7v(i) (yes - all)
PCT7u(i) (No)
PCT7t(i) (yes - all)
PCT7s(i) (yes - all)
PCT7r(i) (yes - all)
0 20 40 60 80 100
PCT7r(i) - PCT7x(i)
Doncaster PCT area 9
CQC Stroke Review 2010 SUPPORTING LIFE AFTER STROKE
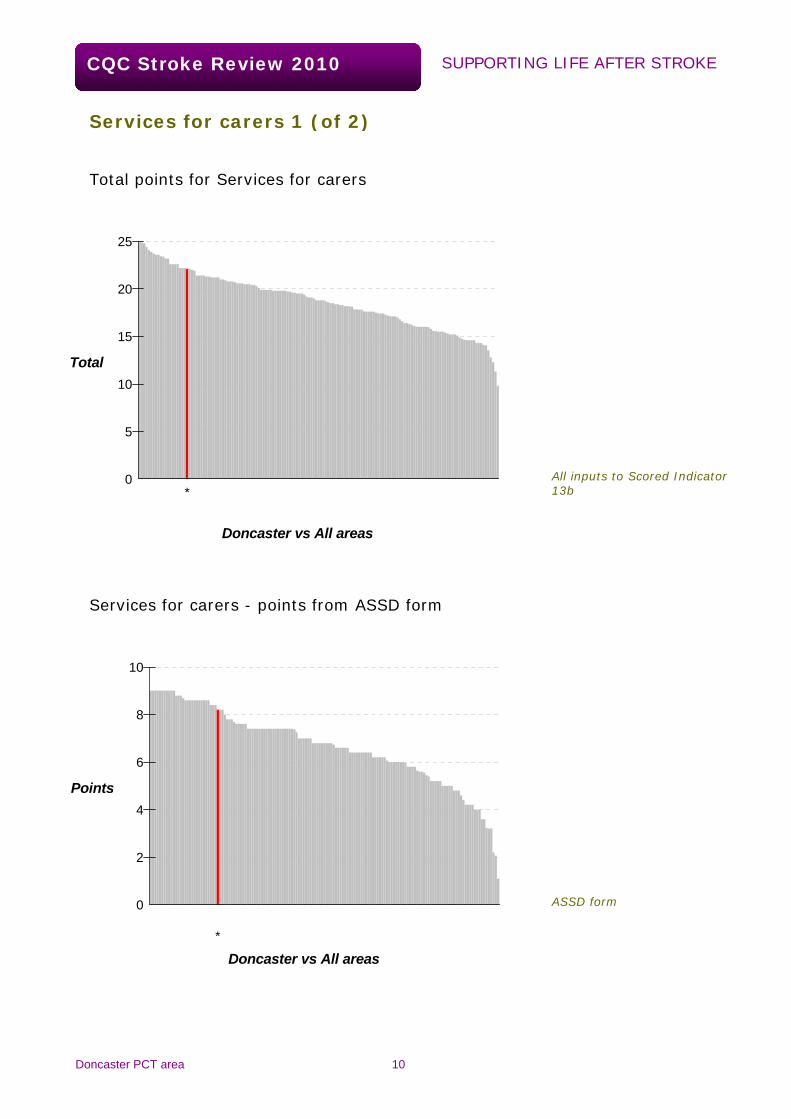
Services for carers 1 (of 2)
Total points for Services for carers
Total
Doncaster vs All areas
0
5
10
15
20
25
All inputs to Scored Indicator 13b *
Services for carers - points from ASSD form
Points
Doncaster vs All areas
0
2
4
6
8
10
ASSD form
*
Doncaster PCT area 10
CQC Stroke Review 2010 SUPPORTING LIFE AFTER STROKE
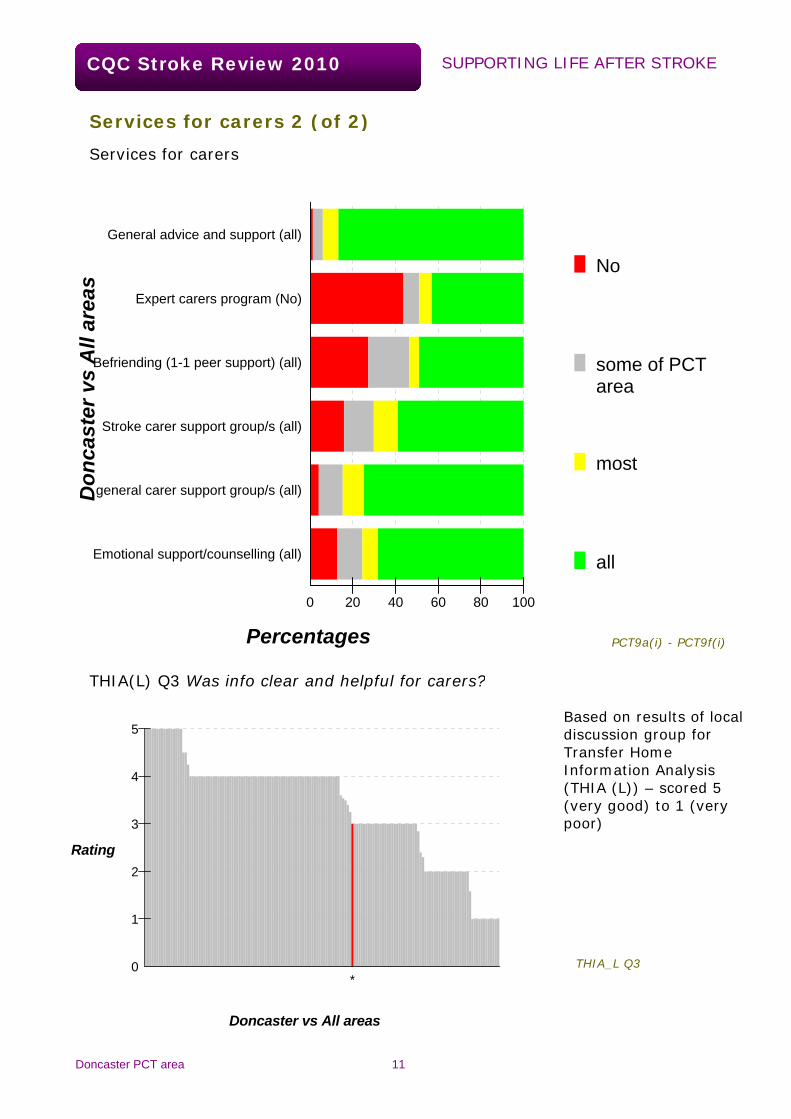
Services for carers 2 (of 2)
Services for carers
No
some of PCTarea
most
all
Don
cast
er v
s A
ll ar
eas
Percentages
Emotional support/counselling (all)
general carer support group/s (all)
Stroke carer support group/s (all)
Befriending (1-1 peer support) (all)
Expert carers program (No)
General advice and support (all)
0 20 40 60 80 100
PCT9a(i) - PCT9f(i)
THIA(L) Q3 Was info clear and helpful for carers?
Based on results of local discussion group for Transfer Home Information Analysis (THIA (L)) – scored 5 (very good) to 1 (very poor)
Rating
Doncaster vs All areas
0
1
2
3
4
5
THIA_L Q3 *
Doncaster PCT area 11
CQC Stroke Review 2010 SUPPORTING LIFE AFTER STROKE
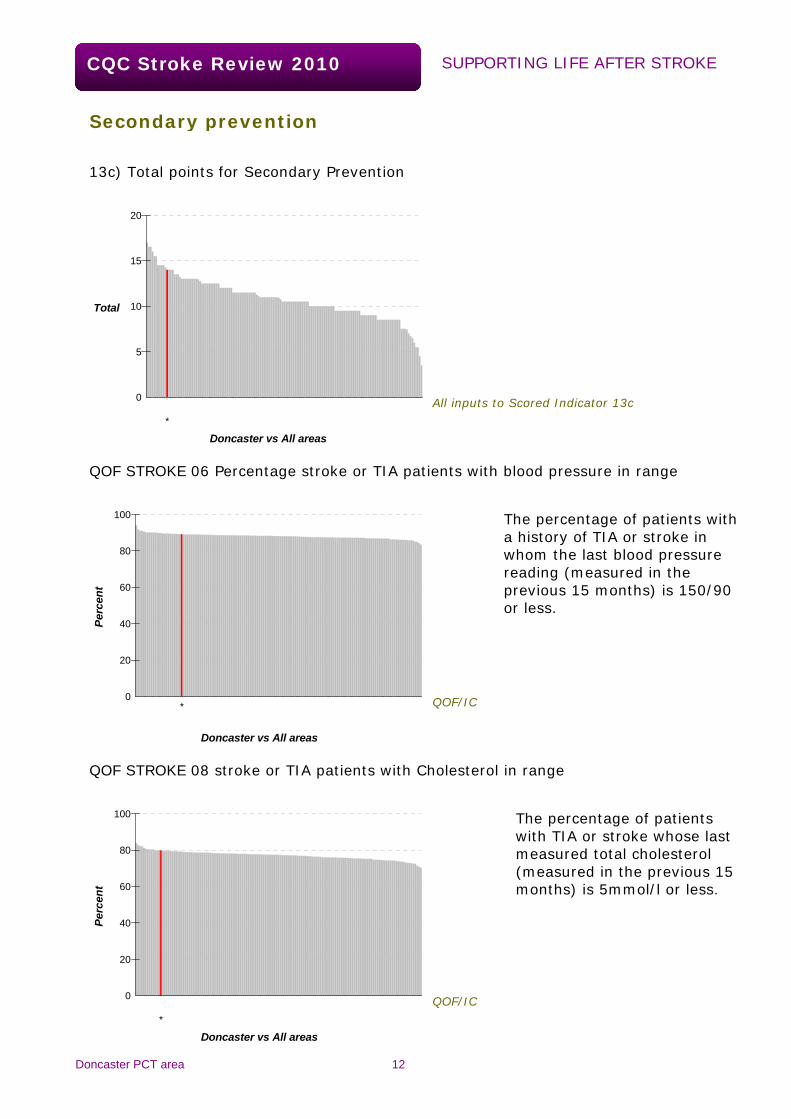
Secondary prevention
13c) Total points for Secondary Prevention
Total
Doncaster vs All areas
0
5
10
15
20
*
All inputs to Scored Indicator 13c
QOF STROKE 06 Percentage stroke or TIA patients with blood pressure in range
Perc
ent
Doncaster vs All areas
0
20
40
60
80
100 The percentage of patients with a history of TIA or stroke in whom the last blood pressure reading (measured in the previous 15 months) is 150/90 or less.
*
QOF/IC
QOF STROKE 08 stroke or TIA patients with Cholesterol in range
The percentage of patients with TIA or stroke whose last measured total cholesterol (measured in the previous 15 months) is 5mmol/l or less.
Perc
ent
Doncaster vs All areas
0
20
40
60
80
100
QOF/IC *
Doncaster PCT area 12
SUPPORTING LIFE AFTER STROKE
Doncaster PCT area 13
CQC Stroke Review 2010
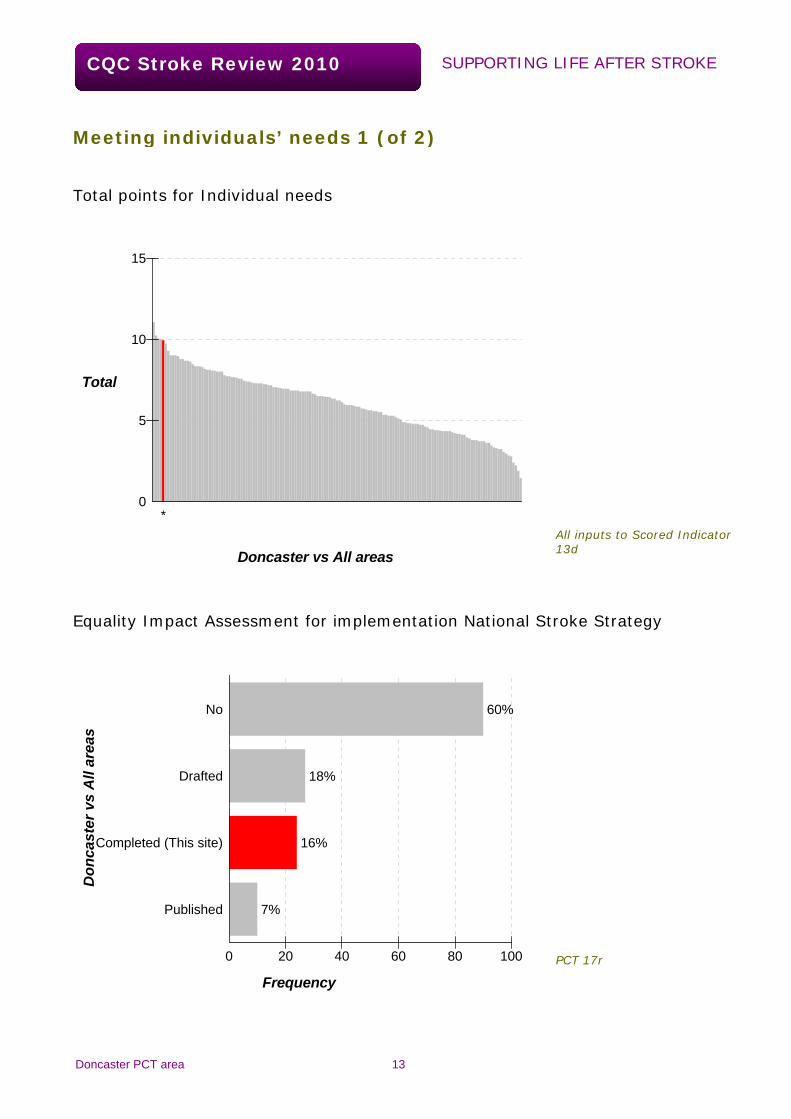
Meeting individuals’ needs 1 (of 2)
Total points for Individual needs
Total
Doncaster vs All areas
0
5
10
15
*
All inputs to Scored Indicator 13d
Equality Impact Assessment for implementation National Stroke Strategy
Don
cast
er v
s A
ll ar
eas
Frequency
7%
16%
Published
Completed (This site)
Drafted
No 60%
18%
0 20 40 60 80 100
PCT 17r
SUPPORTING LIFE AFTER STROKE
Doncaster PCT area 14
CQC Stroke Review 2010
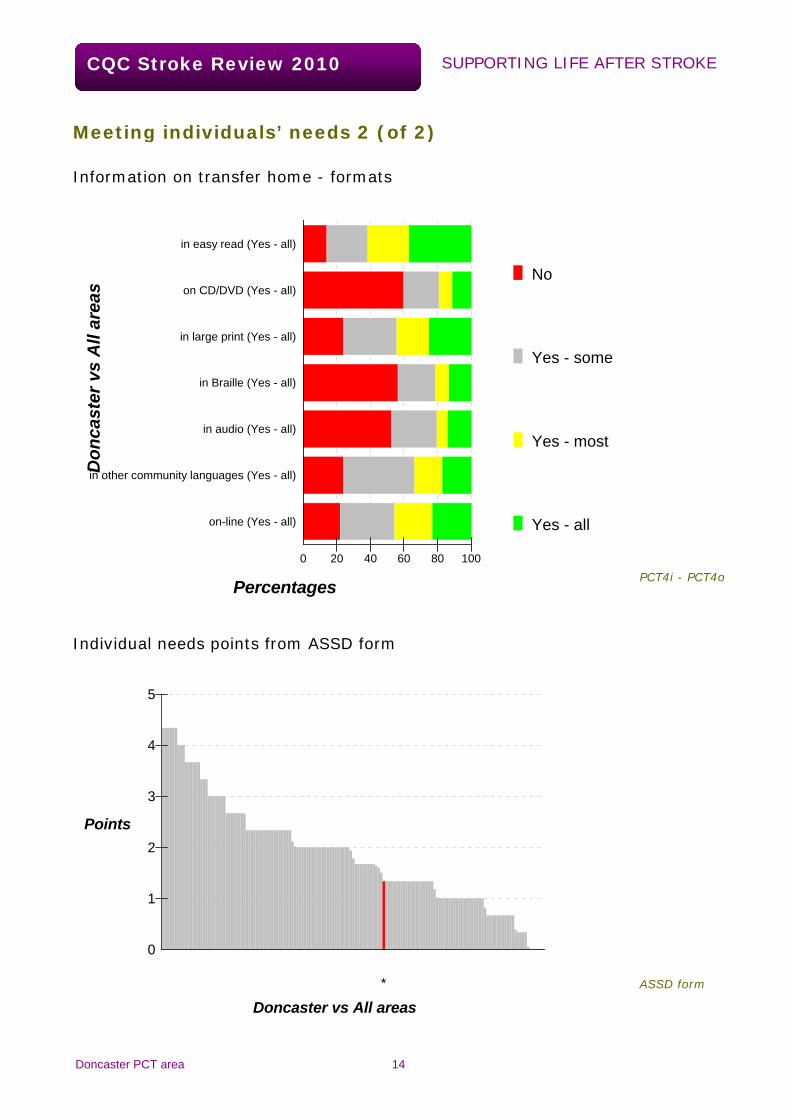
Meeting individuals’ needs 2 (of 2)
Information on transfer home - formats
No
Yes - some
Yes - most
Yes - all
Don
cast
er v
s A
ll ar
eas
Percentages
on-line (Yes - all)
in other community languages (Yes - all)
in audio (Yes - all)
in Braille (Yes - all)
in large print (Yes - all)
on CD/DVD (Yes - all)
in easy read (Yes - all)
0 20 40 60 80 100
PCT4i - PCT4o
Individual needs points from ASSD form
Points
Doncaster vs All areas
0
1
2
3
4
5
ASSD form *

CQC Stroke Review 2010 SUPPORTING LIFE AFTER STROKE
Outcomes at 1 year
HES 1 year mortality
Standardised mortality ratio (values above 1 shows higher mortality than expected, values below 1 show lower mortality than expected)
Std
ratio
Doncaster vs All areas
0.0
0.5
1.0
1.5
*
HES/ONS
HES 1 year emergency readmissions
Std
ratio
Doncaster vs All areas
0.0
0.5
1.0
1.5
Standardised readmission ratio (values above 1 shows more emergency readmissions than expected, values below 1 show fewer emergency readmissions than expected)
*
HES
Doncaster PCT area 15

CQC Stroke Review 2010 SUPPORTING LIFE AFTER STROKE
Support for participation in community life 1 (of 2)
Total points for Community life
Total
Doncaster vs All areas
0
10
20
30
40
All inputs to Scored indicator 15
*
Community life - points from ASSD form
Points
Doncaster vs All areas
0
5
10
15
ASSD form
*
Doncaster PCT area 16
CQC Stroke Review 2010 SUPPORTING LIFE AFTER STROKE
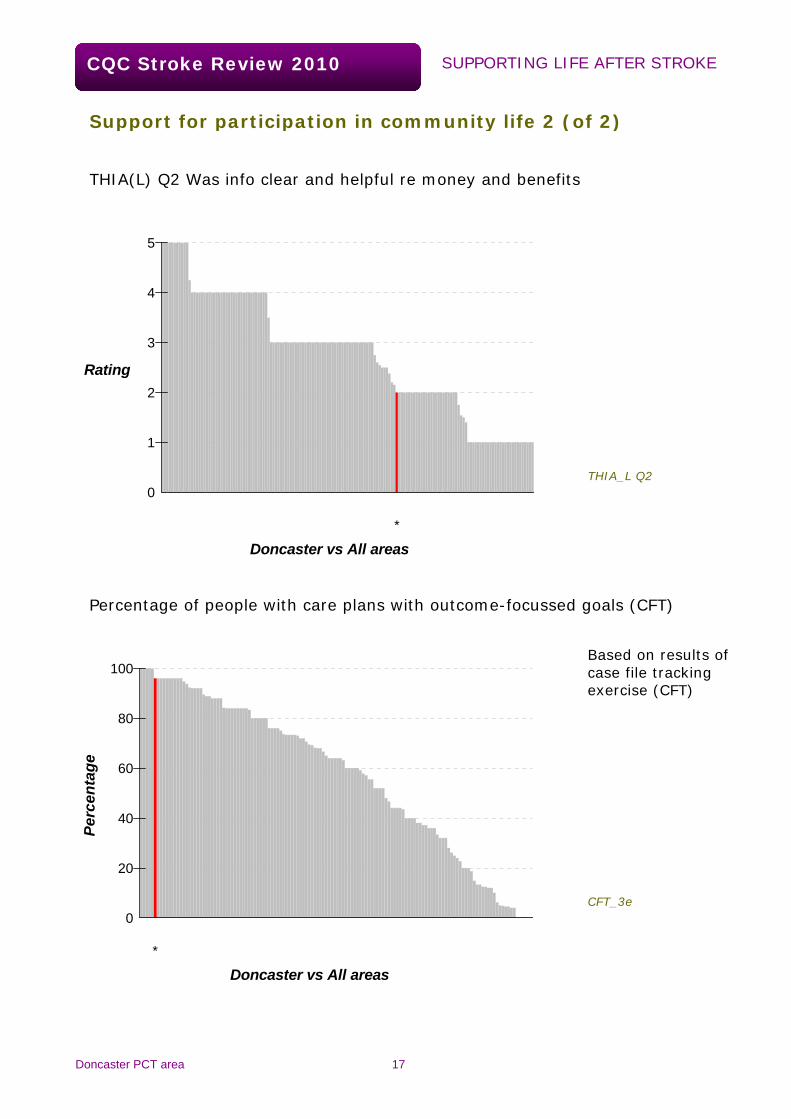
Support for participation in community life 2 (of 2)
THIA(L) Q2 Was info clear and helpful re money and benefits
Rating
Doncaster vs All areas
0
1
2
3
4
5
THIA_L Q2
*
Percentage of people with care plans with outcome-focussed goals (CFT)
Based on results of case file tracking exercise (CFT)
Perc
enta
ge
Doncaster vs All areas
0
20
40
60
80
100
CFT_3e
*
Doncaster PCT area 17
CQC Stroke Review 2010 SUPPORTING LIFE AFTER STROKE
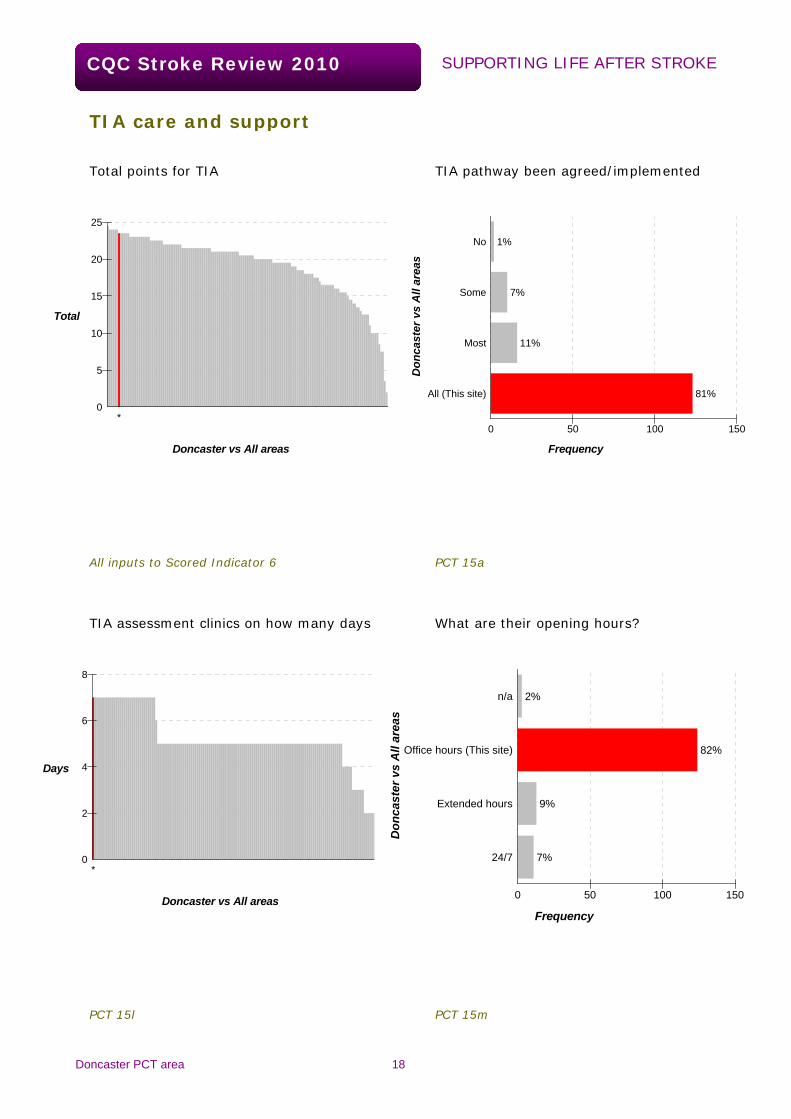
TIA care and support
Total points for TIA TIA pathway been agreed/implemented
Total
Doncaster vs All areas
0
5
10
15
20
25
*
All inputs to Scored Indicator 6
Don
cast
er v
s A
ll ar
eas
Frequency
81%
11%
All (This site)
Most
Some
No 1%
7%
0 50 100 150
PCT 15a
TIA assessment clinics on how many days What are their opening hours?
Days
Doncaster vs All areas
0
2
4
6
8
*
PCT 15l
Don
cast
er v
s A
ll ar
eas
Frequency
7%
9%
24/7
Extended hours
Office hours (This site)
n/a 2%
82%
0 50 100 150
PCT 15m
Doncaster PCT area 18

CQC Stroke Review 2010 SUPPORTING LIFE AFTER STROKE
Reviews and assessments after transfer home 1 (of 2)
Total points for Reviews
Total
Doncaster vs All areas
0
5
10
15
20
25
*All inputs to Scored Indicator 14
Systems in place for reviews after transfer home
No
Yes
Don
cast
er v
s A
ll ar
eas
Percentages
annually after that (No)
at 12 months (No)
at/around 6 months (Yes)
at/around 6 weeks (Yes)
0 20 40 60 80 100
PCT5a(i) - PCT5a(iv)
Doncaster PCT area 19
CQC Stroke Review 2010 SUPPORTING LIFE AFTER STROKE
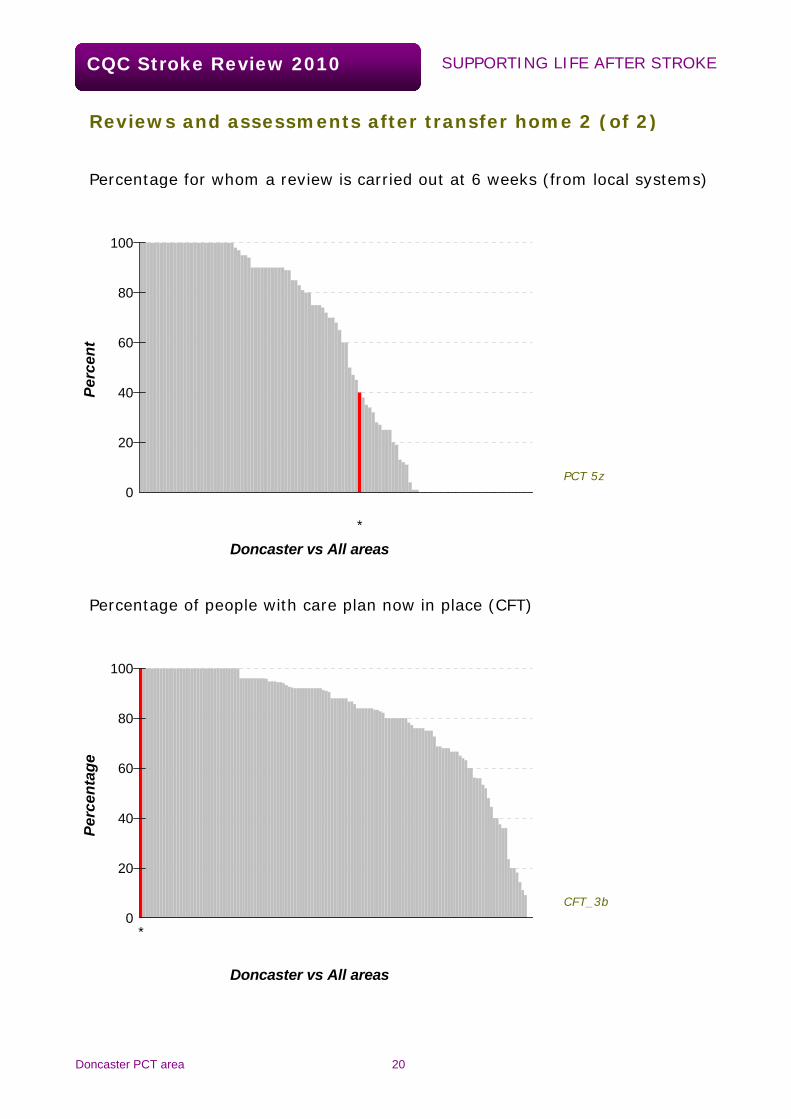
Reviews and assessments after transfer home 2 (of 2)
Percentage for whom a review is carried out at 6 weeks (from local systems)
Perc
ent
Doncaster vs All areas
0
20
40
60
80
100
PCT 5z
*
Percentage of people with care plan now in place (CFT)
Perc
enta
ge
Doncaster vs All areas
0
20
40
60
80
100
CFT_3b
*
Doncaster PCT area 20

CQC Stroke Review 2010 SUPPORTING LIFE AFTER STROKE
Range of information provided
Total points for Range of Info
Total
Doncaster vs All areas
0
5
10
15
20
25
30
All inputs to Scored indicator 3a *
Range of Information points from THIA central analysis
Points
Doncaster vs All areas
0
1
2
3
4
5
6Total points for range of information, based on analysis of Transfer Home Information Analysis tool undertaken centrally by CQC (THIA (C))
THIA(C) *
Range of Information - points from ASSD form
Points
Doncaster vs All areas
0
1
2
3
4
5
6
ASSD form *
Doncaster PCT area 21
CQC Stroke Review 2010 SUPPORTING LIFE AFTER STROKE
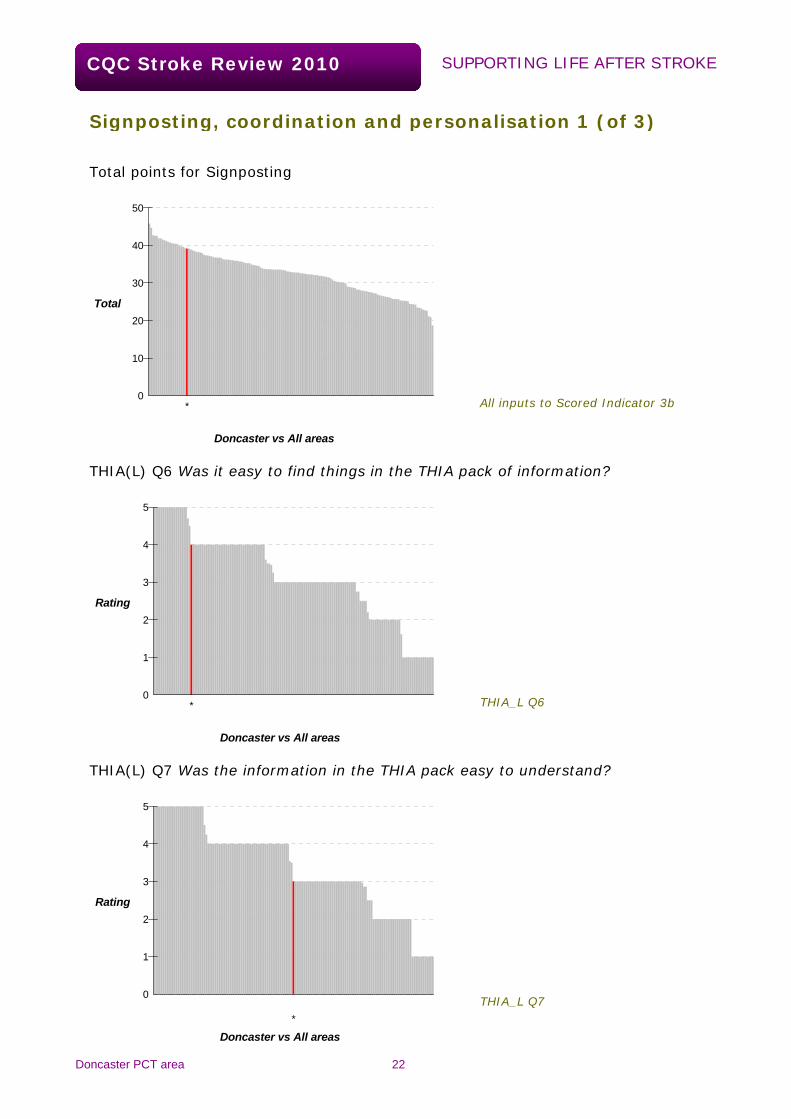
Signposting, coordination and personalisation 1 (of 3)
Total points for Signposting
Total
Doncaster vs All areas
0
10
20
30
40
50
All inputs to Scored Indicator 3b *
THIA(L) Q6 Was it easy to find things in the THIA pack of information?
Rating
Doncaster vs All areas
0
1
2
3
4
5
THIA_L Q6 *
THIA(L) Q7 Was the information in the THIA pack easy to understand?
Rating
Doncaster vs All areas
0
1
2
3
4
5
THIA_L Q7 *
Doncaster PCT area 22

CQC Stroke Review 2010 SUPPORTING LIFE AFTER STROKE
Signposting, coordination and personalisation 2 (of 3)
Signposting points from THIA(C)
Points
Doncaster vs All areas
0
2
4
6
8
THIA(C) *
Percentage of people with named support worker (CFT)
Perc
enta
ge
Doncaster vs All areas
0
20
40
60
80
100
* CFT_2c
Percentage of people given helpline number (CFT)
Perc
enta
ge
Doncaster vs All areas
0
20
40
60
80
100
* CFT_2d
Doncaster PCT area 23
CQC Stroke Review 2010 SUPPORTING LIFE AFTER STROKE
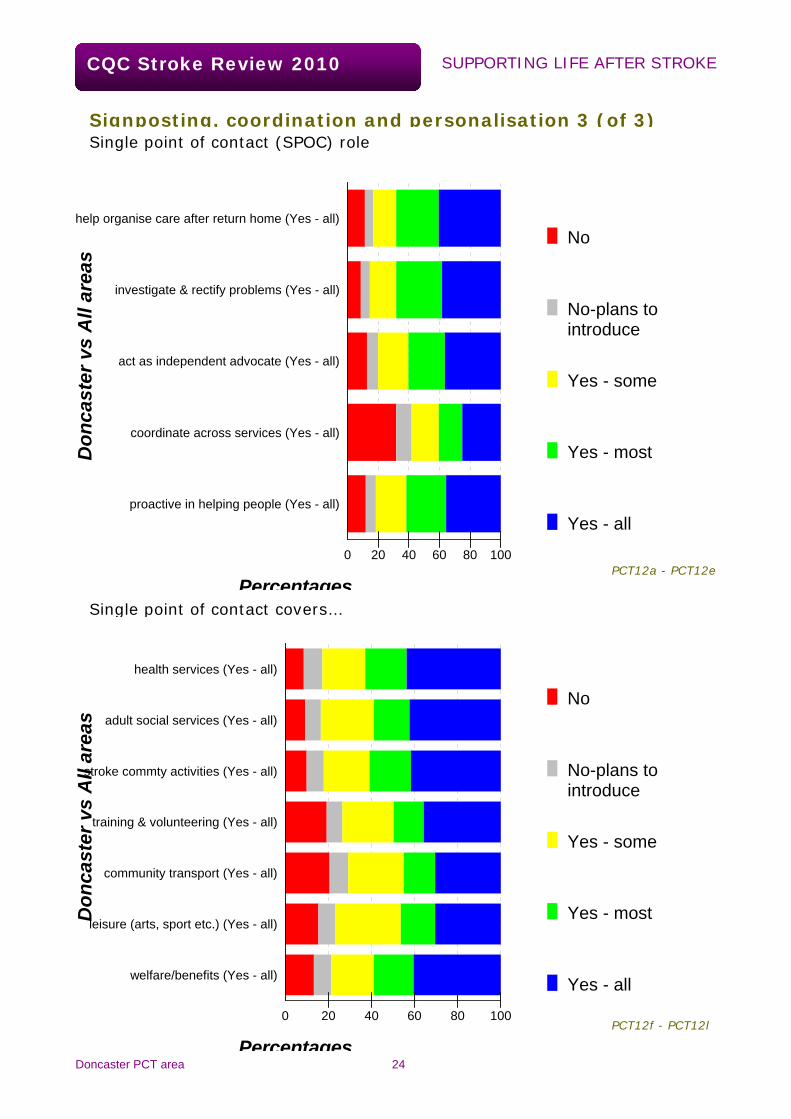
Signposting, coordination and personalisation 3 (of 3) Single point of contact (SPOC) role
No
No-plans tointroduce
Yes - some
Yes - most
Yes - all
Don
cast
er v
s A
ll ar
eas
proactive in helping people (Yes - all)
coordinate across services (Yes - all)
act as independent advocate (Yes - all)
investigate & rectify problems (Yes - all)
help organise care after return home (Yes - all)
0 20 40 60 80 100PCT12a - PCT12e
PercentagesSingle point of contact covers…
No
No-plans tointroduce
Yes - some
Yes - most
Yes - all
Don
cast
er v
s A
ll ar
eas
welfare/benefits (Yes - all)
leisure (arts, sport etc.) (Yes - all)
community transport (Yes - all)
training & volunteering (Yes - all)
stroke commty activities (Yes - all)
adult social services (Yes - all)
health services (Yes - all)
0 20 40 60 80 100PCT12f - PCT12l
Doncaster PCT area 24 Percentages

CQC Stroke Review 2010 SUPPORTING LIFE AFTER STROKE
End of life care
Total points for End of life care
Total
Doncaster vs All areas
0
2
4
6
8
10
All inputs to Scored indicator 11
*
EOLC pathway (PCT questions)
No
Some
Most
All
Don
cast
er v
s A
ll ar
eas
Percentages
support to carer/family after bereavement (All)
support to carer/family before bereavement (All)
preferences re use of DNARs (All)
determining preferences re where to die (All)
assessing needs and arranging EOLC (All)
PCT14a - PCT14e 0 20 40 60 80 100
Doncaster PCT area 25
CQC Stroke Review 2010 SUPPORTING LIFE AFTER STROKE
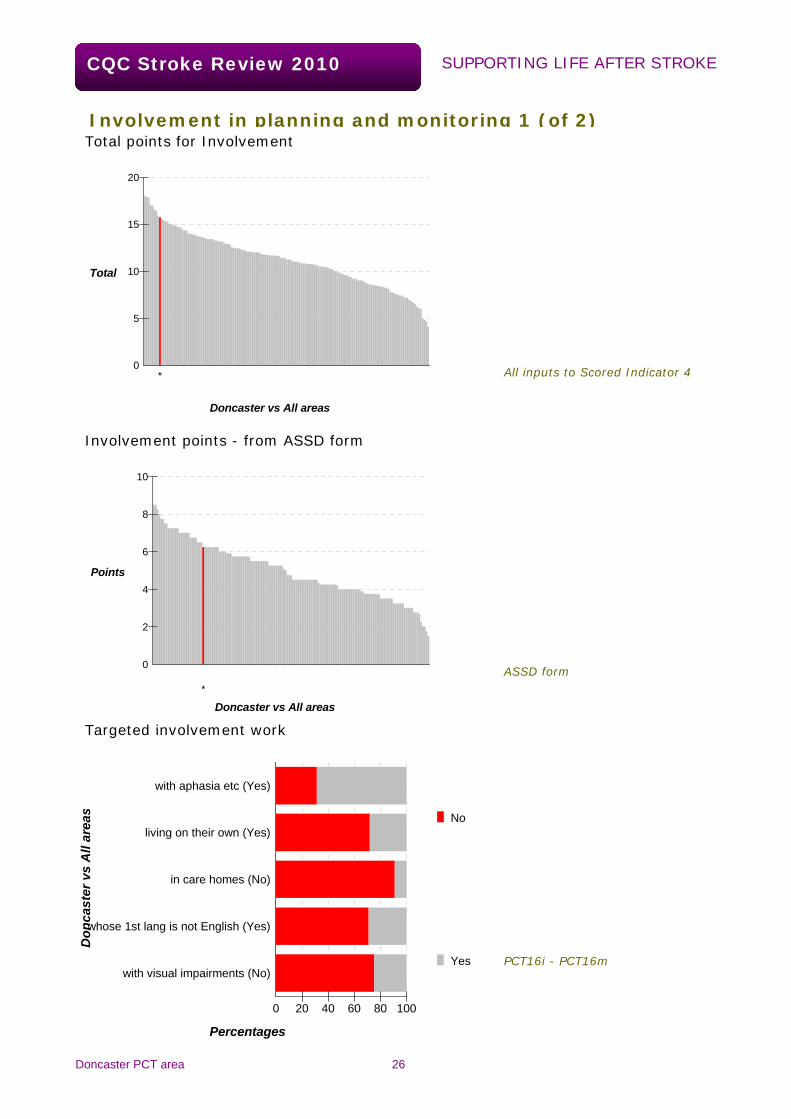
Involvement in planning and monitoring 1 (of 2) Total points for Involvement
Total
Doncaster vs All areas
0
5
10
15
20
All inputs to Scored Indicator 4 *
Involvement points - from ASSD form
Points
Doncaster vs All areas
0
2
4
6
8
10
ASSD form *
Targeted involvement work
No
Yes
Don
cast
er v
s A
ll ar
eas
Percentages
with visual impairments (No)
whose 1st lang is not English (Yes)
in care homes (No)
living on their own (Yes)
with aphasia etc (Yes)
PCT16i - PCT16m
0 20 40 60 80 100
Doncaster PCT area 26

CQC Stroke Review 2010 SUPPORTING LIFE AFTER STROKE
Involvement in planning and monitoring 2 (of 2)
Involvement - stroke survivors
No
Yes
Don
cast
er v
s A
ll ar
eas
Percentages
involved in delivering services (Yes)
involved in reviewing complaints (Yes)
involved in commissioning decisions (Yes)
involved in service monitoring (Yes)
involved in pathway design (Yes)
-representation on management board (Yes)
-focus groups (Yes)
-surveys (Yes)
PCT16a(i) - PCT16h(i) 0 20 40 60 80 100
Involvement - carers
No
Yes
Don
cast
er v
s A
ll ar
eas
Percentages
involved in delivering services (Yes)
involved in reviewing complaints (Yes)
involved in commissioning decisions (Yes)
involved in service monitoring (Yes)
involved in pathway design (Yes)
-representation on management board (Yes)
-focus groups (Yes)
-surveys (Yes)
PCT16a(ii) - PCT16h(ii)
0 20 40 60 80 100
Doncaster PCT area 27

SUPPORTING LIFE AFTER STROKE
Doncaster PCT area 28
CQC Stroke Review 2010
Working together Total points for Working together
Total
Doncaster vs All areas
0
2
4
6
8
10
All inputs to Scored Indicator 17 *
Working together - points from ASSD form
Points
Doncaster vs All areas
0
1
2
3
4
ASSD form *
Integrated reviews of health and social needs
Don
cast
er v
s A
ll ar
eas
Frequency
28%
7%
48%
Yes - all of PCT area (This site)
Yes - most
Yes - some
No
18%
0 20 40 60 80
PCT 5u