Embed Size (px)
Citation preview
Supplemental Poverty Measure pp y(SPM): Threshold Issues
Thesia I. Garner and Marisa GudraisDivision of Price and Index Number Research
Office of Prices and Living Conditions
Brookings/Census Bureau Meetings on Improved Poverty Measurement, Washington, D.C.
November 7, 2011 (revised 11-18-11, May 23, 2012)
What this is and hat this is notWhat this is and what this is not
Ongoing research on SPM poverty thresholds and related Ongoing research on SPM poverty thresholds and related statistics conducted in the Division of Price and Index Number Research, Bureau of Labor Statistics (BLS)
Views expressed in this presentation, including those related to statistical, methodological, technical, or operational issues are ours alone and do not reflect the official policy or policies of the BLS or other agencies
None of what you will see represents production‐level y p pthresholds or production‐level statistics
2
This is RESEARCH
OutlineOutline Poverty Thresholds Poverty Thresholds
Concepts and methodsSupplemental Poverty Measure (SPM) as outlined in the I t T h i l W ki G (ITWG) d tInteragency Technical Working Group (ITWG) document released in March 2010
Results: 2009, 2010, and 2005‐2010
Compare SPM and NAS ThresholdsTime series for 2005 through 2010Time series for 2005 through 2010Explore why SPM and NAS thresholds move differently
I f Di i Issues for Discussion3
U S Poverty ThresholdsU.S. Poverty Thresholds
Annual expenditures amount below which a “family” is considered poor
Which expenditures? For whom?
4
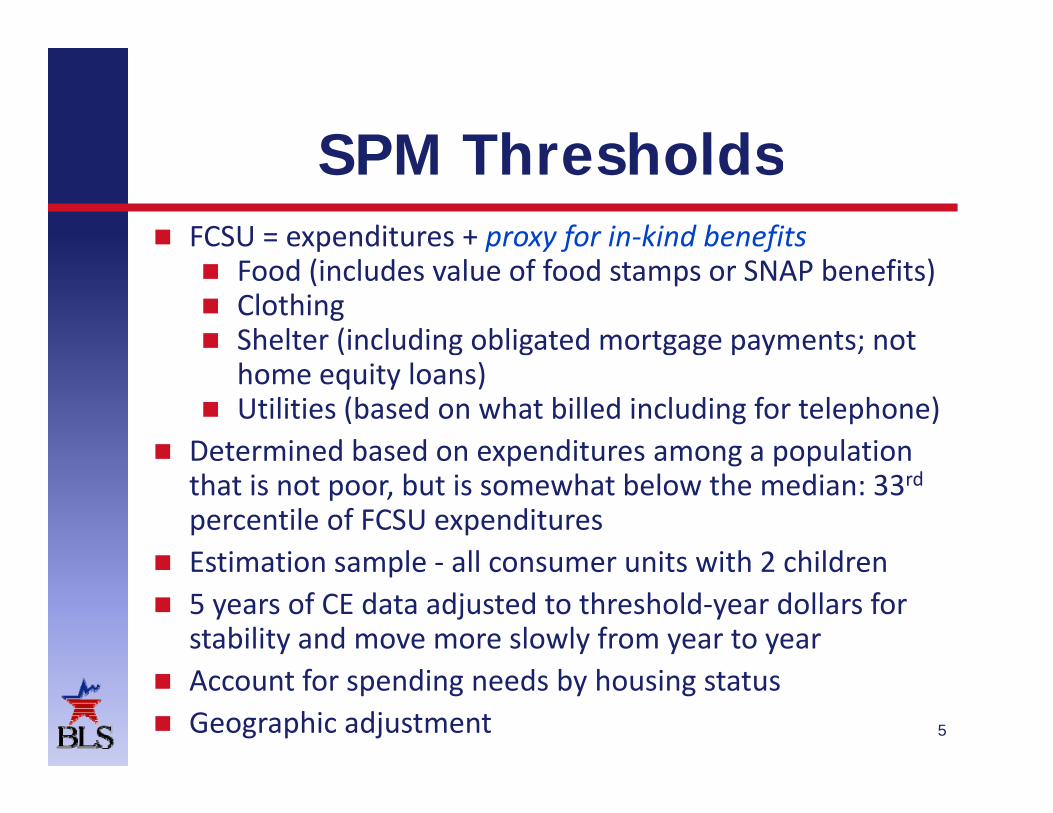
SPM ThresholdsSPM Thresholds FCSU = expenditures + proxy for in‐kind benefits
Food (includes value of food stamps or SNAP benefits) Clothing Shelter (including obligated mortgage payments; not
home equity loans) Utilities (based on what billed including for telephone)
Determined based on expenditures among a population Determined based on expenditures among a population that is not poor, but is somewhat below the median: 33rdpercentile of FCSU expenditures
Estimation sample all consumer units with 2 children Estimation sample ‐ all consumer units with 2 children 5 years of CE data adjusted to threshold‐year dollars for
stability and move more slowly from year to year
5
Account for spending needs by housing status Geographic adjustment
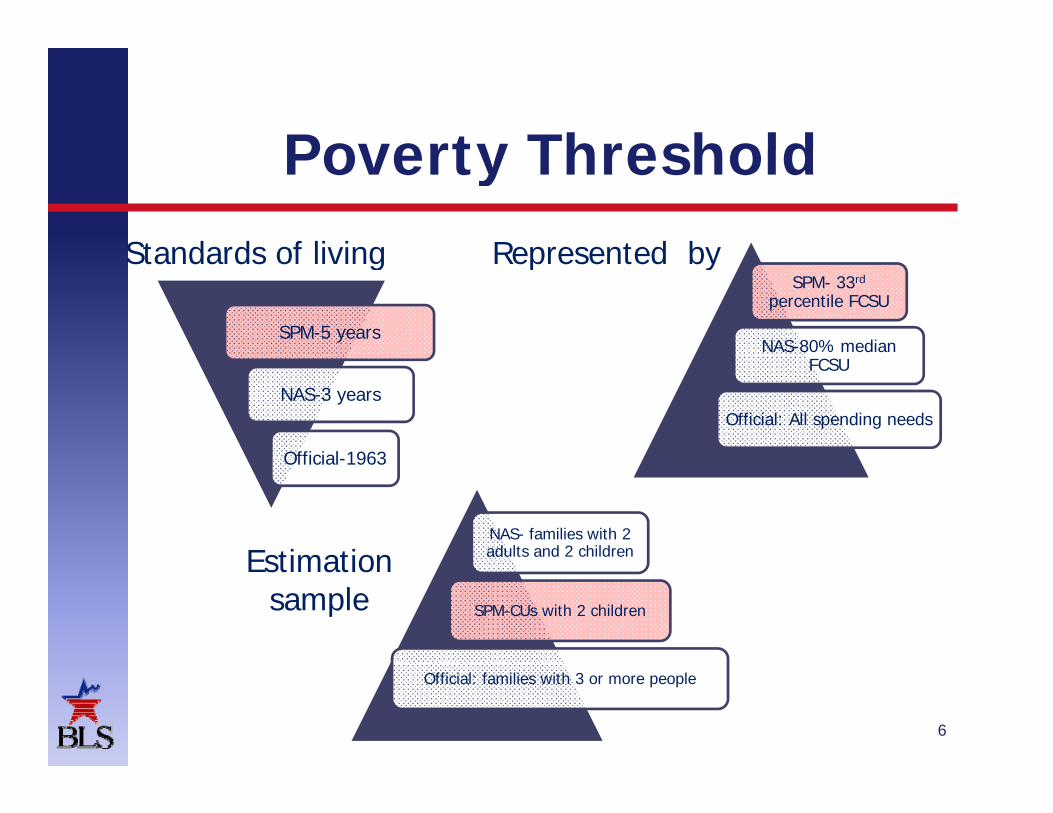
Poverty ThresholdPoverty ThresholdStandards of living Represented by
SPM-5 years
Standards of living Represented bySPM- 33rd
percentile FCSU
NAS-80% median
NAS-3 years
Official-1963
FCSU
Official: All spending needs
Official-1963
NAS- families with 2 adults and 2 childrenEstimation
SPM-CUs with 2 children
Estimationsample
6
Official: families with 3 or more people

Threshold Sample Sizes: Pooled Data for 2010Pooled Data for 2010
20,000
14,000
16,000
18,000
,
mer
Un
its
8,000
10,000
12,000
r of
Con
sum
0
2,000
4,000
6,000
Nu
mbe
r
0
(SPM Base) (NAS Base)
5 Year Sample 5 Year Sample 3 Year Sample 3 Year Sample
+2C 2A+2C +2C 2A+2C
7
Sample Specifications
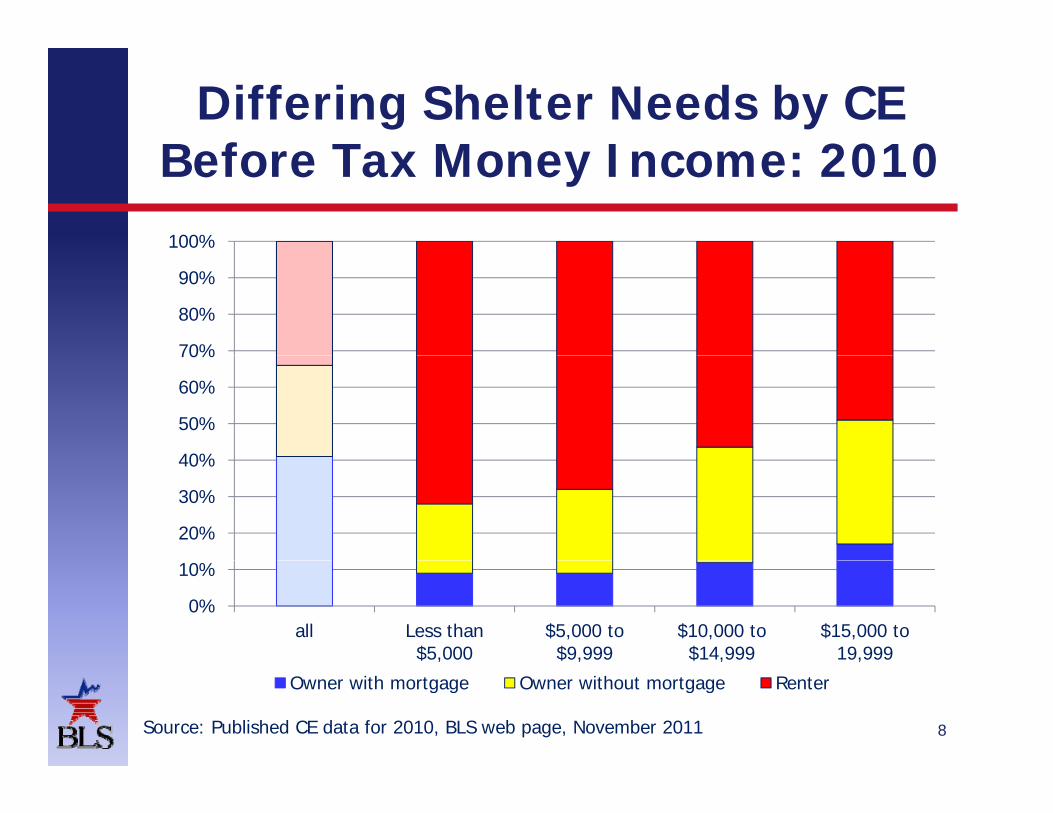
Differing Shelter Needs by CE Befo e Ta Mone Income 2010Before Tax Money Income: 2010100%
70%
80%
90%
40%
50%
60%
70%
20%
30%
40%
0%
10%
all Less than $5,000
$5,000 to $9,999
$10,000 to $14,999
$15,000 to 19,999
8
Owner with mortgage Owner without mortgage Renter
SourceSource: Published CE data for 2010, BLS web page, November 2011
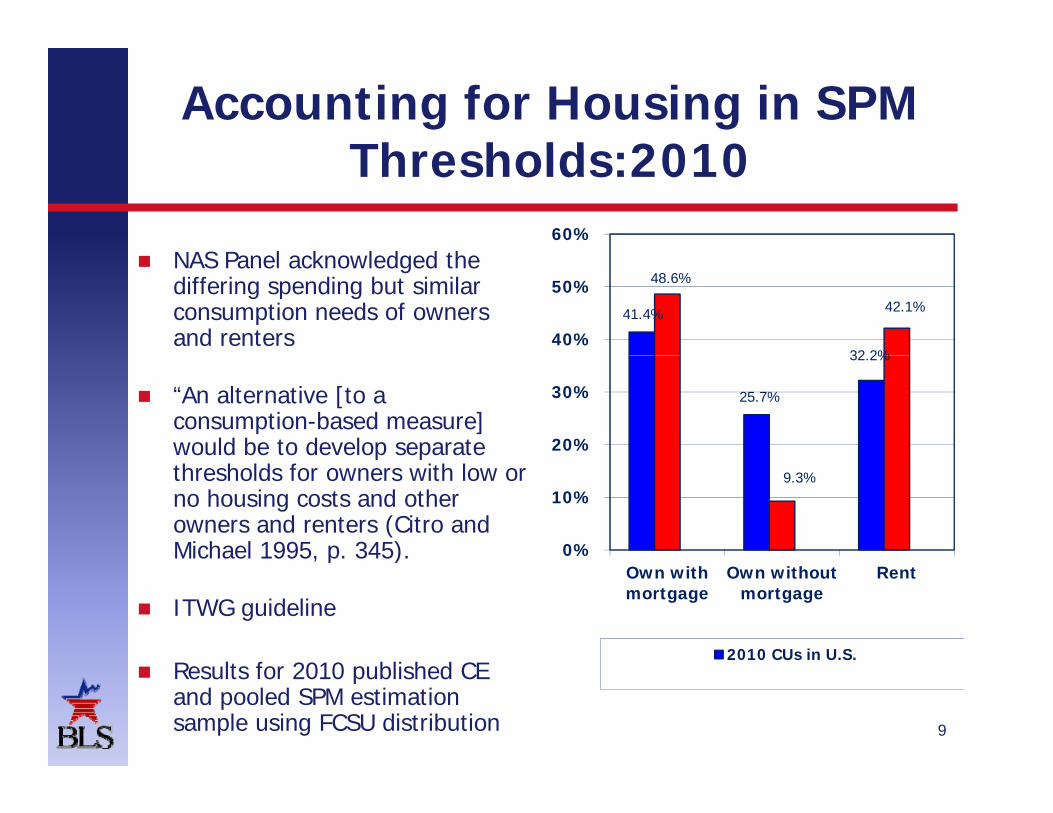
Accounting for Housing in SPM Th esholds 2010Thresholds:2010
NAS P l k l d d th60%
NAS Panel acknowledged the differing spending but similar consumption needs of owners and renters
41.4%
32 2%
48.6%
42.1%
40%
50%
“An alternative [to a consumption-based measure] would be to develop separate
25.7%
32.2%
20%
30%
p pthresholds for owners with low or no housing costs and other owners and renters (Citro and Michael 1995, p. 345).
9.3%
0%
10%
, p )
ITWG guideline
R lt f 2010 bli h d CE
Own with mortgage
Own without mortgage
Rent
2010 CUs in U.S.
9
Results for 2010 published CE and pooled SPM estimation sample using FCSU distribution
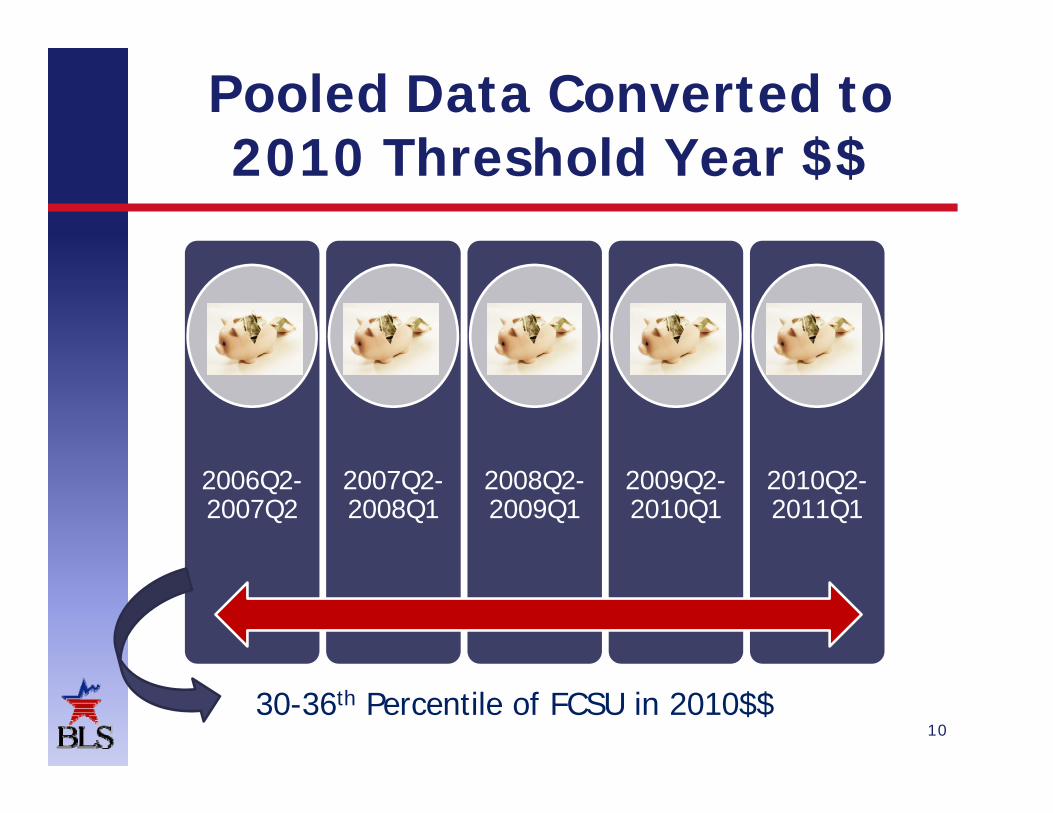
Pooled Data Converted to 2010 Threshold Year $$2010 Threshold Year $$
2006Q2-2007Q2
2007Q2-2008Q1
2008Q2-2009Q1
2009Q2-2010Q1
2010Q2-2011Q1
1030-36th Percentile of FCSU in 2010$$
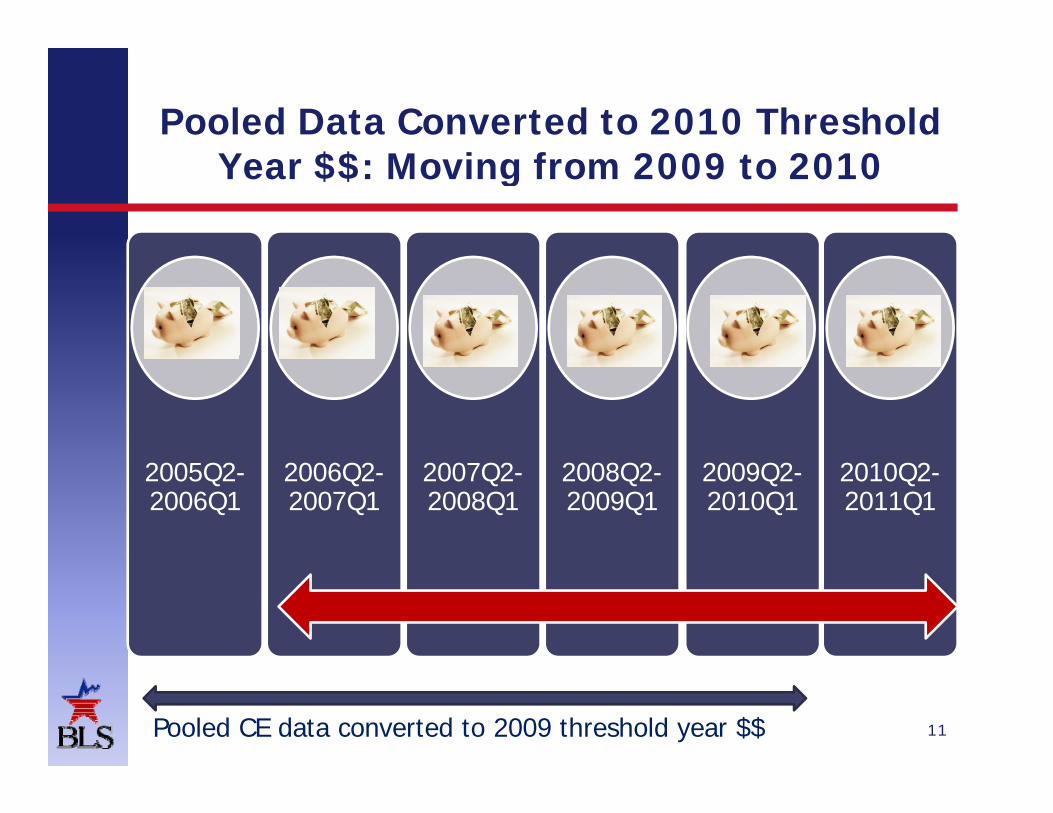
Pooled Data Converted to 2010 Threshold $$Year $$: Moving from 2009 to 2010
2005Q2-2006Q1
2006Q2-2007Q1
2007Q2-2008Q1
2008Q2-2009Q1
2009Q2-2010Q1
2010Q2-2011Q1
11Pooled CE data converted to 2009 threshold year $$
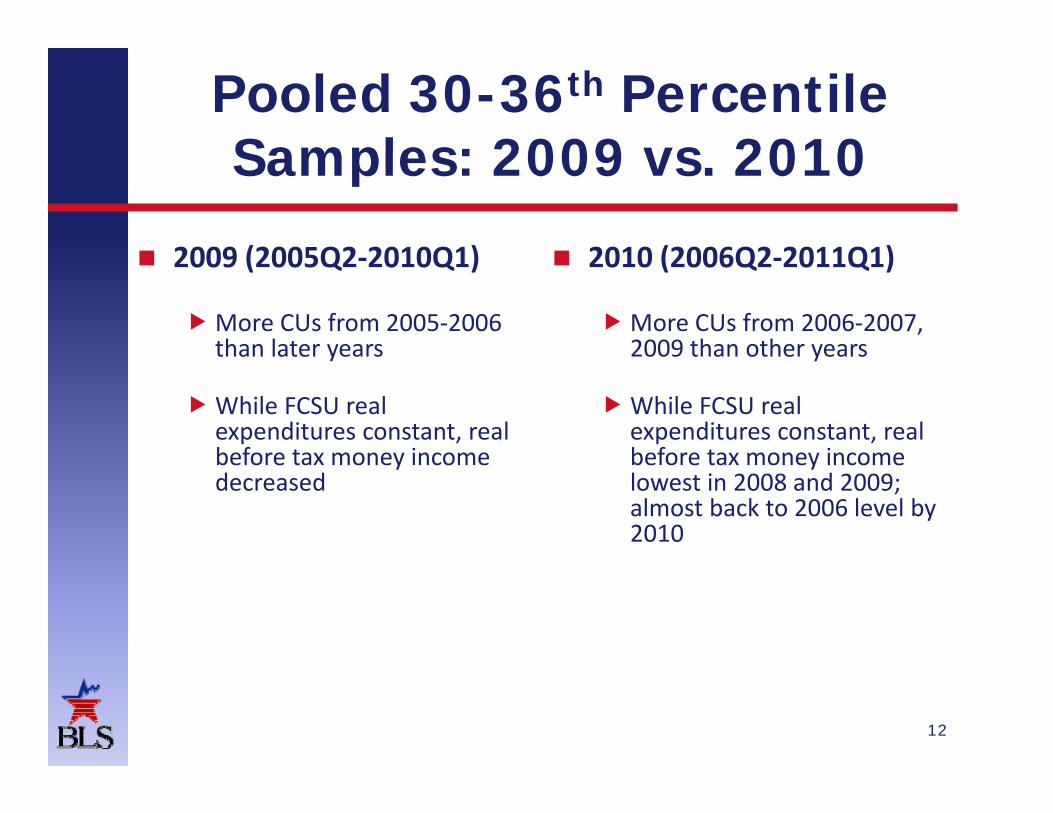
Pooled 30-36th Percentile Samples: 2009 vs 2010Samples: 2009 vs. 2010
2009 (2005Q2 2010Q1) 2010 (2006Q2 2011Q1) 2009 (2005Q2‐2010Q1)
More CUs from 2005‐2006 than later years
2010 (2006Q2‐2011Q1)
More CUs from 2006‐2007, 2009 than other yearsthan later years
While FCSU real expenditures constant, real before tax money income
2009 than other years
While FCSU real expenditures constant, real before tax money incomebefore tax money income
decreasedbefore tax money income lowest in 2008 and 2009; almost back to 2006 level by 2010
12
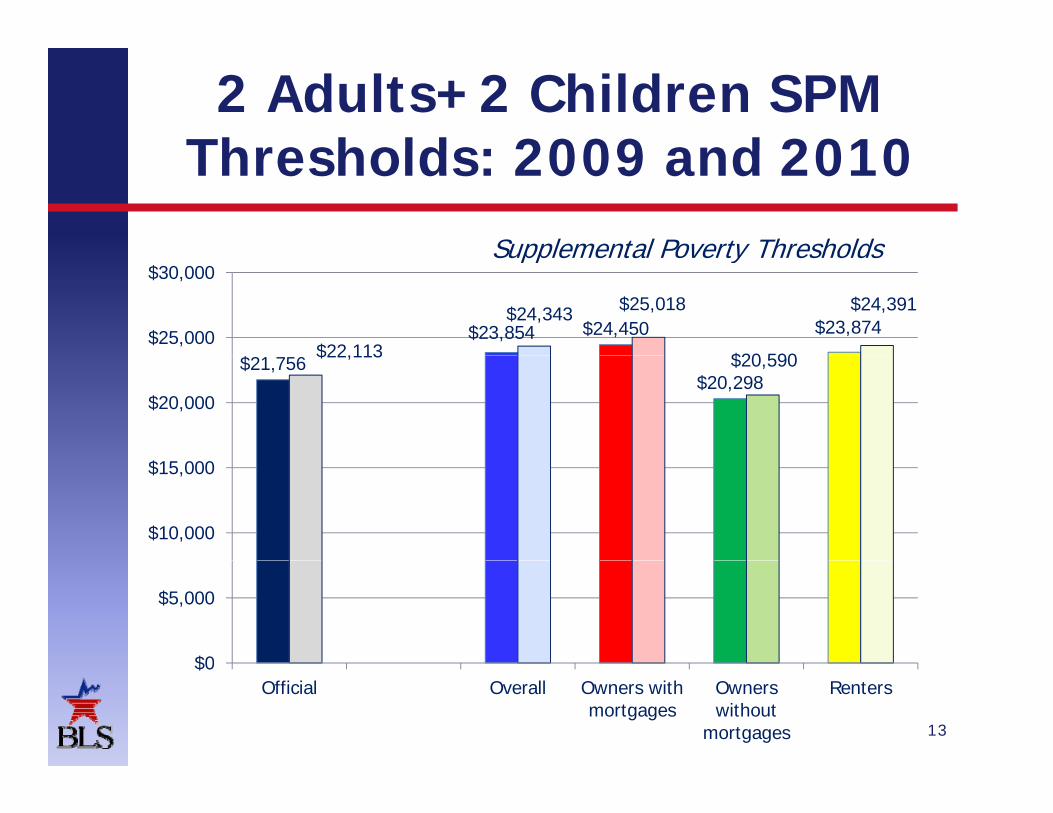
2 Adults+2 Children SPM Thresholds: 2009 and 2010Thresholds: 2009 and 2010
Supplemental Poverty Thresholds
$23,854 $24,450 $23,874$22,113
$24,343 $25,018
$20 590
$24,391
$25,000
$30,000Supplemental Poverty Thresholds
$21,756$20,298
$22,113 $20,590
$20,000
$10,000
$15,000
$0
$5,000
13
$0Official Overall Owners with
mortgagesOwners without
mortgages
Renters
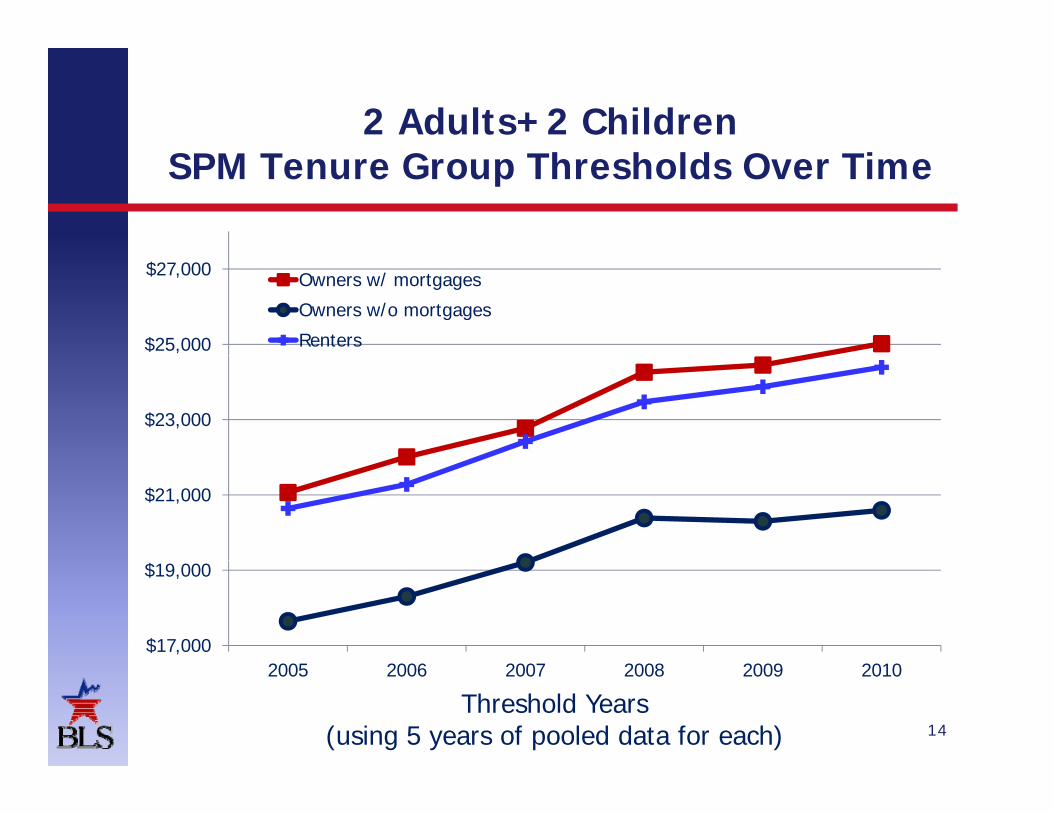
2 Adults+2 ChildrenSPM Tenure Group Thresholds Over Time
$25,000
$27,000 Owners w/ mortgages
Owners w/o mortgages
Renters
$23,000
$21,000
$17,000
$19,000
2005 2006 2007 2008 2009 2010
14
2005 2006 2007 2008 2009 2010
Threshold Years(using 5 years of pooled data for each)
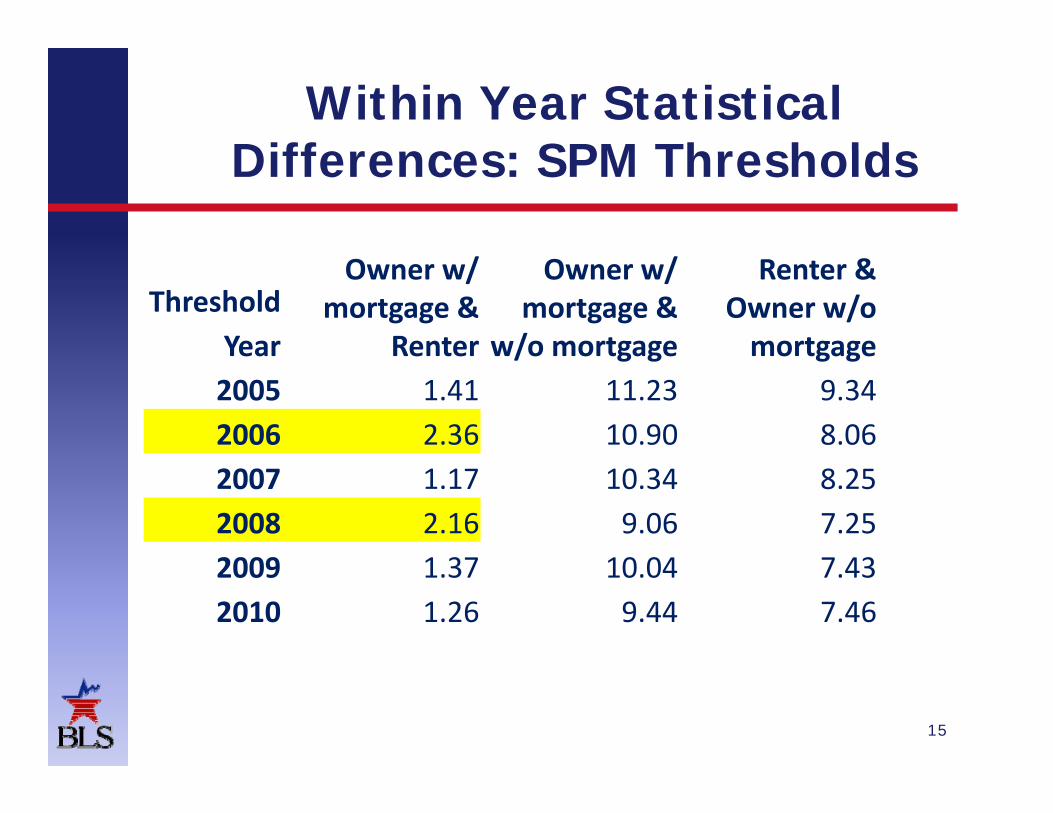
Within Year Statistical Diffe ences SPM Th esholdsDifferences: SPM Thresholds
Owner w/ mortgage &
Renter
Owner w/ mortgage &
w/o mortgage
Renter & Owner w/o mortgage
ThresholdYear Renter w/o mortgage mortgageYear2005 1.41 11.23 9.342006 2.36 10.90 8.062007 1.17 10.34 8.252008 2.16 9.06 7.252009 1 37 10 04 7 432009 1.37 10.04 7.432010 1.26 9.44 7.46
15
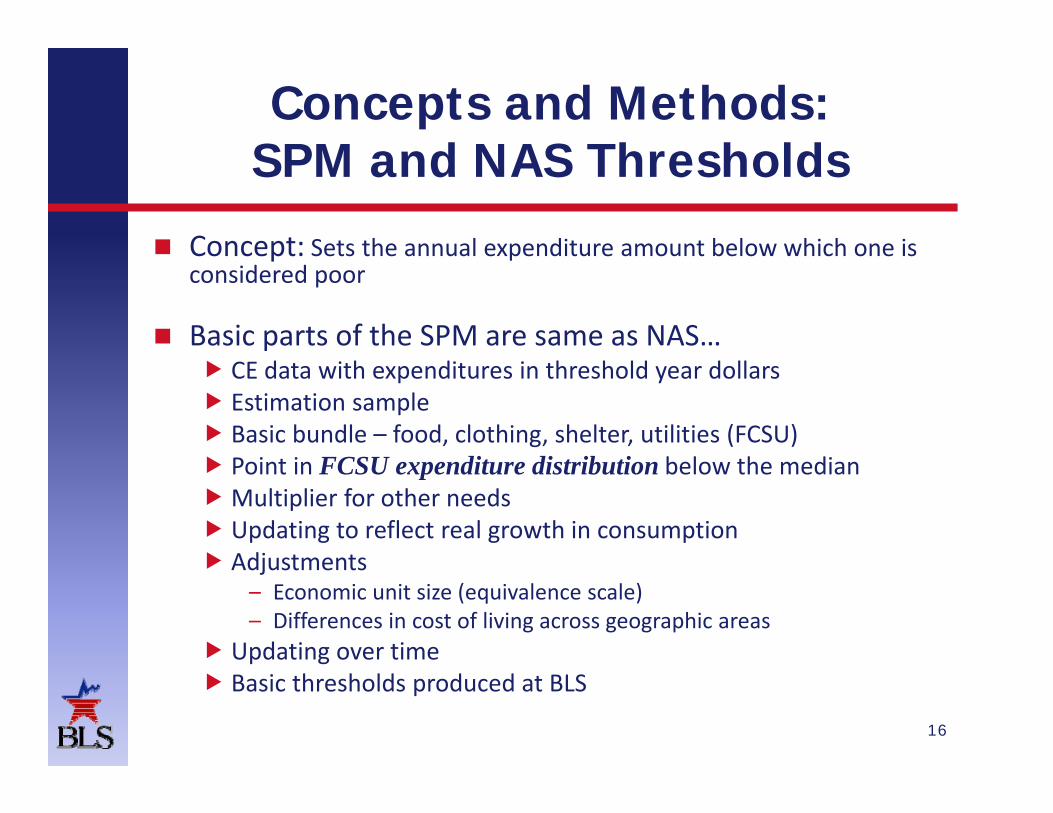
Concepts and Methods: SPM and NAS Th esholdsSPM and NAS Thresholds
Concept: Sets the annual expenditure amount below which one is Concept: Sets the annual expenditure amount below which one is considered poor
Basic parts of the SPM are same as NAS… CE data with expenditures in threshold year dollars Estimation sample Basic bundle – food, clothing, shelter, utilities (FCSU) P i i FCSU di di ib i b l h di Point in FCSU expenditure distribution below the medianMultiplier for other needs Updating to reflect real growth in consumption Adjustments Adjustments
– Economic unit size (equivalence scale)– Differences in cost of living across geographic areas
Updating over time
16
p g Basic thresholds produced at BLS
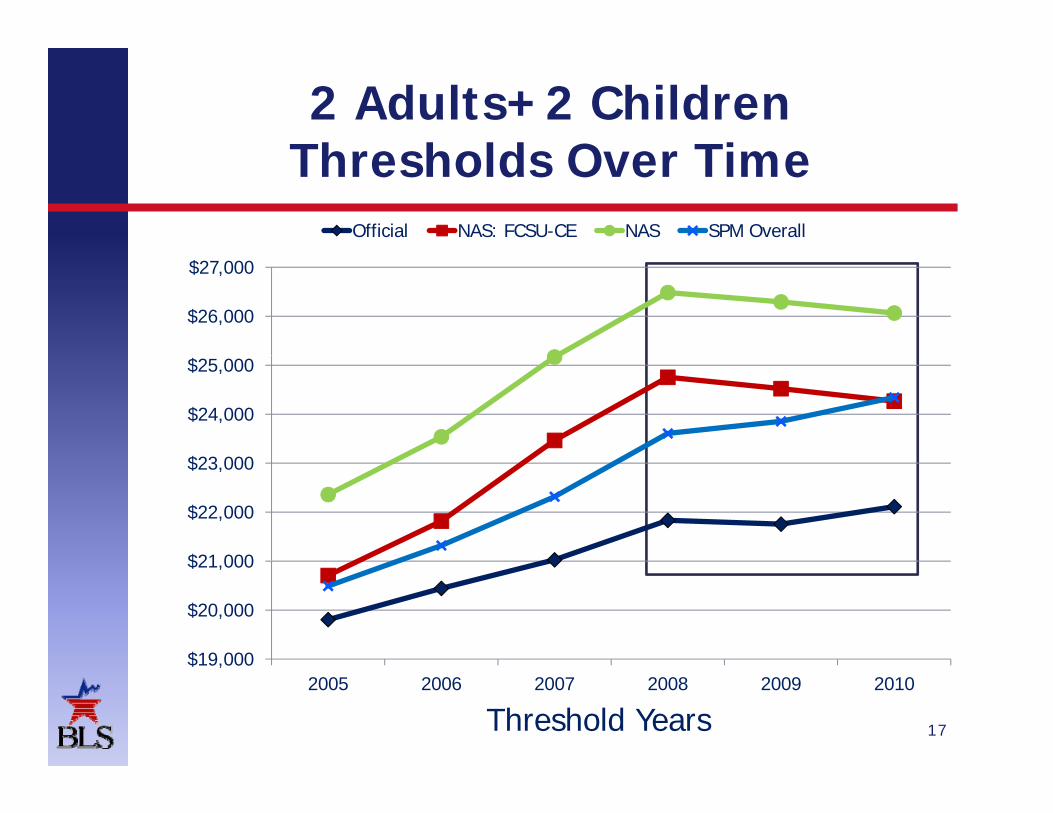
2 Adults+2 ChildrenTh esholds O e TimeThresholds Over Time
Official NAS: FCSU-CE NAS SPM Overall
$26,000
$27,000
$23 000
$24,000
$25,000
$21 000
$22,000
$23,000
$19,000
$20,000
$21,000
17
$19,0002005 2006 2007 2008 2009 2010
Threshold Years
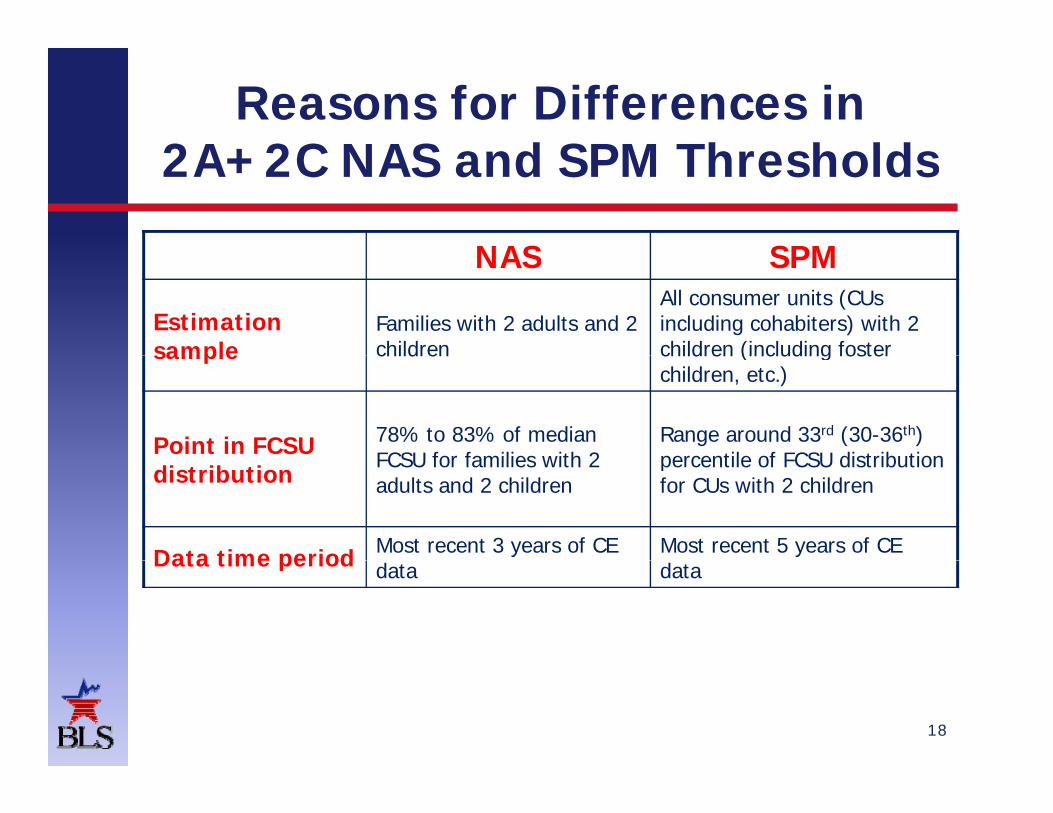
Reasons for Differences in 2A+2C NAS and SPM Th esholds2A+2C NAS and SPM Thresholds
NAS SPMNAS SPM
Estimation sample
Families with 2 adults and 2 children
All consumer units (CUs including cohabiters) with 2 children (including fostersample children children (including foster children, etc.)
Point in FCSU 78% to 83% of median FCSU for families with 2
Range around 33rd (30-36th) percentile of FCSU distribution
distributionFCSU for families with 2 adults and 2 children
percentile of FCSU distribution for CUs with 2 children
Data time period Most recent 3 years of CE Most recent 5 years of CE Data time period data data
18
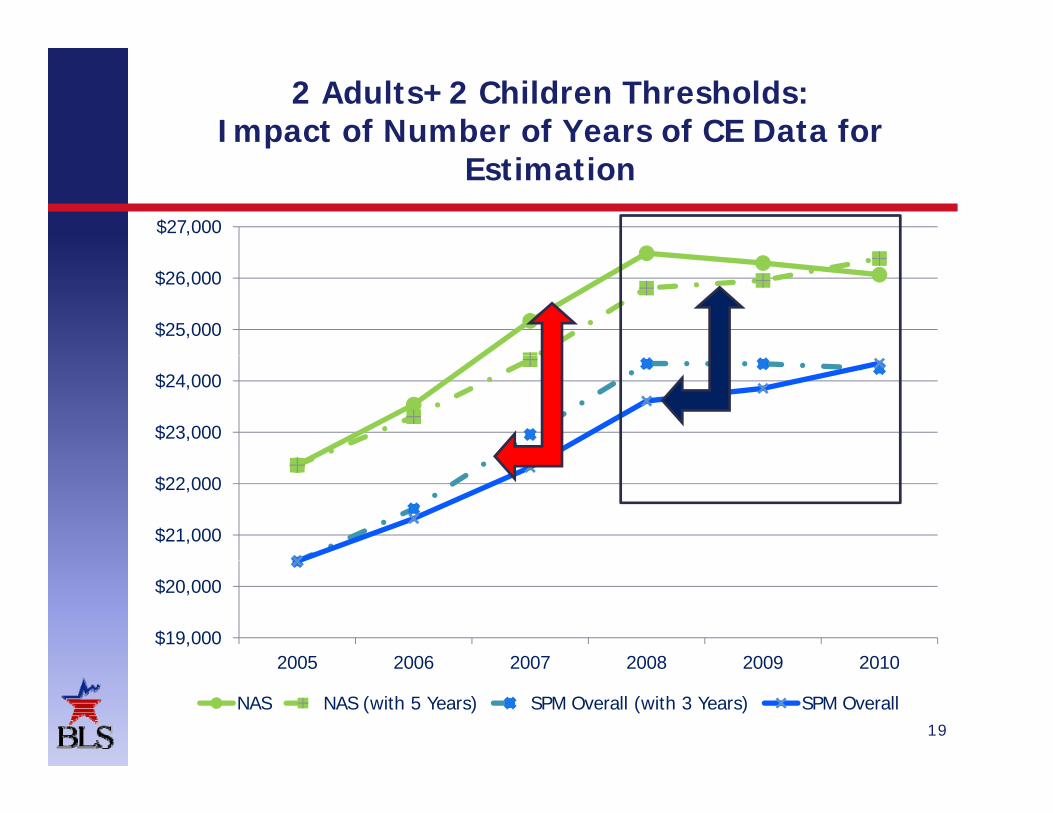
2 Adults+2 Children Thresholds:Impact of Number of Years of CE Data for
$27,000
Estimation
$25,000
$26,000
$23,000
$24,000
$21,000
$22,000
$19,000
$20,000
2005 2006 2007 2008 2009 20102005 2006 2007 2008 2009 2010
NAS NAS (with 5 Years) SPM Overall (with 3 Years) SPM Overall19
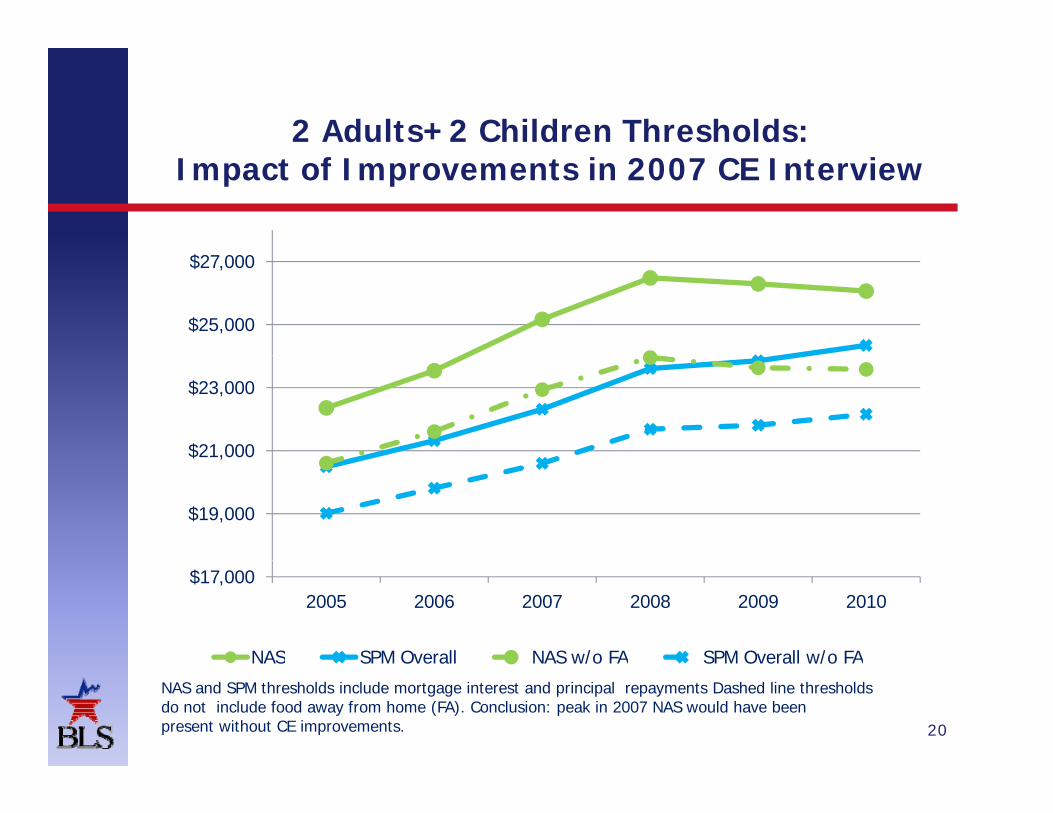
2 Adults+2 Children Thresholds:Impact of Improvements in 2007 CE Interview
$25,000
$27,000
$21,000
$23,000
$19,000
$ ,
$17,0002005 2006 2007 2008 2009 2010
NAS SPM Overall NAS w/o FA SPM Overall w/o FA
20
NAS and SPM thresholds include mortgage interest and principal repayments Dashed line thresholds do not include food away from home (FA). Conclusion: peak in 2007 NAS would have been present without CE improvements.
NAS SPM Overall NAS w/o FA SPM Overall w/o FA
SummarySummary
Accounting for housing tenure impacts Accounting for housing tenure impacts threshold levels
SPM thresholds continue to increase in contrast to NAS thresholds
Differences in SPM and NAS appear to be driven by years of data used in estimation
21
Issues for DiscussionIssues for Discussion
Accounting for shelter “needs”Regression based approach
l lRental equivalence
Time period underlying thresholds Time period underlying thresholds
Role of in-kind subsidieso e o d subs d esTo represent spending needsTo represent higher levels of living
22 Implications for resources

Contact Information
Thesia I. GarnerSenior Research EconomistSenior Research Economist
Division of Price and Index Number Research/Office of Prices and Living Conditions
http://stats.bls.gov/pir/spmhome.htm
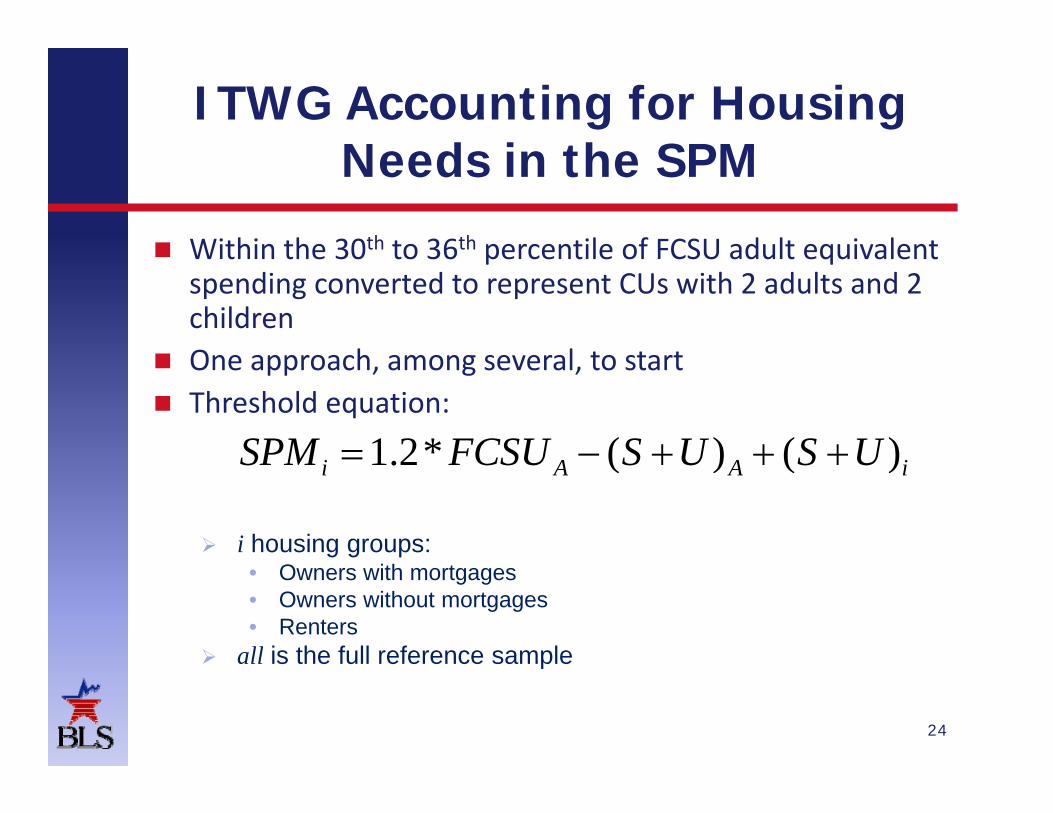
ITWG Accounting for Housing Needs in the SPMNeeds in the SPM
Within the 30th to 36th percentile of FCSU adult equivalent Within the 30 to 36 percentile of FCSU adult equivalent spending converted to represent CUs with 2 adults and 2 children
One approach among several to start One approach, among several, to start Threshold equation:
1 2* ( ) ( )SPM FCSU S U S U 1.2 ( ) ( )i A A iSPM FCSU S U S U
i housing groups:• Owners with mortgages• Owners without mortgages• Renters
all is the full reference sample
24
all is the full reference sample
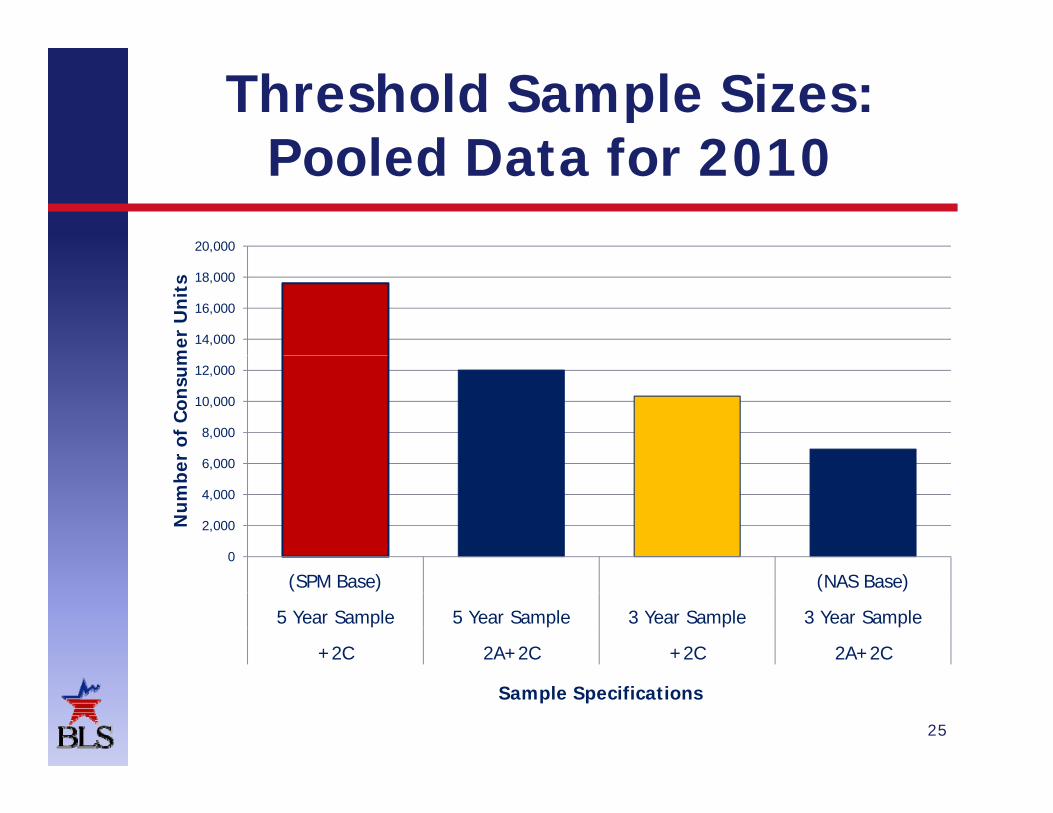
Threshold Sample Sizes: Pooled Data for 2010Pooled Data for 2010
20,000
14,000
16,000
18,000
,
mer
Un
its
8,000
10,000
12,000
r of
Con
sum
0
2,000
4,000
6,000
Nu
mbe
r
0
(SPM Base) (NAS Base)
5 Year Sample 5 Year Sample 3 Year Sample 3 Year Sample
+2C 2A+2C +2C 2A+2C
25
Sample Specifications
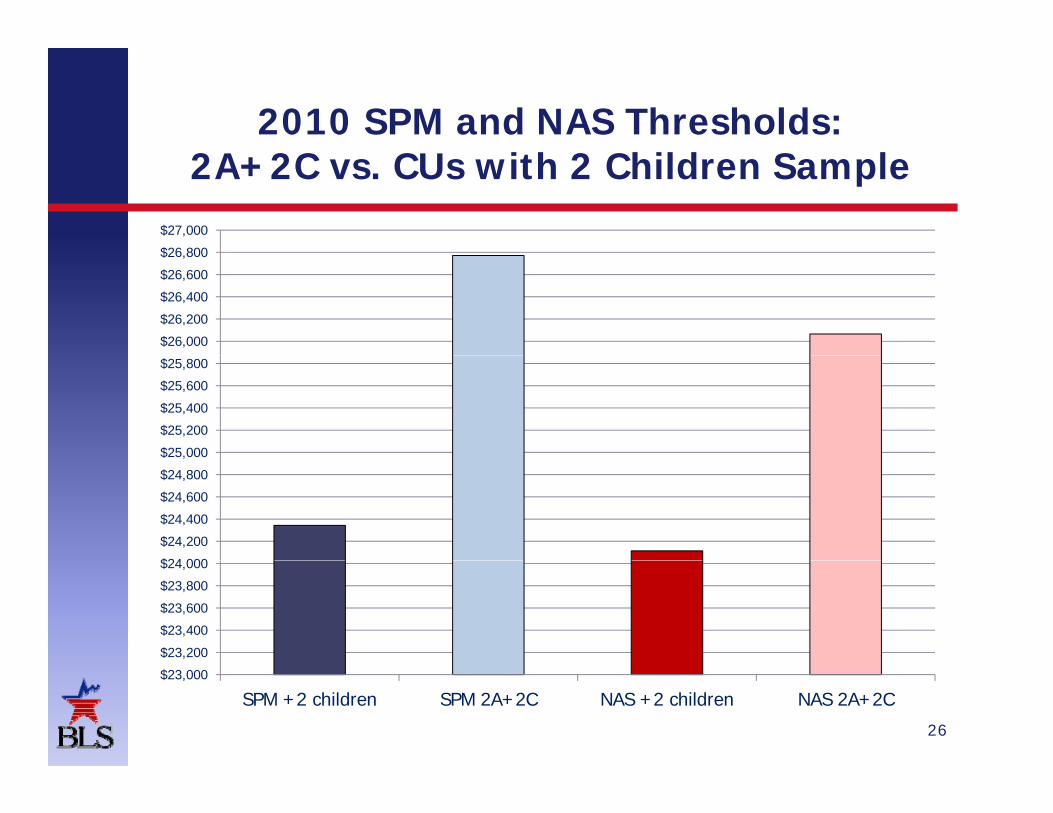
2010 SPM and NAS Thresholds: 2A+2C vs. CUs with 2 Children Sample
$26 800
$27,000
$26,000
$26,200
$26,400
$26,600
$26,800
$25,000
$25,200
$25,400
$25,600
$25,800
$24 000
$24,200
$24,400
$24,600
$24,800
$ ,
$23,200
$23,400
$23,600
$23,800
$24,000
26
$23,000
SPM +2 children SPM 2A+2C NAS +2 children NAS 2A+2C


![[Spm] Presentasi 2 Juknis Spm](https://img.pdfslide.net/doc/110x75/5571fe3f49795991699af645/spm-presentasi-2-juknis-spm.jpg)