Embed Size (px)
Citation preview

8-1
8.0 Technical Support Document (TSD) for the Exceptional Event Claim Concurrence for the Norfolk, Virginia Area
This chapter presents the exceptional event claim concurrence and supporting
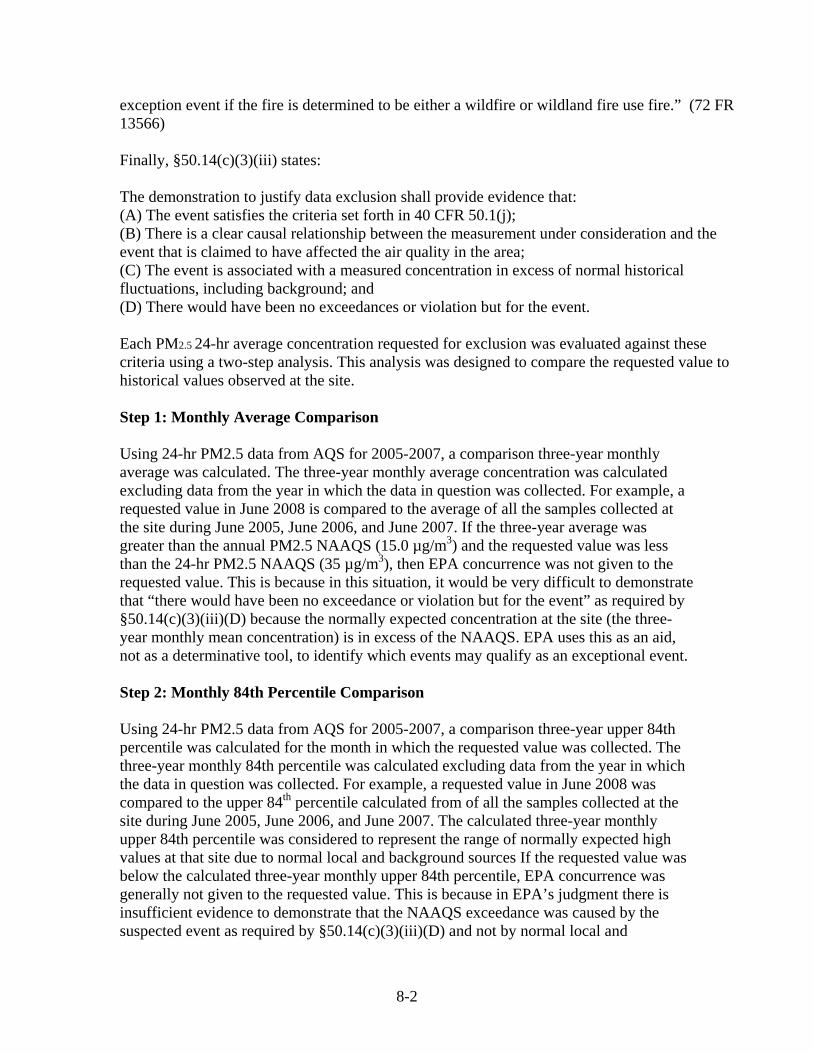
technical information for Norfolk, Virginia ambient air monitoring site (AIRS I.D. 51-710-0024) as provided by U.S. EPA Region 3. Introduction This document provides U.S. Environmental Protection Agency (EPA) Region 3 rationale for concurrence or non-concurrence with exceptional event flags on the 24-hr average PM2.5 concentration recorded at the Norfolk Air Quality System (AQS) site within the Commonwealth of Virginia’s Ambient Air Monitoring Network. On March 6, 2009, Virginia Department of Environmental Quality Air Division (Virginia DEQ) submitted an exceptional event package that included data from several air monitoring stations. The Norfolk site data, included in this package, is being expeditiously reviewed, because the data requested for exclusion influences the 2006-2008 attainment status for the Hampton Roads, Virginia area. At a later date, Region 3 will complete its review of all data included in the March 6, 2009 submittal. The exceptional event flags that EPA Region 3 has concurred with will be excluded from use in determinations of exceedances and National Ambient Air Quality Standards (NAAQS) violations. According to 40 CFR 50.1(j):
“Exceptional event means an event that affects air quality, is not reasonably controllable or preventable, is an event caused by human activity that is unlikely to recur at a particular location or a natural event, and is determined by the Administrator in accordance with 40 CFR 50.14 to be an exceptional event. It does not include stagnation of air masses or meteorological inversions, a meteorological event involving high temperatures or lack of precipitation, or air pollution relating to source noncompliance.”
40 CFR 50.1(k) provides a definition of “natural event”:
(k) Natural event means an event in which human activity plays little or no direct causal role.
The preamble to the Exception Events Rule, published in the Federal Register on March 22, 2007 (72 FR 13560), discusses wildfires and their inclusion as natural events under this definition. Specifically, 72 FR 13566 notes, “A “wildfire” is defined as an unplanned, unwanted wildland fire (such as a fire caused by lightning), and include unauthorized human-caused fires (such as arson or acts of carelessness by campers), escaped prescribe fire projects (escaped control due to unforeseen circumstances) where the appropriate management response includes the objective to suppress the fire.” The preamble also goes on to note that “…both wildfires and wildland fire use fires fall within the meaning of “natural events”…Therefore, ambient particulate matter and ozone concentrations due to smoke from a wildland fire will be considered for treatment as an
8-2
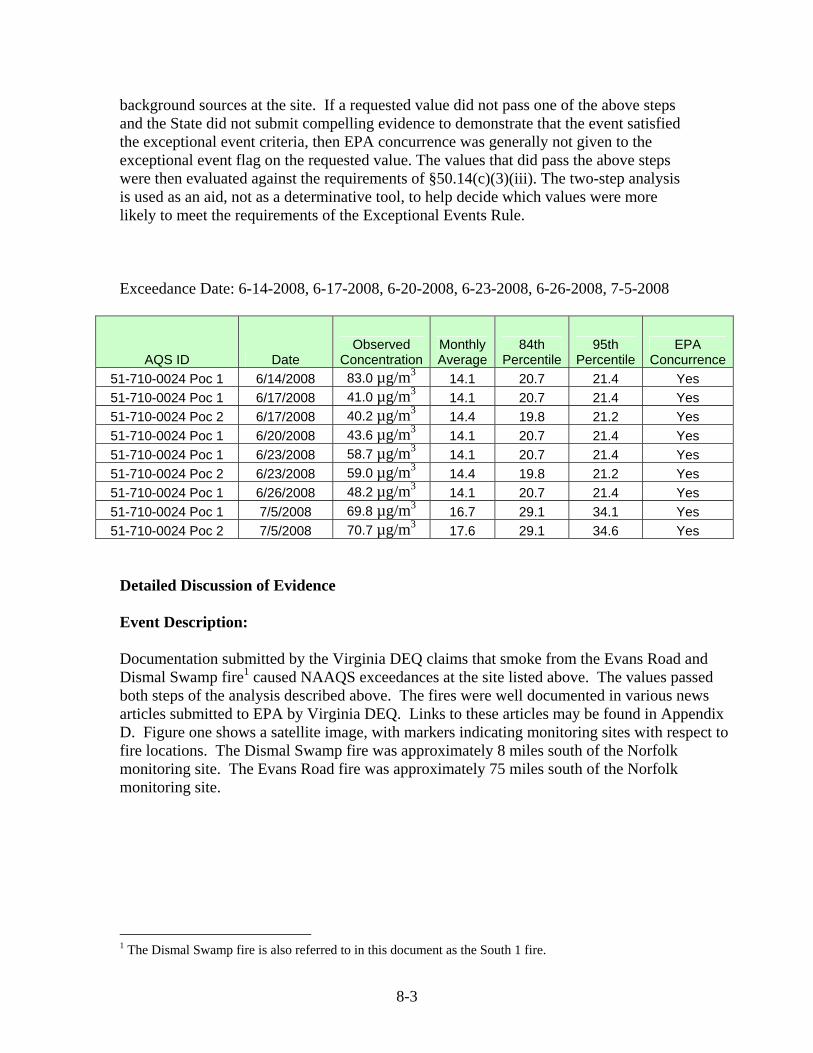
exception event if the fire is determined to be either a wildfire or wildland fire use fire.” (72 FR 13566) Finally, §50.14(c)(3)(iii) states: The demonstration to justify data exclusion shall provide evidence that: (A) The event satisfies the criteria set forth in 40 CFR 50.1(j); (B) There is a clear causal relationship between the measurement under consideration and the event that is claimed to have affected the air quality in the area; (C) The event is associated with a measured concentration in excess of normal historical fluctuations, including background; and (D) There would have been no exceedances or violation but for the event. Each PM2.5 24-hr average concentration requested for exclusion was evaluated against these criteria using a two-step analysis. This analysis was designed to compare the requested value to historical values observed at the site. Step 1: Monthly Average Comparison Using 24-hr PM2.5 data from AQS for 2005-2007, a comparison three-year monthly average was calculated. The three-year monthly average concentration was calculated excluding data from the year in which the data in question was collected. For example, a requested value in June 2008 is compared to the average of all the samples collected at the site during June 2005, June 2006, and June 2007. If the three-year average was greater than the annual PM2.5 NAAQS (15.0 µg/m3) and the requested value was less than the 24-hr PM2.5 NAAQS (35 µg/m3), then EPA concurrence was not given to the requested value. This is because in this situation, it would be very difficult to demonstrate that “there would have been no exceedance or violation but for the event” as required by §50.14(c)(3)(iii)(D) because the normally expected concentration at the site (the three-year monthly mean concentration) is in excess of the NAAQS. EPA uses this as an aid, not as a determinative tool, to identify which events may qualify as an exceptional event. Step 2: Monthly 84th Percentile Comparison Using 24-hr PM2.5 data from AQS for 2005-2007, a comparison three-year upper 84th percentile was calculated for the month in which the requested value was collected. The three-year monthly 84th percentile was calculated excluding data from the year in which the data in question was collected. For example, a requested value in June 2008 was compared to the upper 84th percentile calculated from of all the samples collected at the site during June 2005, June 2006, and June 2007. The calculated three-year monthly upper 84th percentile was considered to represent the range of normally expected high values at that site due to normal local and background sources If the requested value was below the calculated three-year monthly upper 84th percentile, EPA concurrence was generally not given to the requested value. This is because in EPA’s judgment there is insufficient evidence to demonstrate that the NAAQS exceedance was caused by the suspected event as required by §50.14(c)(3)(iii)(D) and not by normal local and
8-3
background sources at the site. If a requested value did not pass one of the above steps and the State did not submit compelling evidence to demonstrate that the event satisfied the exceptional event criteria, then EPA concurrence was generally not given to the exceptional event flag on the requested value. The values that did pass the above steps were then evaluated against the requirements of §50.14(c)(3)(iii). The two-step analysis is used as an aid, not as a determinative tool, to help decide which values were more likely to meet the requirements of the Exceptional Events Rule. Exceedance Date: 6-14-2008, 6-17-2008, 6-20-2008, 6-23-2008, 6-26-2008, 7-5-2008
AQS ID Date Observed
ConcentrationMonthly Average
84th Percentile
95th Percentile
EPA Concurrence
51-710-0024 Poc 1 6/14/2008 83.0 µg/m3 14.1 20.7 21.4 Yes 51-710-0024 Poc 1 6/17/2008 41.0 µg/m3 14.1 20.7 21.4 Yes 51-710-0024 Poc 2 6/17/2008 40.2 µg/m3 14.4 19.8 21.2 Yes 51-710-0024 Poc 1 6/20/2008 43.6 µg/m3 14.1 20.7 21.4 Yes 51-710-0024 Poc 1 6/23/2008 58.7 µg/m3 14.1 20.7 21.4 Yes 51-710-0024 Poc 2 6/23/2008 59.0 µg/m3 14.4 19.8 21.2 Yes 51-710-0024 Poc 1 6/26/2008 48.2 µg/m3 14.1 20.7 21.4 Yes 51-710-0024 Poc 1 7/5/2008 69.8 µg/m3 16.7 29.1 34.1 Yes 51-710-0024 Poc 2 7/5/2008 70.7 µg/m3 17.6 29.1 34.6 Yes
Detailed Discussion of Evidence Event Description: Documentation submitted by the Virginia DEQ claims that smoke from the Evans Road and Dismal Swamp fire1 caused NAAQS exceedances at the site listed above. The values passed both steps of the analysis described above. The fires were well documented in various news articles submitted to EPA by Virginia DEQ. Links to these articles may be found in Appendix D. Figure one shows a satellite image, with markers indicating monitoring sites with respect to fire locations. The Dismal Swamp fire was approximately 8 miles south of the Norfolk monitoring site. The Evans Road fire was approximately 75 miles south of the Norfolk monitoring site.
1 The Dismal Swamp fire is also referred to in this document as the South 1 fire.

8-4
Monitoring Station City/County Monitoring Station City/County
33-A Albemarle Co. 109-M Roanoke 38-I Loudoun Co. 179-C Hampton 71-H Chesterfield Co. 181-A1 Norfolk 72-M Henrico Co. 183-E Suffolk – Tidewater CC 73-E Hanover Co. 183-F Suffolk – Holland 75-B Charles City Co. 184-J VA Beach
Figure 1 Causal Relationship between the Event and Air Quality: Virginia DEQ has provided in their Exceptional Event submittal package a detailed explanation of the Air Quality conditions for each date requested for exclusion in the Norfolk area. The summaries include, what is indicated by the HYSPLIT model, what is indicated by the satellite images and what is the surface observations of airports in the area. HYSPLIT back trajectories, airport surface observations and Satellite images are also included in Appendix A. The information provided by Virginia DEQ and the newspaper coverage that has been documented establishes that smoke was in the Norfolk Virginia area on the days where data exclusion is requested. A causal link between the event and air quality can be established with the evidence presented.

8-5
Comparison to Historical Levels: The data in question was compared to historical levels observed at the Norfolk site. Table 1 shows that all data flagged is greater than the 95th percentile calculated from data collected during the month of June and July for 2005 -2007. Data was unavailable for the Norfolk co-located monitor in 2005, because the co-located monitor was not installed until 2006. Norfolk primary monitor data was substituted for this year, to complete calculation. Virginia DEQ also presented the following atypical analysis, historical graphs, and distribution graphs to show how the data requested for exemption compared to historical data this information was taken directly from Virginia DEQ’s Exceptional events submittal:
Atypical Analysis
The data for the Norfolk monitoring site is presented below in a number of ways, all of which demonstrate quite thoroughly the extent of the influence to the monitoring data caused by the Evans Road and South 1 fires. Figures 1 and 2 provide analyses for the FRM and co-located Norfolk monitors that compare the flagged data to the percentile rankings for each data set. The actual values are also compared to the benchmark 84th and 95th percentile. These values are flagged in AQS with “RT” for wild fires.
Figure 1: Atypical Analysis for the PM2.5 FRM (POC 1) Affected by the Evans Road and South 1 Fires
for Norfolk, 51-710-0024
Historical Percentiles from 2005-2008 (4 years) Concentration, ug/m3
2008 Exceptional Events Candidate
Ratio to Percentiles
0% 25% 50% 75% 84% 95% 100% Date Concentrationug/m3 84% 95%
Flag
6/14/08 83.0 4.32 3.25 RT
6/17/08 41.0 2.14 1.60 RT
6/20/08 43.6 2.27 1.71 RT
6/23/08 58.7 3.06 2.30 RT
6/26/08 48.2 2.51 1.89 RT
2.40 7.40 10.85 15.80 19.20 25.56 83.00
7/5/08 69.8 3.64 2.73 RT
Figure 2: Atypical Analysis for the Collocated PM2.5 Monitor (POC 2) Affected by the Evans Road and South 1 Fires for Norfolk, 51-710-0024
Historical Percentiles from 2006-2008 (3 years) Concentration, ug/m3
2008 Exceptional Events Candidate
Ratio to Percentiles
0% 25% 50% 75% 84% 95% 100% Date Concentrationug/m3 84% 95%
Flag
3.20 7.50 10.50 15.28 18.87 24.81 70.70 6/17/08 40.2 2.13 1.62 RT

8-6
6/23/08 59.0 3.13 2.38 RT
7/5/08 70.7 3.75 2.85 RT

8-7
Norfolk 51-710-0024, POC 1 PM2.5 FRM 24-Hour Average
2005-2008 June and July
0.0
10.0
20.0
30.0
40.0
50.0
60.0
70.0
80.0
90.0
Con
cent
ratio
n, u
g/m
3
Flagged Data:6/14/08 83.0 ug/m36/17/08 41.0 ug/m36/20/08 43.6 ug/m36/23/08 58.7 ug/m36/26/08 48.2 ug/m37/5/08 69.8 ug/m3
Figure 1: Norfolk PM2.5 FRM (POC 1) Historical Record for June and July
Norfolk 51-710-0024 POC 2
Collocated PM2.5 24-Hour Average Monitoring Data June and July 2006 through 2008
0.0
10.0
20.0
30.0
40.0
50.0
60.0
70.0
80.0
Con
cent
ratio
n, u
g/m
3
Flagged Data:6/17/08 40.2 ug/m36/23/08 59.0 ug/m37/5/08 70.7 ug/m3
Figure 2: Norfolk PM2.5 Collocated Monitor (POC 2) Historical Record for June and July

8-8
The historical record of Norfolk PM2.5 values for the FRM and collocated monitors demonstrate the extraordinary nature of the values recorded. Figure 3 shows that the values recorded at the Norfolk FRM are the highest measured in the last four years during the months of June and July. Figure 4 shows that the values recorded at the Norfolk collocated monitor are the highest values measured in the last three years during the months of June and July. Using histograms provides another method for examining the data, and this methodology again supports the conclusion that the flagged data are atypical and extraordinary. Figure 5 below provides the histogram for all data in the last four years for the Norfolk PM2.5 FRM during the months of June and July. Figure 6 below provides the histogram for all data in the last three years for the Norfolk PM2.5 collocated monitor during the months of June and July.
Figure 3: Distribution Frequency of Observations for the Norfolk FRM PM2.5 (POC 1) for 2005-2008,
months of June and July
Distribution Frequency Norfolk 51-710-0024 POC 1
PM2.5 FRM 24-Hour Averages 2005-2008 June and July
2
12
18
20
11
5 5
0
21
01
01
0 01
00
5
10
15
20
25
<5.0
10.1-15.0
20.1-25.0
30.1-35.0
40.1-45.0
50.1-55.0
60.1-65.0
70.1-75.0
80.1-85.0
Concentration, ug/m3
# of O
bserva
tions
Flagged Data:6/14/08 83.0 ug/m36/17/08 41.0 ug/m36/20/08 43.6 ug/m36/23/08 58.7 ug/m36/26/08 48.2 ug/m37/5/08 69.8 ug/m3
Figure 4: Distribution Frequency of Observations for the Norfolk PM2.5 Collocated Monitor, 2006-
2008, months of June and July

8-9
Distribution FrequencyNorfolk, 51-710-0024, POC 2
Collocated PM2.5 24-Hour Average June and July, 2006-2008
0
7 7
10
6
2 2
1 1
0 0
1
0 0
1
0 0 00
2
4
6
8
10
12<5
.0
5.1-
10.0
10.1-1
5.0
15.1-2
0.0
20.1-2
5.0
25.1-3
0.0
30.1-3
5.0
35.1-4
0.0
40.1-4
5.0
45.1-5
0.0
50.1-5
5.0
55.1-6
0.0
60.1-6
5.0
65.1-7
0.0
70.1-7
5.0
75.1-8
0.0
80.1-8
5.0
>85.
0
Concentration, ug/m3
# of
Obs
erva
tions
Flagged Data:6/17/08 40.2 ug/m36/23/08 59.0 ug/m37/5/08 70.7 ug/m3
The histograms show that the data is significantly above both the historical 84th and 95th percentiles. EPA Region III concludes that this evidence shows that the data was influenced by an exceptional event.

8-10
Demonstration of No Exceedance “But For”’ the Event No speciation data is currently available for the days in question; an organic mass apportionment was not possible, because there is no speciation monitor located at the Norfolk Virginia monitoring site. The data requested for exclusion of the 24-hr PM2.5 NAAQS ranged between 36.1µg/m3 and 61.6 µg/m3 in excess of the historical 95th percentile for each monitor in the months of June and July. The monitors were significantly impacted by both fires shown by the NCEP CMAQ Predictive Modeling and Blue Sky Gateway Air Quality Modeling Predictions. This can be viewed in Appendix B of this document. Also included in Appendix C of this document is the NAAPS (Navy Aerosol Analysis and Prediction System) modeling results provided by Neil Frank, USEPA, Office of Air Quality & Planning Standards’ Air Quality Assessment Division. The inclusive evidence indicates that but for the influence of the fires, the Norfolk monitor would have not exceeded the PM2.5 daily NAAQS. Conclusion Based on the technical information provide by the Virginia DEQ, EPA-Region 3 has determined that the data requested for exclusion meets the requirements of the exceptional event rule as specified by 40 CFR §50.14(c)(3)(iii). Therefore, EPA-Region III concurs with the data values flagged as exceptional for Virginia DEQ’s Norfolk, Virginia PM2.5 monitoring site as shown in the table at page 4 above.

8-11
References: U.S. Environmental Protection Agency Region 4. PM2.5 Exceptional Events Technical Support Document 2008. Virginia Department of Environmental Quality Air Division. Exceptional Events Submittal for 2008 Air Monitoring Data 2009.
Blue Sky Gateway Air Quality Modeling Predictionshttp://intranet.epa.gov/r3inaird/VA/BlueSky_EE_Animations.zip

8-12
Appendix A:
June 14, 2008
High pressure off the South Carolina coast brought light southwesterly winds into southeastern Virginia in the morning, backing towards the south later in the day as indicated by the word “High” in the map below (Figures A-1, A-2, and A-3). The southeasterly winds are shown by the NOAA FSL Wind Plot. The wind plots show the wind barbs for the area. Wind barbs can be likened to arrows flying through the air. The wind is flowing in the direction that the “arrow” appears to be flying, and the number of “feathers” indicates the wind speed. One “feather” is approximately 10 knots. Two feathers represent approximately 20 knots. A “half feather” is approximately 5 knots. A “black flag” is approximately 50 knots, and so forth. HYSPLIT back trajectories indicate air flowing directly from the Evans Road and South 1 fire areas into southeastern Virginia (Figure A-4). The smoke plume moving from the South 1 fire towards Norfolk, Chesapeake, and Virginia Beach was particularly evident on visible satellite images (Figure A-5 and Figure A-6). Oceana Navel Air Station (NTU) reported smoke with one mile visibility or less from 7:00 a.m. to 10:00 a.m., with visibility limited to ½ mile in smoke reported from 9:00 a.m. to 10:00 a.m. (Figure A-7). Smoke was also reported from 12:34 p.m. to 3:00 p.m. with 1½ mile visibility from 12:34 p.m. to 1:00 p.m. Additional smoke was reported from 5:00 p.m. to 8:00 p.m. and at 11:00 p.m. with visibility limited to one mile at 7:00 p.m. Norfolk International Airport (ORF), located approximately seven miles from the VDEQ PM2.5 monitor at the National Oceanic and Atmospheric Administration (NOAA) in Norfolk, reported smoke continuously for 13 hours from 7:00 a.m. to 8:00 p.m. with visibility reaching as low as ½ mile due to smoke (Figure A-8). Dulles International Airport (IAD), located five miles from the Ashburn PM2.5 monitor, observed hazy conditions for most of the day, until late afternoon thunderstorms took place. Visibility was as low as two miles due to haze through mid-day (Figure A-9). HYSPLIT back trajectories indicate air flowing directly from the Evans Road and South 1 fire areas into the northern Virginia area. (Figures A-10 and A-11)

8-13
Figure A-1: 6/14/08 U.S. Weather Map

8-14
Figure A-2: 6/14/08 NOAA FSL Wind Plot
Figure A-3: 6/14/08 NOAA FSL Wind Plot

8-15
Figure A-4: 6/14/08 NOAA HYSPLIT Model Output for Hampton Roads
HYSPLIT back trajectories indicate air flowing directly from the Evans Road and South 1 fire areas into southeastern Virginia. The backward trajectories end 12 am June 14, 2008 at the Naval Air Station Oceana and the Norfolk International Airport. This model shows 6 particle trajectories originating at 100, 500 and 1000 meters above ground level and run for a simulation of 36 hours using the EDAS40 meteorological data set.

8-16
Figure A-5: 6/14/08 Satellite Imagery Figure 0-6: 6/14/08 Satellite Imagery with Highway Overlay

8-17
Figure A-7: 6/14/08 NTU Surface Observations
TimeEDT,TemperatureF,Dew PointF,Humidity,Sea Level PressureIn,VisibilityMPH,Wind Direction,Wind SpeedMPH,Gust SpeedMPH,PrecipitationIn,Events,Conditions,FullMetar 12:56 AM,72.0,63.0,73,30.15,7.0,Calm,Calm,-,N/A,,Clear, METAR KNTU 140456Z 00000KT 7SM SKC 22/17 A3014 RMK SLP208 T02220172 402831:56 AM,71.1,62.1,73,30.13,7.0,SSW,3.5,-,N/A,,Clear, METAR KNTU 140556Z 21003KT 7SM SKC 22/17 A3012 RMK SLP203 T02170167 1024420206 58012 2:56 AM,68.0,61.0,78,30.12,7.0,WSW,3.5,-,N/A,,Clear, METAR KNTU 140656Z 24003KT 7SM SKC 20/16 A3011 RMK SLP198 T02000161 3:56 AM,69.1,62.1,78,30.10,7.0,SW,3.5,-,N/A,,Clear, METAR KNTU 140756Z 22003KT 7SM SKC 21/17 A3009 RMK SLP192 T02060167 4:56 AM,68.0,61.0,78,30.10,7.0,SW,5.8,-,N/A,,Clear, METAR KNTU 140856Z 23005KT 7SM SKC 20/16 A3010 RMK SLP193 8/070 T0200016155009 5:25 AM,69.8,60.8,73,30.10,2.0,South,4.6,-,N/A,,Haze, SPECI KNTU 140925Z 19004KT 2SM HZ BKN015 21/16 A3009 RMK SLP192 5:56 AM,66.9,59.0,76,30.10,1.5,SW,3.5,-,N/A,,Mostly Cloudy, METAR KNTU 140956Z 22003KT 1 1/2SM SCT004 BKN009 19/15 A3009 RMK SLP191 T01940150 6:56 AM,69.1,61.0,75,30.09,1.0,Calm,Calm,-,N/A,,Haze, METAR KNTU 141056Z COR 00000KT 1SM HZ BKN004 BKN009 20/16 A3008 RMK SLP19T02060161 7:56 AM,72.0,61.0,68,30.09,1.0,SSW,4.6,-,N/A,,Haze, METAR KNTU 141156Z 20004KT 1SM HZ SCT004 BKN009 22/16 A3008 RMK SLP190 8/T02220161 10222 20183 56003 8:56 AM,75.0,62.1,64,30.09,1.0,WSW,9.2,-,N/A,,Smoke, METAR KNTU 141256Z 24008KT 1SM FU SCT004 BKN009 24/17 A3008 RMK SLP188 T02390167 9:00 AM,75.2,62.6,65,30.09,0.5,WSW,9.2,-,N/A,,Smoke, SPECI KNTU 141300Z 24008KT 1/2SM FU BKN001 BKN009 24/17 A3008 RMK SLP1889:56 AM,80.1,64.0,58,30.07,0.5,WSW,10.4,-,N/A,,Smoke, METAR KNTU 141356Z 25009KT 1/2SM FU BKN001 27/18 A3006 RMK SLP181 T02670110:10 AM,80.6,64.4,58,30.06,1.5,WSW,10.4,-,N/A,,Smoke, SPECI KNTU 141410Z 25009KT 1 1/2SM FU BKN001 27/18 A3006 RMK SLP180 10:40 AM,82.4,62.6,51,30.06,4.0,WSW,10.4,-,N/A,,Smoke, METAR KNTU 141440Z 24009KT 4SM FU BKN001 28/17 A3005 RMK SLP180 10:56 AM,84.0,62.1,47,30.06,4.0,SW,9.2,-,N/A,,Smoke, METAR KNTU 141456Z 23008KT 4SM FU SKC 29/17 A3005 RMK SLP179 T02890167 5811:56 AM,86.0,61.0,43,30.05,7.0,SW,11.5,17.3,N/A,,Clear, METAR KNTU 141556Z 22010G15KT 7SM SKC 30/16 A3004 RMK SLP174 T03000161 12:34 PM,87.8,62.6,43,30.04,1.5,South,10.4,-,N/A,,Smoke, SPECI KNTU 141634Z 19009KT 1 1/2SM FU FEW030 31/17 A3003 RMK SLP171 12:56 PM,87.1,61.0,41,30.03,1.5,SSW,5.8,-,N/A,,Smoke, METAR KNTU 141656Z 20005KT 1 1/2SM FU FEW030 FEW100 31/16 A3002 RMK SLP16T03060161 1:56 PM,87.1,61.0,41,30.00,2.0,South,9.2,-,N/A,,Smoke, METAR KNTU 141756Z 19008KT 2SM FU SCT050 SCT100 31/16 A3000 RMK SLP159 8/T03060161 10317 20222 58019 2:56 PM,87.1,66.0,49,29.99,3.0,SE,12.7,-,N/A,,Smoke, METAR KNTU 141856Z 14011KT 3SM FU FEW050 FEW200 31/19 A2998 RMK SLP153 T03060189 3:19 PM,86.0,66.2,51,29.98,6.0,SE,16.1,23.0,N/A,,Haze, SPECI KNTU 141919Z 14014G20KT 6SM HZ FEW050 FEW200 30/19 A2997 RMK SLP1503:56 PM,87.1,63.0,44,29.97,7.0,SE,17.3,23.0,N/A,,Scattered Clouds,

8-18
METAR KNTU 141956Z 14015G20KT 7SM FEW060 SCT200 31/17 A2996 RMK SLP147 T03060172 4:56 PM,84.9,63.0,48,29.94,4.0,SE,17.3,23.0,N/A,,Smoke, METAR KNTU 142056Z 14015G20KT 4SM FU FEW060 SCT200 29/17 A2993 RMK SLP1398/101 T02940172 58015 5:15 PM,84.2,62.6,48,29.94,2.0,SSE,12.7,-,N/A,,Smoke, METAR KNTU 142115Z 16011KT 2SM FU FEW060 SCT200 29/17 A2993 RMK SLP138 5:56 PM,82.9,64.9,54,29.94,2.0,SSE,13.8,-,N/A,,Smoke, METAR KNTU 142156Z 15012KT 2SM FU SCT200 28/18 A2993 RMK SLP137 T028301836:56 PM,82.9,64.9,54,29.93,1.0,SSE,8.1,17.3,N/A,,Smoke, METAR KNTU 142256Z 16007G15KT 1SM FU SCT100 28/18 A2992 RMK SLP134 T028307:56 PM,82.0,63.0,52,29.93,4.0,South,10.4,18.4,N/A,,Smoke, METAR KNTU 142356Z 19009G16KT 4SM FU SCT200 28/17 A2992 RMK SLP134 8/001 T02780172 10306 20278 55004 8:56 PM,80.1,62.1,54,29.92,7.0,South,10.4,-,N/A,,Scattered Clouds, METAR KNTU 150056Z 19009KT 7SM SCT100 SCT200 27/17 A2991 RMK SLP131 T02679:56 PM,73.0,64.9,76,29.90,7.0,SSE,4.6,-,N/A,,Mostly Cloudy, METAR KNTU 150156Z 15004KT 7SM SCT100 BKN200 23/18 A2989 RMK SLP124 8/078T02280183 10278 20228 58021 10:56 PM,78.1,62.1,58,29.96,5.0,West,13.8,-,N/A,,Smoke, METAR KNTU 150256Z 27012KT 5SM FU BKN200 26/17 A2995 RMK SLP145 8/008 T02560167 53011 11:56 PM,75.0,64.0,69,29.95,7.0,North,6.9,-,N/A,,Mostly Cloudy, METAR KNTU 150356Z 01006KT 7SM BKN200 24/18 A2994 RMK SLP140 T02390178 *Words and acronyms indicating smoke observations as referenced in the above summary have been double underlined, bold faced and colored red. Oceana Navel Air Station is indicated by the acronym KNTU, Norfolk International Airport by KORF, and Dulles International Airport by KIAD. This observation is showing that there is 1 to 1.5 statute mile of visibility throughout the day; the FU indicates that the significant present weather obscuration is smoke. Smoke is a remark made at the end of the data set.

8-19
Figure A-8: 6/14/08 ORF Surface Observations
TimeEDT,TemperatureF,Dew PointF,Humidity,Sea Level PressureIn,VisibilityMPH,Wind Direction,Wind SpeedMPH,Gust SpeedMPH,PrecipitationIn,Events,Conditions,FullMetar 12:51 AM,71.1,66.0,84,30.14,10.0,SSW,5.8,-,N/A,,Clear, METAR KORF 140451Z 20005KT 10SM CLR 22/19 A3014 RMK AO2 SLP206 T02170189 403110200 1:51 AM,70.0,64.9,84,30.13,10.0,SSW,4.6,-,N/A,,Clear, METAR KORF 140551Z AUTO 21004KT 10SM CLR 21/18 A3013 RMK AO2 SLP201 T021110261 20211 58013 TSNO 2:51 AM,70.0,66.0,87,30.12,10.0,South,5.8,-,N/A,,Clear, METAR KORF 140651Z AUTO 19005KT 10SM CLR 21/19 A3012 RMK AO2 SLP197 T0211TSNO 3:51 AM,69.1,64.9,87,30.10,10.0,SW,9.2,-,N/A,,Clear, METAR KORF 140751Z AUTO 23008KT 10SM CLR 21/18 A3010 RMK AO2 SLP191 T0206TSNO 4:31 AM,69.8,64.4,83,30.10,10.0,SW,8.1,-,N/A,,Scattered Clouds, SPECI KORF 140831Z AUTO 22007KT 10SM SCT009 21/18 A3010 RMK AO2 TSNO 4:40 AM,69.8,64.4,83,30.10,9.0,SW,8.1,-,N/A,,Mostly Cloudy, SPECI KORF 140840Z AUTO 22007KT 9SM BKN006 BKN009 21/18 A3010 RMK AO2 CIG005V009 TSNO 4:51 AM,69.1,64.0,84,30.09,4.0,SSW,5.8,-,N/A,,Haze, METAR KORF 140851Z AUTO 21005KT 4SM HZ BKN006 OVC009 21/18 A3009 RMK AO2 004V007 SLP190 T02060178 56011 TSNO 5:21 AM,69.8,62.6,78,30.09,2.0,SW,4.6,-,N/A,,Haze, SPECI KORF 140921Z AUTO 22004KT 2SM HZ OVC006 21/17 A3009 RMK AO2 TSNO 5:29 AM,68.0,62.6,83,30.09,1.8,SW,5.8,-,N/A,,Haze, SPECI KORF 140929Z AUTO 22005KT 1 3/4SM HZ OVC004 20/17 A3009 RMK AO2 CIG003V007 TSNO 5:51 AM,66.9,63.0,87,30.09,1.0,SW,4.6,-,N/A,,Mostly Cloudy, METAR KORF 140951Z AUTO 22004KT 1SM BR BKN004 19/17 A3009 RMK AO2 SLP189 T01940172 TSNO 5:59 AM,68.0,62.6,83,30.09,0.8,SSW,4.6,-,N/A,,Haze, SPECI KORF 140959Z AUTO 21004KT 3/4SM HZ OVC004 20/17 A3009 RMK AO2 TSNO6:51 AM,70.0,63.0,78,30.09,0.5,SW,6.9,-,N/A,,Smoke, METAR KORF 141051Z 22006KT 1/2SM FU BKN004 21/17 A3009 RMK AO2 SLP188 T02110172 7:20 AM,71.6,64.4,78,30.08,0.8,SSW,8.1,-,N/A,,Smoke, SPECI KORF 141120Z 21007KT 3/4SM FU CLR 22/18 A3008 RMK AO2 7:30 AM,73.4,62.6,69,30.09,1.0,SSW,9.2,-,N/A,,Smoke, SPECI KORF 141130Z 21008KT 1SM FU CLR 23/17 A3009 RMK AO2 7:51 AM,73.9,64.0,71,30.09,1.2,SSW,6.9,-,N/A,,Smoke, METAR KORF 141151Z 21006KT 1 1/4SM FU CLR 23/18 A3009 RMK AO2 SLP187 T02330178 10233 20194 57003 8:16 AM,75.2,64.4,69,30.09,2.5,WSW,6.9,-,N/A,,Smoke, SPECI KORF 141216Z 24006KT 2 1/2SM FU CLR 24/18 A3009 RMK AO2 8:24 AM,78.8,64.4,61,30.09,3.0,WSW,4.6,-,N/A,,Smoke, SPECI KORF 141224Z 24004KT 3SM FU CLR 26/18 A3009 RMK AO2 8:51 AM,79.0,66.0,64,30.09,6.0,WSW,10.4,-,N/A,,Smoke, METAR KORF 141251Z 24009KT 6SM FU CLR 26/19 A3009 RMK AO2 SLP187 T02610189:51 AM,82.0,64.9,56,30.06,10.0,West,9.2,-,N/A,,Smoke, METAR KORF 141351Z 28008KT 10SM FU CLR 28/18 A3007 RMK AO2 SLP180 T02780110:51 AM,84.9,62.1,46,30.05,10.0,West,6.9,-,N/A,,Smoke, METAR KORF 141451Z 26006KT 10SM FU CLR 29/17 A3005 RMK AO2 SLP174 T02940158013 11:51 AM,89.1,61.0,39,30.04,10.0,WSW,10.4,-,N/A,,Smoke,

8-20
METAR KORF 141551Z 24009KT 10SM FU CLR 32/16 A3004 RMK AO2 SLP171 T03170112:51 PM,90.0,62.1,39,30.02,10.0,SSW,8.1,-,N/A,,Smoke, METAR KORF 141651Z 20007KT 10SM FU CLR 32/17 A3002 RMK AO2 SLP164 T0322011:51 PM,91.0,62.1,38,30.00,10.0,SW,9.2,-,N/A,,Smoke, METAR KORF 141751Z 23008KT 10SM FU FEW060 33/17 A3000 RMK AO2 SLP157 T03280167 10333 20233 58018 2:51 PM,90.0,62.1,39,29.97,10.0,SW,8.1,-,N/A,,Smoke, METAR KORF 141851Z 23007KT 10SM FU SCT060 32/17 A2997 RMK AO2 SLP148 T03220167 3:51 PM,91.9,62.1,37,29.95,4.0,SSW,10.4,16.1,N/A,,Smoke, METAR KORF 141951Z AUTO 20009G14KT 4SM FU FEW060 33/17 A2995 RMK AO2 SLP1T03330167 TSNO 4:51 PM,91.0,64.0,41,29.92,10.0,South,10.4,-,N/A,,Smoke, METAR KORF 142051Z AUTO 17009KT 10SM FU SCT065 33/18 A2992 RMK AO2 SLP132T03280178 57024 TSNO 5:51 PM,88.0,66.0,48,29.92,5.0,SSE,11.5,-,N/A,,Smoke, METAR KORF 142151Z 16010KT 5SM FU FEW070 31/19 A2992 RMK AO2 SLP130 T03116:18 PM,87.8,66.2,49,29.91,2.5,South,13.8,23.0,N/A,,Smoke, SPECI KORF 142218Z 17012G20KT 2 1/2SM FU FEW090 31/19 A2991 RMK AO2 6:39 PM,84.2,66.2,55,29.91,1.8,South,13.8,20.7,N/A,,Smoke, SPECI KORF 142239Z 17012G18KT 1 3/4SM FU SCT015 29/19 A2991 RMK AO2 6:49 PM,84.2,66.2,55,29.91,1.0,South,11.5,-,N/A,,Smoke, SPECI KORF 142249Z 18010KT 1SM FU BKN010 29/19 A2991 RMK AO2 SFC VIS 1 1/6:51 PM,84.9,66.0,53,29.91,1.0,South,10.4,-,N/A,,Smoke, METAR KORF 142251Z 18009KT 1SM FU BKN010 29/19 A2991 RMK AO2 SFC VIS 1 1/SLP129 T02940189 7:44 PM,82.4,66.2,58,29.92,1.0,South,9.2,-,N/A,,Smoke, SPECI KORF 142344Z 19008KT 1SM FU BKN018 BKN029 28/19 A2992 RMK AO2 SFC V1/4 7:51 PM,82.9,66.0,56,29.92,1.0,South,8.1,-,N/A,,Smoke, METAR KORF 142351Z 18007KT 1SM FU BKN022 BKN029 28/19 A2992 RMK AO2 SFC V1/4 SLP131 T02830189 10344 20283 53000 8:01 PM,82.4,66.2,58,29.91,1.0,South,9.2,-,N/A,,Smoke, SPECI KORF 150001Z 19008KT 1SM FU FEW024 28/19 A2991 RMK AO2 SFC VIS 1 1/8:46 PM,82.4,64.4,54,29.90,10.0,South,12.7,-,N/A,,Clear, SPECI KORF 150046Z 19011KT 10SM CLR 28/18 A2990 RMK AO2 8:51 PM,81.0,64.0,56,29.91,10.0,South,12.7,-,N/A,,Clear, METAR KORF 150051Z 19011KT 10SM CLR 27/18 A2991 RMK AO2 SLP127 T027201789:51 PM,80.1,64.9,60,29.92,6.0,SSW,12.7,-,N/A,,Haze, METAR KORF 150151Z 20011KT 6SM HZ CLR 27/18 A2992 RMK AO2 SLP132 T026701810:51 PM,81.0,64.9,58,29.96,4.0,West,9.2,-,N/A,,Haze, METAR KORF 150251Z 27008KT 4SM HZ FEW041 BKN090 OVC120 27/18 A2996 RMK AOSLP143 T02720183 53018 11:51 PM,75.0,69.1,82,29.94,10.0,North,6.9,-,N/A,,Clear, METAR KORF 150351Z 01006KT 10SM CLR 24/21 A2994 RMK AO2 SLP13T02390206 *Words and acronyms indicating smoke observations as referenced in the above summary have been double underlined, bold faced and colored red. This observation is showing that there is 1 to 1.5 statute mile of visibility throughout the day; The FU indicates that the significant present weather obscuration is smoke. Smoke is a remark made at the end of the data set.
Figure A-9: 6/14/08 IAD Surface Observations
TimeEDT,TemperatureF,Dew PointF,Humidity,Sea Level

8-21
PressureIn,VisibilityMPH,Wind Direction,Wind SpeedMPH,Gust SpeedMPH,PrecipitationIn,Events,Conditions,FullMetar 12:52 AM,75.9,64.0,67,30.10,10.0,South,5.8,-,N/A,,Overcast, METAR KIAD 140452Z 18005KT 10SM FEW100 OVC150 24/18 A3011 RMK AO2 SLP191 T02440178 403060178 1:52 AM,73.9,64.0,71,30.08,10.0,South,6.9,-,N/A,,Overcast, METAR KIAD 140552Z 19006KT 10SM FEW100 OVC150 23/18 A3009 RMK AO2 SLP185 T02330178 10278 20233 58009 2:52 AM,73.9,64.0,71,30.06,10.0,South,6.9,-,N/A,,Mostly Cloudy, METAR KIAD 140652Z 18006KT 10SM FEW100 BKN150 23/18 A3006 RMK AO2 SLP177 T02330178 3:52 AM,72.0,62.1,71,30.03,5.0,South,9.2,-,N/A,,Haze, METAR KIAD 140752Z 19008KT 5SM HZ SCT150 22/17 A3004 RMK AO2 SLP168 T02224:52 AM,72.0,62.1,71,30.02,4.0,SSW,8.1,-,N/A,,Haze, METAR KIAD 140852Z 20007KT 4SM HZ FEW120 BKN200 22/17 A3003 RMK AO2 SLP16T02220167 56019 5:52 AM,70.0,62.1,76,30.02,3.0,South,6.9,-,N/A,,Haze, METAR KIAD 140952Z 18006KT 3SM HZ FEW140 SCT200 21/17 A3003 RMK AO2 SLP16T02110167 6:02 AM,69.8,62.6,78,30.03,2.0,South,5.8,-,N/A,,Haze, SPECI KIAD 141002Z 18005KT 2SM HZ FEW140 SCT200 21/17 A3003 RMK AO2 SFC V1/2 6:52 AM,71.1,62.1,73,30.02,2.0,South,8.1,-,N/A,,Haze, METAR KIAD 141052Z 19007KT 2SM HZ FEW100 SCT150 BKN250 22/17 A3003 RMK AOSFC VIS 2.5 SLP166 T02170167 7:52 AM,72.0,62.1,71,30.02,2.0,South,8.1,-,N/A,,Haze, METAR KIAD 141152Z 19007KT 2SM HZ CLR 22/17 A3002 RMK AO2 SLP164 T022201610233 20211 58003 8:52 AM,75.9,63.0,64,30.03,2.0,SW,5.8,-,N/A,,Haze, METAR KIAD 141252Z 23005KT 2SM HZ SCT080 BKN110 24/17 A3003 RMK AO2 SLP16T02440172 9:52 AM,77.0,64.0,64,30.03,2.0,SSW,3.5,-,N/A,,Haze, METAR KIAD 141352Z 20003KT 2SM HZ SCT085 OVC120 25/18 A3003 RMK AO2 SLP16T02500178 10:52 AM,80.1,64.9,60,30.01,2.0,Calm,Calm,-,N/A,,Haze, METAR KIAD 141452Z 00000KT 2SM HZ SCT085 BKN095 BKN110 27/18 A3002 RMK AOSLP160 T02670183 58003 11:52 AM,84.0,66.9,56,29.99,2.5,Variable,3.5,-,N/A,,Haze, METAR KIAD 141552Z VRB03KT 2 1/2SM HZ BKN090 29/19 A3000 RMK AO2 SFC VIS SLP156 T02890194 12:52 PM,86.0,66.0,51,29.98,2.5,Calm,Calm,-,N/A,,Haze, METAR KIAD 141652Z 00000KT 2 1/2SM HZ FEW075 SCT095 30/19 A2999 RMK AO2 SVIS 3 SLP150 T03000189 12:59 PM,86.0,66.2,51,29.98,3.0,Calm,Calm,-,N/A,,Haze, SPECI KIAD 141659Z COR 00000KT 3SM HZ FEW075 SCT095 30/19 A2998 RMK AO2 1:52 PM,87.1,68.0,53,29.95,4.0,Variable,3.5,-,N/A,,Haze, METAR KIAD 141752Z VRB03KT 4SM HZ BKN045 BKN090 31/20 A2996 RMK AO2 SLP14T03060200 10306 20228 58020 2:52 PM,86.0,66.9,53,29.93,5.0,SW,4.6,-,N/A,,Haze, METAR KIAD 141852Z 23004KT 5SM HZ SCT050 BKN070 BKN095 BKN200 30/19 A2994AO2 SLP135 T03000194 3:09 PM,80.6,66.2,61,29.97,5.0,WNW,20.7,40.3,N/A,,Haze, SPECI KIAD 141909Z COR 29018G35KT 5SM HZ BKN050CB BKN075 BKN090 BKN200 27A2997 RMK AO2 OCNL LTG W PK WND 30035/1906 PRESRR 3:17 PM,75.2,64.4,69,29.97,4.0,WNW,28.8,43.7,N/A,Thunderstorm,Unknown, SPECI KIAD 141917Z 29025G38KT 4SM TS HZ BKN035CB BKN050 OVC200 24/18 A299RMK AO2 PK WND 29038/1916 TSB17 OCNL LTGICCG W-N

8-22
3:48 PM,69.8,66.2,88,29.98,1.0,NNW,16.1,-,0.11,Rain-Thunderstorm,Light Thunderstorms and Rain, SPECI KIAD 141948Z 33014KT 1SM R01R/2800VP6000FT -TSRA SCT009 OVC060 21/1A2998 RMK AO2 PK WND 29038/1916 TSB17RAB18 CIG 019 WEST OCNL LTGICCG W-N P0011 3:50 PM,69.8,66.2,88,29.98,0.8,NNW,17.3,-,0.16,Rain-Thunderstorm,Light Thunderstorms and Rain, SPECI KIAD 141950Z 33015KT 3/4SM R01R/2800V5500FT -TSRA BKN009 OVC060 21/A2998 RMK AO2 PK WND 29038/1916 TSB17RAB18 OCNL LTGICCG W-N P0016 3:52 PM,69.1,66.9,93,29.97,0.8,NNW,13.8,23.0,0.21,Rain-Thunderstorm,LightThunderstorms and Rain, METAR KIAD 141952Z 33012G20KT 3/4SM R01R/2800VP6000FT -TSRA BKN009CB OVC021/19 A2997 RMK AO2 PK WND 29038/1916 TSB17RAB18 SLP147 OCNL LTGICCG W-N P0021 T02060194 3:55 PM,69.8,66.2,88,29.97,1.0,NNW,12.7,23.0,0.05,Rain-Thunderstorm,LightThunderstorms and Rain, SPECI KIAD 141955Z 34011G20KT 1SM R01R/3500VP6000FT -TSRA BKN011 BKN032 OVC060 21/19 A2997 RMK AO2 P0005 3:57 PM,69.8,66.2,88,29.97,1.5,NNW,13.8,23.0,0.05,Rain-Thunderstorm,LightThunderstorms and Rain, SPECI KIAD 141957Z 34012G20KT 1 1/2SM R01R/4500VP6000FT -TSRA BKN009CB BKOVC060 21/19 A2997 RMK AO2 P0005 4:00 PM,69.8,66.2,88,29.98,4.0,NNW,10.4,-,0.06,Rain-Thunderstorm,Light Thunderstorms and Rain, SPECI KIAD 142000Z 33009KT 4SM R01R/6000VP6000FT -TSRA BKN011CB BKN032 OV21/19 A2998 RMK AO2 P0006 4:09 PM,71.6,66.2,83,29.98,10.0,NNW,5.8,-,0.06,Rain,Light Rain, SPECI KIAD 142009Z 33005KT 10SM -RA BKN011 BKN032 OVC060 22/19 A2998 RMK TSE03 P0006 4:32 PM,69.8,66.2,88,29.96,9.0,SE,8.1,-,0.07,Rain-Thunderstorm,Light Thunderstorms and Rain, SPECI KIAD 142032Z 13007KT 9SM -TSRA BKN011 BKN032CB OVC060 21/19 A2996 RAO2 TSE03B30 PRESFR OCNL LTGICCC TS SE MOV NE P0007 4:52 PM,70.0,68.0,93,29.94,10.0,Calm,Calm,-,0.07,Rain-Thunderstorm,Light Thunderstorms and Rain, METAR KIAD 142052Z 00000KT 10SM -TSRA BKN011 BKN032CB OVC060 21/20 A2995 AO2 TSE03B30 SLP139 OCNL LTGICCC TS E MOV NE P0007 60028 T02110200 580024:59 PM,69.8,68.0,94,29.94,10.0,Calm,Calm,-,0.00,Rain,Light Rain, SPECI KIAD 142059Z 00000KT 10SM VCTS -RA FEW034 SCT044 BKN110 21/20 A2994AO2 P0000 5:52 PM,71.1,68.0,90,29.95,10.0,West,11.5,-,0.01,Rain,Light Rain, METAR KIAD 142152Z 28010KT 10SM -RA FEW015 SCT044 BKN110 OVC150 22/20 A29RMK AO2 TSE49 SLP140 P0001 T02170200 6:52 PM,70.0,68.0,93,29.96,3.0,West,5.8,-,0.03,Rain,Light Rain, METAR KIAD 142252Z 26005KT 3SM -RA FEW023 OVC055 21/20 A2996 RMK AO2 SLP1VIS N 2 CIG039 W P0003 T02110200 6:58 PM,69.8,68.0,94,29.96,3.0,West,4.6,-,0.02,Rain,Light Rain, SPECI KIAD 142258Z 26004KT 3SM -RA BKN021 OVC055 21/20 A2996 RMK AO2 SFC 21/2 CIG033 W P0002 7:52 PM,70.0,66.9,90,29.95,6.0,West,3.5,-,0.08,Rain,Light Rain, METAR KIAD 142352Z 28003KT 6SM -RA BR FEW017 SCT039 BKN110 OVC150 21/19 ARMK AO2 SLP141 P0008 60040 T02110194 10311 20206 50002 $ 8:52 PM,69.1,66.9,93,29.92,10.0,West,4.6,-,0.01,Rain,Light Rain, METAR KIAD 150052Z 26004KT 10SM -RA SCT150 BKN200 21/19 A2993 RMK AO2 RAE33B51 SLP132 P0001 T02060194 $ 9:52 PM,69.1,66.9,93,29.92,10.0,Calm,Calm,-,0.00,,Mostly Cloudy, METAR KIAD 150152Z 00000KT 10SM SCT150 BKN200 21/19 A2992 RMK AO2 RAE49

8-23
SLP130 P0000 T02060194 $ 10:52 PM,68.0,66.9,96,29.91,9.0,South,4.6,-,N/A,,Mostly Cloudy, METAR KIAD 150252Z 17004KT 9SM BKN150 20/19 A2991 RMK AO2 SLP127 60001 T02000194 56014 $ 11:48 PM,69.8,66.2,88,29.93,7.0,Calm,Calm,-,N/A,,Mostly Cloudy, SPECI KIAD 150348Z 00000KT 7SM FEW008 BKN100 21/19 A2993 RMK AO2 $ 11:52 PM,69.1,66.9,93,29.92,7.0,Calm,Calm,-,N/A,,Mostly Cloudy, METAR KIAD 150352Z 00000KT 7SM FEW008 BKN100 21/19 A2993 RMK AO2 SLP132 T02060194 $ *Words and acronyms indicating haze observations as referenced in the above summary have been double underlined, bold faced and colored red. This observation is showing that there is 1 to 2 statute mile of visibility throughout the day; The HZ indicates that the significant present weather obscuration is haze. Haze is a remark made at the end of the data set.
8-24
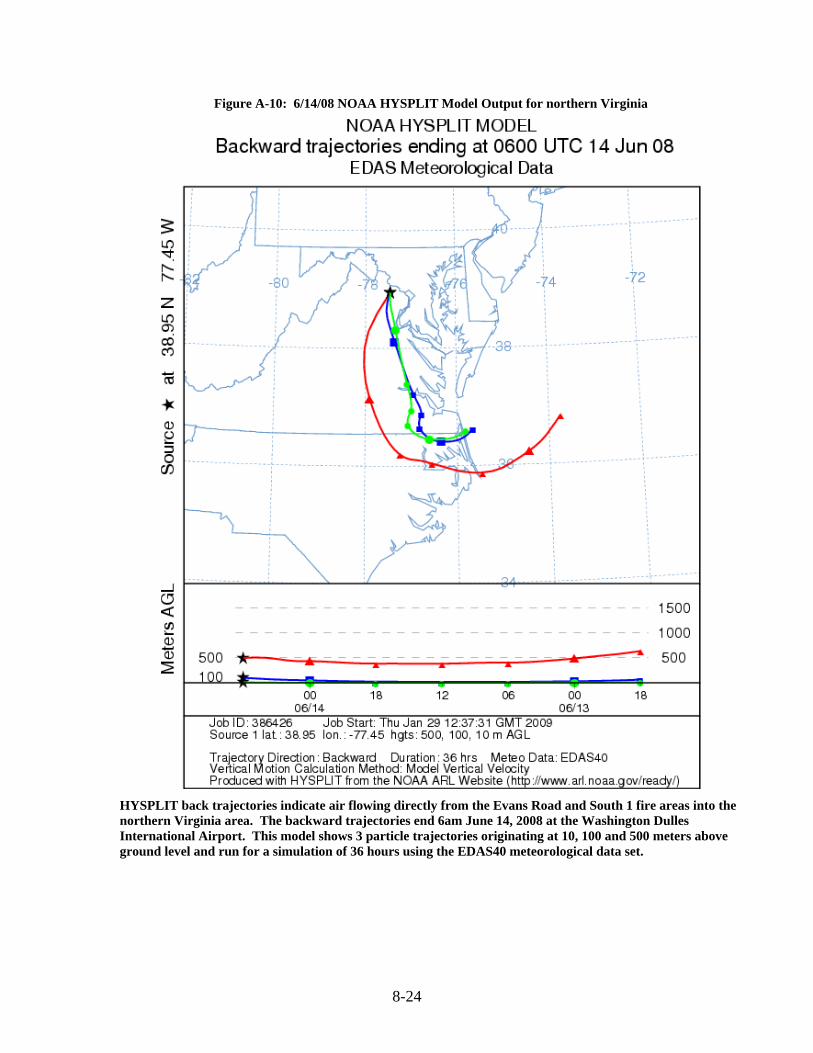
Figure A-10: 6/14/08 NOAA HYSPLIT Model Output for northern Virginia
HYSPLIT back trajectories indicate air flowing directly from the Evans Road and South 1 fire areas into the northern Virginia area. The backward trajectories end 6am June 14, 2008 at the Washington Dulles International Airport. This model shows 3 particle trajectories originating at 10, 100 and 500 meters above ground level and run for a simulation of 36 hours using the EDAS40 meteorological data set.
8-25
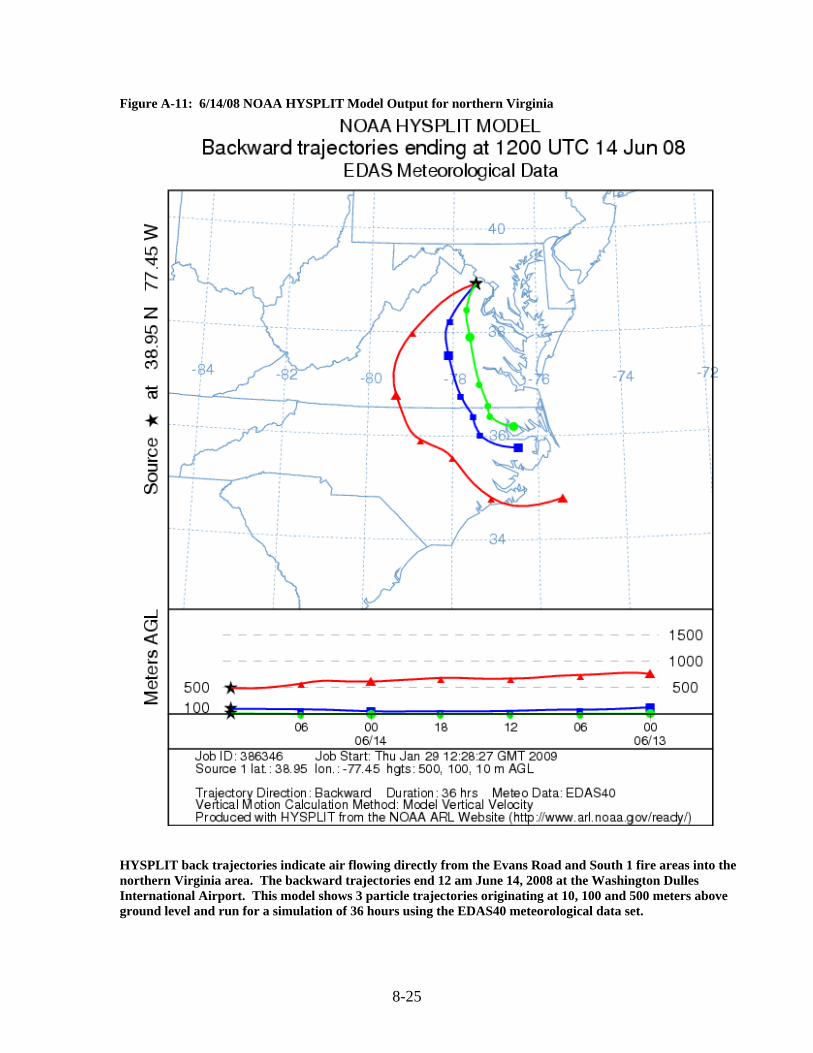
Figure A-11: 6/14/08 NOAA HYSPLIT Model Output for northern Virginia
HYSPLIT back trajectories indicate air flowing directly from the Evans Road and South 1 fire areas into the northern Virginia area. The backward trajectories end 12 am June 14, 2008 at the Washington Dulles International Airport. This model shows 3 particle trajectories originating at 10, 100 and 500 meters above ground level and run for a simulation of 36 hours using the EDAS40 meteorological data set.

8-26
Chapter I: June 17, 2008
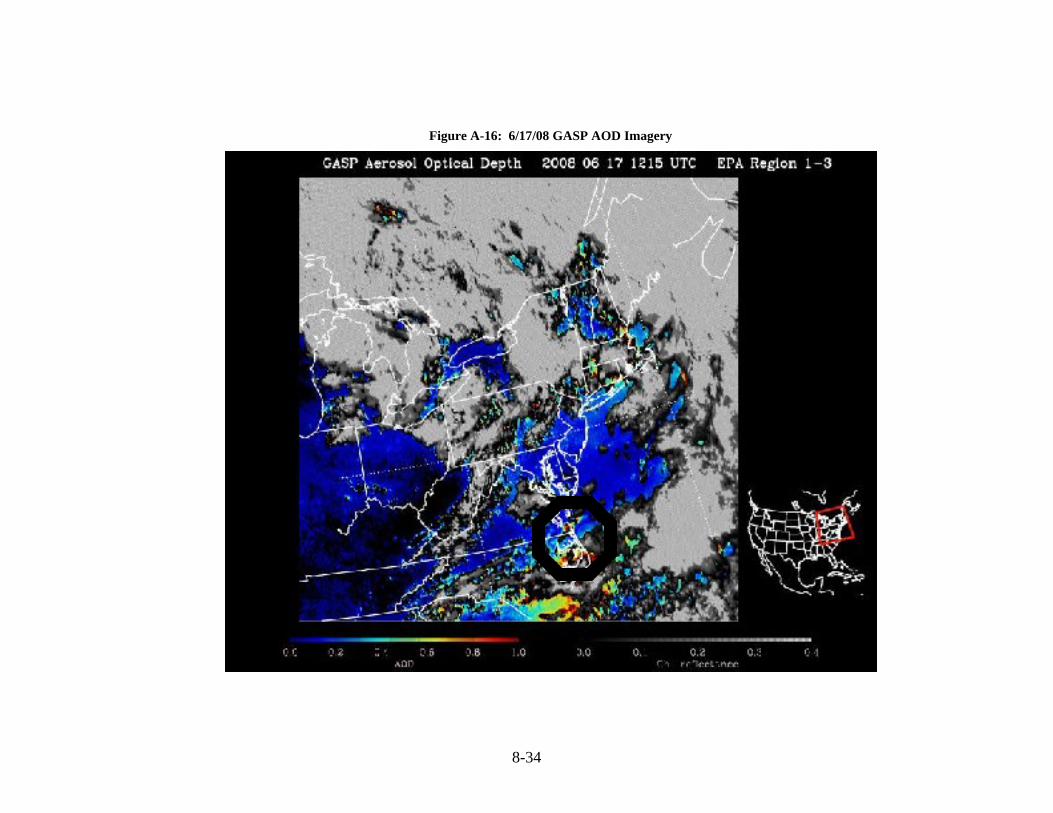
The cold front that was moving through the Ohio Valley on the 16th was in southeastern Virginia on the morning of the 17th (Figure A-12). NTU and ORF surface observations along with HYSPLIT back trajectories indicate winds were from the south-southwest to west-southwest during the morning hours, with air flowing from the South 1 fire area into southeastern Virginia (Figures A-13, A-14, and A-15). NTU reported smoke from 7:40 a.m. until 10:09 a.m., with visibility as low as ¼ mile. ORF reported smoke from 12:27 a.m. until 9:00 a.m., with visibility as low as ¾ mile. GOES Eat Aerosol/Smoke Product (GASP) Aerosol Optical Depth (AOD) image from 1215 UTC (8:15 a.m.) shows an elevated area of AOD (indicated in red, orange and yellow) extending from the South 1 fire northeastward towards Chesapeake and Virginia Beach, Virginia (Figure A-16). AOD is the degree to which aerosols prevent the transmission of light. The AOD is defined as the integrated extinction coefficient over a vertical column of unit cross section. Satellite measured AOD has been shown to be a good proxy for pollution monitoring. .

8-27
Figure A-12: 6/17/08 U.S. Weather Map

8-28
Figure A-13: 6/17/08 NTU Surface Observations
TimeEDT,TemperatureF,Dew PointF,Humidity,Sea Level PressureIn,VisibilityMPH,Wind Direction,Wind SpeedMPH,Gust SpeedMPH,PrecipitationIn,Events,Conditions,FullMetar 12:40 AM,68.0,60.8,78,29.89,2.0,NNW,18.4,36.8,N/A,Rain-Thunderstorm,HeavyThunderstorms and Rain, SPECI KNTU 170440Z 34016G32KT 2SM +TSRA SCT005 BKN035 20/16 A2989 RMK LTGCCICCG TS NW MOV NE SLP120 12:56 AM,64.9,59.0,81,29.88,2.0,NNE,15.0,-,0.42,Rain-Thunderstorm,Heavy Thunderstorms and Rain, METAR KNTU 170456Z 02013KT 2SM +TSRA SCT005 SCT015 BKN035 18/15 A2987 RMKLTGCCICCG OCNL TS NW MOV NE SLP116 P0042 T01830150 403280183 1:20 AM,66.2,60.8,83,29.84,6.0,NNE,11.5,-,N/A,Rain-Thunderstorm,Light Thunderstorms and Rain, SPECI KNTU 170520Z 03010KT 6SM -TSRA SCT015 BKN035 OVC100 19/16 A2983 RMKN MOV NE SLP104 1:56 AM,66.0,60.1,81,29.84,4.0,NNW,11.5,-,0.16,Rain-Thunderstorm,Thunderstorms and Rain, METAR KNTU 170556Z 33010KT 4SM TSRA SCT015 BKN035 OVC100 19/16 A2984 RMK NW MOV N T1 SET SLP104 P0016 60058 8/82/ T01890156 10278 20183 50006 2:56AM,66.0,60.1,81,29.82,7.0,Calm,Calm,,0.46,Thunderstorm,Thunderstorm,METAR KNTU 170656Z 00000KT 7SM TS SCT035 BKN100 19/16 A2982 RMK TS NE MOVT1 SET SLP098 P0046 T01890156 3:30 AM,66.2,60.8,83,29.42,7.0,South,8.1,-,N/A,,Mostly Cloudy, SPECI KNTU 170730Z 18007KT 7SM SCT035 BKN100 19/16 A2981 RMK TS MOVD S T1SLP960 3:56 AM,66.0,61.0,84,29.81,7.0,SSW,4.6,-,N/A,,Mostly Cloudy, METAR KNTU 170756Z 20004KT 7SM BKN100 19/16 A2980 RMK SLP094 T2 SET T01894:56 AM,66.9,61.0,81,29.80,7.0,SW,5.8,-,N/A,,Mostly Cloudy, METAR KNTU 170856Z 22005KT 7SM BKN100 19/16 A2979 RMK SLP091 60046 8/070 T01940161 56017 5:56 AM,66.0,61.0,84,29.81,6.0,WSW,5.8,-,N/A,,Mostly Cloudy, METAR KNTU 170956Z 24005KT 6SM BR BKN100 19/16 A2980 RMK SLP092 T018901616:56 AM,66.9,62.1,84,29.81,7.0,West,5.8,-,N/A,,Scattered Clouds, METAR KNTU 171056Z 26005KT 7SM SCT100 19/17 A2979 RMK SLP092 T01940167 7:40 AM,66.2,62.6,88,29.80,2.0,WSW,5.8,-,N/A,,Smoke, SPECI KNTU 171140Z 25005KT 2SM FU SCT100 19/17 A2979 RMK SLP090 7:56 AM,70.0,63.0,78,29.81,0.2,WSW,8.1,-,N/A,,Smoke, METAR KNTU 171156Z 24007KT 1/4SM FU VV001 21/17 A2980 RMK SLP092 60046 70T02110172 10211 20189 51001 8:26 AM,69.8,62.6,78,29.81,0.5,West,9.2,-,N/A,,Smoke, SPECI KNTU 171226Z 27008KT 1/2SM FU SCT100 21/17 A2980 RMK SLP094 8:56 AM,73.0,63.0,71,29.81,0.8,WNW,8.1,-,N/A,,Smoke, METAR KNTU 171256Z 29007KT 3/4SM FU FEW100 SCT200 23/17 A2980 RMK SLP093 T02280172 9:15 AM,73.4,62.6,69,29.81,1.0,WNW,8.1,-,N/A,,Smoke, SPECI KNTU 171315Z 29007KT 1SM FU FEW100 SCT200 23/17 A2980 RMK SLP094 9:56 AM,77.0,64.0,64,29.82,1.5,West,5.8,-,N/A,,Smoke, METAR KNTU 171356Z 27005KT 1 1/2SM FU SCT120 SCT200 25/18 A2981 RMK SLP09T02500178 10:09 AM,75.2,62.6,65,29.82,4.0,WNW,8.1,-,N/A,,Smoke, SPECI KNTU 171409Z 29007KT 4SM FU SCT120 SCT200 24/17 A2981 RMK SLP096 10:25 AM,75.2,62.6,65,29.81,7.0,West,5.8,-,N/A,,Scattered Clouds, SPECI KNTU 171425Z 28005KT 7SM SCT120 SCT200 24/17 A2981 RMK SLP095 10:56 AM,79.0,62.1,56,29.81,7.0,Variable,4.6,-,N/A,,Mostly Cloudy, METAR KNTU 171456Z VRB04KT 7SM SCT120 BKN200 26/17 A2981 RMK SLP095 T0261
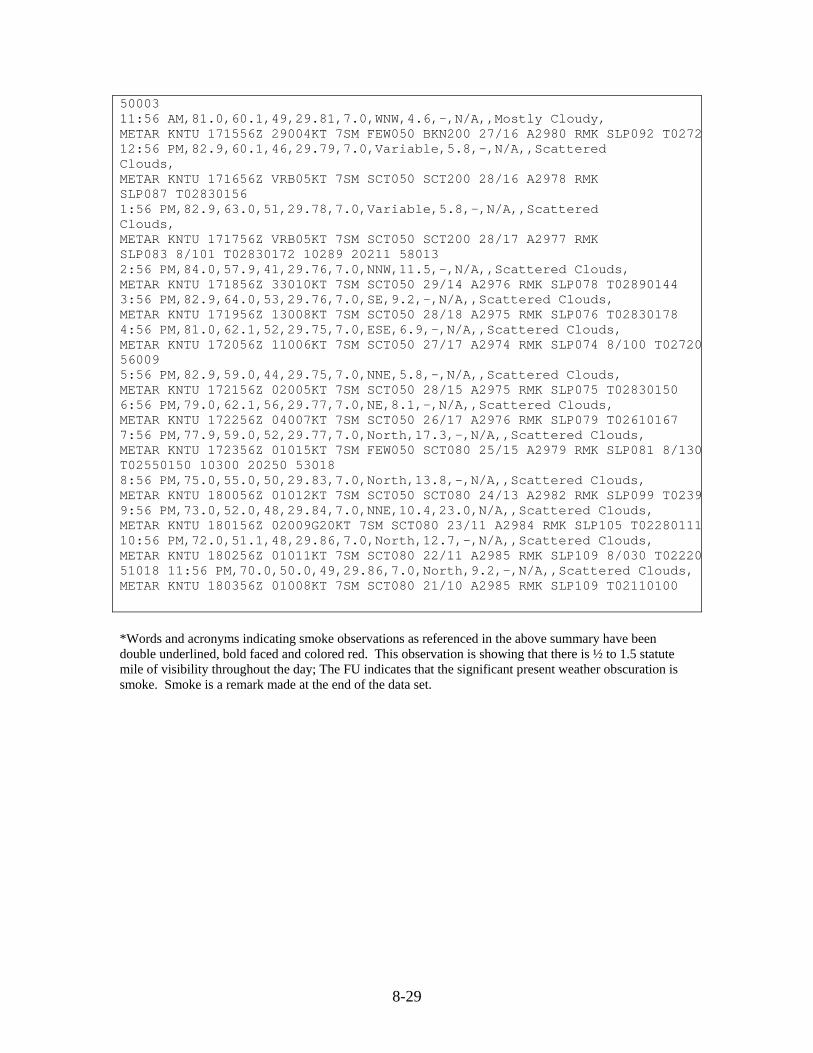
8-29
50003 11:56 AM,81.0,60.1,49,29.81,7.0,WNW,4.6,-,N/A,,Mostly Cloudy, METAR KNTU 171556Z 29004KT 7SM FEW050 BKN200 27/16 A2980 RMK SLP092 T027212:56 PM,82.9,60.1,46,29.79,7.0,Variable,5.8,-,N/A,,Scattered Clouds, METAR KNTU 171656Z VRB05KT 7SM SCT050 SCT200 28/16 A2978 RMK SLP087 T02830156 1:56 PM,82.9,63.0,51,29.78,7.0,Variable,5.8,-,N/A,,Scattered Clouds, METAR KNTU 171756Z VRB05KT 7SM SCT050 SCT200 28/17 A2977 RMK SLP083 8/101 T02830172 10289 20211 58013 2:56 PM,84.0,57.9,41,29.76,7.0,NNW,11.5,-,N/A,,Scattered Clouds, METAR KNTU 171856Z 33010KT 7SM SCT050 29/14 A2976 RMK SLP078 T02890144 3:56 PM,82.9,64.0,53,29.76,7.0,SE,9.2,-,N/A,,Scattered Clouds, METAR KNTU 171956Z 13008KT 7SM SCT050 28/18 A2975 RMK SLP076 T02830178 4:56 PM,81.0,62.1,52,29.75,7.0,ESE,6.9,-,N/A,,Scattered Clouds, METAR KNTU 172056Z 11006KT 7SM SCT050 27/17 A2974 RMK SLP074 8/100 T0272056009 5:56 PM,82.9,59.0,44,29.75,7.0,NNE,5.8,-,N/A,,Scattered Clouds, METAR KNTU 172156Z 02005KT 7SM SCT050 28/15 A2975 RMK SLP075 T02830150 6:56 PM,79.0,62.1,56,29.77,7.0,NE,8.1,-,N/A,,Scattered Clouds, METAR KNTU 172256Z 04007KT 7SM SCT050 26/17 A2976 RMK SLP079 T02610167 7:56 PM,77.9,59.0,52,29.77,7.0,North,17.3,-,N/A,,Scattered Clouds, METAR KNTU 172356Z 01015KT 7SM FEW050 SCT080 25/15 A2979 RMK SLP081 8/130T02550150 10300 20250 53018 8:56 PM,75.0,55.0,50,29.83,7.0,North,13.8,-,N/A,,Scattered Clouds, METAR KNTU 180056Z 01012KT 7SM SCT050 SCT080 24/13 A2982 RMK SLP099 T02399:56 PM,73.0,52.0,48,29.84,7.0,NNE,10.4,23.0,N/A,,Scattered Clouds, METAR KNTU 180156Z 02009G20KT 7SM SCT080 23/11 A2984 RMK SLP105 T0228011110:56 PM,72.0,51.1,48,29.86,7.0,North,12.7,-,N/A,,Scattered Clouds, METAR KNTU 180256Z 01011KT 7SM SCT080 22/11 A2985 RMK SLP109 8/030 T0222051018 11:56 PM,70.0,50.0,49,29.86,7.0,North,9.2,-,N/A,,Scattered Clouds,METAR KNTU 180356Z 01008KT 7SM SCT080 21/10 A2985 RMK SLP109 T02110100 *Words and acronyms indicating smoke observations as referenced in the above summary have been double underlined, bold faced and colored red. This observation is showing that there is ½ to 1.5 statute mile of visibility throughout the day; The FU indicates that the significant present weather obscuration is smoke. Smoke is a remark made at the end of the data set.

8-30
Figure A-14: 6/17/08 ORF Surface Observations
TimeEDT,TemperatureF,Dew PointF,Humidity,Sea Level PressureIn,VisibilityMPH,Wind Direction,Wind SpeedMPH,Gust SpeedMPH,PrecipitationIn,Events,Conditions,FullMetar 12:27 AM,71.6,66.2,83,29.93,2.5,NW,16.1,28.8,0.02,Rain,Heavy Rain, SPECI KORF 170427Z AUTO 32014G25KT 2 1/2SM +RA BR FU FEW005 SCT018 BKN07522/19 A2993 RMK AO2 RAB23 PRESRR P0002 TSNO 12:33 AM,66.2,66.2,100,29.90,1.5,North,9.2,24.2,0.28,Rain,Heavy Rain, SPECI KORF 170433Z AUTO 01008G21KT 1 1/2SM +RA BR FU SCT006 BKN018 BKN075 19/19 A2990 RMK AO2 RAB23 P0028 TSNO $ 12:37 AM,66.2,66.2,100,29.89,2.0,Calm,Calm,-,0.36,Rain,Heavy Rain, SPECI KORF 170437Z AUTO 00000KT 2SM +RA BR FU BKN016 BKN075 BKN095 19/19 A2989 RMK AO2 RAB23 P0036 TSNO $ 12:43 AM,66.2,66.2,100,29.87,5.0,ENE,4.6,-,0.40,Rain,Rain, SPECI KORF 170443Z AUTO 06004KT 5SM RA BR FU FEW018 BKN030 OVC075 19/19 ARMK AO2 RAB23 P0040 TSNO $ 12:51 AM,66.9,-9999,N/A,29.86,9.0,SE,3.5,-,0.40,Rain,Rain, METAR KORF 170451Z AUTO 13003KT 9SM RA FU FEW020 BKN033 OVC100 19/ A2986 AO2 RAB23 SLP111 P0040 T0194 403390189 TSNO $ 1:51 AM,66.9,-9999,N/A,29.85,10.0,NNE,10.4,-,0.09,Rain,Light Rain, METAR KORF 170551Z AUTO 03009KT 10SM -RA FU FEW019 BKN070 OVC080 19/ A298RMK AO2 SLP108 P0009 60049 T0194 10289 20189 50007 TSNO $ 2:01 AM,66.2,-9999,N/A,29.86,2.5,South,9.2,-,0.09,Rain,Heavy Rain, SPECI KORF 170601Z AUTO 18008KT 120V250 2 1/2SM +RA FU BKN015 BKN065 OVC019/ A2986 RMK AO2 VIS 1 3/4V4 P0009 TSNO $ 2:06 AM,66.2,-9999,N/A,29.83,3.0,SSE,11.5,-,0.16,Rain,Rain, SPECI KORF 170606Z AUTO 16010KT 3SM RA FU FEW016 BKN033 OVC080 19/ A2983 AO2 P0016 TSNO $ 2:51 AM,66.0,-9999,N/A,29.83,10.0,SSW,9.2,-,0.16,,Smoke, METAR KORF 170651Z AUTO 21008KT 10SM FU CLR 19/ A2982 RMK AO2 RAE21 SLP09P0016 T0189 TSNO $ 3:51 AM,66.0,-9999,N/A,29.80,10.0,SSW,9.2,-,N/A,,Smoke, METAR KORF 170751Z AUTO 20008KT 10SM FU FEW110 19/ A2980 RMK AO2 SLP091 TTSNO $ 4:51 AM,66.0,-9999,N/A,29.80,10.0,SSW,6.9,-,N/A,,Smoke, METAR KORF 170851Z AUTO 21006KT 10SM FU SCT100 19/ A2980 RMK AO2 SLP091 6T0189 56018 TSNO $ 5:51 AM,66.0,66.0,100,29.80,4.0,SW,6.9,-,N/A,,Partly Cloudy, METAR KORF 170951Z AUTO 23006KT 4SM BR FU FEW095 19/19 A2980 RMK AO2 SLP0T01890189 TSNO $ 6:13 AM,66.2,64.4,94,29.80,2.0,WSW,5.8,-,N/A,,Scattered Clouds, SPECI KORF 171013Z 24005KT 2SM BR FU FEW006 SCT110 19/18 A2980 RMK AO2 $6:23 AM,66.2,64.4,94,29.80,1.8,WSW,6.9,-,N/A,,Mostly Cloudy, SPECI KORF 171023Z 24006KT 1 3/4SM BR FU SCT006 BKN090 BKN110 19/18 A2980AO2 $ 6:31 AM,66.2,64.4,94,29.80,1.5,SW,5.8,-,N/A,,Mostly Cloudy, SPECI KORF 171031Z 23005KT 1 1/2SM BR FU BKN006 BKN090 BKN110 19/18 A2980AO2 $ 6:47 AM,68.0,66.2,94,29.80,1.0,WSW,6.9,-,N/A,,Overcast, SPECI KORF 171047Z 25006KT 1SM BR FU BKN004 OVC095 20/19 A2980 RMK AO2 $6:51 AM,68.0,66.0,93,29.81,0.8,WSW,5.8,-,N/A,,Overcast, METAR KORF 171051Z 25005KT 3/4SM BR FU BKN004 OVC095 20/19 A2980 RMK AO2 SLP092 T02000189 $ 7:31 AM,69.8,66.2,88,29.80,1.0,WSW,8.1,-,N/A,,Mist, SPECI KORF 171131Z 25007KT 1SM BR FU VV005 21/19 A2980 RMK AO2

8-31
7:40 AM,69.8,66.2,88,29.79,0.8,WSW,8.1,-,N/A,,Mist, SPECI KORF 171140Z 25007KT 3/4SM BR FU VV004 21/19 A2979 RMK AO2 7:51 AM,70.0,66.0,87,29.80,0.8,Variable,6.9,-,N/A,,Mist, METAR KORF 171151Z VRB06KT 3/4SM BR FU VV004 21/19 A2980 RMK AO2 SLP089 670065 T02110189 10211 20183 58002 8:20 AM,71.6,66.2,83,29.81,1.0,West,5.8,-,N/A,,Overcast, SPECI KORF 171220Z 26005KT 1SM BR FU OVC006 22/19 A2981 RMK AO2 CIG 003V08:36 AM,71.6,66.2,83,29.81,2.0,West,5.8,-,N/A,,Scattered Clouds, SPECI KORF 171236Z 27005KT 2SM BR FU SCT006 22/19 A2981 RMK AO2 8:47 AM,71.6,66.2,83,29.80,5.0,West,5.8,-,N/A,,Haze, SPECI KORF 171247Z 28005KT 5SM HZ FU FEW006 22/19 A2980 RMK AO2 8:51 AM,72.0,66.9,84,29.81,6.0,WNW,5.8,-,N/A,,Haze, METAR KORF 171251Z 29005KT 6SM HZ FU CLR 22/19 A2981 RMK AO2 SLP093 T02229:51 AM,75.9,64.9,69,29.81,10.0,WNW,5.8,-,N/A,,Clear, METAR KORF 171351Z 29005KT 10SM CLR 24/18 A2981 RMK AO2 SLP095 T0244018310:51 AM,79.0,63.0,58,29.81,10.0,Variable,3.5,-,N/A,,Clear, METAR KORF 171451Z VRB03KT 10SM CLR 26/17 A2981 RMK AO2 SLP093 T02610172 50001 11:51 AM,81.0,64.9,58,29.80,10.0,NW,3.5,-,N/A,,Scattered Clouds, METAR KORF 171551Z 31003KT 10SM SCT035 27/18 A2980 RMK AO2 SLP090 T02720112:51 PM,82.9,62.1,49,29.79,10.0,NW,8.1,-,N/A,,Clear, METAR KORF 171651Z 32007KT 10SM CLR 28/17 A2979 RMK AO2 SLP087 T028301671:51 PM,84.0,64.9,53,29.77,10.0,NE,5.8,-,N/A,,Clear, METAR KORF 171751Z 04005KT 10SM CLR 29/18 A2977 RMK AO2 SLP081 T02890183 10294 20211 58012 2:51 PM,82.9,64.9,54,29.76,10.0,NE,12.7,-,N/A,,Partly Cloudy, METAR KORF 171851Z 05011KT 10SM FEW055 28/18 A2976 RMK AO2 SLP078 T0283013:51 PM,84.0,64.0,51,29.75,10.0,NE,10.4,-,N/A,,Mostly Cloudy, METAR KORF 171951Z 05009KT 10SM BKN060 BKN075 29/18 A2975 RMK AO2 SLP075 T02890178 4:51 PM,82.0,66.0,58,29.75,10.0,NE,9.2,-,N/A,,Clear, METAR KORF 172051Z 04008KT 10SM CLR 28/19 A2975 RMK AO2 SLP073 T02780189 56008 5:51 PM,82.0,62.1,51,29.75,10.0,NNE,8.1,-,N/A,,Clear, METAR KORF 172151Z AUTO 02007KT 10SM CLR 28/17 A2975 RMK AO2 SLP074 T0278TSNO 6:51 PM,79.0,63.0,58,29.77,10.0,NNE,12.7,-,N/A,,Scattered Clouds, METAR KORF 172251Z AUTO 02011KT 10SM SCT090 26/17 A2977 RMK AO2 SLP079 T02610172 TSNO 7:51 PM,75.9,61.0,60,29.80,10.0,NNE,19.6,26.5,N/A,,Scattered Clouds, METAR KORF 172351Z AUTO 03017G23KT 10SM FEW080 SCT100 24/16 A2980 RMK AO2 SLP089 T02440161 10294 20244 53016 TSNO 8:51 PM,75.9,57.9,54,29.82,10.0,North,12.7,-,N/A,,Scattered Clouds, METAR KORF 180051Z AUTO 01011KT 10SM FEW075 SCT085 24/14 A2982 RMK AO2 SLT02440144 TSNO 9:51 PM,75.0,55.9,51,29.84,10.0,NNE,15.0,23.0,N/A,,Overcast, METAR KORF 180151Z 02013G20KT 10SM OVC055 24/13 A2984 RMK AO2 SLP104 T02390133 10:51 PM,73.9,52.0,46,29.85,10.0,NNE,12.7,20.7,N/A,,Partly Cloudy, METAR KORF 180251Z 02011G18KT 10SM FEW060 23/11 A2985 RMK AO2 SLP108 T02330111 51019 11:51 PM,73.9,51.1,45,29.86,10.0,North,10.4,19.6,N/A,,Mostly Cloudy, METAR KORF 180351Z 01009G17KT 10SM BKN070 BKN090 23/11 A2985 RMK AO2 SLP109 T02330106

8-32
*Words and acronyms indicating smoke observations as referenced in the above summary have been double underlined, bold faced and colored red. This observation is showing that there is 3/4 to 2 statute miles of visibility throughout the day; The FU indicates that the significant present weather obscuration is smoke. Smoke is a remark made at the end of the data set.
Figure A-15: 6/17/08 NOAA HYSPLIT Modeling Output for Hampton Roads
HYSPLIT back trajectories indicate air flowing from South 1 fire into the southeastern Virginia area. The backward trajectories end 12 am June 17, 2008 at the Naval Air Station Oceana and the Norfolk

8-33
International Airport. This model shows 6 particle trajectories originating at 100, 500 and 1000 meters above ground level and run for a simulation of 18 hours using the EDAS40 meteorological data set.
8-34
Figure A-16: 6/17/08 GASP AOD Imagery

8-35
Chapter II: June 20, 2008
High pressure was located over the southern Blue Ridge/Great Smoky Mountains (Figure A-17). Surface winds in southeastern Virginia were light from the west-southwest in the morning, backing to the south later in the day (Figures A-18 and A-19). Morning HYSPLIT back trajectories for ORF and NTU indicate low level winds coming from the South 1 fire area (Figure A-20). NTU reported smoke from 7:30 a.m. to 11:00 a.m. with visibility as low as two miles (Figure A-21). Smoke was also reported at 10:00 p.m. ORF reported three miles visibility due to smoke at 11:00 a.m. (Figure A-22). The 1215 UTC GASP AOD image with the red and yellow areas indicate high AOD over Norfolk (Figure A-23).

8-36
Figure A-17: 6/20/08 U.S. Weather Map

8-37
Figure A-18: 6/20/08 NOAA FSL Wind Plot
Figure A-19: 6/20/08 NOAA FSL Wind Plot

8-38
Figure A-20: 6/20/08 NOAA HYSPLIT Model Output for Hampton Roads
HYSPLIT back trajectories indicate low level winds from South 1 fire into the southeastern Virginia area. The backward trajectories end 12 am June 20, 2008 at the Naval Air Station Oceana and the Norfolk International Airport. This model shows 6 particle trajectories originating at 100, 500 and 1000 meters above ground level and run for a simulation of 36 hours using the EDAS40 meteorological data set.

8-39
Figure A-21: 6/20/08 NTU Surface Observations
TimeEDT,TemperatureF,Dew PointF,Humidity,Sea Level PressureIn,VisibilityMPH,Wind Direction,Wind SpeedMPH,Gust SpeedMPH,PrecipitationIn,Events,Conditions,FullMetar 12:00 AM,71.6,60.8,69,30.01,7.0,NNE,13.8,-,N/A,Rain-Thunderstorm,Light Thunderstorms and Rain, SPECI KNTU 200400Z 02012KT 7SM -TSRA BKN030CB BKN060 OVC100 22/16 A2998 RFREQ LTG OVHD ICCGCC TS OVHD MOV E SLP161 12:05 AM,69.8,59.0,68,30.01,4.0,NNW,21.9,26.5,N/A,Rain-Thunderstorm,LightThunderstorms and Rain, SPECI KNTU 200405Z 33019G23KT 4SM -TSRA BR SCT001 OVC030CB 21/15 A3000 RMFREQ LTG OVHD ICCGCC TS OVHD MOV E SLP161 12:28 AM,64.4,57.2,77,29.99,7.0,ENE,9.2,-,N/A,Rain-Thunderstorm,Light Thunderstorms and Rain, SPECI KNTU 200428Z 06008KT 7SM -TSRA FEW001 SCT015 BKN035CB OVC120 18/14 A2998 RMK FREQ LTG E ICCGCC TS E MOV E SLP153 12:35 AM,64.4,57.2,77,29.99,7.0,East,9.2,-,N/A,,Overcast, SPECI KNTU 200435Z COR 09008KT 7SM VCTS FEW001 SCT015 BKN035CB OVC120 18/A2998 RMK FREQ LTG E ICCGCC TS E MOV E SLP153 12:56 AM,64.9,57.0,75,29.97,7.0,ESE,9.2,-,0.21,,Mostly Cloudy, METAR KNTU 200456Z 12008KT 7SM VCTS SCT030 BKN120 18/14 A2996 RMK OCNL LTICCGCC TS E MOV E SLP149 P0021 8/130 T01830139 402560156 1:30 AM,66.2,57.2,73,30.00,7.0,ESE,3.5,-,N/A,Rain,Light Rain Showers, SPECI KNTU 200530Z 11003KT 7SM -SHRA SCT030 BKN090 OVC120 19/14 A2999 RMK SLP157 TS MOVD E 1:56 AM,66.0,57.9,75,29.99,7.0,NNE,5.8,-,0.01,,Mostly Cloudy, METAR KNTU 200556Z 03005KT 7SM FEW040 SCT080 BKN110 19/14 A2998 RMK SLP15P0001 60022 8/130 T01890144 10228 20183 53000 2:56 AM,66.9,57.9,73,29.99,7.0,Calm,Calm,-,N/A,,Partly Cloudy, METAR KNTU 200656Z 00000KT 7SM FEW080 19/14 A2998 RMK SLP156 T01940144 3:56 AM,64.0,57.0,78,29.98,7.0,Calm,Calm,-,N/A,,Scattered Clouds, METAR KNTU 200756Z 00000KT 7SM SCT120 18/14 A2997 RMK SLP150 T01780139 4:56 AM,64.0,57.0,78,29.98,7.0,Calm,Calm,-,N/A,,Scattered Clouds, METAR KNTU 200856Z 00000KT 7SM SCT120 18/14 A2997 RMK SLP150 T01780139 5:56 AM,63.0,57.0,81,29.99,5.0,Calm,Calm,-,N/A,,Haze, METAR KNTU 200956Z COR 00000KT 5SM HZ SCT100 17/14 A2998 RMK SLP155 T01726:56 AM,66.0,60.1,81,30.03,6.0,WSW,5.8,-,N/A,,Haze, METAR KNTU 201056Z 24005KT 6SM HZ SCT100 19/16 A3002 RMK SLP167 T018901567:30 AM,66.2,60.8,83,30.03,3.0,WSW,8.1,-,N/A,,Smoke, SPECI KNTU 201130Z 24007KT 3SM FU SCT100 19/16 A3002 RMK SLP168 7:56 AM,68.0,60.1,76,30.03,2.0,WSW,10.4,-,N/A,,Smoke, METAR KNTU 201156Z 24009KT 2SM FU SKC 20/16 A3002 RMK VIS N 1/2 SLP168 70T02000156 10200 20167 51016 8:56 AM,73.0,59.0,61,30.03,4.0,West,8.1,-,N/A,,Smoke, METAR KNTU 201256Z 28007KT 4SM FU SKC 23/15 A3002 RMK SLP169 T02280150 9:56 AM,77.0,59.0,54,30.04,6.0,West,6.9,-,N/A,,Smoke, METAR KNTU 201356Z 28006KT 6SM FU FEW200 25/15 A3003 RMK SLP173 T0250015010:56 AM,80.1,59.0,48,30.06,6.0,North,9.2,-,N/A,,Smoke, METAR KNTU 201456Z 35008KT 6SM FU SCT200 27/15 A3005 RMK SLP177 8/001 T02670150 53009 11:56 AM,82.0,50.0,33,30.06,7.0,NNW,6.9,-,N/A,,Scattered Clouds, METAR KNTU 201556Z 34006KT 7SM FEW030 SCT200 28/10 A3006 RMK SLP180 T027812:56 PM,82.9,54.0,37,30.06,5.0,North,9.2,-,N/A,,Haze, METAR KNTU 201656Z 35008KT 5SM HZ FEW100 SCT200 28/12 A3005 RMK SLP180 T02830122

8-40
1:56 PM,82.0,55.0,39,30.06,6.0,NNW,9.2,-,N/A,,Haze, METAR KNTU 201756Z 34008KT 6SM HZ FEW100 SCT200 28/13 A3005 RMK SLP178 T02780128 10283 20200 50001 2:56 PM,82.9,52.0,34,30.04,7.0,North,5.8,-,N/A,,Mostly Cloudy, METAR KNTU 201856Z 35005KT 7SM FEW030 SCT100 BKN200 28/11 A3004 RMK SLP17T02830111 3:56 PM,80.1,50.0,35,30.04,7.0,ESE,12.7,-,N/A,,Mostly Cloudy, METAR KNTU 201956Z 11011KT 7SM FEW030 BKN200 27/10 A3003 RMK SLP172 T02674:56 PM,78.1,59.0,52,30.04,6.0,ESE,9.2,-,N/A,,Haze, METAR KNTU 202056Z 11008KT 6SM HZ FEW030 SCT100 BKN200 26/15 A3004 RMK SLT02560150 55004 5:56 PM,77.0,57.9,52,30.05,5.0,SE,10.4,-,N/A,,Haze, METAR KNTU 202156Z 13009KT 5SM HZ FEW030 SCT100 BKN200 25/14 A3004 RMK SLT02500144 6:56 PM,77.0,57.9,52,30.05,5.0,SSE,8.1,-,N/A,,Haze, METAR KNTU 202256Z 16007KT 5SM HZ FEW100 BKN200 25/14 A3004 RMK SLP175 T02500144 7:56 PM,75.9,57.0,52,30.05,7.0,SSE,5.8,-,N/A,,Mostly Cloudy, METAR KNTU 202356Z 16005KT 7SM FEW100 BKN200 24/14 A3004 RMK SLP175 8/031T02440139 10289 20244 50001 8:56 PM,75.0,60.1,60,30.06,6.0,SSW,5.8,-,N/A,,Haze, METAR KNTU 210056Z 21005KT 6SM HZ FEW100 BKN200 24/16 A3005 RMK SLP177 T02390156 9:56 PM,73.9,59.0,59,30.06,4.0,SSW,5.8,-,N/A,,Smoke, METAR KNTU 210156Z 20005KT 4SM FU FEW100 BKN200 23/15 A3005 RMK SLP178 T02330150 10:56 PM,73.0,59.0,61,30.08,6.0,SW,8.1,-,N/A,,Haze, METAR KNTU 210256Z 22007KT 6SM HZ FEW100 SCT200 23/15 A3007 RMK SLP185 8/T02280150 53011 11:56 PM,72.0,59.0,64,30.09,7.0,SW,8.1,-,N/A,,Scattered Clouds, METAR KNTU 210356Z 22007KT 7SM FEW100 SCT200 22/15 A3008 RMK SLP188 T0222 *Words and acronyms indicating smoke observations as referenced in the above summary have been double underlined, bold faced and colored red. This observation is showing that there is 2 statute miles of visibility throughout the day; The FU indicates that the significant present weather obscuration is smoke. Smoke is a remark made at the end of the data set.

8-41
Figure A-22: 6/20/08 ORF Surface Observations
TimeEDT,TemperatureF,Dew PointF,Humidity,Sea Level PressureIn,VisibilityMPH,Wind Direction,Wind SpeedMPH,Gust SpeedMPH,PrecipitationIn,Events,Conditions,FullMetar 12:00 AM,64.4,60.8,88,29.96,2.5,SE,18.4,34.5,0.56,Rain,Light Rain, SPECI KORF 200400Z AUTO 14016G30KT 2 1/2SM -RA BR SCT008 BKN040 OVC110 18A2996 RMK AO2 PK WND 14030/0352 P0056 TSNO $ 12:07 AM,66.2,-9999,N/A,29.96,10.0,SSE,12.7,27.6,0.56,,Overcast, SPECI KORF 200407Z AUTO 16011G24KT 10SM FEW002 SCT012 OVC120 19/ A2996 RMAO2 PK WND 14030/0352 RAE07 P0056 TSNO $ 12:51 AM,64.9,-9999,N/A,29.98,10.0,SE,3.5,-,0.56,,Mostly Cloudy, METAR KORF 200451Z AUTO 14003KT 10SM BKN090 18/ A2998 RMK AO2 PK WND 14030/0352 RAE07 SLP151 P0056 T0183 402670167 TSNO $ 1:51 AM,64.9,-9999,N/A,29.99,10.0,Calm,Calm,-,0.00,,Partly Cloudy, METAR KORF 200551Z AUTO 00000KT 10SM FEW085 18/ A2999 RMK AO2 RAB17E27 SLP0000 60089 T0183 10233 20167 53004 TSNO $ 2:51 AM,66.0,66.0,100,29.99,10.0,SSE,3.5,-,N/A,,Scattered Clouds, METAR KORF 200651Z AUTO 16003KT 10SM SCT080 SCT120 19/19 A2999 RMK AO2 SLT01890189 TSNO $ 3:51 AM,66.0,61.0,84,29.97,10.0,Calm,Calm,-,N/A,,Clear, METAR KORF 200751Z AUTO 00000KT 10SM CLR 19/16 A2997 RMK AO2 SLP148 T0189TSNO $ 4:51 AM,64.9,62.1,90,29.99,10.0,SW,3.5,-,N/A,,Clear, METAR KORF 200851Z AUTO 23003KT 10SM CLR 18/17 A2999 RMK AO2 SLP154 T018355001 TSNO $ 5:51 AM,66.0,62.1,87,29.99,10.0,Calm,Calm,-,N/A,,Clear, METAR KORF 200951Z AUTO 00000KT 10SM CLR 19/17 A2999 RMK AO2 SLP155 T0189TSNO $ 6:51 AM,66.0,63.0,90,30.03,10.0,Calm,Calm,-,N/A,,Clear, METAR KORF 201051Z 00000KT 10SM CLR 19/17 A3003 RMK AO2 SLP167 T01890172 7:51 AM,69.1,64.0,84,30.03,3.0,West,4.6,-,N/A,,Haze, METAR KORF 201151Z 26004KT 3SM HZ CLR 21/18 A3003 RMK AO2 SLP169 70089 T02060178 10206 20178 53015 $ 8:00 AM,69.8,62.6,78,30.03,2.5,WSW,5.8,-,N/A,,Haze, SPECI KORF 201200Z 25005KT 2 1/2SM HZ CLR 21/17 A3003 RMK AO2 $ 8:49 AM,71.6,62.6,73,30.03,3.0,West,5.8,-,N/A,,Haze, SPECI KORF 201249Z 26005KT 3SM HZ CLR 22/17 A3003 RMK AO2 $ 8:51 AM,72.0,62.1,71,30.03,4.0,West,3.5,-,N/A,,Haze, METAR KORF 201251Z 28003KT 4SM HZ CLR 22/17 A3003 RMK AO2 SLP167 T02220169:51 AM,75.9,63.0,64,30.04,3.0,WNW,5.8,-,N/A,,Haze, METAR KORF 201351Z 30005KT 3SM HZ CLR 24/17 A3004 RMK AO2 SFC VIS 6 SLP17T02440172 10:51 AM,79.0,61.0,54,30.05,3.0,NNW,5.8,-,N/A,,Smoke, METAR KORF 201451Z 33005KT 3SM FU FEW100 26/16 A3005 RMK AO2 SLP176 T026153008 11:51 AM,82.0,57.0,42,30.06,4.0,Calm,Calm,-,N/A,,Haze, METAR KORF 201551Z 00000KT 4SM HZ CLR 28/14 A3006 RMK AO2 SLP180 T027801312:51 PM,82.0,46.0,28,30.06,8.0,NNE,6.9,-,N/A,,Haze, METAR KORF 201651Z 03006KT 8SM HZ CLR 28/08 A3006 RMK AO2 SLP180 T02780071:51 PM,81.0,57.9,45,30.06,10.0,NE,9.2,-,N/A,,Haze, METAR KORF 201751Z 05008KT 10SM HZ CLR 27/14 A3006 RMK AO2 SLP178 T02720110294 20206 50002 2:51 PM,82.0,59.0,45,30.04,10.0,NE,10.4,-,N/A,,Haze, METAR KORF 201851Z 05009KT 10SM HZ CLR 28/15 A3004 RMK AO2 SLP173 T0278013:51 PM,81.0,57.9,45,30.03,10.0,NE,10.4,-,N/A,,Haze, METAR KORF 201951Z 05009KT 10SM HZ CLR 27/14 A3003 RMK AO2 SLP168 T027201

8-42
4:51 PM,80.1,55.9,43,30.03,10.0,East,8.1,-,N/A,,Clear, METAR KORF 202051Z 10007KT 10SM CLR 27/13 A3003 RMK AO2 SLP169 T02670133 55009 5:51 PM,80.1,55.9,43,30.04,10.0,SE,9.2,-,N/A,,Clear, METAR KORF 202151Z 13008KT 10SM CLR 27/13 A3004 RMK AO2 SLP171 T026701336:51 PM,79.0,59.0,50,30.04,9.0,South,9.2,-,N/A,,Clear, METAR KORF 202251Z 18008KT 9SM CLR 26/15 A3004 RMK AO2 SLP172 T02610150 7:51 PM,77.0,57.9,52,30.04,10.0,South,8.1,-,N/A,,Clear, METAR KORF 202351Z 19007KT 10SM CLR 25/14 A3004 RMK AO2 SLP173 T02500144 10283 20250 51004 8:51 PM,75.0,61.0,62,30.04,10.0,South,4.6,-,N/A,,Clear, METAR KORF 210051Z 19004KT 10SM CLR 24/16 A3005 RMK AO2 SLP173 T023901619:51 PM,73.9,63.0,68,30.05,9.0,SSW,10.4,-,N/A,,Clear, METAR KORF 210151Z 21009KT 9SM CLR 23/17 A3005 RMK AO2 SLP175 T02330172 10:51 PM,73.0,63.0,71,30.07,6.0,SSW,8.1,-,N/A,,Haze, METAR KORF 210251Z 21007KT 6SM HZ CLR 23/17 A3007 RMK AO2 SLP183 T022801753010 11:51 PM,72.0,62.1,71,30.08,4.0,SSW,9.2,-,N/A,,Haze, METAR KORF 210351Z 21008KT 4SM HZ CLR 22/17 A3008 RMK AO2 SLP184 T0222016 *Words and acronyms indicating smoke observations as referenced in the above summary have been double underlined, bold faced and colored red. This observation is showing that there is 3 statute miles of visibility throughout the day; The FU indicates that the significant present weather obscuration is smoke. Smoke is a remark made at the end of the data set.

8-43
Figure A-23: 6/20/08 GASP AOD Imagery

8-44
Chapter III: June 23, 2008
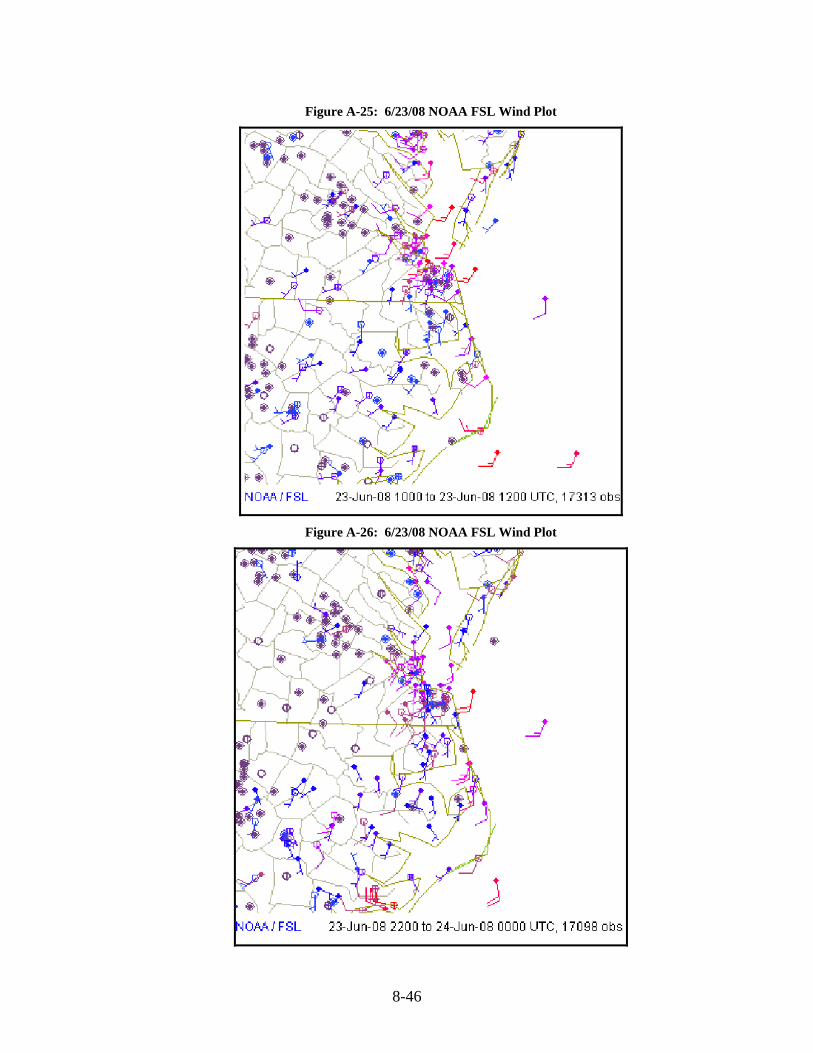
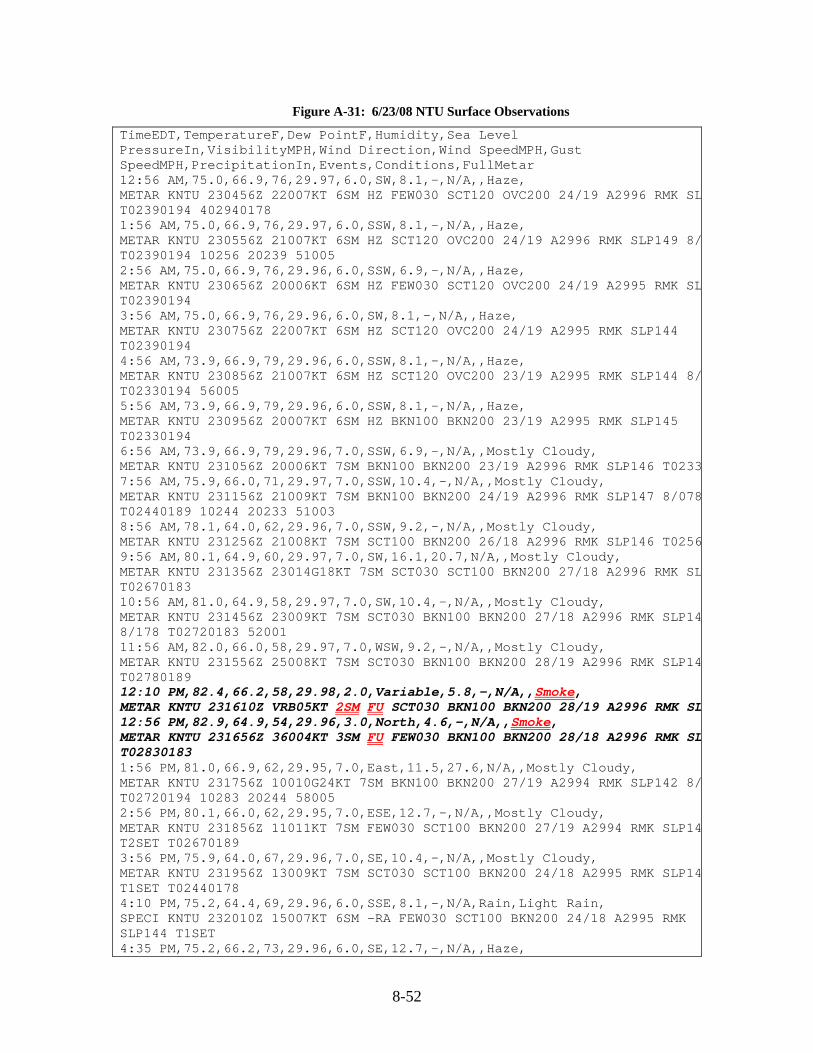
Weak high pressure was located over the southern Atlantic states (Figure A-24). Light southwesterly winds in the morning backed towards the south later in the day (Figures A-25 and A-26). HYSPLIT back trajectories for ORF and NTU indicate low level winds coming from the South 1 and Evans Road fires throughout the day (Figures A-27, A-28, and A-29). ORF winds were from the southwest with smoke reported from 9:00 a.m. to 11:00 a.m. and visibility as low as 1¾ miles (Figure A-30). NTU reported smoke from 12:10 p.m. to 1:00 p.m. with visibility as low as two miles (Figure A-31). The visible satellite image indicated clouds, smoke, and haze over the region (Figure A-32).

8-45
Figure A-24: 6/23/08 U.S. Weather Map
8-46
Figure A-25: 6/23/08 NOAA FSL Wind Plot
Figure A-26: 6/23/08 NOAA FSL Wind Plot
8-47
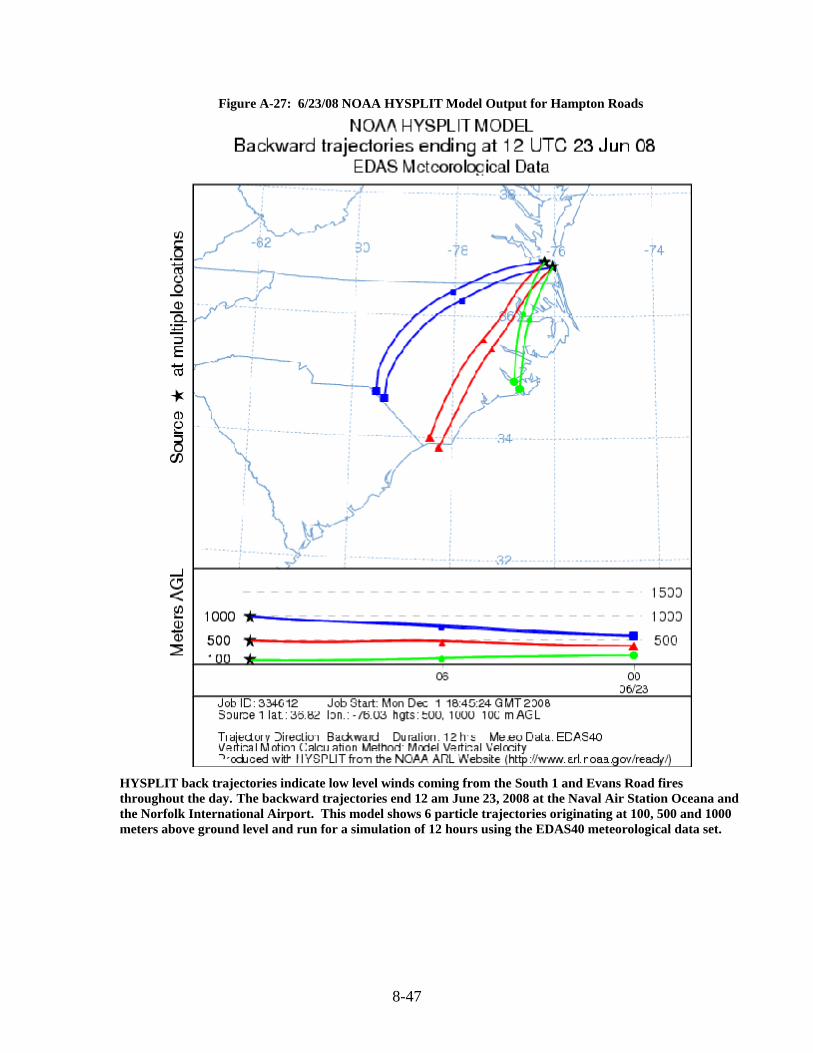
Figure A-27: 6/23/08 NOAA HYSPLIT Model Output for Hampton Roads
HYSPLIT back trajectories indicate low level winds coming from the South 1 and Evans Road fires throughout the day. The backward trajectories end 12 am June 23, 2008 at the Naval Air Station Oceana and the Norfolk International Airport. This model shows 6 particle trajectories originating at 100, 500 and 1000 meters above ground level and run for a simulation of 12 hours using the EDAS40 meteorological data set.

8-48
Figure A-28: 6/23/08 NOAA HYSPLIT Model Output for Hampton Roads
HYSPLIT back trajectories indicate low level winds coming from the South 1 and Evans Road fires throughout the day. The backward trajectories end 5 pm June 23, 2008 at the Naval Air Station Oceana and the Norfolk International Airport. This model shows 6 particle trajectories originating at 100, 500 and 1000 meters above ground level and run for a simulation of 12 hours using the EDAS40 meteorological data set.

8-49
Figure A-29: 6/23/08 NOAA HYSPLIT Model Output for Hampton Roads
HYSPLIT back trajectories indicate low level winds coming from the South 1 and Evans Road fires throughout the day. The backward trajectories end 9 pm June 23, 2008 at the Naval Air Station Oceana and the Norfolk International Airport. This model shows 6 particle trajectories originating at 100, 500 and 1000 meters above ground level and run for a simulation of 12 hours using the EDAS40 meteorological data set.

8-50
Figure A-30: 6/23/08 ORF Surface Observations
TimeEDT,TemperatureF,Dew PointF,Humidity,Sea Level PressureIn,VisibilityMPH,Wind Direction,Wind SpeedMPH,Gust SpeedMPH,PrecipitationIn,Events,Conditions,FullMetar 12:51 AM,75.0,71.1,87,29.96,10.0,SW,10.4,-,N/A,,Clear, METAR KORF 230451Z 22009KT 10SM CLR 24/22 A2996 RMK AO2 SLP144 T02390217 403110189 1:51 AM,75.0,71.1,87,29.96,10.0,SW,9.2,-,N/A,,Clear, METAR KORF 230551Z 22008KT 10SM CLR 24/22 A2996 RMK AO2 SLP146 T02390217 10261 20239 51007 2:51 AM,75.0,71.1,87,29.95,7.0,SSW,8.1,-,N/A,,Clear, METAR KORF 230651Z 21007KT 7SM CLR 24/22 A2995 RMK AO2 SLP142 T02390217 3:51 AM,75.0,70.0,84,29.95,4.0,SW,10.4,-,N/A,,Haze, METAR KORF 230751Z AUTO 22009KT 4SM HZ CLR 24/21 A2995 RMK AO2 SLP141 T02390211 TSNO 4:51 AM,73.0,69.1,87,29.94,5.0,SW,9.2,-,N/A,,Clear, METAR KORF 230851Z AUTO 23008KT 5SM BR CLR 23/21 A2994 RMK AO2 SLP139 T02280206 56006 TSNO 5:51 AM,73.0,69.1,87,29.95,3.0,SSW,8.1,-,N/A,,Partly Cloudy, METAR KORF 230951Z AUTO 21007KT 3SM BR FEW120 23/21 A2995 RMK AO2 SLP141 T02280206 TSNO 6:00 AM,73.4,69.8,88,29.95,1.8,SSW,9.2,-,N/A,,Partly Cloudy, SPECI KORF 231000Z AUTO 21008KT 1 3/4SM BR FEW120 23/21 A2995 RMK AO2 TSN6:51 AM,73.9,70.0,87,29.96,2.0,SSW,10.4,-,N/A,,Partly Cloudy, METAR KORF 231051Z AUTO 20009KT 2SM BR FEW120 23/21 A2995 RMK AO2 SLP143 T02330211 TSNO 7:03 AM,73.4,69.8,88,29.95,3.0,SSW,9.2,-,N/A,,Haze, SPECI KORF 231103Z 21008KT 3SM HZ FEW120 23/21 A2995 RMK AO2 7:51 AM,75.0,66.9,76,29.96,4.0,SSW,9.2,-,N/A,,Haze, METAR KORF 231151Z 21008KT 4SM HZ CLR 24/19 A2996 RMK AO2 SLP143 T023901910239 20228 51004 8:51 AM,78.1,66.9,68,29.96,4.0,SW,12.7,-,N/A,,Smoke, METAR KORF 231251Z 22011KT 4SM FU CLR 26/19 A2996 RMK AO2 SLP144 T02560199:12 AM,80.6,66.2,61,29.96,2.5,SW,11.5,-,N/A,,Smoke, SPECI KORF 231312Z 22010KT 2 1/2SM FU CLR 27/19 A2996 RMK AO2 9:27 AM,78.8,66.2,65,29.96,1.8,SW,12.7,-,N/A,,Smoke, SPECI KORF 231327Z 22011KT 1 3/4SM FU FEW008 26/19 A2996 RMK AO2 9:52 AM,78.8,66.2,65,29.96,2.5,WSW,12.7,-,N/A,,Smoke, SPECI KORF 231352Z 24011KT 2 1/2SM FU FEW010 SCT027 26/19 A2996 RMK AO2 10:23 AM,80.6,66.2,61,29.96,3.0,WSW,9.2,-,N/A,,Smoke, SPECI KORF 231423Z 24008KT 3SM FU SCT027 27/19 A2996 RMK AO2 10:51 AM,81.0,66.9,62,29.96,5.0,SSW,10.4,-,N/A,,Smoke, METAR KORF 231451Z 21009KT 5SM FU BKN030 27/19 A2996 RMK AO2 SLP146 T027253002 11:51 AM,80.1,66.9,64,29.98,10.0,Variable,4.6,-,N/A,,Mostly Cloudy, METAR KORF 231551Z VRB04KT 10SM BKN030 BKN036 27/19 A2998 RMK AO2 SLP150 T02670194 12:51 PM,82.9,66.0,56,29.96,10.0,Variable,3.5,-,N/A,,Clear, METAR KORF 231651Z VRB03KT 10SM CLR 28/19 A2996 RMK AO2 SLP143 T028301891:51 PM,84.0,66.0,55,29.94,10.0,Calm,Calm,-,N/A,,Clear, METAR KORF 231751Z 00000KT 10SM CLR 29/19 A2994 RMK AO2 SLP139 T02890189 10300 20239 58007 2:51 PM,82.9,70.0,65,29.94,10.0,NE,10.4,-,N/A,,Partly Cloudy, METAR KORF 231851Z 05009KT 10SM FEW041 28/21 A2994 RMK AO2 SLP137 T0283023:51 PM,82.0,69.1,65,29.94,10.0,ESE,12.7,19.6,N/A,,Clear,

8-51
METAR KORF 231951Z 12011G17KT 10SM CLR 28/21 A2994 RMK AO2 SLP138 T0278024:51 PM,82.0,70.0,67,29.94,10.0,South,11.5,-,N/A,,Clear, METAR KORF 232051Z 17010KT 10SM CLR 28/21 A2994 RMK AO2 SLP138 T02780211 55001 5:51 PM,79.0,68.0,69,29.94,10.0,South,11.5,-,N/A,,Clear, METAR KORF 232151Z 18010KT 10SM CLR 26/20 A2994 RMK AO2 SLP137 T026102006:51 PM,81.0,69.1,67,29.94,10.0,South,8.1,-,N/A,,Clear, METAR KORF 232251Z 19007KT 10SM CLR 27/21 A2994 RMK AO2 SLP137 T027202067:51 PM,78.1,66.9,68,29.95,10.0,South,8.1,-,N/A,,Clear, METAR KORF 232351Z 19007KT 10SM CLR 26/19 A2995 RMK AO2 SLP140 T02560194 10294 20256 53002 8:51 PM,77.0,69.1,76,29.95,10.0,SSW,10.4,-,N/A,,Clear, METAR KORF 240051Z 20009KT 10SM CLR 25/21 A2995 RMK AO2 SLP142 T025002069:51 PM,75.9,70.0,82,29.98,10.0,SSW,10.4,-,N/A,,Clear, METAR KORF 240151Z 21009KT 10SM CLR 24/21 A2998 RMK AO2 SLP150 T0244021110:51 PM,75.0,69.1,82,29.99,10.0,SSW,9.2,-,N/A,,Clear, METAR KORF 240251Z 21008KT 10SM CLR 24/21 A2999 RMK AO2 SLP154 T02390206 53014 11:51 PM,75.0,69.1,82,29.99,10.0,SW,13.8,-,N/A,,Clear, METAR KORF 240351Z 22012KT 10SM CLR 24/21 A2999 RMK AO2 SLP155 T02390206 *Words and acronyms indicating smoke observations as referenced in the above summary have been double underlined, bold faced and colored red. This observation is showing that there is 1 to 1 3/4 statute mile of visibility throughout the day; The FU indicates that the significant present weather obscuration is smoke. Smoke is a remark made at the end of the data set.
8-52
Figure A-31: 6/23/08 NTU Surface Observations
TimeEDT,TemperatureF,Dew PointF,Humidity,Sea Level PressureIn,VisibilityMPH,Wind Direction,Wind SpeedMPH,Gust SpeedMPH,PrecipitationIn,Events,Conditions,FullMetar 12:56 AM,75.0,66.9,76,29.97,6.0,SW,8.1,-,N/A,,Haze, METAR KNTU 230456Z 22007KT 6SM HZ FEW030 SCT120 OVC200 24/19 A2996 RMK SLT02390194 402940178 1:56 AM,75.0,66.9,76,29.97,6.0,SSW,8.1,-,N/A,,Haze, METAR KNTU 230556Z 21007KT 6SM HZ SCT120 OVC200 24/19 A2996 RMK SLP149 8/T02390194 10256 20239 51005 2:56 AM,75.0,66.9,76,29.96,6.0,SSW,6.9,-,N/A,,Haze, METAR KNTU 230656Z 20006KT 6SM HZ FEW030 SCT120 OVC200 24/19 A2995 RMK SLT02390194 3:56 AM,75.0,66.9,76,29.96,6.0,SW,8.1,-,N/A,,Haze, METAR KNTU 230756Z 22007KT 6SM HZ SCT120 OVC200 24/19 A2995 RMK SLP144 T02390194 4:56 AM,73.9,66.9,79,29.96,6.0,SSW,8.1,-,N/A,,Haze, METAR KNTU 230856Z 21007KT 6SM HZ SCT120 OVC200 23/19 A2995 RMK SLP144 8/T02330194 56005 5:56 AM,73.9,66.9,79,29.96,6.0,SSW,8.1,-,N/A,,Haze, METAR KNTU 230956Z 20007KT 6SM HZ BKN100 BKN200 23/19 A2995 RMK SLP145 T02330194 6:56 AM,73.9,66.9,79,29.96,7.0,SSW,6.9,-,N/A,,Mostly Cloudy, METAR KNTU 231056Z 20006KT 7SM BKN100 BKN200 23/19 A2996 RMK SLP146 T02337:56 AM,75.9,66.0,71,29.97,7.0,SSW,10.4,-,N/A,,Mostly Cloudy, METAR KNTU 231156Z 21009KT 7SM BKN100 BKN200 24/19 A2996 RMK SLP147 8/078T02440189 10244 20233 51003 8:56 AM,78.1,64.0,62,29.96,7.0,SSW,9.2,-,N/A,,Mostly Cloudy, METAR KNTU 231256Z 21008KT 7SM SCT100 BKN200 26/18 A2996 RMK SLP146 T02569:56 AM,80.1,64.9,60,29.97,7.0,SW,16.1,20.7,N/A,,Mostly Cloudy, METAR KNTU 231356Z 23014G18KT 7SM SCT030 SCT100 BKN200 27/18 A2996 RMK SLT02670183 10:56 AM,81.0,64.9,58,29.97,7.0,SW,10.4,-,N/A,,Mostly Cloudy, METAR KNTU 231456Z 23009KT 7SM SCT030 BKN100 BKN200 27/18 A2996 RMK SLP148/178 T02720183 52001 11:56 AM,82.0,66.0,58,29.97,7.0,WSW,9.2,-,N/A,,Mostly Cloudy, METAR KNTU 231556Z 25008KT 7SM SCT030 BKN100 BKN200 28/19 A2996 RMK SLP14T02780189 12:10 PM,82.4,66.2,58,29.98,2.0,Variable,5.8,-,N/A,,Smoke, METAR KNTU 231610Z VRB05KT 2SM FU SCT030 BKN100 BKN200 28/19 A2996 RMK SL12:56 PM,82.9,64.9,54,29.96,3.0,North,4.6,-,N/A,,Smoke, METAR KNTU 231656Z 36004KT 3SM FU FEW030 BKN100 BKN200 28/18 A2996 RMK SLT02830183 1:56 PM,81.0,66.9,62,29.95,7.0,East,11.5,27.6,N/A,,Mostly Cloudy, METAR KNTU 231756Z 10010G24KT 7SM BKN100 BKN200 27/19 A2994 RMK SLP142 8/T02720194 10283 20244 58005 2:56 PM,80.1,66.0,62,29.95,7.0,ESE,12.7,-,N/A,,Mostly Cloudy, METAR KNTU 231856Z 11011KT 7SM FEW030 SCT100 BKN200 27/19 A2994 RMK SLP14T2SET T02670189 3:56 PM,75.9,64.0,67,29.96,7.0,SE,10.4,-,N/A,,Mostly Cloudy, METAR KNTU 231956Z 13009KT 7SM SCT030 SCT100 BKN200 24/18 A2995 RMK SLP14T1SET T02440178 4:10 PM,75.2,64.4,69,29.96,6.0,SSE,8.1,-,N/A,Rain,Light Rain, SPECI KNTU 232010Z 15007KT 6SM -RA FEW030 SCT100 BKN200 24/18 A2995 RMK SLP144 T1SET 4:35 PM,75.2,66.2,73,29.96,6.0,SE,12.7,-,N/A,,Haze,

8-53
SPECI KNTU 232035Z 14011KT 6SM HZ FEW030 SCT100 BKN200 24/19 A2995 RMK SLT1SET 4:56 PM,77.0,66.0,69,29.96,7.0,South,10.4,-,0.00,,Mostly Cloudy, METAR KNTU 232056Z 18009KT 7SM FEW030 SCT100 BKN200 25/19 A2995 RMK SLP14T1SET P0000 60000 8/178 T02500189 52000 5:56 PM,78.1,64.9,64,29.95,7.0,South,6.9,-,N/A,,Mostly Cloudy, METAR KNTU 232156Z 18006KT 7SM FEW030 FEW100 BKN200 26/18 A2994 RMK SLP14T1SET T02560183 6:56 PM,78.1,66.0,66,29.95,7.0,South,9.2,-,N/A,,Mostly Cloudy, METAR KNTU 232256Z 17008KT 7SM FEW030 FEW100 BKN200 26/19 A2995 RMK SLP14T2SET T02560189 7:56 PM,77.0,64.9,66,29.95,7.0,South,8.1,-,N/A,,Mostly Cloudy, METAR KNTU 232356Z 19007KT 7SM FEW060 FEW100 BKN200 25/18 A2995 RMK SLP148/131 T02500183 10278 20239 53001 8:56 PM,75.9,64.9,69,29.96,7.0,SSW,9.2,-,N/A,,Mostly Cloudy, METAR KNTU 240056Z 20008KT 7SM FEW060 FEW100 BKN200 24/18 A2996 RMK SLP14T02440183 9:56 PM,75.0,66.0,73,29.98,7.0,SSW,8.1,-,N/A,,Mostly Cloudy, METAR KNTU 240156Z 20007KT 7SM FEW060 FEW100 BKN200 24/19 A2997 RMK SLP15T02390189 10:56 PM,75.0,66.0,73,29.99,7.0,SSW,8.1,-,N/A,,Mostly Cloudy, METAR KNTU 240256Z 21007KT 7SM FEW060 FEW100 BKN200 24/19 A2999 RMK SLP15T2SET 8/131 T02390189 53013 11:56 PM,75.0,66.0,73,30.00,7.0,SW,10.4,-,N/A,,Mostly Cloudy, METAR KNTU 240356Z 23009KT 7SM FEW060 FEW100 BKN200 24/19 A2999 RMK SLP15T2SET T02390189 *Words and acronyms indicating smoke observations as referenced in the above summary have been double underlined, bold faced and colored red. This observation is showing that there is 2 statute miles of visibility throughout the day; The FU indicates that the significant present weather obscuration is smoke. Smoke is a remark made at the end of the data set.

8-54
Figure A-32: 6/23/08 Satellite Imagery with Highway Overlay

8-55
Chapter IV: June 26, 2008
High pressure off the southeast coast brought southwesterly winds over the region (Figure A-33). HYSPLIT back trajectories indicate low level flow from the South 1 and Evans Road fires all day long (Figures A-34, A-35, A-36, A-37, and A-38). West and west-southwesterly winds for most of the day at ORF backed to the southwest in the evening (Figure A-39). ORF reported smoke from 8:00 a.m. until at least midnight with visibility as low as three miles. NTU reported smoke at various times throughout the day from 1:00 a.m. until 8:00 p.m. with visibility as low as 1½ miles (Figure A-40). This is indicating that the smoke is not up in the stratosphere. That it is in the lower monitoring level of the atmosphere. Haze was evident on the visible satellite image (Figure A-41). The 2045 UTC GASP AOD image indicated high AOD in the area (Figure A-42) as evidenced by the red, and yellow in the image below.

8-56
Figure A-33: 6/26/08 U.S. Weather Map

8-57
Figure A-34: 6/26/08 NOAA HYSPLIT Model Output for Hampton Roads
HYSPLIT back trajectories indicate low level flow from the South 1 and Evans Road fires all day long. The backward trajectories end 12 am June 26, 2008 at the Naval Air Station Oceana and the Norfolk International Airport. This model shows 6 particle trajectories originating at 100, 500 and 1000 meters above ground level and run for a simulation of 12 hours using the EDAS40 meteorological data set.

8-58
Figure A-35: 6/26/08 NOAA HYSPLIT Model Output for Hampton Roads
HYSPLIT back trajectories indicate low level flow from the South 1 and Evans Road fires all day long. The backward trajectories end 5 pm June 26, 2008 at the Naval Air Station Oceana and the Norfolk International Airport. This model shows 6 particle trajectories originating at 100, 500 and 1000 meters above ground level and run for a simulation of 12 hours using the EDAS40 meteorological data set.

8-59
Figure A-36: 6/26/08 NOAA HYSPLIT Model Output for Hampton Roads
HYSPLIT back trajectories indicate low level flow from the South 1 and Evans Road fires all day long. The backward trajectories end 9 pm June 26, 2008 at the Naval Air Station Oceana and the Norfolk International Airport. This model shows 6 particle trajectories originating at 100, 500 and 1000 meters above ground level and run for a simulation of 12 hours using the EDAS40 meteorological data set.

8-60
Figure A-37: 6/26/08 NOAA HYSPLIT Model Output for Hampton Roads
HYSPLIT back trajectories indicate low level flow from the South 1 and Evans Road fires all day long. The backward trajectories end 1 am June 27, 2008 at the Naval Air Station Oceana and the Norfolk International Airport. This model shows 6 particle trajectories originating at 100, 500 and 1000 meters above ground level and run for a simulation of 12 hours using the EDAS40 meteorological data set.

8-61
Figure A-38: 6/26/08 NOAA HYSPLIT Model Output for Hampton Roads
HYSPLIT back trajectories indicate low level flow from the South 1 and Evans Road fires all day long. The backward trajectories end 4 am June 27, 2008 at the Naval Air Station Oceana and the Norfolk International Airport. This model shows 6 particle trajectories originating at 100, 500 and 1000 meters above ground level and run for a simulation of 12 hours using the EDAS40 meteorological data set.

8-62
Figure A-39: 6/26/08 ORF Surface Observations
TimeEDT,TemperatureF,Dew PointF,Humidity,Sea Level PressureIn,VisibilityMPH,Wind Direction,Wind SpeedMPH,Gust SpeedMPH,PrecipitationIn,Events,Conditions,FullMetar 12:51 AM,78.1,66.9,68,30.09,3.0,SW,9.2,-,N/A,,Haze, METAR KORF 260451Z 23008KT 3SM HZ FEW090 26/19 A3009 RMK AO2 SLP190 T0256403060189 1:51 AM,78.1,66.9,68,30.08,4.0,SW,10.4,-,N/A,,Haze, METAR KORF 260551Z AUTO 23009KT 4SM HZ FEW080 26/19 A3008 RMK AO2 SLP184 T02560194 10283 20256 58009 TSNO 2:51 AM,78.1,66.9,68,30.06,10.0,WSW,11.5,-,N/A,,Clear, METAR KORF 260651Z AUTO 24010KT 10SM CLR 26/19 A3006 RMK AO2 SLP180 T0256TSNO 3:51 AM,77.0,66.9,71,30.05,10.0,WSW,10.4,-,N/A,,Clear, METAR KORF 260751Z AUTO 24009KT 10SM CLR 25/19 A3005 RMK AO2 SLP175 T0250TSNO 4:51 AM,75.9,66.9,74,30.05,9.0,SW,11.5,-,N/A,,Clear, METAR KORF 260851Z AUTO 23010KT 9SM CLR 24/19 A3005 RMK AO2 SLP174 T0244056010 TSNO 5:51 AM,75.0,69.1,82,30.05,6.0,SW,12.7,-,N/A,,Haze,METAR KORF 260951Z AUT23011KT 6SM HZ CLR 24/21 A3005 RMK AO2 SLP174 T02390206 TSNO 6:51 AM,75.9,69.1,79,30.05,6.0,SW,12.7,-,N/A,,Haze, METAR KORF 261051Z AUTO 23011KT 6SM HZ CLR 24/21 A3005 RMK AO2 SLP174 T02440206 TSNO 7:51 AM,78.1,70.0,76,30.05,7.0,WSW,8.1,-,N/A,,Smoke, METAR KORF 261151Z 25007KT 7SM FU CLR 26/21 A3005 RMK AO2 SLP175 T025602110261 20239 53001 8:51 AM,80.1,69.1,69,30.06,7.0,West,6.9,-,N/A,,Smoke, METAR KORF 261251Z 26006KT 7SM FU CLR 27/21 A3006 RMK AO2 SLP178 T02670209:51 AM,82.9,70.0,65,30.04,10.0,West,8.1,17.3,N/A,,Smoke, METAR KORF 261351Z 27007G15KT 10SM FU CLR 28/21 A3004 RMK AO2 SLP172 T02830211 10:51 AM,86.0,69.1,57,30.03,10.0,West,8.1,-,N/A,,Smoke, METAR KORF 261451Z 26007KT 10SM FU CLR 30/21 A3003 RMK AO2 SLP168 T03000258007 11:51 AM,90.0,69.1,50,30.01,10.0,WSW,12.7,-,N/A,,Smoke, METAR KORF 261551Z 25011KT 10SM FU CLR 32/21 A3001 RMK AO2 SLP160 T03220212:51 PM,91.0,66.9,45,29.99,10.0,WSW,6.9,16.1,N/A,,Smoke, METAR KORF 261651Z 25006G14KT 10SM FU CLR 33/19 A2999 RMK AO2 SLP155 T03280194 1:51 PM,93.0,66.0,41,29.96,10.0,WSW,9.2,-,N/A,,Smoke, METAR KORF 261751Z 24008KT 220V280 10SM FU CLR 34/19 A2996 RMK AO2 SLP144T03390189 10339 20256 58024 2:51 PM,95.0,60.1,31,29.94,10.0,West,12.7,19.6,N/A,,Smoke, METAR KORF 261851Z 26011G17KT 10SM FU CLR 35/16 A2994 RMK AO2 SLP138 T03500156 3:51 PM,95.0,59.0,30,29.92,10.0,WSW,13.8,21.9,N/A,,Smoke, METAR KORF 261951Z 25012G19KT 10SM FU FEW080 35/15 A2992 RMK AO2 SLP132 T03500150 4:51 PM,96.1,60.1,30,29.91,10.0,WSW,11.5,23.0,N/A,,Smoke, METAR KORF 262051Z AUTO 25010G20KT 10SM FU CLR 36/16 A2991 RMK AO2 SLP128T03560156 56016 TSNO 5:51 PM,95.0,62.1,33,29.89,10.0,WSW,13.8,19.6,N/A,,Smoke, METAR KORF 262151Z AUTO 24012G17KT 10SM FU CLR 35/17 A2989 RMK AO2 SLP122T03500167 TSNO 6:51 PM,93.0,61.0,34,29.88,10.0,SW,15.0,-,N/A,,Smoke,

8-63
METAR KORF 262251Z AUTO 22013KT 10SM FU CLR 34/16 A2988 RMK AO2 SLP117 T03390161 TSNO 7:51 PM,91.0,61.0,36,29.88,10.0,SW,12.7,-,N/A,,Smoke, METAR KORF 262351Z AUTO 22011KT 10SM FU CLR 33/16 A2988 RMK AO2 SLP116 T03280161 10361 20328 56011 TSNO 8:51 PM,88.0,60.1,39,29.89,6.0,SW,11.5,-,N/A,,Haze, METAR KORF 270051Z AUTO 22010KT 6SM HZ FU CLR 31/16 A2989 RMK AO2 SLP122 T03110156 TSNO 9:51 PM,87.1,57.9,37,29.91,6.0,SW,12.7,-,N/A,,Haze, METAR KORF 270151Z AUTO 22011KT 6SM HZ FU CLR 31/14 A2991 RMK AO2 SLP127 T03060144 TSNO 10:51 PM,84.9,57.9,40,29.93,3.0,SW,12.7,-,N/A,,Haze, METAR KORF 270251Z AUTO 22011KT 3SM HZ FU CLR 29/14 A2993 RMK AO2 SLP134 T02940144 53018 TSNO 11:24 PM,82.4,69.8,66,29.93,7.0,SW,13.8,-,N/A,,Smoke, SPECI KORF 270324Z AUTO 22012KT 7SM FU FEW009 28/21 A2993 RMK AO2 TSNO 11:51 PM,82.0,70.0,67,29.94,5.0,SW,13.8,-,N/A,,Haze, METAR KORF 270351Z AUTO 22012KT 5SM HZ FU CLR 28/21 A2994 RMK AO2 SLP137 T02780211 TSNO *Words and acronyms indicating smoke observations as referenced in the above summary have been double underlined, bold faced and colored red. The FU indicates that the significant present weather obscuration is smoke. Smoke is a remark made at the end of the data set.

8-64
Figure A-40: 6/26/08 NTU Surface Observations
TimeEDT,TemperatureF,Dew PointF,Humidity,Sea Level PressureIn,VisibilityMPH,Wind Direction,Wind SpeedMPH,Gust SpeedMPH,PrecipitationIn,Events,Conditions,FullMetar 12:56 AM,78.1,64.0,62,30.10,5.0,SW,8.1,-,N/A,,Smoke, METAR KNTU 260456Z 23007KT 5SM FU SCT100 26/18 A3009 RMK SLP192 T02560178403000178 1:56 AM,78.1,63.0,60,30.08,7.0,SW,10.4,-,N/A,,Partly Cloudy, METAR KNTU 260556Z 22009KT 7SM FEW100 FEW200 26/17 A3007 RMK SLP186 T025610278 20256 58009 2:56 AM,75.9,63.0,64,30.07,6.0,SW,8.1,-,N/A,,Smoke, METAR KNTU 260656Z 23007KT 6SM FU FEW200 24/17 A3006 RMK SLP183 T024401723:56 AM,75.9,64.0,67,30.06,6.0,SW,8.1,-,N/A,,Smoke, METAR KNTU 260756Z 22007KT 6SM FU SCT200 24/18 A3005 RMK SLP178 T024401784:56 AM,75.0,64.0,69,30.06,6.0,SW,8.1,-,N/A,,Haze, METAR KNTU 260856Z 22007KT 6SM HZ FEW200 24/18 A3005 RMK SLP177 T0239017856008 5:56 AM,73.9,64.0,71,30.06,5.0,SW,8.1,-,N/A,,Haze, METAR KNTU 260956Z 22007KT 5SM HZ FEW200 23/18 A3005 RMK SLP177 T023301786:56 AM,73.9,64.9,73,30.06,5.0,SW,8.1,-,N/A,,Haze, METAR KNTU 261056Z 23007KT 5SM HZ FEW200 23/18 A3005 RMK SLP178 T023301837:56 AM,75.9,66.0,71,30.06,4.0,SW,9.2,-,N/A,,Haze, METAR KNTU 261156Z 23008KT 4SM HZ SCT200 24/19 A3005 RMK SLP178 8/005 T02440189 10256 20233 53001 8:56 AM,79.0,66.9,66,30.06,2.0,WSW,11.5,-,N/A,,Smoke, METAR KNTU 261256Z 24010KT 2SM FU BKN200 26/19 A3005 RMK SLP179 T0261019410:56 AM,87.1,66.9,51,30.04,6.0,SW,12.7,-,N/A,,Haze, METAR KNTU 261456Z 23011KT 6SM HZ BKN200 31/19 A3003 RMK SLP170 8/008 T03060194 58008 11:56 AM,89.1,68.0,50,30.01,6.0,SW,10.4,-,N/A,,Haze, METAR KNTU 261556Z 22009KT 6SM HZ BKN200 32/20 A3001 RMK SLP163 T0317020012:15 PM,89.6,66.2,46,30.01,3.0,SW,10.4,20.7,N/A,,Mostly Cloudy, SPECI KNTU 261615Z 22009G18KT 3SM BKN200 32/19 A3000 RMK SLP161 12:56 PM,90.0,66.0,45,30.00,1.5,SW,10.4,18.4,N/A,,Smoke, METAR KNTU 261656Z 22009G16KT 1 1/2SM FU BKN200 32/19 A2999 RMK SLP157 T03220189 1:56 PM,93.0,63.0,37,29.97,2.0,WSW,12.7,19.6,N/A,,Smoke, METAR KNTU 261756Z COR 24011G17KT 2SM FU BKN200 34/17 A2996 RMK SLP148 8/T03390172 10339 20244 56015 2:56 PM,95.0,57.0,28,29.95,6.0,West,11.5,21.9,N/A,,Haze, METAR KNTU 261856Z 26010G19KT 6SM HZ FEW060 BKN200 35/14 A2994 RMK SLP140T03500139 3:30 PM,95.0,60.8,32,29.94,3.0,SSW,13.8,-,N/A,,Mostly Cloudy, SPECI KNTU 261930Z 21012KT 3SM FEW040 BKN200 35/16 A2993 RMK SLP137 3:56 PM,95.0,59.0,30,29.93,6.0,WSW,15.0,23.0,N/A,,Haze, METAR KNTU 261956Z 25013G20KT 6SM HZ FEW040 BKN200 35/15 A2992 RMK SLP135T03500150 4:56 PM,95.0,59.0,30,29.92,6.0,WSW,18.4,25.3,N/A,,Haze, METAR KNTU 262056Z 24016G22KT 6SM HZ SCT040 BKN200 35/15 A2991 RMK SLP1318/108 T03500150 56017 5:56 PM,93.9,55.9,28,29.90,6.0,WSW,13.8,-,N/A,,Haze, METAR KNTU 262156Z 24012KT 6SM HZ SCT040 SCT200 34/13 A2989 RMK SLP125 T03440133 6:56 PM,93.0,59.0,32,29.89,5.0,SSW,11.5,-,N/A,,Smoke, METAR KNTU 262256Z 21010KT 5SM FU SKC 34/15 A2988 RMK SLP121 T03390150 7:56 PM,90.0,59.0,35,29.89,6.0,SSW,9.2,-,N/A,,Smoke,

8-65
METAR KNTU 262356Z 21008KT 6SM FU FEW200 32/15 A2988 RMK SLP120 T0322015010356 20322 56011 8:56 PM,87.1,57.9,37,29.90,7.0,SW,8.1,-,N/A,,Mostly Cloudy, METAR KNTU 270056Z 23007KT 7SM BKN120 BKN200 31/14 A2989 RMK SLP125 T03069:56 PM,84.9,57.0,38,29.92,7.0,SSW,10.4,-,N/A,,Scattered Clouds, METAR KNTU 270156Z 20009KT 7SM SCT120 29/14 A2291 RMK SLP131 T02940139 10:56 PM,82.9,66.0,56,29.94,7.0,SW,11.5,-,N/A,,Scattered Clouds, METAR KNTU 270256Z 22010KT 7SM SCT100 28/19 A2993 RMK SLP138 T02830189 5311:56 PM,82.0,68.0,62,29.95,7.0,SW,11.5,-,N/A,,Scattered Clouds, METAR KNTU 270356Z 22010KT 7SM SCT100 28/20 A2994 RMK SLP141 T02780200
*Words and acronyms indicating smoke observations as referenced in the above summary have been double underlined, bold faced and colored red. This observation is showing that there is 1.5 statute mile of visibility throughout the day, The FU indicates that the significant present weather obscuration is smoke. Smoke is a remark made at the end of the data set.

8-66
Figure A-41: 6/26/08 Satellite Imagery with Highway Overlay

8-67
Figure A-42: 6/26/08 GASP AOD Imagery

8-68
Chapter V: July 5, 2008
A stationary front was draped over central Virginia with weak areas of low pressure along the front near New Jersey and eastern Kentucky in the morning (Figure A-43). West-southwesterly and southwesterly winds preceded the front over southeastern Virginia (Figure A-44). HYSPLIT back trajectories indicate low level flow from the South 1 and Evans Road fire areas throughout the day (Figures A-45, A-46, and A-47). ORF reported smoke from 6:00 a.m. to 8:00 a.m., 9:23 a.m. to 12 noon, and from 2:06 p.m. to 3:00 p.m. with visibility as low as ½ mile (Figure A-48). NTU reported smoke at 4:00 a.m., at 8:00 a.m., from 9:40 a.m. to 12 noon, and from 1:00 p.m. to 1:15 p.m. with visibility as low as ½ mile (Figure A-49).

8-69
Figure A-43: 7/5/08 U.S. Weather Map

8-70
Figure A-44: 7/5/08 NOAA FSL Wind Plot

8-71
Figure A-45: 7/5/08 HYSPLIT Model Output for Hampton Roads
HYSPLIT back trajectories indicate low level flow from the South 1 and Evans Road fires all day long. The backward trajectories end 12 am July 05, 2008 at the Naval Air Station Oceana and the Norfolk International Airport. This model shows 6 particle trajectories originating at 100, 500 and 1000 meters above ground level and run for a simulation of 12 hours using the EDAS40 meteorological data set.

8-72
Figure A-46: 7/5/08 NOAA HYSPLIT Model Output for Hampton Roads
HYSPLIT back trajectories indicate low level flow from the South 1 and Evans Road fires all day long. The backward trajectories end 4 pm July 05, 2008 at the Naval Air Station Oceana and the Norfolk International Airport. This model shows 6 particle trajectories originating at 100, 500 and 1000 meters above ground level and run for a simulation of 12 hours using the EDAS40 meteorological data set.

8-73
Figure A-47: 7/5/08 NOAA HYSPLIT Model for Hampton Roads
HYSPLIT back trajectories indicate low level flow from the South 1 and Evans Road fires all day long. The backward trajectories end 7 pm July 05, 2008 at the Naval Air Station Oceana and the Norfolk International Airport. This model shows 6 particle trajectories originating at 100, 500 and 1000 meters above ground level and run for a simulation of 12 hours using the EDAS40 meteorological data set.

8-74
Figure A-48: 7/5/08 ORF Surface Observations
TimeEDT,TemperatureF,Dew PointF,Humidity,Sea Level PressureIn,VisibilityMPH,Wind Direction,Wind SpeedMPH,Gust SpeedMPH,PrecipitationIn,Events,Conditions,FullMetar 12:30 AM,73.4,73.4,100,30.04,10.0,WSW,9.2,-,0.00,,Overcast, SPECI KORF 050430Z 25008KT 10SM FEW040CB OVC120 23/23 A3004 RMK AO2 RAB12FRQ LTGICCGCA SW-NW TS SW-NW MOV E P0000 $ 12:33 AM,73.4,73.4,100,30.04,10.0,WSW,9.2,-,0.00,Rain-Thunderstorm,Light Thunderstorms and Rain, SPECI KORF 050433Z 25008KT 10SM -TSRA FEW040CB OVC120 23/23 A3004 RMK AO2TSB33RAB12 FRQ LTGICCGCA SW-NW TS SW-NW MOV E P0000 $ 12:51 AM,73.9,73.0,97,30.04,7.0,SSW,9.2,-,0.01,Rain-Thunderstorm,Light Thunderstorms and Rain, METAR KORF 050451Z 21008KT 7SM -TSRA FEW040CB OVC120 23/23 A3004 RMK AO2 TSB33RAB12 SLP171 FRQ LTGICCGCA SW-OHD TS SW-OHD MOV E P0001 T02330228 403560211 $ 1:14 AM,71.6,71.6,100,30.04,5.0,West,8.1,-,0.05,Rain,Rain, SPECI KORF 050514Z 26007KT 5SM RA BR FEW040 OVC110 22/22 A3004 RMK AO2 TSTS MOV E P0005 $ 1:38 AM,71.6,71.6,100,30.04,6.0,West,8.1,-,0.17,Rain,Rain, SPECI KORF 050538Z 26007KT 6SM RA BR OVC027 22/22 A3004 RMK AO2 TSE14 P001:51 AM,72.0,71.1,97,30.04,7.0,WSW,10.4,-,0.20,Rain,Rain, METAR KORF 050551Z 25009KT 7SM RA OVC028 22/22 A3004 RMK AO2 TSE14 SLP170P0020 60080 T02220217 10300 20211 50011 $ 2:21 AM,71.6,71.6,100,30.03,8.0,WSW,11.5,-,0.10,Rain,Rain, SPECI KORF 050621Z 25010KT 8SM RA OVC031 22/22 A3003 RMK AO2 P0010 $ 2:51 AM,71.1,70.7,99,30.02,9.0,SW,12.7,-,0.13,Rain,Rain, METAR KORF 050651Z 22011KT 9SM RA OVC039 22/22 A3002 RMK AO2 SLP165 P0013T02170215 $ 3:51 AM,70.0,69.1,97,29.99,10.0,SW,3.5,-,0.02,Rain,Light Rain, METAR KORF 050751Z 23003KT 10SM -RA BKN090 OVC120 21/21 A3000 RMK AO2 RAE20B38 SLP156 P0002 T02110206 $ 4:51 AM,71.1,69.8,96,30.00,4.0,WSW,6.9,-,0.00,,Overcast, METAR KORF 050851Z 24006KT 4SM BR OVC120 22/21 A3000 RMK AO2 RAE0755 SLP1P0000 60015 T02170210 56014 $ 5:08 AM,71.6,69.8,94,30.00,2.5,WSW,5.8,-,N/A,,Partly Cloudy, SPECI KORF 050908Z COR 24005KT 2 1/2SM BR FEW006 22/21 A3000 RMK AO2 $ 5:25 AM,71.6,69.8,94,30.00,0.8,SSW,6.9,-,N/A,,Mostly Cloudy, SPECI KORF 050925Z 20006KT 3/4SM BR BKN004 22/21 A3000 RMK AO2 CIG 003V005:51 AM,71.1,70.7,99,30.01,0.5,SW,6.9,-,N/A,Fog,Fog, METAR KORF 050951Z 23006KT 1/2SM FG FU OVC004 22/22 A3000 RMK AO2 SLP160 T02170215 $ 6:51 AM,71.1,71.1,100,30.01,0.5,SW,6.9,-,N/A,Fog,Fog, METAR KORF 051051Z 23006KT 1/2SM FG FU OVC004 22/22 A3001 RMK AO2 SLP162 T02170217 $ 7:13 AM,71.6,71.6,100,30.01,0.5,SSW,5.8,-,N/A,Fog,Fog, SPECI KORF 051113Z 21005KT 1/2SM FG FU OVC006 22/22 A3001 RMK AO2 $ 7:32 AM,71.6,69.8,94,30.02,1.0,SSW,6.9,-,N/A,,Overcast, SPECI KORF 051132Z 21006KT 1SM BR FU BKN006 OVC120 22/21 A3002 RMK AO2 $7:43 AM,71.6,69.8,94,30.02,5.0,SSW,5.8,-,N/A,,Smoke, SPECI KORF 051143Z 21005KT 5SM FU SCT006 OVC120 22/21 A3002 RMK AO2 $ 7:51 AM,73.0,70.0,90,30.02,5.0,SSW,6.9,-,N/A,,Smoke, METAR KORF 051151Z 21006KT 5SM FU SCT006 OVC120 23/21 A3002 RMK AO2 SLP1660015 70095 T02280211 10228 20211 53009 $

8-75
8:51 AM,73.9,71.1,91,30.03,10.0,SSW,5.8,-,N/A,,Mostly Cloudy, METAR KORF 051251Z 20005KT 10SM BKN120 23/22 A3003 RMK AO2 SLP169 T0233029:23 AM,75.2,71.6,89,30.03,2.0,SW,8.1,-,N/A,,Smoke, SPECI KORF 051323Z 22007KT 2SM FU FEW095 24/22 A3003 RMK AO2 $ 9:51 AM,77.0,72.0,84,30.03,2.0,WSW,9.2,-,N/A,,Smoke, METAR KORF 051351Z 24008KT 2SM FU CLR 25/22 A3003 RMK AO2 SLP168 T025002210:51 AM,80.1,71.1,74,30.04,2.0,WSW,6.9,-,N/A,,Smoke, METAR KORF 051451Z 24006KT 2SM FU FEW020 27/22 A3004 RMK AO2 SLP170 T026751005 $ 11:34 AM,80.6,71.6,74,30.03,5.0,WSW,8.1,-,N/A,,Smoke, SPECI KORF 051534Z 25007KT 5SM FU SCT020 BKN100 27/22 A3003 RMK AO2 $ 11:51 AM,81.0,70.0,69,30.03,5.0,Variable,6.9,-,N/A,,Smoke, METAR KORF 051551Z VRB06KT 5SM FU SCT020 BKN100 27/21 A3003 RMK AO2 SLP16T02720211 $ 12:51 PM,82.0,73.0,74,30.02,10.0,Calm,Calm,-,N/A,,Mostly Cloudy, METAR KORF 051651Z 00000KT 10SM FEW026 SCT036 BKN050 28/23 A3002 RMK AO2 SLP164 T02780228 $ 1:26 PM,80.6,71.6,74,30.02,10.0,NE,4.6,-,N/A,,Mostly Cloudy, SPECI KORF 051726Z 05004KT 10SM BKN027 27/22 A3002 RMK AO2 $ 1:51 PM,80.1,72.0,76,30.02,10.0,ENE,10.4,-,N/A,,Mostly Cloudy, METAR KORF 051751Z 06009KT 10SM BKN029 BKN037 27/22 A3002 RMK AO2 SLP165 T02670222 10278 20228 55005 $ 2:06 PM,80.6,71.6,74,30.02,3.0,East,10.4,-,N/A,,Smoke, SPECI KORF 051806Z 09009KT 3SM FU SCT030 BKN037 27/22 A3002 RMK AO2 $ 2:51 PM,84.0,71.1,65,30.01,4.0,SSE,16.1,23.0,N/A,,Smoke, METAR KORF 051851Z 15014G20KT 4SM FU SCT030CB BKN040 29/22 A3001 RMK AO2 SLP162 CB DSNT SW MOV NE T02890217 $ 3:51 PM,77.0,69.1,76,29.99,10.0,South,13.8,-,0.01,,Mostly Cloudy, METAR KORF 051951Z 18012KT 10SM SCT020 SCT030 BKN040 25/21 A2999 RMK AO2 WND 17026/1915 RAB24E45 SLP156 P0001 T02500206 $ 4:04 PM,78.8,69.8,74,29.99,10.0,South,12.7,17.3,N/A,Thunderstorm,Thunderstorm,SPECI KORF 052004Z 18011G15KT 10SM TS FEW020 SCT030CB BKN040 26/21 A2999 AO2 TSB04 OCNL LTGICCC W TS W MOV E $ 4:32 PM,78.8,69.8,74,29.97,10.0,South,15.0,19.6,N/A,,Scattered Clouds, SPECI KORF 052032Z 17013G17KT 10SM FEW030 SCT040 26/21 A2997 RMK AO2 TSB0CB DSNT N AND S MOV E $ 4:51 PM,79.0,70.0,74,29.95,10.0,SSW,9.2,19.6,N/A,,Scattered Clouds, METAR KORF 052051Z 20008G17KT 10SM FEW040 SCT100 26/21 A2995 RMK AO2 TSB0SLP140 CB DSNT N MOV E 60001 T02610211 58025 $ 5:51 PM,80.1,69.1,69,29.95,10.0,South,8.1,-,N/A,,Partly Cloudy, METAR KORF 052151Z 18007KT 10SM FEW100 27/21 A2995 RMK AO2 SLP141 CB DSNTT02670206 $ 6:51 PM,77.0,72.0,84,29.99,10.0,NE,4.6,-,N/A,,Scattered Clouds, METAR KORF 052251Z 04004KT 10SM FEW030 SCT120 25/22 A2999 RMK AO2 SLP153 T02500222 $ 7:44 PM,75.2,71.6,89,29.99,10.0,ENE,6.9,N/A,Thunderstorm,Thunderstorm, SPECI KORF 052344Z 06006KT 10SM TS BKN037CB 24/22 A2999 RMK AO2 TSB44 OCNLTGICCC W-N TS W-N MOV N $ 7:51 PM,75.0,72.0,90,29.99,10.0,NE,3.5,-,0.00,Rain-Thunderstorm,Light Thunderstorms and Rain, METAR KORF 052351Z 05003KT 10SM -TSRA SCT035 BKN042CB 24/22 A2999 RMK AO2TSB44RAB50 SLP155 OCNL LTGICCC W-N TS W-N MOV N P0000 60001 T02390222 10289 20239 53016 $ 8:26 PM,73.4,71.6,94,30.01,10.0,West,12.7,16.1,0.01,Rain-Thunderstorm,LigThunderstorms and Rain, SPECI KORF 060026Z 28011G14KT 10SM -TSRA FEW009 BKN017 OVC035CB 23/22 A30

8-76
RMK AO2 OCNL LTGICCC OHD TS OHD MOV N P0001 $ 8:51 PM,70.0,68.0,93,30.02,4.0,West,5.8,-,0.25,Rain-Thunderstorm,Light Thunderstorms and Rain, METAR KORF 060051Z 28005KT 4SM -TSRA BR FEW008 BKN023 OVC046CB 21/20 A300RMK AO2 SLP164 OCNL LTGICCC W-OHD TS W-OHD MOV N P0025 T02110200 $ 9:11 PM,69.8,68.0,94,30.01,7.0,West,5.8,-,0.02,Rain-Thunderstorm,Light Thunderstorms and Rain, SPECI KORF 060111Z 26005KT 7SM -TSRA FEW015 BKN046CB OVC055 21/20 A3001 RAO2 OCNL LTGICCC W-OHD TS W-OHD MOV N P0002 $ 9:51 PM,71.1,69.1,93,30.04,6.0,SW,9.2,-,0.12,Rain-Thunderstorm,Light Thunderstorms and Rain, METAR KORF 060151Z 22008KT 6SM -TSRA BR OVC039CB 22/21 A3003 RMK AO2 SLP1FRQ LTGICCC ALQDS TS ALQDS MOV N P0012 T02170206 $ 10:51 PM,70.0,69.1,97,30.01,9.0,SSE,4.6,-,0.09,Rain-Thunderstorm,Light Thunderstorms and Rain, METAR KORF 060251Z 15004KT 9SM -TSRA OVC041CB 21/21 A3001 RMK AO2 SLP163 LTGICCC E-OHD TS E-OHD MOV N P0009 60046 T02110206 50008 $ 11:02 PM,69.8,68.0,94,30.01,10.0,Calm,Calm,-,0.01,Rain,Light Rain, SPECI KORF 060302Z 00000KT 10SM -RA OVC039 21/20 A3001 RMK AO2 TSE02 P00011:51 PM,70.0,69.1,97,30.01,10.0,Calm,Calm,-,0.02,Rain,Light Rain, METAR KORF 060351Z 00000KT 10SM -RA BKN040 21/21 A3001 RMK AO2 TSE02 SLP1P0002 T02110206 $
*Words and acronyms indicating smoke observations as referenced in the above summary have been double underlined, bold faced and colored red. This observation is showing that there is ½ statute mile of visibility throughout the day; The FU indicates that the significant present weather obscuration is smoke. Smoke is a remark made at the end of the data set.

8-77
Figure A-49: 7/5/08 NTU Surface Observations
TimeEDT,TemperatureF,Dew PointF,Humidity,Sea Level PressureIn,VisibilityMPH,Wind Direction,Wind SpeedMPH,Gust SpeedMPH,PrecipitationIn,Events,Conditions,FullMetar 12:20 AM,75.2,66.2,73,29.96,5.0,West,12.7,-,N/A,Rain,Light Rain, SPECI KNTU 050420Z 26011KT 5SM -RA FEW030 SCT100 BKN200 24/19 A3004 RMK SLP143 T1SET 12:40 AM,73.4,64.4,73,30.04,6.0,West,13.8,25.3,N/A,Rain-Thunderstorm,LighThunderstorms and Rain, SPECI KNTU 050440Z 26012G22KT 6SM -TSRA FEW030CB BKN100 BKN200 23/18 A300RMK OCNL LTGICCC NW TS NW MOV N SLP172 T1SET 12:56 AM,73.0,64.9,76,30.04,7.0,WSW,6.9,,0.01,Thunderstorm,Thunderstorm,METAR KNTU 050456Z 24006KT 7SM TS FEW030CB SCT080 BKN100 BKN200 23/18 A30RMK OCNL LTGICCC NW TS NW MOV N SLP170 T1SET P0001 T02280183 403440228 1:10 AM,73.4,64.4,73,30.04,6.0,WSW,6.9,-,N/A,Rain-Thunderstorm,Light Thunderstorms and Rain, SPECI KNTU 050510Z 24006KT 6SM -TSRA FEW030CB SCT080 BKN100 BKN200 23/18 A3003 RMK TS NW MOV NE SLP170 T1SET 1:56 AM,72.0,64.9,78,30.04,6.0,West,10.4,-,0.04,Rain-Thunderstorm,Light Thunderstorms and Rain, METAR KNTU 050556Z COR 26009KT 6SM -TSRA SCT030CB SCT080 BKN100 BKN200 22A3003 RMK TS NW MOV NE SLP170 T1SET P0004 60005 8/378 T02220183 10294 20251006 2:56 AM,71.1,64.9,81,30.03,6.0,SW,12.7,-,0.01,Rain,Light Rain, METAR KNTU 050656Z 23011KT 6SM -RA SCT020 BKN100 BKN200 22/18 A3002 RMK SLP169 T1SET P0001 T02170183 3:56 AM,71.1,64.9,81,30.00,3.0,SW,6.9,-,0.03,,Smoke, METAR KNTU 050756Z 22006KT 3SM FU SCT100 BKN200 22/18 A2999 RMK SLP159 T2P0003 T02170183 4:56 AM,71.1,64.9,81,30.01,7.0,SW,8.1,-,N/A,,Mostly Cloudy, METAR KNTU 050856Z 23007KT 7SM SCT100 BKN200 22/18 A3000 RMK SLP161 600048/078 T02170183 55011 5:56 AM,71.1,64.9,81,30.02,6.0,SSW,5.8,-,N/A,,Overcast, METAR KNTU 050956Z 21005KT 6SM BR BKN120 OVC200 22/18 A3001 RMK SLP164 T02170183 6:56 AM,71.1,64.9,81,30.02,5.0,SSW,3.5,-,N/A,,Haze, METAR KNTU 051056Z 21003KT 5SM HZ BKN120 BKN200 22/18 A3001 RMK SLP164 T02170183 7:56 AM,73.0,66.0,79,30.03,5.0,WSW,4.6,-,N/A,,Smoke, METAR KNTU 051156Z 24004KT 5SM FU BKN120 BKN200 23/19 A3002 RMK SLP167 6070009 T02280189 10228 20211 53004 8:56 AM,75.0,68.0,79,30.04,7.0,SW,6.9,-,N/A,,Overcast, METAR KNTU 051256Z 22006KT 7SM FEW020 OVC120 24/20 A3003 RMK SLP171 T02399:40 AM,78.8,69.8,74,30.03,3.0,SW,9.2,-,N/A,,Smoke, SPECI KNTU 051340Z 23008KT 3SM FU FEW020 BKN120 26/21 A3002 RMK SLP169 9:56 AM,78.1,69.1,74,30.04,1.0,SW,9.2,-,N/A,,Smoke, METAR KNTU 051356Z 22008KT 1SM FU FEW020 BKN100 BKN200 26/21 A3003 RMK SLT02560206 10:56 AM,82.0,69.1,65,30.04,2.0,SW,10.4,-,N/A,,Smoke, METAR KNTU 051456Z 23009KT 2SM FU SCT020 BKN100 28/21 A3003 RMK SLP171 T02780206 53006 11:18 AM,82.4,68.0,62,30.04,0.8,WSW,9.2,-,N/A,,Smoke, SPECI KNTU 051518Z 25008KT 3/4SM FU SCT010 BKN080 28/20 A3003 RMK SLP17011:36 AM,82.4,66.2,58,30.04,0.5,WSW,6.9,-,N/A,,Smoke,

8-78
SPECI KNTU 051536Z 24006KT 1/2SM FU VV003 28/19 A3003 RMK SLP171 11:56 AM,81.0,66.0,60,30.04,1.0,WNW,6.9,-,N/A,,Smoke, METAR KNTU 051556Z 29006KT 1SM FU SCT010 BKN025 OVC080 27/19 A3003 RMK SLT2SET 02720189 12:35 PM,82.4,66.2,58,30.03,2.0,WSW,5.8,-,N/A,Rain,Light Rain Showers, SPECI KNTU 051635Z 25005KT 2SM -SHRA SCT010 BKN025 OVC080 28/19 A3002 RMK SLP168 T2SET 12:56 PM,81.0,68.0,65,30.03,2.0,West,3.5,-,0.00,,Smoke, METAR KNTU 051656Z 27003KT 2SM FU SCT010 BKN025 OVC100 27/20 A3002 RMK SLT2SET P0000 T02720200 1:15 PM,78.8,66.2,65,30.04,4.0,SE,20.7,26.5,N/A,,Smoke, METAR KNTU 051715Z 14018G23KT 4SM FU FEW010 BKN025 OVC080 26/19 A3003 RMKSLP173 T2SET 1:56 PM,79.0,66.0,64,30.03,7.0,SSE,8.1,-,N/A,Thunderstorm,Thunderstorm, METAR KNTU 051756Z 15007KT 7SM TS FEW025CB BKN040 OVC080 26/19 A3003 RMK LTGIC S SLP170 T1SET T02610189 10283 20228 55002 2:32 PM,78.8,66.2,65,30.02,6.0,SSE,13.8,-,N/A,Rain-Thunderstorm,Light Thunderstorms and Rain, METAR KNTU 051832Z 15012KT 6SM -TSRA FEW025CB BKN045 OVC080 26/19 A3002 OLTGIC SW SLP171 T1SET 2:56 PM,75.0,64.9,71,30.04,6.0,South,11.5,25.3,0.00,Rain-Thunderstorm,Light Thunderstorms and Rain, METAR KNTU 051856Z 17010G22KT 6SM -TSRA SCT025CB BKN065 BKN200 24/18 A300RMK TS OVD SLP170 T1SET P0000 T02390183 3:56 PM,73.4,66.2,78,30.00,4.0,South,8.1,-,N/A,Rain-Thunderstorm,Light Thunderstorms and Rain, METAR KNTU 051956Z 18007KT 4SM -TSRA SCT015CB BKN025 BKN090 23/19 A3000 SLP160 T1SET P0003 T02330194 4:27 PM,-9999,-9999,N/A,29.99,7.0,South,6.9,-,N/A,,Mostly Cloudy, SPECI KNTU 052027Z 19006KT 7SM SCT015 BKN025 BKN090 A2998 RMK TS MOV NE SLP153 T1SET 4:56 PM,75.9,53.6,46,29.95,7.0,SSE,5.8,-,0.02,,Mostly Cloudy, METAR KNTU 052056Z 16005KT 7SM FEW025 BKN090 BKN200 24/12 A2994 RMK SLP14T1SET P0002 60005 T02440206 58028 5:56 PM,79.0,69.1,72,29.96,7.0,Variable,4.6,-,N/A,,Mostly Cloudy, METAR KNTU 052156Z VRB04KT 7SM FEW030 BKN100 BKN200 26/21 A2995 RMK SLP14T2SET T02610206 6:56 PM,78.1,69.1,74,29.99,7.0,East,3.5,-,N/A,,Mostly Cloudy, METAR KNTU 052256Z 10003KT 7SM BKN100 BKN200 26/21 A2998 RMK SLP155 T2SETT02560206 7:56 PM,75.0,68.0,79,30.00,7.0,SE,3.5,-,N/A,,Mostly Cloudy, METAR KNTU 052356Z 13003KT 7SM FEW030CB BKN100 BKN200 24/20 A2999 RMK TS MOV N SLP157 T2SET 8/378 T02390200 10267 20228 52016 8:56 PM,73.0,64.0,73,30.02,6.0,West,15.0,24.2,N/A,Rain-Thunderstorm,LightThunderstorms and Rain, METAR KNTU 060056Z 28013G21KT 6SM -TSRA SCT150CB BKN100 BKN200 23/18 A3001 RMK TS NW MOV N SLP164 T1SET T02280178 9:56 PM,70.0,64.0,81,30.03,4.0,West,19.6,29.9,0.10,Rain-Thunderstorm,Thunderstorms and Rain, METAR KNTU 060156Z 27017G26KT 4SM TSRA FEW005 SCT010 BKN030CB OVC050 23/1A3001 RMK OCNL LTGICCCCG TS OVHD MOV NE SLP168 T1SET P0010 T02110178 10:20 PM,69.8,64.4,83,30.04,4.0,West,6.9,-,N/A,Rain-Thunderstorm,Thunderstorms and Rain, SPECI KNTU 060220Z 26006KT 4SM TSRA SCT010 BKN030CB OVC050 21/18 A3003 RMK OCNL LTGICCC TS N MOV NE SLP171 T1SET

8-79
10:56 PM,71.1,66.0,84,30.02,5.0,Calm,Calm,-,0.38,Rain,Light Rain, METAR KNTU 060256Z 00000KT 5SM -RA SCT010 BKN030 BKN100 22/19 A3001 RMK TMOVD NE SLP165 T2SET P0038 60048 8/870 T02170189 50002 11:56 PM,71.1,66.0,84,30.02,6.0,Calm,Calm,-,0.05,Rain,Light Rain, METAR KNTU 060356Z 00000KT 6SM -RA FEW010 SCT030 BKN100 22/19 A3000 RMK SLP165 P0005 T02170189 *Words and acronyms indicating smoke observations as referenced in the above summary have been double underlined, bold faced and colored red. This observation is showing that there is 1 to 2 statute mile of visibility throughout the day; The FU indicates that the significant present weather obscuration is smoke. Smoke is a remark made at the end of the data set.

8-80
Appendix B
NCEP CMAQ Predictive Modeling The National Centers for Environmental Protection (NCEP) CMAQ predictive modeling is another tool that may be used to forecast air quality. The NCEP CMAQ surface PM2.5 experimental model forecasts use point, area, and mobile emissions based upon the 2005 EPA National Emissions Inventory (NEI). These emission estimates are then projected for 2008. This model estimates emissions from electrical generating units (EGUs) using 2006 continuous emission monitor (CEM) data projected for 2008. For mobile sources, the model estimates emissions using EPA Office of Transportation and Air Quality (OTAQ) data in addition to 2005 NEI v1 emission data sets. The actual fires in Virginia and North Carolina are not included in the model inputs; however, climatological smoke and fire particulate emission estimates are included. Additional model information on the NCEP CMAQ predictive modeling may be found at http://www.emc.ncep.noaa.gov/mmb/aq/AQChangelogE.html. Figures B-1 through B-6 provide the NCEP CMAQ model predictions for Virginia for June 14th, 17th, 20th, 23rd, 26th, and July 5th, 2008. Circles denote PM2.5 continuous emission monitor 24-hour average data for each day, with the exception of July 5th. Continuous emission monitor data is not shown for July 5th. The NCEP PM2.5 model predicts good air quality on these days and given that there were no other incidents related to air quality, a review of this data demonstrates that but for the Evans road and South 1 fires, no exceedances of any NAAQS would have been measured at the Norfolk monitoring site.

8-81
Figure B-1: NCEP CMAQ PM2.5 Modeling Output for June 14, 2008
Figure B-2: NCEP CMAQ PM2.5 Modeling Output for June 17, 2008

8-82
Figure B-3: NCEP CMAQ PM2.5 Modeling Output for June 20, 2008
Figure B-4: NCEP CMAQ PM2.5 Modeling Output for June 23, 2008

8-83
Figure B-5: NCEP CMAQ PM2.5 Modeling Output for June 26, 2008
Figure B-6: NCEP CMAQ PM2.5 Modeling Output for July 5, 2008

8-84
Blue Sky Gateway Air Quality Modeling Predictions Another platform used to predict PM2.5 air quality is the Blue Sky Gateway PM2.5 model. This model uses meteorological, anthropogenic, and biogenic inputs to create air quality predictions. Anthropogenic emissions estimates use data created by MOBILE6 for on-road emissions. For point source emissions, the modeling inputs use data from the 2002 NEI and grow this data to current year estimates via EPA’s Economic Growth Analysis System (EGAS) version 4.0. Carryover smoke and emissions from the previous day are also inputs. Sonoma Technology, Inc. uses the MM5 weather forecast model to drive the CMAQ model on a 36-kilometer grid. BlueSky Gateway documentation and configurations are listed at http://www.getbluesky.org/bluesky/sti/realtime_configurations.pdf. Model runs are made with and without fire emissions as initial conditions. Therefore, model predictions for June 14th, 17th, 20th, 23rd, 26th, and July 5th without the inclusion of the pollution from the Evans Road and South 1 fires are useful in determining if the area would have exceeded any NAAQS if the fires had not occurred. Outputs from this model are animated simulations of air quality predictions and are not suitable for reproduction in paper text. These simulations are provided on the CD ROM included with this document. Outputs from this model show that without the inclusion of the pollution from the Evans Road and South 1 fires, the Hampton Roads area would have attained the 1997 and 2006 NAAQS for PM2.5. These outputs are strong evidence that but for the Evans Road and South 1 fires, the Norfolk monitoring site would not have exceeded any NAAQS.

8-85
Appendix C NAAPS model
Estimated surface concentrations of sulfate, smoke and dust using the NAAPS model
Supplement for the “But-For” Section of the Norfolk EE documentation
• Lacking speciation data at the sites with suspected smoke impacts, NAAPS (Navy Aerosol Analysis and Prediction System) was used to estimate ground level concentrations of smoke, sulfates and dust. The maps shown in Figures on pages 87-92 demonstrate that estimated dust and sulfate concentrations were moderate or low on the claimed exceptional event days, while smoke is clearly shown to exhibit high levels. Sulfate, smoke and dust are the major PM2.5 components typically observed during the summer season.
• Reference: – NAAPS model
• http://www.nrlmry.navy.mil/aerosol/
– Eastern US data archive • http://www.nrlmry.navy.mil/flambe-
bin/aerosol/display_directory_aer2?DIR=/web/aerosol/public_html/globaer/ops_01/eus/
• Results show that smoke was the principal contributor to PM2.5 and that sulfates were at best moderate on the claimed exceptional event days.

8-86

8-87

8-88

8-89

8-90

8-91
The following links provide a variety of articles on the Pocosin Lakes National Wildlife Refuge wildfire and the Great Dismal Swamp National Wildlife Refuge wildfire. These articles often refer to the amounts of smoke being generated and the impacts on air quality. “Is that smoke? Smell from huge N.C. fire drifts over region” The Virginian Pilot, 6/5/08 http://hamptonroads.com/2008/06/smoke-smell-huge-nc-fire-drifts-over-region “Officials: NC wildfire may double in size, close highways to Outer Banks” WRAL.com, 6/5/08 http://www.wral.com/news/local/story/3001194/ “N.C. wildfire refuge fire grows, some evacuations” USA Today, 6/6/08 http://www.usatoday.com/news/nation/2008-06-05-wildfire_N.htm “Hyde Fire’s smoke adds to morning fog” DailyAdvance.com, 6/7/08 http://www.dailyadvance.com/news/content/news/stories/2008/06/07/0607smokeDM.html?cxtype=rss&cxsvc=7&cxcat=7 “North Carolina fire consumes fewer than 1,000 more acres” Virginia Pilot, 6/7/08 http://hamptonroads.com/2008/06/north-carolina-fire-consumes-fewer-1000-more-acres “Spot fire empties more homes in Hyde: Wildfire moves deeper into Pocosin Lakes refuge; gusts may reverse blaze” The News and Observer, 6/11/08 http://www.newsobserver.com/news/story/1103760.html “Swamp fire in Suffolk spreads” Richmond Times Dispatch, 6/11/08 http://www.timesdispatch.com/rtd/news/local/article/-RTD_2008_06_12_0149/15141/

8-92
APPENDIX D Newspaper Articles
“Fire sets back tree revival project in Great Dismal Swamp” Virginia Pilot, 6/12/08 http://hamptonroads.com/2008/06/dismal-swamp-fire-spreading-suffolk-moving-toward-nc “High Noon-Temperature hits 89 degrees” Richmond Times-Dispatch, 6/14/08 http://www.timesdispatch.com/rtd/news/local/article/-RTD_2008_06_14_0173/15530/ “Smoke from fires to pose threat to region’s air quality” Virginia Pilot, 6/14/08 http://hamptonroads.com/2008/06/smoke-fires-pose-threat-region%E2%80%99s-air-quality “Swamp fire covers 2,400 acres; smoke invades Hampton Roads, N.C.” Virginia Pilot, 6/16/08 http://hamptonroads.com/2008/06/dismal-swamp-fire-now-covers-2400-acres-smoke-invades-hampton-roads-north-carolina “Should you be worried by all the smoke from the fires?” Virginia Pilot, 6/17/08 http://hamptonroads.com/2008/06/should-you-be-worried-all-smoke-fires “Falling trees complicate firefighting in Dismal Swamp” Virginia Pilot, 6/20/08 http://hamptonroads.com/2008/06/falling-trees-complicate-firefighting-dismal-swamp “Hampton Roads to see more smoky days” Richmond-Times Dispatch, 6/20/08 http://www.timesdispatch.com/rtd/news/local/article/-RTD_2008_06_21_0081/16637/ “Here it comes again: Smoke predicted for the weekend” Virginia Pilot, 6/21/08 http://hamptonroads.com/2008/06/here-it-comes-again-smoke-predicted-weekend “Great Dismal Swamp fire 50% contained, continues to spew smoke” Virginia Pilot, 6/22/08 http://hamptonroads.com/2008/06/great-dismal-swamp-fire-50-contained-continues-spew-smoke “Dismal Swamp fire partially contained, still spewing smoke” Virginia Pilot, 6/23/08 http://hamptonroads.com/node/469922

8-93
“Flames quickly got away from crew as swamp fire began” Virginia Pilot, 6/26/08 http://hamptonroads.com/2008/06/flames-quickly-got-away-crew-swamp-fire-began “Thunderstorms could spread 'historic' Dismal Swamp fire” Virginia Pilot, 6/30/08 http://hamptonroads.com/2008/06/thunderstorms-could-spread-historic-dismal-swamp-fire “Evans Road Wildfire Grows; Smoke Remains a Problem” WITN.com, 7/4/08 http://www.witn.com/home/headlines/19456249.html “Great Dismal Fire won’t give up” Richmond Times-Dispatch, 7/5/08 http://www.timesdispatch.com/rtd/sports/recreation/article/-RTD_2008_07_06_0210/3351/ “Wetlands can turn dry, burn” Richmond Times-Dispatch, 7/7/08 http://www.timesdispatch.com/rtd/lifestyles/health_med_fit/article/-RTD_2008_07_08_0003/3516/ “Great Dismal Swamp fire contained but not extinguished” Virginia Pilot, 8/1/08 http://hamptonroads.com/2008/07/great-dismal-swamp-fire-contained-not-vanquished “Great Dismal Swamp fire out; cost $11 million” Richmond Times-Dispatch, 10/10/08 http://www.timesdispatch.com/rtd/news/local/article/FIREGAT10_20081010-114404/108434/