Embed Size (px)
Citation preview
SURFACE EFFECTS OF BIOMACHINING PURE COPPER
By
Daniel Johnson
A Thesis Submitted to the Faculty of the
DEPARTMENT OF MECHANICAL ENGINEERING
In Partial Fulfillment of the Requirements
For the Degree of
MASTER OF SCIENCE
In Mechanical Engineering from
THE UNIVERSITY OF MICHIGAN
2 0 0 5
Committee Members
Albert Shih Associate Professor Steven Skerlos Assistant Professor
i
Table of Contents
Table of Contents i List of Figures ii List of Tables ii Chapter 1 Introduction 1
11 Current Small-Scale Manufacturing and the Need for Improvement 1 12 A Biological Solution 1
Chapter 2 Overview of the Biological Mechanism Involved in Biomachining 3 21 Biological Background and Species Selection 3 22 Basic Reactions of The Biomachining Process 4 23 Kinetics at the Cell Wall and Respiration 5
Chapter 3 Previous Work on Biomachining 9 31 Pioneering Work of Uno Kaneeda and Yokomizo 9 32 The work of Zhang and Li Mechanisms and Kinetics 12
Chapter 4 Experimental Setup 15 41 Introduction 15 42 Bacterial Media 17
421 Liquid Media 17 422 Solid Media 17
43 Culturing A ferrooxidans 18 44 Bacterial Concentration Estimation Technique The 3-Tube MPN 21 45 Sample Preparation 23 46 Aseptic Technique 23 47 Beginning an Experiment 24 48 Finishing an Experiment 25 49 Material Removal Rate 25
Chapter 5 Experimental Data 27 51 Roughness Results Summary 27 52 Bacterial Concentrations 29
521 Initial Bacterial Concentrations 29 522 Final Bacterial Concentrations 29
53 SEM Pictures 29 54 Material Removal Rate 31
6 Conclusions 32 References 33 Appendix A Experimental Roughness Values 35 Appendix B SEM Micrographs 40
ii
List of Figures
Figure 1 Acidithiobacillus Ferrooxidans 5 Figure 2The Cell wall of A ferrooxidans and Key Reactions 6 Figure 3 Cytochrome C Configuration 6 Figure 4 Biomachining Process Reactions 8 Figure 5 Basic Biomachining Experimental Setup 10 Figure 6 Biomachining Experiments on Fe and Cu 10 Figure 7 Mean MRR vs Temperature in Biomachining 11 Figure 8 Biomachining with Varied Applied Voltages for Fe and Cu 11 Figure 9 Biomachining Depth vs Time for Fe and Cu 12 Figure 10 Vg[Fe3+] and Vc[Fe3+] vs cell concentration and Kg and Kc vs cell concentration 13 Figure 11 Experimental Procedures Flow Chart 16 Figure 12 A ferrooxidans sample as-shipped from ATCC 18 Figure 13 Plate Media with Growth (Upper-Right) 19 Figure 14 Example Tubes with Bacterial Growth and Without 19 Figure 15 Culture Flask After ~48 Hours Incubation (2mL Innoculation) 20 Figure 16 Culture Flask After ~120 Hours Incubation (2mL Innoculation) 21 Figure 17 A Typical Dilution Series (note growth stops at the 9th dilution) 22 Figure 18 Typical 3-Tube MPN (note growth stops at 8th dilution) 23 Figure 19 Microbial Laminar-Flow Hood Used in the Experiments 24 Figure 20 Experiment Jar with Sample in Mount (without media) 25 Figure 21 Summarized Experimental Results 27 Figure 22 Summary of Roughness Values Before and After Incubation for Control Samples and Samples
Incubated with Bacteria 28 Figure 23 Possible Bacterial Traces on a Copper Surface 30
List of Tables
Table 1 Classifications species and potential applications of various organisms 4 Table 2 9K Media Components 9 Table 3 List of Equipment with Model and Manufacturers 16 Table 4 2-Solution 9K Media Components 17 Table 5 Solid Media Solution Components 17 Table 6 Material Removal Rate Data 31
1
Chapter 1 Introduction 11 Current Small-Scale Manufacturing and the Need for Improvement The ever accelerating rate of progress in microelectronics has brought on an age of devices whose features are continually shrinking with each new generation While the smaller scale of the circuits in these devices allows higher density and performance it introduces new manufacturing cooling and material challenges that must be overcome Perhaps the worst of these is the amount of heat produced that must be dissipated to prevent damage to the delicate metal traces To help achieve this necessary goal more and more manufacturers of integrated circuits are switching to using copper for their principle conductor as copper has not only excellent electrical conductivity but also one of the highest thermal conductivities of all pure metals Traditional manufacturing of microscopic patterns in copper involves a process called wet chemical etching The pattern of circuits is first printed in negative onto the copper using photolithographic techniques The part is then typically exposed to a solution of ferric chloride (FeCl3) which can remove the copper at rates up to 234 micromhr [1] The samples are then simply rinsed and the photoresist is removed with another solvent leaving the copper pattern on its substrate material While traditional chemical etching with ferric chloride is fast and effective it has several drawbacks
1 Ferric chloride works too quickly at eroding the metal for fine depth control It is best used to remove all copper down to a substrate material that does not react with it As future devices may utilize multiple three-dimensional features made out of copper rather than uniform-depth monolayers a slower more controlled process is desired
2 Ferric chloride along with some other chemical etching techniques also produces a very exothermic reaction which can leave a heat affected zone on the surface of the metal being etched and this can degrade the desired material properties of the metal This is more of a serious issue for MEMs (micro electro-mechanical devices)
3 Ferric chloride is also toxic to both humans and the environment posing many disposal problems
4 Finally as the process proceeds the ferric chloride becomes less and less efficient due to the buildup of dissolved ions While many processes have been invented to ldquoregeneraterdquo the ferric chloride and prolong the usable time of a given volume ultimately it still ends up as a hazardous waste
A more environmentally benign process in controlled etching of small-scale structures in copper is thus desired especially as this area of the industry expands in the future 12 A Biological Solution One very promising solution to this problem comes from a recently discovered process known as ldquobiomachiningrdquo Instead of using highly toxic ferric chloride or other chemicals to etch the copper bacteria can be used to produce the same effect at a slower
2
rate and at lower temperatures all for very low energy input and cost If this process can be properly understood controlled and even accelerated (where desirable) it holds promise as a commercially viable alternative to chemical etching The species involved and explanations of the underlying chemical processes are described in detail in section 2 Past experimental work is described in section 3 while experimental procedures and results of this study are elaborated upon in sections 4 and 5 Finally conclusions and suggestions for future work are given in section 6
3
Chapter 2 Overview of the Biological Mechanism Involved in Biomachining 21 Biological Background and Species Selection Every organism can be classified based on where it obtains its carbon used for growing and repairing damage and how it produces energy the fuel it uses to run all metabolic processes Organisms known as lithotrophs obtain carbon from inorganic compounds including carbon dioxide Organotrophs on the other hand obtain all the carbon they use from organic compounds including those from other organisms Each of these groups can be further subdivided based on how included organisms obtain energy The prefix Chemo- is given to those organisms that extract energy by processing matter with chemolithotrophs typically processing inorganic matter and chemoorganotrophs which process organic matter Many large animals (including humans) and bacteria are classified as chemoorganotrophs The other energy production method involves using energy from light and organisms that use this process have the prefix Photo- assigned to them Plants are the most common examples of photolithotrophs[2] Organisms fitting into the category of chemolithotrophs have been the subject of intensive research lately for their unique ability to either oxidize or reduce certain inorganic compounds especially heavy metals Species such as Shewanella oneidensis have been investigated for a process known as ldquobioremediationrdquo in which toxic chemicals are taken out of groundwater by the natural reduction reactions of the bacteria Species such as Geobacter metallireducens and Rhodoferax ferrireducens have shown potential application for biologically-based fuel cells Finally species such as Desulfovibrio sp and Acidithiobacillus ferrooxidans (formerly Thiobacillus ferrooxidans) have been shown to consume metals as part of their metabolism This process termed ldquobiomachiningrdquo has been analyzed for potential applications to micro and nano-scale manufacturing including for the potential processing of copper Acidithiobacillus ferrooxidans shows the most promise of the two both for its ease of culturing and pronounced consumption of the metal as it grows A summary of the classifications species and potential applications is displayed below in Table 1
4
Table 1 Classifications species and potential applications of various organisms
Carbon Source Energy Source Sample Species Applications
Acidithiobacillus ferrooxidans
Biomachining [2 3 4 5 6 7 8] Bioleaching [9 10 11]
Thiobacillus thiooxidans Bioleaching [9]
Geobacter metallireducens
Microbial fuel cells [12] Bioremediation [13 14]
Shewanella oneidensis Bioremediation [15]
Desulfovibrio sp Biomachining [16]
Chemolithotroph (Energy source Inorganic matter)
Rhodoferax ferrireducens Microbial fuel cells [17]
Lithotroph (Carbon source CO2)
Photolithotroph (Energy source Light)
Plants Chlorella Cyanophta etc NA
Chemoorganotroph (Energy source Organic matter)
Humans most animals most bacteria
NA Organotroph (Carbon source Organic matter)
Photoorganotroph (Energy source Light)
Rhodospirillaceae NA
22 Basic Reactions of The Biomachining Process The Acidthiobacillus ferrooxidans organism is a small rod-like bacterium (shown below in Figure 1) measuring about 1 microm long and 5 microm in diameter [2] that contains a unique set of attributes that makes it suitable as a living micro-machining tool This species belongs to a group of organisms known as chemolithotrophs organisms (usually single-celled) able to obtain energy by the oxidation of inorganic substrates rather than the usual substances such as glucose As a source of carbon the organism can obtain all its needs solely by using CO2 dissolved in its medium Oxygen serving as an electron acceptor does have to be present to make these reactions possible thus technically making A ferrooxidans aerobic The production of energy is obtained from the oxidation of the substrate as well as the combination of hydrogen ions and oxygen being fused into water [18 19] Finally this bacterium is also considered an acidophile as it is able to thrive in a pH level less than 3 [8]
5
Figure 1 Acidithiobacillus Ferrooxidans [20]
The overall reaction employed by A ferrooxidans can be summarized as a combination of the continued oxidation of ferrous iron (Fe2+) to ferric iron (Fe3+) as well as the reduction of H+ ions (from the acidic environment) with oxygen to produce water The reaction is shown below
OHFeHOFe 23
22 22212 +rarr++ +++ (1)
It is the production of the ferric iron that makes this organism useful in micromachining of metals The ferric iron is able to oxidize both pure neutral copper and iron into charged soluble forms thus being able to corrode a solid surface of either metal The reactions for each are summarized below
++ rarr+ 230 32 FeFeFe (2) +++ +rarr+ 2230 22 FeCuFeCu (3)
While the iron and copper ion creation reactions shown above in equations 2 and 3 occur outside the cell those involved in the continuous production of ferric iron and water shown in equation 1 occur inside the cell as described below [8] 23 Kinetics at the Cell Wall and Respiration The cell of each Acidithiobacillus ferrooxidans has a cell wall made up of many layers that separates the interior of the cell the cytoplasm from its environment The outer region of this wall consists of an outer membrane and a region called the peptidoglycan This is then followed by a gap called the periplasmic space where the pH of fluid inside the cell is still near that of the environment (usually ~2) Finally an inner membrane separates the periplasmic space from the cytoplasm The pH in this membrane increases to around 45 and in the cytoplasm the pH approaches neutral The reason for such marked pH variation is twofold the oxidation of ferrous to ferric iron is easier to facilitate in lower pH environments and an excess of hydrogen ions (ie a low pH) allows an ample source of reactant for the water production reaction [7 21] A representation of the cell wall is shown below
6
Figure 2The Cell wall of A ferrooxidans and Key Reactions [7]
The first part of these reactions the continuous production of Fe3+ from Fe2+ involves the transfer of electrons from the ferrous iron This process is accomplished by a series of cellular compounds known as cytochromes labeled cyto-c and cyto-a1 in Figure 2 These large molecules imbedded in the inner membrane of the cell wall often contain metallic atoms such as iron or copper that have a high affinity for accepting electrons An example of a typical cytochrome is shown below
Figure 3 Cytochrome C Configuration [21]
In the process of stripping an electron from the iron atoms these macromolecules are reduced The electrons are then once again stripped by another cytochrome further in the cell thus passing the electrons into the cytoplasm by a series of oxidation-reduction reactions This group of cytochromes that strip and move electrons form what is called an ldquoelectron transport chainrdquo In A ferrooxidans we see cytochrome-c (which strips the
7
electrons from the iron ions) in combination with cytochrome-a1 [7] It is believed that cytochrome-a1 performs a similar task to another cytochrome in its family called a3 which facilitates the reoxidation (taking the acquired electrons back out) of c-cytochromes thus acting as a c-cytochrome oxidase Cytochrome-a1 is believed to be the final link in the electron transport chain described above It must be said however that the exact functioning of this group of cytochromes is still not well defined [21] The oxidation of iron takes place in the low pH of the periplasmic space along with the uptake of H+ ions The whole goal of these two processes the coupling of the reoxidation of the cytochromes and the reactions of hydrogen ions with oxygen is to produce useable energy for the organism These reactions produce energy by virtue of the free energy change between the products and the reactants and this energy is used to bind an extra phosphate onto the Adenosine diphospate molecule thus creating Adenosine triphosphate The actual efficiency of the cells in utilizing the redox reactions can vary from 10-50 but this is still efficient enough to produce the necessary energy to create ATP [22] The ATP molecule is vital in nearly all organisms as a means of storing and transporting energy throughout the cell It can store energy in the extra phosphate bond until needed by some cellular process and then release it to create ADP and a free phosphate (which can then be recombined into ATP again) The phosphate bonds are theoretically able to hold anywhere from 37656ndash58576 kJ (9000-14000 calories) each and for each atom of oxygen consumed in a reaction 1-4 phosphate bonds can be produced [21] Another theoretical calculation estimates that the overall reaction used by A ferrooxidans produces around 33472 kJmol (8 kcalmol) of usable energy [2 5] The energy creating process forms a circulatory system of sorts for the iron ions as they are continually converted to Fe3+ exuded from the cell reduced to Fe2+ by their reaction with copper or iron then reabsorbed into the periplasmic space for reoxidation Hydrogen ions are obviously consumed and water is produced Thus H+ ions must be continually supplied or the reaction cannot move forward A representation of the reactions involved is depicted below in Figure 4
8
Figure 4 Biomachining Process Reactions [8]
The lower reactions on the chart come from the ferric iron ionrsquos natural hydrolysis with water ultimately producing Fe(OH)3 and free H+ ions It is in part due to this reaction that the ferric iron ion reaction with the workpiece material is best achieved by those bacteria actually in contact with the part surface The H+ supplying reaction as labeled is a consequence of the copper ions reacting with H2S which was added to the medium The exact reason for using H2S rather than some other H source is described below in section 32 Acidithiobacillus ferrooxidans through the complex reactions described above is thus able to make the energy it needs to survive by performing a useful task to manufacturing engineers Through the oxidation of pure iron and copper this organism is able to produce a machining effect comparable to chemical etching If all of the parameters of this biomachining process can be understood and controlled it may become a commercially viable process able to compete with existing chemical etching in terms of productivity and yet be far more environmentally benign
9
Chapter 3 Previous Work on Biomachining 31 Pioneering Work of Uno Kaneeda and Yokomizo One of the earliest studies of using A ferrooxidans in a manufacturing capacity was performed by Uno Kaneeda and Yokomizo in Japan in 1993 as described in [2] While employing a very basic experimental setup they were able to show some preliminary data on the effects of changing some of the parameters involved in the biomachining process and even suggest a way to accelerate the process with a properly-applied electric potential The setup first employed very pure samples of iron (9995) and copper (9990) which had line patterns put onto them by existing photolithography techniques This left alternating sections of photoresist and exposed metal on the upper surfaces The bacteria and the samples were immersed in a medium known as ldquo9Krdquo the ingredients of which are described below in Table 2 Table 2 9K Media Components [2] Component Mass10L Water (NH4)2SO4 30 g K2HPO4 5 g MgSO4 5 g KCl 1 g Ca(NO3)2 01 g Deionized water 10 L H2SO4 Adjust the pH to 25 FeSO4 3 vol
The samples and bacteria immersed in the 9K medium and in open beakers were then incubated at a constant temperature and constantly mixed with an agitator The sketch of the experimental setup is shown below in Figure 5
10
Figure 5 Basic Biomachining Experimental Setup [2]
The experiments were first run with a constant temperature of 28ordm C and a shaking rate of 160 cycles per minute Three different strains of Acidithiobacillus ferrooxidans (ATCC 13598 13661 and 33020) were tested in these runs on both metals and all yielded similar results as shown below in Figure 6
Figure 6 Biomachining Experiments on Fe (left) and Cu (right) [2]
As shown in the graphs the biomachining rate at these conditions is almost directly proportional to time for all three species which makes the process time relatively simple to predict For Cu the MRR was about 20 micromhr and for Fe the MRR was 14 micromhr The control of the experiment using just the 9K medium shows that the bacteria do indeed produce all of the material removal effect despite the corrosive (pH ~25) medium
11
As a variation on the initial conditions the researchers varied temperature for one strain (ATCC 13598) and observed the mean material removal rate The results for both Fe and Cu are shown below in Figure 7
Figure 7 Mean MRR vs Temperature in Biomachining [2]
As the figure shows the peak MRR for Cu (~23 micromhr) is near 30ordmC while for Fe the max MRR (~20 micromhr) occurs near 40ordmC Thus temperature proves to be a relatively key variable in the efficiency of biomachining Any process designed to employ biomachining will obviously have to control temperature to keep the MRR near its theoretical maximum As a final experiment with biomachining Uno et al applied different electric potentials to the workpieces to observe how changing that would influence the biomachining rate The results for using strain ATCC 13598 on Fe and Cu for a variety of applied voltages are shown below in Figure 8
Figure 8 Biomachining with Varied Applied Voltages for Fe (left) and Cu (right) [2]
As shown above if positive applied voltages are used the MRR is accelerated over baseline For iron if the voltage applied is negative (5V in this case) the MRR is actually negative indicating material is deposited Thus applied voltage can have an accelerating effect in the biomachining rate but more work needs to be done to determine if there is a maximum voltage which yields a benefit to the process
12
32 The work of Zhang and Li Mechanisms and Kinetics Another pioneering group in the area of biomachining worked in China producing papers on the subject in 1996 and 1998[7 8] Zhang and Li not only elaborated on the biological mechanisms used by A ferrooxidans but also gave equations relating the kinetics of the overall reaction to experimental conditions Their more detailed work can give us valuable insight into the process and an initial point to begin studying parameter adjustment in the biomachining process In their 1996 paper Zhang and Li perform an experiment very similar to the one by Uno et al The sample was prepared once again using existing photolithographic techniques The prepared sample was then incubated with the bacteria for a period of time Finally the sample was removed periodically and measured both with a profilometer and scanning electron microscope The data they collected showed that the average biomachining (ie material removal) rates were 10 micromhr for iron and 135 micromhr for pure copper The data graphs producing these rates are shown below in Figure 9
Figure 9 Biomachining Depth vs Time for Fe (left) and Cu (right) [7]
As figure 9 shows the biomachining rates in Zhang and Lirsquos tests remained nearly constant over the length of the tests In addition to this Zhang and Li explained the Fe oxidizing and reducing reactions involved as used above as well as explaining what parts of the cell (periplasmic space cytochromes etc) are used in the reactions They concluded that the biomachining process is entirely dependent on the biological recreation of Fe3+ In 1998 Zhang and Li went further in explaining the biomachining process by studying the kinetics of each sub-reaction and how experimental concentrations affected each of these reaction rates The first reaction relates the consumption of Fe3+ labeled as
][ 3+FeVc below in equation 4 to the mass change of a Cu sample
))((5463102][ 403 hLmmolCuFeVc ∆=+ (4)
After this the rate of generation of Fe3+ (shown below as Vg[Fe3+ ] in equation 5) is dependent on both its consumption (denoted as Vc[Fe3+ ] below) and what Zhang and Li called its ldquoincrease raterdquo (Vt[Fe3+ ])
13
))(]([[][ 333 hLmmolFeVFeVFeV ctg
+++ += (5) Vg[Fe3+ ] and Vc[Fe3+ ] tend to become equal over time and Vt[Fe3+ ] starts out large in the first few hours of an experiment and then turns to zero as the system reaches a stable ion concentration The equilibrium equations of generating and consuming Fe3+ show that these quantities are directly proportional to the Fe2+ and Fe3+ concentrations respectively
][][
2
3
+
+
=Fe
FeVKg g (6)
][][
3
3
+
+
=FeFeV
Kc c (7)
Kg (equation 6) is the rate coefficient of generating Fe3+ and Kc (equation 7) is the rate coefficient of consuming it Both have units of mmol(Lh) In their experiments Zhang and Li found that the generation and consumption rates and coefficients were directly proportional to bacterial cell concentration The data for these rates taking out effects of non-biological sources and sinks of Fe3+ are shown below
Figure 10 Vg[Fe3+]and Vc[Fe3+] vs cell concentration (left) and Kg and Kc vs cell concentration
(right) [8] The result of all of this is that the material removal rate is directly proportional to the amount of A ferrooxidans organisms present as might be expected What these graphs donrsquot show is whether or not there is some maximum bacterial concentration at which biomachining can occur This leaves an open question for our research as one obviously cannot increase the bacterial count indefinitely In their experiments Zhang and Li studied how the hydrolysis of Fe (as described above in section 2) affects H+ ion concentration which also affects the biomachining
14
process since it is taken up by A ferrooxidans in the respiration process They found that the natural decrease due to hydrolysis was lower than that caused by consumption by the organism The big conclusion of the experiments is that H+ ions must be supplied to keep the reaction moving and allow the organism to reproducegrow Ideally the pH should be kept around 2 to not negatively impact the process A final conclusion reached by Zhang and Li is that the buildup of Cu ions in solution (from their oxidation by Fe3+) can cause the biomachining process to slow down As shown in the schematic diagram of the reactions used above they took care of this problem by bubbling H2S gas into the solution This gas supplies H+ ions and creates CuS which precipitates thus removing the Cu ions from solution
15
Chapter 4 Experimental Setup 41 Introduction To conduct our own experiments with A ferrooxidans the bacteria first had to be obtained and cultured successfully Several variations on the basic liquid media for this species were tried until one that was both effective and easy to make was found Before continuous cultures could even be created however the bacteria first had to be isolated which is most easily done on solid media such as common bacterial agar Due to the acidic conditions required by this bacterial species a specialized form of gelatinous media had to be found that would solidify even under a low pH Finally once we were confident we had isolated A ferrooxidans and were able to continuously culture it we had to devise a successful way to estimate bacterial concentrations Once the bacteria were successfully isolated and growing an experiment was conducted to expand on some of the work described above done by early researchers in the field For nano and micro-scale machining tasks a high degree of precision is required to make any kind of material removal process successful While Zhang Li and others were able to show that using an active population of A ferrooxidans could remove a significant amount of material from a copper surface they did not go into any detail on the resulting surface and specifically its finish For any process that may arise out of using these bacteria to machine copper being able to produce level even surfaces is highly desired The experiments thus conducted by the author as described in detail below looked at changes in surface finish and roughness for several copper sample pieces Both quantitative average roughness values and qualitative surface descriptions were obtained and are discussed below All of the experiments show that without some significant changes to the basic biomachining process surface finish quality degrades significantly and even though drastic material removal can be seen the uneven nature of its distribution across a given surface makes direct applications in manufacturing seem doubtful A second experiment was conducted to obtain a crude estimate of the material removal rate of biomachining pure copper surfaces in the hopes of replicating previous results In that experiment very thin copper foil pieces were exposed to solutions of A ferrooxidans as well as sterile media for the same time periods as the copper blocks The difference in mass was recorded and converted into a material removal rate using known material properties The experimental procedures used to observe the effects of A ferrooxidans on surface roughness and material removal rates of the copper samples involved many steps and many different pieces of laboratory equipment The combination of experimental steps and the continuous culture protocol employed to maintain a healthy population of the bacteria is summarized in the flow chart below (Figure 11) and a full list of equipment used appears in the subsequent table (Table 3) Detailed explanations of each step are laid out in the following sections
16
Figure 11 Experimental Procedures Flow Chart
Table 3 List of Equipment with Model and Manufacturers Chemicals Stock distributed by Sigma Incubator and Shaker innova 4300 by New Brunswick Scientific Microbial Hood BioGARD Hood by Baker Company Inc Media Filtration System Stericup Pre-Sterilized Vacuum Driven Disposable
Filtration System 2 microm filter 1L Jar by Millipore Culture Flasks Pyrex 250 mL Erlenmeyer Flasks distributed by Sigma Experiment Jars 500 mLWide-Mouth Short Clear Glass Jars distributed by
Fisher MPN Test Tubes Fisherbrand Disposable Culture Tubes Borosilicate Glass
by Fisher Dilution Series Tubes Falcon Blue Max Jr 15 mL Polypropylene Conical Tubes
by Becton Dickinson Plates Fisherbrand 15mm Cell Culture Plates by Fisher Flask Filter Top Fisherbrand Non-Sterile Cotton Gauze Sponges by Fisher Copper Foil Copper Shim Stock (110 Annealed) by Lyon Industries Copper Stock Alloy 101 Extreme-Temperature Electronic-Grade Copper
distributed by McMaster-Carr Profilometer Talysurf Intra by Taylor-Hobson SEM XL30 by Philips Mass Scale PG802-S by Mettler Toledo pH Meter Φ360 by Beckman
17
42 Bacterial Media For any microorganism to be able to grow and reproduce successfully it must be kept in an environment that contains all of the nutrients and environmental conditions it requires to live A ferrooxidans as described above typically requires a liquid environment with a low pH and some metal to serve as its source of electrons in the respiration process This particular species has been known to biologists for some time so there are standard media recipes available for it and other similar acidophilic bacteria The most commonly used media is referred to as 9K which is a rather simple mix of salts and sulphate compounds combined with a source of iron for use by the bacteria 421 Liquid Media The most basic recipe found for 9K bacterial media was used based on that listed at the website of All-Russian Collection of Microorganisms[23] This recipe employs two separate solutions that are mixed after sterilization Each component is added in the order listed Table 4 2-Solution 9K Media Components [23] Solution 1 Solution 2 700mL H2O 300mL H2O 01g KCl 30g FeSO47H2O 3g (NH4)2SO4 05g Mg SO4 05g K2 PO4 001g Ca(NO3) 2 The pH of each is adjusted to 25-26 using sulphuric acid (H2SO4) Finally each solution is passed through a 2 microm filter into a sterile sealed flask When the two solutions mix in the flask the mixture becomes opaque and yellow and a precipitate forms The precipitate eventually oxidizes even in the sealed flask rendering the media less useful for bacterial culture of A ferrooxidans The approximate shelf-life of this 9K media is two to three weeks 422 Solid Media Solid media was used for isolation of A ferrooxidans after first obtaining samples from ATCC This plate media incorporated three solutions that were combined at the time of pouring The solution formulations (as originally given) are shown in Table 5 Table 5 Solid Media Solution Components [24] Solution 1 Solution 2 Solution3 10g Fe SO4 09g (NH4)2SO4 1g100mL Bacterial Agar 500mL H2O 035g Mg SO4 0175g Tryptone Soy Broth 500mL H2O
18
Solutions 1 and 2 each had their pH adjusted to ~2 using H2SO4 Instead of TSB Bacto Tryptone was used and desired results were still achieved After experimenting with several ratios of the solutions we found a 11410 combination of solution 1solution 2solution 3 worked very well Further increasing the proportion of agar solution produces a media that solidifies very well despite the acidic nature of the other solutions Plates using this media were poured under a bacterial hood to ensure sterility 43 Culturing A ferrooxidans The bacterial sample came directly from ATCC (21834) in a sealed test tube as shown below in Figure 12
Figure 12 A ferrooxidans sample as-shipped from ATCC
After acquiring the initial sample from ATCC 2 mL of sample broth were directly deposited onto plate media Samples were then left to incubate at 35deg C until bacterial colonies became visible The colonies that did appear were extremely small units almost impossible to see except under high optical magnification To the naked eye bacterial growth appeared as a bright yellow almost-transparent cloud on the surface of the media typically arranged as one large mass A typical plate with growth is shown below in Figure 13
19
Figure 13 Plate Media with Growth (Upper-Right)
To further isolate A ferrooxidans streaks were taken off of the growth on the plates using sterile plastic picks and mixed into 15mL conical tubes of liquid 9K media After one or two days of being incubated again at 35degC bacterial growth appeared as a drastic color change of the media which turned a bright orange and developed an iridescent film at the surface The precipitate also turned a dark orange color As a control blank tubes of sterile 9K media were incubated at identical conditions The controls showed almost no change with the usual light yellow precipitate color only darkening slightly as it oxidized A side-by-side comparison of the media exhibiting growth and a control sample is shown below in Figure 14
Figure 14 Example Tubes with Bacterial Growth (left) and Without (right)
Continuous cultures of A ferrooxidans were produced by taking several mL from tubes showing the most dramatic signs of growth and mixing them into flasks of 9K media Each flask was created with a vented top of tightly packed medical gauze which was covered with aluminum foil and autoclaved Each 250 mL flask was filled with 150 mL of 9K media upon use and after the bacterial broth was mixed in the vented tops
20
were replaced all under a bacterial hood to avoid contamination The inoculated flasks were then incubated at 35degC and shaken at 120 cyclesminute Using this culturing protocol one flask would last approximately four to seven days at which time the process was repeated using 2 mL from the previous flask The growth behavior visible in the shaken flasks was very similar to that mentioned for the sealed conical tubes used in isolating the bacteria The 9K media generally turned a bright orange color within two days (Figure 15) and the precipitate solidified into one darker mass on the bottom of the flask As time passed the color would fade back to almost the same light yellow color of uninnoculated 9K media but the precipitate would remain as one hard solid mass on the bottom (Figure 16) Generally this reversal of the color change would happen after four to five days and that was used that as an indicator of when to create a fresh inoculation As a control sterile 9K media was again incubated under identical conditions and just like in the tube controls only a slight darkening of the precipitate was observed after many days due to oxidation
Figure 15 Culture Flask After ~48 Hours Incubation (2mL Innoculation)
21
Figure 16 Culture Flask After ~120 Hours Incubation (2mL Innoculation)
44 Bacterial Concentration Estimation Technique The 3-Tube MPN Due to the small size of A ferrooxidans cells conventional counting techniques that rely on optical microscopy were deemed ineffective for estimating the bacterial populations in the biomachining experiments Instead of using a device such as a hacyometer to count individuals present in a pre-determined fluid volume by visual inspection a statistical method known as the most probable number (or MPN) technique was used that could give very clear results with reasonable levels of accuracy[25 26] This technique involves two main steps creating an initial series of dilutions of the original sample and then using those dilutions to inoculate a collection of test tubes to watch for growth Starting with an initial bacterial sample in this case broth incubated for 48 hours the first step in creating an MPN is to create a collection of dilutions of that initial sample Initially one mL of original sample is put into a test tube containing 9mL of sterile media of the same type used in culturing the bacteria The resulting 10 mL solution is then a 110 dilution of the original bacterial solution To create the next dilution 1 mL of the new solution is withdrawn and put into a second tube of 9 mL of sterile media The second tube now with 10 mL of solution is now a 1100 dilution of the original sample Each subsequent transfer of 1 mL to a fresh tube of 9 mL sterile media creates another power of ten dilution of the original bacterial sample In this
22
manner the original solution can be diluted as many times as is believed to be necessary A typical dilution series is shown below (Figure 17) and this particular series has had enough time to clearly show signs of growth The number of dilutions must be sufficient to reach a point where no organisms are transferred to the next subsequent dilution Ideally there will be at least two or more dilutions where no growth will appear or the resulting MPN is less likely to be accurate if at all usable Once the dilution series has been created generally carried out to eleven dilutions for the biomachining tests part of that series is used to inoculate the tubes used as growth indicators in the most probable number test In a three-tube MPN an array of test tubes containing 9 mL of sterile media is set up consisting of an arbitrary number of columns of three test tubes each In the biomachining experiment one column was set up for each dilution from 10-4 to 10-11 resulting in a 3 X 8 array or a total of 24 test tubes (Figure 18) Each tube in a given column receives 1 mL from its designated dilution resulting in three 10 mL solutions Once all 24 tubes have been inoculated from their designated dilutions the tube array is incubated until signs of growth appear Once enough time has passed to ensure all the tubes that will show growth have the array is removed from incubation Each three-tube column is given a score corresponding to how many of the tubes show growth ranging from +0 for no growth in any tube to +3 for all tubes showing growth For the statistical analysis the first column where no growth (+0) occurs is noted The sequence of scores of this column and the two preceding it such as +3 +2 +0 is used to find a numerical value in tabulated MPN tables This numerical value is then multiplied by the inverse of the dilution power of the middle column As an example if the sequence of scores is +3 +2 +0 centered on the 10-8 dilution then the value corresponding to a sequence of +3 +2 +0 in the table (say 93) is multiplied by 108 resulting in a total approximate bacterial concentration of the original sample of 93108 organismsmL
A typical dilution series is shown below in Figure 17 and a three-tube MPN is shown in Figure 18 The MPN technique was repeated for each experiment both in the starting solution and at the end of each time period for each jar
Figure 17 A Typical Dilution Series (note growth stops at the 9th dilution)
23
Figure 18 Typical 3-Tube MPN (note growth stops at 8th dilution)
45 Sample Preparation For the main experiment first samples of 9999 pure copper (Alloy 101) were prepared from plate stock The copper was cut into roughly uniform cubes of approximately 12-15 mm to a side using a wire EDM process One face was then chosen and ground to the desired level of surface finish Polishing of the chosen side was carried out using grinding wheels fitted with paper containing Si-C of various grit sizes The grit sizes chosen were 320 600 and 1200 each used in sequence until the desired finish level was reached For the highest level of surface finish a fabric wheel covered with a 6microm diamond particle slurry was used Once polished every sample was contained in a sealed plastic bag to reduce surface oxidation before use in the experiment A total of sixteen samples were prepared and used Four were made for each level of surface finish control and experimental pieces for 24 hour exposure and control and experimental pieces for 48 hour exposure Before use in the experiments each sample was subjected to roughness measurement using a profilometer On the chosen polished side of each sample three tests were done along one direction and three were done in a perpendicular direction In this measurement only the Ra value of roughness was used and the and the specific profilometer settings were data length 56 mm cutoffs 7 Gaussian filter Ls 008 mm and Lc 8 mm To obtain an estimate of overall surface roughness the average of all six readings was used Finally each sample was viewed using a SEM Pictures were captured at 100X and 500X Due to the similarities of surfaces of identical finish only representative micrographs are included for the pre-experiment portion of the data 46 Aseptic Technique Before each experiment every container and sample was sterilized to avoid potential contamination The sealed jars used were autoclaved and were only opened under a bacterial culture hood shown below in Figure 19 The copper samples and the plastic mounts that held them upright were sterilized chemically by soaking them in
24
100 ethanol for 1-2 minutes They were then air-dried on a sterile metal surface under the culture hood that had also been sterilized with 100 ethanol
Figure 19 Microbial Laminar-Flow Hood Used in the Experiments
All media and bacterial samples were transferred between containers using sterile sealed pipettes and a pipettor that was cleaned with 100 ethanol Gloves were always worn and were also rinsed with ethanol Finally the working surface inside the hood was also wiped down with 100alchohol 47 Beginning an Experiment For an experimental run using bacteria four sterile flasks were filled with 150mL of fresh 9K media and inoculated with 2mL each from an existing batch culture under the bacterial culture hood The flasks with vented tops replaced were then shaken at 120 RPM and incubated at 35degC for 48 hours Each flask was then opened in the hood and poured into a 1L sterile flask and mixed Before pouring the mixed bacterial solution into the test jars a sample was taken for an estimate of the initial bacterial concentration using a 3-tube MPN
Each jar was next opened and filled with approximately 150 mL of the mixed bacterial broth In the case of the control tests each jar was filled with 150 mL of fresh 9K media After each metal sample designated for the particular test (one of each finish) and corresponding plastic mount finished air-drying from sterilization with ethanol they were gently placed on the bottom of the jars with the polished metal surface facing upward A typical jar with plastic sample mount is shown below in Figure 20
25
Figure 20 Experiment Jar with Sample in Mount (without media)
Each jar was then sealed and placed in an incubator again at 35degC without
shaking for the designated time period Four such experimental runs were conducted controlwith bacteria for 24 hours and controlwith bacteria for 48 hours 48 Finishing an Experiment At the completion of each time period the jars were removed from the incubator and the samples were removed Each sample was then rinsed gently with de-ionized water and air-dried which was finished by blotting with lint-free wiping paper For transfer to the roughness testing each was wrapped in lint-free wipes and stuffed into a conical tube The remaining bacterial broth in each jar was sampled for final MPNrsquos resulting in a total of five for each experimental run Just as before 1 mL (this time from each jar) was put into 9 mL of sterile 9K media and the dilutions were carried out eleven times Tubes 6-11 were then used in each three-tube MPN to estimate bacterial concentrations Just as before the experiments roughness values were taken on the finished face of the cubical sample Again three values were taken in one direction and three were taken perpendicular to that The average of the six Ra values is used in the experimental results presented below SEM micrographs were also again taken of each surface at 100X and 500X magnification for comparison with the surfaces before exposure An exception to this is the included micrograph at higher magnification believed to show bacterial traces but this is elaborated upon below 49 Material Removal Rate A final experiment was conducted in an attempt to obtain a crude estimate of the material removal rate of the bacteria a necessary quantity in any machining process Previous work gave some values for this parameter and it was desired to see if current experiments produced comparable numbers as well as determine if it changes with time For this test a pre-experiment culturing and MPN were carried out as detailed above in 41 and 47 Four copper foil sheets were cut from shim stock of 0001 in thick Cu Alloy 110 in a designated size of 4 mm by 6 mm and their masses were measured
26
This material is slightly different from the very pure plate stock used in the roughness tests (the foil having a purity of only 999 Cu) but it was deemed similar enough to be relevant and was the only available variety of copper that came in such a thin foil After cutting and then sterilizing in ethyl alcohol two pieces of foil were then fully submerged in 150 mL of bacterial broth and the other two were submerged in equal quantities of sterile 9K media All tests were conducted in the same sample jars used in the roughness experiments which were sealed and incubated at 35deg C for the specified length of time (24 or 48 hours) At the conclusion of the time period each piece of foil was removed rinsed with de-ionized water and air dried The final masses were recorded and then compared to the initial Using the mass difference and time period as well as the known density value for the specific copper alloy[27] a material removal rate was then calculated for each piece of foil which was assumed to be constant over the given time period
27
Chapter 5 Experimental Data 51 Roughness Results Summary The results of the experiment described above are summarized in Figure 22 below Every sample exposed to the bacteria experienced a drastic increase in overall roughness well beyond any bounds of error in the profilometer The controls by contrast all showed little or no increase in roughness The slight variations in the control roughness values could be attributed to the acidic nature of the media (pH of ~25) as well as measurement error in the profilometer It was observed that after exposure to even sterile media individual grains and boundaries became clearly visible indicating at least some corrosion on the surface
320 2
4hr c
ontro
l
320 2
4hr b
acte
ria
320 4
8hr c
ontro
l
320 4
8hr b
acte
ria
600 2
4hr c
ontro
l
600 2
4hr b
acte
ria
600 4
8hr c
ontro
l
600 4
8hr b
acte
ria
1200
24h
r con
trol
1200
24h
r bac
teria
1200
48h
r con
trol
1200
48h
r bac
teria
Diam 2
4hr c
ontro
l
Diam 2
4hr b
acter
ia
Diam 4
8hr c
ontro
l
Diam 4
8hr b
acter
ia
00000
05000
10000
15000
20000
25000
30000
35000
Avg
Rou
ghne
ss R
a (micro
m)
Average Roughness of Copper Samples Before and After Biomachining
Pre-Experiment Post-Experiment
Figure 21 Summarized Experimental Results
28
Figure 22 Summary of Roughness Values Before and After Incubation for Control Samples (top) and Samples Incubated with Bacteria (bottom)
The bacterial populations showed little change in growth behavior beyond regular replication although some (the 1200 and Diamond for 48 hours) did show some decrease The variations in these numbers have many possible sources of error including the inaccuracies inherent in the MPN estimation process possible breakdowns in aseptic technique uneven mixing at each dilution and even slight errors in the amounts of solution transferred between tubes
24 Hour Control Samples
000050100150200250300350
320 600 1200 Diamond
Finish
Rou
ghne
ss R
a (micro
m)
Pre-Experiment Post-Experiment
48 Hour Control Samples
000050100150200250300350
320 600 1200 Diamond
Finish
Rou
ghne
ss R
a (micro
m)
Pre-Experiment Post-Experiment
24 Hour Samples With Bacteria
000050100150200250300350
320 600 1200 Diamond
Finish
Rou
ghne
ss R
a (micro
m)
Pre-Experiment Post-Experiment
48 Hour Samples With Bacteria
000050100150200250300350
320 600 1200 Diamond
Finish
Rou
ghne
ss R
a (micro
m)
Pre-Experiment Post-Experiment
29
52 Bacterial Concentrations 521 Initial Bacterial Concentrations 24 Hours The MPN series ended in a sequence of +3 +3 +0 (ie for two dilutions all three tubes showed growth and then the next higher series had no tubes showing growth) centered at the 10-7 dilution This corresponds to an approximate concentration of 24107 organismsmL 48 hours The MPN series resulted in a sequence of +3 +1 +0 centered at the 108 dilution This corresponds to an approximate concentration of 43107 organismsmL 522 Final Bacterial Concentrations 24 hours 320 MPN series of +3 +1 +0 centered at the 10-8 dilution
bacterial concentration of 43107 organismsmL 600 MPN series of +3 +3 +0 centered at the 10-7 dilution
bacterial concentration of 24107 organismsmL 1200 MPN series of +3 +3 +0 centered at the 10-7 dilution
bacterial concentration of 24107 organismsmL Diamond MPN series of +3 +3 +1 centered at the 10-8 dilution
bacterial concentration of 43107 organismsmL 48 hours 320 MPN series of +3 +2 +0 centered at the 10-8 dilution
bacterial concentration of 93107 organismsmL 600 MPN series of +3 +1 +0 centered at the 10-8 dilution
bacterial concentration of 43107 organismsmL 1200 MPN series of +3 +3 +0 centered at the 10-7 dilution
bacterial concentration of 24107 organismsmL Diamond MPN series of +3 +3 +0 centered at the 10-7 dilution
bacterial concentration of 24107 organismsmL 53 SEM Pictures The qualitative results gleaned from the SEM pictures of each surface all of which are included in Appendix B reinforce the drastic changes shown in the numerical data between pre and post-exposure to A ferrooxidans Before exposure to either media or bacteria each surface shows rather predictable regular patterns for each level of finish As expected the lowest value of surface finish (the 320 grit paper) gives the surface a rather jagged appearance with large canyons carved in parallel by the rather large particles as they removed the surface material Edges of these trenches can be seen to have many irregular portions along their length with almost complete detachment of
30
some of the larger chunks of material As the surface finish become finer the carved trenches become narrower and much more regular until we reach the 6 microm diamond level where hardly any surface features can be seen
The post-experiment SEM micrographs show the drastic contrast between the control surfaces which only experienced the acidic media and those exposed to the bacteria Each surface exposed to the bacteria reveals an extremely uneven surface marked by numerous depressions and craters On some of the more level sections highly ordered angular plates can be seen The higher level surfaces vary from relatively smooth to an almost pin-cushion-like appearance The control surfaces show slight changes in the depths of the aforementioned trenches but the patterns are still very regular and donrsquot seem to change very much from before the experiment It is apparent in some of the control SEM micrographs that grain boundaries are visible The corrosive 9K media apparently preferentially attacks the less organized amorphous regions in between the individual grains of copper so this may explain some of the roughness changes seen in the control samples On some of the higher magnification micrographs for samples incubated with bacteria especially the 600 finish sample incubated for 48 hours small regular rod shapes can be seen on some of the lower level surfaces It his highly unlikely that these actually are individuals of A ferrooxidans but the general shape and size suggest that they may be remnants of where the bacteria once adhered to the surface Corrosion caused by single individuals may have created depressions that show up in these images Actual bacteria would most likely have been vaporized by charge buildup from the electron source of the microscope A picture at 2500X magnification of the 600 finish sample with the possible bacterial remnants is shown below in Figure 23
Figure 23 Possible Bacterial Traces on a Copper Surface
31
54 Material Removal Rate
The copper foil pieces displayed drastic differences in mass after exposure to bacterial solutions of A ferrooxidans indicating a pronounced removal of material The control experiments while displaying some material loss due to the acidic nature of the 9K media have an almost insignificant change in mass when compared to the pieces exposed to the bacteria The results are summarized below in Table 6 The MPN resulted in +3 +1 +0 centered at the 10-8 dilution corresponding to initial bacterial concentrations of 43107 organismsmL for both bacterial tests Table 6 Material Removal Rate Data Foil Label Initial Mass Final Mass Material Removal Rate 24 hr Control 05295 g 05250 g 873810-4 mmhr 24 hr Bacteria 05330 g 03691 g 0032 mmhr 48 hr Control 05250 g 05245 g 485510-5 mmhr 48 hr Bacteria 05259 g 03512 g 0017 mmhr Aside from the large mass differences exhibited by the foil pieces exposed to the bacteria visible physical differences were also observed between them and the control pieces The pieces exposed to bacteria had visible grain boundaries and were much less lustrous than their control counterparts
32
6 Conclusions The most obvious conclusion that can be made using the experimental results is that the ldquomachiningrdquo effect on copper produced by Acidithiobacillus ferrooxidans is very detrimental to surface finish This largely uneven corrosion seems to be produced regardless of initial finish at least past the rather rough 320 grit size In this current setup bacterial machining is impractical for fine control of nano-scale material removal That being said the process could still have potential if some possible refinements are added The rather uneven nature of the corrosion effect could be partially caused by the deposition of the solid waste products of the copper corrosion on the sample surface This material could effect how well the bacteria adhere to the copper surface thus shielding a covered area from bacterial corrosion One fairly simple remedy for this is to conduct the experiment in a non-quiescent fluid environment If a properly controlled flow of media is constantly forced over the sample it may carry away the waste material thus leaving unaffected material exposed for bacterial adhesion The optimal flow rate would promote waste removal while not preventing the bacteriarsquos access to the surface and this would have to be determined through further empirical testing A slightly more complex modification of this process would involve the use of single-crystal copper The irregular pattern of crystal grains and the disorganized nature of the grain boundaries may contribute to the lack of evenness in the corrosion Single grain copper crystals could potentially eliminate effects of etching at the grain boundaries by the 9K media thus exposing a relatively smooth surface to the bacteria If this is combined with forced fluid flow over the sample much more uniformity in material removal could potentially be achieved The material removal rate tests were very simple in nature but they still suggest possible trends in the removal behavior exhibited by the bacteria The noticeably lower material removal rate for the 48 hour time period suggests that not only is the removal rate not uniform but it slows down with time The otherwise identical 24 hour test suggests an initially high MRR which may slow down due to waste buildup in the liquid media or lack of oxygen The first suggested cause seems more likely especially since the media used in the test exhibited a much deeper orange color as did the precipitate than the typical liquid media exhibiting growth The color suggests a buildup of copper compounds most likely CuS as suggested in the reaction diagrams in 23 One possible way to make the material removal rate more uniform with time is to constantly supply fresh aerated media to and flush waste compounds from the whole working fluid environment Future work could thus initially include a combination of the three modifications suggested above A single crystal of copper would be able to present the most even surface possible to the bacteria as no grain boundaries would exist to be corroded by the media If fresh media were constantly supplied and forced over the surface of the workpiece at a controlled flow rate waste compounds could be removed as they are generated and the copper surface could remain evenly exposed for bacterial machining After these initial modifications other process and environment parameters can be varied to further refine and find the limits of biomachining
33
References [1] Williams K and Gupta K and Wasilik M (2003) ldquoEtch Rates for
Micromachining Processing-Part IIrdquo Journal of Microelectromechanical Systems Vol 12 No 6 pp 761-778
[2] Uno Y Kaneeda T and Yokomizo S (1993) ldquoFundamental study on biomachining (machining of metals by Thiobacillus ferrooxidans)rdquo Transactions of the Japan Society of Mechanical Engineers Part C Vol 59 pp 3199-3204
[3] Kumada M Kawakado T Kobuchi S Uno Y Maeda S and Miyuki H (2001) ldquoInvestigations of fine biomachining of metals by using microbially influenced corrosion - Differences between steel and copper in metal biomachining by using Thiobacillus Ferrooxidansrdquo Zairyo to Kankyo Corrosion Engineering Vol 50 pp 411-417
[4] Kurosaki Y Matsui M Nakamura Y Murai K and Kimura T (2003) ldquoMaterial processing using microorganisms (An investigation of microbial action on metals)rdquo JSME International Journal Series C Mechanical Systems Machine Elements and Manufacturing Vol 46 pp 322-330
[5] Uno Y Kaneeda T and Yokomizo S (1996a) ldquoFundamental study on biomachining (machining of metals by Thiobacillus ferrooxidans)rdquo JSME International Journal Series C Vol 39 pp 837-842
[6] Uno Y Kaneeda T Yokomizo S and Yoshimura T (1996b) ldquoFundamental study on electric field assisted biomachiningrdquo Journal of the Japan Society for Precision Engineering Vol 62 pp 540-543
[7] Zhang D and Li Y (1996) ldquoPossibility of biological micromachining used for metal removalrdquo Science in China Series C Life Sciences Vol 41 pp 151-156
[8] Zhang D and Li Y (1998) ldquoStudies on kinetics and thermodynamics of biomachining pure copperrdquo Science in China Series C Life Sciences Vol 42 pp 57-62
[9] Gomez C Blazquez M and Ballester A (1999) ldquoBioleaching of a Spanish complex sulphide ore bulk concentraterdquo Minerals Engineering Vol 12 pp 93-106
[10] Konishi Y Kubo H and Asai S (1992) ldquoBioleaching of zinc sulfide concentrate by Thiobacillus ferrooxidansrdquo Biotechnology and Bioengineering Vol 39 pp66-74
[11] Olson G (1991) ldquoRate of pyrite bioleaching by Thiobacillus ferrooxidans Results of an interlaboratory comparisonrdquo Applied Environmental Microbiology Vol 57 (3) pp 642ndash644
[12] Bond D Holmes D Tender L and Lovley D (2002) ldquoElectrode-reducing microorganisms that harvest energy from marine sedimentsrdquo Science 295483-5
[13] Lovley D R Phillips E J P Gorby Y A Landa E R (1991) ldquoMicrobial reduction of uraniumrdquo Nature Vol 350 pp 413-416
[14] Lovley D R (2003) ldquoCleaning up with genomics applying molecular biology to bioremediationrdquo Nature Reviews Vol 1 pp 35-44
34
[15] Viamajala S Peyton B and Petersen J (2003) ldquoModeling chromate reduction in Shewanella oneidensis MR-1 development of a novel dual-enzyme kinetic modelrdquo Biotechnology and Bioengineering Vol 83 No 7 pp 790-797
[16] Dinh H Kuever J Mussmann M Hassel A Stratmann M and Widdel F (2004) ldquoIron corrosion by novel anaerobic microorganismsrdquo Nature Vol 427(6977) pp 829-832
[17] Chaudhuri S and Lovley D (2003) ldquoElectricity generation by direct oxidation of glucose in mediatorless microbial fuel cellsrdquo Nature Biotechnology Vol 21 No 10 pp 1229-1232
[18] Levett Paul N Anaerobic Bacteria A Functional Biology Open University Press Philadelphia 1990
[19] Wilkinson J F Introduction to Microbiology John Wiley and Sons New York 1975
[20] MVTechnologies Inc (MVTI) [21] Walsh E OrsquoF An Introduction to Biochemistry English Universities Press
London 1961 [22] Zehnder A J B Biology of Anaerobic Microorganisms John Wiley and Sons
New York 1988 [23] httpwwwvkmrucatalogpdfmediapdf [24] Johnson Macvicar and Rolfe ldquoA New Solid Medium for the Isolation and
Enumeration of Thiobacillus Ferrooxidans and Acidophilic Heterotrophic Bacteriardquo The Journal of Microbiological Methods Vol 7 Number 1 1987 pp 9-18
[25] Southam G and Beveridge T J ldquoEnumeration of Thiobacilli within pH-Neutral and Acidic Mine Tailings and Their Role in the Development of Secondary Mineral Soilrdquo Applied and Environmental Microbiology Vol 58 Number 6 June 1992 pp 1904-1912
[26] httpwwwjlindquistnetgeneralmicro102dil3html [27] httpwwwsuppliersonlinecompropertypagesC11000asp
35
Appendix A Experimental Roughness Values A1 Pre-Experiment
Label Ra Values (microm)
Average (microm)
320 24hr control 06168 05536 05284 05091 04927 05757 05987 320 24hr bacteria 03703 04132 03811 03513 03633 05117 05014 320 48hr control 04765 04834 05057 05501 04471 04231 04979 320 48hr bacteria 06029 05958 05349 05426 07305 06431 05206 600 24hr control 0301 03215 03016 02771 03918 02947 03628 600 24hr bacteria 03074 03319 0317 0363 03431 03239 03368 600 48hr control 02778 02967 02859
36
02534 03205 03024 03399 600 48hr bacteria 03735 03596 03866 03364 03568 03388 03657 1200 24hr control 01555 01842 01719 01693 02184 01963 01939 1200 24hr bacteria 01979 01644 01654 01797 01432 0145 01549 1200 48hr control 02055 02212 02008 02166 02377 02449 02217 1200 48hr bacteria 02699 02306 02583 02232 02181 02195 01946 Diam 24hr control 00633 00690 00783 00745 00566 00744 00666 Diam 24hr bacteria 00304 00346 00382 00369
37
00295 00399 00328 Diam 48hr control 00504 00487 00519 00476 00477 00506 00437 Diam 48hr bacteria 004 00502 00383 00368 00548 0046 00853 A2 Post-Experiment
Label Ra Values (microm)
Average (microm)
320 24hr control 05093 04806 04717 04466 05079 04779 04704 320 24hr bacteria 40345 30396 41263 22224 11939 34905 31699 320 48hr control 04159 04162 04018 03825 04539 04349 04082 320 48hr bacteria 26231 30146 29079 36229 29167 30213 29954 600 24hr control 02934 02847 02661
38
03096 02788 02757 02846 600 24hr bacteria 2816 22547 21324 21519 21726 21195 21358 600 48hr control 04503 04087 03814 03961 0394 04267 04037 600 48hr bacteria 20805 22723 18524 24643 18637 24745 28985 1200 24hr control 02211 02039 02032 02108 02235 01855 01792 1200 24hr bacteria 25051 20462 23025 19845 15742 17522 21588 1200 48hr control 03195 02935 02736 02983 03315 02681 027 1200 48hr bacteria 23707 21281 20559 19257
39
23222 20152 2079 Diam 24hr control 01773 01588 01811 01661 01425 01438 0142 Diam 24hr bacteria 19187 20563 20323 22641 23499 19352 18374 Diam 48hr control 04644 04828 05018 04834 04961 05621 03888 Diam 48hr bacteria 20618 17603 12904 13919 17156 18022 22998
40
Appendix B SEM Micrographs B1 Pre-Experiment SEM Micrographs
Typical 320 Finish (images from 24 Hour Control)
Typical 600 Finish (images from 24 Hour Control)
Typical 1200 Finish (images from 48 Hour Control)
41
Typical Diamond Finish (images from 48 Hour Control)
B2 Post-Experiment SEM Micrographs
320 Finish 24 Hour With Bacteria
320 Finish 24 Hour Control
42
320 Finish 48 Hour With Bacteria
320 Finish 48 Hour Control
600 Finish 24 Hour With Bacteria
43
600 Finish 24 Hour Control
600 Finish 48 Hour With Bacteria
600 Finish 48 Hour Control
44
1200 Finish 24 Hour With Bacteria
1200 Finish 24 Hour Control
1200 Finish 48 Hour With Bacteria
45
1200 48 Hour Control
6microm Diamond Finish 24 Hour With Bacteria
6microm Diamond Finish 24 Hour Control
46
6microm Diamond Finish 48 Hour With Bacteria
6microm Diamond Finish 48 Hour Control

2
rate and at lower temperatures all for very low energy input and cost If this process can be properly understood controlled and even accelerated (where desirable) it holds promise as a commercially viable alternative to chemical etching The species involved and explanations of the underlying chemical processes are described in detail in section 2 Past experimental work is described in section 3 while experimental procedures and results of this study are elaborated upon in sections 4 and 5 Finally conclusions and suggestions for future work are given in section 6
3
Chapter 2 Overview of the Biological Mechanism Involved in Biomachining 21 Biological Background and Species Selection Every organism can be classified based on where it obtains its carbon used for growing and repairing damage and how it produces energy the fuel it uses to run all metabolic processes Organisms known as lithotrophs obtain carbon from inorganic compounds including carbon dioxide Organotrophs on the other hand obtain all the carbon they use from organic compounds including those from other organisms Each of these groups can be further subdivided based on how included organisms obtain energy The prefix Chemo- is given to those organisms that extract energy by processing matter with chemolithotrophs typically processing inorganic matter and chemoorganotrophs which process organic matter Many large animals (including humans) and bacteria are classified as chemoorganotrophs The other energy production method involves using energy from light and organisms that use this process have the prefix Photo- assigned to them Plants are the most common examples of photolithotrophs[2] Organisms fitting into the category of chemolithotrophs have been the subject of intensive research lately for their unique ability to either oxidize or reduce certain inorganic compounds especially heavy metals Species such as Shewanella oneidensis have been investigated for a process known as ldquobioremediationrdquo in which toxic chemicals are taken out of groundwater by the natural reduction reactions of the bacteria Species such as Geobacter metallireducens and Rhodoferax ferrireducens have shown potential application for biologically-based fuel cells Finally species such as Desulfovibrio sp and Acidithiobacillus ferrooxidans (formerly Thiobacillus ferrooxidans) have been shown to consume metals as part of their metabolism This process termed ldquobiomachiningrdquo has been analyzed for potential applications to micro and nano-scale manufacturing including for the potential processing of copper Acidithiobacillus ferrooxidans shows the most promise of the two both for its ease of culturing and pronounced consumption of the metal as it grows A summary of the classifications species and potential applications is displayed below in Table 1
4
Table 1 Classifications species and potential applications of various organisms
Carbon Source Energy Source Sample Species Applications
Acidithiobacillus ferrooxidans
Biomachining [2 3 4 5 6 7 8] Bioleaching [9 10 11]
Thiobacillus thiooxidans Bioleaching [9]
Geobacter metallireducens
Microbial fuel cells [12] Bioremediation [13 14]
Shewanella oneidensis Bioremediation [15]
Desulfovibrio sp Biomachining [16]
Chemolithotroph (Energy source Inorganic matter)
Rhodoferax ferrireducens Microbial fuel cells [17]
Lithotroph (Carbon source CO2)
Photolithotroph (Energy source Light)
Plants Chlorella Cyanophta etc NA
Chemoorganotroph (Energy source Organic matter)
Humans most animals most bacteria
NA Organotroph (Carbon source Organic matter)
Photoorganotroph (Energy source Light)
Rhodospirillaceae NA
22 Basic Reactions of The Biomachining Process The Acidthiobacillus ferrooxidans organism is a small rod-like bacterium (shown below in Figure 1) measuring about 1 microm long and 5 microm in diameter [2] that contains a unique set of attributes that makes it suitable as a living micro-machining tool This species belongs to a group of organisms known as chemolithotrophs organisms (usually single-celled) able to obtain energy by the oxidation of inorganic substrates rather than the usual substances such as glucose As a source of carbon the organism can obtain all its needs solely by using CO2 dissolved in its medium Oxygen serving as an electron acceptor does have to be present to make these reactions possible thus technically making A ferrooxidans aerobic The production of energy is obtained from the oxidation of the substrate as well as the combination of hydrogen ions and oxygen being fused into water [18 19] Finally this bacterium is also considered an acidophile as it is able to thrive in a pH level less than 3 [8]
5
Figure 1 Acidithiobacillus Ferrooxidans [20]
The overall reaction employed by A ferrooxidans can be summarized as a combination of the continued oxidation of ferrous iron (Fe2+) to ferric iron (Fe3+) as well as the reduction of H+ ions (from the acidic environment) with oxygen to produce water The reaction is shown below
OHFeHOFe 23
22 22212 +rarr++ +++ (1)
It is the production of the ferric iron that makes this organism useful in micromachining of metals The ferric iron is able to oxidize both pure neutral copper and iron into charged soluble forms thus being able to corrode a solid surface of either metal The reactions for each are summarized below
++ rarr+ 230 32 FeFeFe (2) +++ +rarr+ 2230 22 FeCuFeCu (3)
While the iron and copper ion creation reactions shown above in equations 2 and 3 occur outside the cell those involved in the continuous production of ferric iron and water shown in equation 1 occur inside the cell as described below [8] 23 Kinetics at the Cell Wall and Respiration The cell of each Acidithiobacillus ferrooxidans has a cell wall made up of many layers that separates the interior of the cell the cytoplasm from its environment The outer region of this wall consists of an outer membrane and a region called the peptidoglycan This is then followed by a gap called the periplasmic space where the pH of fluid inside the cell is still near that of the environment (usually ~2) Finally an inner membrane separates the periplasmic space from the cytoplasm The pH in this membrane increases to around 45 and in the cytoplasm the pH approaches neutral The reason for such marked pH variation is twofold the oxidation of ferrous to ferric iron is easier to facilitate in lower pH environments and an excess of hydrogen ions (ie a low pH) allows an ample source of reactant for the water production reaction [7 21] A representation of the cell wall is shown below
6
Figure 2The Cell wall of A ferrooxidans and Key Reactions [7]
The first part of these reactions the continuous production of Fe3+ from Fe2+ involves the transfer of electrons from the ferrous iron This process is accomplished by a series of cellular compounds known as cytochromes labeled cyto-c and cyto-a1 in Figure 2 These large molecules imbedded in the inner membrane of the cell wall often contain metallic atoms such as iron or copper that have a high affinity for accepting electrons An example of a typical cytochrome is shown below
Figure 3 Cytochrome C Configuration [21]
In the process of stripping an electron from the iron atoms these macromolecules are reduced The electrons are then once again stripped by another cytochrome further in the cell thus passing the electrons into the cytoplasm by a series of oxidation-reduction reactions This group of cytochromes that strip and move electrons form what is called an ldquoelectron transport chainrdquo In A ferrooxidans we see cytochrome-c (which strips the
7
electrons from the iron ions) in combination with cytochrome-a1 [7] It is believed that cytochrome-a1 performs a similar task to another cytochrome in its family called a3 which facilitates the reoxidation (taking the acquired electrons back out) of c-cytochromes thus acting as a c-cytochrome oxidase Cytochrome-a1 is believed to be the final link in the electron transport chain described above It must be said however that the exact functioning of this group of cytochromes is still not well defined [21] The oxidation of iron takes place in the low pH of the periplasmic space along with the uptake of H+ ions The whole goal of these two processes the coupling of the reoxidation of the cytochromes and the reactions of hydrogen ions with oxygen is to produce useable energy for the organism These reactions produce energy by virtue of the free energy change between the products and the reactants and this energy is used to bind an extra phosphate onto the Adenosine diphospate molecule thus creating Adenosine triphosphate The actual efficiency of the cells in utilizing the redox reactions can vary from 10-50 but this is still efficient enough to produce the necessary energy to create ATP [22] The ATP molecule is vital in nearly all organisms as a means of storing and transporting energy throughout the cell It can store energy in the extra phosphate bond until needed by some cellular process and then release it to create ADP and a free phosphate (which can then be recombined into ATP again) The phosphate bonds are theoretically able to hold anywhere from 37656ndash58576 kJ (9000-14000 calories) each and for each atom of oxygen consumed in a reaction 1-4 phosphate bonds can be produced [21] Another theoretical calculation estimates that the overall reaction used by A ferrooxidans produces around 33472 kJmol (8 kcalmol) of usable energy [2 5] The energy creating process forms a circulatory system of sorts for the iron ions as they are continually converted to Fe3+ exuded from the cell reduced to Fe2+ by their reaction with copper or iron then reabsorbed into the periplasmic space for reoxidation Hydrogen ions are obviously consumed and water is produced Thus H+ ions must be continually supplied or the reaction cannot move forward A representation of the reactions involved is depicted below in Figure 4
8
Figure 4 Biomachining Process Reactions [8]
The lower reactions on the chart come from the ferric iron ionrsquos natural hydrolysis with water ultimately producing Fe(OH)3 and free H+ ions It is in part due to this reaction that the ferric iron ion reaction with the workpiece material is best achieved by those bacteria actually in contact with the part surface The H+ supplying reaction as labeled is a consequence of the copper ions reacting with H2S which was added to the medium The exact reason for using H2S rather than some other H source is described below in section 32 Acidithiobacillus ferrooxidans through the complex reactions described above is thus able to make the energy it needs to survive by performing a useful task to manufacturing engineers Through the oxidation of pure iron and copper this organism is able to produce a machining effect comparable to chemical etching If all of the parameters of this biomachining process can be understood and controlled it may become a commercially viable process able to compete with existing chemical etching in terms of productivity and yet be far more environmentally benign
9
Chapter 3 Previous Work on Biomachining 31 Pioneering Work of Uno Kaneeda and Yokomizo One of the earliest studies of using A ferrooxidans in a manufacturing capacity was performed by Uno Kaneeda and Yokomizo in Japan in 1993 as described in [2] While employing a very basic experimental setup they were able to show some preliminary data on the effects of changing some of the parameters involved in the biomachining process and even suggest a way to accelerate the process with a properly-applied electric potential The setup first employed very pure samples of iron (9995) and copper (9990) which had line patterns put onto them by existing photolithography techniques This left alternating sections of photoresist and exposed metal on the upper surfaces The bacteria and the samples were immersed in a medium known as ldquo9Krdquo the ingredients of which are described below in Table 2 Table 2 9K Media Components [2] Component Mass10L Water (NH4)2SO4 30 g K2HPO4 5 g MgSO4 5 g KCl 1 g Ca(NO3)2 01 g Deionized water 10 L H2SO4 Adjust the pH to 25 FeSO4 3 vol
The samples and bacteria immersed in the 9K medium and in open beakers were then incubated at a constant temperature and constantly mixed with an agitator The sketch of the experimental setup is shown below in Figure 5
10
Figure 5 Basic Biomachining Experimental Setup [2]
The experiments were first run with a constant temperature of 28ordm C and a shaking rate of 160 cycles per minute Three different strains of Acidithiobacillus ferrooxidans (ATCC 13598 13661 and 33020) were tested in these runs on both metals and all yielded similar results as shown below in Figure 6
Figure 6 Biomachining Experiments on Fe (left) and Cu (right) [2]
As shown in the graphs the biomachining rate at these conditions is almost directly proportional to time for all three species which makes the process time relatively simple to predict For Cu the MRR was about 20 micromhr and for Fe the MRR was 14 micromhr The control of the experiment using just the 9K medium shows that the bacteria do indeed produce all of the material removal effect despite the corrosive (pH ~25) medium
11
As a variation on the initial conditions the researchers varied temperature for one strain (ATCC 13598) and observed the mean material removal rate The results for both Fe and Cu are shown below in Figure 7
Figure 7 Mean MRR vs Temperature in Biomachining [2]
As the figure shows the peak MRR for Cu (~23 micromhr) is near 30ordmC while for Fe the max MRR (~20 micromhr) occurs near 40ordmC Thus temperature proves to be a relatively key variable in the efficiency of biomachining Any process designed to employ biomachining will obviously have to control temperature to keep the MRR near its theoretical maximum As a final experiment with biomachining Uno et al applied different electric potentials to the workpieces to observe how changing that would influence the biomachining rate The results for using strain ATCC 13598 on Fe and Cu for a variety of applied voltages are shown below in Figure 8
Figure 8 Biomachining with Varied Applied Voltages for Fe (left) and Cu (right) [2]
As shown above if positive applied voltages are used the MRR is accelerated over baseline For iron if the voltage applied is negative (5V in this case) the MRR is actually negative indicating material is deposited Thus applied voltage can have an accelerating effect in the biomachining rate but more work needs to be done to determine if there is a maximum voltage which yields a benefit to the process
12
32 The work of Zhang and Li Mechanisms and Kinetics Another pioneering group in the area of biomachining worked in China producing papers on the subject in 1996 and 1998[7 8] Zhang and Li not only elaborated on the biological mechanisms used by A ferrooxidans but also gave equations relating the kinetics of the overall reaction to experimental conditions Their more detailed work can give us valuable insight into the process and an initial point to begin studying parameter adjustment in the biomachining process In their 1996 paper Zhang and Li perform an experiment very similar to the one by Uno et al The sample was prepared once again using existing photolithographic techniques The prepared sample was then incubated with the bacteria for a period of time Finally the sample was removed periodically and measured both with a profilometer and scanning electron microscope The data they collected showed that the average biomachining (ie material removal) rates were 10 micromhr for iron and 135 micromhr for pure copper The data graphs producing these rates are shown below in Figure 9
Figure 9 Biomachining Depth vs Time for Fe (left) and Cu (right) [7]
As figure 9 shows the biomachining rates in Zhang and Lirsquos tests remained nearly constant over the length of the tests In addition to this Zhang and Li explained the Fe oxidizing and reducing reactions involved as used above as well as explaining what parts of the cell (periplasmic space cytochromes etc) are used in the reactions They concluded that the biomachining process is entirely dependent on the biological recreation of Fe3+ In 1998 Zhang and Li went further in explaining the biomachining process by studying the kinetics of each sub-reaction and how experimental concentrations affected each of these reaction rates The first reaction relates the consumption of Fe3+ labeled as
][ 3+FeVc below in equation 4 to the mass change of a Cu sample
))((5463102][ 403 hLmmolCuFeVc ∆=+ (4)
After this the rate of generation of Fe3+ (shown below as Vg[Fe3+ ] in equation 5) is dependent on both its consumption (denoted as Vc[Fe3+ ] below) and what Zhang and Li called its ldquoincrease raterdquo (Vt[Fe3+ ])
13
))(]([[][ 333 hLmmolFeVFeVFeV ctg
+++ += (5) Vg[Fe3+ ] and Vc[Fe3+ ] tend to become equal over time and Vt[Fe3+ ] starts out large in the first few hours of an experiment and then turns to zero as the system reaches a stable ion concentration The equilibrium equations of generating and consuming Fe3+ show that these quantities are directly proportional to the Fe2+ and Fe3+ concentrations respectively
][][
2
3
+
+
=Fe
FeVKg g (6)
][][
3
3
+
+
=FeFeV
Kc c (7)
Kg (equation 6) is the rate coefficient of generating Fe3+ and Kc (equation 7) is the rate coefficient of consuming it Both have units of mmol(Lh) In their experiments Zhang and Li found that the generation and consumption rates and coefficients were directly proportional to bacterial cell concentration The data for these rates taking out effects of non-biological sources and sinks of Fe3+ are shown below
Figure 10 Vg[Fe3+]and Vc[Fe3+] vs cell concentration (left) and Kg and Kc vs cell concentration
(right) [8] The result of all of this is that the material removal rate is directly proportional to the amount of A ferrooxidans organisms present as might be expected What these graphs donrsquot show is whether or not there is some maximum bacterial concentration at which biomachining can occur This leaves an open question for our research as one obviously cannot increase the bacterial count indefinitely In their experiments Zhang and Li studied how the hydrolysis of Fe (as described above in section 2) affects H+ ion concentration which also affects the biomachining
14
process since it is taken up by A ferrooxidans in the respiration process They found that the natural decrease due to hydrolysis was lower than that caused by consumption by the organism The big conclusion of the experiments is that H+ ions must be supplied to keep the reaction moving and allow the organism to reproducegrow Ideally the pH should be kept around 2 to not negatively impact the process A final conclusion reached by Zhang and Li is that the buildup of Cu ions in solution (from their oxidation by Fe3+) can cause the biomachining process to slow down As shown in the schematic diagram of the reactions used above they took care of this problem by bubbling H2S gas into the solution This gas supplies H+ ions and creates CuS which precipitates thus removing the Cu ions from solution
15
Chapter 4 Experimental Setup 41 Introduction To conduct our own experiments with A ferrooxidans the bacteria first had to be obtained and cultured successfully Several variations on the basic liquid media for this species were tried until one that was both effective and easy to make was found Before continuous cultures could even be created however the bacteria first had to be isolated which is most easily done on solid media such as common bacterial agar Due to the acidic conditions required by this bacterial species a specialized form of gelatinous media had to be found that would solidify even under a low pH Finally once we were confident we had isolated A ferrooxidans and were able to continuously culture it we had to devise a successful way to estimate bacterial concentrations Once the bacteria were successfully isolated and growing an experiment was conducted to expand on some of the work described above done by early researchers in the field For nano and micro-scale machining tasks a high degree of precision is required to make any kind of material removal process successful While Zhang Li and others were able to show that using an active population of A ferrooxidans could remove a significant amount of material from a copper surface they did not go into any detail on the resulting surface and specifically its finish For any process that may arise out of using these bacteria to machine copper being able to produce level even surfaces is highly desired The experiments thus conducted by the author as described in detail below looked at changes in surface finish and roughness for several copper sample pieces Both quantitative average roughness values and qualitative surface descriptions were obtained and are discussed below All of the experiments show that without some significant changes to the basic biomachining process surface finish quality degrades significantly and even though drastic material removal can be seen the uneven nature of its distribution across a given surface makes direct applications in manufacturing seem doubtful A second experiment was conducted to obtain a crude estimate of the material removal rate of biomachining pure copper surfaces in the hopes of replicating previous results In that experiment very thin copper foil pieces were exposed to solutions of A ferrooxidans as well as sterile media for the same time periods as the copper blocks The difference in mass was recorded and converted into a material removal rate using known material properties The experimental procedures used to observe the effects of A ferrooxidans on surface roughness and material removal rates of the copper samples involved many steps and many different pieces of laboratory equipment The combination of experimental steps and the continuous culture protocol employed to maintain a healthy population of the bacteria is summarized in the flow chart below (Figure 11) and a full list of equipment used appears in the subsequent table (Table 3) Detailed explanations of each step are laid out in the following sections
16
Figure 11 Experimental Procedures Flow Chart
Table 3 List of Equipment with Model and Manufacturers Chemicals Stock distributed by Sigma Incubator and Shaker innova 4300 by New Brunswick Scientific Microbial Hood BioGARD Hood by Baker Company Inc Media Filtration System Stericup Pre-Sterilized Vacuum Driven Disposable
Filtration System 2 microm filter 1L Jar by Millipore Culture Flasks Pyrex 250 mL Erlenmeyer Flasks distributed by Sigma Experiment Jars 500 mLWide-Mouth Short Clear Glass Jars distributed by
Fisher MPN Test Tubes Fisherbrand Disposable Culture Tubes Borosilicate Glass
by Fisher Dilution Series Tubes Falcon Blue Max Jr 15 mL Polypropylene Conical Tubes
by Becton Dickinson Plates Fisherbrand 15mm Cell Culture Plates by Fisher Flask Filter Top Fisherbrand Non-Sterile Cotton Gauze Sponges by Fisher Copper Foil Copper Shim Stock (110 Annealed) by Lyon Industries Copper Stock Alloy 101 Extreme-Temperature Electronic-Grade Copper
distributed by McMaster-Carr Profilometer Talysurf Intra by Taylor-Hobson SEM XL30 by Philips Mass Scale PG802-S by Mettler Toledo pH Meter Φ360 by Beckman
17
42 Bacterial Media For any microorganism to be able to grow and reproduce successfully it must be kept in an environment that contains all of the nutrients and environmental conditions it requires to live A ferrooxidans as described above typically requires a liquid environment with a low pH and some metal to serve as its source of electrons in the respiration process This particular species has been known to biologists for some time so there are standard media recipes available for it and other similar acidophilic bacteria The most commonly used media is referred to as 9K which is a rather simple mix of salts and sulphate compounds combined with a source of iron for use by the bacteria 421 Liquid Media The most basic recipe found for 9K bacterial media was used based on that listed at the website of All-Russian Collection of Microorganisms[23] This recipe employs two separate solutions that are mixed after sterilization Each component is added in the order listed Table 4 2-Solution 9K Media Components [23] Solution 1 Solution 2 700mL H2O 300mL H2O 01g KCl 30g FeSO47H2O 3g (NH4)2SO4 05g Mg SO4 05g K2 PO4 001g Ca(NO3) 2 The pH of each is adjusted to 25-26 using sulphuric acid (H2SO4) Finally each solution is passed through a 2 microm filter into a sterile sealed flask When the two solutions mix in the flask the mixture becomes opaque and yellow and a precipitate forms The precipitate eventually oxidizes even in the sealed flask rendering the media less useful for bacterial culture of A ferrooxidans The approximate shelf-life of this 9K media is two to three weeks 422 Solid Media Solid media was used for isolation of A ferrooxidans after first obtaining samples from ATCC This plate media incorporated three solutions that were combined at the time of pouring The solution formulations (as originally given) are shown in Table 5 Table 5 Solid Media Solution Components [24] Solution 1 Solution 2 Solution3 10g Fe SO4 09g (NH4)2SO4 1g100mL Bacterial Agar 500mL H2O 035g Mg SO4 0175g Tryptone Soy Broth 500mL H2O
18
Solutions 1 and 2 each had their pH adjusted to ~2 using H2SO4 Instead of TSB Bacto Tryptone was used and desired results were still achieved After experimenting with several ratios of the solutions we found a 11410 combination of solution 1solution 2solution 3 worked very well Further increasing the proportion of agar solution produces a media that solidifies very well despite the acidic nature of the other solutions Plates using this media were poured under a bacterial hood to ensure sterility 43 Culturing A ferrooxidans The bacterial sample came directly from ATCC (21834) in a sealed test tube as shown below in Figure 12
Figure 12 A ferrooxidans sample as-shipped from ATCC
After acquiring the initial sample from ATCC 2 mL of sample broth were directly deposited onto plate media Samples were then left to incubate at 35deg C until bacterial colonies became visible The colonies that did appear were extremely small units almost impossible to see except under high optical magnification To the naked eye bacterial growth appeared as a bright yellow almost-transparent cloud on the surface of the media typically arranged as one large mass A typical plate with growth is shown below in Figure 13
19
Figure 13 Plate Media with Growth (Upper-Right)
To further isolate A ferrooxidans streaks were taken off of the growth on the plates using sterile plastic picks and mixed into 15mL conical tubes of liquid 9K media After one or two days of being incubated again at 35degC bacterial growth appeared as a drastic color change of the media which turned a bright orange and developed an iridescent film at the surface The precipitate also turned a dark orange color As a control blank tubes of sterile 9K media were incubated at identical conditions The controls showed almost no change with the usual light yellow precipitate color only darkening slightly as it oxidized A side-by-side comparison of the media exhibiting growth and a control sample is shown below in Figure 14
Figure 14 Example Tubes with Bacterial Growth (left) and Without (right)
Continuous cultures of A ferrooxidans were produced by taking several mL from tubes showing the most dramatic signs of growth and mixing them into flasks of 9K media Each flask was created with a vented top of tightly packed medical gauze which was covered with aluminum foil and autoclaved Each 250 mL flask was filled with 150 mL of 9K media upon use and after the bacterial broth was mixed in the vented tops
20
were replaced all under a bacterial hood to avoid contamination The inoculated flasks were then incubated at 35degC and shaken at 120 cyclesminute Using this culturing protocol one flask would last approximately four to seven days at which time the process was repeated using 2 mL from the previous flask The growth behavior visible in the shaken flasks was very similar to that mentioned for the sealed conical tubes used in isolating the bacteria The 9K media generally turned a bright orange color within two days (Figure 15) and the precipitate solidified into one darker mass on the bottom of the flask As time passed the color would fade back to almost the same light yellow color of uninnoculated 9K media but the precipitate would remain as one hard solid mass on the bottom (Figure 16) Generally this reversal of the color change would happen after four to five days and that was used that as an indicator of when to create a fresh inoculation As a control sterile 9K media was again incubated under identical conditions and just like in the tube controls only a slight darkening of the precipitate was observed after many days due to oxidation
Figure 15 Culture Flask After ~48 Hours Incubation (2mL Innoculation)
21
Figure 16 Culture Flask After ~120 Hours Incubation (2mL Innoculation)
44 Bacterial Concentration Estimation Technique The 3-Tube MPN Due to the small size of A ferrooxidans cells conventional counting techniques that rely on optical microscopy were deemed ineffective for estimating the bacterial populations in the biomachining experiments Instead of using a device such as a hacyometer to count individuals present in a pre-determined fluid volume by visual inspection a statistical method known as the most probable number (or MPN) technique was used that could give very clear results with reasonable levels of accuracy[25 26] This technique involves two main steps creating an initial series of dilutions of the original sample and then using those dilutions to inoculate a collection of test tubes to watch for growth Starting with an initial bacterial sample in this case broth incubated for 48 hours the first step in creating an MPN is to create a collection of dilutions of that initial sample Initially one mL of original sample is put into a test tube containing 9mL of sterile media of the same type used in culturing the bacteria The resulting 10 mL solution is then a 110 dilution of the original bacterial solution To create the next dilution 1 mL of the new solution is withdrawn and put into a second tube of 9 mL of sterile media The second tube now with 10 mL of solution is now a 1100 dilution of the original sample Each subsequent transfer of 1 mL to a fresh tube of 9 mL sterile media creates another power of ten dilution of the original bacterial sample In this
22
manner the original solution can be diluted as many times as is believed to be necessary A typical dilution series is shown below (Figure 17) and this particular series has had enough time to clearly show signs of growth The number of dilutions must be sufficient to reach a point where no organisms are transferred to the next subsequent dilution Ideally there will be at least two or more dilutions where no growth will appear or the resulting MPN is less likely to be accurate if at all usable Once the dilution series has been created generally carried out to eleven dilutions for the biomachining tests part of that series is used to inoculate the tubes used as growth indicators in the most probable number test In a three-tube MPN an array of test tubes containing 9 mL of sterile media is set up consisting of an arbitrary number of columns of three test tubes each In the biomachining experiment one column was set up for each dilution from 10-4 to 10-11 resulting in a 3 X 8 array or a total of 24 test tubes (Figure 18) Each tube in a given column receives 1 mL from its designated dilution resulting in three 10 mL solutions Once all 24 tubes have been inoculated from their designated dilutions the tube array is incubated until signs of growth appear Once enough time has passed to ensure all the tubes that will show growth have the array is removed from incubation Each three-tube column is given a score corresponding to how many of the tubes show growth ranging from +0 for no growth in any tube to +3 for all tubes showing growth For the statistical analysis the first column where no growth (+0) occurs is noted The sequence of scores of this column and the two preceding it such as +3 +2 +0 is used to find a numerical value in tabulated MPN tables This numerical value is then multiplied by the inverse of the dilution power of the middle column As an example if the sequence of scores is +3 +2 +0 centered on the 10-8 dilution then the value corresponding to a sequence of +3 +2 +0 in the table (say 93) is multiplied by 108 resulting in a total approximate bacterial concentration of the original sample of 93108 organismsmL
A typical dilution series is shown below in Figure 17 and a three-tube MPN is shown in Figure 18 The MPN technique was repeated for each experiment both in the starting solution and at the end of each time period for each jar
Figure 17 A Typical Dilution Series (note growth stops at the 9th dilution)
23
Figure 18 Typical 3-Tube MPN (note growth stops at 8th dilution)
45 Sample Preparation For the main experiment first samples of 9999 pure copper (Alloy 101) were prepared from plate stock The copper was cut into roughly uniform cubes of approximately 12-15 mm to a side using a wire EDM process One face was then chosen and ground to the desired level of surface finish Polishing of the chosen side was carried out using grinding wheels fitted with paper containing Si-C of various grit sizes The grit sizes chosen were 320 600 and 1200 each used in sequence until the desired finish level was reached For the highest level of surface finish a fabric wheel covered with a 6microm diamond particle slurry was used Once polished every sample was contained in a sealed plastic bag to reduce surface oxidation before use in the experiment A total of sixteen samples were prepared and used Four were made for each level of surface finish control and experimental pieces for 24 hour exposure and control and experimental pieces for 48 hour exposure Before use in the experiments each sample was subjected to roughness measurement using a profilometer On the chosen polished side of each sample three tests were done along one direction and three were done in a perpendicular direction In this measurement only the Ra value of roughness was used and the and the specific profilometer settings were data length 56 mm cutoffs 7 Gaussian filter Ls 008 mm and Lc 8 mm To obtain an estimate of overall surface roughness the average of all six readings was used Finally each sample was viewed using a SEM Pictures were captured at 100X and 500X Due to the similarities of surfaces of identical finish only representative micrographs are included for the pre-experiment portion of the data 46 Aseptic Technique Before each experiment every container and sample was sterilized to avoid potential contamination The sealed jars used were autoclaved and were only opened under a bacterial culture hood shown below in Figure 19 The copper samples and the plastic mounts that held them upright were sterilized chemically by soaking them in
24
100 ethanol for 1-2 minutes They were then air-dried on a sterile metal surface under the culture hood that had also been sterilized with 100 ethanol
Figure 19 Microbial Laminar-Flow Hood Used in the Experiments
All media and bacterial samples were transferred between containers using sterile sealed pipettes and a pipettor that was cleaned with 100 ethanol Gloves were always worn and were also rinsed with ethanol Finally the working surface inside the hood was also wiped down with 100alchohol 47 Beginning an Experiment For an experimental run using bacteria four sterile flasks were filled with 150mL of fresh 9K media and inoculated with 2mL each from an existing batch culture under the bacterial culture hood The flasks with vented tops replaced were then shaken at 120 RPM and incubated at 35degC for 48 hours Each flask was then opened in the hood and poured into a 1L sterile flask and mixed Before pouring the mixed bacterial solution into the test jars a sample was taken for an estimate of the initial bacterial concentration using a 3-tube MPN
Each jar was next opened and filled with approximately 150 mL of the mixed bacterial broth In the case of the control tests each jar was filled with 150 mL of fresh 9K media After each metal sample designated for the particular test (one of each finish) and corresponding plastic mount finished air-drying from sterilization with ethanol they were gently placed on the bottom of the jars with the polished metal surface facing upward A typical jar with plastic sample mount is shown below in Figure 20
25
Figure 20 Experiment Jar with Sample in Mount (without media)
Each jar was then sealed and placed in an incubator again at 35degC without
shaking for the designated time period Four such experimental runs were conducted controlwith bacteria for 24 hours and controlwith bacteria for 48 hours 48 Finishing an Experiment At the completion of each time period the jars were removed from the incubator and the samples were removed Each sample was then rinsed gently with de-ionized water and air-dried which was finished by blotting with lint-free wiping paper For transfer to the roughness testing each was wrapped in lint-free wipes and stuffed into a conical tube The remaining bacterial broth in each jar was sampled for final MPNrsquos resulting in a total of five for each experimental run Just as before 1 mL (this time from each jar) was put into 9 mL of sterile 9K media and the dilutions were carried out eleven times Tubes 6-11 were then used in each three-tube MPN to estimate bacterial concentrations Just as before the experiments roughness values were taken on the finished face of the cubical sample Again three values were taken in one direction and three were taken perpendicular to that The average of the six Ra values is used in the experimental results presented below SEM micrographs were also again taken of each surface at 100X and 500X magnification for comparison with the surfaces before exposure An exception to this is the included micrograph at higher magnification believed to show bacterial traces but this is elaborated upon below 49 Material Removal Rate A final experiment was conducted in an attempt to obtain a crude estimate of the material removal rate of the bacteria a necessary quantity in any machining process Previous work gave some values for this parameter and it was desired to see if current experiments produced comparable numbers as well as determine if it changes with time For this test a pre-experiment culturing and MPN were carried out as detailed above in 41 and 47 Four copper foil sheets were cut from shim stock of 0001 in thick Cu Alloy 110 in a designated size of 4 mm by 6 mm and their masses were measured
26
This material is slightly different from the very pure plate stock used in the roughness tests (the foil having a purity of only 999 Cu) but it was deemed similar enough to be relevant and was the only available variety of copper that came in such a thin foil After cutting and then sterilizing in ethyl alcohol two pieces of foil were then fully submerged in 150 mL of bacterial broth and the other two were submerged in equal quantities of sterile 9K media All tests were conducted in the same sample jars used in the roughness experiments which were sealed and incubated at 35deg C for the specified length of time (24 or 48 hours) At the conclusion of the time period each piece of foil was removed rinsed with de-ionized water and air dried The final masses were recorded and then compared to the initial Using the mass difference and time period as well as the known density value for the specific copper alloy[27] a material removal rate was then calculated for each piece of foil which was assumed to be constant over the given time period
27
Chapter 5 Experimental Data 51 Roughness Results Summary The results of the experiment described above are summarized in Figure 22 below Every sample exposed to the bacteria experienced a drastic increase in overall roughness well beyond any bounds of error in the profilometer The controls by contrast all showed little or no increase in roughness The slight variations in the control roughness values could be attributed to the acidic nature of the media (pH of ~25) as well as measurement error in the profilometer It was observed that after exposure to even sterile media individual grains and boundaries became clearly visible indicating at least some corrosion on the surface
320 2
4hr c
ontro
l
320 2
4hr b
acte
ria
320 4
8hr c
ontro
l
320 4
8hr b
acte
ria
600 2
4hr c
ontro
l
600 2
4hr b
acte
ria
600 4
8hr c
ontro
l
600 4
8hr b
acte
ria
1200
24h
r con
trol
1200
24h
r bac
teria
1200
48h
r con
trol
1200
48h
r bac
teria
Diam 2
4hr c
ontro
l
Diam 2
4hr b
acter
ia
Diam 4
8hr c
ontro
l
Diam 4
8hr b
acter
ia
00000
05000
10000
15000
20000
25000
30000
35000
Avg
Rou
ghne
ss R
a (micro
m)
Average Roughness of Copper Samples Before and After Biomachining
Pre-Experiment Post-Experiment
Figure 21 Summarized Experimental Results
28
Figure 22 Summary of Roughness Values Before and After Incubation for Control Samples (top) and Samples Incubated with Bacteria (bottom)
The bacterial populations showed little change in growth behavior beyond regular replication although some (the 1200 and Diamond for 48 hours) did show some decrease The variations in these numbers have many possible sources of error including the inaccuracies inherent in the MPN estimation process possible breakdowns in aseptic technique uneven mixing at each dilution and even slight errors in the amounts of solution transferred between tubes
24 Hour Control Samples
000050100150200250300350
320 600 1200 Diamond
Finish
Rou
ghne
ss R
a (micro
m)
Pre-Experiment Post-Experiment
48 Hour Control Samples
000050100150200250300350
320 600 1200 Diamond
Finish
Rou
ghne
ss R
a (micro
m)
Pre-Experiment Post-Experiment
24 Hour Samples With Bacteria
000050100150200250300350
320 600 1200 Diamond
Finish
Rou
ghne
ss R
a (micro
m)
Pre-Experiment Post-Experiment
48 Hour Samples With Bacteria
000050100150200250300350
320 600 1200 Diamond
Finish
Rou
ghne
ss R
a (micro
m)
Pre-Experiment Post-Experiment
29
52 Bacterial Concentrations 521 Initial Bacterial Concentrations 24 Hours The MPN series ended in a sequence of +3 +3 +0 (ie for two dilutions all three tubes showed growth and then the next higher series had no tubes showing growth) centered at the 10-7 dilution This corresponds to an approximate concentration of 24107 organismsmL 48 hours The MPN series resulted in a sequence of +3 +1 +0 centered at the 108 dilution This corresponds to an approximate concentration of 43107 organismsmL 522 Final Bacterial Concentrations 24 hours 320 MPN series of +3 +1 +0 centered at the 10-8 dilution
bacterial concentration of 43107 organismsmL 600 MPN series of +3 +3 +0 centered at the 10-7 dilution
bacterial concentration of 24107 organismsmL 1200 MPN series of +3 +3 +0 centered at the 10-7 dilution
bacterial concentration of 24107 organismsmL Diamond MPN series of +3 +3 +1 centered at the 10-8 dilution
bacterial concentration of 43107 organismsmL 48 hours 320 MPN series of +3 +2 +0 centered at the 10-8 dilution
bacterial concentration of 93107 organismsmL 600 MPN series of +3 +1 +0 centered at the 10-8 dilution
bacterial concentration of 43107 organismsmL 1200 MPN series of +3 +3 +0 centered at the 10-7 dilution
bacterial concentration of 24107 organismsmL Diamond MPN series of +3 +3 +0 centered at the 10-7 dilution
bacterial concentration of 24107 organismsmL 53 SEM Pictures The qualitative results gleaned from the SEM pictures of each surface all of which are included in Appendix B reinforce the drastic changes shown in the numerical data between pre and post-exposure to A ferrooxidans Before exposure to either media or bacteria each surface shows rather predictable regular patterns for each level of finish As expected the lowest value of surface finish (the 320 grit paper) gives the surface a rather jagged appearance with large canyons carved in parallel by the rather large particles as they removed the surface material Edges of these trenches can be seen to have many irregular portions along their length with almost complete detachment of
30
some of the larger chunks of material As the surface finish become finer the carved trenches become narrower and much more regular until we reach the 6 microm diamond level where hardly any surface features can be seen
The post-experiment SEM micrographs show the drastic contrast between the control surfaces which only experienced the acidic media and those exposed to the bacteria Each surface exposed to the bacteria reveals an extremely uneven surface marked by numerous depressions and craters On some of the more level sections highly ordered angular plates can be seen The higher level surfaces vary from relatively smooth to an almost pin-cushion-like appearance The control surfaces show slight changes in the depths of the aforementioned trenches but the patterns are still very regular and donrsquot seem to change very much from before the experiment It is apparent in some of the control SEM micrographs that grain boundaries are visible The corrosive 9K media apparently preferentially attacks the less organized amorphous regions in between the individual grains of copper so this may explain some of the roughness changes seen in the control samples On some of the higher magnification micrographs for samples incubated with bacteria especially the 600 finish sample incubated for 48 hours small regular rod shapes can be seen on some of the lower level surfaces It his highly unlikely that these actually are individuals of A ferrooxidans but the general shape and size suggest that they may be remnants of where the bacteria once adhered to the surface Corrosion caused by single individuals may have created depressions that show up in these images Actual bacteria would most likely have been vaporized by charge buildup from the electron source of the microscope A picture at 2500X magnification of the 600 finish sample with the possible bacterial remnants is shown below in Figure 23
Figure 23 Possible Bacterial Traces on a Copper Surface
31
54 Material Removal Rate
The copper foil pieces displayed drastic differences in mass after exposure to bacterial solutions of A ferrooxidans indicating a pronounced removal of material The control experiments while displaying some material loss due to the acidic nature of the 9K media have an almost insignificant change in mass when compared to the pieces exposed to the bacteria The results are summarized below in Table 6 The MPN resulted in +3 +1 +0 centered at the 10-8 dilution corresponding to initial bacterial concentrations of 43107 organismsmL for both bacterial tests Table 6 Material Removal Rate Data Foil Label Initial Mass Final Mass Material Removal Rate 24 hr Control 05295 g 05250 g 873810-4 mmhr 24 hr Bacteria 05330 g 03691 g 0032 mmhr 48 hr Control 05250 g 05245 g 485510-5 mmhr 48 hr Bacteria 05259 g 03512 g 0017 mmhr Aside from the large mass differences exhibited by the foil pieces exposed to the bacteria visible physical differences were also observed between them and the control pieces The pieces exposed to bacteria had visible grain boundaries and were much less lustrous than their control counterparts
32
6 Conclusions The most obvious conclusion that can be made using the experimental results is that the ldquomachiningrdquo effect on copper produced by Acidithiobacillus ferrooxidans is very detrimental to surface finish This largely uneven corrosion seems to be produced regardless of initial finish at least past the rather rough 320 grit size In this current setup bacterial machining is impractical for fine control of nano-scale material removal That being said the process could still have potential if some possible refinements are added The rather uneven nature of the corrosion effect could be partially caused by the deposition of the solid waste products of the copper corrosion on the sample surface This material could effect how well the bacteria adhere to the copper surface thus shielding a covered area from bacterial corrosion One fairly simple remedy for this is to conduct the experiment in a non-quiescent fluid environment If a properly controlled flow of media is constantly forced over the sample it may carry away the waste material thus leaving unaffected material exposed for bacterial adhesion The optimal flow rate would promote waste removal while not preventing the bacteriarsquos access to the surface and this would have to be determined through further empirical testing A slightly more complex modification of this process would involve the use of single-crystal copper The irregular pattern of crystal grains and the disorganized nature of the grain boundaries may contribute to the lack of evenness in the corrosion Single grain copper crystals could potentially eliminate effects of etching at the grain boundaries by the 9K media thus exposing a relatively smooth surface to the bacteria If this is combined with forced fluid flow over the sample much more uniformity in material removal could potentially be achieved The material removal rate tests were very simple in nature but they still suggest possible trends in the removal behavior exhibited by the bacteria The noticeably lower material removal rate for the 48 hour time period suggests that not only is the removal rate not uniform but it slows down with time The otherwise identical 24 hour test suggests an initially high MRR which may slow down due to waste buildup in the liquid media or lack of oxygen The first suggested cause seems more likely especially since the media used in the test exhibited a much deeper orange color as did the precipitate than the typical liquid media exhibiting growth The color suggests a buildup of copper compounds most likely CuS as suggested in the reaction diagrams in 23 One possible way to make the material removal rate more uniform with time is to constantly supply fresh aerated media to and flush waste compounds from the whole working fluid environment Future work could thus initially include a combination of the three modifications suggested above A single crystal of copper would be able to present the most even surface possible to the bacteria as no grain boundaries would exist to be corroded by the media If fresh media were constantly supplied and forced over the surface of the workpiece at a controlled flow rate waste compounds could be removed as they are generated and the copper surface could remain evenly exposed for bacterial machining After these initial modifications other process and environment parameters can be varied to further refine and find the limits of biomachining
33
References [1] Williams K and Gupta K and Wasilik M (2003) ldquoEtch Rates for
Micromachining Processing-Part IIrdquo Journal of Microelectromechanical Systems Vol 12 No 6 pp 761-778
[2] Uno Y Kaneeda T and Yokomizo S (1993) ldquoFundamental study on biomachining (machining of metals by Thiobacillus ferrooxidans)rdquo Transactions of the Japan Society of Mechanical Engineers Part C Vol 59 pp 3199-3204
[3] Kumada M Kawakado T Kobuchi S Uno Y Maeda S and Miyuki H (2001) ldquoInvestigations of fine biomachining of metals by using microbially influenced corrosion - Differences between steel and copper in metal biomachining by using Thiobacillus Ferrooxidansrdquo Zairyo to Kankyo Corrosion Engineering Vol 50 pp 411-417
[4] Kurosaki Y Matsui M Nakamura Y Murai K and Kimura T (2003) ldquoMaterial processing using microorganisms (An investigation of microbial action on metals)rdquo JSME International Journal Series C Mechanical Systems Machine Elements and Manufacturing Vol 46 pp 322-330
[5] Uno Y Kaneeda T and Yokomizo S (1996a) ldquoFundamental study on biomachining (machining of metals by Thiobacillus ferrooxidans)rdquo JSME International Journal Series C Vol 39 pp 837-842
[6] Uno Y Kaneeda T Yokomizo S and Yoshimura T (1996b) ldquoFundamental study on electric field assisted biomachiningrdquo Journal of the Japan Society for Precision Engineering Vol 62 pp 540-543
[7] Zhang D and Li Y (1996) ldquoPossibility of biological micromachining used for metal removalrdquo Science in China Series C Life Sciences Vol 41 pp 151-156
[8] Zhang D and Li Y (1998) ldquoStudies on kinetics and thermodynamics of biomachining pure copperrdquo Science in China Series C Life Sciences Vol 42 pp 57-62
[9] Gomez C Blazquez M and Ballester A (1999) ldquoBioleaching of a Spanish complex sulphide ore bulk concentraterdquo Minerals Engineering Vol 12 pp 93-106
[10] Konishi Y Kubo H and Asai S (1992) ldquoBioleaching of zinc sulfide concentrate by Thiobacillus ferrooxidansrdquo Biotechnology and Bioengineering Vol 39 pp66-74
[11] Olson G (1991) ldquoRate of pyrite bioleaching by Thiobacillus ferrooxidans Results of an interlaboratory comparisonrdquo Applied Environmental Microbiology Vol 57 (3) pp 642ndash644
[12] Bond D Holmes D Tender L and Lovley D (2002) ldquoElectrode-reducing microorganisms that harvest energy from marine sedimentsrdquo Science 295483-5
[13] Lovley D R Phillips E J P Gorby Y A Landa E R (1991) ldquoMicrobial reduction of uraniumrdquo Nature Vol 350 pp 413-416
[14] Lovley D R (2003) ldquoCleaning up with genomics applying molecular biology to bioremediationrdquo Nature Reviews Vol 1 pp 35-44
34
[15] Viamajala S Peyton B and Petersen J (2003) ldquoModeling chromate reduction in Shewanella oneidensis MR-1 development of a novel dual-enzyme kinetic modelrdquo Biotechnology and Bioengineering Vol 83 No 7 pp 790-797
[16] Dinh H Kuever J Mussmann M Hassel A Stratmann M and Widdel F (2004) ldquoIron corrosion by novel anaerobic microorganismsrdquo Nature Vol 427(6977) pp 829-832
[17] Chaudhuri S and Lovley D (2003) ldquoElectricity generation by direct oxidation of glucose in mediatorless microbial fuel cellsrdquo Nature Biotechnology Vol 21 No 10 pp 1229-1232
[18] Levett Paul N Anaerobic Bacteria A Functional Biology Open University Press Philadelphia 1990
[19] Wilkinson J F Introduction to Microbiology John Wiley and Sons New York 1975
[20] MVTechnologies Inc (MVTI) [21] Walsh E OrsquoF An Introduction to Biochemistry English Universities Press
London 1961 [22] Zehnder A J B Biology of Anaerobic Microorganisms John Wiley and Sons
New York 1988 [23] httpwwwvkmrucatalogpdfmediapdf [24] Johnson Macvicar and Rolfe ldquoA New Solid Medium for the Isolation and
Enumeration of Thiobacillus Ferrooxidans and Acidophilic Heterotrophic Bacteriardquo The Journal of Microbiological Methods Vol 7 Number 1 1987 pp 9-18
[25] Southam G and Beveridge T J ldquoEnumeration of Thiobacilli within pH-Neutral and Acidic Mine Tailings and Their Role in the Development of Secondary Mineral Soilrdquo Applied and Environmental Microbiology Vol 58 Number 6 June 1992 pp 1904-1912
[26] httpwwwjlindquistnetgeneralmicro102dil3html [27] httpwwwsuppliersonlinecompropertypagesC11000asp
35
Appendix A Experimental Roughness Values A1 Pre-Experiment
Label Ra Values (microm)
Average (microm)
320 24hr control 06168 05536 05284 05091 04927 05757 05987 320 24hr bacteria 03703 04132 03811 03513 03633 05117 05014 320 48hr control 04765 04834 05057 05501 04471 04231 04979 320 48hr bacteria 06029 05958 05349 05426 07305 06431 05206 600 24hr control 0301 03215 03016 02771 03918 02947 03628 600 24hr bacteria 03074 03319 0317 0363 03431 03239 03368 600 48hr control 02778 02967 02859
36
02534 03205 03024 03399 600 48hr bacteria 03735 03596 03866 03364 03568 03388 03657 1200 24hr control 01555 01842 01719 01693 02184 01963 01939 1200 24hr bacteria 01979 01644 01654 01797 01432 0145 01549 1200 48hr control 02055 02212 02008 02166 02377 02449 02217 1200 48hr bacteria 02699 02306 02583 02232 02181 02195 01946 Diam 24hr control 00633 00690 00783 00745 00566 00744 00666 Diam 24hr bacteria 00304 00346 00382 00369
37
00295 00399 00328 Diam 48hr control 00504 00487 00519 00476 00477 00506 00437 Diam 48hr bacteria 004 00502 00383 00368 00548 0046 00853 A2 Post-Experiment
Label Ra Values (microm)
Average (microm)
320 24hr control 05093 04806 04717 04466 05079 04779 04704 320 24hr bacteria 40345 30396 41263 22224 11939 34905 31699 320 48hr control 04159 04162 04018 03825 04539 04349 04082 320 48hr bacteria 26231 30146 29079 36229 29167 30213 29954 600 24hr control 02934 02847 02661
38
03096 02788 02757 02846 600 24hr bacteria 2816 22547 21324 21519 21726 21195 21358 600 48hr control 04503 04087 03814 03961 0394 04267 04037 600 48hr bacteria 20805 22723 18524 24643 18637 24745 28985 1200 24hr control 02211 02039 02032 02108 02235 01855 01792 1200 24hr bacteria 25051 20462 23025 19845 15742 17522 21588 1200 48hr control 03195 02935 02736 02983 03315 02681 027 1200 48hr bacteria 23707 21281 20559 19257
39
23222 20152 2079 Diam 24hr control 01773 01588 01811 01661 01425 01438 0142 Diam 24hr bacteria 19187 20563 20323 22641 23499 19352 18374 Diam 48hr control 04644 04828 05018 04834 04961 05621 03888 Diam 48hr bacteria 20618 17603 12904 13919 17156 18022 22998
40
Appendix B SEM Micrographs B1 Pre-Experiment SEM Micrographs
Typical 320 Finish (images from 24 Hour Control)
Typical 600 Finish (images from 24 Hour Control)
Typical 1200 Finish (images from 48 Hour Control)
41
Typical Diamond Finish (images from 48 Hour Control)
B2 Post-Experiment SEM Micrographs
320 Finish 24 Hour With Bacteria
320 Finish 24 Hour Control
42
320 Finish 48 Hour With Bacteria
320 Finish 48 Hour Control
600 Finish 24 Hour With Bacteria
43
600 Finish 24 Hour Control
600 Finish 48 Hour With Bacteria
600 Finish 48 Hour Control
44
1200 Finish 24 Hour With Bacteria
1200 Finish 24 Hour Control
1200 Finish 48 Hour With Bacteria
45
1200 48 Hour Control
6microm Diamond Finish 24 Hour With Bacteria
6microm Diamond Finish 24 Hour Control
46
6microm Diamond Finish 48 Hour With Bacteria
6microm Diamond Finish 48 Hour Control
3
Chapter 2 Overview of the Biological Mechanism Involved in Biomachining 21 Biological Background and Species Selection Every organism can be classified based on where it obtains its carbon used for growing and repairing damage and how it produces energy the fuel it uses to run all metabolic processes Organisms known as lithotrophs obtain carbon from inorganic compounds including carbon dioxide Organotrophs on the other hand obtain all the carbon they use from organic compounds including those from other organisms Each of these groups can be further subdivided based on how included organisms obtain energy The prefix Chemo- is given to those organisms that extract energy by processing matter with chemolithotrophs typically processing inorganic matter and chemoorganotrophs which process organic matter Many large animals (including humans) and bacteria are classified as chemoorganotrophs The other energy production method involves using energy from light and organisms that use this process have the prefix Photo- assigned to them Plants are the most common examples of photolithotrophs[2] Organisms fitting into the category of chemolithotrophs have been the subject of intensive research lately for their unique ability to either oxidize or reduce certain inorganic compounds especially heavy metals Species such as Shewanella oneidensis have been investigated for a process known as ldquobioremediationrdquo in which toxic chemicals are taken out of groundwater by the natural reduction reactions of the bacteria Species such as Geobacter metallireducens and Rhodoferax ferrireducens have shown potential application for biologically-based fuel cells Finally species such as Desulfovibrio sp and Acidithiobacillus ferrooxidans (formerly Thiobacillus ferrooxidans) have been shown to consume metals as part of their metabolism This process termed ldquobiomachiningrdquo has been analyzed for potential applications to micro and nano-scale manufacturing including for the potential processing of copper Acidithiobacillus ferrooxidans shows the most promise of the two both for its ease of culturing and pronounced consumption of the metal as it grows A summary of the classifications species and potential applications is displayed below in Table 1
4
Table 1 Classifications species and potential applications of various organisms
Carbon Source Energy Source Sample Species Applications
Acidithiobacillus ferrooxidans
Biomachining [2 3 4 5 6 7 8] Bioleaching [9 10 11]
Thiobacillus thiooxidans Bioleaching [9]
Geobacter metallireducens
Microbial fuel cells [12] Bioremediation [13 14]
Shewanella oneidensis Bioremediation [15]
Desulfovibrio sp Biomachining [16]
Chemolithotroph (Energy source Inorganic matter)
Rhodoferax ferrireducens Microbial fuel cells [17]
Lithotroph (Carbon source CO2)
Photolithotroph (Energy source Light)
Plants Chlorella Cyanophta etc NA
Chemoorganotroph (Energy source Organic matter)
Humans most animals most bacteria
NA Organotroph (Carbon source Organic matter)
Photoorganotroph (Energy source Light)
Rhodospirillaceae NA
22 Basic Reactions of The Biomachining Process The Acidthiobacillus ferrooxidans organism is a small rod-like bacterium (shown below in Figure 1) measuring about 1 microm long and 5 microm in diameter [2] that contains a unique set of attributes that makes it suitable as a living micro-machining tool This species belongs to a group of organisms known as chemolithotrophs organisms (usually single-celled) able to obtain energy by the oxidation of inorganic substrates rather than the usual substances such as glucose As a source of carbon the organism can obtain all its needs solely by using CO2 dissolved in its medium Oxygen serving as an electron acceptor does have to be present to make these reactions possible thus technically making A ferrooxidans aerobic The production of energy is obtained from the oxidation of the substrate as well as the combination of hydrogen ions and oxygen being fused into water [18 19] Finally this bacterium is also considered an acidophile as it is able to thrive in a pH level less than 3 [8]
5
Figure 1 Acidithiobacillus Ferrooxidans [20]
The overall reaction employed by A ferrooxidans can be summarized as a combination of the continued oxidation of ferrous iron (Fe2+) to ferric iron (Fe3+) as well as the reduction of H+ ions (from the acidic environment) with oxygen to produce water The reaction is shown below
OHFeHOFe 23
22 22212 +rarr++ +++ (1)
It is the production of the ferric iron that makes this organism useful in micromachining of metals The ferric iron is able to oxidize both pure neutral copper and iron into charged soluble forms thus being able to corrode a solid surface of either metal The reactions for each are summarized below
++ rarr+ 230 32 FeFeFe (2) +++ +rarr+ 2230 22 FeCuFeCu (3)
While the iron and copper ion creation reactions shown above in equations 2 and 3 occur outside the cell those involved in the continuous production of ferric iron and water shown in equation 1 occur inside the cell as described below [8] 23 Kinetics at the Cell Wall and Respiration The cell of each Acidithiobacillus ferrooxidans has a cell wall made up of many layers that separates the interior of the cell the cytoplasm from its environment The outer region of this wall consists of an outer membrane and a region called the peptidoglycan This is then followed by a gap called the periplasmic space where the pH of fluid inside the cell is still near that of the environment (usually ~2) Finally an inner membrane separates the periplasmic space from the cytoplasm The pH in this membrane increases to around 45 and in the cytoplasm the pH approaches neutral The reason for such marked pH variation is twofold the oxidation of ferrous to ferric iron is easier to facilitate in lower pH environments and an excess of hydrogen ions (ie a low pH) allows an ample source of reactant for the water production reaction [7 21] A representation of the cell wall is shown below
6
Figure 2The Cell wall of A ferrooxidans and Key Reactions [7]
The first part of these reactions the continuous production of Fe3+ from Fe2+ involves the transfer of electrons from the ferrous iron This process is accomplished by a series of cellular compounds known as cytochromes labeled cyto-c and cyto-a1 in Figure 2 These large molecules imbedded in the inner membrane of the cell wall often contain metallic atoms such as iron or copper that have a high affinity for accepting electrons An example of a typical cytochrome is shown below
Figure 3 Cytochrome C Configuration [21]
In the process of stripping an electron from the iron atoms these macromolecules are reduced The electrons are then once again stripped by another cytochrome further in the cell thus passing the electrons into the cytoplasm by a series of oxidation-reduction reactions This group of cytochromes that strip and move electrons form what is called an ldquoelectron transport chainrdquo In A ferrooxidans we see cytochrome-c (which strips the
7
electrons from the iron ions) in combination with cytochrome-a1 [7] It is believed that cytochrome-a1 performs a similar task to another cytochrome in its family called a3 which facilitates the reoxidation (taking the acquired electrons back out) of c-cytochromes thus acting as a c-cytochrome oxidase Cytochrome-a1 is believed to be the final link in the electron transport chain described above It must be said however that the exact functioning of this group of cytochromes is still not well defined [21] The oxidation of iron takes place in the low pH of the periplasmic space along with the uptake of H+ ions The whole goal of these two processes the coupling of the reoxidation of the cytochromes and the reactions of hydrogen ions with oxygen is to produce useable energy for the organism These reactions produce energy by virtue of the free energy change between the products and the reactants and this energy is used to bind an extra phosphate onto the Adenosine diphospate molecule thus creating Adenosine triphosphate The actual efficiency of the cells in utilizing the redox reactions can vary from 10-50 but this is still efficient enough to produce the necessary energy to create ATP [22] The ATP molecule is vital in nearly all organisms as a means of storing and transporting energy throughout the cell It can store energy in the extra phosphate bond until needed by some cellular process and then release it to create ADP and a free phosphate (which can then be recombined into ATP again) The phosphate bonds are theoretically able to hold anywhere from 37656ndash58576 kJ (9000-14000 calories) each and for each atom of oxygen consumed in a reaction 1-4 phosphate bonds can be produced [21] Another theoretical calculation estimates that the overall reaction used by A ferrooxidans produces around 33472 kJmol (8 kcalmol) of usable energy [2 5] The energy creating process forms a circulatory system of sorts for the iron ions as they are continually converted to Fe3+ exuded from the cell reduced to Fe2+ by their reaction with copper or iron then reabsorbed into the periplasmic space for reoxidation Hydrogen ions are obviously consumed and water is produced Thus H+ ions must be continually supplied or the reaction cannot move forward A representation of the reactions involved is depicted below in Figure 4
8
Figure 4 Biomachining Process Reactions [8]
The lower reactions on the chart come from the ferric iron ionrsquos natural hydrolysis with water ultimately producing Fe(OH)3 and free H+ ions It is in part due to this reaction that the ferric iron ion reaction with the workpiece material is best achieved by those bacteria actually in contact with the part surface The H+ supplying reaction as labeled is a consequence of the copper ions reacting with H2S which was added to the medium The exact reason for using H2S rather than some other H source is described below in section 32 Acidithiobacillus ferrooxidans through the complex reactions described above is thus able to make the energy it needs to survive by performing a useful task to manufacturing engineers Through the oxidation of pure iron and copper this organism is able to produce a machining effect comparable to chemical etching If all of the parameters of this biomachining process can be understood and controlled it may become a commercially viable process able to compete with existing chemical etching in terms of productivity and yet be far more environmentally benign
9
Chapter 3 Previous Work on Biomachining 31 Pioneering Work of Uno Kaneeda and Yokomizo One of the earliest studies of using A ferrooxidans in a manufacturing capacity was performed by Uno Kaneeda and Yokomizo in Japan in 1993 as described in [2] While employing a very basic experimental setup they were able to show some preliminary data on the effects of changing some of the parameters involved in the biomachining process and even suggest a way to accelerate the process with a properly-applied electric potential The setup first employed very pure samples of iron (9995) and copper (9990) which had line patterns put onto them by existing photolithography techniques This left alternating sections of photoresist and exposed metal on the upper surfaces The bacteria and the samples were immersed in a medium known as ldquo9Krdquo the ingredients of which are described below in Table 2 Table 2 9K Media Components [2] Component Mass10L Water (NH4)2SO4 30 g K2HPO4 5 g MgSO4 5 g KCl 1 g Ca(NO3)2 01 g Deionized water 10 L H2SO4 Adjust the pH to 25 FeSO4 3 vol
The samples and bacteria immersed in the 9K medium and in open beakers were then incubated at a constant temperature and constantly mixed with an agitator The sketch of the experimental setup is shown below in Figure 5
10
Figure 5 Basic Biomachining Experimental Setup [2]
The experiments were first run with a constant temperature of 28ordm C and a shaking rate of 160 cycles per minute Three different strains of Acidithiobacillus ferrooxidans (ATCC 13598 13661 and 33020) were tested in these runs on both metals and all yielded similar results as shown below in Figure 6
Figure 6 Biomachining Experiments on Fe (left) and Cu (right) [2]
As shown in the graphs the biomachining rate at these conditions is almost directly proportional to time for all three species which makes the process time relatively simple to predict For Cu the MRR was about 20 micromhr and for Fe the MRR was 14 micromhr The control of the experiment using just the 9K medium shows that the bacteria do indeed produce all of the material removal effect despite the corrosive (pH ~25) medium
11
As a variation on the initial conditions the researchers varied temperature for one strain (ATCC 13598) and observed the mean material removal rate The results for both Fe and Cu are shown below in Figure 7
Figure 7 Mean MRR vs Temperature in Biomachining [2]
As the figure shows the peak MRR for Cu (~23 micromhr) is near 30ordmC while for Fe the max MRR (~20 micromhr) occurs near 40ordmC Thus temperature proves to be a relatively key variable in the efficiency of biomachining Any process designed to employ biomachining will obviously have to control temperature to keep the MRR near its theoretical maximum As a final experiment with biomachining Uno et al applied different electric potentials to the workpieces to observe how changing that would influence the biomachining rate The results for using strain ATCC 13598 on Fe and Cu for a variety of applied voltages are shown below in Figure 8
Figure 8 Biomachining with Varied Applied Voltages for Fe (left) and Cu (right) [2]
As shown above if positive applied voltages are used the MRR is accelerated over baseline For iron if the voltage applied is negative (5V in this case) the MRR is actually negative indicating material is deposited Thus applied voltage can have an accelerating effect in the biomachining rate but more work needs to be done to determine if there is a maximum voltage which yields a benefit to the process
12
32 The work of Zhang and Li Mechanisms and Kinetics Another pioneering group in the area of biomachining worked in China producing papers on the subject in 1996 and 1998[7 8] Zhang and Li not only elaborated on the biological mechanisms used by A ferrooxidans but also gave equations relating the kinetics of the overall reaction to experimental conditions Their more detailed work can give us valuable insight into the process and an initial point to begin studying parameter adjustment in the biomachining process In their 1996 paper Zhang and Li perform an experiment very similar to the one by Uno et al The sample was prepared once again using existing photolithographic techniques The prepared sample was then incubated with the bacteria for a period of time Finally the sample was removed periodically and measured both with a profilometer and scanning electron microscope The data they collected showed that the average biomachining (ie material removal) rates were 10 micromhr for iron and 135 micromhr for pure copper The data graphs producing these rates are shown below in Figure 9
Figure 9 Biomachining Depth vs Time for Fe (left) and Cu (right) [7]
As figure 9 shows the biomachining rates in Zhang and Lirsquos tests remained nearly constant over the length of the tests In addition to this Zhang and Li explained the Fe oxidizing and reducing reactions involved as used above as well as explaining what parts of the cell (periplasmic space cytochromes etc) are used in the reactions They concluded that the biomachining process is entirely dependent on the biological recreation of Fe3+ In 1998 Zhang and Li went further in explaining the biomachining process by studying the kinetics of each sub-reaction and how experimental concentrations affected each of these reaction rates The first reaction relates the consumption of Fe3+ labeled as
][ 3+FeVc below in equation 4 to the mass change of a Cu sample
))((5463102][ 403 hLmmolCuFeVc ∆=+ (4)
After this the rate of generation of Fe3+ (shown below as Vg[Fe3+ ] in equation 5) is dependent on both its consumption (denoted as Vc[Fe3+ ] below) and what Zhang and Li called its ldquoincrease raterdquo (Vt[Fe3+ ])
13
))(]([[][ 333 hLmmolFeVFeVFeV ctg
+++ += (5) Vg[Fe3+ ] and Vc[Fe3+ ] tend to become equal over time and Vt[Fe3+ ] starts out large in the first few hours of an experiment and then turns to zero as the system reaches a stable ion concentration The equilibrium equations of generating and consuming Fe3+ show that these quantities are directly proportional to the Fe2+ and Fe3+ concentrations respectively
][][
2
3
+
+
=Fe
FeVKg g (6)
][][
3
3
+
+
=FeFeV
Kc c (7)
Kg (equation 6) is the rate coefficient of generating Fe3+ and Kc (equation 7) is the rate coefficient of consuming it Both have units of mmol(Lh) In their experiments Zhang and Li found that the generation and consumption rates and coefficients were directly proportional to bacterial cell concentration The data for these rates taking out effects of non-biological sources and sinks of Fe3+ are shown below
Figure 10 Vg[Fe3+]and Vc[Fe3+] vs cell concentration (left) and Kg and Kc vs cell concentration
(right) [8] The result of all of this is that the material removal rate is directly proportional to the amount of A ferrooxidans organisms present as might be expected What these graphs donrsquot show is whether or not there is some maximum bacterial concentration at which biomachining can occur This leaves an open question for our research as one obviously cannot increase the bacterial count indefinitely In their experiments Zhang and Li studied how the hydrolysis of Fe (as described above in section 2) affects H+ ion concentration which also affects the biomachining
14
process since it is taken up by A ferrooxidans in the respiration process They found that the natural decrease due to hydrolysis was lower than that caused by consumption by the organism The big conclusion of the experiments is that H+ ions must be supplied to keep the reaction moving and allow the organism to reproducegrow Ideally the pH should be kept around 2 to not negatively impact the process A final conclusion reached by Zhang and Li is that the buildup of Cu ions in solution (from their oxidation by Fe3+) can cause the biomachining process to slow down As shown in the schematic diagram of the reactions used above they took care of this problem by bubbling H2S gas into the solution This gas supplies H+ ions and creates CuS which precipitates thus removing the Cu ions from solution
15
Chapter 4 Experimental Setup 41 Introduction To conduct our own experiments with A ferrooxidans the bacteria first had to be obtained and cultured successfully Several variations on the basic liquid media for this species were tried until one that was both effective and easy to make was found Before continuous cultures could even be created however the bacteria first had to be isolated which is most easily done on solid media such as common bacterial agar Due to the acidic conditions required by this bacterial species a specialized form of gelatinous media had to be found that would solidify even under a low pH Finally once we were confident we had isolated A ferrooxidans and were able to continuously culture it we had to devise a successful way to estimate bacterial concentrations Once the bacteria were successfully isolated and growing an experiment was conducted to expand on some of the work described above done by early researchers in the field For nano and micro-scale machining tasks a high degree of precision is required to make any kind of material removal process successful While Zhang Li and others were able to show that using an active population of A ferrooxidans could remove a significant amount of material from a copper surface they did not go into any detail on the resulting surface and specifically its finish For any process that may arise out of using these bacteria to machine copper being able to produce level even surfaces is highly desired The experiments thus conducted by the author as described in detail below looked at changes in surface finish and roughness for several copper sample pieces Both quantitative average roughness values and qualitative surface descriptions were obtained and are discussed below All of the experiments show that without some significant changes to the basic biomachining process surface finish quality degrades significantly and even though drastic material removal can be seen the uneven nature of its distribution across a given surface makes direct applications in manufacturing seem doubtful A second experiment was conducted to obtain a crude estimate of the material removal rate of biomachining pure copper surfaces in the hopes of replicating previous results In that experiment very thin copper foil pieces were exposed to solutions of A ferrooxidans as well as sterile media for the same time periods as the copper blocks The difference in mass was recorded and converted into a material removal rate using known material properties The experimental procedures used to observe the effects of A ferrooxidans on surface roughness and material removal rates of the copper samples involved many steps and many different pieces of laboratory equipment The combination of experimental steps and the continuous culture protocol employed to maintain a healthy population of the bacteria is summarized in the flow chart below (Figure 11) and a full list of equipment used appears in the subsequent table (Table 3) Detailed explanations of each step are laid out in the following sections
16
Figure 11 Experimental Procedures Flow Chart
Table 3 List of Equipment with Model and Manufacturers Chemicals Stock distributed by Sigma Incubator and Shaker innova 4300 by New Brunswick Scientific Microbial Hood BioGARD Hood by Baker Company Inc Media Filtration System Stericup Pre-Sterilized Vacuum Driven Disposable
Filtration System 2 microm filter 1L Jar by Millipore Culture Flasks Pyrex 250 mL Erlenmeyer Flasks distributed by Sigma Experiment Jars 500 mLWide-Mouth Short Clear Glass Jars distributed by
Fisher MPN Test Tubes Fisherbrand Disposable Culture Tubes Borosilicate Glass
by Fisher Dilution Series Tubes Falcon Blue Max Jr 15 mL Polypropylene Conical Tubes
by Becton Dickinson Plates Fisherbrand 15mm Cell Culture Plates by Fisher Flask Filter Top Fisherbrand Non-Sterile Cotton Gauze Sponges by Fisher Copper Foil Copper Shim Stock (110 Annealed) by Lyon Industries Copper Stock Alloy 101 Extreme-Temperature Electronic-Grade Copper
distributed by McMaster-Carr Profilometer Talysurf Intra by Taylor-Hobson SEM XL30 by Philips Mass Scale PG802-S by Mettler Toledo pH Meter Φ360 by Beckman
17
42 Bacterial Media For any microorganism to be able to grow and reproduce successfully it must be kept in an environment that contains all of the nutrients and environmental conditions it requires to live A ferrooxidans as described above typically requires a liquid environment with a low pH and some metal to serve as its source of electrons in the respiration process This particular species has been known to biologists for some time so there are standard media recipes available for it and other similar acidophilic bacteria The most commonly used media is referred to as 9K which is a rather simple mix of salts and sulphate compounds combined with a source of iron for use by the bacteria 421 Liquid Media The most basic recipe found for 9K bacterial media was used based on that listed at the website of All-Russian Collection of Microorganisms[23] This recipe employs two separate solutions that are mixed after sterilization Each component is added in the order listed Table 4 2-Solution 9K Media Components [23] Solution 1 Solution 2 700mL H2O 300mL H2O 01g KCl 30g FeSO47H2O 3g (NH4)2SO4 05g Mg SO4 05g K2 PO4 001g Ca(NO3) 2 The pH of each is adjusted to 25-26 using sulphuric acid (H2SO4) Finally each solution is passed through a 2 microm filter into a sterile sealed flask When the two solutions mix in the flask the mixture becomes opaque and yellow and a precipitate forms The precipitate eventually oxidizes even in the sealed flask rendering the media less useful for bacterial culture of A ferrooxidans The approximate shelf-life of this 9K media is two to three weeks 422 Solid Media Solid media was used for isolation of A ferrooxidans after first obtaining samples from ATCC This plate media incorporated three solutions that were combined at the time of pouring The solution formulations (as originally given) are shown in Table 5 Table 5 Solid Media Solution Components [24] Solution 1 Solution 2 Solution3 10g Fe SO4 09g (NH4)2SO4 1g100mL Bacterial Agar 500mL H2O 035g Mg SO4 0175g Tryptone Soy Broth 500mL H2O
18
Solutions 1 and 2 each had their pH adjusted to ~2 using H2SO4 Instead of TSB Bacto Tryptone was used and desired results were still achieved After experimenting with several ratios of the solutions we found a 11410 combination of solution 1solution 2solution 3 worked very well Further increasing the proportion of agar solution produces a media that solidifies very well despite the acidic nature of the other solutions Plates using this media were poured under a bacterial hood to ensure sterility 43 Culturing A ferrooxidans The bacterial sample came directly from ATCC (21834) in a sealed test tube as shown below in Figure 12
Figure 12 A ferrooxidans sample as-shipped from ATCC
After acquiring the initial sample from ATCC 2 mL of sample broth were directly deposited onto plate media Samples were then left to incubate at 35deg C until bacterial colonies became visible The colonies that did appear were extremely small units almost impossible to see except under high optical magnification To the naked eye bacterial growth appeared as a bright yellow almost-transparent cloud on the surface of the media typically arranged as one large mass A typical plate with growth is shown below in Figure 13
19
Figure 13 Plate Media with Growth (Upper-Right)
To further isolate A ferrooxidans streaks were taken off of the growth on the plates using sterile plastic picks and mixed into 15mL conical tubes of liquid 9K media After one or two days of being incubated again at 35degC bacterial growth appeared as a drastic color change of the media which turned a bright orange and developed an iridescent film at the surface The precipitate also turned a dark orange color As a control blank tubes of sterile 9K media were incubated at identical conditions The controls showed almost no change with the usual light yellow precipitate color only darkening slightly as it oxidized A side-by-side comparison of the media exhibiting growth and a control sample is shown below in Figure 14
Figure 14 Example Tubes with Bacterial Growth (left) and Without (right)
Continuous cultures of A ferrooxidans were produced by taking several mL from tubes showing the most dramatic signs of growth and mixing them into flasks of 9K media Each flask was created with a vented top of tightly packed medical gauze which was covered with aluminum foil and autoclaved Each 250 mL flask was filled with 150 mL of 9K media upon use and after the bacterial broth was mixed in the vented tops
20
were replaced all under a bacterial hood to avoid contamination The inoculated flasks were then incubated at 35degC and shaken at 120 cyclesminute Using this culturing protocol one flask would last approximately four to seven days at which time the process was repeated using 2 mL from the previous flask The growth behavior visible in the shaken flasks was very similar to that mentioned for the sealed conical tubes used in isolating the bacteria The 9K media generally turned a bright orange color within two days (Figure 15) and the precipitate solidified into one darker mass on the bottom of the flask As time passed the color would fade back to almost the same light yellow color of uninnoculated 9K media but the precipitate would remain as one hard solid mass on the bottom (Figure 16) Generally this reversal of the color change would happen after four to five days and that was used that as an indicator of when to create a fresh inoculation As a control sterile 9K media was again incubated under identical conditions and just like in the tube controls only a slight darkening of the precipitate was observed after many days due to oxidation
Figure 15 Culture Flask After ~48 Hours Incubation (2mL Innoculation)
21
Figure 16 Culture Flask After ~120 Hours Incubation (2mL Innoculation)
44 Bacterial Concentration Estimation Technique The 3-Tube MPN Due to the small size of A ferrooxidans cells conventional counting techniques that rely on optical microscopy were deemed ineffective for estimating the bacterial populations in the biomachining experiments Instead of using a device such as a hacyometer to count individuals present in a pre-determined fluid volume by visual inspection a statistical method known as the most probable number (or MPN) technique was used that could give very clear results with reasonable levels of accuracy[25 26] This technique involves two main steps creating an initial series of dilutions of the original sample and then using those dilutions to inoculate a collection of test tubes to watch for growth Starting with an initial bacterial sample in this case broth incubated for 48 hours the first step in creating an MPN is to create a collection of dilutions of that initial sample Initially one mL of original sample is put into a test tube containing 9mL of sterile media of the same type used in culturing the bacteria The resulting 10 mL solution is then a 110 dilution of the original bacterial solution To create the next dilution 1 mL of the new solution is withdrawn and put into a second tube of 9 mL of sterile media The second tube now with 10 mL of solution is now a 1100 dilution of the original sample Each subsequent transfer of 1 mL to a fresh tube of 9 mL sterile media creates another power of ten dilution of the original bacterial sample In this
22
manner the original solution can be diluted as many times as is believed to be necessary A typical dilution series is shown below (Figure 17) and this particular series has had enough time to clearly show signs of growth The number of dilutions must be sufficient to reach a point where no organisms are transferred to the next subsequent dilution Ideally there will be at least two or more dilutions where no growth will appear or the resulting MPN is less likely to be accurate if at all usable Once the dilution series has been created generally carried out to eleven dilutions for the biomachining tests part of that series is used to inoculate the tubes used as growth indicators in the most probable number test In a three-tube MPN an array of test tubes containing 9 mL of sterile media is set up consisting of an arbitrary number of columns of three test tubes each In the biomachining experiment one column was set up for each dilution from 10-4 to 10-11 resulting in a 3 X 8 array or a total of 24 test tubes (Figure 18) Each tube in a given column receives 1 mL from its designated dilution resulting in three 10 mL solutions Once all 24 tubes have been inoculated from their designated dilutions the tube array is incubated until signs of growth appear Once enough time has passed to ensure all the tubes that will show growth have the array is removed from incubation Each three-tube column is given a score corresponding to how many of the tubes show growth ranging from +0 for no growth in any tube to +3 for all tubes showing growth For the statistical analysis the first column where no growth (+0) occurs is noted The sequence of scores of this column and the two preceding it such as +3 +2 +0 is used to find a numerical value in tabulated MPN tables This numerical value is then multiplied by the inverse of the dilution power of the middle column As an example if the sequence of scores is +3 +2 +0 centered on the 10-8 dilution then the value corresponding to a sequence of +3 +2 +0 in the table (say 93) is multiplied by 108 resulting in a total approximate bacterial concentration of the original sample of 93108 organismsmL
A typical dilution series is shown below in Figure 17 and a three-tube MPN is shown in Figure 18 The MPN technique was repeated for each experiment both in the starting solution and at the end of each time period for each jar
Figure 17 A Typical Dilution Series (note growth stops at the 9th dilution)
23
Figure 18 Typical 3-Tube MPN (note growth stops at 8th dilution)
45 Sample Preparation For the main experiment first samples of 9999 pure copper (Alloy 101) were prepared from plate stock The copper was cut into roughly uniform cubes of approximately 12-15 mm to a side using a wire EDM process One face was then chosen and ground to the desired level of surface finish Polishing of the chosen side was carried out using grinding wheels fitted with paper containing Si-C of various grit sizes The grit sizes chosen were 320 600 and 1200 each used in sequence until the desired finish level was reached For the highest level of surface finish a fabric wheel covered with a 6microm diamond particle slurry was used Once polished every sample was contained in a sealed plastic bag to reduce surface oxidation before use in the experiment A total of sixteen samples were prepared and used Four were made for each level of surface finish control and experimental pieces for 24 hour exposure and control and experimental pieces for 48 hour exposure Before use in the experiments each sample was subjected to roughness measurement using a profilometer On the chosen polished side of each sample three tests were done along one direction and three were done in a perpendicular direction In this measurement only the Ra value of roughness was used and the and the specific profilometer settings were data length 56 mm cutoffs 7 Gaussian filter Ls 008 mm and Lc 8 mm To obtain an estimate of overall surface roughness the average of all six readings was used Finally each sample was viewed using a SEM Pictures were captured at 100X and 500X Due to the similarities of surfaces of identical finish only representative micrographs are included for the pre-experiment portion of the data 46 Aseptic Technique Before each experiment every container and sample was sterilized to avoid potential contamination The sealed jars used were autoclaved and were only opened under a bacterial culture hood shown below in Figure 19 The copper samples and the plastic mounts that held them upright were sterilized chemically by soaking them in
24
100 ethanol for 1-2 minutes They were then air-dried on a sterile metal surface under the culture hood that had also been sterilized with 100 ethanol
Figure 19 Microbial Laminar-Flow Hood Used in the Experiments
All media and bacterial samples were transferred between containers using sterile sealed pipettes and a pipettor that was cleaned with 100 ethanol Gloves were always worn and were also rinsed with ethanol Finally the working surface inside the hood was also wiped down with 100alchohol 47 Beginning an Experiment For an experimental run using bacteria four sterile flasks were filled with 150mL of fresh 9K media and inoculated with 2mL each from an existing batch culture under the bacterial culture hood The flasks with vented tops replaced were then shaken at 120 RPM and incubated at 35degC for 48 hours Each flask was then opened in the hood and poured into a 1L sterile flask and mixed Before pouring the mixed bacterial solution into the test jars a sample was taken for an estimate of the initial bacterial concentration using a 3-tube MPN
Each jar was next opened and filled with approximately 150 mL of the mixed bacterial broth In the case of the control tests each jar was filled with 150 mL of fresh 9K media After each metal sample designated for the particular test (one of each finish) and corresponding plastic mount finished air-drying from sterilization with ethanol they were gently placed on the bottom of the jars with the polished metal surface facing upward A typical jar with plastic sample mount is shown below in Figure 20
25
Figure 20 Experiment Jar with Sample in Mount (without media)
Each jar was then sealed and placed in an incubator again at 35degC without
shaking for the designated time period Four such experimental runs were conducted controlwith bacteria for 24 hours and controlwith bacteria for 48 hours 48 Finishing an Experiment At the completion of each time period the jars were removed from the incubator and the samples were removed Each sample was then rinsed gently with de-ionized water and air-dried which was finished by blotting with lint-free wiping paper For transfer to the roughness testing each was wrapped in lint-free wipes and stuffed into a conical tube The remaining bacterial broth in each jar was sampled for final MPNrsquos resulting in a total of five for each experimental run Just as before 1 mL (this time from each jar) was put into 9 mL of sterile 9K media and the dilutions were carried out eleven times Tubes 6-11 were then used in each three-tube MPN to estimate bacterial concentrations Just as before the experiments roughness values were taken on the finished face of the cubical sample Again three values were taken in one direction and three were taken perpendicular to that The average of the six Ra values is used in the experimental results presented below SEM micrographs were also again taken of each surface at 100X and 500X magnification for comparison with the surfaces before exposure An exception to this is the included micrograph at higher magnification believed to show bacterial traces but this is elaborated upon below 49 Material Removal Rate A final experiment was conducted in an attempt to obtain a crude estimate of the material removal rate of the bacteria a necessary quantity in any machining process Previous work gave some values for this parameter and it was desired to see if current experiments produced comparable numbers as well as determine if it changes with time For this test a pre-experiment culturing and MPN were carried out as detailed above in 41 and 47 Four copper foil sheets were cut from shim stock of 0001 in thick Cu Alloy 110 in a designated size of 4 mm by 6 mm and their masses were measured
26
This material is slightly different from the very pure plate stock used in the roughness tests (the foil having a purity of only 999 Cu) but it was deemed similar enough to be relevant and was the only available variety of copper that came in such a thin foil After cutting and then sterilizing in ethyl alcohol two pieces of foil were then fully submerged in 150 mL of bacterial broth and the other two were submerged in equal quantities of sterile 9K media All tests were conducted in the same sample jars used in the roughness experiments which were sealed and incubated at 35deg C for the specified length of time (24 or 48 hours) At the conclusion of the time period each piece of foil was removed rinsed with de-ionized water and air dried The final masses were recorded and then compared to the initial Using the mass difference and time period as well as the known density value for the specific copper alloy[27] a material removal rate was then calculated for each piece of foil which was assumed to be constant over the given time period
27
Chapter 5 Experimental Data 51 Roughness Results Summary The results of the experiment described above are summarized in Figure 22 below Every sample exposed to the bacteria experienced a drastic increase in overall roughness well beyond any bounds of error in the profilometer The controls by contrast all showed little or no increase in roughness The slight variations in the control roughness values could be attributed to the acidic nature of the media (pH of ~25) as well as measurement error in the profilometer It was observed that after exposure to even sterile media individual grains and boundaries became clearly visible indicating at least some corrosion on the surface
320 2
4hr c
ontro
l
320 2
4hr b
acte
ria
320 4
8hr c
ontro
l
320 4
8hr b
acte
ria
600 2
4hr c
ontro
l
600 2
4hr b
acte
ria
600 4
8hr c
ontro
l
600 4
8hr b
acte
ria
1200
24h
r con
trol
1200
24h
r bac
teria
1200
48h
r con
trol
1200
48h
r bac
teria
Diam 2
4hr c
ontro
l
Diam 2
4hr b
acter
ia
Diam 4
8hr c
ontro
l
Diam 4
8hr b
acter
ia
00000
05000
10000
15000
20000
25000
30000
35000
Avg
Rou
ghne
ss R
a (micro
m)
Average Roughness of Copper Samples Before and After Biomachining
Pre-Experiment Post-Experiment
Figure 21 Summarized Experimental Results
28
Figure 22 Summary of Roughness Values Before and After Incubation for Control Samples (top) and Samples Incubated with Bacteria (bottom)
The bacterial populations showed little change in growth behavior beyond regular replication although some (the 1200 and Diamond for 48 hours) did show some decrease The variations in these numbers have many possible sources of error including the inaccuracies inherent in the MPN estimation process possible breakdowns in aseptic technique uneven mixing at each dilution and even slight errors in the amounts of solution transferred between tubes
24 Hour Control Samples
000050100150200250300350
320 600 1200 Diamond
Finish
Rou
ghne
ss R
a (micro
m)
Pre-Experiment Post-Experiment
48 Hour Control Samples
000050100150200250300350
320 600 1200 Diamond
Finish
Rou
ghne
ss R
a (micro
m)
Pre-Experiment Post-Experiment
24 Hour Samples With Bacteria
000050100150200250300350
320 600 1200 Diamond
Finish
Rou
ghne
ss R
a (micro
m)
Pre-Experiment Post-Experiment
48 Hour Samples With Bacteria
000050100150200250300350
320 600 1200 Diamond
Finish
Rou
ghne
ss R
a (micro
m)
Pre-Experiment Post-Experiment
29
52 Bacterial Concentrations 521 Initial Bacterial Concentrations 24 Hours The MPN series ended in a sequence of +3 +3 +0 (ie for two dilutions all three tubes showed growth and then the next higher series had no tubes showing growth) centered at the 10-7 dilution This corresponds to an approximate concentration of 24107 organismsmL 48 hours The MPN series resulted in a sequence of +3 +1 +0 centered at the 108 dilution This corresponds to an approximate concentration of 43107 organismsmL 522 Final Bacterial Concentrations 24 hours 320 MPN series of +3 +1 +0 centered at the 10-8 dilution
bacterial concentration of 43107 organismsmL 600 MPN series of +3 +3 +0 centered at the 10-7 dilution
bacterial concentration of 24107 organismsmL 1200 MPN series of +3 +3 +0 centered at the 10-7 dilution
bacterial concentration of 24107 organismsmL Diamond MPN series of +3 +3 +1 centered at the 10-8 dilution
bacterial concentration of 43107 organismsmL 48 hours 320 MPN series of +3 +2 +0 centered at the 10-8 dilution
bacterial concentration of 93107 organismsmL 600 MPN series of +3 +1 +0 centered at the 10-8 dilution
bacterial concentration of 43107 organismsmL 1200 MPN series of +3 +3 +0 centered at the 10-7 dilution
bacterial concentration of 24107 organismsmL Diamond MPN series of +3 +3 +0 centered at the 10-7 dilution
bacterial concentration of 24107 organismsmL 53 SEM Pictures The qualitative results gleaned from the SEM pictures of each surface all of which are included in Appendix B reinforce the drastic changes shown in the numerical data between pre and post-exposure to A ferrooxidans Before exposure to either media or bacteria each surface shows rather predictable regular patterns for each level of finish As expected the lowest value of surface finish (the 320 grit paper) gives the surface a rather jagged appearance with large canyons carved in parallel by the rather large particles as they removed the surface material Edges of these trenches can be seen to have many irregular portions along their length with almost complete detachment of
30
some of the larger chunks of material As the surface finish become finer the carved trenches become narrower and much more regular until we reach the 6 microm diamond level where hardly any surface features can be seen
The post-experiment SEM micrographs show the drastic contrast between the control surfaces which only experienced the acidic media and those exposed to the bacteria Each surface exposed to the bacteria reveals an extremely uneven surface marked by numerous depressions and craters On some of the more level sections highly ordered angular plates can be seen The higher level surfaces vary from relatively smooth to an almost pin-cushion-like appearance The control surfaces show slight changes in the depths of the aforementioned trenches but the patterns are still very regular and donrsquot seem to change very much from before the experiment It is apparent in some of the control SEM micrographs that grain boundaries are visible The corrosive 9K media apparently preferentially attacks the less organized amorphous regions in between the individual grains of copper so this may explain some of the roughness changes seen in the control samples On some of the higher magnification micrographs for samples incubated with bacteria especially the 600 finish sample incubated for 48 hours small regular rod shapes can be seen on some of the lower level surfaces It his highly unlikely that these actually are individuals of A ferrooxidans but the general shape and size suggest that they may be remnants of where the bacteria once adhered to the surface Corrosion caused by single individuals may have created depressions that show up in these images Actual bacteria would most likely have been vaporized by charge buildup from the electron source of the microscope A picture at 2500X magnification of the 600 finish sample with the possible bacterial remnants is shown below in Figure 23
Figure 23 Possible Bacterial Traces on a Copper Surface
31
54 Material Removal Rate
The copper foil pieces displayed drastic differences in mass after exposure to bacterial solutions of A ferrooxidans indicating a pronounced removal of material The control experiments while displaying some material loss due to the acidic nature of the 9K media have an almost insignificant change in mass when compared to the pieces exposed to the bacteria The results are summarized below in Table 6 The MPN resulted in +3 +1 +0 centered at the 10-8 dilution corresponding to initial bacterial concentrations of 43107 organismsmL for both bacterial tests Table 6 Material Removal Rate Data Foil Label Initial Mass Final Mass Material Removal Rate 24 hr Control 05295 g 05250 g 873810-4 mmhr 24 hr Bacteria 05330 g 03691 g 0032 mmhr 48 hr Control 05250 g 05245 g 485510-5 mmhr 48 hr Bacteria 05259 g 03512 g 0017 mmhr Aside from the large mass differences exhibited by the foil pieces exposed to the bacteria visible physical differences were also observed between them and the control pieces The pieces exposed to bacteria had visible grain boundaries and were much less lustrous than their control counterparts
32
6 Conclusions The most obvious conclusion that can be made using the experimental results is that the ldquomachiningrdquo effect on copper produced by Acidithiobacillus ferrooxidans is very detrimental to surface finish This largely uneven corrosion seems to be produced regardless of initial finish at least past the rather rough 320 grit size In this current setup bacterial machining is impractical for fine control of nano-scale material removal That being said the process could still have potential if some possible refinements are added The rather uneven nature of the corrosion effect could be partially caused by the deposition of the solid waste products of the copper corrosion on the sample surface This material could effect how well the bacteria adhere to the copper surface thus shielding a covered area from bacterial corrosion One fairly simple remedy for this is to conduct the experiment in a non-quiescent fluid environment If a properly controlled flow of media is constantly forced over the sample it may carry away the waste material thus leaving unaffected material exposed for bacterial adhesion The optimal flow rate would promote waste removal while not preventing the bacteriarsquos access to the surface and this would have to be determined through further empirical testing A slightly more complex modification of this process would involve the use of single-crystal copper The irregular pattern of crystal grains and the disorganized nature of the grain boundaries may contribute to the lack of evenness in the corrosion Single grain copper crystals could potentially eliminate effects of etching at the grain boundaries by the 9K media thus exposing a relatively smooth surface to the bacteria If this is combined with forced fluid flow over the sample much more uniformity in material removal could potentially be achieved The material removal rate tests were very simple in nature but they still suggest possible trends in the removal behavior exhibited by the bacteria The noticeably lower material removal rate for the 48 hour time period suggests that not only is the removal rate not uniform but it slows down with time The otherwise identical 24 hour test suggests an initially high MRR which may slow down due to waste buildup in the liquid media or lack of oxygen The first suggested cause seems more likely especially since the media used in the test exhibited a much deeper orange color as did the precipitate than the typical liquid media exhibiting growth The color suggests a buildup of copper compounds most likely CuS as suggested in the reaction diagrams in 23 One possible way to make the material removal rate more uniform with time is to constantly supply fresh aerated media to and flush waste compounds from the whole working fluid environment Future work could thus initially include a combination of the three modifications suggested above A single crystal of copper would be able to present the most even surface possible to the bacteria as no grain boundaries would exist to be corroded by the media If fresh media were constantly supplied and forced over the surface of the workpiece at a controlled flow rate waste compounds could be removed as they are generated and the copper surface could remain evenly exposed for bacterial machining After these initial modifications other process and environment parameters can be varied to further refine and find the limits of biomachining
33
References [1] Williams K and Gupta K and Wasilik M (2003) ldquoEtch Rates for
Micromachining Processing-Part IIrdquo Journal of Microelectromechanical Systems Vol 12 No 6 pp 761-778
[2] Uno Y Kaneeda T and Yokomizo S (1993) ldquoFundamental study on biomachining (machining of metals by Thiobacillus ferrooxidans)rdquo Transactions of the Japan Society of Mechanical Engineers Part C Vol 59 pp 3199-3204
[3] Kumada M Kawakado T Kobuchi S Uno Y Maeda S and Miyuki H (2001) ldquoInvestigations of fine biomachining of metals by using microbially influenced corrosion - Differences between steel and copper in metal biomachining by using Thiobacillus Ferrooxidansrdquo Zairyo to Kankyo Corrosion Engineering Vol 50 pp 411-417
[4] Kurosaki Y Matsui M Nakamura Y Murai K and Kimura T (2003) ldquoMaterial processing using microorganisms (An investigation of microbial action on metals)rdquo JSME International Journal Series C Mechanical Systems Machine Elements and Manufacturing Vol 46 pp 322-330
[5] Uno Y Kaneeda T and Yokomizo S (1996a) ldquoFundamental study on biomachining (machining of metals by Thiobacillus ferrooxidans)rdquo JSME International Journal Series C Vol 39 pp 837-842
[6] Uno Y Kaneeda T Yokomizo S and Yoshimura T (1996b) ldquoFundamental study on electric field assisted biomachiningrdquo Journal of the Japan Society for Precision Engineering Vol 62 pp 540-543
[7] Zhang D and Li Y (1996) ldquoPossibility of biological micromachining used for metal removalrdquo Science in China Series C Life Sciences Vol 41 pp 151-156
[8] Zhang D and Li Y (1998) ldquoStudies on kinetics and thermodynamics of biomachining pure copperrdquo Science in China Series C Life Sciences Vol 42 pp 57-62
[9] Gomez C Blazquez M and Ballester A (1999) ldquoBioleaching of a Spanish complex sulphide ore bulk concentraterdquo Minerals Engineering Vol 12 pp 93-106
[10] Konishi Y Kubo H and Asai S (1992) ldquoBioleaching of zinc sulfide concentrate by Thiobacillus ferrooxidansrdquo Biotechnology and Bioengineering Vol 39 pp66-74
[11] Olson G (1991) ldquoRate of pyrite bioleaching by Thiobacillus ferrooxidans Results of an interlaboratory comparisonrdquo Applied Environmental Microbiology Vol 57 (3) pp 642ndash644
[12] Bond D Holmes D Tender L and Lovley D (2002) ldquoElectrode-reducing microorganisms that harvest energy from marine sedimentsrdquo Science 295483-5
[13] Lovley D R Phillips E J P Gorby Y A Landa E R (1991) ldquoMicrobial reduction of uraniumrdquo Nature Vol 350 pp 413-416
[14] Lovley D R (2003) ldquoCleaning up with genomics applying molecular biology to bioremediationrdquo Nature Reviews Vol 1 pp 35-44
34
[15] Viamajala S Peyton B and Petersen J (2003) ldquoModeling chromate reduction in Shewanella oneidensis MR-1 development of a novel dual-enzyme kinetic modelrdquo Biotechnology and Bioengineering Vol 83 No 7 pp 790-797
[16] Dinh H Kuever J Mussmann M Hassel A Stratmann M and Widdel F (2004) ldquoIron corrosion by novel anaerobic microorganismsrdquo Nature Vol 427(6977) pp 829-832
[17] Chaudhuri S and Lovley D (2003) ldquoElectricity generation by direct oxidation of glucose in mediatorless microbial fuel cellsrdquo Nature Biotechnology Vol 21 No 10 pp 1229-1232
[18] Levett Paul N Anaerobic Bacteria A Functional Biology Open University Press Philadelphia 1990
[19] Wilkinson J F Introduction to Microbiology John Wiley and Sons New York 1975
[20] MVTechnologies Inc (MVTI) [21] Walsh E OrsquoF An Introduction to Biochemistry English Universities Press
London 1961 [22] Zehnder A J B Biology of Anaerobic Microorganisms John Wiley and Sons
New York 1988 [23] httpwwwvkmrucatalogpdfmediapdf [24] Johnson Macvicar and Rolfe ldquoA New Solid Medium for the Isolation and
Enumeration of Thiobacillus Ferrooxidans and Acidophilic Heterotrophic Bacteriardquo The Journal of Microbiological Methods Vol 7 Number 1 1987 pp 9-18
[25] Southam G and Beveridge T J ldquoEnumeration of Thiobacilli within pH-Neutral and Acidic Mine Tailings and Their Role in the Development of Secondary Mineral Soilrdquo Applied and Environmental Microbiology Vol 58 Number 6 June 1992 pp 1904-1912
[26] httpwwwjlindquistnetgeneralmicro102dil3html [27] httpwwwsuppliersonlinecompropertypagesC11000asp
35
Appendix A Experimental Roughness Values A1 Pre-Experiment
Label Ra Values (microm)
Average (microm)
320 24hr control 06168 05536 05284 05091 04927 05757 05987 320 24hr bacteria 03703 04132 03811 03513 03633 05117 05014 320 48hr control 04765 04834 05057 05501 04471 04231 04979 320 48hr bacteria 06029 05958 05349 05426 07305 06431 05206 600 24hr control 0301 03215 03016 02771 03918 02947 03628 600 24hr bacteria 03074 03319 0317 0363 03431 03239 03368 600 48hr control 02778 02967 02859
36
02534 03205 03024 03399 600 48hr bacteria 03735 03596 03866 03364 03568 03388 03657 1200 24hr control 01555 01842 01719 01693 02184 01963 01939 1200 24hr bacteria 01979 01644 01654 01797 01432 0145 01549 1200 48hr control 02055 02212 02008 02166 02377 02449 02217 1200 48hr bacteria 02699 02306 02583 02232 02181 02195 01946 Diam 24hr control 00633 00690 00783 00745 00566 00744 00666 Diam 24hr bacteria 00304 00346 00382 00369
37
00295 00399 00328 Diam 48hr control 00504 00487 00519 00476 00477 00506 00437 Diam 48hr bacteria 004 00502 00383 00368 00548 0046 00853 A2 Post-Experiment
Label Ra Values (microm)
Average (microm)
320 24hr control 05093 04806 04717 04466 05079 04779 04704 320 24hr bacteria 40345 30396 41263 22224 11939 34905 31699 320 48hr control 04159 04162 04018 03825 04539 04349 04082 320 48hr bacteria 26231 30146 29079 36229 29167 30213 29954 600 24hr control 02934 02847 02661
38
03096 02788 02757 02846 600 24hr bacteria 2816 22547 21324 21519 21726 21195 21358 600 48hr control 04503 04087 03814 03961 0394 04267 04037 600 48hr bacteria 20805 22723 18524 24643 18637 24745 28985 1200 24hr control 02211 02039 02032 02108 02235 01855 01792 1200 24hr bacteria 25051 20462 23025 19845 15742 17522 21588 1200 48hr control 03195 02935 02736 02983 03315 02681 027 1200 48hr bacteria 23707 21281 20559 19257
39
23222 20152 2079 Diam 24hr control 01773 01588 01811 01661 01425 01438 0142 Diam 24hr bacteria 19187 20563 20323 22641 23499 19352 18374 Diam 48hr control 04644 04828 05018 04834 04961 05621 03888 Diam 48hr bacteria 20618 17603 12904 13919 17156 18022 22998
40
Appendix B SEM Micrographs B1 Pre-Experiment SEM Micrographs
Typical 320 Finish (images from 24 Hour Control)
Typical 600 Finish (images from 24 Hour Control)
Typical 1200 Finish (images from 48 Hour Control)
41
Typical Diamond Finish (images from 48 Hour Control)
B2 Post-Experiment SEM Micrographs
320 Finish 24 Hour With Bacteria
320 Finish 24 Hour Control
42
320 Finish 48 Hour With Bacteria
320 Finish 48 Hour Control
600 Finish 24 Hour With Bacteria
43
600 Finish 24 Hour Control
600 Finish 48 Hour With Bacteria
600 Finish 48 Hour Control
44
1200 Finish 24 Hour With Bacteria
1200 Finish 24 Hour Control
1200 Finish 48 Hour With Bacteria
45
1200 48 Hour Control
6microm Diamond Finish 24 Hour With Bacteria
6microm Diamond Finish 24 Hour Control
46
6microm Diamond Finish 48 Hour With Bacteria
6microm Diamond Finish 48 Hour Control
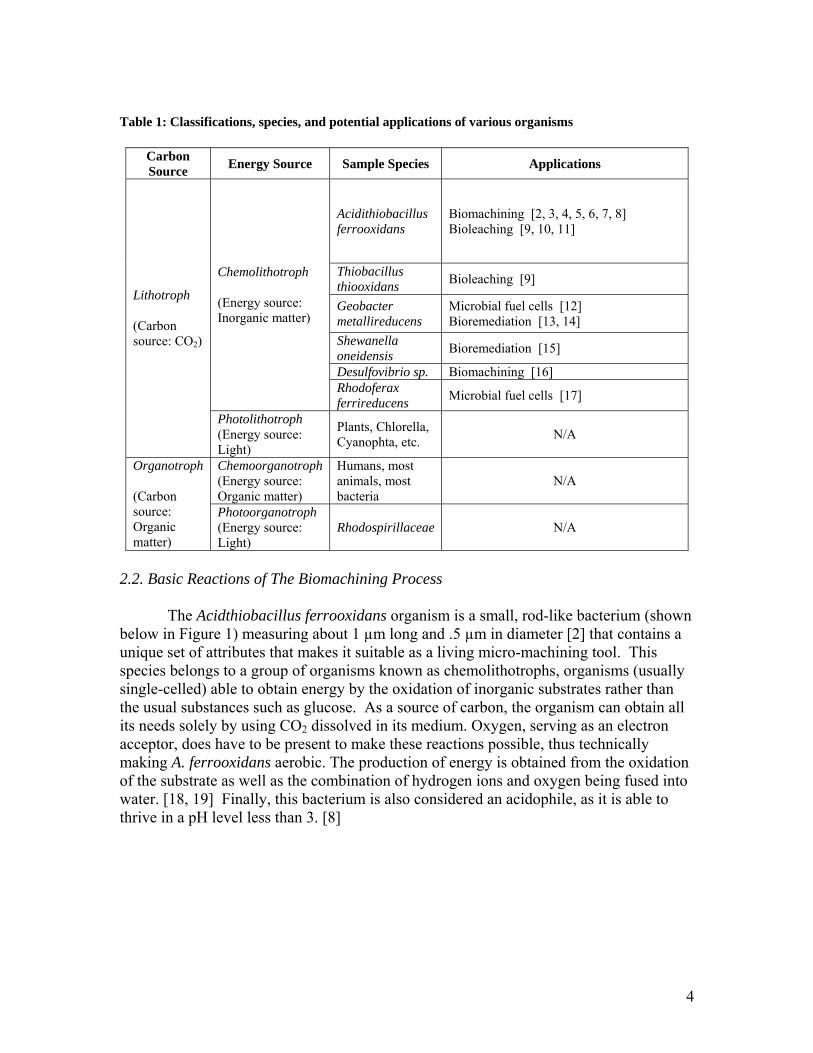
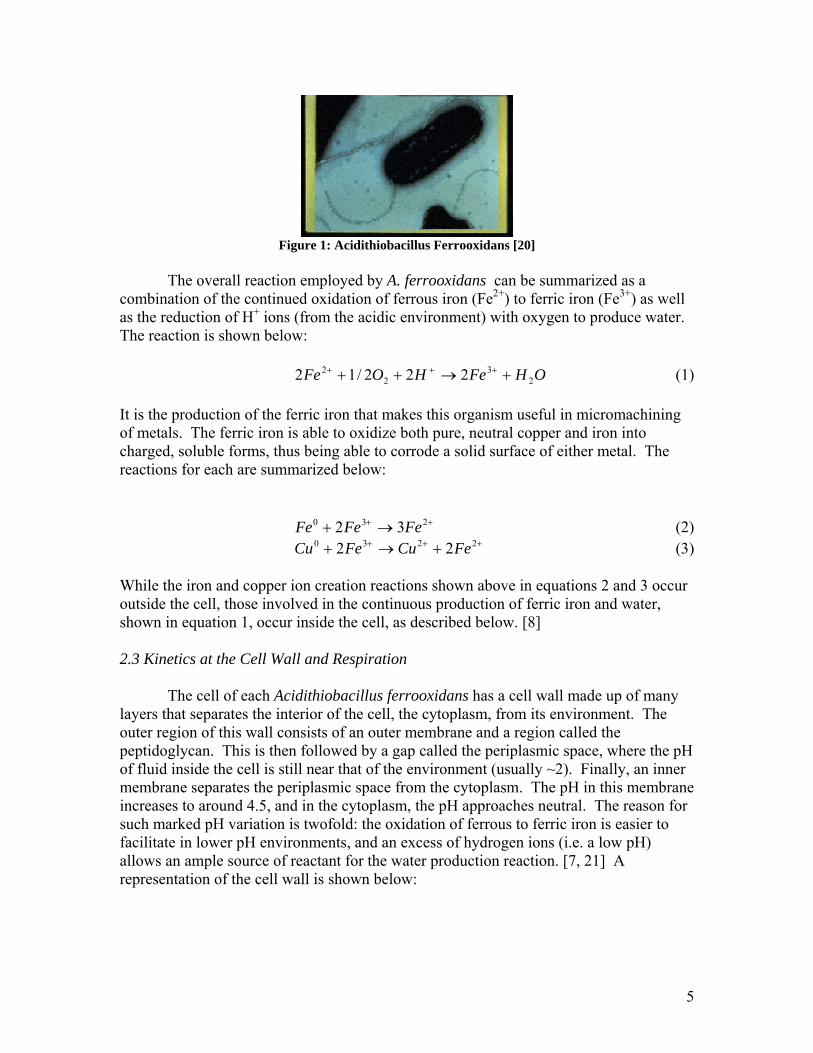
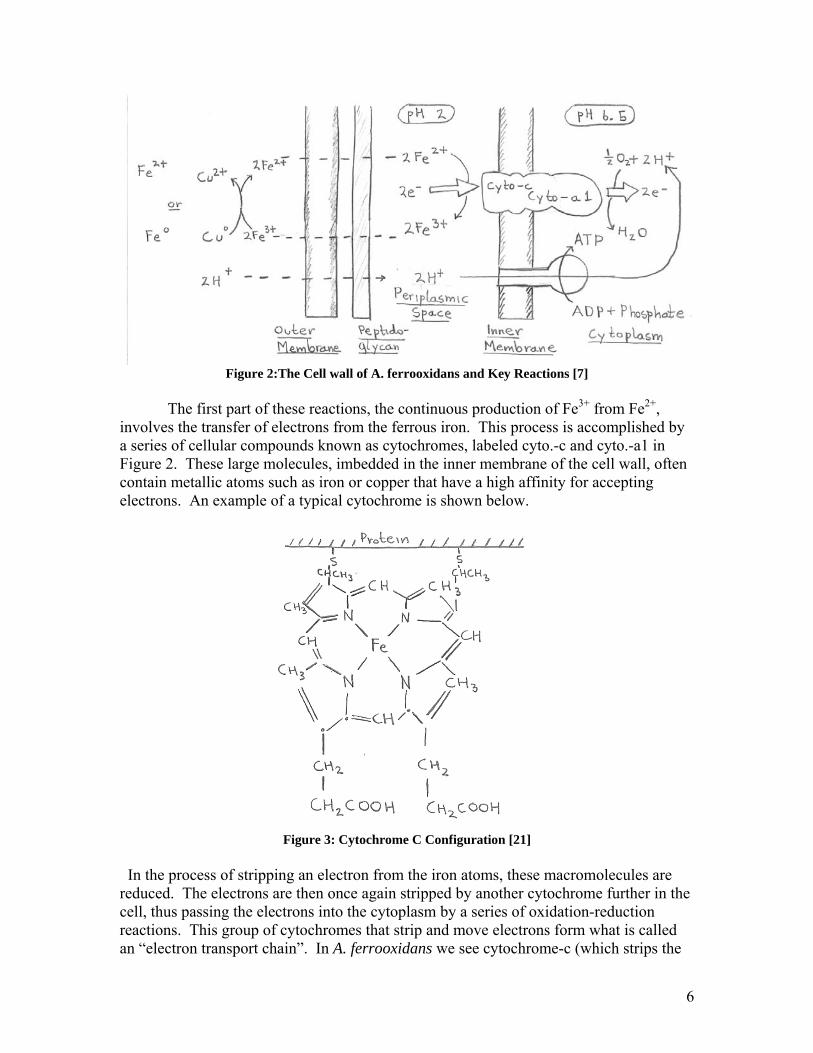
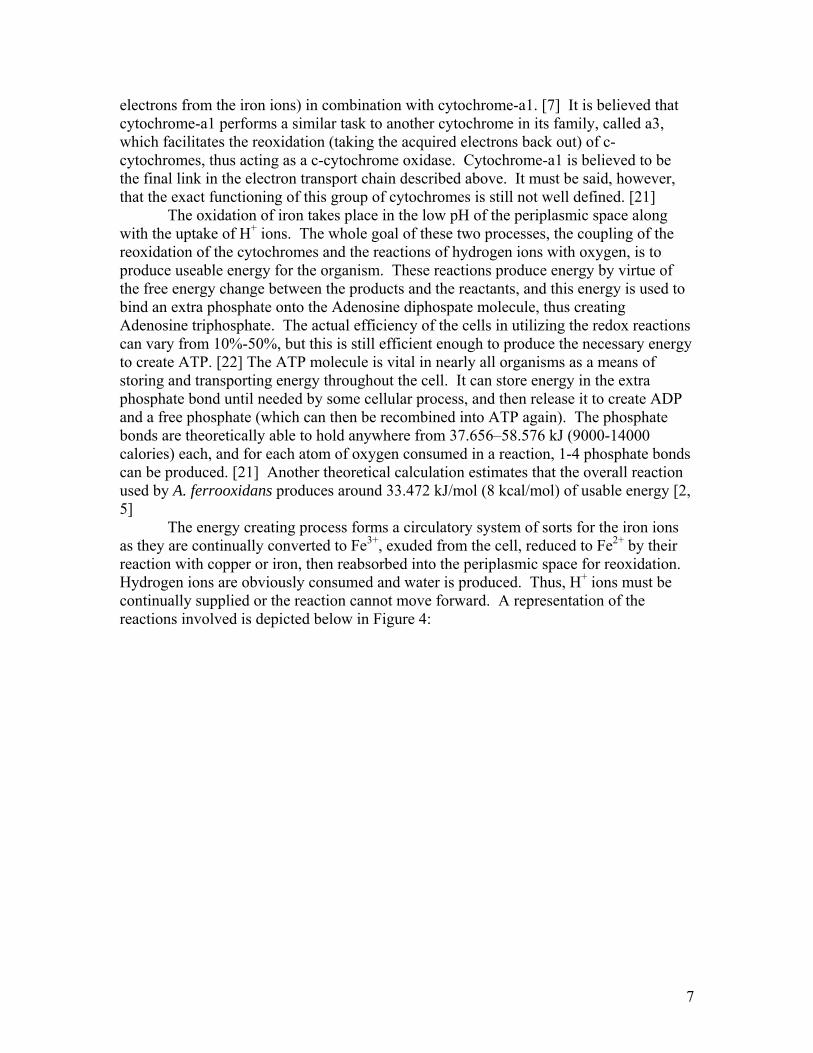
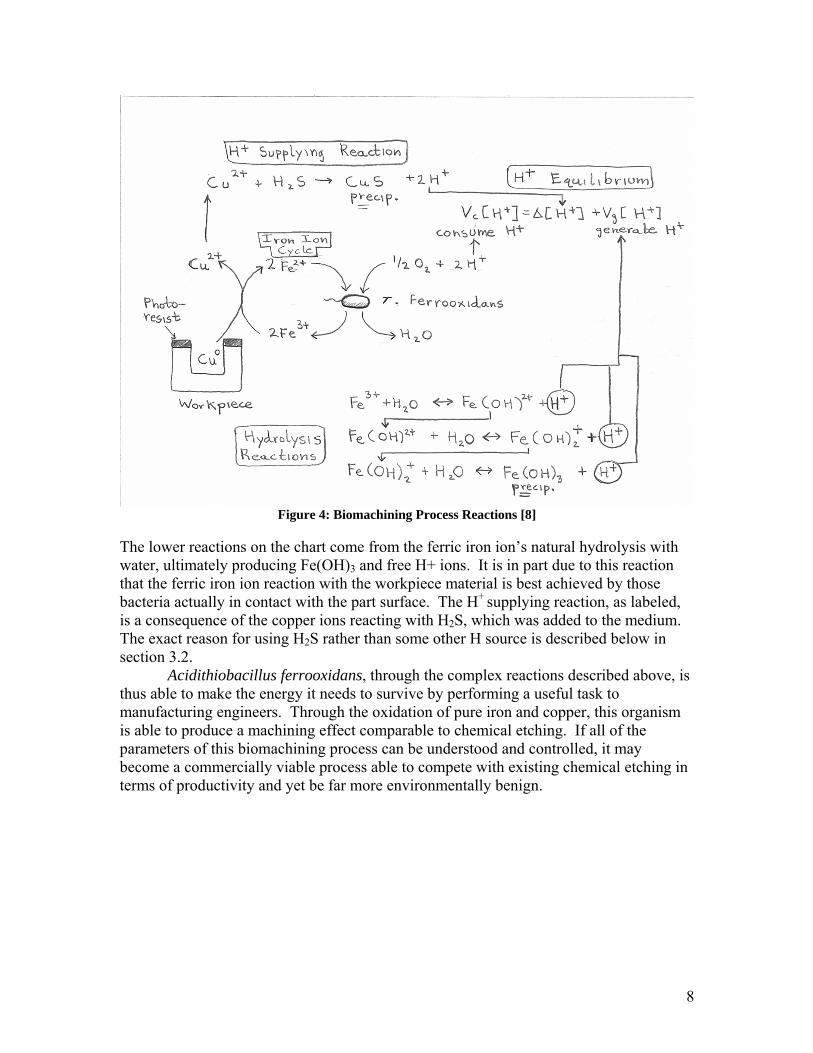
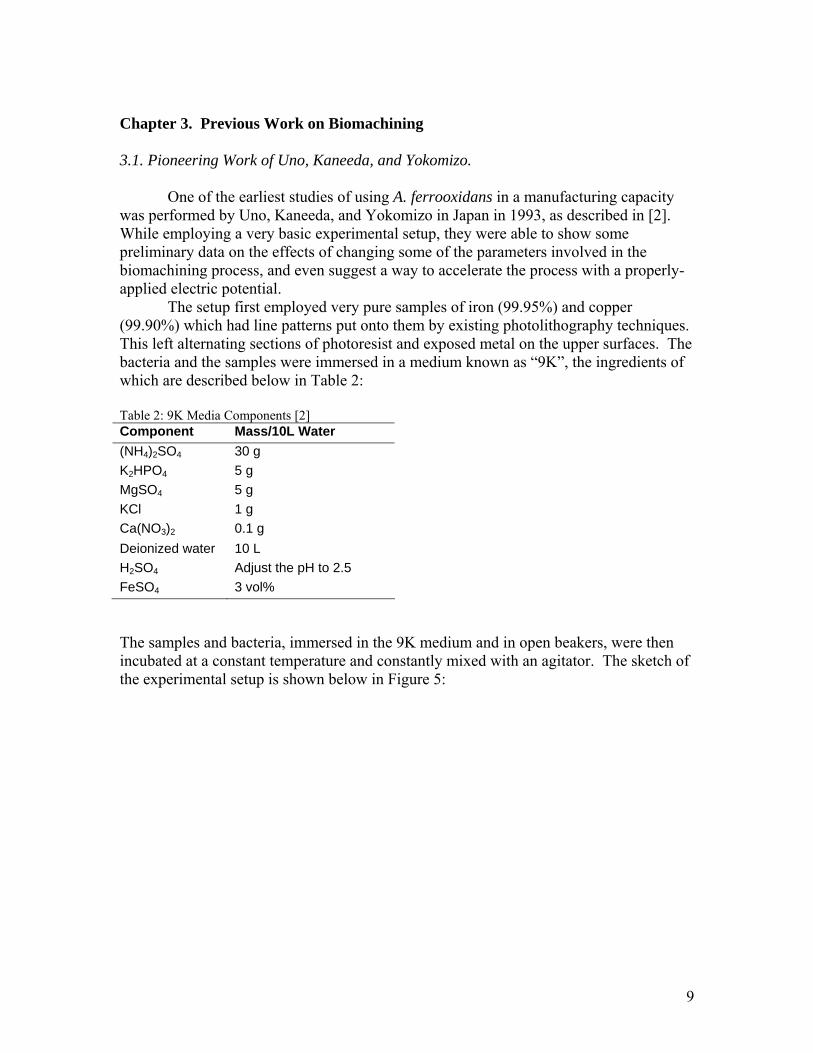
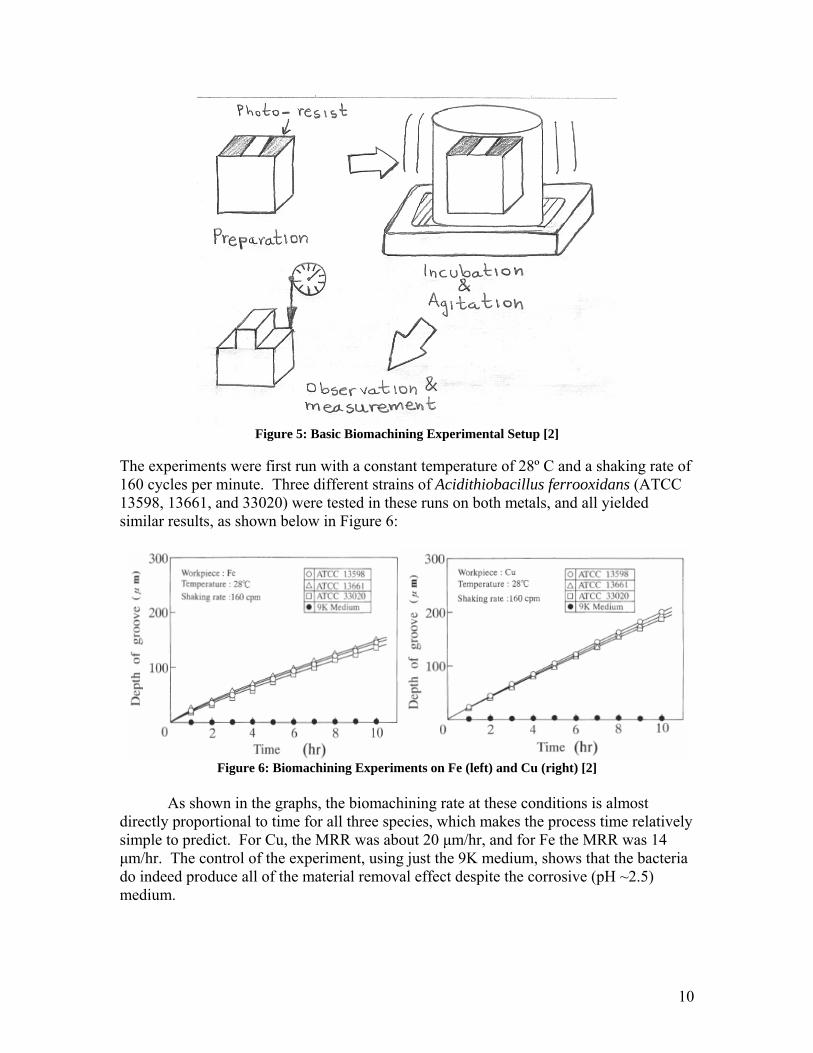
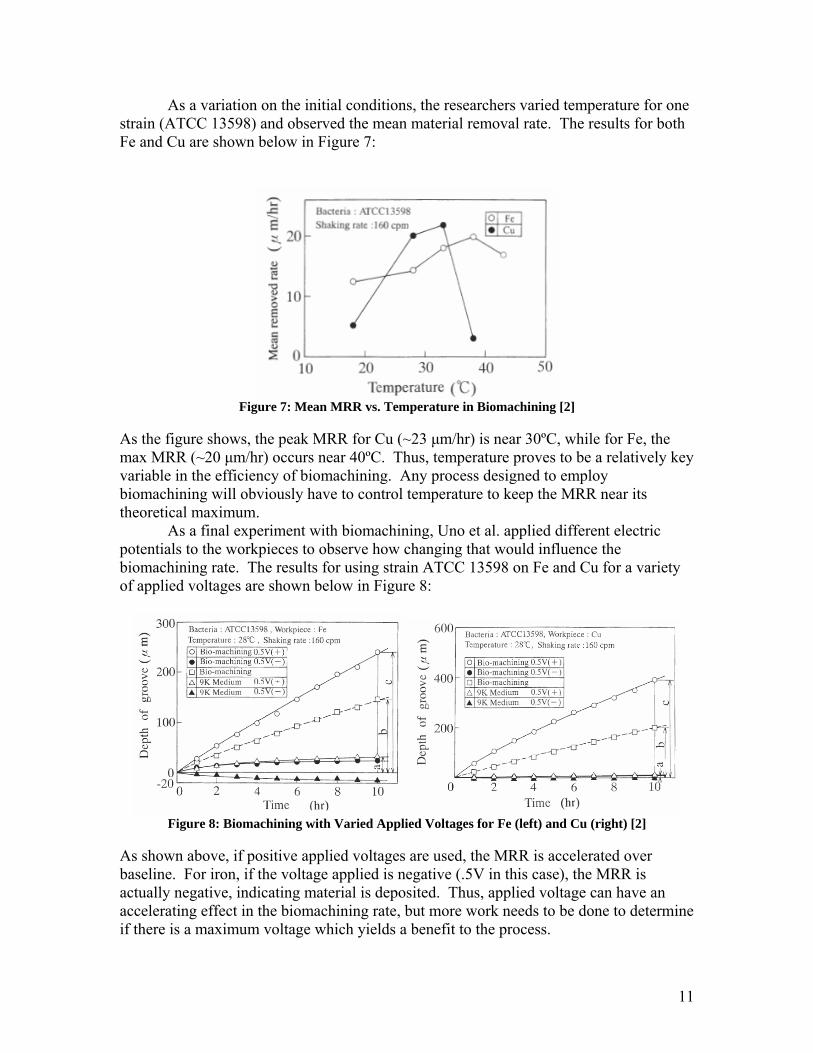
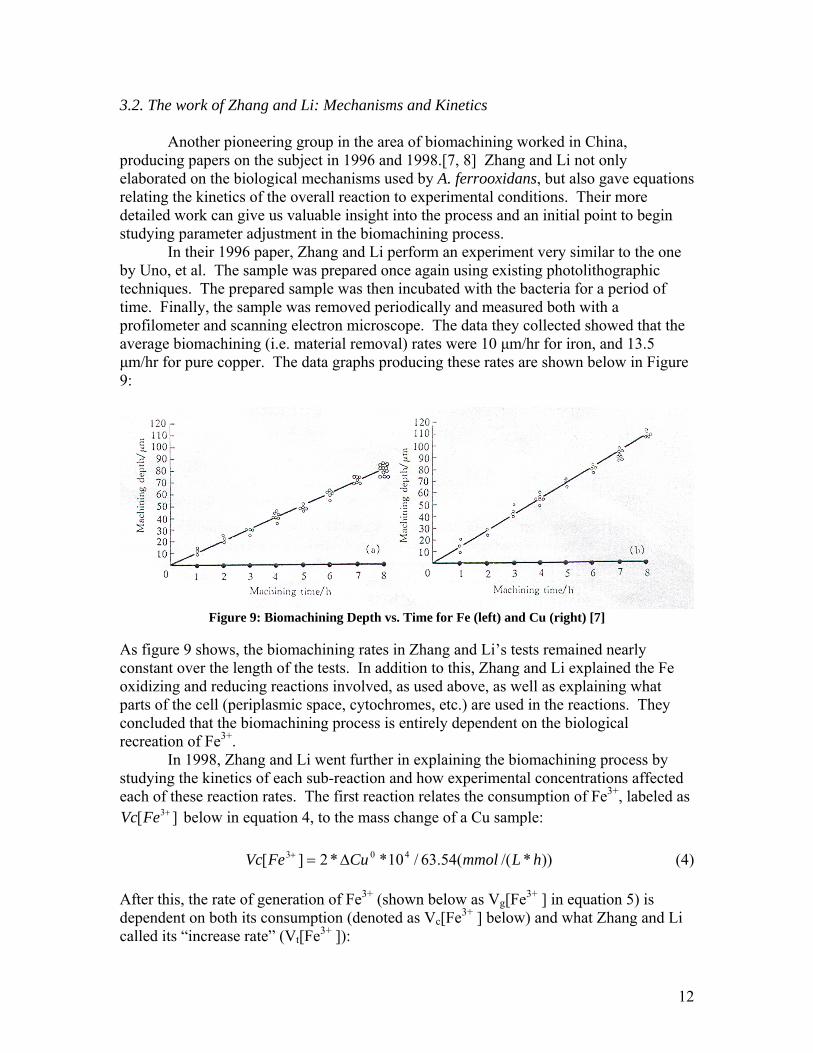
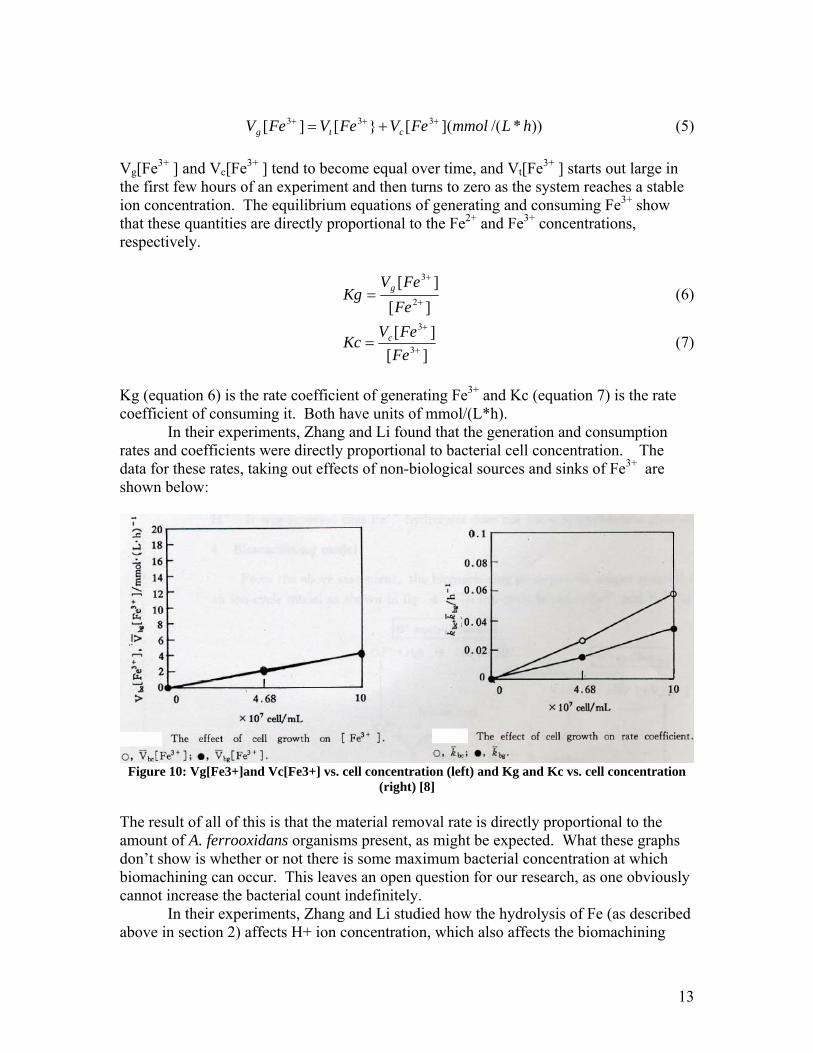
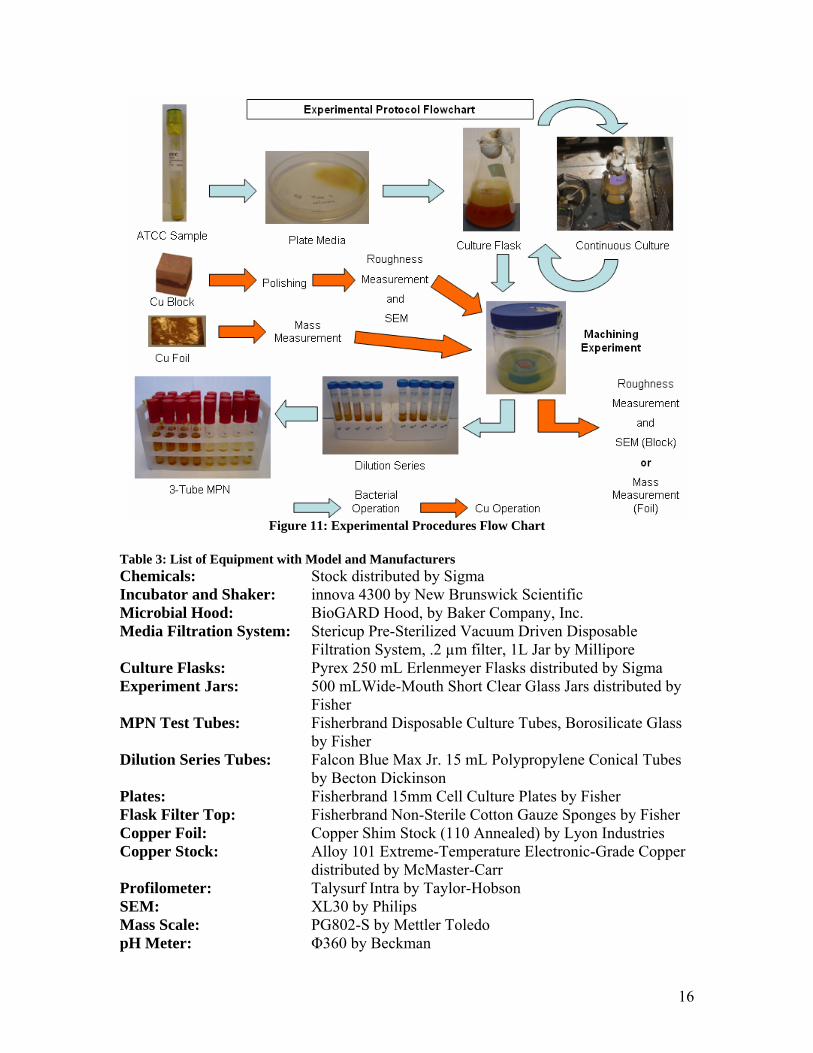
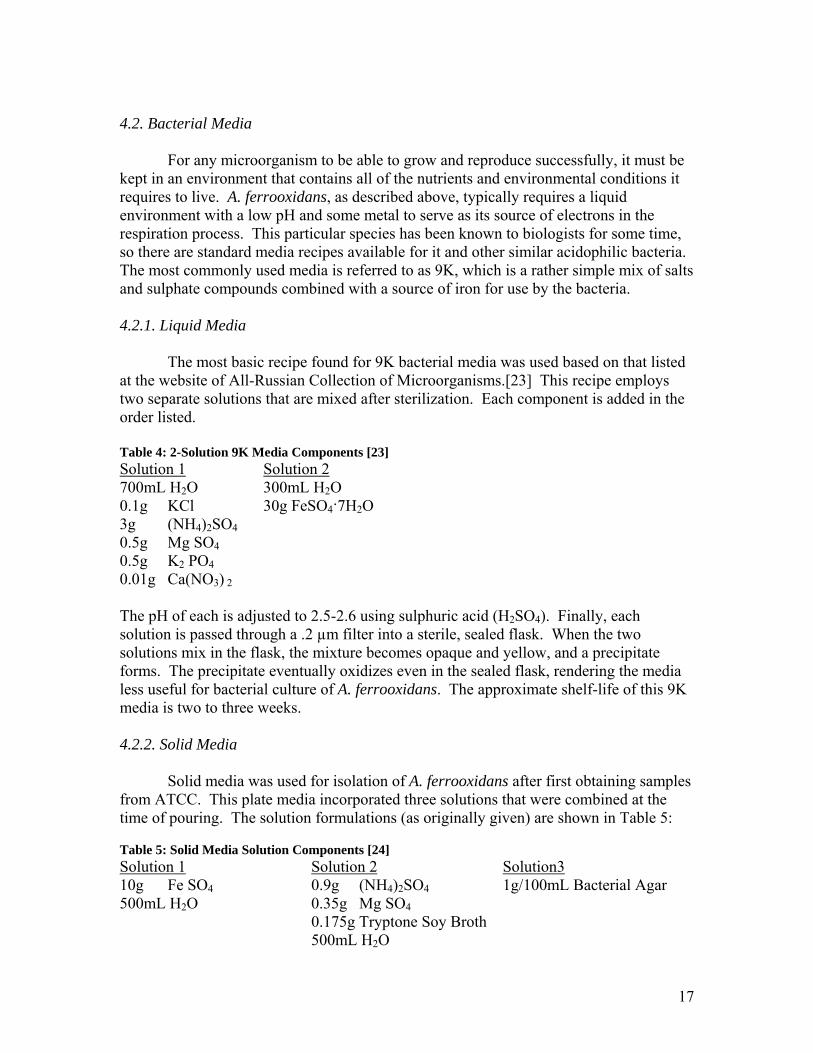
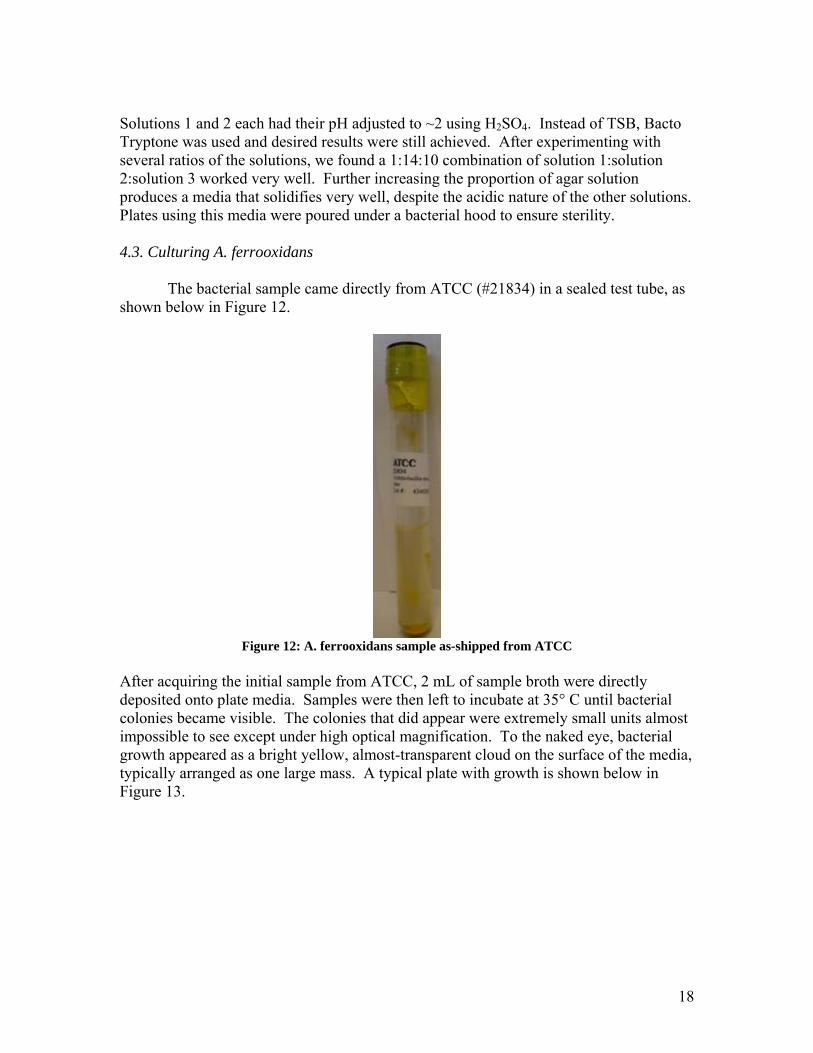
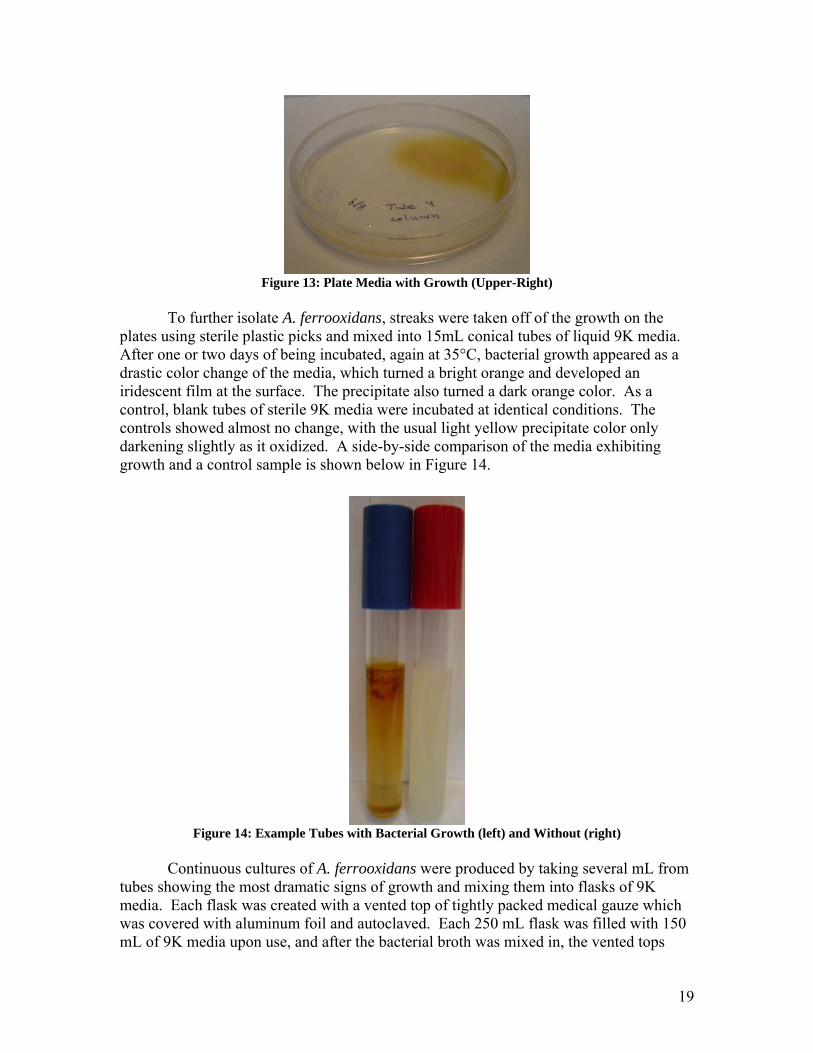
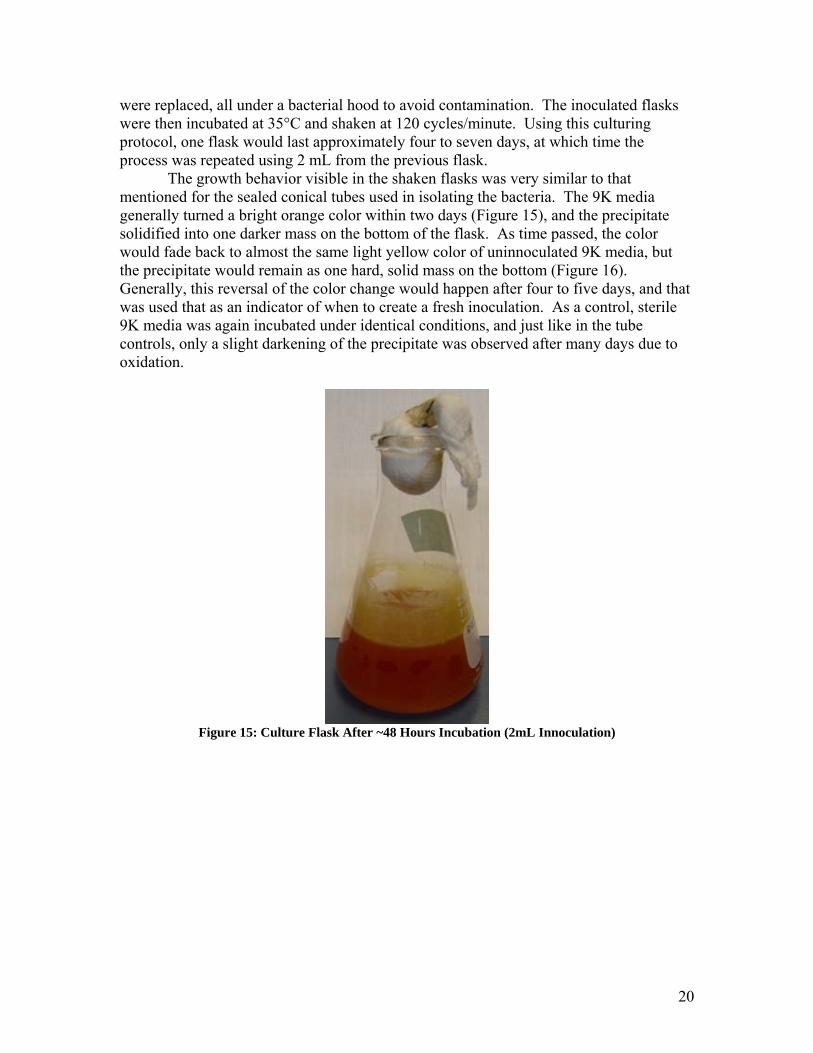
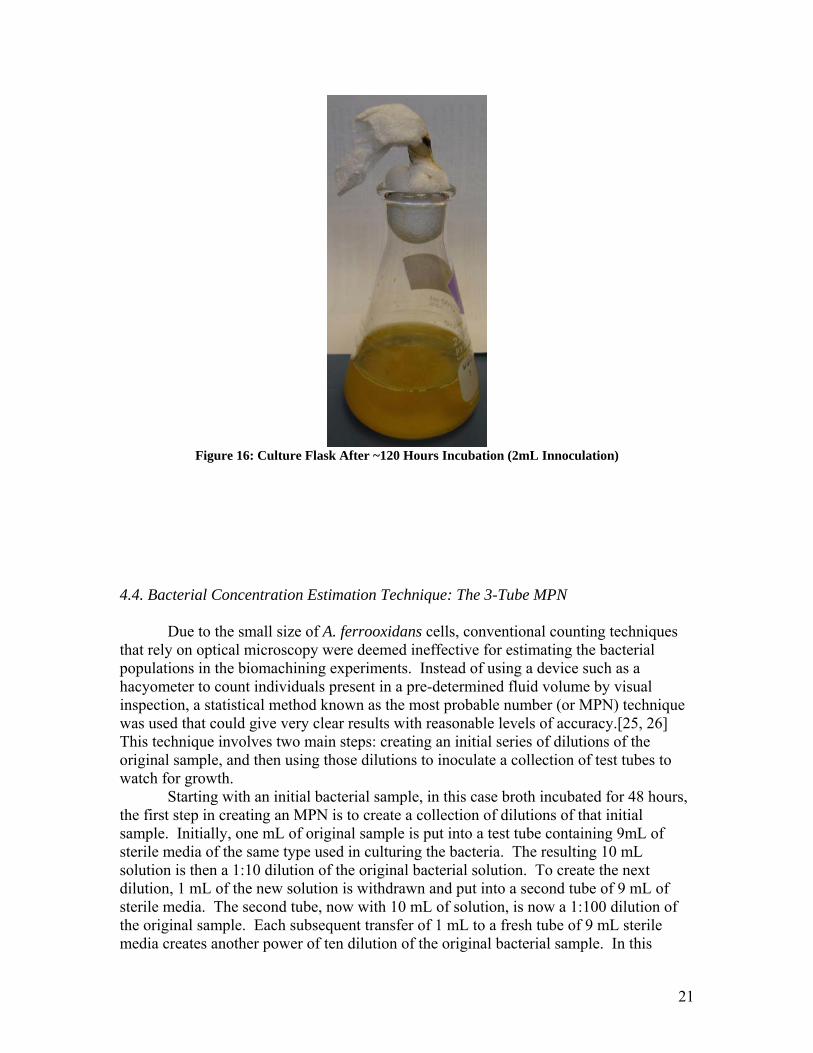
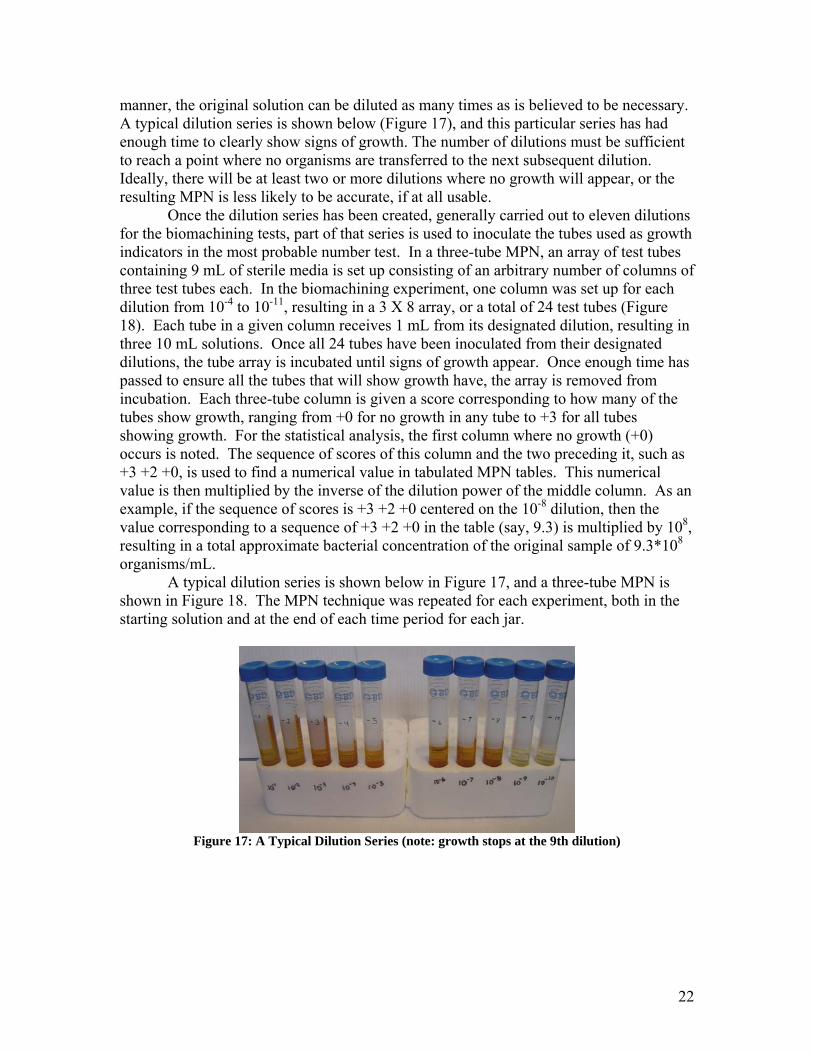
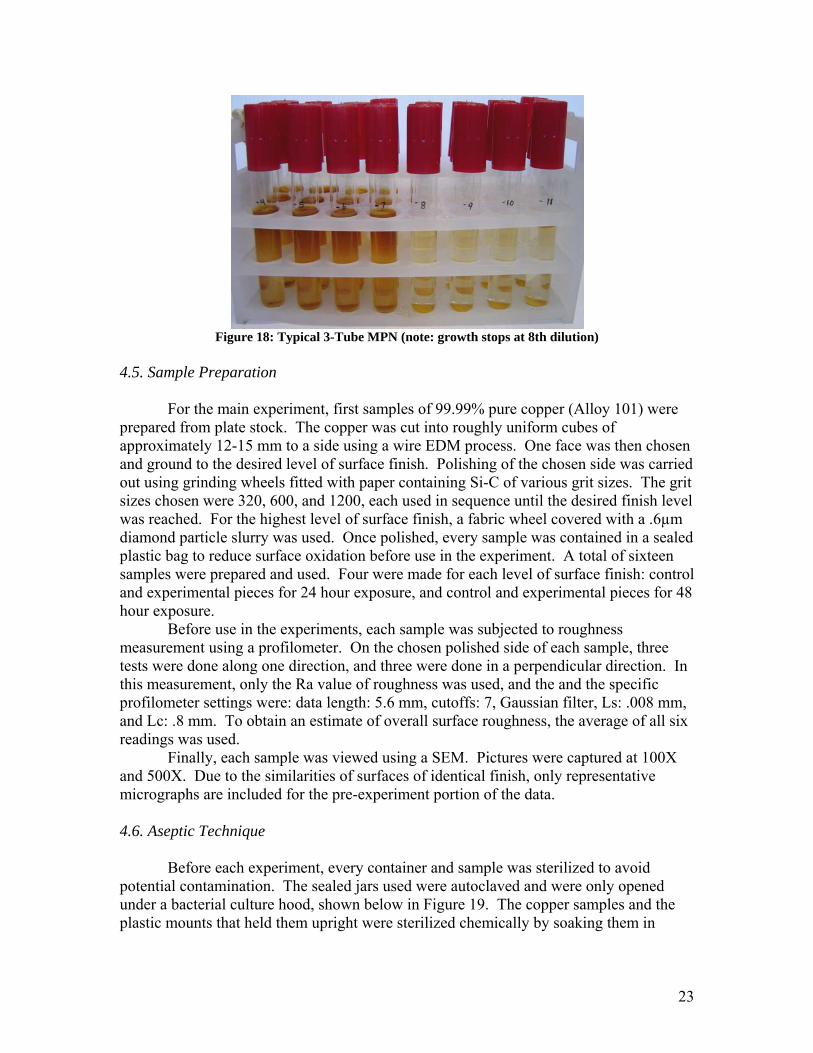
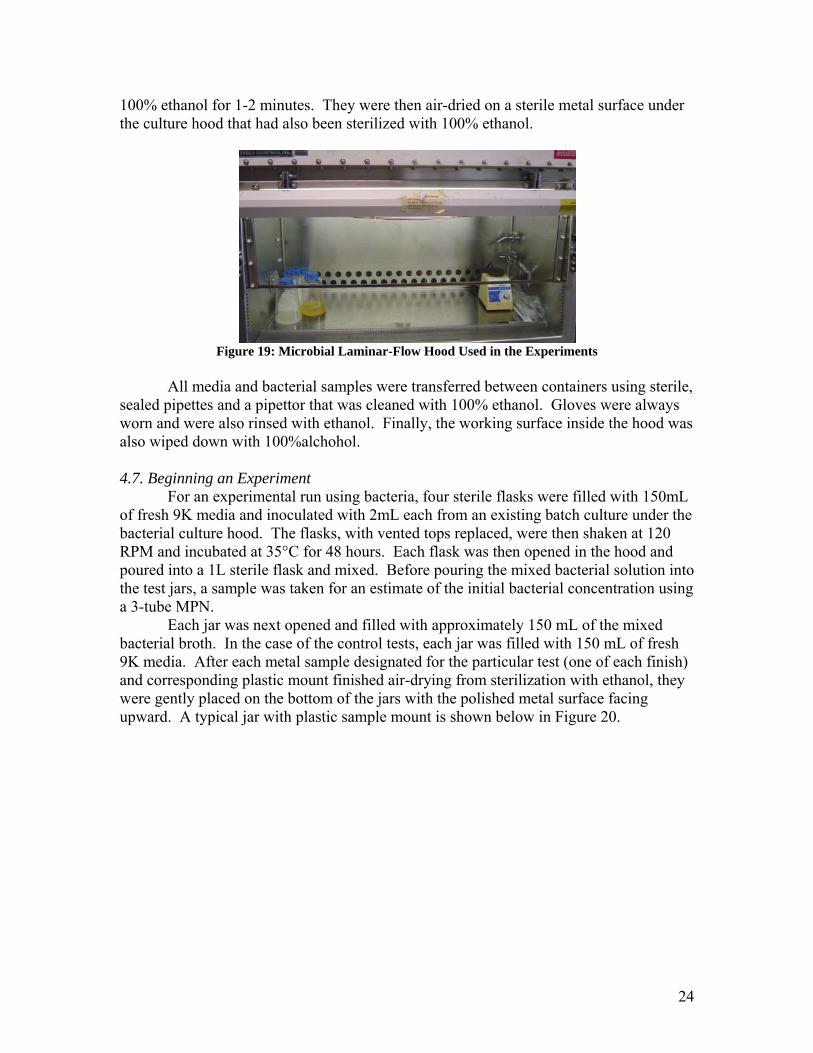
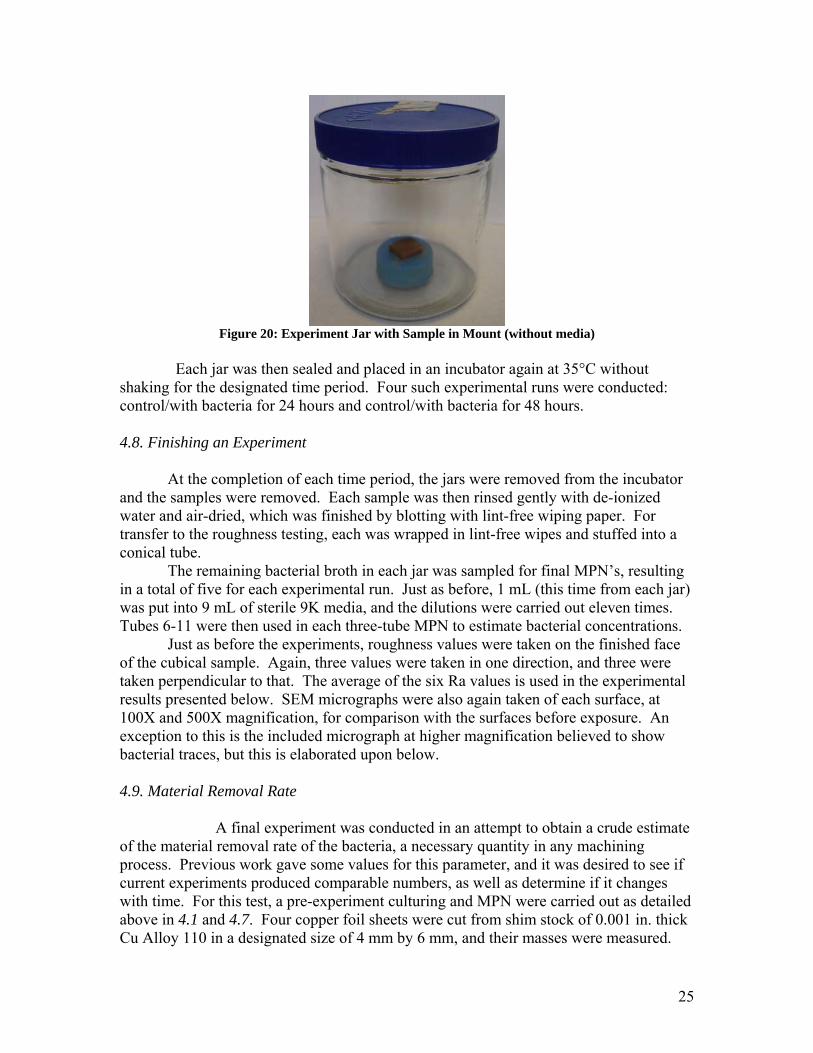
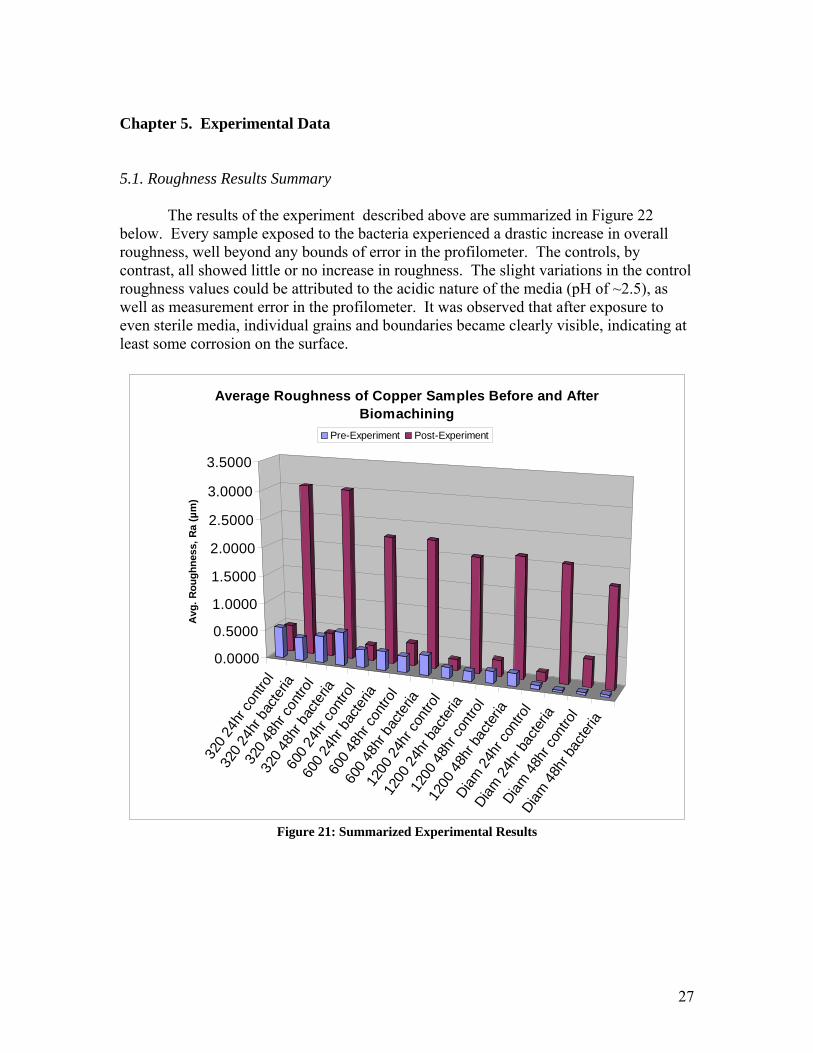
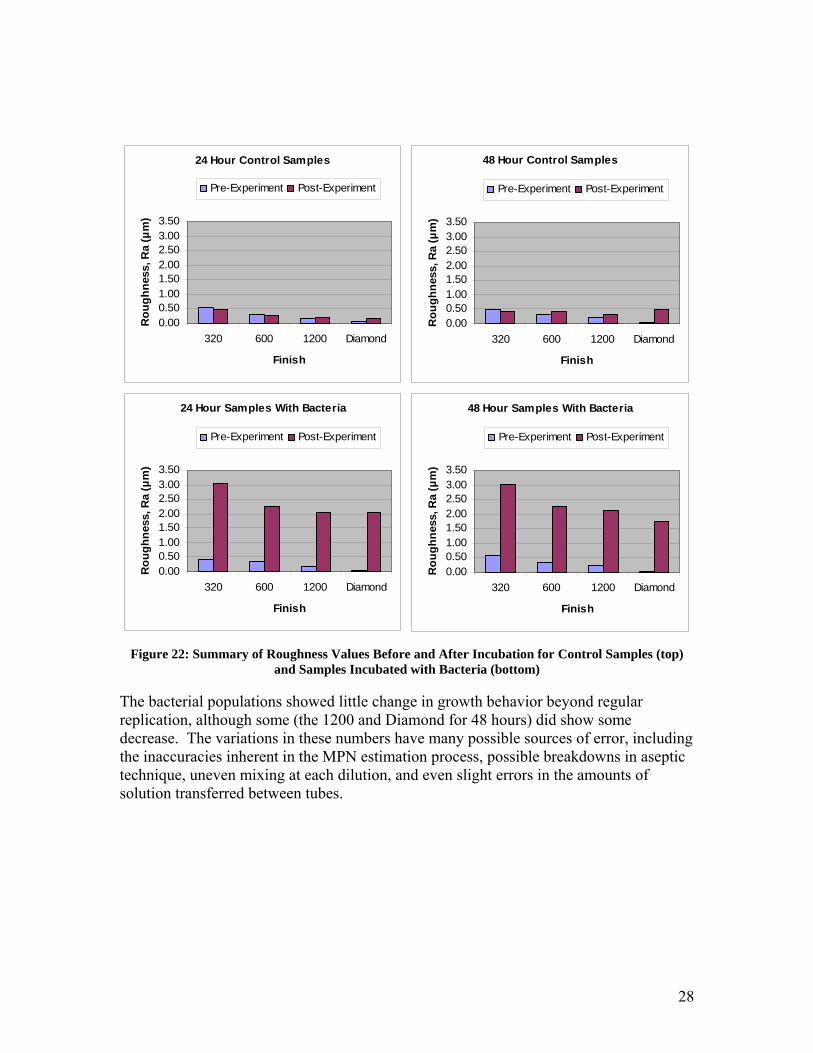
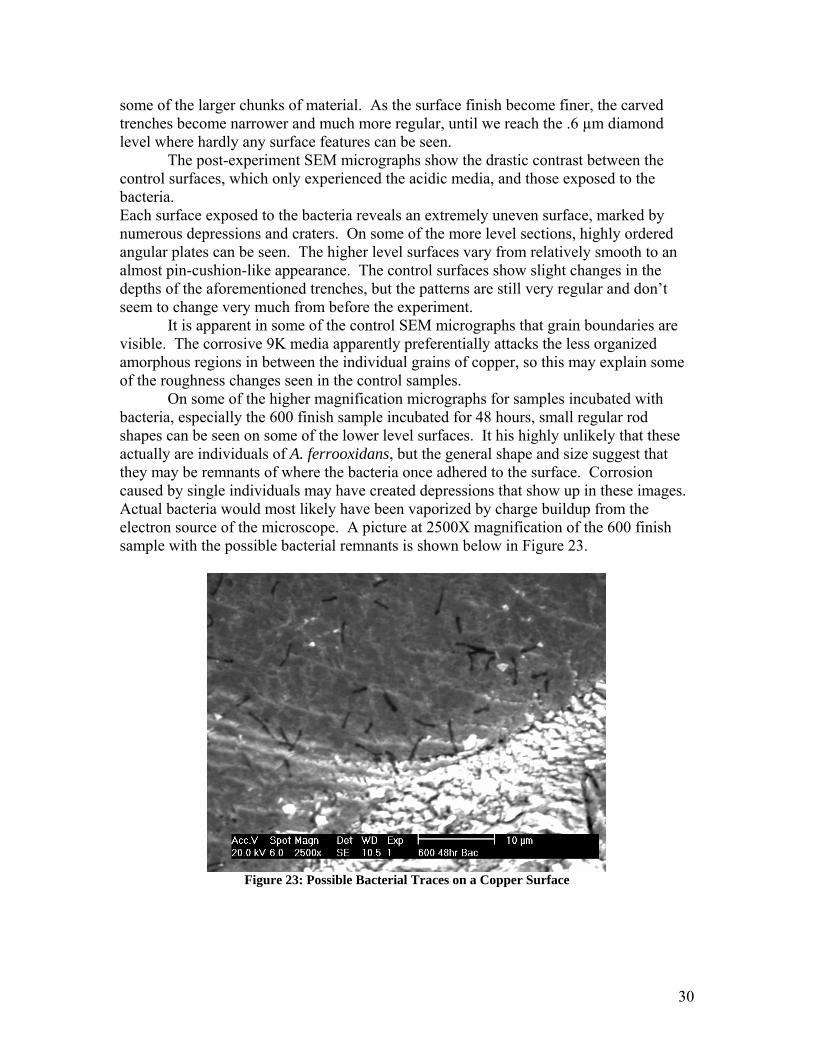
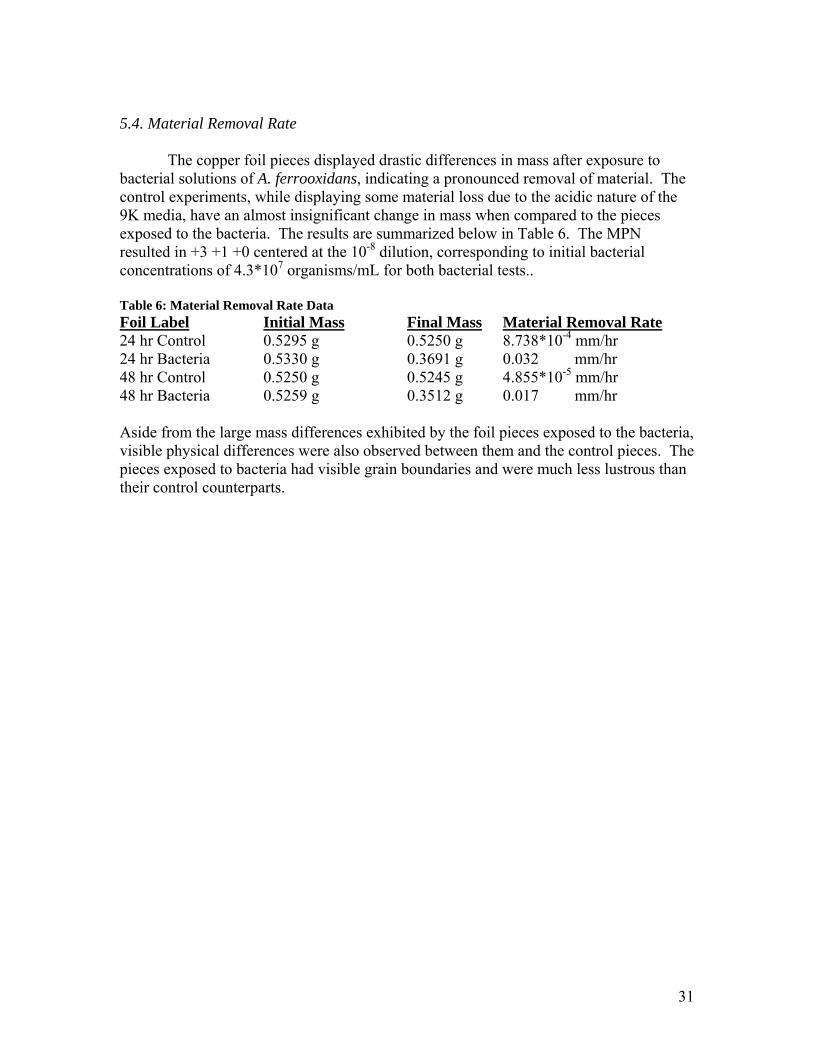
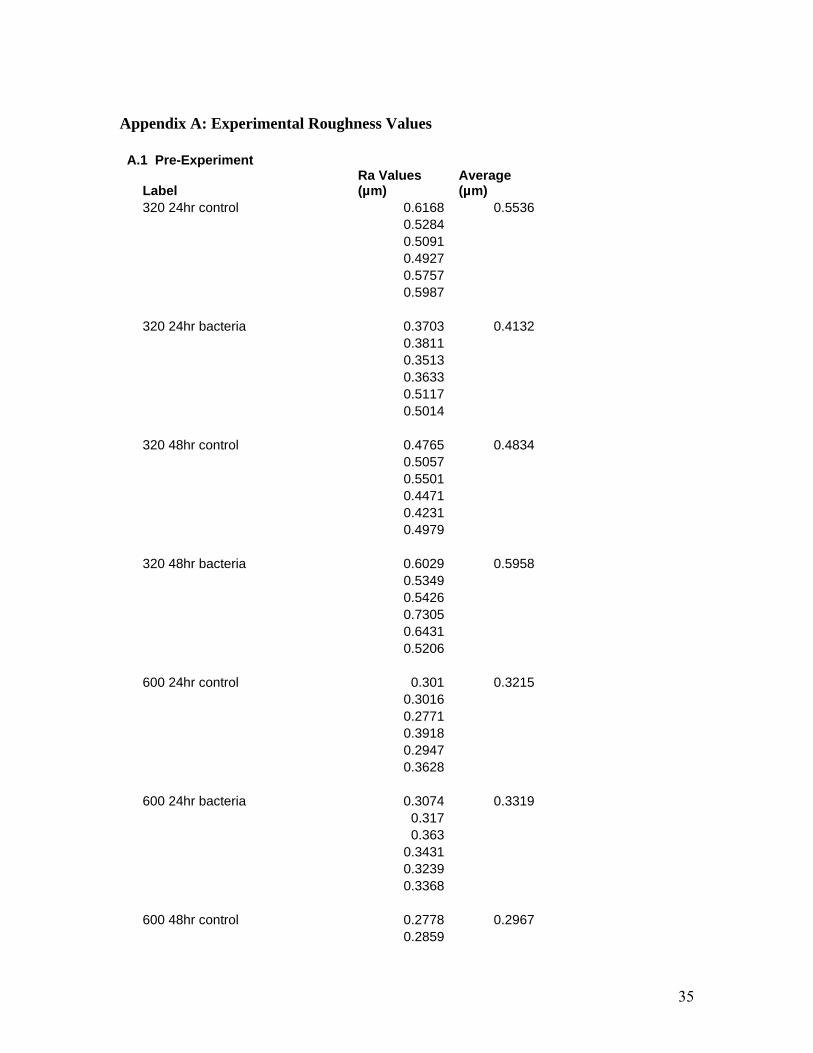
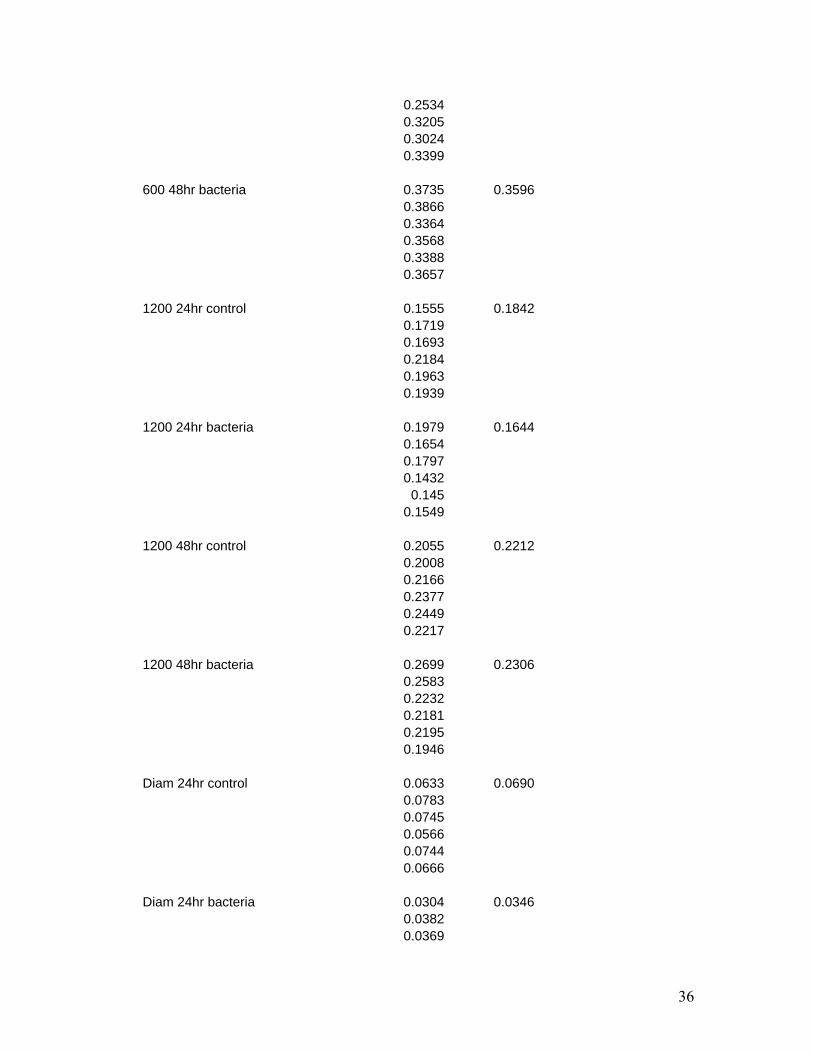
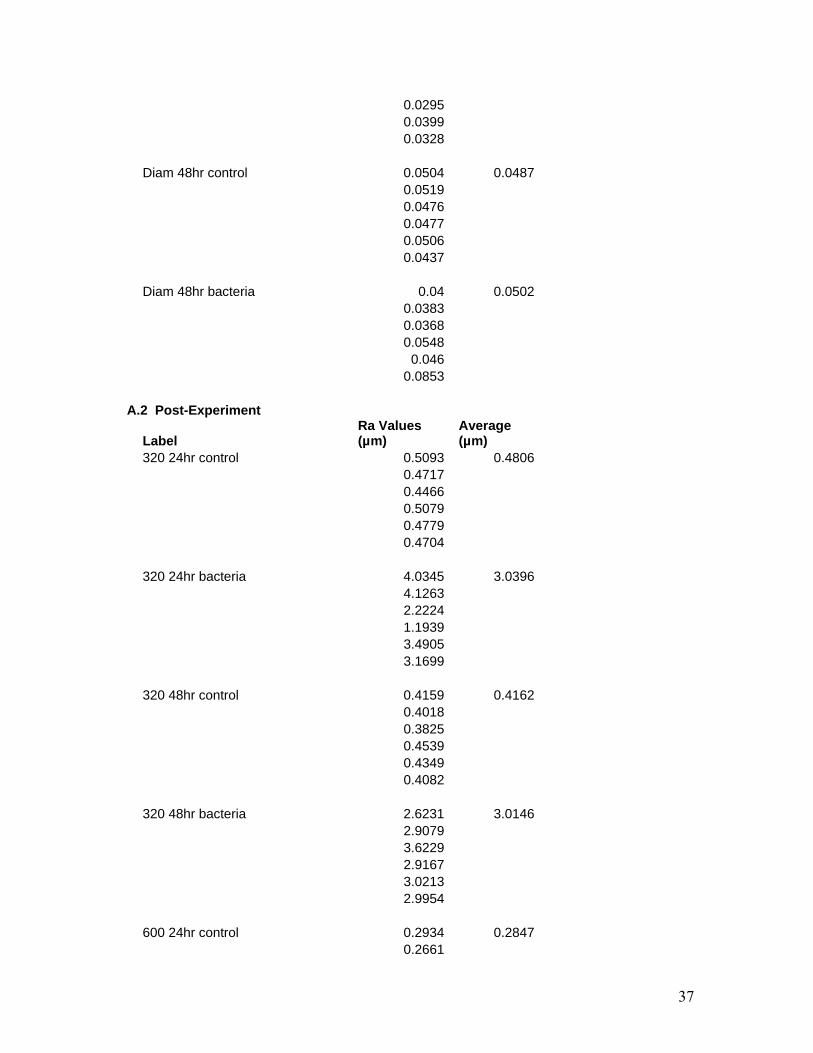
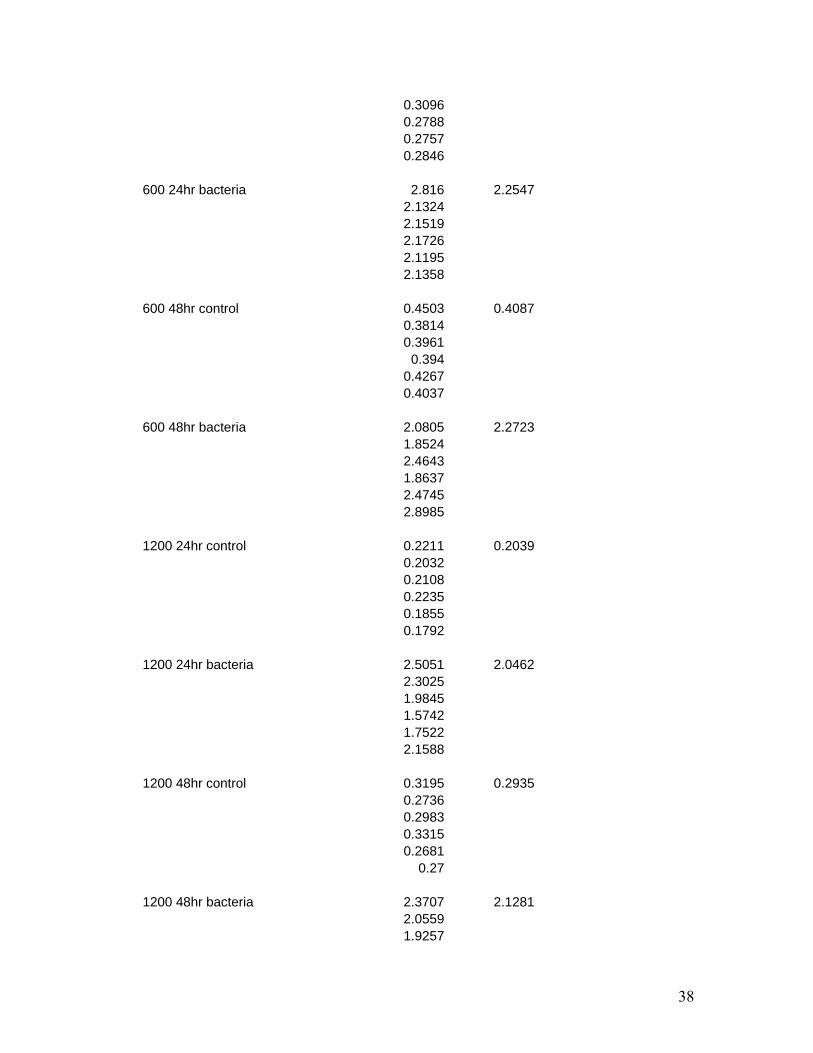
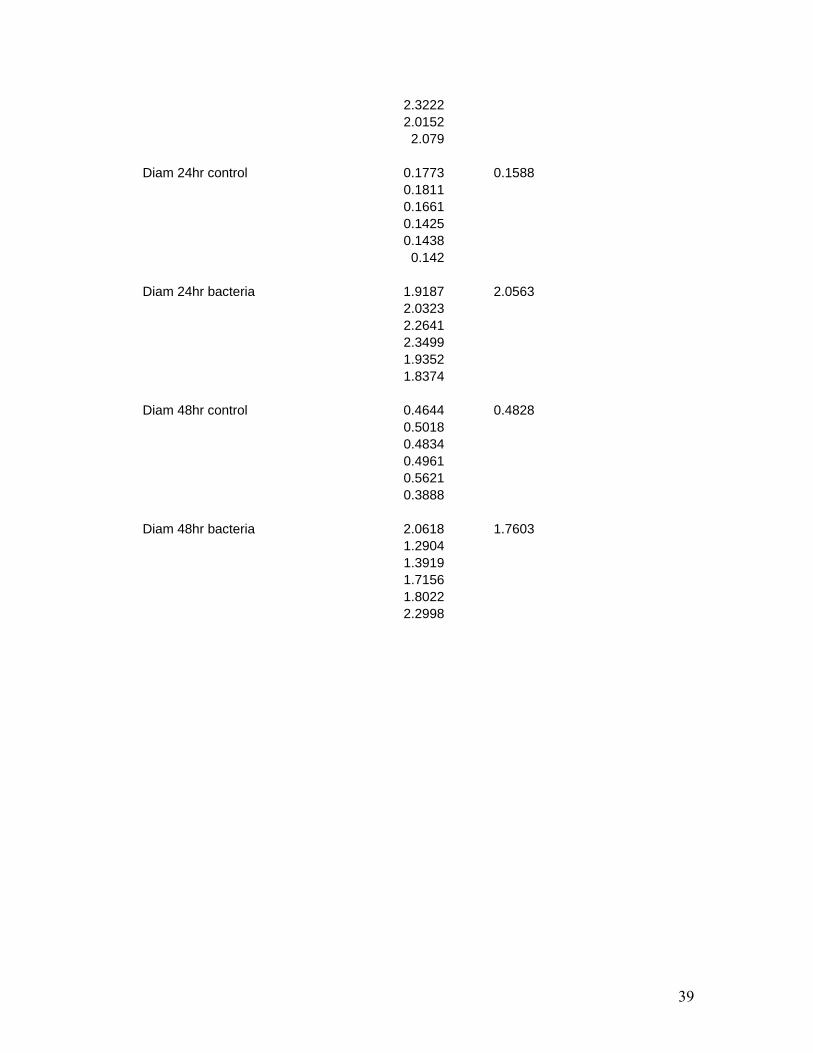
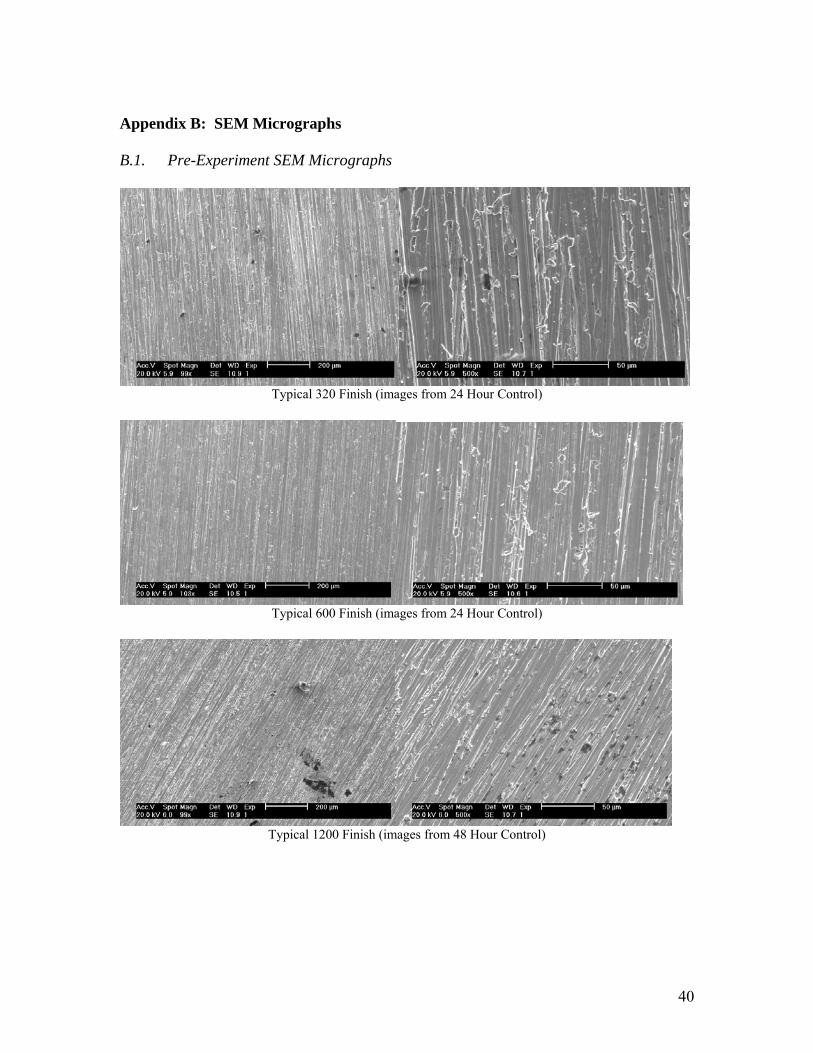
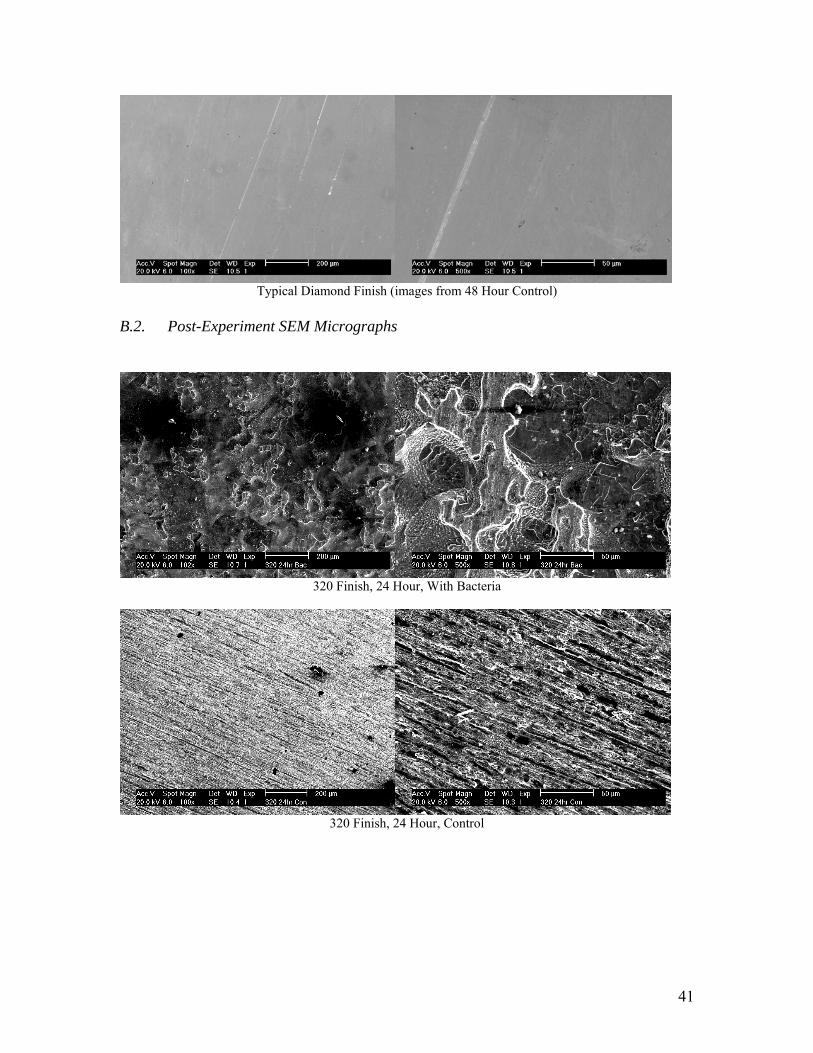
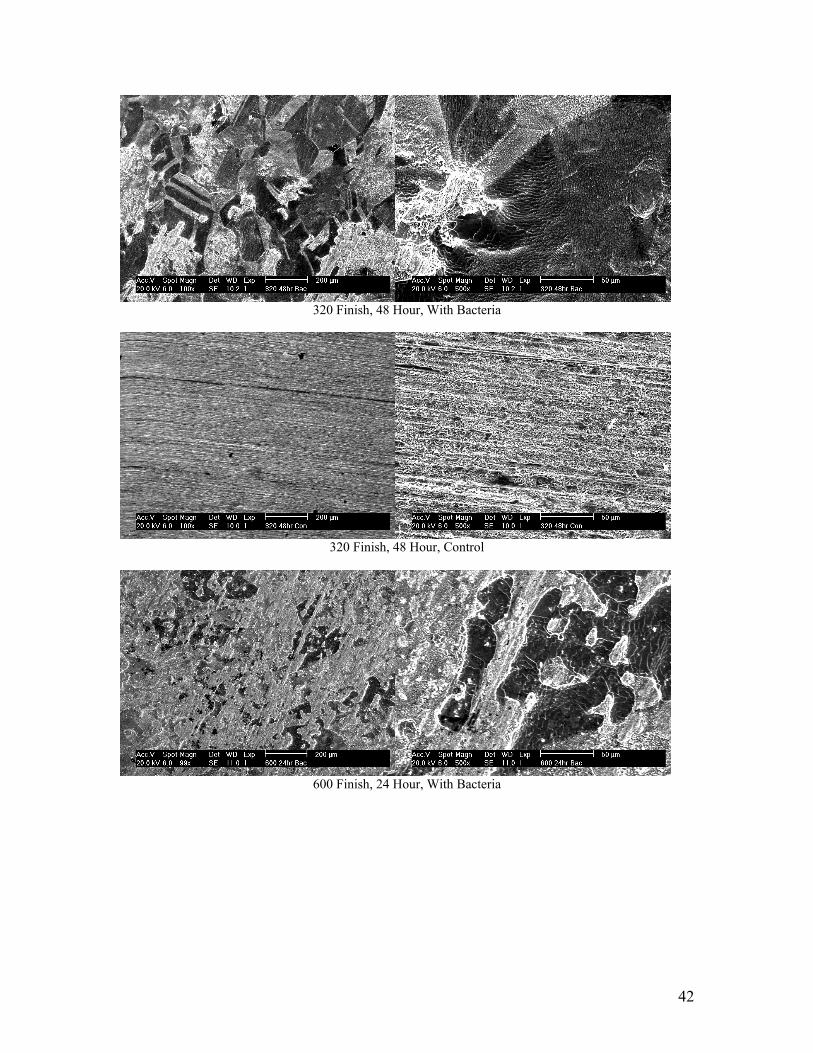
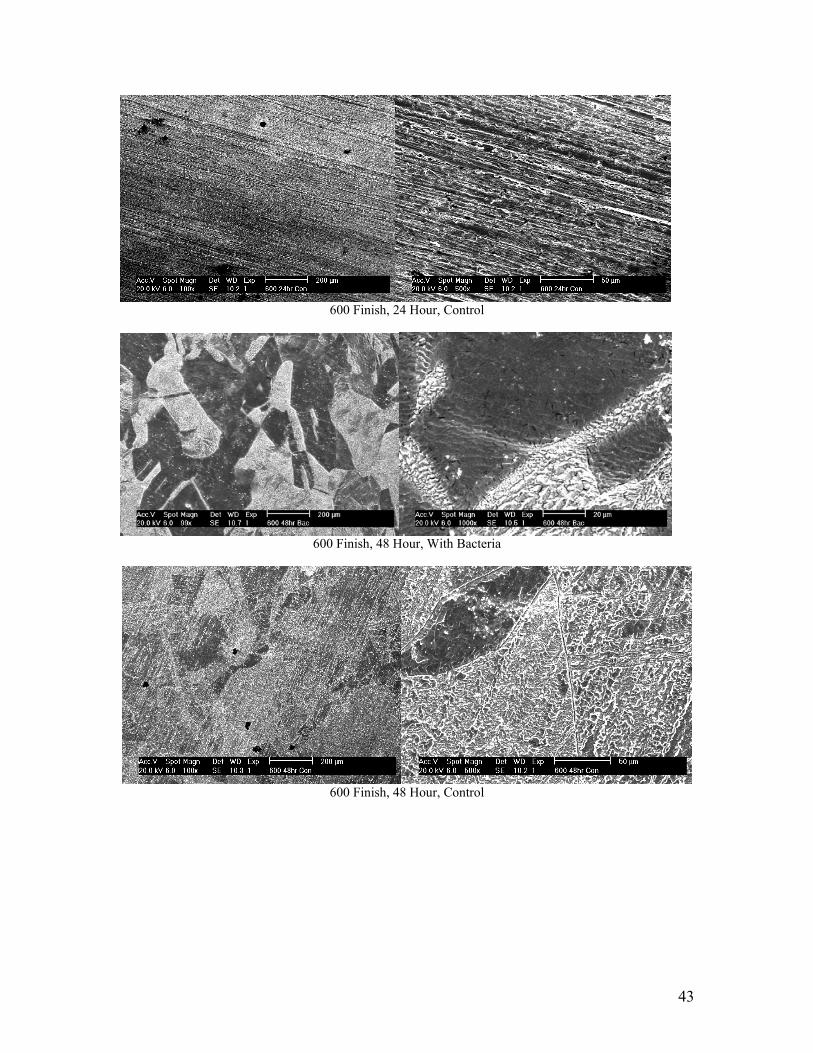
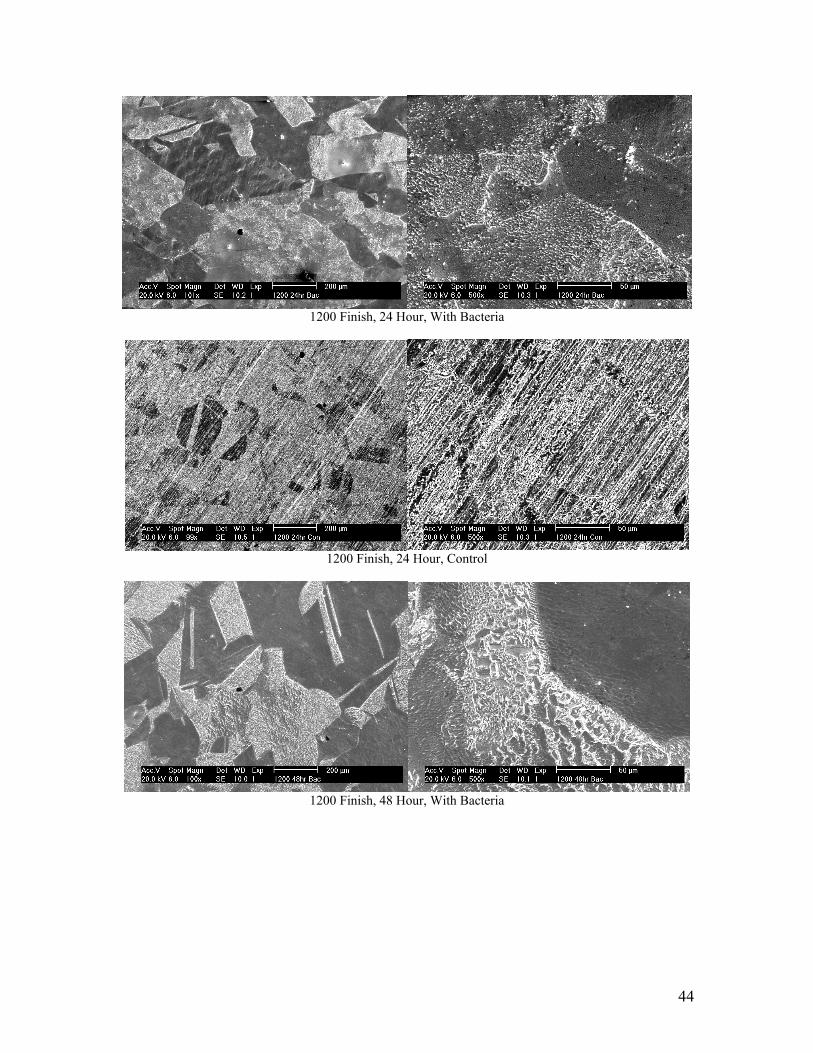
44
1200 Finish 24 Hour With Bacteria
1200 Finish 24 Hour Control
1200 Finish 48 Hour With Bacteria
45
1200 48 Hour Control
6microm Diamond Finish 24 Hour With Bacteria
6microm Diamond Finish 24 Hour Control
46
6microm Diamond Finish 48 Hour With Bacteria
6microm Diamond Finish 48 Hour Control
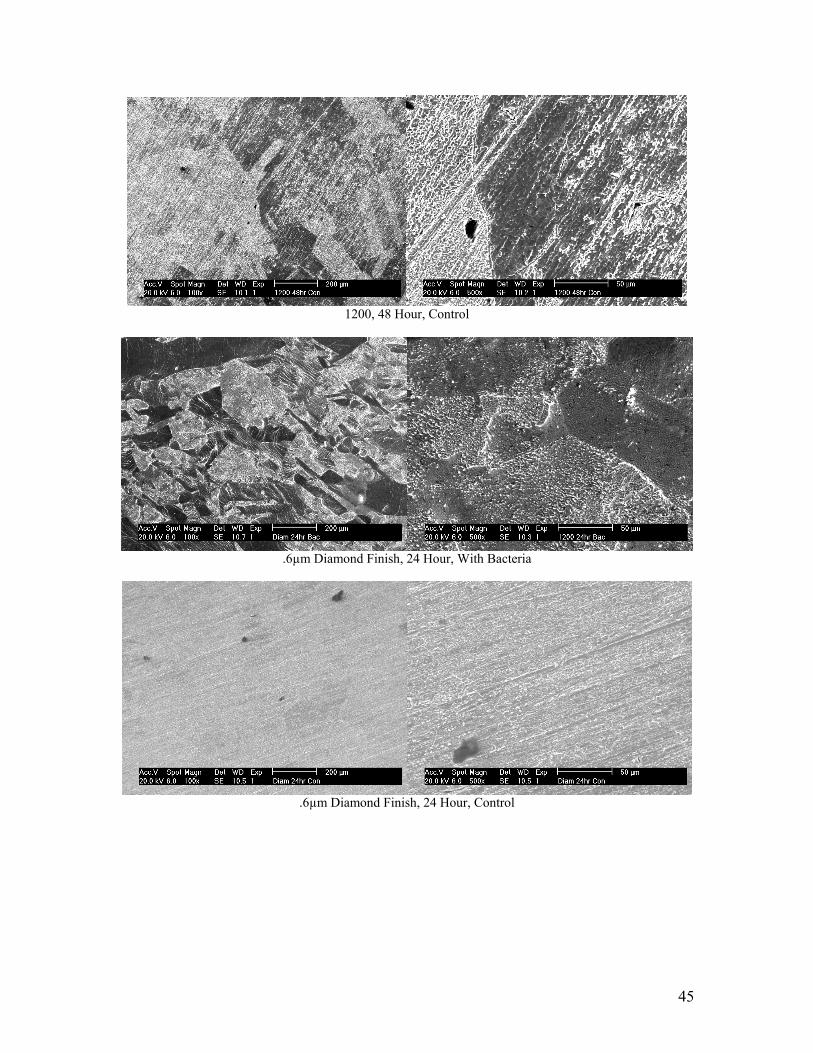
45
1200 48 Hour Control
6microm Diamond Finish 24 Hour With Bacteria
6microm Diamond Finish 24 Hour Control
46
6microm Diamond Finish 48 Hour With Bacteria
6microm Diamond Finish 48 Hour Control
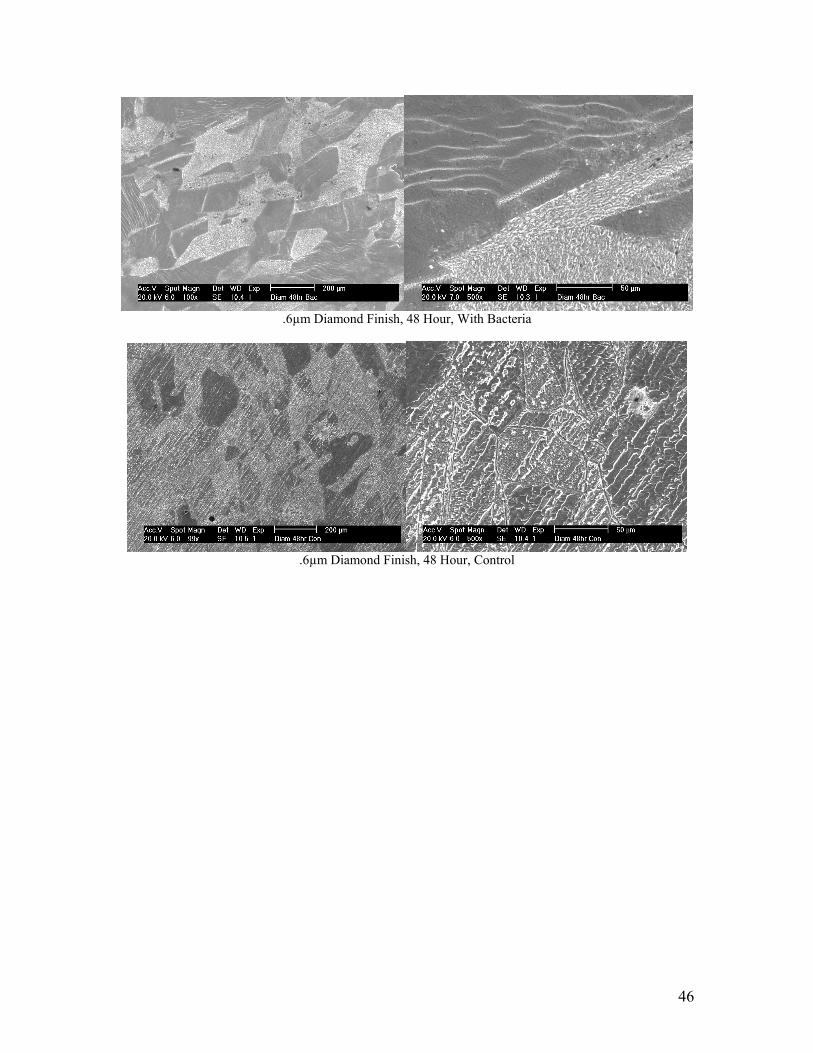
46
6microm Diamond Finish 48 Hour With Bacteria
6microm Diamond Finish 48 Hour Control