Embed Size (px)
Citation preview
Indian Journal of Natural Products and Resources Vol. 1 (2), June 2010, pp. 181-192
Surface morphology, chemical and structural assignment of gum Kondagogu (Cochlospermum gossypium DC.): An exudate tree gum of India
V T P Vinod1 and R B Sashidhar2* 1Jonaki, Board of Radiation and Isotope Technology (BRIT),
Department of Atomic Energy (DAE), CCMB Campus, Uppal Road, Hyderabad-500 007, Andhra Pradesh, India 2Department of Biochemistry, University College of Science, Osmania University, Hyderabad-500 007
Received 28 January 2009; Accepted 27 October 2009
Indian forests are a major source of large number of non-wood forest products. One such product is an exudate tree gum, regionally called as gum Kondagogu (Cochlospermum gossypium DC.), belonging to the family Bixaceae. This gum is collected by tribals in the state of Andhra Pradesh and marketed by Girijan Cooperative Society, Andhra Pradesh, India. Experimental work carried out in our laboratory on this gum has resulted in assigning a separate identity to this gum as compared to the well established and commercially exploited gum Karaya. Gum kondagogu has unique physiochemical properties as compared to other tree gums. Proximate analysis of the gum indicates that it has high volatile acidity and water-binding capacity. Elemental composition of gum kondagogu was determined by Energy dispersive X-ray fluorescence spectrometry (EDXRF). Surface morphological studies based on SEM analysis showed irregular shape with sharp edges in the native gum, while the deacetylated gum showed a fibrilar and porous structure. AFM analysis indicated that native gum was visualized as spherical lumps, suggesting an inter- or intra-molecular aggregation. TEM image of native gum kondagogu showed that the polymer was an extending linear chain with branch points. FT-IR spectrum of native gum indicated the predominant presence of acetyl group (12%w/w). Analytical data on gum kondagogu indicated that the major neutral sugars
were arabinose, mannose, α-D-glucose, β-D-glucose, rhamnose and galactose, whereas uronic acids (D-Glucuronic acid, β-D-
galacturonic acid and α-D-galacturonic acid) were the major acidic sugars. Structural assignment was carried out using acid hydrolysis, Smith degradation and NMR studies [1H, 13C, 2-D NMR (TOCSY and NOESY)]. Smith degradation analysis
indicated that the back bone structure of gum kondagogu was that of α-D-GalpA-(1→4)-α-L-Rhap and can be grouped under rhamnogalacturonan type of gum. The experimental work provides enough evidence to exploit this natural biopolymer in food, textile and pharmaceutical industry.
Keywords: Gum kondagogu, Smith degradation, Cochlospermum gossypium, Natural biopolymer, Food, Textile, Pharmaceutical.
IPC code: Int. cl.8—A61K 36/00, C08B 37/00
Introduction Plant gums are safe for use as pharmaceutical
substances and food additives apart from various industrial applications. Natural gums are incorporated in a very diverse range of food formulations to impart a vide variety of characterizes to the food products. Thus, gums are used as stabilizing, suspending, gelling, emulsifying, thickening, binding and coating agents. Further, many plant gums have been modified in order to improve the properties for application as matrix for controlled drug delivery, tissue reconstruction, pH and electrical sensitive hydrogels and also to remove heavy metals from effluents1-3.
Gums and mucilages are hydrophilic carbohydrate polymers of high molecular weight, generally
composed of monosaccharide units joined by glycosidic bonds. Natural gums are of plant origin and are found either in the intracellular parts of the plant or as extracellular exudates, produced as a result of injury to the plant. At the site of injury, as a defense mechanism an aqueous gum solution is exuded to seal the wound, preventing the infection and dehydration of the plant. This exudate dries on contact with air and sunlight to form hard lump that can be easily collected1. Indian forests are a major source of large number of non-wood forest products, such as exudate gums. India has source of two major forest gums, namely, gum karaya (Sterculia urens Roxb.) and gum kondagogu (Cochlospermum gossypium DC.). Gum kondagogu belongs to the family Bixaceae. This, natural product is collected by tribals in the state of Andhra Pradesh and marketed by Girijan Cooperative Society (Govt. of Andhra Pradesh), Andhra Pradesh,
____________ *Correspondent author E-mail: [email protected] Phone: +91-040-27097044
INDIAN J NAT PROD RESOUR, JUNE 2010
182
India. Between theses two exudate gums, gum karaya has been chemically characterized and its visco-elastic and rheological properties have been well established, thus enabling its commercial exploitation in food and pharmaceutical industry4,5. Even though, gum kondagogu is an important forest produce, its commercial exploitation was limited due to non-availability of scientific information, especially in relation to its physico-chemical, structural and rheological properties. Extensive studies have been carried out in our laboratory to characterize this gum so as to facilitate its commercial exploitation6-8.
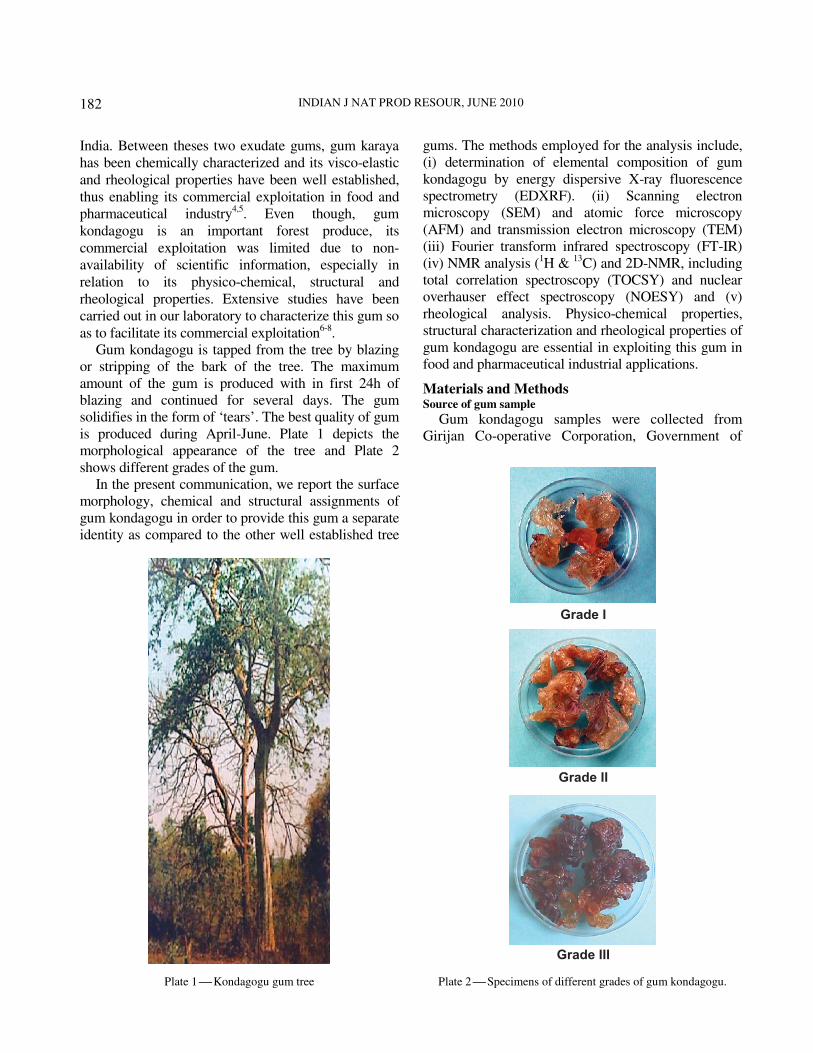
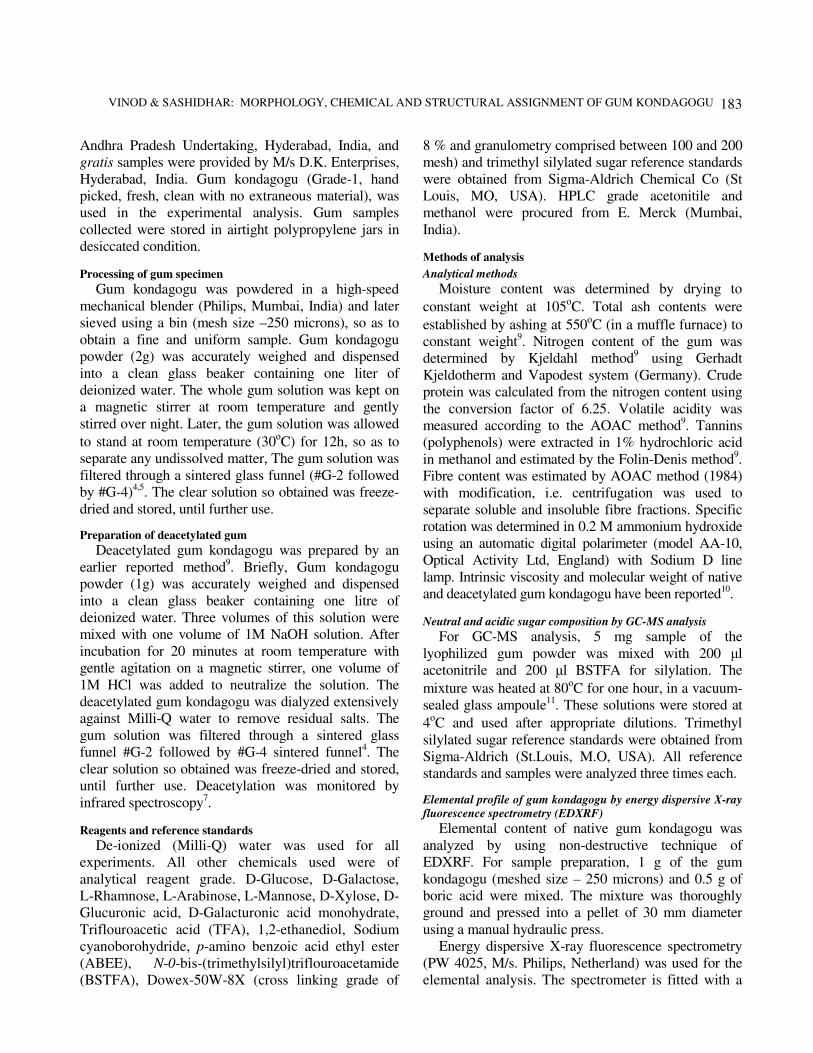
Gum kondagogu is tapped from the tree by blazing or stripping of the bark of the tree. The maximum amount of the gum is produced with in first 24h of blazing and continued for several days. The gum solidifies in the form of ‘tears’. The best quality of gum is produced during April-June. Plate 1 depicts the morphological appearance of the tree and Plate 2 shows different grades of the gum.
In the present communication, we report the surface morphology, chemical and structural assignments of gum kondagogu in order to provide this gum a separate identity as compared to the other well established tree
gums. The methods employed for the analysis include, (i) determination of elemental composition of gum kondagogu by energy dispersive X-ray fluorescence spectrometry (EDXRF). (ii) Scanning electron microscopy (SEM) and atomic force microscopy (AFM) and transmission electron microscopy (TEM) (iii) Fourier transform infrared spectroscopy (FT-IR) (iv) NMR analysis (1H & 13C) and 2D-NMR, including total correlation spectroscopy (TOCSY) and nuclear overhauser effect spectroscopy (NOESY) and (v) rheological analysis. Physico-chemical properties, structural characterization and rheological properties of gum kondagogu are essential in exploiting this gum in food and pharmaceutical industrial applications.
Materials and Methods Source of gum sample
Gum kondagogu samples were collected from Girijan Co-operative Corporation, Government of
Plate 1 Kondagogu gum tree
Plate 2 Specimens of different grades of gum kondagogu.
VINOD & SASHIDHAR: MORPHOLOGY, CHEMICAL AND STRUCTURAL ASSIGNMENT OF GUM KONDAGOGU
183
Andhra Pradesh Undertaking, Hyderabad, India, and gratis samples were provided by M/s D.K. Enterprises, Hyderabad, India. Gum kondagogu (Grade-1, hand picked, fresh, clean with no extraneous material), was used in the experimental analysis. Gum samples collected were stored in airtight polypropylene jars in desiccated condition.
Processing of gum specimen
Gum kondagogu was powdered in a high-speed mechanical blender (Philips, Mumbai, India) and later sieved using a bin (mesh size –250 microns), so as to obtain a fine and uniform sample. Gum kondagogu powder (2g) was accurately weighed and dispensed into a clean glass beaker containing one liter of deionized water. The whole gum solution was kept on a magnetic stirrer at room temperature and gently stirred over night. Later, the gum solution was allowed
to stand at room temperature (30οC) for 12h, so as to separate any undissolved matter, The gum solution was filtered through a sintered glass funnel (#G-2 followed by #G-4)4,5. The clear solution so obtained was freeze-dried and stored, until further use.
Preparation of deacetylated gum
Deacetylated gum kondagogu was prepared by an earlier reported method9. Briefly, Gum kondagogu powder (1g) was accurately weighed and dispensed into a clean glass beaker containing one litre of deionized water. Three volumes of this solution were mixed with one volume of 1M NaOH solution. After incubation for 20 minutes at room temperature with gentle agitation on a magnetic stirrer, one volume of 1M HCl was added to neutralize the solution. The deacetylated gum kondagogu was dialyzed extensively against Milli-Q water to remove residual salts. The gum solution was filtered through a sintered glass funnel #G-2 followed by #G-4 sintered funnel4. The clear solution so obtained was freeze-dried and stored, until further use. Deacetylation was monitored by infrared spectroscopy7.
Reagents and reference standards
De-ionized (Milli-Q) water was used for all experiments. All other chemicals used were of analytical reagent grade. D-Glucose, D-Galactose, L-Rhamnose, L-Arabinose, L-Mannose, D-Xylose, D-Glucuronic acid, D-Galacturonic acid monohydrate, Triflouroacetic acid (TFA), 1,2-ethanediol, Sodium cyanoborohydride, p-amino benzoic acid ethyl ester (ABEE), N-0-bis-(trimethylsilyl)triflouroacetamide (BSTFA), Dowex-50W-8X (cross linking grade of
8 % and granulometry comprised between 100 and 200 mesh) and trimethyl silylated sugar reference standards were obtained from Sigma-Aldrich Chemical Co (St Louis, MO, USA). HPLC grade acetonitile and methanol were procured from E. Merck (Mumbai, India).
Methods of analysis
Analytical methods
Moisture content was determined by drying to
constant weight at 105οC. Total ash contents were
established by ashing at 550οC (in a muffle furnace) to constant weight9. Nitrogen content of the gum was determined by Kjeldahl method9 using Gerhadt Kjeldotherm and Vapodest system (Germany). Crude protein was calculated from the nitrogen content using the conversion factor of 6.25. Volatile acidity was measured according to the AOAC method9. Tannins (polyphenols) were extracted in 1% hydrochloric acid in methanol and estimated by the Folin-Denis method9. Fibre content was estimated by AOAC method (1984) with modification, i.e. centrifugation was used to separate soluble and insoluble fibre fractions. Specific rotation was determined in 0.2 M ammonium hydroxide using an automatic digital polarimeter (model AA-10, Optical Activity Ltd, England) with Sodium D line lamp. Intrinsic viscosity and molecular weight of native and deacetylated gum kondagogu have been reported10.
Neutral and acidic sugar composition by GC-MS analysis
For GC-MS analysis, 5 mg sample of the lyophilized gum powder was mixed with 200 µl acetonitrile and 200 µl BSTFA for silylation. The
mixture was heated at 80οC for one hour, in a vacuum-sealed glass ampoule11. These solutions were stored at
4οC and used after appropriate dilutions. Trimethyl silylated sugar reference standards were obtained from Sigma-Aldrich (St.Louis, M.O, USA). All reference standards and samples were analyzed three times each.
Elemental profile of gum kondagogu by energy dispersive X-ray
fluorescence spectrometry (EDXRF)
Elemental content of native gum kondagogu was analyzed by using non-destructive technique of EDXRF. For sample preparation, 1 g of the gum kondagogu (meshed size – 250 microns) and 0.5 g of boric acid were mixed. The mixture was thoroughly ground and pressed into a pellet of 30 mm diameter using a manual hydraulic press.
Energy dispersive X-ray fluorescence spectrometry (PW 4025, M/s. Philips, Netherland) was used for the elemental analysis. The spectrometer is fitted with a
INDIAN J NAT PROD RESOUR, JUNE 2010
184
side window X-ray tube (9W) that has rhodium as anode. The power specification of the tube are 4-30
kV; 1 µA-1 mA. Selection of filters, tube voltage, sample position and current are fully controlled by computer. Beam spot area (elliptical) for the instrument is 81.7 mm2. The instrument has the features of multi-channel analyzer test, standard less determination and automatic gain correction. Beam stop contains a reference sample (an alloy of aluminum and copper). Copper is used for gain-correction. Elements, Al and Cu are used for instrument energy calibration.
Surface morphology by SEM, AFM and TEM
The SEM photomicrographs of native, swelled and deacetylated gum were recorded by using SEM (Philips XL-30, Lancashire, UK). Appropriate samples were mounted on an aluminum stub with double-sided adhesive tape. The tap was first firmly attached to the stub and the sample powder was scattered carefully over its surface. The stub with the specimen was then sputter coated with a thin layer of gold to make the specimens conductive. The processed specimen was subjected to SEM analysis.
Gum kondagogu, native form (1µg m/l) in Milli Q water was prepared and serially diluted to the desired concentration, before subjecting it to AFM analysis. Two microliters of the solution was dispensed into a freshly cleaved 10 mm diam. disk of mica and air-dried. The mica was mounted in a multimode scanning probe-Bioscope microscope with a nanoscope 1V controller, operated as an atomic force microscope in the tapping mode (Digital Instruments, Santa Barbara, CA, USA). The thin layer of gum kondagogu sample adhering to the mica surface was scanned with atomic force microscope operating in the intermittent contact mode using etched silicon probes (TESP). The springs constant for these probes were 20-100 N/m, and nominal tip radius of curvature was 5-10 nm with a frequency of 200-400 kHz12. Topographic (height) and phase images were recorded simultaneously at ambient temperature. The level of tapping force used during imaging is related to the ratio of the set point amplitude and the ratio of the free-oscillation amplitude. Images were analyzed by software version 5.12 rev. B, which was supplied by the manufactures (along with command reference manual) of the instrument, for data analysis.
TEM was carried out on a transmission electron microscope (JOEL 100 CX, Tokyo, Japan). The gum kondagogu samples were fixed with a 2.5% (w/v)
solution of glutaraldehyde-phosphate buffer (100 mM; pH.7.5) for 2 h, and later washed repeatedly with 100 mM phosphate buffer, dehydrated in a graded ethanol series (50-100%) and acetone (100 %). Resin infiltration was carried out overnight in 2:1 (v/v) acetone/resin, then further 4 h in 1:1 (twice) and finally overnight in 100% resin. The resin infiltration steps were performed at 20ºC and eventually the samples were transferred into molds filled with fresh spur resin for polymerization at 60ºC for 24 hours13. Functional group analysis
Fourier transforms infrared spectra of native and deacetylated gum kondagogu were recorded on a FT-IR spectrometer (Jasco, 420, Tokyo, Japan). The lyophilized dry powder was mixed with KBr and pressed into pellets under mechanical pressure. The FT-IR spectra were acquired after 32 scans between 4000 and 400/cm, with the spectral resolution of 4/cm. Smith degradation experiment14, 15
The polysaccharide (100 mg) was oxidized with 0.1M sodium meta-periodate (2ml) at room temperature in the dark for 48h. Later, the oxidation process was stopped by the addition of 1, 2-ethanediol and the solution was dialyzed against distilled water and the dialyzed material was freeze-dried. Then, the freeze-dried material was dissolved in minimum volume of water and reduced with NaBH4 for 12h at 25oC, before being neutralized with 50% acetic acid. After reduction, the sample was dialyzed against distilled water and freeze-dried. The product was subjected to mild hydrolysis with 0.05 M trifluoro acetic acid (CF3COOH) for 8h at 25oC to eliminate residues of oxidized sugars attached to the polysaccharide. Excess trifluro acetic acid was removes in a Speed Vac concentrator by repeated addition of methanol. The material was dialyzed against distilled water and later lyophilized. The lyophilized material was dehydrated over P2O5 in vacuum chamber for several days and then deuterium exchange was followed by lyophilization with D2O. The Smith-degraded sample was subjected to 13C NMR spectral analysis.
1-Dimentional (1H and 13C-NMR) and 2-Dimentional-NMR
(TOCSY and NOESY) analysis 1H and 13C-NMR spectra of acid hydrolysed gum
kondagogu and Smith degraded samples were recorded in an NMR spectrometer (Varian, UNITY-400, Steinhausen, Switzerland). The acid hydrolysed
VINOD & SASHIDHAR: MORPHOLOGY, CHEMICAL AND STRUCTURAL ASSIGNMENT OF GUM KONDAGOGU
185
gum kondagogu (100mg) was dissolved in D2O and the chemical shifts were reported in ppm relative to an internal standard TSP (3-trimethylsilyl-propionic-2, 2, 3, 3, -d4 acid, sodium salt, 98% D) for 1H NMR and 1, 4-dioxane (δ 66.67 ppm) for 13C spectra. Proton NMR spectra was obtained at a base frequency of 400 MHz with 16 transitions and delay time of 1.5 seconds and for 13C, base frequency was 100 MHz with 3000 scans and delay time of 2 seconds. A 2-D NMR spectrum was determined based on total correlation spectroscopy (TOCSY) and nuclear over Hauser effect spectroscopy (NOESY), using NMR spectrometer (Varian, UNITY-400, Steinhausen, Switzerland). The TOCSY experiment was recorded at mixing time of 150 ms, and complete assignment required several TOCSY experiments having mixing times ranging from 60 to 300ms. The NOESY mixing delay was 300 ms.
Rhelogical analysis
Aqueous solutions at different concentrations ranging from 1 to 3% (w/v) were prepared by
dissolving lyophilized native gum. All the rheological measurements were performed in a Physica MCR 51 Rheometer (Anton Paar, Germany GmbH, Ostfildem, Germany). The solutions were characterized for their
steady-shear viscosity function, η(r), using a unidirectional steady-shear flow, with shear rate ranging from 0.3 to 400/s.
Results and Discussion
Analytical data
Table 1 gives the proximate analysis, water binding capacity, specific rotation, intrinsic viscosity, molecular weight and sugar composition (neutral and acidic) of the grade-I gum kondagogu. The moisture, ash and volatile acidity a content of gum kondagogu corresponds to those reported for commercial gum karaya6. The crude protein content was found to be lower as compared to gum karaya6. The tannin content of gum kondagogu was comparatively higher than gum karaya. The total fibre content was lower in gum kondagogu as compared to gum karaya, while the soluble fibre contents were higher in gum kondagogu. The water binding capacity of gum kondagogu was higher than karaya gum, even though
the specific rotation [α]D of both the gums were observed to be similar6. The intrinsic viscosity and molecular weight of gum kondagogu by static light scattering experiment was found to be higher than gum Karaya, gum Tragacanth and gum Arabic10. Neutral and Acidic sugar composition
Trimethylsilylation of gum kondagogu and its subsequent analysis by GC-MS revealed that the major components present in the gums were neutral sugars and uronic acids. The major sugars identified in the gums, are depicted in Table 1. The neutral sugar residue identified were arabinose (2.52 mol %),
mannose (8.3 mol %), α-D-glucose (2.48 mol %), β-D-glucose (2.52 mol%), rhamnose (12.85mol %), galactose (18.95mol %) and acidic sugars were
D-Glucuronic acid (19.26 mol %), β-D-galacturonic
acid (13.22 mol %) and α-D-galacturonic acid (11.22 mol %).
Elemental composition
The elemental composition of gum kondagogu was determined by Energy dispersive X-ray fluorescence spectrometry (EDXRF) is presented in Table 2. The result indicated that calcium (17.5 mg/g), potassium (15.2 mg/g) and sodium (2.5mg/g) are the major element present in gum kondagogu. The minor
Table 1 Analytical profile of gum kondagogu
Parameter Gum*composition
Moisture (g %) 15.25 ± 1.18
Asha(g %) 7.3 ± 0.33
Crude Proteinb (g %) 6.3 ± 1.11
Volatile acidityb(g %) 15.9 ± 0.35
Tanninb(g %) 0.072 ± 0.008
Total fibreb(g %) 80.0 ± 20.2
Insoluble fibreb(g %) 77.5 ± 13.9
Soluble fibreb(g %) 22.5 ± 8.00
Water binding capacity (ml/g) 35.1 ± 1.96
pH 4.9-5.0
Specific rotation [α] b.c
+53.5 ± 7.37
Intrinsic viscosity, [n], dL/g 32.68 ± 0.22 dl/ g
Molecular weight (kDa) 7.23 ± 0.15 × 10⁶
Sugar residues Mole % #
Neutral sugars
Rhamnose 12.85 ± 0.15
Arabinose 2.52 ± 0.01
Mannose 8.3 ± 0.09
α-D-glucose 2.48 ± 0.03
β-D-glucose 2.52 ± 0.01
Acidic sugars
D-glucuronic acid 19.26 ±0.17
β-D-galacturonic acid 13.22 ± 0.12
α-D-galacturonic acid 11.02 ± 0.12
*Grade–I gum kondagogu; a = Corrected for moisture content; b = Corrected for moisture and ash content, c = in 0.2 M Ammonium
hydroxide; # Analyzed by GC-MS, Value: Mean ± SD; n = 6
INDIAN J NAT PROD RESOUR, JUNE 2010
186
elements present in gum kondagogu are Mg, Si, S, Cl, Mn, Fe, Cu, Sr, Ba and Al. The present results of elemental composition of gum kondagogu were comparable with earlier reported value by ICP-AES and AAS methods6,7.
Surface morphology of gum kondagogu
SEM analysis
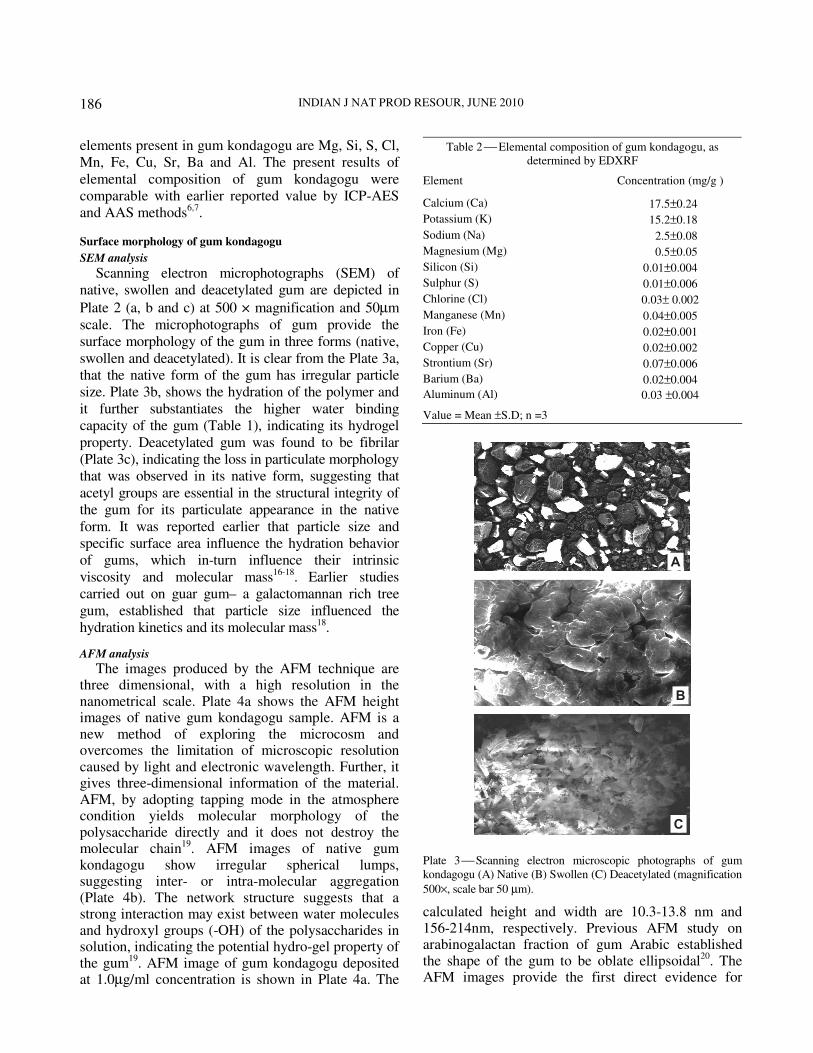
Scanning electron microphotographs (SEM) of native, swollen and deacetylated gum are depicted in
Plate 2 (a, b and c) at 500 × magnification and 50µm scale. The microphotographs of gum provide the surface morphology of the gum in three forms (native, swollen and deacetylated). It is clear from the Plate 3a, that the native form of the gum has irregular particle size. Plate 3b, shows the hydration of the polymer and it further substantiates the higher water binding capacity of the gum (Table 1), indicating its hydrogel property. Deacetylated gum was found to be fibrilar (Plate 3c), indicating the loss in particulate morphology that was observed in its native form, suggesting that acetyl groups are essential in the structural integrity of the gum for its particulate appearance in the native form. It was reported earlier that particle size and specific surface area influence the hydration behavior of gums, which in-turn influence their intrinsic viscosity and molecular mass16-18. Earlier studies carried out on guar gum– a galactomannan rich tree gum, established that particle size influenced the hydration kinetics and its molecular mass18.
AFM analysis
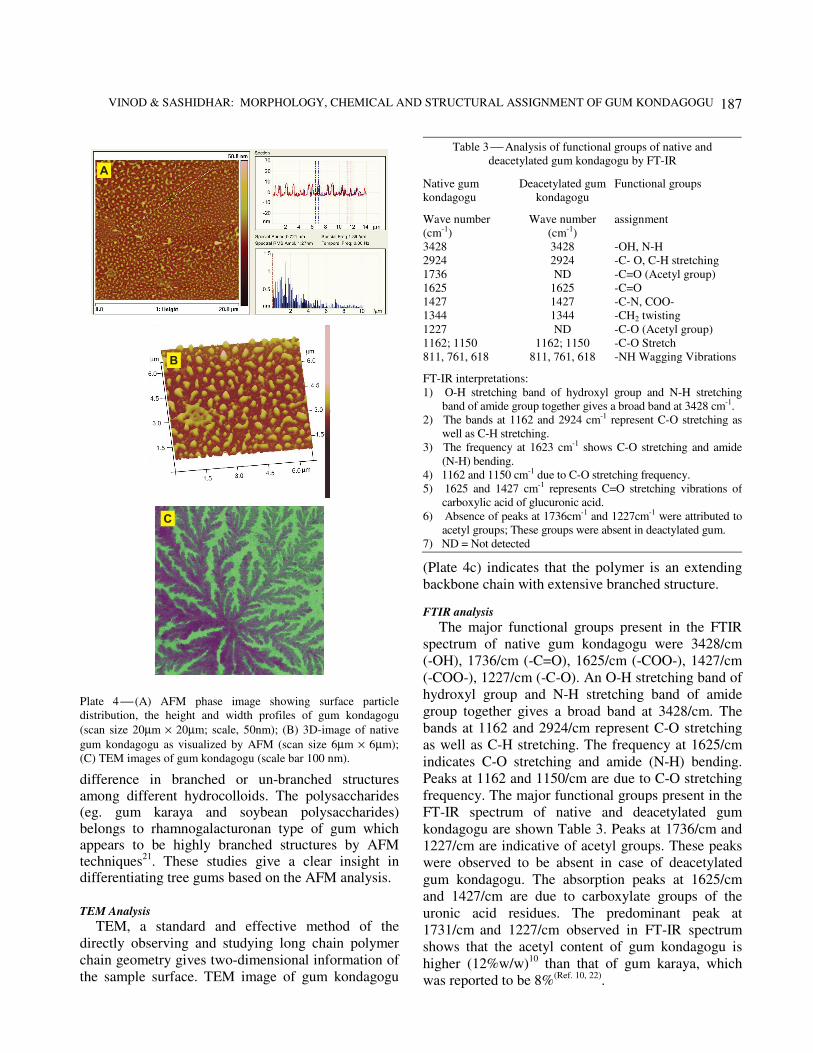
The images produced by the AFM technique are three dimensional, with a high resolution in the nanometrical scale. Plate 4a shows the AFM height images of native gum kondagogu sample. AFM is a new method of exploring the microcosm and overcomes the limitation of microscopic resolution caused by light and electronic wavelength. Further, it gives three-dimensional information of the material. AFM, by adopting tapping mode in the atmosphere condition yields molecular morphology of the polysaccharide directly and it does not destroy the molecular chain19. AFM images of native gum kondagogu show irregular spherical lumps, suggesting inter- or intra-molecular aggregation (Plate 4b). The network structure suggests that a strong interaction may exist between water molecules and hydroxyl groups (-OH) of the polysaccharides in solution, indicating the potential hydro-gel property of the gum19. AFM image of gum kondagogu deposited at 1.0µg/ml concentration is shown in Plate 4a. The
calculated height and width are 10.3-13.8 nm and 156-214nm, respectively. Previous AFM study on arabinogalactan fraction of gum Arabic established the shape of the gum to be oblate ellipsoidal20. The AFM images provide the first direct evidence for
Table 2 Elemental composition of gum kondagogu, as determined by EDXRF
Element Concentration (mg/g )
Calcium (Ca) 17.5±0.24
Potassium (K) 15.2±0.18
Sodium (Na) 2.5±0.08
Magnesium (Mg) 0.5±0.05
Silicon (Si) 0.01±0.004
Sulphur (S) 0.01±0.006
Chlorine (Cl) 0.03± 0.002
Manganese (Mn) 0.04±0.005
Iron (Fe) 0.02±0.001
Copper (Cu) 0.02±0.002
Strontium (Sr) 0.07±0.006
Barium (Ba) 0.02±0.004
Aluminum (Al) 0.03 ±0.004
Value = Mean ±S.D; n =3
Plate 3 Scanning electron microscopic photographs of gum kondagogu (A) Native (B) Swollen (C) Deacetylated (magnification
500×, scale bar 50 µm).
VINOD & SASHIDHAR: MORPHOLOGY, CHEMICAL AND STRUCTURAL ASSIGNMENT OF GUM KONDAGOGU
187
difference in branched or un-branched structures among different hydrocolloids. The polysaccharides (eg. gum karaya and soybean polysaccharides) belongs to rhamnogalacturonan type of gum which appears to be highly branched structures by AFM techniques21. These studies give a clear insight in differentiating tree gums based on the AFM analysis.
TEM Analysis
TEM, a standard and effective method of the directly observing and studying long chain polymer chain geometry gives two-dimensional information of the sample surface. TEM image of gum kondagogu
(Plate 4c) indicates that the polymer is an extending backbone chain with extensive branched structure.
FTIR analysis
The major functional groups present in the FTIR spectrum of native gum kondagogu were 3428/cm (-OH), 1736/cm (-C=O), 1625/cm (-COO-), 1427/cm (-COO-), 1227/cm (-C-O). An O-H stretching band of hydroxyl group and N-H stretching band of amide group together gives a broad band at 3428/cm. The bands at 1162 and 2924/cm represent C-O stretching as well as C-H stretching. The frequency at 1625/cm indicates C-O stretching and amide (N-H) bending. Peaks at 1162 and 1150/cm are due to C-O stretching frequency. The major functional groups present in the FT-IR spectrum of native and deacetylated gum kondagogu are shown Table 3. Peaks at 1736/cm and 1227/cm are indicative of acetyl groups. These peaks were observed to be absent in case of deacetylated gum kondagogu. The absorption peaks at 1625/cm and 1427/cm are due to carboxylate groups of the uronic acid residues. The predominant peak at 1731/cm and 1227/cm observed in FT-IR spectrum shows that the acetyl content of gum kondagogu is higher (12%w/w)10 than that of gum karaya, which was reported to be 8%(Ref. 10, 22).
Plate 4 (A) AFM phase image showing surface particle distribution, the height and width profiles of gum kondagogu
(scan size 20µm × 20µm; scale, 50nm); (B) 3D-image of native
gum kondagogu as visualized by AFM (scan size 6µm × 6µm); (C) TEM images of gum kondagogu (scale bar 100 nm).
Table 3 Analysis of functional groups of native and deacetylated gum kondagogu by FT-IR
Native gum kondagogu
Deacetylated gum kondagogu
Functional groups
Wave number (cm-1)
Wave number (cm-1)
assignment
3428 3428 -OH, N-H 2924 2924 -C- O, C-H stretching 1736 ND -C=O (Acetyl group) 1625 1625 -C=O 1427 1427 -C-N, COO- 1344 1344 -CH2 twisting 1227 ND -C-O (Acetyl group) 1162; 1150 1162; 1150 -C-O Stretch 811, 761, 618 811, 761, 618 -NH Wagging Vibrations
FT-IR interpretations: 1) O-H stretching band of hydroxyl group and N-H stretching
band of amide group together gives a broad band at 3428 cm-1. 2) The bands at 1162 and 2924 cm-1 represent C-O stretching as
well as C-H stretching. 3) The frequency at 1623 cm-1 shows C-O stretching and amide
(N-H) bending. 4) 1162 and 1150 cm-1 due to C-O stretching frequency. 5) 1625 and 1427 cm-1 represents C=O stretching vibrations of
carboxylic acid of glucuronic acid. 6) Absence of peaks at 1736cm-1 and 1227cm-1 were attributed to
acetyl groups; These groups were absent in deactylated gum. 7) ND = Not detected
INDIAN J NAT PROD RESOUR, JUNE 2010
188
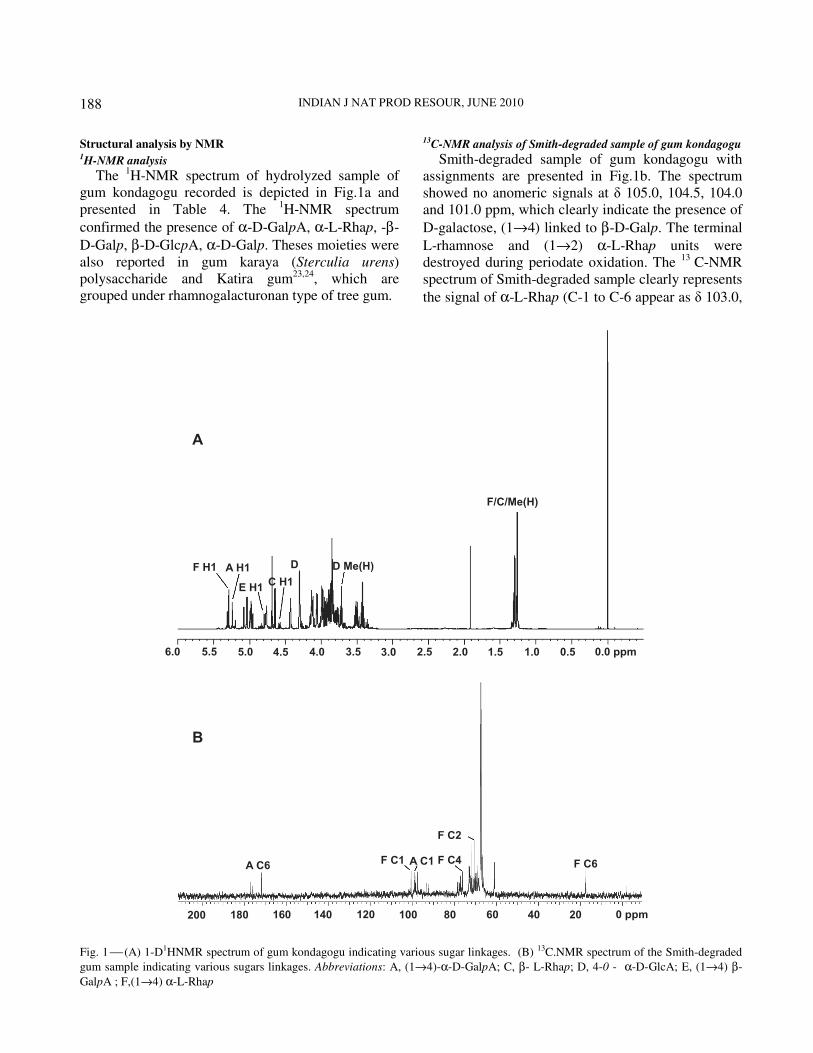
Structural analysis by NMR 1H-NMR analysis
The 1H-NMR spectrum of hydrolyzed sample of gum kondagogu recorded is depicted in Fig.1a and presented in Table 4. The 1H-NMR spectrum
confirmed the presence of α-D-GalpA, α-L-Rhap, -β-
D-Galp, β-D-GlcpA, α-D-Galp. Theses moieties were also reported in gum karaya (Sterculia urens) polysaccharide and Katira gum23,24, which are grouped under rhamnogalacturonan type of tree gum.
13C-NMR analysis of Smith-degraded sample of gum kondagogu
Smith-degraded sample of gum kondagogu with assignments are presented in Fig.1b. The spectrum showed no anomeric signals at δ 105.0, 104.5, 104.0 and 101.0 ppm, which clearly indicate the presence of
D-galactose, (1→4) linked to β-D-Galp. The terminal
L-rhamnose and (1→2) α-L-Rhap units were destroyed during periodate oxidation. The 13 C-NMR spectrum of Smith-degraded sample clearly represents
the signal of α-L-Rhap (C-1 to C-6 appear as δ 103.0,
Fig. 1 (A) 1-D1HNMR spectrum of gum kondagogu indicating various sugar linkages. (B) 13C.NMR spectrum of the Smith-degraded
gum sample indicating various sugars linkages. Abbreviations: A, (1→4)-α-D-GalpA; C, β- L-Rhap; D, 4-0 - α-D-GlcA; E, (1→4) β-
GalpA ; F,(1→4) α-L-Rhap
VINOD & SASHIDHAR: MORPHOLOGY, CHEMICAL AND STRUCTURAL ASSIGNMENT OF GUM KONDAGOGU
189
70.7, 71.0, 78.2, 69.7 and 17.2 ppm) and α-D-Galacturonic acid (C-1 to C-6 appeared as δ 99.0, 68.9, 70.7, 71.9, 72.5 and 174 ppm) 24, uronic acids
residues such as β-D-glucuronic acid and its 4-O-methyl analogue, are attached at the C-6 and C-4 positions of the galactose moieties in the backbone (Table 5). From the results of Smith-degraded sample of gum kondagogu, the backbone structure of gum
kondagogu can be assigned as α-D-GalpA-(1→4)-α-L-Rhap, and grouped under rhamnogalacturonans type of gums. 2D-NMR (TOCSY and NOESY) analysis
TOCSY and NOESY analysis have proven useful for practical structural characterization of carbohydrate due to the possibility of obtaining high-quality spectra with high resolution. The linkage site identification is often done by homonuclear 1-D and 2-D NOESY experiments. The selection of cross
peaks from 1→2 linkages is achieved by tuning the duration of the TOCSY mixing period. The sensitivity of this technique has been observed to be superior to that of heteronuclear multiple-bond coherence (HMBC) analysis for carbohydrate polymers. NOESY spectra can give connectivities across the glycosidic
linkage and may be helpful in cases with severe overlap occur due to the separation in the carbon dimension. The assignment of the glycosidic linkages between the different residues is based on the TOCSY and NOESY experiments25.
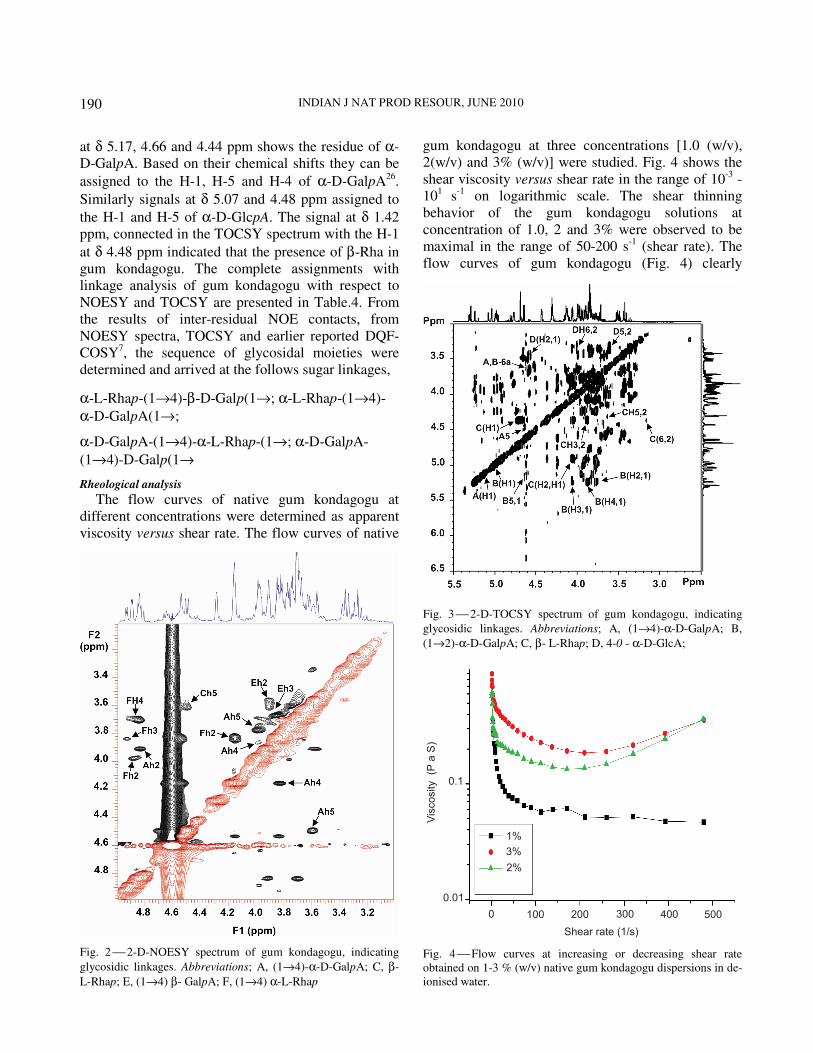
NOESY spectra of gum kondagogu hydrolyzed samples were acquired with a 300 ms mixing time to provide both inter and intra-residual coupling (Fig. 2). The sequences of glycosyl residues of the gum kondagogu hydrolyzed samples were determined from NOSEY analysis. Inter-residue NOE (nuclear over Hauser effect) contacts were observed from H-1 of residue A with H-4 of residue E, H-1 of residue B with H-4 of residue A, H-1 of residue C with H-4 of residue B, H-1 of residue D with H-2 of residue B, H-1 of residue E with H-2 of residue C and H-1 of residue F with H-2 of residue A, along with other inter-residual couplings. The analysis of hydrolyzed residue of gum kondagogu A and B, which show a B C-1, A H-4 and a B H-1, A C-4, cross peak supported by NOESY. Cross peak between B H-1 and A H-4
typical for (1→4) glycosidic linkage between GlcA and GalA. The inter residual cross-peaks between A H-1 and C H-5 and C H-6 found in the NOESY spectrum and the heteronuclear cross-peak between A
C-1 and H-4 suggest a GalA (1→ 4)-Rha linkage (Fig.
2). A Rha (1→ 4) Glc linkage could be proven by the D H-4, C C-1 and C H-1, D C-4 cross peaks have been indicated earlier HMBC spectrum in our study7. The present NOESY spectrum (Fig. 2) indicated that
δ at 4.97/4.06 ppm represents α-D-glucopyranosyl
unit was attached to 1→ 4 to a β-D-galactopyranosyl unit that had anomeric resonance at 4.71 ppm. This result was attributed earlier reported 13C NMR data of gum kondagogu hydrolyzed sample, where anomeric
resonance at 100.9 ppm and 105.2 ppm represents α-
D-Glcp and β-D-Galp7.
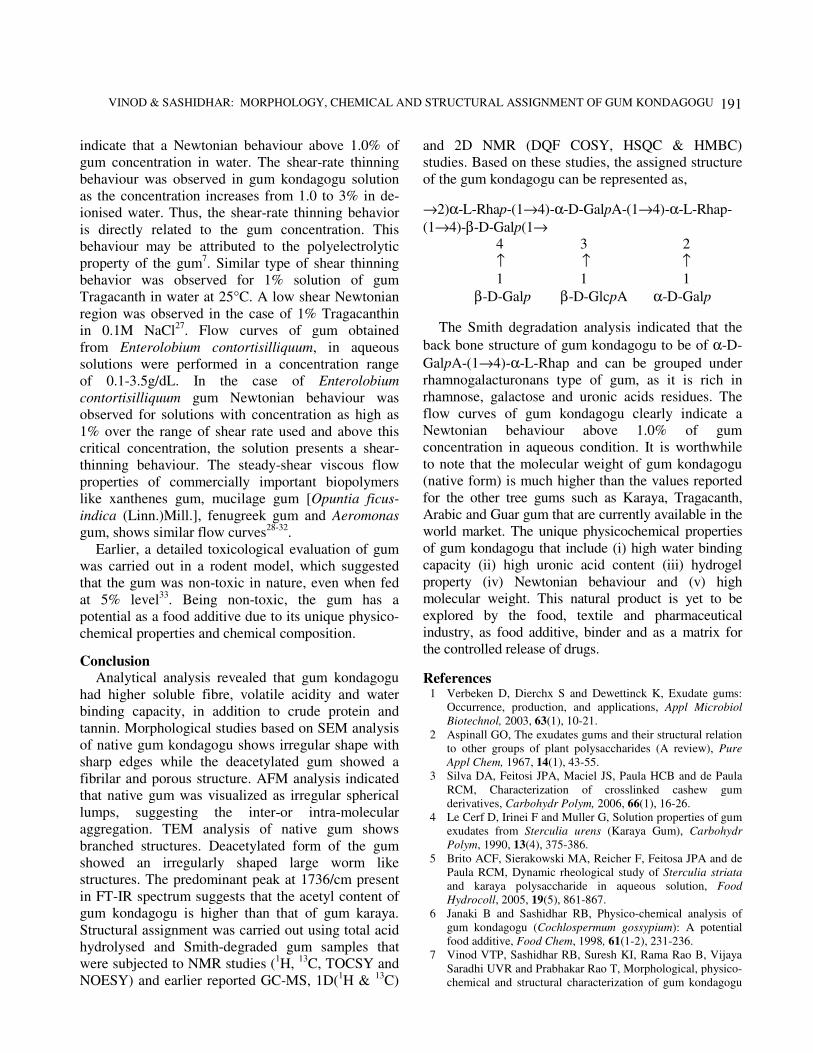
2-D TOCSY spectrum of gum kondagogu hydrolyzed samples is presented in Fig.3. The signals
Table 41-D 1H-NMR chemical shifts (δ) in ppm of the gum kondagogu hydrolyzed products and 2 D-NMR (TOCSY &
NOESY) assignments
Proton (δ in ppm)* Sugar Residue
H-1 H-2 H-3 H-4 H-5 H-6a
(1→ 4) α-D-Gal pA (A) 5.17 3.96 4.01 4.44 4.66 -
(1→ 4) α-L-GlcpA (B) 5.07 3.96 3.83 3.66 4.48 -
(1→ 4) β-L-Rhap (C) 4.86 4.07 3.65 3.55 3.52 1.21
(1→ 4) β-D-GlcpA (D) 4.5 3.35 3.68 3.65 3.57 3.69
(1→ 4) β -D-Gal pA (E) 4.52 3.6 3.69 3.92 4.05 -
(1→ 2) α-L-Rhap (F) 5.13 4.06 3.78 4.24 - -
*Verhoef et al, 2002; Ojha et al, 2008
Table 51-D 13C-NMR data for Smith-degraded gum kondagogu polymer
Assignments in ppm (δ) Sugar residue
C-1 C-2 C-3 C-4 C-5 C-6 O-CH3
α-D-Gal pA(1→ * 99.0 68.9 70.7 71.9 72.5 174
→ 4) α-L-Rhap(1→ * 103 70.7 71.0 78.2 69.7 17.2
4-O-Me-α-D-Glc pA(1← $ 99.70 73.12 73.69 82.5 70.76 175.82 59.95
→ 6)β-D-Gal p (1← $ 102.63 70.2 72.25 69.32 73.12 68.90
*Ojha et al, 2008; $Leon de Pinto et al, 1994
INDIAN J NAT PROD RESOUR, JUNE 2010
190
at δ 5.17, 4.66 and 4.44 ppm shows the residue of α-D-GalpA. Based on their chemical shifts they can be
assigned to the H-1, H-5 and H-4 of α-D-GalpA26.
Similarly signals at δ 5.07 and 4.48 ppm assigned to
the H-1 and H-5 of α-D-GlcpA. The signal at δ 1.42 ppm, connected in the TOCSY spectrum with the H-1
at δ 4.48 ppm indicated that the presence of β-Rha in gum kondagogu. The complete assignments with linkage analysis of gum kondagogu with respect to NOESY and TOCSY are presented in Table.4. From the results of inter-residual NOE contacts, from NOESY spectra, TOCSY and earlier reported DQF-COSY7, the sequence of glycosidal moieties were determined and arrived at the follows sugar linkages,
α-L-Rhap-(1→4)-β-D-Galp(1→; α-L-Rhap-(1→4)-
α-D-GalpA(1→;
α-D-GalpA-(1→4)-α-L-Rhap-(1→; α-D-GalpA-
(1→4)-D-Galp(1→
Rheological analysis
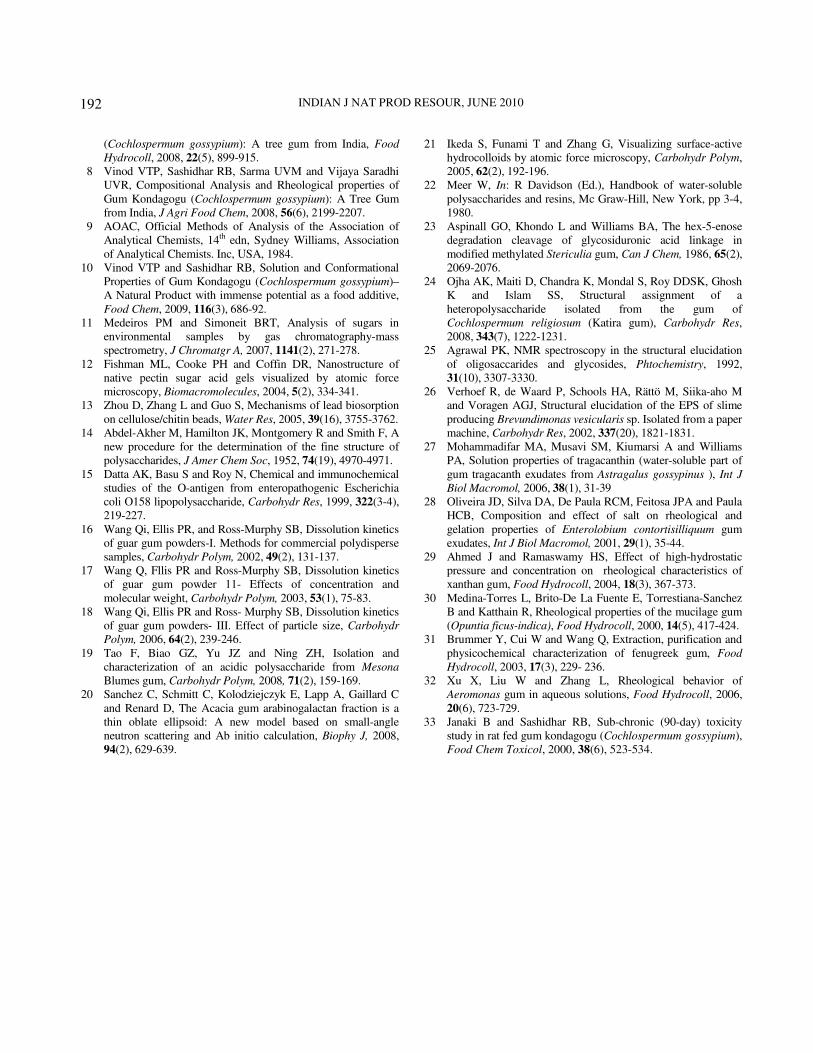
The flow curves of native gum kondagogu at different concentrations were determined as apparent viscosity versus shear rate. The flow curves of native
gum kondagogu at three concentrations [1.0 (w/v), 2(w/v) and 3% (w/v)] were studied. Fig. 4 shows the shear viscosity versus shear rate in the range of 10-3 - 101 s-1 on logarithmic scale. The shear thinning behavior of the gum kondagogu solutions at concentration of 1.0, 2 and 3% were observed to be maximal in the range of 50-200 s-1 (shear rate). The flow curves of gum kondagogu (Fig. 4) clearly
Fig. 2 2-D-NOESY spectrum of gum kondagogu, indicating
glycosidic linkages. Abbreviations; A, (1→4)-α-D-GalpA; C, β-
L-Rhap; E, (1→4) β- GalpA; F, (1→4) α-L-Rhap
Fig. 3 2-D-TOCSY spectrum of gum kondagogu, indicating
glycosidic linkages. Abbreviations; A, (1→4)-α-D-GalpA; B,
(1→2)-α-D-GalpA; C, β- L-Rhap; D, 4-0 - α-D-GlcA;
Fig. 4 Flow curves at increasing or decreasing shear rate obtained on 1-3 % (w/v) native gum kondagogu dispersions in de-ionised water.
VINOD & SASHIDHAR: MORPHOLOGY, CHEMICAL AND STRUCTURAL ASSIGNMENT OF GUM KONDAGOGU
191
indicate that a Newtonian behaviour above 1.0% of gum concentration in water. The shear-rate thinning behaviour was observed in gum kondagogu solution as the concentration increases from 1.0 to 3% in de-ionised water. Thus, the shear-rate thinning behavior is directly related to the gum concentration. This behaviour may be attributed to the polyelectrolytic property of the gum7. Similar type of shear thinning behavior was observed for 1% solution of gum Tragacanth in water at 25°C. A low shear Newtonian region was observed in the case of 1% Tragacanthin in 0.1M NaCl27. Flow curves of gum obtained from Enterolobium contortisilliquum, in aqueous solutions were performed in a concentration range of 0.1-3.5g/dL. In the case of Enterolobium
contortisilliquum gum Newtonian behaviour was observed for solutions with concentration as high as 1% over the range of shear rate used and above this critical concentration, the solution presents a shear-thinning behaviour. The steady-shear viscous flow properties of commercially important biopolymers like xanthenes gum, mucilage gum [Opuntia ficus-
indica (Linn.)Mill.], fenugreek gum and Aeromonas gum, shows similar flow curves28-32.
Earlier, a detailed toxicological evaluation of gum was carried out in a rodent model, which suggested that the gum was non-toxic in nature, even when fed at 5% level33. Being non-toxic, the gum has a potential as a food additive due to its unique physico-chemical properties and chemical composition.
Conclusion Analytical analysis revealed that gum kondagogu
had higher soluble fibre, volatile acidity and water binding capacity, in addition to crude protein and tannin. Morphological studies based on SEM analysis of native gum kondagogu shows irregular shape with sharp edges while the deacetylated gum showed a fibrilar and porous structure. AFM analysis indicated that native gum was visualized as irregular spherical lumps, suggesting the inter-or intra-molecular aggregation. TEM analysis of native gum shows branched structures. Deacetylated form of the gum showed an irregularly shaped large worm like structures. The predominant peak at 1736/cm present in FT-IR spectrum suggests that the acetyl content of gum kondagogu is higher than that of gum karaya. Structural assignment was carried out using total acid hydrolysed and Smith-degraded gum samples that were subjected to NMR studies (1H, 13C, TOCSY and NOESY) and earlier reported GC-MS, 1D(1H & 13C)
and 2D NMR (DQF COSY, HSQC & HMBC) studies. Based on these studies, the assigned structure of the gum kondagogu can be represented as,
→2)α-L-Rhap-(1→4)-α-D-GalpA-(1→4)-α-L-Rhap-
(1→4)-β-D-Galp(1→ 4 3 2
↑ ↑ ↑ 1 1 1
β-D-Galp β-D-GlcpA α-D-Galp
The Smith degradation analysis indicated that the
back bone structure of gum kondagogu to be of α-D-
GalpA-(1→4)-α-L-Rhap and can be grouped under rhamnogalacturonans type of gum, as it is rich in rhamnose, galactose and uronic acids residues. The flow curves of gum kondagogu clearly indicate a Newtonian behaviour above 1.0% of gum concentration in aqueous condition. It is worthwhile to note that the molecular weight of gum kondagogu (native form) is much higher than the values reported for the other tree gums such as Karaya, Tragacanth, Arabic and Guar gum that are currently available in the world market. The unique physicochemical properties of gum kondagogu that include (i) high water binding capacity (ii) high uronic acid content (iii) hydrogel property (iv) Newtonian behaviour and (v) high molecular weight. This natural product is yet to be explored by the food, textile and pharmaceutical industry, as food additive, binder and as a matrix for the controlled release of drugs.
References 1 Verbeken D, Dierchx S and Dewettinck K, Exudate gums:
Occurrence, production, and applications, Appl Microbiol
Biotechnol, 2003, 63(1), 10-21. 2 Aspinall GO, The exudates gums and their structural relation
to other groups of plant polysaccharides (A review), Pure
Appl Chem, 1967, 14(1), 43-55. 3 Silva DA, Feitosi JPA, Maciel JS, Paula HCB and de Paula
RCM, Characterization of crosslinked cashew gum derivatives, Carbohydr Polym, 2006, 66(1), 16-26.
4 Le Cerf D, Irinei F and Muller G, Solution properties of gum exudates from Sterculia urens (Karaya Gum), Carbohydr
Polym, 1990, 13(4), 375-386. 5 Brito ACF, Sierakowski MA, Reicher F, Feitosa JPA and de
Paula RCM, Dynamic rheological study of Sterculia striata and karaya polysaccharide in aqueous solution, Food
Hydrocoll, 2005, 19(5), 861-867. 6 Janaki B and Sashidhar RB, Physico-chemical analysis of
gum kondagogu (Cochlospermum gossypium): A potential food additive, Food Chem, 1998, 61(1-2), 231-236.
7 Vinod VTP, Sashidhar RB, Suresh KI, Rama Rao B, Vijaya Saradhi UVR and Prabhakar Rao T, Morphological, physico-chemical and structural characterization of gum kondagogu
INDIAN J NAT PROD RESOUR, JUNE 2010
192
(Cochlospermum gossypium): A tree gum from India, Food
Hydrocoll, 2008, 22(5), 899-915. 8 Vinod VTP, Sashidhar RB, Sarma UVM and Vijaya Saradhi
UVR, Compositional Analysis and Rheological properties of Gum Kondagogu (Cochlospermum gossypium): A Tree Gum from India, J Agri Food Chem, 2008, 56(6), 2199-2207.
9 AOAC, Official Methods of Analysis of the Association of Analytical Chemists, 14th edn, Sydney Williams, Association of Analytical Chemists. Inc, USA, 1984.
10 Vinod VTP and Sashidhar RB, Solution and Conformational Properties of Gum Kondagogu (Cochlospermum gossypium)–A Natural Product with immense potential as a food additive, Food Chem, 2009, 116(3), 686-92.
11 Medeiros PM and Simoneit BRT, Analysis of sugars in environmental samples by gas chromatography-mass spectrometry, J Chromatgr A, 2007, 1141(2), 271-278.
12 Fishman ML, Cooke PH and Coffin DR, Nanostructure of native pectin sugar acid gels visualized by atomic force microscopy, Biomacromolecules, 2004, 5(2), 334-341.
13 Zhou D, Zhang L and Guo S, Mechanisms of lead biosorption on cellulose/chitin beads, Water Res, 2005, 39(16), 3755-3762.
14 Abdel-Akher M, Hamilton JK, Montgomery R and Smith F, A new procedure for the determination of the fine structure of polysaccharides, J Amer Chem Soc, 1952, 74(19), 4970-4971.
15 Datta AK, Basu S and Roy N, Chemical and immunochemical studies of the O-antigen from enteropathogenic Escherichia coli O158 lipopolysaccharide, Carbohydr Res, 1999, 322(3-4), 219-227.
16 Wang Qi, Ellis PR, and Ross-Murphy SB, Dissolution kinetics of guar gum powders-I. Methods for commercial polydisperse samples, Carbohydr Polym, 2002, 49(2), 131-137.
17 Wang Q, Fllis PR and Ross-Murphy SB, Dissolution kinetics of guar gum powder 11- Effects of concentration and molecular weight, Carbohydr Polym, 2003, 53(1), 75-83.
18 Wang Qi, Ellis PR and Ross- Murphy SB, Dissolution kinetics of guar gum powders- III. Effect of particle size, Carbohydr
Polym, 2006, 64(2), 239-246. 19 Tao F, Biao GZ, Yu JZ and Ning ZH, Isolation and
characterization of an acidic polysaccharide from Mesona
Blumes gum, Carbohydr Polym, 2008, 71(2), 159-169. 20 Sanchez C, Schmitt C, Kolodziejczyk E, Lapp A, Gaillard C
and Renard D, The Acacia gum arabinogalactan fraction is a thin oblate ellipsoid: A new model based on small-angle neutron scattering and Ab initio calculation, Biophy J, 2008, 94(2), 629-639.
21 Ikeda S, Funami T and Zhang G, Visualizing surface-active hydrocolloids by atomic force microscopy, Carbohydr Polym, 2005, 62(2), 192-196.
22 Meer W, In: R Davidson (Ed.), Handbook of water-soluble polysaccharides and resins, Mc Graw-Hill, New York, pp 3-4, 1980.
23 Aspinall GO, Khondo L and Williams BA, The hex-5-enose degradation cleavage of glycosiduronic acid linkage in modified methylated Stericulia gum, Can J Chem, 1986, 65(2), 2069-2076.
24 Ojha AK, Maiti D, Chandra K, Mondal S, Roy DDSK, Ghosh K and Islam SS, Structural assignment of a heteropolysaccharide isolated from the gum of Cochlospermum religiosum (Katira gum), Carbohydr Res, 2008, 343(7), 1222-1231.
25 Agrawal PK, NMR spectroscopy in the structural elucidation of oligosaccarides and glycosides, Phtochemistry, 1992, 31(10), 3307-3330.
26 Verhoef R, de Waard P, Schools HA, Rättö M, Siika-aho M and Voragen AGJ, Structural elucidation of the EPS of slime producing Brevundimonas vesicularis sp. Isolated from a paper machine, Carbohydr Res, 2002, 337(20), 1821-1831.
27 Mohammadifar MA, Musavi SM, Kiumarsi A and Williams PA, Solution properties of tragacanthin (water-soluble part of gum tragacanth exudates from Astragalus gossypinus ), Int J
Biol Macromol, 2006, 38(1), 31-39 28 Oliveira JD, Silva DA, De Paula RCM, Feitosa JPA and Paula
HCB, Composition and effect of salt on rheological and gelation properties of Enterolobium contortisilliquum gum exudates, Int J Biol Macromol, 2001, 29(1), 35-44.
29 Ahmed J and Ramaswamy HS, Effect of high-hydrostatic pressure and concentration on rheological characteristics of xanthan gum, Food Hydrocoll, 2004, 18(3), 367-373.
30 Medina-Torres L, Brito-De La Fuente E, Torrestiana-Sanchez B and Katthain R, Rheological properties of the mucilage gum (Opuntia ficus-indica), Food Hydrocoll, 2000, 14(5), 417-424.
31 Brummer Y, Cui W and Wang Q, Extraction, purification and physicochemical characterization of fenugreek gum, Food
Hydrocoll, 2003, 17(3), 229- 236. 32 Xu X, Liu W and Zhang L, Rheological behavior of
Aeromonas gum in aqueous solutions, Food Hydrocoll, 2006, 20(6), 723-729.
33 Janaki B and Sashidhar RB, Sub-chronic (90-day) toxicity study in rat fed gum kondagogu (Cochlospermum gossypium), Food Chem Toxicol, 2000, 38(6), 523-534.