Embed Size (px)
Citation preview
35ACI Materials Journal/January-February 2014
ACI MATERIALS JOURNAL TECHNICAL PAPER
This study investigates surface waves propagating across a partially closed surface-breaking crack in concrete. The experi-mental program includes three concrete specimens and three test phases. In the first and second test phases, effects of compression and bending on the transmission ratio and phase velocity of surface waves were investigated in crack-free specimens. In the third phase, the surface wave parameters were measured on the specimens with a surface-breaking crack when a compressive load was applied to partially close the crack. Experimental results showed that both the wave transmission and velocity are sensitive to the compressive load when the crack is gradually closed. Variations of the surface wave parameters are presented with the compressive and tensile loads, and crack mouth opening displacement (CMOD). Findings in this study will provide useful information for studying stress wave propagation across a partially closed crack and for applying the surface wave based nondestructive testing methods to actual concrete structures.
Keywords: partially closed surface-breaking crack; surface wave; trans-mission; velocity.
INTRODUCTIONThe ultrasonic pulse velocity (UPV) test is a widely used
nondestructive test (NDT) method for concrete structures. This method is based on measuring the velocity of P-waves in concrete. The measured wave velocity can be correlated to mechanical properties of concrete or used to detect cracks and voids. The procedure and performance of the UPV test have been standardized, and are described in many testing standards.1 In the UPV test, ultrasonic pulses are generated by a transducer on one surface of concrete, and are measured by a second transducer on the same or opposite surface of concrete. The UPV measurement can provide information on concrete quality, uniformity, location of cracked or damaged areas, and strength gain. The ratio of the measured wave velocity to the reference velocity has been demonstrated as a good indicator of the level of deteriorations in material between two sensors.2,3 In addition, the pulse attenuation of ultrasonic waves can be used for evaluating relative quality of concrete, but care is needed to ensure consistent coupling of transducers for reliable measurements.4
Surface-wave based methods have also been used for NDT of concrete due to their one-side access feature. Surface waves are propagating vibrations along the surface of a solid. In semi-infinite media, surface waves are non-dispersive; that is, the wave velocity does not change with frequency. In practical situations, the assumption is still valid when the thickness H of the structure of interest is sufficiently larger than the wavelength λ of the surface waves (H > 2λ). The
particle vibration amplitude of surface waves exponentially decreases with the distance from the free surface boundary with frequency-dependent penetration depth: lower frequency components have deeper penetration depth. This property of surface waves provides valuable information of the presence and the size of sub-surface defects or surface-breaking cracks in concrete. For example, when incident surface waves (R
i) propagate across a surface-breaking
crack, the low frequency components of the incident surface waves will transmit to the forward scattering field with atten-uation (R
tr), while the high-frequency components will be
reflected back (Rr). Consequently, the transmission coeffi-
cient of surface waves (Tr) across a surface-breaking crack, which is defined as the ratio of spectral amplitudes of R
tr
to Ri, depends on frequency (or wavelength) and the crack
depth h. An analytical solution relating Tr and h/λ was given by Achenbach and his colleagues.5-7 This property of surface wave has been used to determine the depth of a surface-breaking crack, and many studies have been published in past three decades.5-13 Recently, the authors14 proposed the air-coupled sensing method that significantly improved signal consistency and test speed in transmission measure-ment of surface waves in concrete.
Most of the studies on surface wave transmission across a surface-breaking crack, however, were obtained from a well-defined crack (or notch) in a laboratory. In fact, there is a critical gap of knowledge between the theory and appli-cation to in-place concrete structures. Cracks in in-service concrete structures subjected to various external loadings are generally ill-defined and partially closed, which means the opening displacement between average planes of the one and the other rough surface are imperfectly closed.15 Kendall and Tabor16 investigated interfacial contact between two solids using multiple methods, including electrical, thermal, optical and ultrasonic assessment. Baltazar et al.17 and Kim et al.18 demonstrated that ultrasonic waves are sensitive to rough surface in contact in aluminum. Pecorari19 investi-gated scattering of surface waves caused by a partially closed surface-breaking crack in aluminum, and explored effects of external loadings on reflection and transmission coefficients of surface waves. Na and Blackshire20 investigated interac-tion of a surface wave with a tightly closed fatigue crack in
Title No. 111-M04
Surface Wave Transmission across a Partially Closed Surface-Breaking Crack in Concreteby Seong-Hoon Kee and Jinying Zhu
ACI Materials Journal, V. 111, No. 1, January-February 2014.MS No. M-2011-406.R2, doi: 10.14359.51686445, received May 22, 2013, and
reviewed under Institute publication policies. Copyright © 2014, American Concrete Institute. All rights reserved, including the making of copies unless permission is obtained from the copyright proprietors. Pertinent discussion including author’s closure, if any, will be published ten months from this journal’s date if the discussion is received within four months of the paper’s print publication.
36 ACI Materials Journal/January-February 2014
aluminum. It was confirmed that stress waves can transmit through the tight crack. Therefore, the surface wave trans-mission theory based on linear analysis cannot be directly applied to tightly closed cracks. For cracks in concrete, Cheng and Sansalone21,22 carried out a series of studies to determine the minimum crack width that can be detected using the impact echo method.4 They found the minimum crack width (of delaminated defects) for which stress waves (P- and S-waves) are not transmitted was 0.003 in. (0.08 mm). The result provides a rough idea about the effect of crack width (or interfacial condition in the crack) on stress wave transmission across a partially closed crack. Aggelis et al.23,24 demonstrated through a series of experimental studies that NDT methods based on surface wave measure-ments are effective for evaluating actual surface-breaking or sub-surface cracks in concrete. Popovics et al.11 reported that transmission coefficients of surface waves across a surface-breaking crack are primarily dependent of discontinuity depth regardless of the nature of the crack; however, the effects of varying external loadings on the interfacial condi-tions in cracks were not taken into account.
The main objective of this study is to investigate surface wave propagation across a partially closed surface-breaking crack in concrete and the effects of stress on surface wave transmission. Three concrete specimens were prepared in laboratory for experimental studies. The experimental program includes three test phases. In the first and second test phases, effects of compression and bending on the transmission coefficients and phase velocity of surface waves were investigated in crack-free specimens. A surface-breaking crack was generated at the end of Phase 2. In the third phase, an axial compressive load was used to gradually close the crack, which simulates a partially closed crack with different interfacial conditions. The effect of crack width on surface wave parameters was investigated.
RESEARCH SIGNIFICANCEThe surface wave transmission method has been verified
as effective for identifying and characterizing a surface-breaking crack in concrete. Most studies on the topic, however, have been limited to well-defined and completely open cracks or notch-type cracks. Therefore, there is a crit-ical gap of knowledge to apply the results from previous studies to tightly closed cracks in real concrete structures. This paper presents a study to investigate the effects of compression stress on surface wave propagation across a partially closed surface-breaking crack in concrete. Findings in this study will provide useful information to extend the surface wave-based NDT methods to practice.
EXPERIMENTAL PROGRAM
Preparation of specimensThree concrete specimens with dimensions of 15.75 x 7.48
x 59.06 in. (b x H x l = 400 x 190 x 1500 mm) were prepared in the laboratory. All of the specimens have the same mate-rial properties and details. Normalweight concrete, made from Type I/II cement, river sand, and coarse aggregate with a maximum size of 0.75 in. (19 mm), was used. The
design compressive strength of the concrete was 3000 psi (20 MPa). Three cylinder specimens were used to measure concrete compressive strength according to ASTM C39. The measured concrete strength at the time of testing ranged from 3240 to 3420 psi (22.3 to 23.58 MPa), with a mean value of 3317 psi (22.84 MPa). P-wave velocities measured with a pair of 54 kHz ultrasonic transducers were in a range of 4331 and 4386 m/s. The dimensions and the measured average concrete strength of specimens at the time of testing are summarized in Table 1. Two layers of longitudinal rein-forcing bars were placed to avoid abrupt collapse of concrete specimens during loadings (Fig. 1(a)). Four and two No. 3 reinforcing bars (0.375 in. diameter [13.3 mm]) were used for the top and bottom layers, respectively. To ensure gener-ation of a single flexural crack in the middle of concrete specimens, the reinforcing bars were unbonded to the concrete by wrapping a thin plastic film of 15.7 in. (40 cm) long on the middle section of reinforcing bars (Fig. 1(a)). After cracking, it is reasonable to assume that concrete in the crack section cannot provide any tensile strength, and only the top reinforcing bars participate in the load-resis-tance mechanism. Assuming a constant strain distribution in the unbounded steel reinforcing bars, shear stresses in the
Table 1—Dimensions, compressive strength of concrete specimens, and crack depth
Specimenno.
Dimensions Material
Crack depth in stress-free concrete
(P3 = 0 kN)
b, mm H, mm L, mm fc,* MPa
hcore
,†
mmh
Tr,‡
mm
1
400 190 1500
22.4 135 125
2 23.2 120 93
3 23.5 180 135
*fc is average concrete compressive strength measured at time of testing.
†hcore
is crack depth directly read from core samples.‡h
Tr is crack depth estimated using surface wave transmission coefficient.
Notes: 1 mm = 1/25.4 in.; 1MPa = 145.0377 psi.
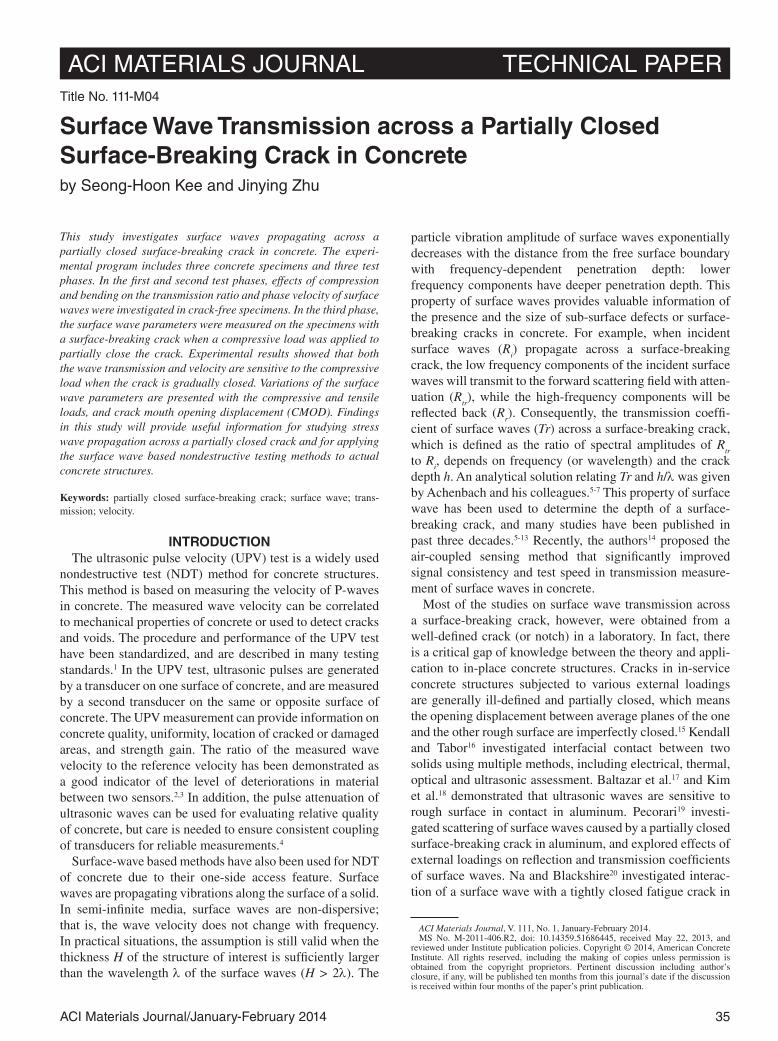
Fig. 1—Detail of a concrete specimen and testing proce-dure: (a) applying external compression P
1; (b) applying
point load P2 using three-point bending setup and generating
a vertical surface-breaking crack; and (c) applying external compression P
3 to close the crack and induce various inter-
facial conditions in the crack.

37ACI Materials Journal/January-February 2014
unbounded concrete region disappear after cracking, which prevents initiation of additional shear cracks or other flex-ural cracks in the middle of the concrete specimens. Conse-quently, a single vertical surface-breaking crack will occur on the midsection of the specimens. In addition, transverse reinforcing bars (No. 3) were placed to avoid abrupt shear failure and to ensure flexural failure of the beam.
Testing procedure and setupThe testing procedure includes three phases, as illustrated
in Fig. 1. In each test phase, the external load (P1, P
2, or
P3) gradually increased with several steps. Figure 2 illus-
trates the setup of external post-tensioning (to apply axial compression force in Test Phases I and III) and three-point bending (to generate a flexural crack in Test Phase II). During each test phase, surface wave transmission and velocity
Fig. 2—Test setup for applying compressive forces, generating a surface-breaking crack, and measuring surface waves: (a) elevation view; (b) plan view of test setup from Section A-A′ in Fig. 2(a); and (c) test setup of air-coupled sensors and dial gauge on test region.
38 ACI Materials Journal/January-February 2014
were measured on the top surface of the specimens at each loading step. Surface waves were generated by impacting the top concrete surface with a steel ball, and measured by two air-coupled sensors14,25 (Fig. 2(c)). Specifics of surface wave measurements are described in the section entitled “Surface wave measurement.” Procedures of the static test are described in more detail as follows.
In Test Phase I, a compression load P1 was applied at the
ends of the crack-free specimens using the external post-ten-sioning setup (Fig. 2(a) and (b)). The compressive load P
1
monotonically increased from 0 to 24 kips (106.7 kN) with seven steps: 0, 4, 8, 12, 16, 20, and 24 kips (0, 17.8, 35.6, 53.3, 71.1, 88.9, and 106.7 kN). The maximum load was approximately 10% of the nominal compressive strength of the concrete specimens. Two loading rams (LR 1 and 2 in Fig. 2(b)), controlled by a hydraulic pump, were used to apply the external loads, the magnitude of which was moni-tored by two load cells (LC 1 and 2 in Fig. 2(b)) attached to the two loading rams, respectively. In addition, rubber pads were used to prevent stress concentration at the concrete-steel interface. The internal stress at the midsection of each specimen due to P
1 was assumed constant through the cross
section as
σ = P
1/A
g (1)
where Ag is the gross section area of concrete specimens.
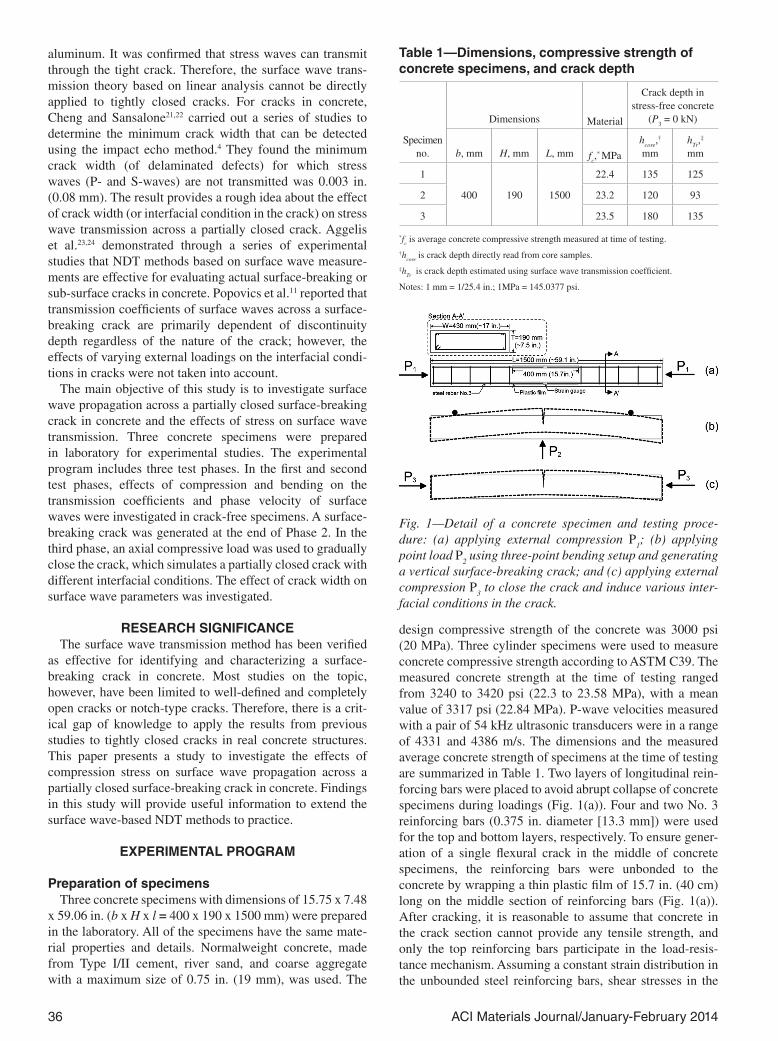
This assumption is valid because the measured strains at the top and bottom reinforcing bars showed very little eccen-tricity during Test Phase I (Fig. 3). At the end of Test Phase I, the compressive load P
1 was completely released.
In Test Phase II, an upward point load P2 was applied on
the bottom surface of the specimens by using a hydraulic loading ram (LR 3) installed on the strong floor in the labo-ratory (Fig. 2(a)). The point load P
2 was gradually increased
from 0 with four to five steps until a sudden drop of P2 was
measured on the force-displacement curves P2-d
c of the
specimens, where dc is the center deflection of the specimens
measured using two linear variable differential transformers
(LVDTs) placed under the middle section of the specimens during testing. A sudden drop of P
2 indicates an onset of a
flexural crack on the top concrete surface. A load cell (LC 3) was positioned on the LR 3 for monitoring the magnitude of P
2 during Test Phase II. One steel bearing plate was placed
on the top of the load cell (LC 3), and another plate was placed on the bottom surface of the specimens. A spherical head was placed between these two plates to ensure proper alignment of the top bearing plate relative to the concrete surface during testing. Two groups of bolts, each of which includes four 1 in. (2.54 cm) diameter high-strength rods and bolts, were used to resist the loadings applied to the spec-imens at one support by using back-to-back channels that straddled the specimens (Fig. 2(a)).
Before cracking, the behavior of concrete specimens was in elastic range. Thus, the stress distribution caused by P
2
can be expressed as follows
σ =
3 23
P l
bHy
(2)
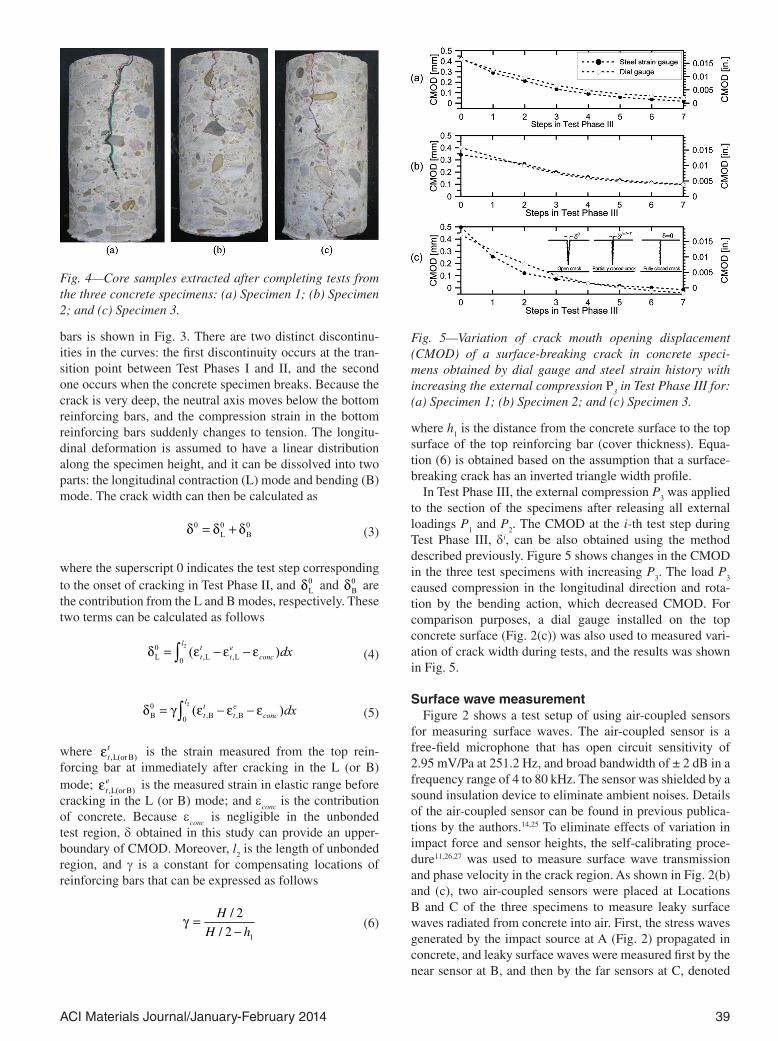
where y is the distance from a neutral axis of the section; l is the span length of the specimens (that is, center-to-center distance between supports); and b and H are the width and the thickness of the specimens, respectively. The test setup of Phase II shown in Fig. 2 was effective for generating a single vertical surface-breaking crack in the midsection of the concrete specimens. Crack propagation was in a brittle manner due to a low reinforcement ratio across the section of the specimens. Once a crack developed, the resisting force monitored by the LC 3 suddenly dropped. The initial depths and widths (crack mouth opening displacement [CMOD]) of surface-breaking cracks were measured on the vertical surface of specimens after cracking. The crack depths measured on Specimens 1 and 2 were approximately 5.31 and 4.72 in. (135 and 120 mm), respectively. For Spec-imen 3, because the LR 3 was further moved upward over the peak displacement, a deeper crack with a depth approx-imately 7.08 in. (180 mm) was induced. In addition, core samples were extracted from the specimens after testing, and the crack depths measured on the core samples have good agreement with the depth measured on the vertical surface of specimens (Fig. 4). Details of CMOD measurement are described in the following section.
In Test Phase III, a compression load P3 was applied at
the ends of the concrete specimens with a surface-breaking crack using the external post-tensioning setup (Fig. 2(a) and (b)). As in Test Phase I, the compressive load monotonically increased from 0 to 24 kips (106.7 kN) with seven steps (0, 4, 8, 12, 16, 20, and 24 kips [0, 17.8, 35.6, 53.3, 71.1, 88.9, and 106.7 kN]), which consequently decreased the CMOD and resulted in various interfacial contact conditions in a surface-breaking crack.
Calculation of CMODThe crack width δ, or CMOD, was calculated by using
strain history measured from the top and bottom reinforcing bars. A typical strain history for top and bottom reinforcing
Fig. 3—Typical steel strain history during Test Phases I, II, and III measured from Specimen 1.
39ACI Materials Journal/January-February 2014
bars is shown in Fig. 3. There are two distinct discontinu-ities in the curves: the first discontinuity occurs at the tran-sition point between Test Phases I and II, and the second one occurs when the concrete specimen breaks. Because the crack is very deep, the neutral axis moves below the bottom reinforcing bars, and the compression strain in the bottom reinforcing bars suddenly changes to tension. The longitu-dinal deformation is assumed to have a linear distribution along the specimen height, and it can be dissolved into two parts: the longitudinal contraction (L) mode and bending (B) mode. The crack width can then be calculated as
δ δ δ0 0 0= +L B (3)
where the superscript 0 indicates the test step corresponding to the onset of cracking in Test Phase II, and δL
0 and δB0 are
the contribution from the L and B modes, respectively. These two terms can be calculated as follows
δ ε ε εL L L0
0
2= − −∫ ( ), ,tt
te
conc
ldx
(4)
δ γ ε ε εB B B0
0
2= − −∫ ( ), ,tt
te
conc
ldx
(5)
where εtt, )L(orB is the strain measured from the top rein-
forcing bar at immediately after cracking in the L (or B) mode; εt
e, )L(orB is the measured strain in elastic range before
cracking in the L (or B) mode; and εconc
is the contribution of concrete. Because ε
conc is negligible in the unbonded
test region, δ obtained in this study can provide an upper-boundary of CMOD. Moreover, l
2 is the length of unbonded
region, and γ is a constant for compensating locations of reinforcing bars that can be expressed as follows
γ =
−H
H h
/
/
2
2 1 (6)
where h1 is the distance from the concrete surface to the top
surface of the top reinforcing bar (cover thickness). Equa-tion (6) is obtained based on the assumption that a surface-breaking crack has an inverted triangle width profile.
In Test Phase III, the external compression P3 was applied
to the section of the specimens after releasing all external loadings P
1 and P
2. The CMOD at the i-th test step during
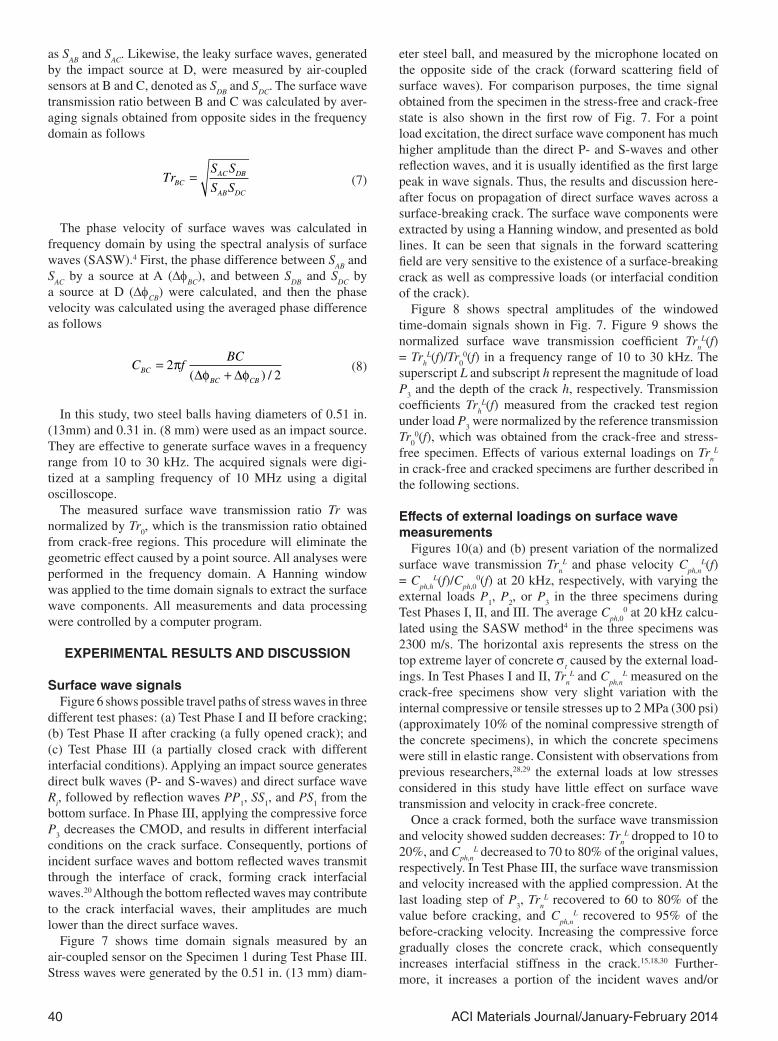
Test Phase III, δi, can be also obtained using the method described previously. Figure 5 shows changes in the CMOD in the three test specimens with increasing P
3. The load P
3
caused compression in the longitudinal direction and rota-tion by the bending action, which decreased CMOD. For comparison purposes, a dial gauge installed on the top concrete surface (Fig. 2(c)) was also used to measured vari-ation of crack width during tests, and the results was shown in Fig. 5.
Surface wave measurementFigure 2 shows a test setup of using air-coupled sensors
for measuring surface waves. The air-coupled sensor is a free-field microphone that has open circuit sensitivity of 2.95 mV/Pa at 251.2 Hz, and broad bandwidth of ± 2 dB in a frequency range of 4 to 80 kHz. The sensor was shielded by a sound insulation device to eliminate ambient noises. Details of the air-coupled sensor can be found in previous publica-tions by the authors.14,25 To eliminate effects of variation in impact force and sensor heights, the self-calibrating proce-dure11,26,27 was used to measure surface wave transmission and phase velocity in the crack region. As shown in Fig. 2(b) and (c), two air-coupled sensors were placed at Locations B and C of the three specimens to measure leaky surface waves radiated from concrete into air. First, the stress waves generated by the impact source at A (Fig. 2) propagated in concrete, and leaky surface waves were measured first by the near sensor at B, and then by the far sensors at C, denoted
Fig. 4—Core samples extracted after completing tests from the three concrete specimens: (a) Specimen 1; (b) Specimen 2; and (c) Specimen 3.
Fig. 5—Variation of crack mouth opening displacement (CMOD) of a surface-breaking crack in concrete speci-mens obtained by dial gauge and steel strain history with increasing the external compression P
3 in Test Phase III for:
(a) Specimen 1; (b) Specimen 2; and (c) Specimen 3.
40 ACI Materials Journal/January-February 2014
as SAB
and SAC
. Likewise, the leaky surface waves, generated by the impact source at D, were measured by air-coupled sensors at B and C, denoted as S
DB and S
DC. The surface wave
transmission ratio between B and C was calculated by aver-aging signals obtained from opposite sides in the frequency domain as follows
TrS S
S SBCAC DB
AB DC
=
(7)
The phase velocity of surface waves was calculated in frequency domain by using the spectral analysis of surface waves (SASW).4 First, the phase difference between S
AB and
SAC
by a source at A (ΔφBC
), and between SDB
and SDC
by a source at D (Δφ
CB) were calculated, and then the phase
velocity was calculated using the averaged phase difference as follows
C f
BCBC
BC CB
=+
22
πφ φ( ) /∆ ∆
(8)
In this study, two steel balls having diameters of 0.51 in. (13mm) and 0.31 in. (8 mm) were used as an impact source. They are effective to generate surface waves in a frequency range from 10 to 30 kHz. The acquired signals were digi-tized at a sampling frequency of 10 MHz using a digital oscilloscope.
The measured surface wave transmission ratio Tr was normalized by Tr
0, which is the transmission ratio obtained
from crack-free regions. This procedure will eliminate the geometric effect caused by a point source. All analyses were performed in the frequency domain. A Hanning window was applied to the time domain signals to extract the surface wave components. All measurements and data processing were controlled by a computer program.
EXPERIMENTAL RESULTS AND DISCUSSION
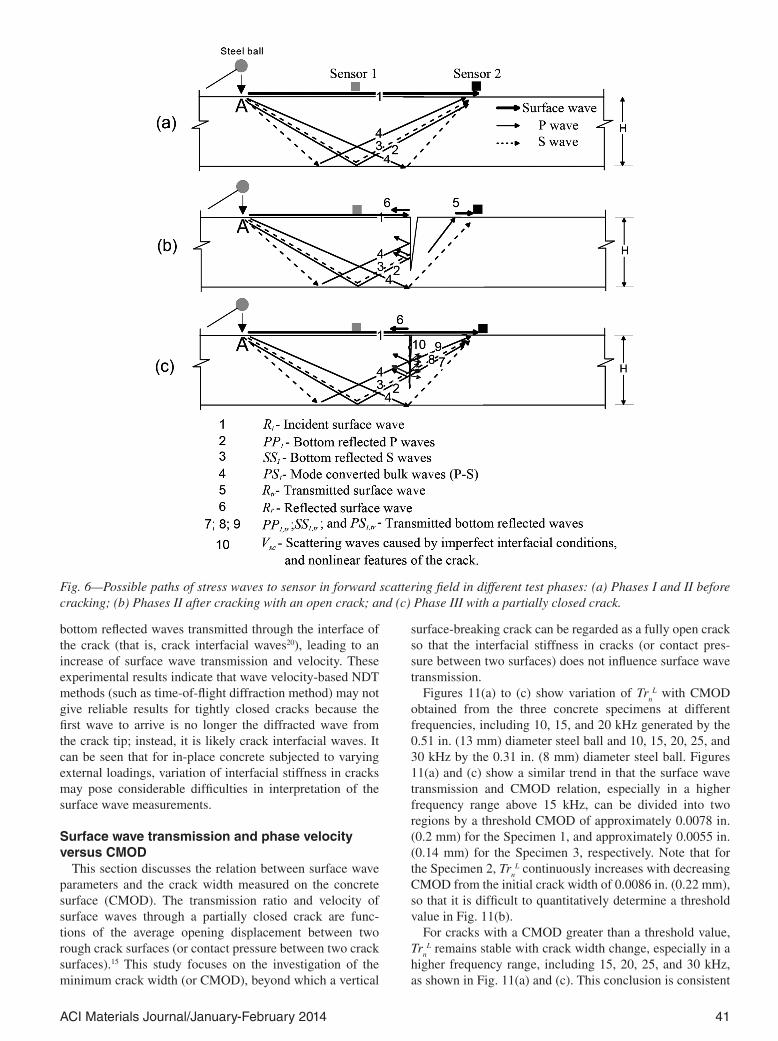
Surface wave signalsFigure 6 shows possible travel paths of stress waves in three
different test phases: (a) Test Phase I and II before cracking; (b) Test Phase II after cracking (a fully opened crack); and (c) Test Phase III (a partially closed crack with different interfacial conditions). Applying an impact source generates direct bulk waves (P- and S-waves) and direct surface wave R
i, followed by reflection waves PP
1, SS
1, and PS
1 from the
bottom surface. In Phase III, applying the compressive force P
3 decreases the CMOD, and results in different interfacial
conditions on the crack surface. Consequently, portions of incident surface waves and bottom reflected waves transmit through the interface of crack, forming crack interfacial waves.20 Although the bottom reflected waves may contribute to the crack interfacial waves, their amplitudes are much lower than the direct surface waves.
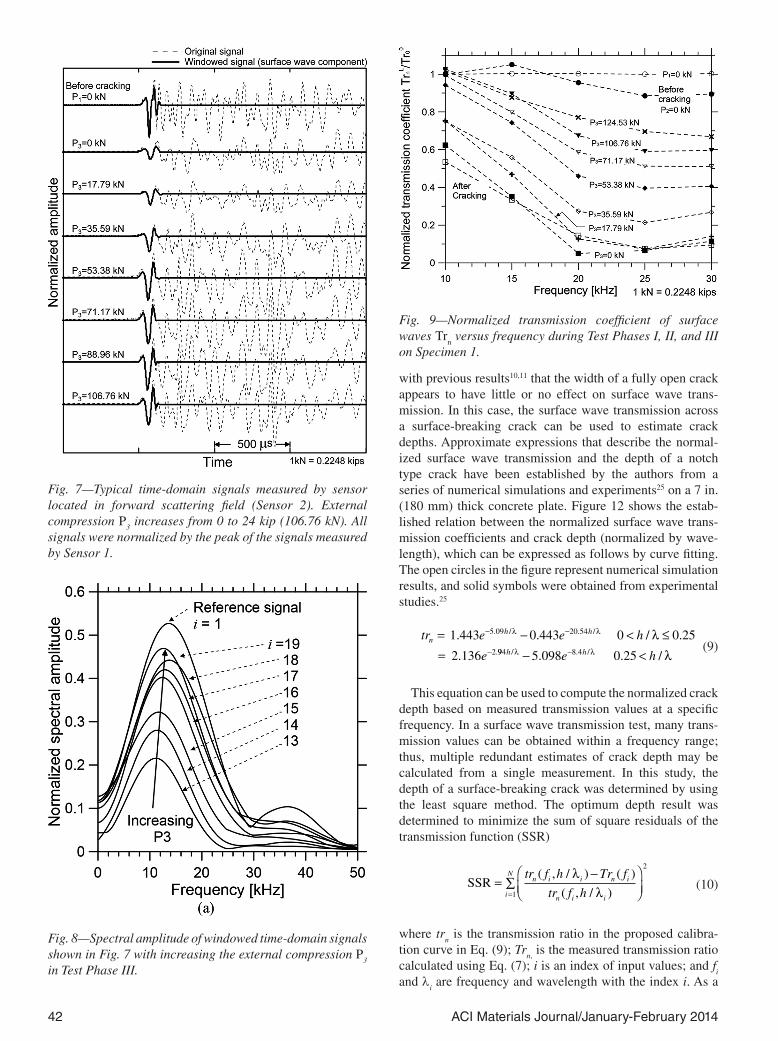
Figure 7 shows time domain signals measured by an air-coupled sensor on the Specimen 1 during Test Phase III. Stress waves were generated by the 0.51 in. (13 mm) diam-
eter steel ball, and measured by the microphone located on the opposite side of the crack (forward scattering field of surface waves). For comparison purposes, the time signal obtained from the specimen in the stress-free and crack-free state is also shown in the first row of Fig. 7. For a point load excitation, the direct surface wave component has much higher amplitude than the direct P- and S-waves and other reflection waves, and it is usually identified as the first large peak in wave signals. Thus, the results and discussion here-after focus on propagation of direct surface waves across a surface-breaking crack. The surface wave components were extracted by using a Hanning window, and presented as bold lines. It can be seen that signals in the forward scattering field are very sensitive to the existence of a surface-breaking crack as well as compressive loads (or interfacial condition of the crack).
Figure 8 shows spectral amplitudes of the windowed time-domain signals shown in Fig. 7. Figure 9 shows the normalized surface wave transmission coefficient Tr
nL(f)
= Trh
L(f)/Tr00(f) in a frequency range of 10 to 30 kHz. The
superscript L and subscript h represent the magnitude of load P
3 and the depth of the crack h, respectively. Transmission
coefficients Trh
L(f) measured from the cracked test region under load P
3 were normalized by the reference transmission
Tr0
0(f), which was obtained from the crack-free and stress-free specimen. Effects of various external loadings on Tr
nL
in crack-free and cracked specimens are further described in the following sections.
Effects of external loadings on surface wave measurements
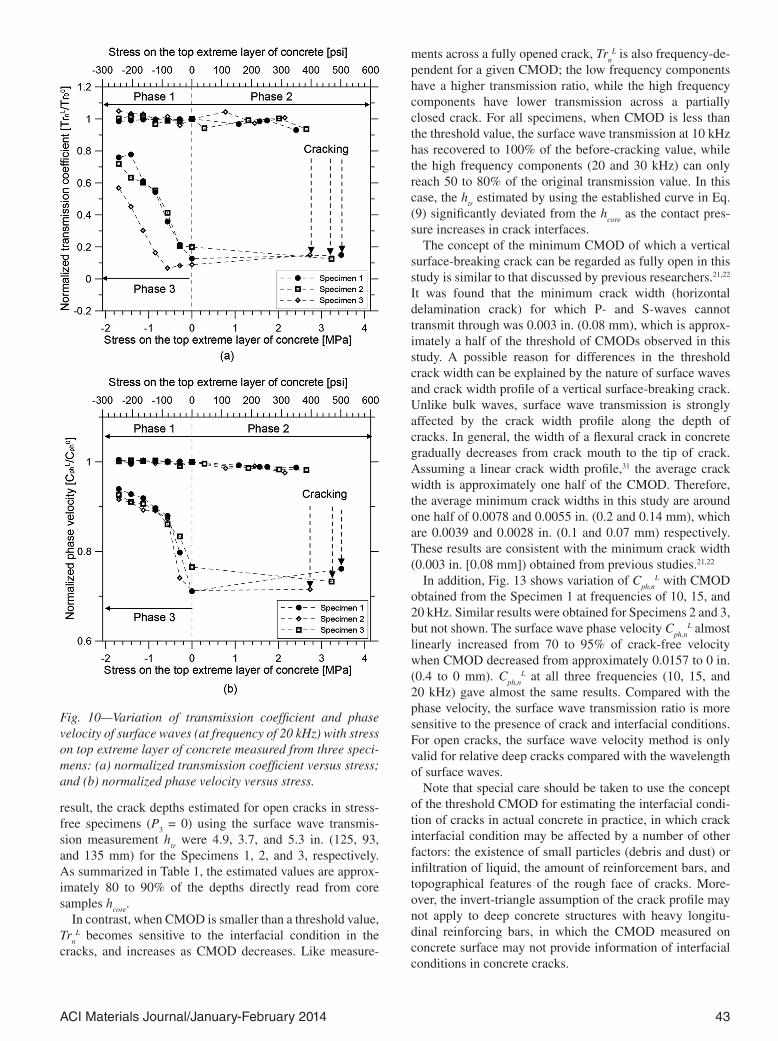
Figures 10(a) and (b) present variation of the normalized surface wave transmission Tr
nL and phase velocity C
ph,nL(f)
= Cph,h
L(f)/Cph,0
0(f) at 20 kHz, respectively, with varying the external loads P
1, P
2, or P
3 in the three specimens during
Test Phases I, II, and III. The average Cph,0
0 at 20 kHz calcu-lated using the SASW method4 in the three specimens was 2300 m/s. The horizontal axis represents the stress on the top extreme layer of concrete σ
t caused by the external load-
ings. In Test Phases I and II, Trn
L and Cph,n
L measured on the crack-free specimens show very slight variation with the internal compressive or tensile stresses up to 2 MPa (300 psi) (approximately 10% of the nominal compressive strength of the concrete specimens), in which the concrete specimens were still in elastic range. Consistent with observations from previous researchers,28,29 the external loads at low stresses considered in this study have little effect on surface wave transmission and velocity in crack-free concrete.
Once a crack formed, both the surface wave transmission and velocity showed sudden decreases: Tr
nL dropped to 10 to
20%, and Cph,n
L decreased to 70 to 80% of the original values, respectively. In Test Phase III, the surface wave transmission and velocity increased with the applied compression. At the last loading step of P
3, Tr
nL recovered to 60 to 80% of the
value before cracking, and Cph,n
L recovered to 95% of the before-cracking velocity. Increasing the compressive force gradually closes the concrete crack, which consequently increases interfacial stiffness in the crack.15,18,30 Further-more, it increases a portion of the incident waves and/or
41ACI Materials Journal/January-February 2014
bottom reflected waves transmitted through the interface of the crack (that is, crack interfacial waves20), leading to an increase of surface wave transmission and velocity. These experimental results indicate that wave velocity-based NDT methods (such as time-of-flight diffraction method) may not give reliable results for tightly closed cracks because the first wave to arrive is no longer the diffracted wave from the crack tip; instead, it is likely crack interfacial waves. It can be seen that for in-place concrete subjected to varying external loadings, variation of interfacial stiffness in cracks may pose considerable difficulties in interpretation of the surface wave measurements.
Surface wave transmission and phase velocity versus CMOD
This section discusses the relation between surface wave parameters and the crack width measured on the concrete surface (CMOD). The transmission ratio and velocity of surface waves through a partially closed crack are func-tions of the average opening displacement between two rough crack surfaces (or contact pressure between two crack surfaces).15 This study focuses on the investigation of the minimum crack width (or CMOD), beyond which a vertical
surface-breaking crack can be regarded as a fully open crack so that the interfacial stiffness in cracks (or contact pres-sure between two surfaces) does not influence surface wave transmission.
Figures 11(a) to (c) show variation of Trn
L with CMOD obtained from the three concrete specimens at different frequencies, including 10, 15, and 20 kHz generated by the 0.51 in. (13 mm) diameter steel ball and 10, 15, 20, 25, and 30 kHz by the 0.31 in. (8 mm) diameter steel ball. Figures 11(a) and (c) show a similar trend in that the surface wave transmission and CMOD relation, especially in a higher frequency range above 15 kHz, can be divided into two regions by a threshold CMOD of approximately 0.0078 in. (0.2 mm) for the Specimen 1, and approximately 0.0055 in. (0.14 mm) for the Specimen 3, respectively. Note that for the Specimen 2, Tr
nL continuously increases with decreasing
CMOD from the initial crack width of 0.0086 in. (0.22 mm), so that it is difficult to quantitatively determine a threshold value in Fig. 11(b).
For cracks with a CMOD greater than a threshold value, Tr
nL remains stable with crack width change, especially in a
higher frequency range, including 15, 20, 25, and 30 kHz, as shown in Fig. 11(a) and (c). This conclusion is consistent
Fig. 6—Possible paths of stress waves to sensor in forward scattering field in different test phases: (a) Phases I and II before cracking; (b) Phases II after cracking with an open crack; and (c) Phase III with a partially closed crack.
42 ACI Materials Journal/January-February 2014
with previous results10,11 that the width of a fully open crack appears to have little or no effect on surface wave trans-mission. In this case, the surface wave transmission across a surface-breaking crack can be used to estimate crack depths. Approximate expressions that describe the normal-ized surface wave transmission and the depth of a notch type crack have been established by the authors from a series of numerical simulations and experiments25 on a 7 in. (180 mm) thick concrete plate. Figure 12 shows the estab-lished relation between the normalized surface wave trans-mission coefficients and crack depth (normalized by wave-length), which can be expressed as follows by curve fitting. The open circles in the figure represent numerical simulation results, and solid symbols were obtained from experimental studies.25
tr e e h
en
h h= − < ≤=
− −
−
1 443 0 443 0 0 25
2 136
5 09 20 54
2
. . / .
.
. / . /
.
λ λ λ 994 8 45 098 0 25h he h/ . /. . /λ λ λ− <−
(9)
This equation can be used to compute the normalized crack depth based on measured transmission values at a specific frequency. In a surface wave transmission test, many trans-mission values can be obtained within a frequency range; thus, multiple redundant estimates of crack depth may be calculated from a single measurement. In this study, the depth of a surface-breaking crack was determined by using the least square method. The optimum depth result was determined to minimize the sum of square residuals of the transmission function (SSR)
SSR =−
∑=
tr f h Tr f
tr f hn i i n i
n i ii
N ( , / ) ( )
( , / )
λλ
2
1
(10)
where trn is the transmission ratio in the proposed calibra-
tion curve in Eq. (9); Trn, is the measured transmission ratio
calculated using Eq. (7); i is an index of input values; and fi
and λi are frequency and wavelength with the index i. As a
Fig. 7—Typical time-domain signals measured by sensor located in forward scattering field (Sensor 2). External compression P
3 increases from 0 to 24 kip (106.76 kN). All
signals were normalized by the peak of the signals measured by Sensor 1.
Fig. 8—Spectral amplitude of windowed time-domain signals shown in Fig. 7 with increasing the external compression P
3
in Test Phase III.
Fig. 9—Normalized transmission coefficient of surface waves Tr
n versus frequency during Test Phases I, II, and III
on Specimen 1.
43ACI Materials Journal/January-February 2014
result, the crack depths estimated for open cracks in stress-free specimens (P
3 = 0) using the surface wave transmis-
sion measurement htr were 4.9, 3.7, and 5.3 in. (125, 93,
and 135 mm) for the Specimens 1, 2, and 3, respectively. As summarized in Table 1, the estimated values are approx-imately 80 to 90% of the depths directly read from core samples h
core.
In contrast, when CMOD is smaller than a threshold value, Tr
nL becomes sensitive to the interfacial condition in the
cracks, and increases as CMOD decreases. Like measure-
ments across a fully opened crack, Trn
L is also frequency-de-pendent for a given CMOD; the low frequency components have a higher transmission ratio, while the high frequency components have lower transmission across a partially closed crack. For all specimens, when CMOD is less than the threshold value, the surface wave transmission at 10 kHz has recovered to 100% of the before-cracking value, while the high frequency components (20 and 30 kHz) can only reach 50 to 80% of the original transmission value. In this case, the h
tr estimated by using the established curve in Eq.
(9) significantly deviated from the hcore
as the contact pres-sure increases in crack interfaces.
The concept of the minimum CMOD of which a vertical surface-breaking crack can be regarded as fully open in this study is similar to that discussed by previous researchers.21,22 It was found that the minimum crack width (horizontal delamination crack) for which P- and S-waves cannot transmit through was 0.003 in. (0.08 mm), which is approx-imately a half of the threshold of CMODs observed in this study. A possible reason for differences in the threshold crack width can be explained by the nature of surface waves and crack width profile of a vertical surface-breaking crack. Unlike bulk waves, surface wave transmission is strongly affected by the crack width profile along the depth of cracks. In general, the width of a flexural crack in concrete gradually decreases from crack mouth to the tip of crack. Assuming a linear crack width profile,31 the average crack width is approximately one half of the CMOD. Therefore, the average minimum crack widths in this study are around one half of 0.0078 and 0.0055 in. (0.2 and 0.14 mm), which are 0.0039 and 0.0028 in. (0.1 and 0.07 mm) respectively. These results are consistent with the minimum crack width (0.003 in. [0.08 mm]) obtained from previous studies.21,22
In addition, Fig. 13 shows variation of Cph,n
L with CMOD obtained from the Specimen 1 at frequencies of 10, 15, and 20 kHz. Similar results were obtained for Specimens 2 and 3, but not shown. The surface wave phase velocity C
ph,nL almost
linearly increased from 70 to 95% of crack-free velocity when CMOD decreased from approximately 0.0157 to 0 in. (0.4 to 0 mm). C
ph,nL at all three frequencies (10, 15, and
20 kHz) gave almost the same results. Compared with the phase velocity, the surface wave transmission ratio is more sensitive to the presence of crack and interfacial conditions. For open cracks, the surface wave velocity method is only valid for relative deep cracks compared with the wavelength of surface waves.
Note that special care should be taken to use the concept of the threshold CMOD for estimating the interfacial condi-tion of cracks in actual concrete in practice, in which crack interfacial condition may be affected by a number of other factors: the existence of small particles (debris and dust) or infiltration of liquid, the amount of reinforcement bars, and topographical features of the rough face of cracks. More-over, the invert-triangle assumption of the crack profile may not apply to deep concrete structures with heavy longitu-dinal reinforcing bars, in which the CMOD measured on concrete surface may not provide information of interfacial conditions in concrete cracks.
Fig. 10—Variation of transmission coefficient and phase velocity of surface waves (at frequency of 20 kHz) with stress on top extreme layer of concrete measured from three speci-mens: (a) normalized transmission coefficient versus stress; and (b) normalized phase velocity versus stress.

44 ACI Materials Journal/January-February 2014
Fig. 11—Normalized transmission coefficient of surface waves versus CMOD in Test Phase III on: (a) Specimen 1; (b) Spec-imen 2; and (c) Specimen 3.
Fig. 12—Trn versus h/λ obtained from numerical simulation
and experiments on concrete plate with thickness of 180 mm (7.0 in.) having notches with various depths.25
Fig. 13—Normalized phase velocity of surface waves versus CMOD in Test Phase III (Specimen 1).
45ACI Materials Journal/January-February 2014
SUMMARY AND CONCLUSIONSIn this paper, experimental results are presented to inves-
tigate effects of external loadings on surface wave transmis-sion and velocity across a partially closed surface-breaking crack in concrete. The conclusions are summarized as follows:
1. In the crack-free region, the external loading has little effect on measurements of surface waves, compared with the changes caused by cracks. Therefore, acoustoelastic effect is neglected in this study.
2. When a crack was gradually closed by the compres-sive force P
3, both surface wave transmission and phase
velocity monotonically increase with the load. It implies that a portion of the incident surface wave can directly transmit through the crack surfaces. The surface wave transmission is more sensitive to crack width change than the phase velocity. When CMOD decreased from 0.0157 to 0 in. (0.4 to 0 mm), Tr
nL increased from 10 to 90%, while C
ph,nL changed from
70 to 95% of the original value. This experimental result also indicates that stress wave velocity-based NDT methods (such as time of flight method) will not give reliable results for tightly closed cracks.
3. Surface wave transmission still shows frequency-de-pendent property across a partially or tightly closed crack, while the phase velocity is independent of frequencies.
4. Experimental results reveal that there is a threshold CMOD beyond which crack width has little effect on Tr
nL.
For cracks with CMOD greater than a threshold value of 0.0078 in. (0.2 mm) for Specimens 1 and 2, and 0.0055 in. (0.14 mm) for Specimen 3, Tr
nL remains stable with crack
width change. The crack can be regarded as a fully opened crack, and the surface transmission method can be used to measure the depth of a surface-breaking crack.
5. For open cracks in stress-free specimens (P3 = 0), the
crack depths estimated using the surface wave transmis-sion measurements show reasonably good agreement with the depths directly read from core samples h
core in concrete
specimens. The surface wave transmission method, however, significantly underestimates the crack depth in concrete specimens under increasing compressive loadings. There-fore, special care should be taken for characterizing crack depths in actual concrete structures subjected to external loadings.
AUTHOR BIOSACI member Seong-Hoon Kee is a Postdoctoral Research Associate at the Center for Advanced Infrastructure and Transportation (CAIT), Rutgers, the State University of New Jersey, New Brunswick, NJ. He received his PhD in civil engineering from the University of Texas at Austin, Austin, TX. He was a recipient of the ACI-James Instruments Student Award for Research on NDT of Concrete in 2011. His research interests include auto-mated nondestructive testing, structural health monitoring, and chloride- induced deterioration of concrete.
ACI member Jinying Zhu is an Assistant Professor in the Department of Civil, Architectural and Environmental Engineering at the University of Texas at Austin. She received her PhD in civil engineering from the Univer-sity of Illinois at Urbana-Champaign, Champaign, IL. She is a member of ACI Committees 123, Research and Current Developments; 228, Nonde-structive Testing of Concrete; and 231, Properties of Concrete at Early Ages. Her research interests include nondestructive testing of concrete and material characterization using ultrasonic waves.
REFERENCES1. Komlos, K.; Popovics, S.; Nurnbergerova, T.; Babal, B.; and Popovics,
J. S., “Ultrasonic Pulse Velocity Test of Concrete Properties as Specified in Various Standards,” Cement and Concrete Research, V. 18, 1996, pp. 357-364.
2. Tomsett, H. N., “The Practical Use of Ultrasonic Pulse Velocity Measurements in the Assessment of Concrete Quality,” Magazine of Concrete Research, V. 32, No. 110, 1980, pp. 7-16.
3. Yaman, I. O.; Inci, G.; Yesiller, N.; and Aktan, H. M., “Ultrasonic Pulse Velocity in Concrete Using Direct and Indirect Transmission,” ACI Materials Journal, V. 98, No. 6, Nov.-Dec. 2001, pp. 450-457.
4. ACI Committee 228, “Nondestructive Test Methods for Evaluation of Concrete in Structures (ACI 228.2R-98),” American Concrete Institute, Farmington Hills, MI, 1998, 62 pp.
5. Achenbach, J. D.; Keer, L. M.; and Mendelsohn, D. A., “Elastody-namic Analysis of an Edge Crack,” Journal of Applied Mechanics, V. 47, No. 3, 1980, pp. 551-556.
6. Angel, Y. C., and Achenbach, J. D., “Reflection and Transmission of Obliquely Incident Rayleigh Waves by a Surface-Breaking Crack,” The Journal of the Acoustical Society of America, V. 75, No. 2, 1984, pp. 313-319.
7. Mendelsohn, D. A.; Achenbach, J. D.; and Keer, L. M., “Scattering of Elastic Waves by a Surface-Breaking Crack,” Wave Motion, V. 2, No. 3, 1980, pp. 277-292.
8. Cheng, A., and Achenbach, J. D., “A Roller Device to Scan for Surface-Breaking Cracks and to Determine Crack Depth by a Self-Cali-brating Ultrasonic Technique,” Research in Nondestructive Evaluation, V. 7, No. 4, 1996, pp. 185-194.
9. Hevin, G.; Abraham, O.; Petersen, H. A.; and Campillo, M., “Charac-terization of Surface Cracks with Rayleigh Waves: A Numerical Model,” NDT & E International, V. 31, No. 4, 1998, pp. 289-298.
10. Masserey, B., and Mazza, E., “Analysis of the Near-Field Ultrasonic Scattering at a Surface Crack,” The Journal of the Acoustical Society of America, V. 118, No. 6, 2005, pp. 3585-3594.
11. Popovics, J. S., “Song. W. J.; Ghandehari, M.; Subramaniam, K. V.; Achenbach, J. D.; and Shah, S. P., “Application of Surface Wave Trans-mission Measurements for Crack Depth Determination in Concrete,” ACI Materials Journal, V. 97, No. 2, Mar.-Apr. 2000, pp. 127-135.
12. Song, W. J.; Popovics, J. S.; Aldrin, J. C.; and Shah, S. P., “Measure-ment of Surface Wave Transmission Coefficient across Surface-Breaking Cracks and Notches in Concrete,” The Journal of the Acoustical Society of America, V. 113, No. 2, 2003, pp. 717-725.
13. Yew, C. H.; Chen, K. G.; and Wang, D. L., “An Experimental Study of Interaction between Surface Waves and a Surface Breaking Crack,” The Journal of the Acoustical Society of America, V. 75, No. 1, 1984, pp. 189-196.
14. Kee, S. H., and Zhu, J., “Using Air-Coupled Sensors to Determine the Depth of a Surface-Breaking Crack in Concrete,” The Journal of the Acoustical Society of America, V. 127, No. 3, Mar. 2010, pp. 1279-1287.
15. Kim, J.-Y., and Lee, J.-S., “A Micromechanical Model for Nonlinear Acoustic Properties of Interfaces between Solids,” Journal of Applied Physics, V. 101, No. 043501, 2007, 9 pp.
16. Kendall, K., and Tabor, D., “An Ultrasonic Study of the Area of Contact between Stationary and Sliding Surfaces,” Proceedings of the Royal Society of London. Series A, Mathematical and Physical Sciences, V. 323, No. 1554, 1971, pp. 321-340.
17. Baltazar, A.; Rokhlin, S. I.; and Pecorari, C., “On the Relationship between Ultrasonic and Micromechanical Properties of Contacting Rough Surfaces,” Journal of the Mechanics and Physics of Solids, V. 50, No. 7, 2002, pp. 1397-1416.
18. Kim, J. Y.; Baltazar, A.; and Rokhlin, S. I., “Ultrasonic Assessment of Rough Surface Contact between Solids from Elastoplastic Loading-Un-loading Hysteresis Cycle,” Journal of the Mechanics and Physics of Solids, V. 52, No. 8, 2004, pp. 1911-1934.
19. Pecorari, C., “Scattering of a Rayleigh Wave by a Surface-Breaking Crack with Faces in Partial Contact,” Wave Motion, V. 33, No. 3, 2001, pp. 259-270.
20. Na, J. K., and Blackshire, J. L., “Interaction of Rayleigh Surface Waves with a Tightly Closed Fatigue Crack,” NDT & E International, V. 43, No. 5, 2010, pp. 432-439.
21. Cheng, C.-C., and Sansalone, M., “Determining the Minimum Crack Width That Can Be Detected Using the Impact-Echo Method Part 1: Exper-imental Study,” Materials and Structures, V. 28, No. 2, 1995, pp. 74-82.
22. Cheng, C.-C., and Sansalone, M., “Determining the Minimum Crack Width That Can Be Detected Using the Impact-Echo Method Part 2: Numerical Fracture Analyses,” Materials and Structures, V. 28, No. 3, 1995, pp. 125-132.

46 ACI Materials Journal/January-February 2014
23. Aggelis, D. G.; Leonidou, E.; and Matikas, T. E., “Subsurface Crack Determination by One-Sided Ultrasonic Measurements,” Cement and Concrete Composites, V. 34, No. 2, 2012, pp. 140-146.
24. Aggelis, D. G.; Shiotani, T.; and Polyzos, D., “Characterization of Surface Crack Depth and Repair Evaluation Using Rayleigh Waves,” Cement and Concrete Composites, V. 31, No. 1, 2009, pp. 77-83.
25. Kee, S.-H., “Evaluation of Crack-Depth in Concrete Using Non-Con-tact Surface Wave Transmission Measurement,” PhD dissertation, Depart-ment of Civil, Environmental and Architectural Engineering, The Univer-sity of Texas at Austin, Austin, TX, 2011.
26. Achenbach, J. D.; Komsky, I. N.; Lee, Y. C.; and Angel, Y. C., “Self-Calibrating Ultrasonic Technique for Crack Depth Measurement,” Journal of Nondestructive Evaluation, V. 11, No. 2, 1992, pp. 103-108.
27. Zhu, J., and Popovics, J. S., “Non-Contact Imaging for Surface-Opening Cracks in Concrete with Air-Coupled Sensors,” Materials and Structures, V. 38, 2005, pp. 801-806.
28. Shokouhi, P.; Zoega, A.; Wiggenhauser, H.; and Fischer, G., “Surface Wave Velocity-Stress Relationship in Uniaxially Loaded Concrete,” ACI Materials Journal, V. 109, No. 2, Mar.-Apr. 2012, pp. 141-148.
29. “Stähler, S. C.; Sens-Schönfelder, C.; and Niederleithinger, E., “Monitoring Stress Changes in a Concrete Bridge with Coda Wave Inter-ferometry,” The Journal of the Acoustical Society of America, V. 129, No. 4, 2011, pp. 1945-1952.
30. Kim, J.-Y.; Jacobs, L. J.; Qu, J.; and Littles, J. W., “Experimental Characterization of Fatigue Damage in a Nickel-Base Superalloy Using Nonlinear Ultrasonic Waves,” The Journal of the Acoustical Society of America, V. 120, No. 3, 2006, pp. 1266-1273.
31. Zhang, J., and Stang, H., “Applications of Stress Crack Width Rela-tionship in Predicting the Flexural Behavior of Fibre-Reinforced Concrete,” Cement and Concrete Research, V. 28, No. 3, 1998, pp. 439-452.