Embed Size (px)
Citation preview
Surface Waxes in Grapevine as Target for Resistance
Breeding
Zur Erlangung des akademischen Grades eines
DOKTORS DER NATURWISSENSCHAFTEN
(Dr. rer. nat.)
von der KIT-Fakultät für Chemie und Biowissenschaften
des Karlsruher Instituts für Technologie (KIT)
genehmigte
DISSERTATION
von
Xinshuang Ge
aus
Shandong, China
Dekan: Prof. Dr. Reinhard Fischer
Referent: Prof. Dr. Peter Nick
Korreferent: Prof. Dr. Jörg Kämper
Tag der mündlichen Prüfung: 10.02.2021

Die vorliegende Dissertation wurde am Botanischen Institut des Karlsruhe Instituts für
Technologie (KIT), Botanisches Institut, Lehrstuhl 1 für Molekulare Zellbiologie, im
Zeitraum von Oktober 2016 bis Januar 2021 angefertigt.

Erklärung
Hiermit erkläre ich, dass ich die vorliegende Dissertation, abgesehen von der
Benutzung der angegebenen Hilfsmittel, selbständig verfasst habe.
Alle Stellen, die gemäß Wortlaut oder Inhalt aus anderen Arbeiten entnommen sind,
wurden durch Angabe der Quelle als Entlehnungen kenntlich gemacht.
Diese Dissertation liegt in gleicher oder ähnlicher Form keiner anderen
Prüfungsbehörde vor.
Zudem erkläre ich, dass ich mich beim Anfertigen dieser Arbeit an die Regeln zur
Sicherung guter wissenschaftlicher Praxis des KIT gehalten habe, einschließlich der
Abgabe und Archivierung der Primärdaten, und dass die elektronische Version mit der
schriftlichen übereinstimmt.
Karlsruhe, im Januar 2021
Xinshuang Ge
Acknowledgements
I
Acknowledgments
I would like to express my heartfelt thanks to all the people who help and
support me to complete doctoral study in Germany.
Firstly, I extend my sincerest gratitude to Prof. Dr. Peter Nick for providing
the chance that I could study in botanical institute I and enjoy the life in
Germany. And he gives a great deal of constructive suggestions for the
project and instructions for doing the scientific research.
I would like to express my sincere appreciation to Prof. Dr. Jörg Kämper
for being my co-examiner.
I would like to take this opportunity to express my sincere gratitude to Dr.
Birgit Hetzer and Breutmann Gunilla (Max Rubner Institute, Karlsruhe,
Germany). We worked together to investigate the surface waxes
morphology by cryo-SEM in the European wild grapevine accession and
also analyze the phenotypes of transgenic Arabidopsis lines.
I would like to thank Dr. Christine Tisch, Dr. Ruth Walter and Dr.rer.nat.
Andreas Kortekamp (Dienstleistungszentrum Ländlicher Raum Rheinpfalz,
Neustadt, Germany) for providing the chance to finish the experiment of
the Powdery Mildew infection in the leaf discs of three genotypes and
sharing the data of Powdery Mildew infection severity and frequency in

Acknowledgements
II
the plants.
I also would like to thank Patrick Schindele in the botanical institute II for
providing the method of Arabidopsis transformation and teaching me how
to do it properly.
My special thanks to Dr. Michael Riemann as the group leader for
discussing together about the molecular biology, providing suggestions and
revising my thesis.
Thanks for all the people in botanical institute I. My especial thanks to
Sabine Purper, Nadja Wunsch, Ernst Heene Dr. Qiong Liu, Dr. Xiaolu Xu,
Dr.Fan Bai, Dr. Peijie Gong, Dr. Ruipu Wang, Dr. Xue Peng, Dr. Gangliang
Tang, Dr. Pingyin Guan, Gero Kaeser, Wenjing Shi, Christian Metzger and
Xuan Liu from whom I got unselfish help and support.
I also express my sincere thanks to my family and my friends. With their
listening and support, I could pass through the hard time.
Finally, I would also thank CSC scholarship for financial support.

Abbreviations
III
Abbreviations
ABC transporters: ATP binding cassette transporters
ACC: Acetyl-CoA carboxylase
BiFC: bimolecular fluorescence complementation
BSTFA-TMCS:
[N,O-bis(trimethylsilyl)trifluoroacetamide):trimethylchlorosilane
Cryo-SEM: Cryo-scanning electron microscopy
CTAB: cetyltrimethylammonium bromide
DMIs: demethylation inhibiting fungicides
ECR: trans-2, 3-enoyl-CoA reductase
ER: endoplasmic reticulum
FAE: fatty acids elongase
FATB: acyl-ACP thioesterase
FAR: fatty acyl-CoA reductase
FAS: fatty acid synthase
GC/MS: mass spectrometry-gas chromatography
HCD: β-Hydroxy acyl-CoA dehydratase
HR: hypersensitive response
KCR: β-Ketoacyl-CoA reductase
KCS: β-Ketoacyl-CoA synthase
LACS: long-chain-acyl-CoA synthetases
LTPs: lipid transporter proteins

Abbreviations
IV
PM: plasma membrane
ROS: reactive oxygen species
VLCFAs: very long chain fatty acids
XRD: X-ray powder diffraction
Contents
V
Contents
Acknowledgments ........................................................................................................ I
Abbreviations ............................................................................................................ III
Contents ....................................................................................................................... V
Zusammenfassung........................................................................................................ 1
Abstract ......................................................................................................................... 3
1. Introduction .............................................................................................................. 5
1.1 Powdery Mildew, a devastating disease in viticulture ....................................... 5
1.2 The symptoms of Powdery Mildew ................................................................... 5
1.3 The life cycle of Powdery Mildew ..................................................................... 6
1.4 Management of grapevine Powdery Mildew ..................................................... 7
1.5 Wax structures .................................................................................................... 8
1.6 Wax chemical components ............................................................................... 10
1.7 The function of surface waxes in the defense against abiotic and biotic stress11
1.8 The regulation of plant development by the epicuticular waxes ..................... 12
1.9 Wax biosynthesis mechanism in Arabidopsis .................................................. 12
1.9.1 De novo fatty acids synthesis .................................................................. 13
1.9.2 VLCFAs formation in the ER ................................................................. 14
1.9.3 The alkane formation pathway of VLCFAs derivation ........................... 14
1.9.4 The alcohol formation pathway of VLCFAs derivation ......................... 15
1.10 Wax transport ................................................................................................. 16
1.10.1 Wax precursors go into the ER ............................................................. 16
1.10.2 Transport from the ER to the PM .......................................................... 16
1.10.3 Wax components through the PM into the apoplast ............................. 17
1.10.4 Wax components export from the epidermal cell ................................. 17
1.11 MYB30 and MYB 106 function in Arabidopsis ............................................ 18
1.12 Scope of the study .......................................................................................... 19
2. Materials and methods .......................................................................................... 21
2.1 Plant material ................................................................................................... 21
2.2 Cryo-Scanning electron microscopy analysis (cryo-SEM).............................. 21
2.3 Quantification of wax structures ...................................................................... 22
2.4 Inoculation with Erysiphe necator ................................................................... 23
2.5 Microscopic analysis and staging of E. necator development ......................... 24
2.6 Grapevine cell culture ...................................................................................... 25
2.7 Arabidopsis mutants and growth conditions .................................................... 26
2.8 RNA extraction ................................................................................................ 27
2.9 cDNA synthesis ................................................................................................ 27
2.10 Quantitative real-time PCR ............................................................................ 28
2.11 Cloning the protein-coding regions of MYB30 and MYB106 in Ke114 and
Ke35 ....................................................................................................................... 28
Contents
VI
2.12 Construction of plasmids and establishment of transgenic MYB30 and
MYB106 lines ........................................................................................................ 29
2.13 Epidermal wax content analysis ..................................................................... 30
2.14 Protein interaction between MYB30 and MYB106 ...................................... 31
2.15 Analysis and cloning the promoter of MYB30 and MYB106 ....................... 32
2.16 Promoter activity assay .................................................................................. 33
3. Results ..................................................................................................................... 35
3.1 Different types of surface wax structures depend on genotype and on cell
differentiation in Vitis. ............................................................................................ 35
3.2 The time course of surface wax formation depends on leaf development ....... 36
3.3 The surface wax pattern in the different clades ............................................... 38
3.4 The correlations for the different clades in surface wax accumulation ........... 39
3.5 The link between surface wax content and Powdery Mildew susceptibility ... 41
3.6 The stages of Powdery Mildew spores’ development on fully expanded leaves
................................................................................................................................ 42
3.7 Abundant surface wax can interfere with appressorium formation ................. 44
3.8 The genotypes of Ke114 and Ke35 are close relationship, though the phenotypes
are extremely different ........................................................................................... 46
3.9 Cloning and sequence analysis of MYB106 and MYB30 in the V. sylvestris
group of Ke114 and Ke35 ...................................................................................... 48
3.10 Two alleles of MYB106 complement the Arabidopsis myb106 mutant, not only
the wax content, but also the over-branched trichome phenotype ......................... 52
3.11 Two alleles of MYB30 complement the defective wax accumulation phenotype
of Arabidopsis myb30 mutant ................................................................................ 55
3.12 Expression pattern of two alleles of MYB106 and two alleles of MYB30 in
Ke114 and Ke35 ..................................................................................................... 58
3.13 Subcellular co-localization of two alleles of MYB106 and two alleles of
MYB30 .................................................................................................................. 58
3.14 MYB106 interacts with MYB30 to regulate the wax formation in the genotypes
Ke114 and Ke35 ..................................................................................................... 60
3.15 Plant hormones, light and low temperature may regulate MYB106 and MYB30
expression in the cis-acting regulatory elements analysis ..................................... 62
3.16 Chitosan regulates the promoter of MYB106 and MYB30 activity .............. 64
4. Discussion................................................................................................................ 66
4.1 Genetic variation of surface wax morphology and development in V. sylvestris
................................................................................................................................ 66
4.2 Low wax content genotypes are more susceptible to Powdery Mildew .......... 68
4.3 Abundant surface waxes regulate appressorium formation of Powdery Mildew
spores ..................................................................................................................... 69
4.4 MYB106 and MYB30 are associated with wax biosynthesis pathway in
grapevines .............................................................................................................. 70
4.5 The genes’ functions of two alleles of MYB106 and two alleles of MYB30 have
less differences, separately ..................................................................................... 72

Contents
VII
4.6 MYB106 is more relatively conserved, compared with MYB30 .................... 73
4.7 MYB106 and MYB30 are involved in defense regulation .............................. 74
4.8 Conclusion ....................................................................................................... 75
4.9 Outlook ............................................................................................................ 77
Appendix ..................................................................................................................... 78
References ................................................................................................................. 101

Zusammenfassung
1
Zusammenfassung
Rund 80% des europäischen Fungizid-Verbrauchs gehen auf den Weinbau
zurück. Es werden mehrere Krankheiten bekämpft, die während des 19tn
Jahrhunderts eingeschleppt worden sind, wobei unter denen der Echte
Mehltau besonders destruktiv ist (Arnold et al 2005). Aufgrund ihrer
Struktur und räumlicher Anordnung, liegt die Vermutung nahe, dass die
Wachschicht der pflanzlichen Epidermis Einfluss auf die Infektion durch
den Mehltau hat (Collinge 2009; Kunst and Samuels 2003). Es wäre
möglich, dass sie die Adhäsion an oder die Penetration der Blattoberfläche
durch das Appressorium erschwert oder verhindert (Wenping Qiu 2015).
Daher ist es von Interesse herauszufinden, ob resistente Pflanzen
Unterschiede in den Wachsanlagerungen aufweisen. Gegebenenfalls wären
auch die Mechanismen der Wachs-Biosynthese in unserer Weinreben
Sammlung zu untersuchen, um damit Strategien zur Generation von neuen,
resistenten Weinreben zu erstellen.
In dieser Arbeit konnten wir in unserer Sammlung von Weinreben, die nahe
mit unserem Kultur-Wein verwandt sind, drei distinkte Morphologien des
Oberflächen-Waches feststellen: als lange, flügelähnlichen Strukturen, als
kleine Wachs-Kristalle und als eine Mischform der beiden vorherigen
Formen. Die Bildung und Anlagerung von Wachs ist zwar abhängig vom
Alter des Blatts, stabilisiert sich jedoch, vollständig geöffneten Blatt. Es

Zusammenfassung
2
konnte festgestellt werden, dass die Pflanzen-Linien mit geringerem
Wachs-Vorkommen empfänglicher für die Infektion mit Echtem Mehltau
sind. Zudem konnte der hohe Wachs-Gehalt der Linie Ke114, mit der Linie
Ke34 verglichen, Sporen davon abhalten ein Appressorium zu bilden,
sondern in der „aberrant stage“ (ausschließlich Hyphen-Wachstum) zu
verharren und somit die Mehltau-Infektion verhindern.
Es wurde für weitere Vergleiche das Paar von Genotypen Ke114 und Ke34
gewählt, da diese Linien sich bezüglich des „SNP polygenetic tree“ sehr
ähnlich sind und trotzdem signifikante Unterschiede in der Wax-
Morphologie und Mehltau-Resistenz aufweisen. Pflanzen dieser Linien
exprimierten die Gene MYB106 und MYB30 unterschiedlich, besonders
MYB 106 exprimierten in dem zweiten Blatt. Beide Gene konnten den
wachsfreien Phänotyp einer myb106 und myb30 Arabidosis Mutante
komplementieren. In den untersuchten Linien interagieren MYB106 und
MYB30 miteinander, um die Wachs-Biosynthese zu regulieren. Zudem
konnte aufgezeigt werden, dass Chitosan, eine der Hauptkomponenten der
pilzlichen Zellwand, die Promoter-Aktivität der Transkriptionsfaktoren
MYB106 und MYB30 ändert und so Gen-Expressions Level der Pflanze
beeinflusst.
Abstract
3
Abstract
Viticulture accounts for around 80% of fungicide use in Europe, a demand
which is caused by several diseases that have been introduced in the 19th
century, especially Powdery Mildew (Arnold, Schnitzler, Douard, Peter, &
Gillet, 2005). Owing to the structure and the location of surface wax
(Collinge, 2009; L. Kunst & Samuels, 2003), maybe it can block Powdery
Mildew penetrating the surface wax and cuticle as well as the adhesion at
the leaf surface (Wenping Qiu, 2015). It is important consequently to find
out that if there are distinct resistance to the Powdery Mildew in the grape
accessions which have wax accumulation differences. Further wax
biosynthesis mechanism needs to be investigated in the grapevine
collection. That can provide another strategy to create new varieties.
In this study, there were three types of wax morphologies discerned as long
wing-like structure, small wax crystals and occurrence long wax wings
with small wax crystals together in the wild ancestor of domesticated
grapevine collections. Surface waxes formation and accumulation of the
genotypes indicated genetic variation and wax contents stabilized at fully
expanded leaves. The relationship between wax content and Powdery
Mildew resistance was that varieties with low wax abundance were more
susceptible to Powdery Mildew. Moreover, the higher wax accumulation
of Ke114 genotype, compared with genotype of Ke35, could prevent the
Powdery Mildew spores further generating the appressorium, instead, the

Abstract
4
aberrant stage ap*(only hyphae growth) appearance, thus influenced the
resistance to Powdery Mildew.
we found one pair of Ke114 and Ke35, which were close to each other
according to the SNP polygenetic tree, that they had different wax
formation and the resistance to the Powdery Mildew. Further the
expression levels of MYB106 and MYB30 were also distinguished in the
pair, especially MYB106 expression level in the secondary leaf. Both of
them could complement the wax-lack phenotype in myb106 and myb30
Arabidopsis mutant background, respectively. MYB 106 and MYB 30
interacted with each other to regulate the wax biosynthesis in the pair.
Furthermore, chitosan, as the main component of fungal cell walls could
regulate the promoter activity of MYB 106 and MYB 30, further
influenced the genes expression level and regulate the wax biosynthesis in
the Ke114 and Ke35.
Introduction
5
1. Introduction
1.1 Powdery Mildew, a devastating disease in viticulture
The causal agent of Powdery Mildew on grapevines is the fungus Erysiphe
necator,which is an obligate biotrophic pathogen (David M. Gadoury,
Cadle-Davidson, Wilcox, Dry, Seem, et al., 2012; Qiu, Feechan, & Dry,
2015). The disease comes originally from North America and spreads
widely in Europe since the 19th century (Lange, 1996). The European
cultivated grapevine (Vitis vinifera), compared with American varieties, are
much more susceptible to Powdery Mildew, so the disease causes large-
scale grapevine production decline and fruit quality reduction, which in
turn generate significant economic losses (Ellis, 2008; D. M. Gadoury,
Seem, Pearson, & Wilcox, 2001).
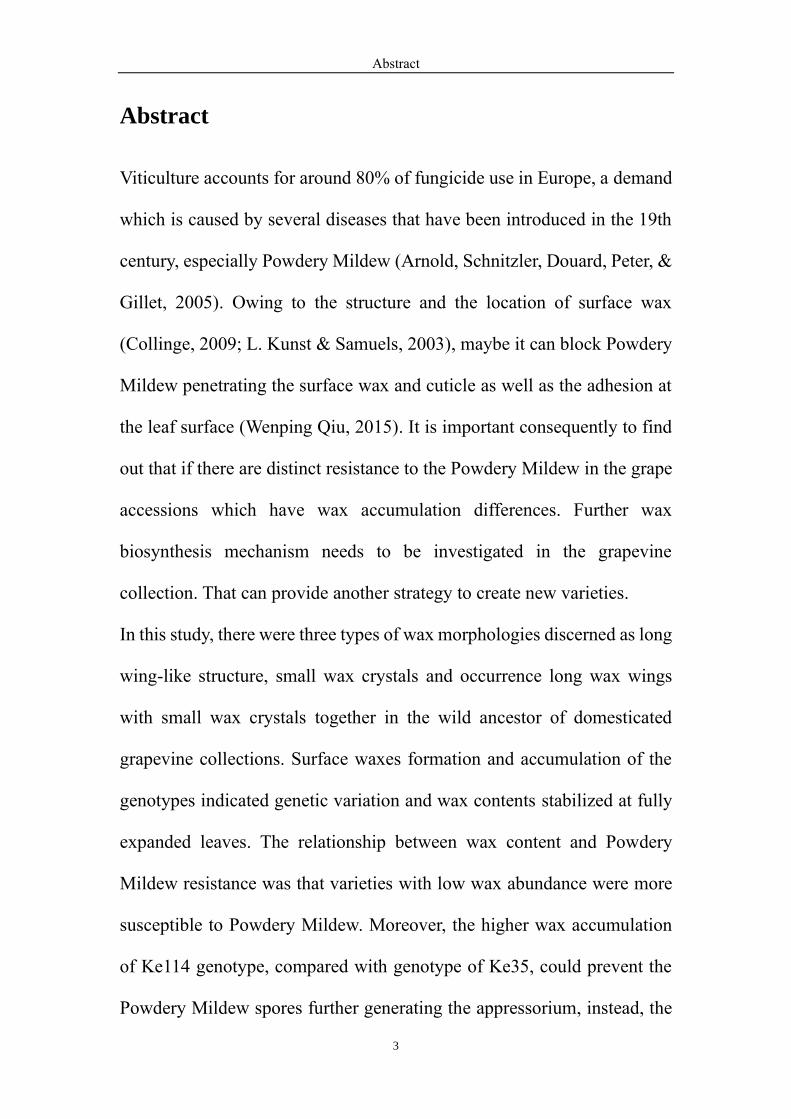
1.2 The symptoms of Powdery Mildew
Powdery Mildew could infect almost the whole grapevine green tissues
(Fig. 1-1). In the early stage of infection, there are some small diffuse round
white colonies appearing on the adaxial side of leaves and the surface of
berries (Sall, 1982). As infection progressed, the entire leaves and berries
are covered with grey colonies, further there appear colonies on the abaxial
side of leaves. The infected leaves become stunted, show premature
senescence and abscission in late stages of the infection. The berries appear
misshapen, cracking, rotting and plants show early fruit drop (David M.
Introduction
6
Gadoury, Seem, Ficke, & Wilcox, 2003; Jones et al., 2014).
Figure 1-1. The symptoms of Powdery Mildew infected leaf and grape. Figure from (Jones et al., 2014)
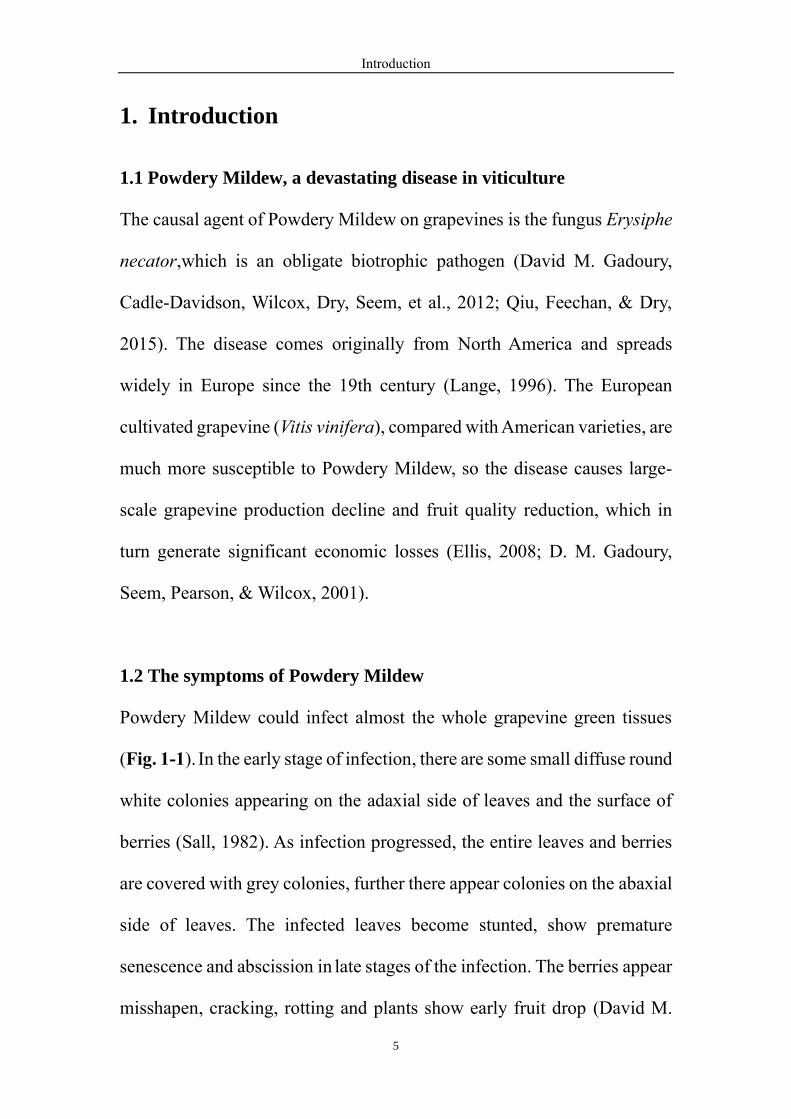
1.3 The life cycle of Powdery Mildew
The grapevine leaves and buds are infected by the conidia or ascospores
released from the cleistothecia in spring (Fig. 1-2). They firstly geminate
on the surface of grapevine green tissues and form a specialized infectious
structure, the appressorium, to penetrate and invade into the epidermal cells
to obtain the nutrients for further development (David M. Gadoury, 1990;
Heintz & Blaich, 1990). Then the mycelium covers the entire surface,
conidia are generated from the protruding vertically hyphae for propagation
after a few warm days. Finally, they start quickly infecting new host tissues
through spore distribution by wind. The rapid spread and growth of
Powdery Mildew primarily utilize the asexual reproduction cycle. Conidia
continuously generate in moderate temperature and a humid environment.
Introduction
7
There are two ways for Powdery Mildew to overwinter. The first one is to
produce cleistothecia in the late summer (David M. Gadoury, 1990, 1991).
They could hang on the bark crevices with hook-shaped ends when they
are washed by rains. The other is that the fungus infects the developing
buds and overwinter inside. Then they wait for the following spring to
propagate (Ellis, 2008; Gemmrich & Seidel, 1996).
Figure 1-2. The life cycle of Powdery Mildew. Figure from (Ellis, 2008)
1.4 Management of grapevine Powdery Mildew
The selection of resistant grapevine varieties is a reasonable method
because the American species are less susceptible to Powdery Mildew
(Halleen & Holz, 2017). Further as preventive measures, we can facilitate
ventilation and improve the growth conditions by grapevine pruning and
training methods (Austin & Wilcox, 2011; Zoecklein, Wolf, Duncan, Judge,

Introduction
8
& Cook, 1992). For biological control, mycophagous mites have been
investigated that the higher density of them in acarodomatia or leaf domatia,
leads to the less Powdery Mildew propagation on foliage and fruits
(English-Loeb, Norton, Gadoury, Seem, & Wilcox, 1999, 2007; Norton,
English-Loeb, Gadoury, & Seem, 2000). The usage of inorganic fungicides
especially sulfur is still common worldwide, because of the effectiveness.
For fungicides, the limitations are their impact on environmental pollution
and pathogen resistance development (D. M. Gadoury et al., 1994; Russell,
2005). There are some organic fungicides such as sterol demethylation
inhibiting fungicides (DMIs) being used, but Erysiphe necator has been
found to be resistant to these fungicides (Shetty, Narkar, Sawant, & Sawant,
2014).
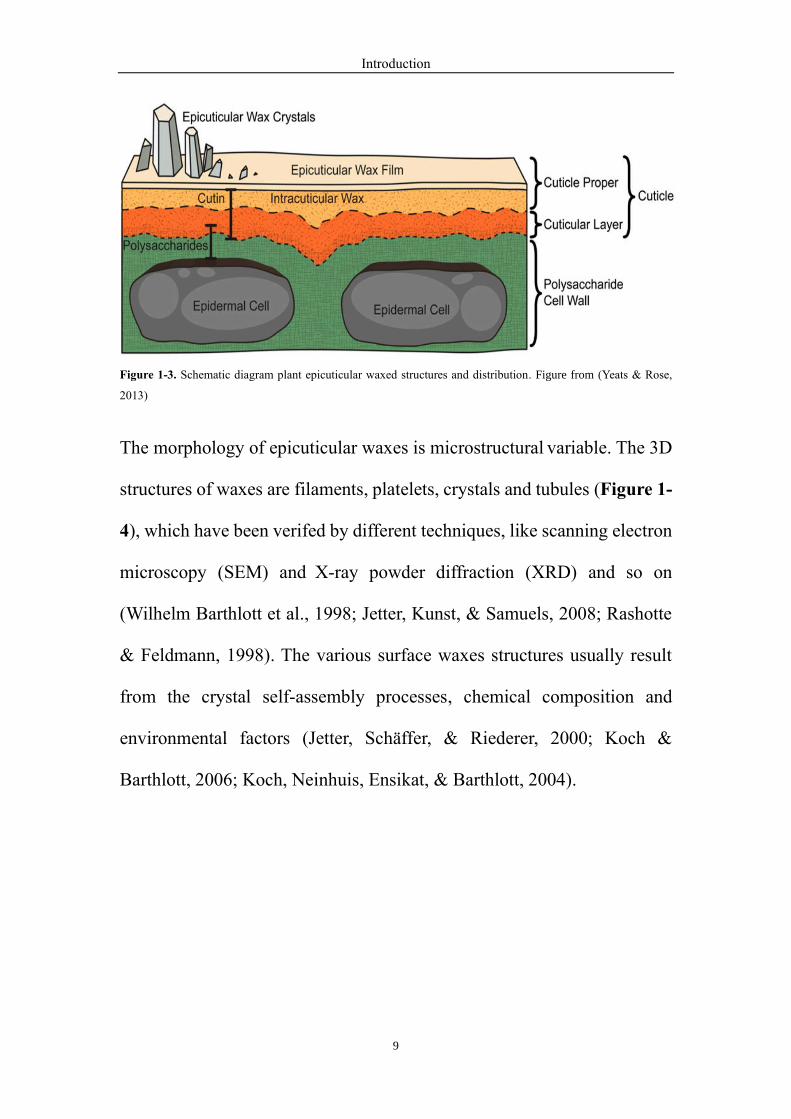
1.5 Wax structures
Plant surface waxes, as the primary physical plant-environment interaction
layers (Fig. 1-3), protect the plant tissues from the abiotic and biotic
stresses (J. Kim et al., 2013; Lewandowska, Keyl, & Feussner, 2020; X.
Wang, Kong, Zhi, & Chang, 2020; Yeats & Rose, 2013).
Introduction
9
Figure 1-3. Schematic diagram plant epicuticular waxed structures and distribution. Figure from (Yeats & Rose,
2013)
The morphology of epicuticular waxes is microstructural variable. The 3D
structures of waxes are filaments, platelets, crystals and tubules (Figure 1-
4), which have been verifed by different techniques, like scanning electron
microscopy (SEM) and X-ray powder diffraction (XRD) and so on
(Wilhelm Barthlott et al., 1998; Jetter, Kunst, & Samuels, 2008; Rashotte
& Feldmann, 1998). The various surface waxes structures usually result
from the crystal self-assembly processes, chemical composition and
environmental factors (Jetter, Schäffer, & Riederer, 2000; Koch &
Barthlott, 2006; Koch, Neinhuis, Ensikat, & Barthlott, 2004).

Introduction
10
Figure 1-4. Different morphology of epicuticular waxes: a the wax crust on Crassula ovata b wax chineys on
Heliconia collinsiana c and d wax tubes on an Eucalyptus gunnii and Thalictrum flavum glaucum,separately e and
f wax platelets on Aloe porphyrostachys and Euphorbia characias respectively. Figures from (Koch & Ensikat, 2008).
1.6 Wax chemical components
Epicuticular waxes are lipophilic complex mixtures. Because of the
hydrophobic property known as Lotus effect (W. Barthlott & Neinhuis,
1997), the components of the wax layer can be extracted with organic
solvents like chloroform supplemented with local heating (Schonherr &
Riederer, 1989). Further the wax compounds are analyzed by GC/MS
(Zeisler-Diehl, Barthlott, & Schreiber, 2018). There are more than 30
plants being investigated with regard to wax components (Sharma, Kothari,
Rathore, & Gour, 2018). And the waxes are mainly composed of a series
of very-long chain compounds and their derivatives. Among them, the
Introduction
11
carbon chain lengths of ketones and secondary alcohols are in majority of
an odd-number ,while for primary alcohols, esters and fatty acids, they are
mostly even-numbered (Von Wettstein-Knowles, 2018). In addition, there
are traces of secondary metabolites like triterpenoids, terpenoids, sterols,
and aromatic compounds (Razeq, Kosma, Rowland, & Molina, 2014; E.
Wollenweber, Kraut, & Mues, 1998). Although these substances are rare in
most species, they appear main wax components in others species, such as
flavonoids in ferns and angiosperms (Post-Beittenmiller, 1996; Eckhard
Wollenweber, 1978; Eckhard Wollenweber & H. Dietz, 1981).
1.7 The function of surface waxes in the defense against abiotic and
biotic stress
The plant surface waxes are protective barriers between the plant and the
external environment because of the chemical properties. Several papers
have verified that the wax layer can prevent non-stomatal water loss during
drought stress (Premachandra, Saneoka, Fujita, & Ogata, 1992; Williams,
Rosenqvist, & Buchhave, 2000). Waxes effectively reflect, scatter and
absorb harmful light such as high-energy short-wave UV lights (Clark &
Lister, 1975; Holmes & Keiller, 2002; S. Wang, Duan, Eneji, & Li, 2007).
And the waxes are also efficient barriers to block harmful substances such
as organic pesticides (Culberson, Martin, & Juniper, 1971; Sharma et al.,
2018).
Introduction
12
Moreover, the outside waxes promote water droplet formation because of
the superhydrophobic property and self-cleaning ability, which deceases
the occurrence of particles and residues on the leaf surface and restricts the
attachment and invasion of pathogens (Burton & Bhushan, 2006;
Culberson et al., 1971; Jeffree, 2007) . At the same time, the fungal
colonization process is also influenced by the wax layer (Leveau, 2018;
Marcell & Beattie, 2002). The thickness and compositions of waxes play a
role in herbivorous insects for host selection and spawning (Eigenbrode &
Espelie, 1995; Moharramipour, Tsumuki, Sato, Murata, & Kanehisa, 1997;
Ni, Quisenberry, Siegfried, & Lee, 1998).
1.8 The regulation of plant development by the epicuticular waxes
In addition, the wax development regulates plant growth like leaf
expension and flower formation (X. Chen, Goodwin, Boroff, Liu, & Jenks,
2003; Jenks, Rashotte, Tuttle, & Feldmann, 1996; Rhee, Hlousek-Radojcic,
Ponsamuel, Liu, & Post-Beittenmiller, 1998). Then the surface wax of
pollen is involved in the signal recognition between the pollen and the
stigma and regulation of fertility (Millar et al., 1999).
1.9 Wax biosynthesis mechanism in Arabidopsis
The wax biosynthesis pathway has been investigated basically clearly in
Arabidopsis recently through GC/MS, nuclear magnetic resonance, and

Introduction
13
isotope tracing techniques (Jenks, Tuttle, Eigenbrode, & Feldmann, 1995;
L. Kunst & Samuels, 2003; Lewandowska et al., 2020; McNevin,
Woodward, Hannoufa, Feldmann, & Lemieux, 1993). The process of wax
synthesis completely occurs in different organelles of epidermal cells, and
it is a series of enzymatic reactions coordinated by multienzyme complexes
(Davies, 1980; H. U. Kim, 2020; Samuels, Kunst, & Jetter, 2008). The wax
snythesis process can be divided into three parts (Fig. 1-5).
The first step is the de novo fatty acids synthesis with chain lengths of C16-
C18 in the plastid, then they are transported into the endoplasmic reticulum
(ER) to process, modify and extend the fatty acid chains, resulting in C26-
C34 very long chain fatty acids (VLCFAs). Finally through the alkane and
alcohols formation pathway, VLCFAs are metabolically modified to form
the main components of surface waxes (Ljerka Kunst & Samuels, 2009;
Lee & Suh, 2015; Suh et al., 2005).
1.9.1 De novo fatty acids synthesis
Acetyl CoA, as the precursors in plastid, synthesize malonyl-CoA through
the acetyl-CoA carboxylase (ACC) multi-enzyme complex. Malonyl-CoAs
are continuously catalyzed and polymerized by the fatty acid synthase
system (FAS) till finally C16-C18 fatty acids generation (H. U. Kim, 2020;
Mazliak, 1973).

Introduction
14
1.9.2 VLCFAs formation in the ER
The extension of the chain lengths is accomplished by the action of the
fatty acid elongase complex (FAE), which includes β-ketoacyl-CoA
synthase (KCS) (Fiebig et al., 2000; Franke et al., 2009; L Kunst, Taylor,
& Underhill, 1992; Todd, Post-Beittenmiller, & Jaworski, 1999), reductase
(KCR) (Beaudoin et al., 2009), β-hydroxyacyl-CoA dehydratase (HCD)
(Bach et al., 2008; Racovita, Peng, Awakawa, Abe, & Jetter, 2015), and
trans-2, 3-enoyl-CoA reductase (ECR) (H. Zheng, Rowland, & Kunst,
2005).The enzyme complex (FAE) uses malonyl-CoAs as substrates to
repeat a four steps cycle, further synthesizes C26- C34 VLCFAs (Bernard
& Joubès, 2013; Li-Beisson et al., 2013).
1.9.3 The alkane formation pathway of VLCFAs derivation
The VLCFAs derivatives as aldehydes, alkanes, secondary alcohols and
ketones are generated in the alkane formation pathway. The substances
mostly account for 80%~ 90% of the wax compositions, alkanes relatively
highest (Schneider-Belhaddad & Kolattukudy, 2000). CER1, WAX2/CER3
and CYTB5 regulate aldehydes synthesis (Bernard et al., 2012; X. Chen et
al., 2003; McNevin et al., 1993). And odd-numbered chain length of
alkanes, alcohols and ketones produce by MNH1 removing the carbonyl
groups (Greer et al., 2007).
Introduction
15
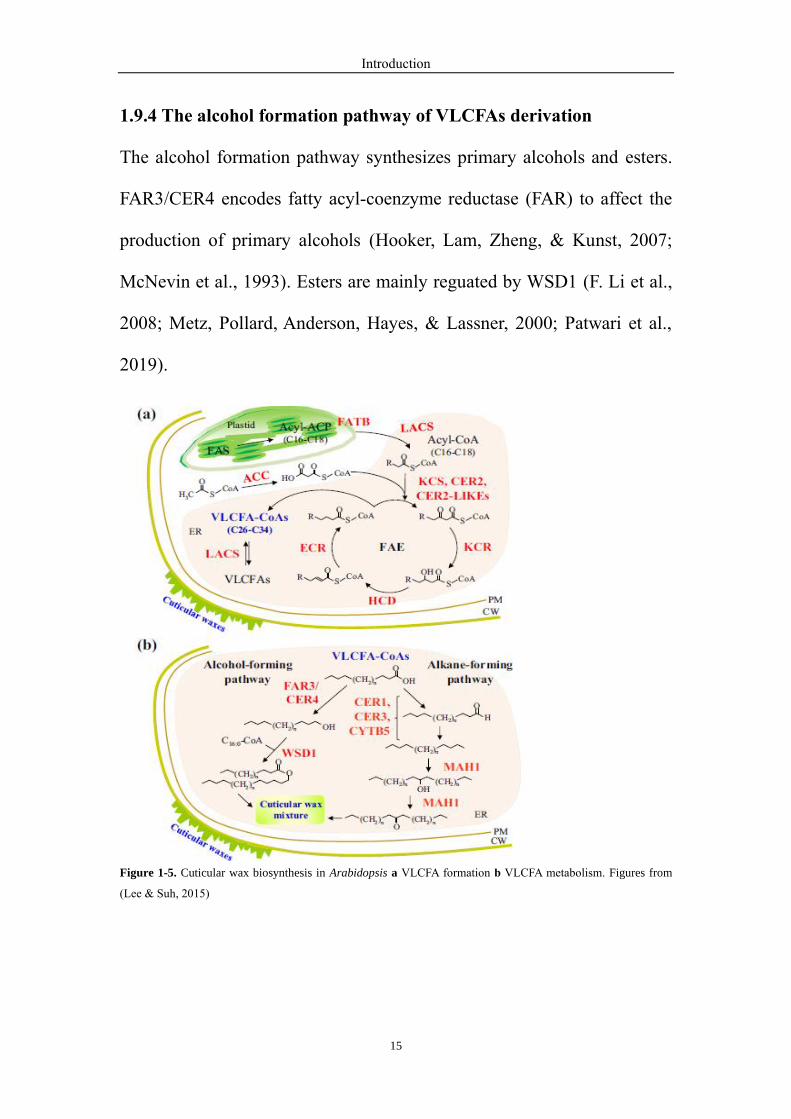
1.9.4 The alcohol formation pathway of VLCFAs derivation
The alcohol formation pathway synthesizes primary alcohols and esters.
FAR3/CER4 encodes fatty acyl-coenzyme reductase (FAR) to affect the
production of primary alcohols (Hooker, Lam, Zheng, & Kunst, 2007;
McNevin et al., 1993). Esters are mainly reguated by WSD1 (F. Li et al.,
2008; Metz, Pollard, Anderson, Hayes, & Lassner, 2000; Patwari et al.,
2019).
Figure 1-5. Cuticular wax biosynthesis in Arabidopsis a VLCFA formation b VLCFA metabolism. Figures from
(Lee & Suh, 2015)
Introduction
16
1.10 Wax transport
The waxes are ultimately located outside, however the sites of wax
synthesis are in the plastid and ER of epidermal cells. Hence, there are
transportation processes of cuticular waxes from synthesis sites to function
place (L. Kunst & Samuels, 2003; Ljerka Kunst & Samuels, 2009).
1.10.1 Wax precursors go into the ER
C16-C18 fatty acids are released from the precursors , the C16-C18 acyl-
ACPs (Fig. 1-5), by thioesterases (FATB) (Bonaventure, Salas, Pollard, &
Ohlrogge, 2003; N. Li, Xu, Li-Beisson, & Philippar, 2016; Salas &
Ohlrogge, 2002). And they are immediately esterified by LACS (long-
chain-acyl-CoA synthetases) to prevent them from being reversed into the
plastid, further transfer into ER (Fulda, Shockey, Werber, Wolter, & Heinz,
2002; Shockey, Fulda, & Browse, 2002; Weng, Molina, Shockey, &
Browse, 2010).
1.10.2 Transport from the ER to the PM
There are two transport mechanisms to explain the route from the ER to
the cell membrane. One is that the ER is directly fused into plasma
membrane (Grabski, De Feijter, & Schindler, 1993; Staehelin & Chapman,
1987). The other is to transport wax components through the Golgi vesicles
networks (McFarlane et al., 2014; Millar, Wrischer, & Kunst, 1998).
Introduction
17
1.10.3 Wax components through the PM into the apoplast
The ABC transporters provide energy by hydrolyzing ATP to help the wax
components to pass through the bilayer of PM, when these
macromoleculars reach the PM (D. A. Bird, 2008; N. Chen et al., 2018;
Lacey Samuels, Mcfarlane, Shin, & Bird, 2010; Pighin et al., 2004). And
there are CER5/ABCG12 and WBC11/ABCG11 being distinguished that
their location on the plasma membrane could encode the semitransporter
of the ABC transporter (D. Bird et al., 2007; Panikashvili et al., 2007)
(Figure 1-6).
1.10.4 Wax components export from the epidermal cell
The final barrier for wax components is through the hydrophilic plant cell
wall. There are some lipid transporter proteins (LTPs) on the plasma
membrane that carry macromolecular waxes through the cell wall to the
leaf surface, where epicuticular waxes continuously accumulate (DeBono,
2011; Edstam, Blomqvist, Eklöf, Wennergren, & Edqvist, 2013). Ealier
studies have shown that both LTPG1 and LTPG2 had substrate specificity,
and the absence of both caused a decrease in surface wax content (H. Kim
et al., 2012; Lee et al., 2009).
Introduction
18
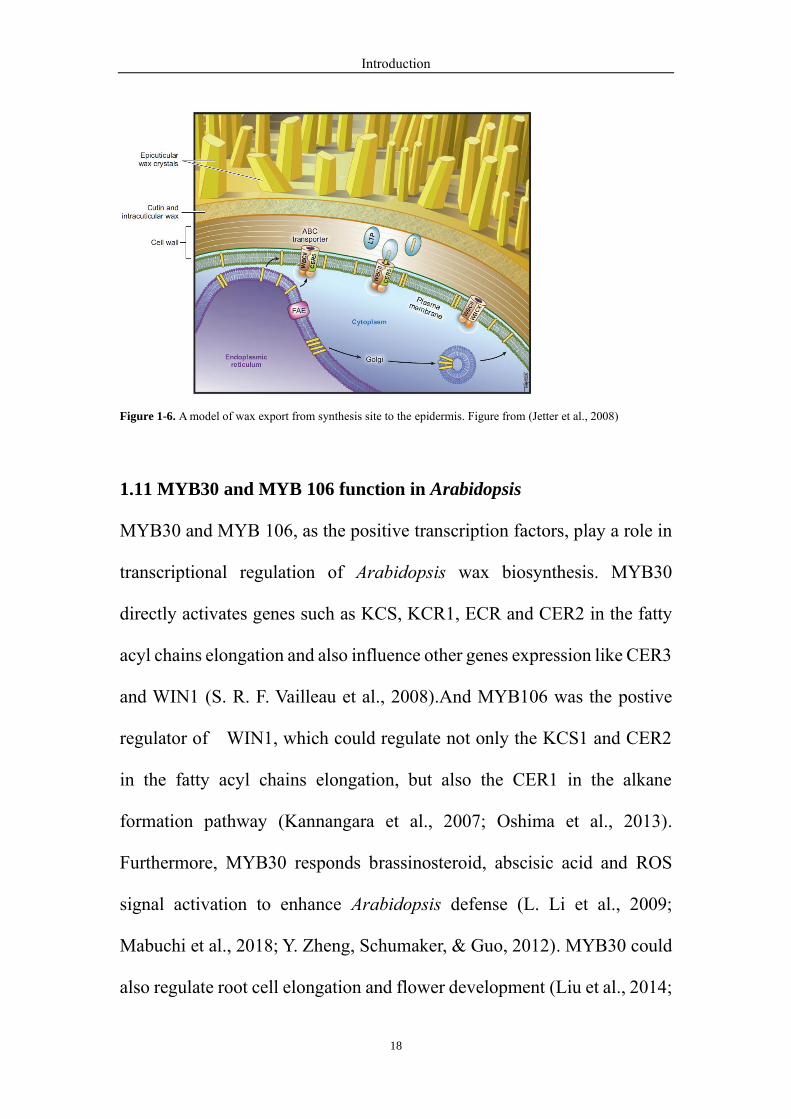
Figure 1-6. A model of wax export from synthesis site to the epidermis. Figure from (Jetter et al., 2008)
1.11 MYB30 and MYB 106 function in Arabidopsis
MYB30 and MYB 106, as the positive transcription factors, play a role in
transcriptional regulation of Arabidopsis wax biosynthesis. MYB30
directly activates genes such as KCS, KCR1, ECR and CER2 in the fatty
acyl chains elongation and also influence other genes expression like CER3
and WIN1 (S. R. F. Vailleau et al., 2008).And MYB106 was the postive
regulator of WIN1, which could regulate not only the KCS1 and CER2
in the fatty acyl chains elongation, but also the CER1 in the alkane
formation pathway (Kannangara et al., 2007; Oshima et al., 2013).
Furthermore, MYB30 responds brassinosteroid, abscisic acid and ROS
signal activation to enhance Arabidopsis defense (L. Li et al., 2009;
Mabuchi et al., 2018; Y. Zheng, Schumaker, & Guo, 2012). MYB30 could
also regulate root cell elongation and flower development (Liu et al., 2014;
Introduction
19
Mabuchi et al., 2018) For MYB106, a role in the regulation of the trichome
development in Arabidopsis has been described (Jakoby et al., 2008).
1.12 Scope of the study
Powdery Mildew is still one of the worldwide and deleterious disease of
grapes and most of European cultivars are extremely susceptible to
Powdery Mildew (Brewer & Milgroom, 2010). Fungicides are broadly
applied for prevention and treatment of Powdery Mildew (D. M. Gadoury
et al., 1994). Viticulture consequently is a fungicide-consuming
agricultural system. However, long-term and extensive use of fungicides
not only increases production costs and environmental risks, but also is
potentially a risk for the development of the fungicide resistance. Therefore,
it is urgent to investigate the Powdery Mildew infection mechanism and
cultivate new varieties. Because Powdery Mildew produces appressoria to
invade grape epidermal cells for propagation, the epicuticular waxes
covering the surface of epidermal cells may play a role in preventing the
invasion and penetration. The surface waxes of grapevine are still poorly
understood. Several questions are thus put forward:
1. What are surface waxes morphology and distribution in the grapevine
accession?
2. How do grapevine surface waxes develop and accumulate?
3. What kind of relationship between the surface wax and the resistance to
Powdery Mildew?

Introduction
20
4. What are the key genes to be involved in the grapevine wax biosynthesis
pathway?
5. How do the genes regulate the grapevine wax biosynthesis?
To answer these questions, we have firstly screened 115 ancestor wild
grapevine collections to examine the grapevine wax structures under Cryo-
SEM, and investigate the mechanism of wax formation and accumulation
in the accession. Further the resistance to Powdery Mildew were studied.
Moreover, the relationship between the surface wax and the resistance to
Powdery Mildew has been analyzed. And the process of Powdery Mildew
invasion has been discussed preliminarily.
Furthermore, one pair of wild grapes, Ke114 and Ke35, were selected as
the materials to uncover the grapevine wax biosynthesis mechanism,
according to the SNP polygenic tree. The master regulators of wax
biosynthesis, MYB106 and MYB30, were chosen to investigate the
expression pattern in the pair and further to reveal the gene function in
grapevine wax biosynthesis mechanism. Chitosan was used as an elicitor
to check if it could regulate the promoter activity of MYB106 and MYB30,
further to regulate the grapevine wax accumulation in the study.

Materials and methods
21
2. Materials and methods
2.1 Plant material
This study was conducted using the germplasm collection established in
the Botanical Garden of the Karlsruhe Institute of Technology, and
comprised 102 genotypes, mainly from the last viable German population
for Vitis vinifera ssp. sylvestris at Ketsch peninsula in an alluvial forest at
the banks of the Rhine river between Karlsruhe and Mannheim along with
a few residual individuals from other sites of the Upper Rhine valley. In
addition, 8 V. vinifera ssp. vinifera varieties were included into the study
that are either common in German and French vineyards, along with 5
traditional landraces from Central Europe, Tunisia, and Tenerife (Canary
Archipelago). The majority of these genotypes have been fully sequenced
(Liang et al., 2019), and their phylogenetic relationships assessed based on
maximum-likelihood clustering based on genome-wide single-nucleotide
polymorphisms, which allows to group the sylvestris population into five
clades (Suppl. Fig. S2). Identity, accession codes, and origin of the
individual accessions used in this study are compiled in Suppl. Table 1.
2.2 Cryo-Scanning electron microscopy analysis (cryo-SEM)
Small leaf samples of about 5 x 5 mm were excised from freshly harvested
leaves and immediately fixed on a plane cryo transfer shuttle with

Materials and methods
22
conductive mounting medium (1:1 mix of Tissue-Tek O.C.T™
compound and colloidal graphite, Agar Scientific Ltd., Stansted, United
Kingdom). Subsequently, they were shock frozen by plunging them into
nitrogen slush (ca. -210 °C) and instantly transferred to the cryo chamber
(PP2000 T, Quorum Technologies Ltd., Laughton, United Kingdom),
which had been pre-cooled to -135 °C. Inside the cryo chamber, the sample
was sublimated at -90 °C for 15 mins (K. McDonald, 2007). To minimize
charging problems, the samples were sputtered with platinum in an Argon
atmosphere (30 s coating at a current of 5-10 mA) and finally transferred
to the cryo-stage in the SEM chamber (T = -135 °C). Imaging was carried
out with a Quanta 250 FEG field emission scanning electron microscope
(FEI, Brno, Czech Republic) under high vacuum (3*10-7 mbar) with an
Everhart-Thornley detector, a working distance of 5 mm, and an
accelerating voltage of 10 kV (Beckett & Read, 1986; K. L. McDonald,
2009; Wille et al., 2017).
2.3 Quantification of wax structures
The wax structures on the upper surface of grapevine leaves were measured
by quantitative image analysis from the digital images obtained by
scanning electron microscopy using the freeware ImageJ
(https://imagej.nih.gov/ij/). Images were converted into binary images and
inverted, such that the wax structures appeared black on a white
Materials and methods
23
background (Suppl. Fig. S1B). These structures were then automatically
selected by the Analyze Particle tool based on their size and circularity. To
exclude background noise, the minimal level for detection was set to 1
square pixels, to exclude unspecific particles, such as dust on the leaf
surface, the maximal level for detection was set to 1000 square pixels. A
circularity filter of 0-0.2 was then used to select elongated structures (wax
wings and ribs), a circularity filter of 0.2-1 selected rounder structures,
such as wax crystals. For each circularity setting, the total area of the
selected structures was recorded and set into relation of the total ROI area
to estimate the wax coverage. All experiments were measured in 3
biological replications.
2.4 Inoculation with Erysiphe necator
For infection with Erysiphe necator (the causative agent of Powdery
Mildew of Grapevine) a field isolate from a vineyard in Neustadt an der
Weinstraße (Palatinate, Germany) was used that has been maintained on
the susceptible variety V. vinifera ssp. vinifera cv. ‘Müller-Thurgau’ in the
greenhouse of the Dienstleistungszentrum Rheinland-Pfalz (Neustadt an
der Weinstraße). The pathogen culture was maintained by placing the
recipient plants between heavily infected donor plants.
The fresh, fully expanded leaves from infested plants were collected at the
stage of sporulation as source for E. necator conidia for controlled
Materials and methods
24
inoculation. Leaf discs were excised from the (fully elongated) sixth leaf
for the susceptible V. vinifera ssp. vinifera cv. ‘Müller-Thurgau’, and two
representative V. vinifera ssp. sylvestris genotypes, Ke35 (belonging to
clade C of the Ketsch population) and Ke114 (belonging to clade D of the
Ketsch population), and maintained on wet filter paper in plastic Petri
dishes (16cm diameter, 10mm height) with the adaxial side up. To simulate
natural infection, where the conidia drop from upper to lower leaves, a
paper cylinder of 60 cm height was placed on top of the leaf discs, and the
infested donor plant was shaken above the cylinder. To prevent the
inoculated leaf discs from desiccation, the petri dish was closed and
wrapped by Nescofilm. Then the specimen was incubated at 22-24°C in 16
h light/8 h dark. These leaf discs were sampled at 2, 6, 10, 14, 18 and 22 h
post inoculation (hpi). Three biological replicates with three individual
discs from three different leaves were performed.
2.5 Microscopic analysis and staging of E. necator development
The leaf discs were transferred directly abaxial side down on a slide with
around 2-3 drops of 0.1% w/v Fluorescent Brightener 28 (Sigma-Aldrich,
Deisenhofen, Germany) in 50 mM Tris HCl (pH 9) complemented with
0.1 % v/v Tween 20, and incubated 10-20 mins at room temperature.
Excess dye was rinsed off with buffer, and then the specimen was viewed
by fluorescence microscopy (Apotome, Zeiss, Jena) after adding sufficient

Materials and methods
25
buffer from side of the cover slip to allow the leaf disc to assume a flat
shape. The conidia of per leaf disc were examined using excitation at 450-
490 nm, a beam splitter at 515 nm, and a long-pass emission filter >520
nm. Conidia were classified (Rumbolz, Kassemeyer, V Steinmetz, et al.,
2000; Welter, Tisch, Kortekamp, Töpfer, & Zyprian, 2017) as illustrated in
Fig. 3-6 into different stages (stage 0, ungerminated spores; stage 1, spores
with initiated germ tubes; stage 2, spores which had developed an
appressorium; stage 3, spores that had generated a first hypha; stage 4,
spores, where a secondary hypha had appeared and stage ap*, spores with
aberrant or absent appressorium).
2.6 Grapevine cell culture
Vitis vinifera cv. ‘Pinot Noir’ and Vitis vinifera ssp. sylvestris genotype
‘Ke15’ as the grapevine cell culture materials were examined in the study.
The suspension cells originating from the callus tissue induced by the leaf
mesophyll (Seibicke, 2002), were cultured weekly by 8 or 10 mL of mother
stock cells into 100 mL Erlenmeyer flask including 30 mL of fresh liquid
MS medium, which contained 4.3 g.L−1 Murashige and Skoog salts
(Duchefa, Haarlem, The Netherlands), 1 mg.L−1 thiamine, 100 mg.L−1
inositol, 200 mg.L−1 KH2PO4, 0.2 mg.L−1 2, 4-dichlorophenoxyacetic acid
(2, 4-D) and 30 g.L−1sucrose, at pH 5.8. Then they were incubated on a
horizontal shaker (KS250 basic, IKA Labortechnik, Staufen, Germany) at

Materials and methods
26
150 rpm in the dark, 27°C.
2.7 Arabidopsis mutants and growth conditions
The Arabidopsis mutants were purchased from the TAIR website
(https://www.Arabidopsis.org/). For the Arabidopsis myb106 mutant, we
used the T-DNA–tagged line SALK_025449 (Alonso et al., 2003; Oshima
et al., 2013). And for the Arabidopsis myb30 mutant, the GABI-KAT T-
DNA line 022F04 was chosen for the complementation experiment
(Kleinboelting, Huep, Kloetgen, Viehoever, & Weisshaar, 2012; Rosso et
al., 2003; S. R. F. Vailleau et al., 2008). Furthermore, the wild type
Columbia (Col) was provided by the Botanical Garden of the KIT.
All the Arabidopsis seeds were sterilized with 1 mL 4% sodium
hypochlorite in an Eppendorf tube, shaking at room temperature for 5 mins.
Then they were centrifuged for 30 seconds at 6000 rpm, the supernatant
was discarded. Afterwards, they were washed with 1mL ddH2O for three
times and 1 mL ddH2O was added for overnight stratification at 4 °C in the
dark.
The seeds were submerged in 50 mL of 0.1% Agarose-ddH2O in a 50 mL
screw cap tube and discretely sown on solid agar media supplemented with
4.9 g.L−1 Murashige and Skoog salts (Duchefa, Haarlem, The Netherlands),
10 g.L−1 sucrose at pH 5.7 with or without kanamycin antibiotic, and
incubated at 22°C in 16h light /8h dark for two weeks. Then seedlings were
transferred into greenhouse for further experiments.
Materials and methods
27
2.8 RNA extraction
The young leaves of Vitis vinifera ssp. sylvestris genotypes ‘Ke114’ and
‘Ke35’ were sampled and quickly frozen. Then they were ground by the
Tissuelyser (Qiagen, Germany) with a frequency of 18~ 20 Hz for around
1 min. The Spectrum™ Plant Total RNA Kit (Sigma-Aldrich) was used to
extract total RNA of the genotypes ‘Ke114’ and ‘Ke35’ according to the
manufacturer’s instruction. The total RNA was treated with RNase-Free
DNase (Qiagen, Germany) to remove traces of genomic DNA. The purity
and quality were checked by the NanoDrop spectrophotometer (Radnor,
USA) and electrophoresis.
2.9 cDNA synthesis
RNA was reversely transcribed into cDNA following the two steps
methods of reverse transcription by using M-MuLV cDNA synthesis kit
(New England Biolabs; Frankfurt am Main, Germany). Firstly, the
mixtures with 1 μg of extracted RNA, 2 μL of oligo-dT (40 μM) and 1 μL
of dNTP (10mM) were incubated at 70 °C for 5 mins. Then there were
added 2 μL 10×RT buffer, 0.5 μL M-MuLV reverse transcriptase (200 U/μL)
and 0.5 μL RNase inhibitor (10U/μL) and incubated at 42 °C for 1 hour.
By increasing the temperature into 90 °C for 10 mins to finish the cDNA
synthesis.

Materials and methods
28
2.10 Quantitative real-time PCR
The mRNA expression levels of selected genes were analyzed by CFX96
Touch™ Real-Time PCR Cycler (Bio-Rad, USA), as previously described
(Duan et al., 2015; Guan et al., 2020). The related transcriptional levels
were normalized by the averaged Ct values of internal standards,
elongation factor 1α and ubiquitin (Svyatyna et al., 2014). The final data
statistics were analyzed by the 2–△△Ct method (Livak & Schmittgen, 2001).
2.11 Cloning the protein-coding regions of MYB30 and MYB106 in
Ke114 and Ke35
The templates for cloning MYB30 (accession number NM001281017) and
MYB106 (accession number XM010665048) were cDNAs from the leaves
of Vitis vinifera ssp. sylvestris genotypes ‘Ke114’ and ‘Ke35’. They were
amplified by PCR using Phusion High-Fidelity DNA polymerase (NEB,
Frankfurt, Germany) and the appropriate primers (Suppl. table 3). Then
they were cloned into the pGEM®-T Easy Vector (Promega) and
transformed into E. coli DH5α for sequence verification (Eurofins
Genomics, Germany). The phylogenetic tree was subsequently constructed
via the MEGA 7.0 software (https://www.megasoftware.net/) (Kumar,
Stecher, & Tamura, 2016), using the neighbor joining method (Felsenstein,
1985; Saitou & Nei, 1987).

Materials and methods
29
2.12 Construction of plasmids and establishment of transgenic MYB30
and MYB106 lines
To obtained the constructs p35S:MYB30-GFP, p35S:MYB106-GFP and
p35S:MYB106-RFP, gateway recombination cloning technology was used
in the study (Karimi, Inzé, & Depicker, 2002; Nakagawa, Ishiguro, &
Kimura, 2009). Firstly, the PCR fragments were cloned into pDONR
™/Zeo vector (Invitrogen Corporation, Paisley, UK) by BP cloning. Then
the plasmids were separately transferred into the pH7FWG2.0 and
pH7RWG2.0 destination binary vectors by LR cloning. After sequencing
verification, these plant expression vectors, containing GFP or RFP
reporter genes, were introduced into GV3101 strains of Agrobacterium
tumefaciens by heat shock transformation method.
The above constructs were transformed into Arabidopsis mutants by the
floral dip method, as described previously (Clough & Bent, 1998;
Logemann, Birkenbihl, Ülker, & Somssich, 2006; X. Zhang, Henriques,
Lin, Niu, & Chua, 2006). The overnight growth Agrobacterium cultures
were centrifuged at 4500 rpm for 15 mins, further resuspended in 800 mL
infiltration medium, including 2 g Murashige and Skoog salts (Duchefa,
Haarlem, The Netherlands), 40 g Sucrose, 3.4 µL Benzylaminopurine
(BAP) (Sigma-Aldrich), 400 µL Silwet L-77(Sigma-Aldrich), and 800 µL
Acetosyringone (Sigma-Aldrich), at pH 5.7.
After mixing well, the inflorescences and rosettes of Arabidopsis were
Materials and methods
30
inverted and dipped into the cell suspension for 20 seconds with a circular
motion. The plants were laid down horizontally on the prepared black box
with a plastic cover overnight. Afterwards, the plants were put upright back
to the greenhouse and grew normally until collection of the seeds.
2.13 Epidermal wax content analysis
Cuticular wax was extracted from around 6-week-old Arabidopsis stems
by immersing tissues in chloroform at room temperature for 1 min.
Afterwards, the addition docosane was added as an internal standard and
the samples were dried under stable streams of N2 gas. Then the extracted
monomers were dissolved into 100 µL of BSTFA-TMCS [N,O-
bis(trimethylsilyl)trifluoroacetamide):trimethylchlorosilane (99 : 1;
Sigma-Aldrich) ] for 30 mins at around 80-100 °C. The surplus BSTFA-
TMCS was subsequently evaporated under N2 gas. Samples were dissolved
in 200 µL hexane before being analyzed by GC/MS (gas chromatography–
mass spectrometer).
During gas chromatography, helium was used as the carrier gas (Column
flow: 1.5 mL/min and average velocity: 31.97 cm/sec). Injector and
detector temperatures were separately set at 300 °C and 310 °C. During the
run, temperature was initially set at 160°C for 1 min and increased to
200 °C by 50 °C/min, with a final hold for 1 min. Afterwards, temperature
increased again to 310 °C at 4 °C /min, then held for 10 mins. By using an
Materials and methods
31
HP-5 column (30 m x 0.320 mm, 025 µm) and an Agilent 5975 mass
spectrometric detector, the qualitative analysis were implemented
(Bourdenx et al., 2011; Oshima et al., 2013; S. R. F. Vailleau et al., 2008;
W. Wang et al., 2014).
2.14 Protein interaction between MYB30 and MYB106
The BiFC (bimolecular fluorescence complementation) constructs were
also generated by the gateway recombination cloning technology (Karimi
et al., 2002; Nakagawa et al., 2009) as mentioned. However the destination
vectors were pMAV-GW-YC, pMAV-GW-YN, pMAV-YC-GW and
pMAV-YN-GW, being derived from the pMAV4 vector (Kircher et al.,
1999). All the vectors were provided by Dr. Thomas Kretsch (Stolpe et al.,
2005). Further the plasmid of p35S:FABD2-RFP, which localized to actin,
was used as the negative control (Klotz & Nick, 2012).
A gold particle bombardment system was performed for transient
transformation assay (Maisch, Fierová, Fischer, & Nick, 2009). The split
YFP and the RFP negative control constructs (1μg of each plasmids) coated
with gold particles (1.5-3.0 μM; Sigma-Aldrich, Germany) were loaded
onto microcarriers (Bio-Rad Hercules, CA USA). Then they were shot into
three-day-old Vitis vinifera cv. ‘Pinot Noir’ cells by three times at pressure
1.5 bar under vacuum (-0.8 bar). Then the cells were incubated in dark
overnight prior to fluorescence analysis by using Apotome fluorescence
Materials and methods
32
microscope (Zeiss, Germany). The YFP fluorophores were excited at 524
nm wavelength and emission was detected at 536 nm, and RFP
fluorophores were excited at 545 nm, and emission was detected at 572 nm.
The pictures were processed by ZEN software (Zeiss, Germany).
2.15 Analysis and cloning the promoter of MYB30 and MYB106
The promoter regions of MYB30 and MYB106 genes were amplified from
Vitis vinifera ssp. sylvestris genotypes ‘Ke114’ and ‘Ke35’ genomic DNAs,
which were extracted by a CTAB method with some modifications (Doyle
& Doyle, 1987). The ground leaves were mixed with 900 µL 1.5% CTAB
(75 mM Tris, 1.05 M NaCl, 15 mM EDTA and 15 g.L−1
Cetyltrimethylammonium bromide at pH 8.0),then incubated at 65 °C for
1h. Afterwards, 630 µL Chloroform: isoamyl alcohol solution (24:1) was
added and vortexed for 15 mins, then centrifugation for 10 mins at 15,000
rpm. The supernatants were transferred into 2/3 (v/v) ice-cold isopropanol
and incubated at -20 °C for 20 mins. The samples were centrifuged for 15
mins at 15,000 rpm, 4 °C. After removing the supernatant, the pallet
containing DNA was washed with 1 mL 70% ethanol and centrifuged for
15 mins at 15,000 rpm, 4 °C, with another once 15 mins centrifugation for
drying. The genome DNA was ready for the follow experiments after
dissolving into nuclease free water.
Then the PCR products were ligated with the pGEM®-T Easy Vector
(Promega), and transformed into E. coli DH5α. The plasmids were isolated
Materials and methods
33
and analyzed for verification of the sequence (Eurofins Genomics,
Germany). The promoter fragments were aligned by the SnapGene
software (https://www.snapgene.com/). For the promoter of MYB30, 2834
bp upstream of the start codon in both two genotypes were used. In the
MYB106 promoter there were two alleles, which included 3012 bp (named
pMYB106-1) and 3015bp (named pMYB106-2) in the two accessions,
respectively. Further the putative regulatory elements were investigated
using the PlantCARE database (Lescot et al., 2002)
(http://bioinformatics.psb.ugent.be/webtools/plantcare/html/).
2.16 Promoter activity assay
For the dual-luciferase assay, the destination vector of pLUC was used to
make the constructs MYB30pro: LUC, MYB106-1pro: LUC and
MYB106-2pro: LUC by the gateway cloning technology, as mentioned
above. The MYB14/pART7 plasmid as effector of STS29pro: LUC was
transformed with the reporter as the positive control, which were kindly
provided by Prof. Dr. Jochen Bogs (DLR Neustadt). The vectors were
bombarded into three-day-old cells of Vitis vinifera cv. ‘Pinot Noir’ and
Vitis vinifera ssp. sylvestris genotype ‘Ke15’, then they were incubated in
two days. Further as the internal standard, 100 ng of a modified Renilla
luciferase vector (pRLUC, Promega) was co-bombarded to normalize and
calibrate the promoter activities (Czemmel et al., 2009; Duan et al., 2016;
Jiao, Xu, Duan, Wang, & Nick, 2016; Oshima et al., 2013).
Materials and methods
34
Twenty-four hours after the bombardment, the transiently transformed
cells were treated with chitosan as an elicitor and related solvent (acetic
acid) as the control, further incubated another 24 h (El-kenawy, 2017; Portu,
López, Baroja, Santamaría, & Garde-Cerdán, 2016). Then they were
ground around 1-2 min in 200 μL of 2 × passive lysis buffers (PLB,
Promega, Madison, WI) on ice. 20 μL supernatant was separately added 50
μL Beetle juice and 50 μL Renilla Glow Juice (PJK, Kleinbittersdorf,
Germany), after centrifugation of 1 min at 10,000 rpm. Firefly
luminescence and Renilla luminescence were recorded by Lumat LB9507
luminometer (Berthold Technologies, Bad Wildbad Germany). All
experiments were measured in technical triplicates and 4 biological
replications.
Results
35
3. Results
3.1 Different types of surface wax structures depend on genotype and
on cell differentiation in Vitis.
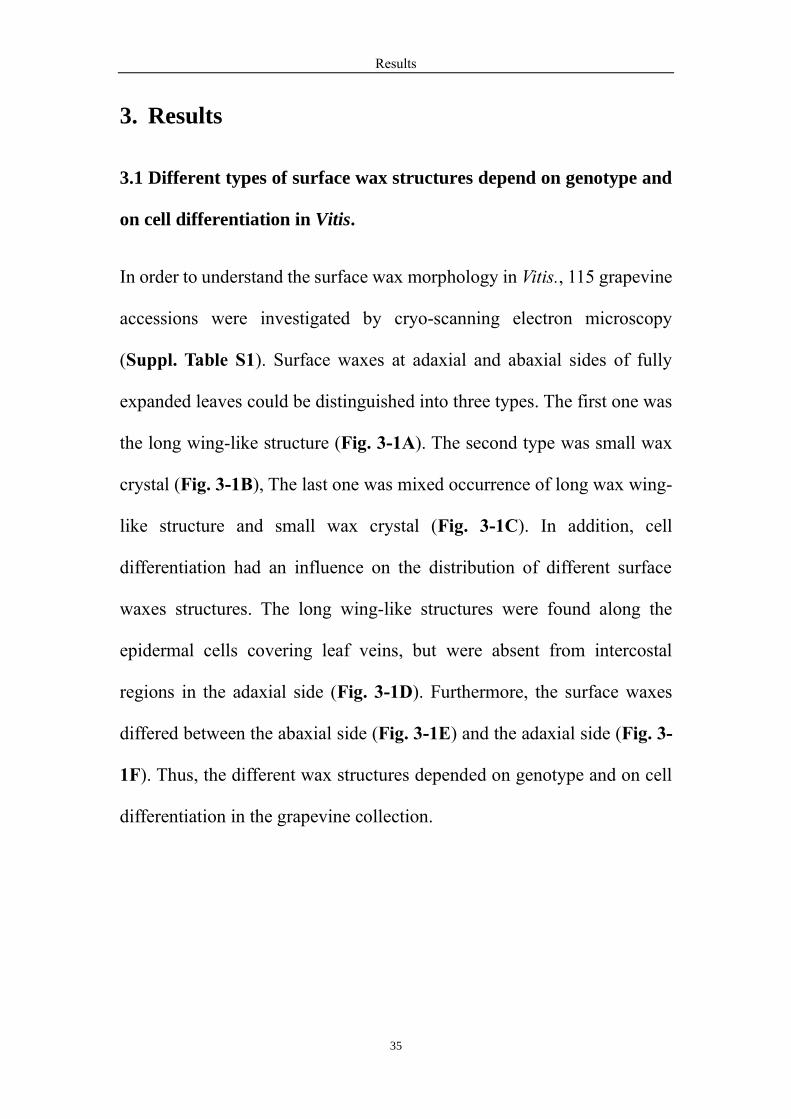
In order to understand the surface wax morphology in Vitis., 115 grapevine
accessions were investigated by cryo-scanning electron microscopy
(Suppl. Table S1). Surface waxes at adaxial and abaxial sides of fully
expanded leaves could be distinguished into three types. The first one was
the long wing-like structure (Fig. 3-1A). The second type was small wax
crystal (Fig. 3-1B), The last one was mixed occurrence of long wax wing-
like structure and small wax crystal (Fig. 3-1C). In addition, cell
differentiation had an influence on the distribution of different surface
waxes structures. The long wing-like structures were found along the
epidermal cells covering leaf veins, but were absent from intercostal
regions in the adaxial side (Fig. 3-1D). Furthermore, the surface waxes
differed between the abaxial side (Fig. 3-1E) and the adaxial side (Fig. 3-
1F). Thus, the different wax structures depended on genotype and on cell
differentiation in the grapevine collection.
Results
36
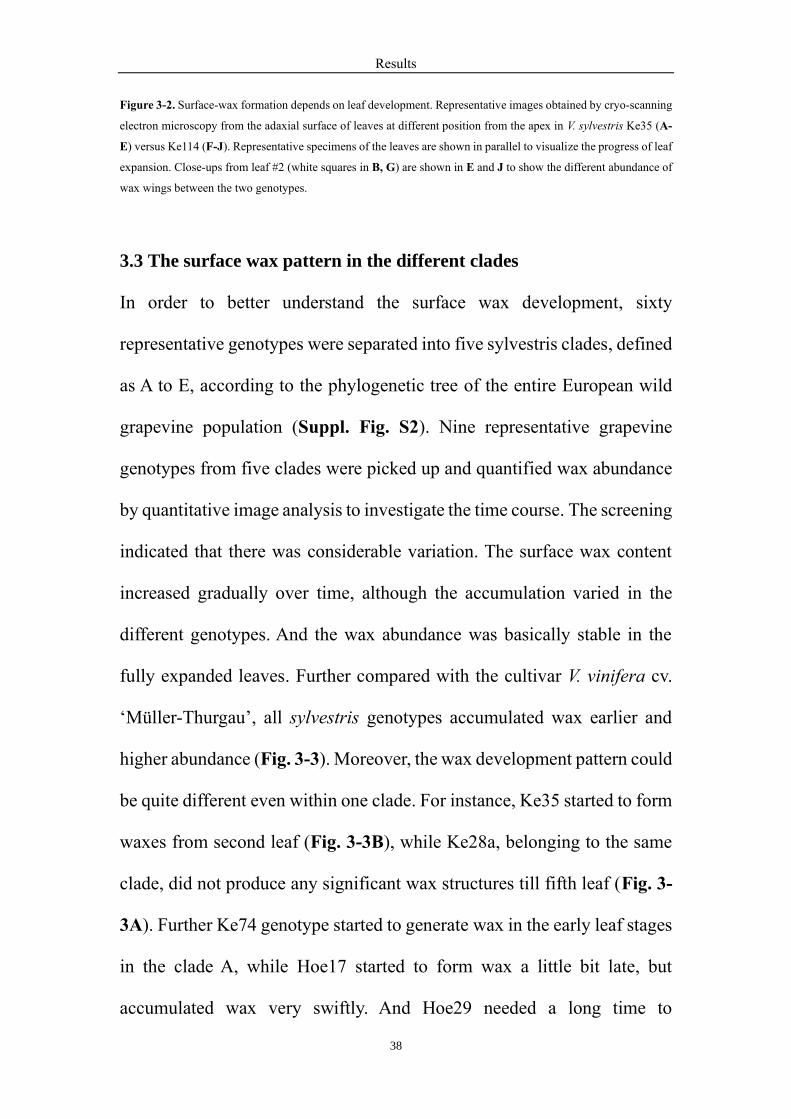
Figure 3-1. Surface-wax structures depend on genotype and on cell differentiation in Vitis. Representative images
obtained by cryo-scanning electron microscopy from fully expanded leaves. A-C Different structures of surface
waxes from intercostal regions at the adaxial side to illustrate different structures of surface waxes, such as A long
wax wings in V. sylvestris Ke28c, B small wax crystals in V. sylvestris Ke114, C mixed occurrence of long wax
wings and small wax crystals in V. sylvestris Ke23. D-F Cell type differences of surface waxes. D Long wax wings
are found along the epidermal cells covering leaf veins, but are absent from intercostal regions in the adaxial side in
V. vinifera cv. ‘Müller-Thurgau’. E, F Surface waxes differ between the abaxial (E) and the adaxial (F) side in V.
rupestris.
3.2 The time course of surface wax formation depends on leaf
development
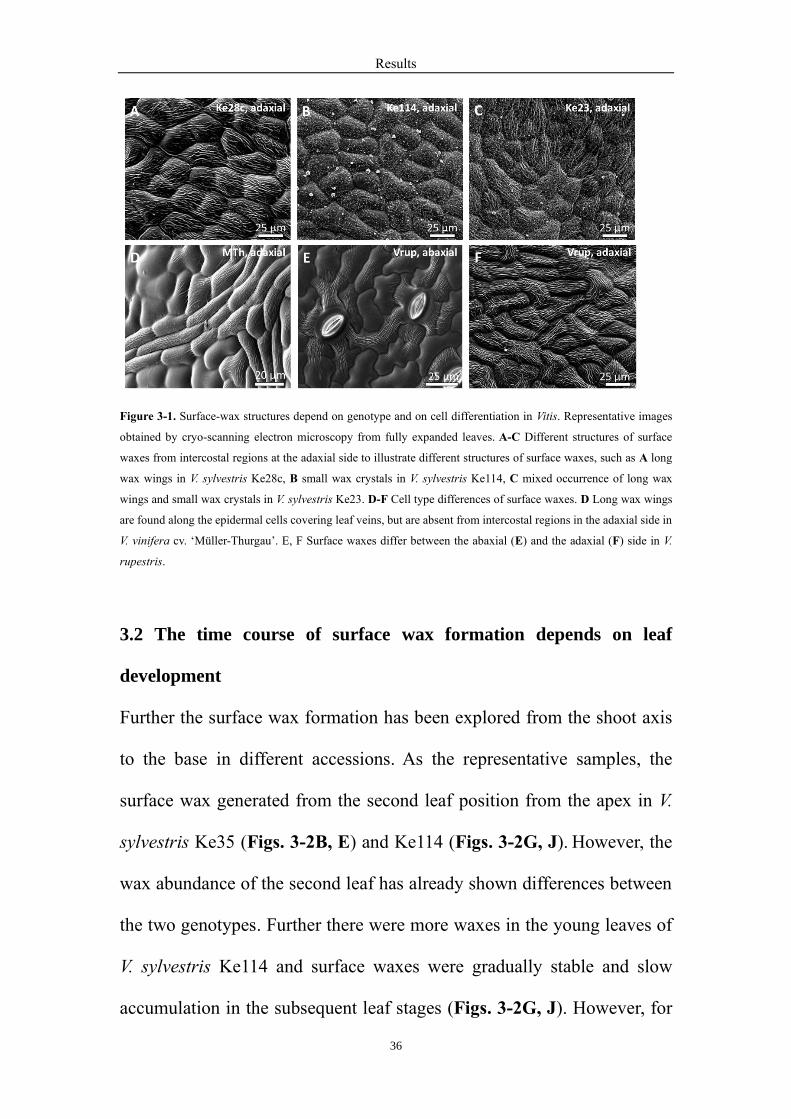
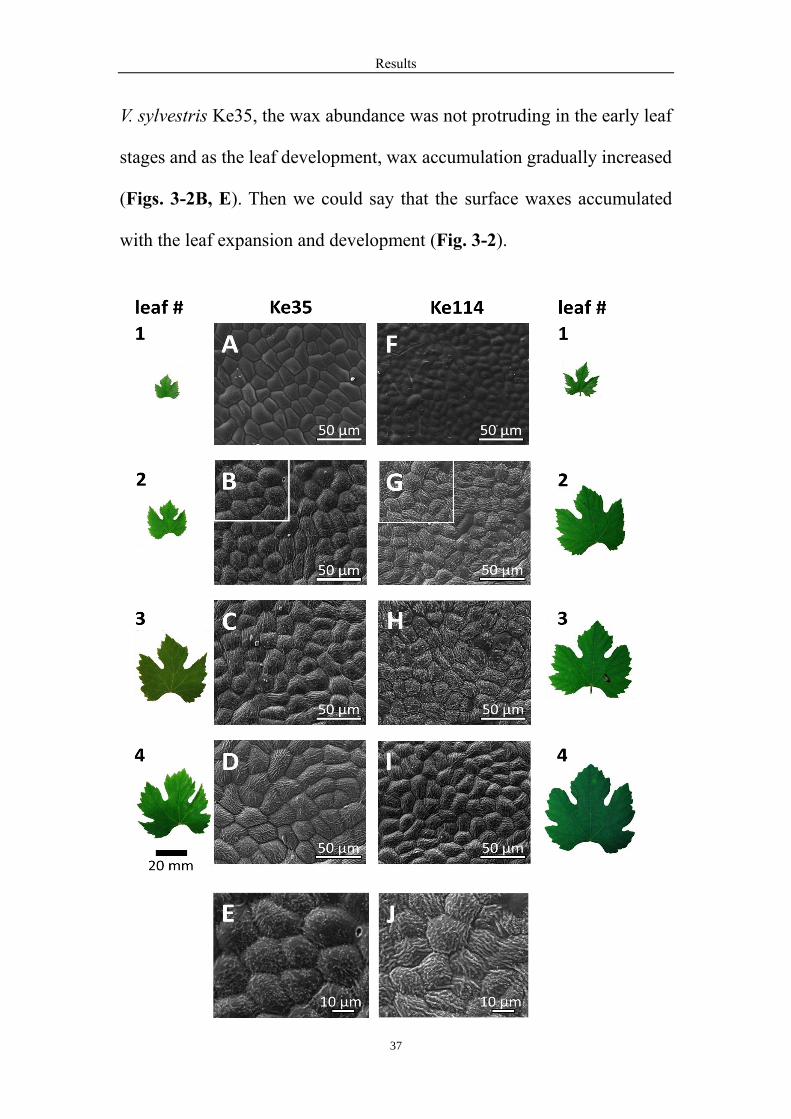
Further the surface wax formation has been explored from the shoot axis
to the base in different accessions. As the representative samples, the
surface wax generated from the second leaf position from the apex in V.
sylvestris Ke35 (Figs. 3-2B, E) and Ke114 (Figs. 3-2G, J). However, the
wax abundance of the second leaf has already shown differences between
the two genotypes. Further there were more waxes in the young leaves of
V. sylvestris Ke114 and surface waxes were gradually stable and slow
accumulation in the subsequent leaf stages (Figs. 3-2G, J). However, for
Results
37
V. sylvestris Ke35, the wax abundance was not protruding in the early leaf
stages and as the leaf development, wax accumulation gradually increased
(Figs. 3-2B, E). Then we could say that the surface waxes accumulated
with the leaf expansion and development (Fig. 3-2).
Results
38
Figure 3-2. Surface-wax formation depends on leaf development. Representative images obtained by cryo-scanning
electron microscopy from the adaxial surface of leaves at different position from the apex in V. sylvestris Ke35 (A-
E) versus Ke114 (F-J). Representative specimens of the leaves are shown in parallel to visualize the progress of leaf
expansion. Close-ups from leaf #2 (white squares in B, G) are shown in E and J to show the different abundance of
wax wings between the two genotypes.
3.3 The surface wax pattern in the different clades
In order to better understand the surface wax development, sixty
representative genotypes were separated into five sylvestris clades, defined
as A to E, according to the phylogenetic tree of the entire European wild
grapevine population (Suppl. Fig. S2). Nine representative grapevine
genotypes from five clades were picked up and quantified wax abundance
by quantitative image analysis to investigate the time course. The screening
indicated that there was considerable variation. The surface wax content
increased gradually over time, although the accumulation varied in the
different genotypes. And the wax abundance was basically stable in the
fully expanded leaves. Further compared with the cultivar V. vinifera cv.
‘Müller-Thurgau’, all sylvestris genotypes accumulated wax earlier and
higher abundance (Fig. 3-3). Moreover, the wax development pattern could
be quite different even within one clade. For instance, Ke35 started to form
waxes from second leaf (Fig. 3-3B), while Ke28a, belonging to the same
clade, did not produce any significant wax structures till fifth leaf (Fig. 3-
3A). Further Ke74 genotype started to generate wax in the early leaf stages
in the clade A, while Hoe17 started to form wax a little bit late, but
accumulated wax very swiftly. And Hoe29 needed a long time to
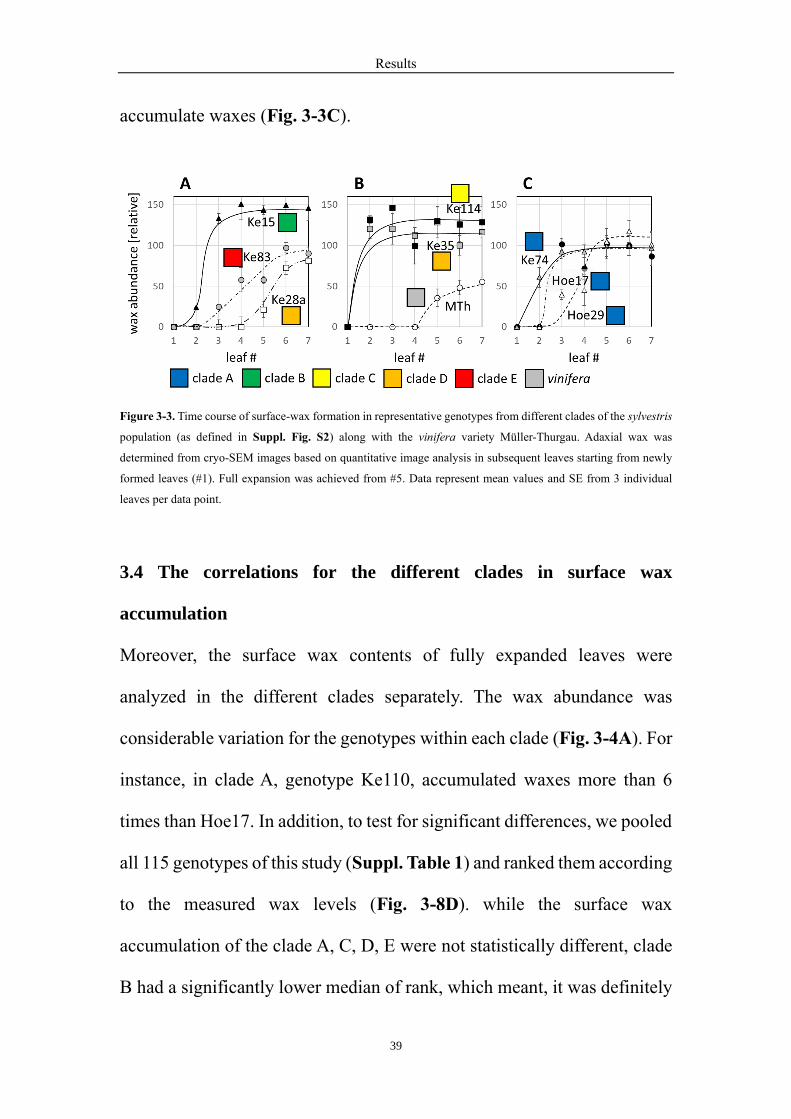
Results
39
accumulate waxes (Fig. 3-3C).
Figure 3-3. Time course of surface-wax formation in representative genotypes from different clades of the sylvestris
population (as defined in Suppl. Fig. S2) along with the vinifera variety Müller-Thurgau. Adaxial wax was
determined from cryo-SEM images based on quantitative image analysis in subsequent leaves starting from newly
formed leaves (#1). Full expansion was achieved from #5. Data represent mean values and SE from 3 individual
leaves per data point.
3.4 The correlations for the different clades in surface wax
accumulation
Moreover, the surface wax contents of fully expanded leaves were
analyzed in the different clades separately. The wax abundance was
considerable variation for the genotypes within each clade (Fig. 3-4A). For
instance, in clade A, genotype Ke110, accumulated waxes more than 6
times than Hoe17. In addition, to test for significant differences, we pooled
all 115 genotypes of this study (Suppl. Table 1) and ranked them according
to the measured wax levels (Fig. 3-8D). while the surface wax
accumulation of the clade A, C, D, E were not statistically different, clade
B had a significantly lower median of rank, which meant, it was definitely
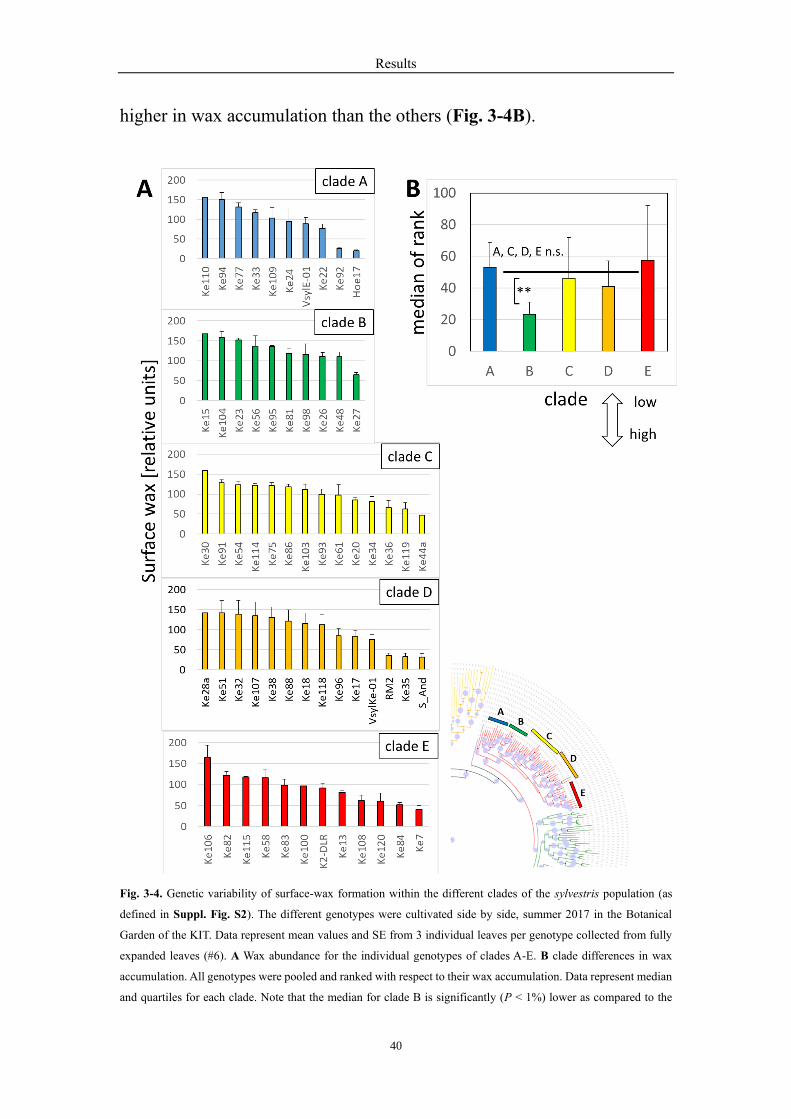
Results
40
higher in wax accumulation than the others (Fig. 3-4B).
Fig. 3-4. Genetic variability of surface-wax formation within the different clades of the sylvestris population (as
defined in Suppl. Fig. S2). The different genotypes were cultivated side by side, summer 2017 in the Botanical
Garden of the KIT. Data represent mean values and SE from 3 individual leaves per genotype collected from fully
expanded leaves (#6). A Wax abundance for the individual genotypes of clades A-E. B clade differences in wax
accumulation. All genotypes were pooled and ranked with respect to their wax accumulation. Data represent median
and quartiles for each clade. Note that the median for clade B is significantly (P < 1%) lower as compared to the
Results
41
other clades based on a non-parametrical Kruskal-Wallis test meaning that clade B overall accumulates more wax
than the other clades.
3.5 The link between surface wax content and Powdery Mildew
susceptibility
During the process of Powdery Mildew infection, spores penetrate and
invade into the host cells by specialized infectious structure called
appressorium. The successful invasion depended on the interaction with the
leaf surface (Armijo et al., 2016; David M. Gadoury, Cadle-Davidson,
Wilcox, Dry, See, et al., 2012; Qiu et al., 2015; Rumbolz, Kassemeyer,
Steinmetz, et al., 2000). Therefore, we have assumed that the surface wax
abundance may have a relationship with the infection process of Powdery
Mildew. To verify the hypothesis, Powdery Mildew susceptibility of the
representative grapevine genotypes were studied by Dr. Christine Tisch
(Tisch, 2017). Then we ranked a set of 83 genotypes according to Powdery
Mildew susceptibility (Suppl. Fig. S4). Low numbers represented a high
degree of resistance, high numbers a high degree of susceptibility. Then we
plotted the ranks obtained for symptom of Powdery Mildew susceptibility
over those obtained for wax abundance (Fig. 3-5A). Up to rank 70 for wax
abundance, susceptibility was unchanged and relatively low. However,
above this threshold, an increase in the rank for wax abundance was
accompanied by a concomitant increase of susceptibility, which meant that
as long as a certain wax abundance was maintained, the Powdery Mildew
susceptibility was constantly low, but when wax abundance was below the
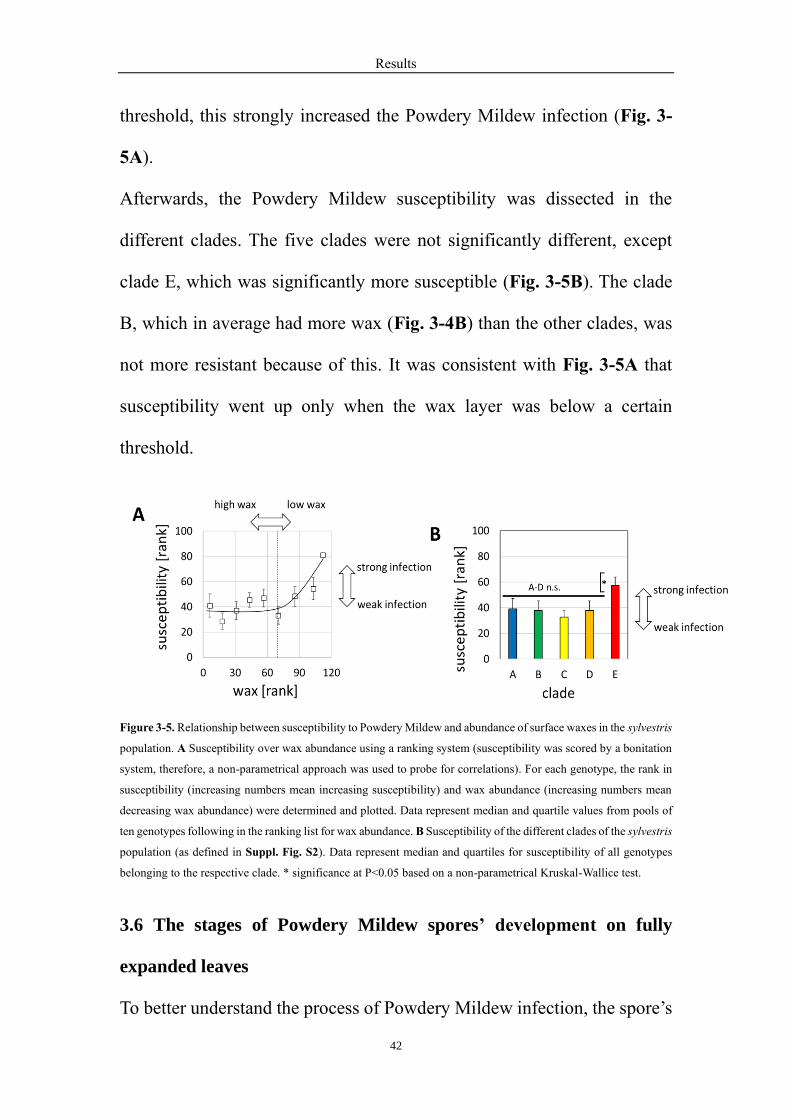
Results
42
threshold, this strongly increased the Powdery Mildew infection (Fig. 3-
5A).
Afterwards, the Powdery Mildew susceptibility was dissected in the
different clades. The five clades were not significantly different, except
clade E, which was significantly more susceptible (Fig. 3-5B). The clade
B, which in average had more wax (Fig. 3-4B) than the other clades, was
not more resistant because of this. It was consistent with Fig. 3-5A that
susceptibility went up only when the wax layer was below a certain
threshold.
Figure 3-5. Relationship between susceptibility to Powdery Mildew and abundance of surface waxes in the sylvestris
population. A Susceptibility over wax abundance using a ranking system (susceptibility was scored by a bonitation
system, therefore, a non-parametrical approach was used to probe for correlations). For each genotype, the rank in
susceptibility (increasing numbers mean increasing susceptibility) and wax abundance (increasing numbers mean
decreasing wax abundance) were determined and plotted. Data represent median and quartile values from pools of
ten genotypes following in the ranking list for wax abundance. B Susceptibility of the different clades of the sylvestris
population (as defined in Suppl. Fig. S2). Data represent median and quartiles for susceptibility of all genotypes
belonging to the respective clade. * significance at P<0.05 based on a non-parametrical Kruskal-Wallice test.
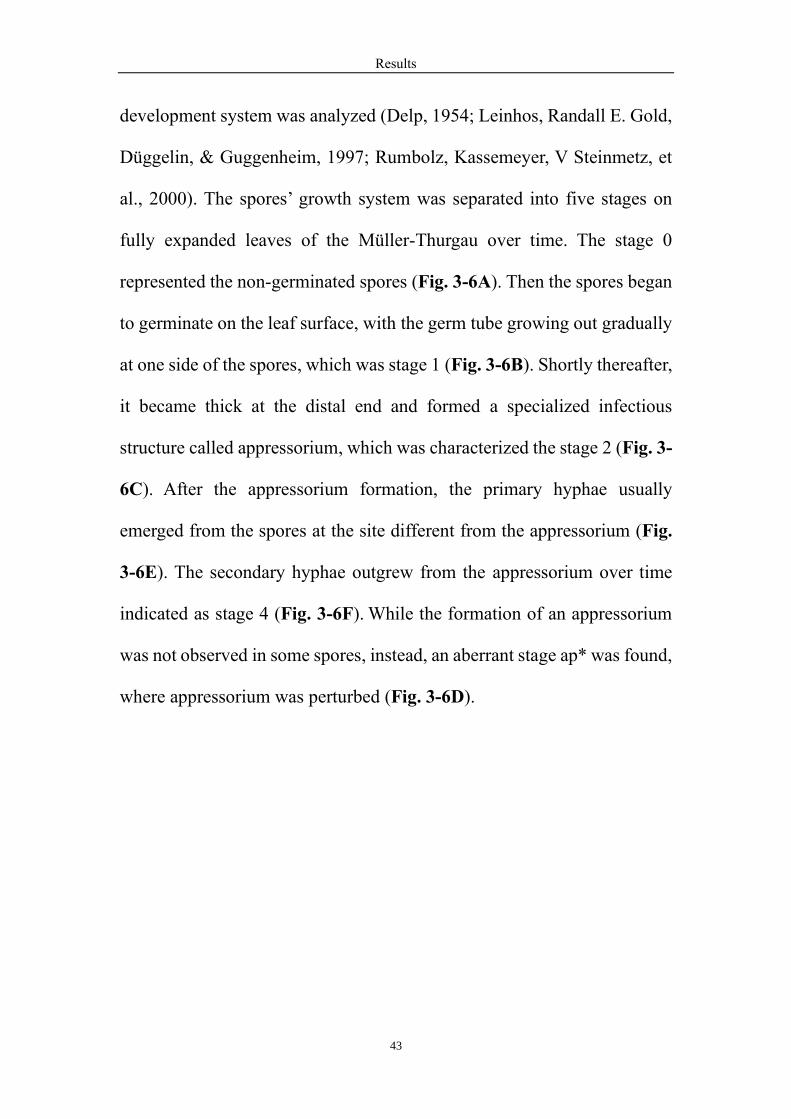
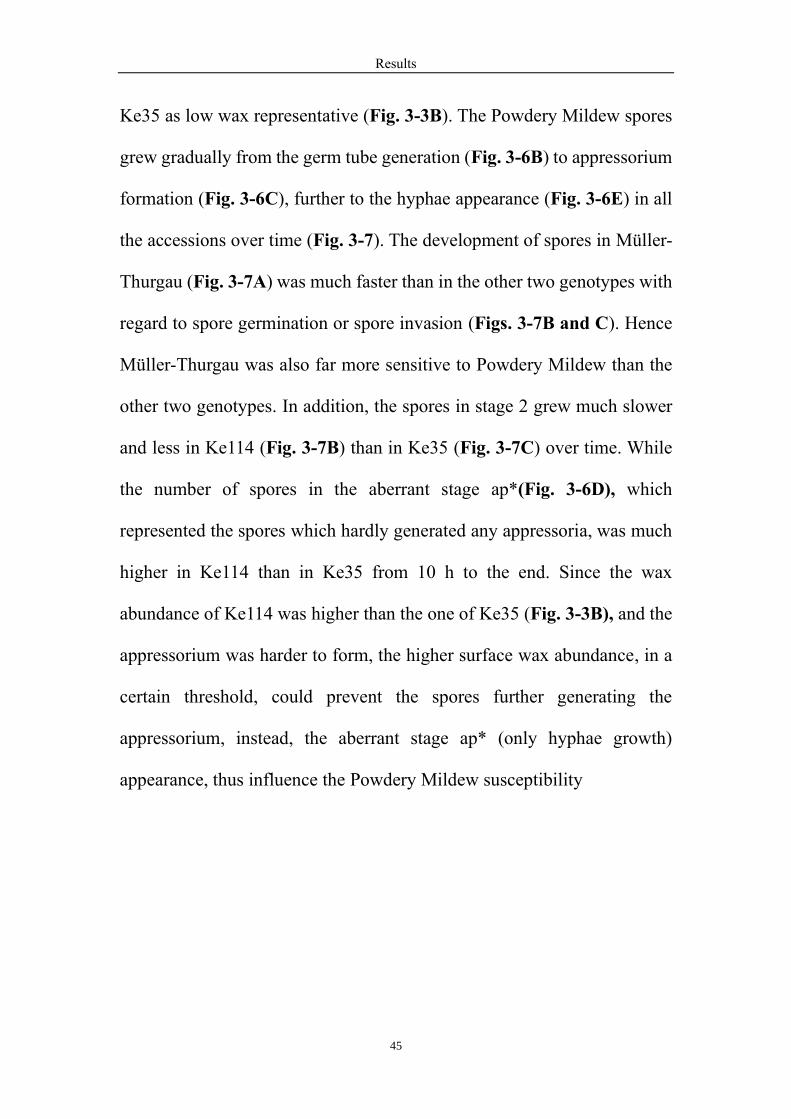
3.6 The stages of Powdery Mildew spores’ development on fully
expanded leaves
To better understand the process of Powdery Mildew infection, the spore’s
Results
43
development system was analyzed (Delp, 1954; Leinhos, Randall E. Gold,
Düggelin, & Guggenheim, 1997; Rumbolz, Kassemeyer, V Steinmetz, et
al., 2000). The spores’ growth system was separated into five stages on
fully expanded leaves of the Müller-Thurgau over time. The stage 0
represented the non-germinated spores (Fig. 3-6A). Then the spores began
to germinate on the leaf surface, with the germ tube growing out gradually
at one side of the spores, which was stage 1 (Fig. 3-6B). Shortly thereafter,
it became thick at the distal end and formed a specialized infectious
structure called appressorium, which was characterized the stage 2 (Fig. 3-
6C). After the appressorium formation, the primary hyphae usually
emerged from the spores at the site different from the appressorium (Fig.
3-6E). The secondary hyphae outgrew from the appressorium over time
indicated as stage 4 (Fig. 3-6F). While the formation of an appressorium
was not observed in some spores, instead, an aberrant stage ap* was found,
where appressorium was perturbed (Fig. 3-6D).
Results
44
Figure 3-6. Stageing of Powdery Mildew development on fully expanded leaves of V. sylvestris assessed by
fluorescence microscopy after staining with Fluorescent Brightener 28. A Stage 0 (ungerminated spores). B Stage 1
characterized by the emergence of a germ tube (gt). C Stage 2 characterized by the formation of an appressorium
(ap). while the formation of an appressorium was not observed, instead, an aberrant stage ap* D was found, where
appressorium was perturbed E Stage 3 characterized by the outgrowth of a primary hyphae (ph) from the spore at
sites different from the appressorium. F Stage 4 characterized by the outgrowth of a secondary hyphae (sh) from the
appressorium.
3.7 Abundant surface wax can interfere with appressorium formation
As mentioned before, the wax abundance, in a certain threshold, would
influence the Powdery Mildew susceptibility of the plant (Fig. 3-5).
Further how the wax abundance changing the infection process as a
question should be solved. Three represented genotypes were chosen to
investigate, Müller-Thurgau as control, Ke114 as high wax representative,
Results
45
Ke35 as low wax representative (Fig. 3-3B). The Powdery Mildew spores
grew gradually from the germ tube generation (Fig. 3-6B) to appressorium
formation (Fig. 3-6C), further to the hyphae appearance (Fig. 3-6E) in all
the accessions over time (Fig. 3-7). The development of spores in Müller-
Thurgau (Fig. 3-7A) was much faster than in the other two genotypes with
regard to spore germination or spore invasion (Figs. 3-7B and C). Hence
Müller-Thurgau was also far more sensitive to Powdery Mildew than the
other two genotypes. In addition, the spores in stage 2 grew much slower
and less in Ke114 (Fig. 3-7B) than in Ke35 (Fig. 3-7C) over time. While
the number of spores in the aberrant stage ap*(Fig. 3-6D), which
represented the spores which hardly generated any appressoria, was much
higher in Ke114 than in Ke35 from 10 h to the end. Since the wax
abundance of Ke114 was higher than the one of Ke35 (Fig. 3-3B), and the
appressorium was harder to form, the higher surface wax abundance, in a
certain threshold, could prevent the spores further generating the
appressorium, instead, the aberrant stage ap* (only hyphae growth)
appearance, thus influence the Powdery Mildew susceptibility

Results
46
Figure 3-7. Development of Powdery Mildew on leaves of the V. vinifera variety Müller-Thurgau (A) as compared
to the V. sylvestris genotypes Ke35 (B), and Ke114 (C). Frequencies of the different stages as defined in Fig.3-6
have been plotted over time in hours post infection (hpi). Data represent mean and standard errors from three
biological replicates conducted in fully expanded leaves (#6). Stage ap* represents the aberrant stage found on
sylvestris leaves, where appressorium development is affected.
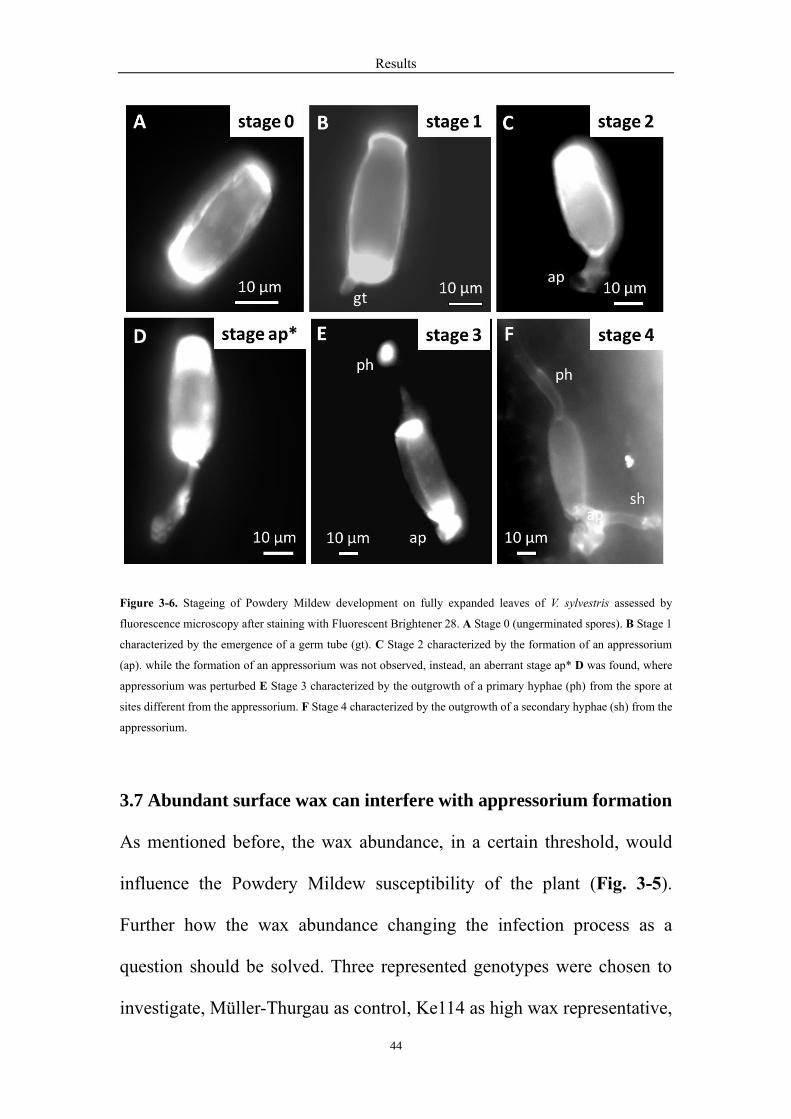
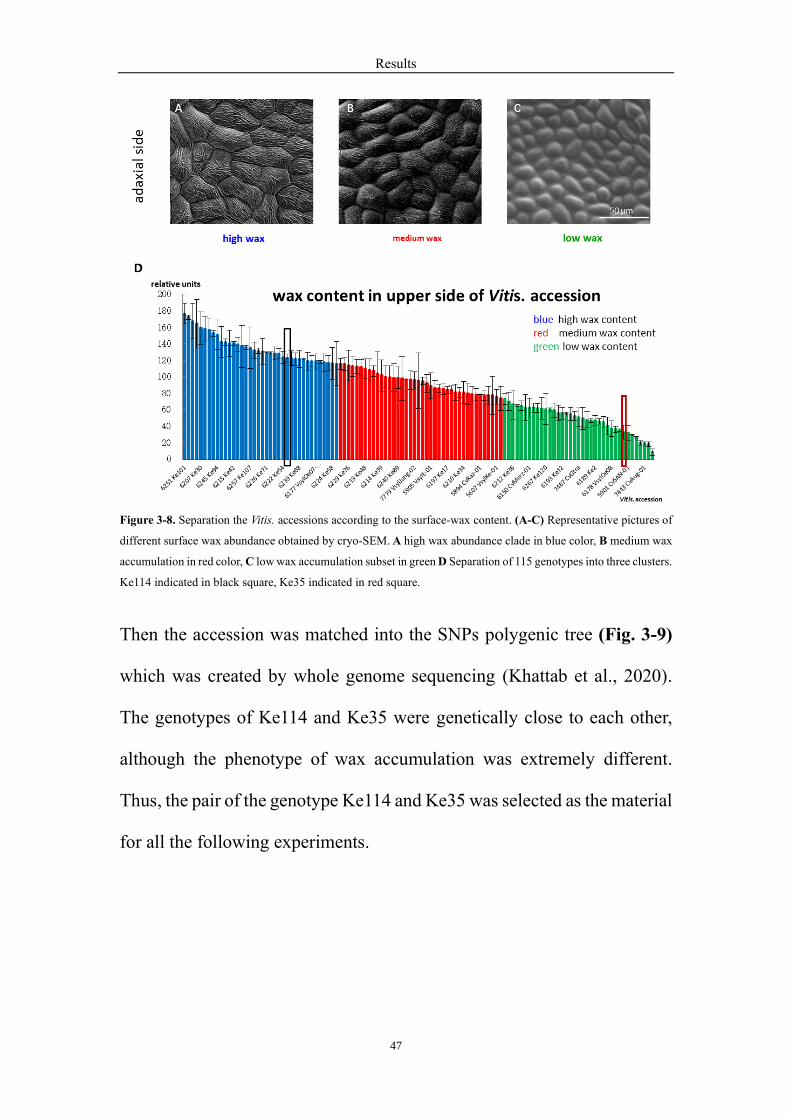
3.8 The genotypes of Ke114 and Ke35 are close relationship, though
the phenotypes are extremely different
In order to understand the relationship in the 115 V. sylvestris accessions,
they were separated into three clades (Fig. 3-8), high wax abundance clade
(Fig. 3-8A), medium wax accumulation group (Fig. 3-8B) and low wax
accumulation subset (Fig. 3-8C) according to the surface wax content.
Results
47
Figure 3-8. Separation the Vitis. accessions according to the surface-wax content. (A-C) Representative pictures of
different surface wax abundance obtained by cryo-SEM. A high wax abundance clade in blue color, B medium wax
accumulation in red color, C low wax accumulation subset in green D Separation of 115 genotypes into three clusters.
Ke114 indicated in black square, Ke35 indicated in red square.
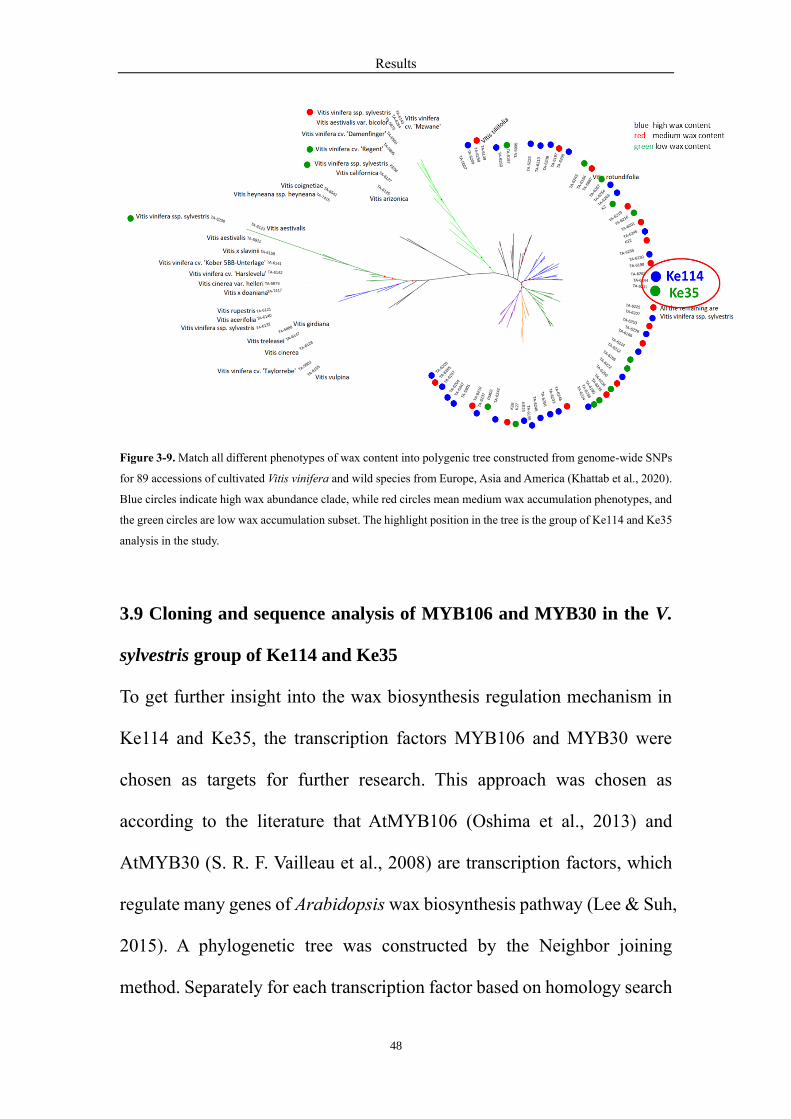
Then the accession was matched into the SNPs polygenic tree (Fig. 3-9)
which was created by whole genome sequencing (Khattab et al., 2020).
The genotypes of Ke114 and Ke35 were genetically close to each other,
although the phenotype of wax accumulation was extremely different.
Thus, the pair of the genotype Ke114 and Ke35 was selected as the material
for all the following experiments.
Results
48
Figure 3-9. Match all different phenotypes of wax content into polygenic tree constructed from genome-wide SNPs
for 89 accessions of cultivated Vitis vinifera and wild species from Europe, Asia and America (Khattab et al., 2020).
Blue circles indicate high wax abundance clade, while red circles mean medium wax accumulation phenotypes, and
the green circles are low wax accumulation subset. The highlight position in the tree is the group of Ke114 and Ke35
analysis in the study.
3.9 Cloning and sequence analysis of MYB106 and MYB30 in the V.
sylvestris group of Ke114 and Ke35
To get further insight into the wax biosynthesis regulation mechanism in
Ke114 and Ke35, the transcription factors MYB106 and MYB30 were
chosen as targets for further research. This approach was chosen as
according to the literature that AtMYB106 (Oshima et al., 2013) and
AtMYB30 (S. R. F. Vailleau et al., 2008) are transcription factors, which
regulate many genes of Arabidopsis wax biosynthesis pathway (Lee & Suh,
2015). A phylogenetic tree was constructed by the Neighbor joining
method. Separately for each transcription factor based on homology search
Results
49
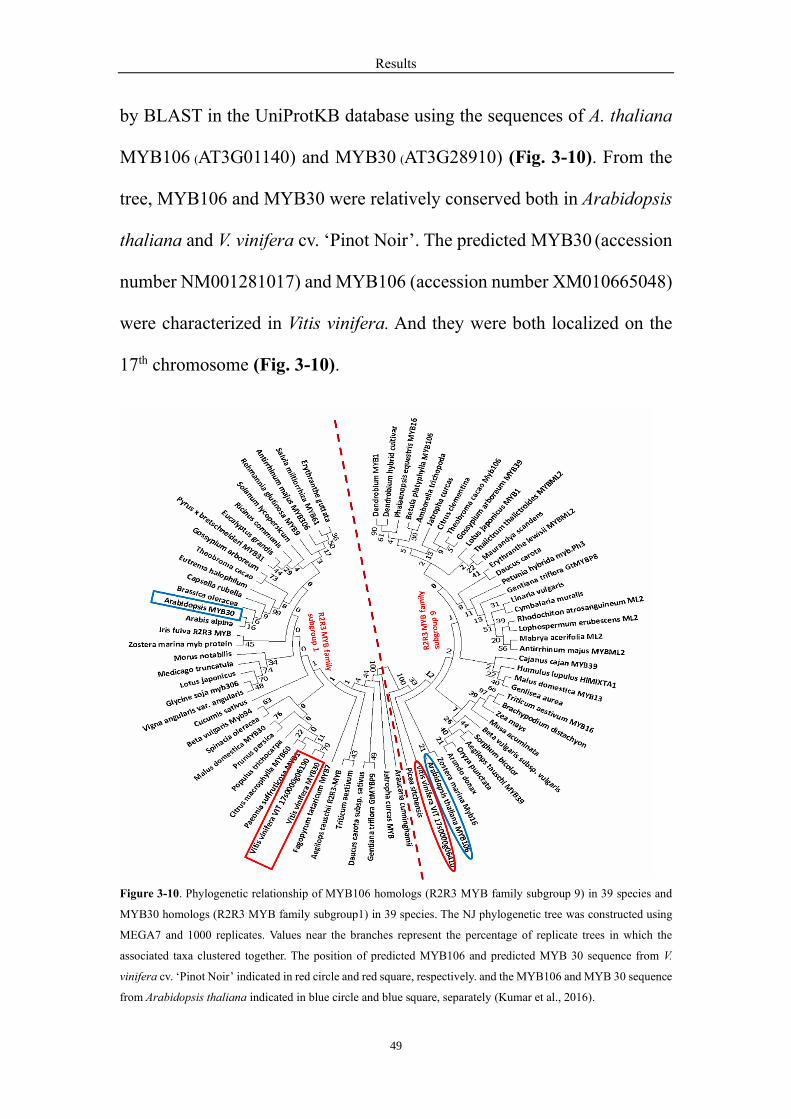
by BLAST in the UniProtKB database using the sequences of A. thaliana
MYB106 (AT3G01140) and MYB30 (AT3G28910) (Fig. 3-10). From the
tree, MYB106 and MYB30 were relatively conserved both in Arabidopsis
thaliana and V. vinifera cv. ‘Pinot Noir’. The predicted MYB30 (accession
number NM001281017) and MYB106 (accession number XM010665048)
were characterized in Vitis vinifera. And they were both localized on the
17th chromosome (Fig. 3-10).
Figure 3-10. Phylogenetic relationship of MYB106 homologs (R2R3 MYB family subgroup 9) in 39 species and
MYB30 homologs (R2R3 MYB family subgroup1) in 39 species. The NJ phylogenetic tree was constructed using
MEGA7 and 1000 replicates. Values near the branches represent the percentage of replicate trees in which the
associated taxa clustered together. The position of predicted MYB106 and predicted MYB 30 sequence from V.
vinifera cv. ‘Pinot Noir’ indicated in red circle and red square, respectively. and the MYB106 and MYB 30 sequence
from Arabidopsis thaliana indicated in blue circle and blue square, separately (Kumar et al., 2016).

Results
50
Afterwards, the coding sequences of MYB106 and MYB30 in Ke114 and
Ke35 were identified, respectively. For MYB106, there were two alleles,
named D-MYB106 and S-MYB106 (Fig. 3-11A and Suppl. Fig. S5), both
in the Ke114 and Ke35.There were four SNPs in the two types of MYB106.
And among them, three SNPs changed amino acids. In the first site,
threonine changing into proline (T10P), was near the SANT domain, which
had DNA binding function. The mutation in the second site resulted in a
change of serine into alanine(S27A), was within the SANT domain. In the
last site, phenylalanine was changed into Leucine (F331L). For MYB30,
same with MYB106, it was heterozygous both in the Ke114 and Ke35, and
two alleles of MYB30 were named D-MYB30 and S-MYB30 (Fig. 3-11B
and Suppl. Fig. S5). The SNPs in Ke114 and Ke35 caused two different
amino acids in the respective position of MYB30. In the P42T site, proline
was changed into threonine in the SANT domain. In the other site, valine
was changed into alanine(V304A).
The predicted 3D protein structure of the various types of MYB106 and
MYB30 are shown in Fig. 3-11C and D. The sites of T10P and S27A in
MYB106 (Fig. 3-11C), in addition, P42T site in the MYB30 (Fig. 3-11D)
were in or nearly the DNA binding sequence according to the 3D protein
structure model of the template 3zqc.3. Taken together, because of
molecular backbone of proline and nucleophilic property of serine, the
T10P, S27A and P42T substitution sites maybe play a role in regulation

Results
51
DNA binding function of MYB106 and MYB30.
Figure 3-11. Protein sequence analysis of MYB106 (A and C) and MYB30 (B and D) in the V. sylvestris genotypes
Ke35 and Ke114. A Predicted domains in the two alleles of MYB106 in the group of genotypes Ke35 and Ke114.
The mutant sites in the two alleles of MYB106 were identified. The SNP sites indicated in red between the D-
MYB106 and S-MYB106. Details shown in the Appendix. B Predicted domains in the two alleles of MYB30 in the
group of genotypes Ke35 and Ke114.The variation sites in the two alleles of MYB30 were identified. The SNP sites
indicated in red between the D-MYB30 and S-MYB30. SANT, DNA binding domain. C Mapping of the T20P and
S27A sites (red squares) in the three‐dimensional structure of two alleles of MYB106 and template 3zqc.3 (SWTL
ID). D-MYB106(orange), S-MYB106(violet), 3zqc.3(deep teal). D Mapping of the P42T site (red square) in the
three‐dimensional structure of two alleles of MYB30 and template 3zqc.3(SWTL ID). D-MYB30(orange), S-
MYB30(violet), 3zqc.3(deep teal).
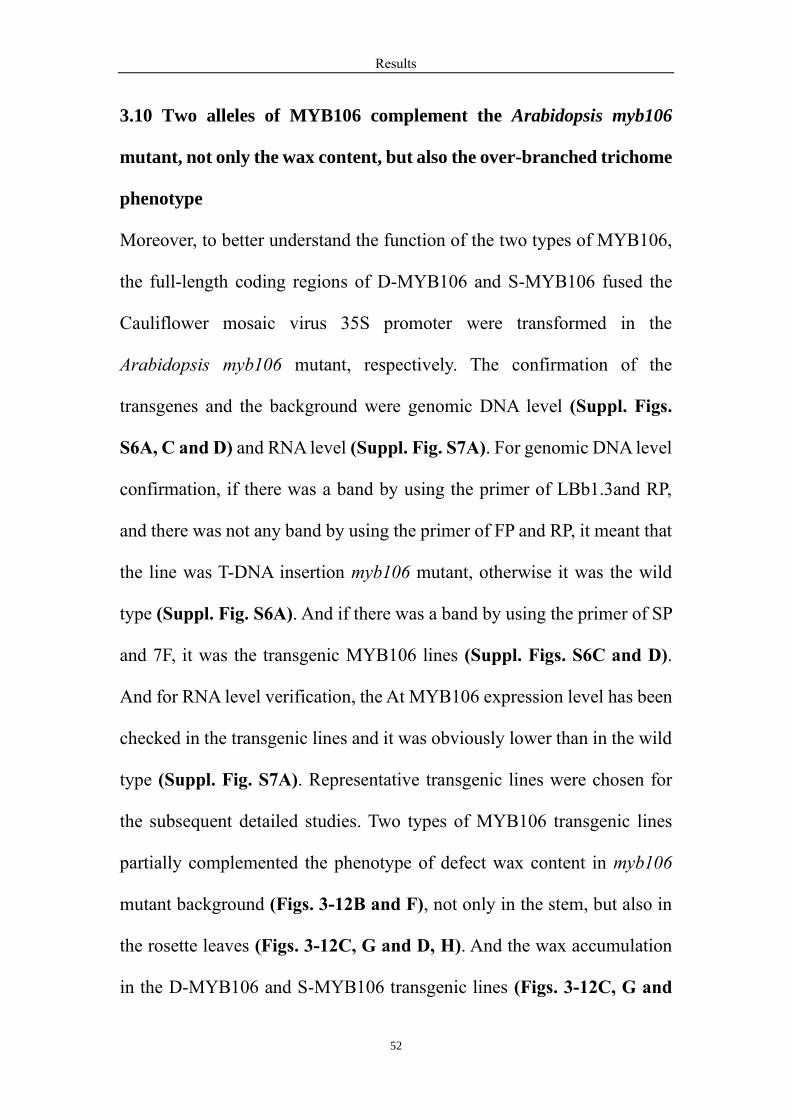
Results
52
3.10 Two alleles of MYB106 complement the Arabidopsis myb106
mutant, not only the wax content, but also the over-branched trichome
phenotype
Moreover, to better understand the function of the two types of MYB106,
the full-length coding regions of D-MYB106 and S-MYB106 fused the
Cauliflower mosaic virus 35S promoter were transformed in the
Arabidopsis myb106 mutant, respectively. The confirmation of the
transgenes and the background were genomic DNA level (Suppl. Figs.
S6A, C and D) and RNA level (Suppl. Fig. S7A). For genomic DNA level
confirmation, if there was a band by using the primer of LBb1.3and RP,
and there was not any band by using the primer of FP and RP, it meant that
the line was T-DNA insertion myb106 mutant, otherwise it was the wild
type (Suppl. Fig. S6A). And if there was a band by using the primer of SP
and 7F, it was the transgenic MYB106 lines (Suppl. Figs. S6C and D).
And for RNA level verification, the At MYB106 expression level has been
checked in the transgenic lines and it was obviously lower than in the wild
type (Suppl. Fig. S7A). Representative transgenic lines were chosen for
the subsequent detailed studies. Two types of MYB106 transgenic lines
partially complemented the phenotype of defect wax content in myb106
mutant background (Figs. 3-12B and F), not only in the stem, but also in
the rosette leaves (Figs. 3-12C, G and D, H). And the wax accumulation
in the D-MYB106 and S-MYB106 transgenic lines (Figs. 3-12C, G and
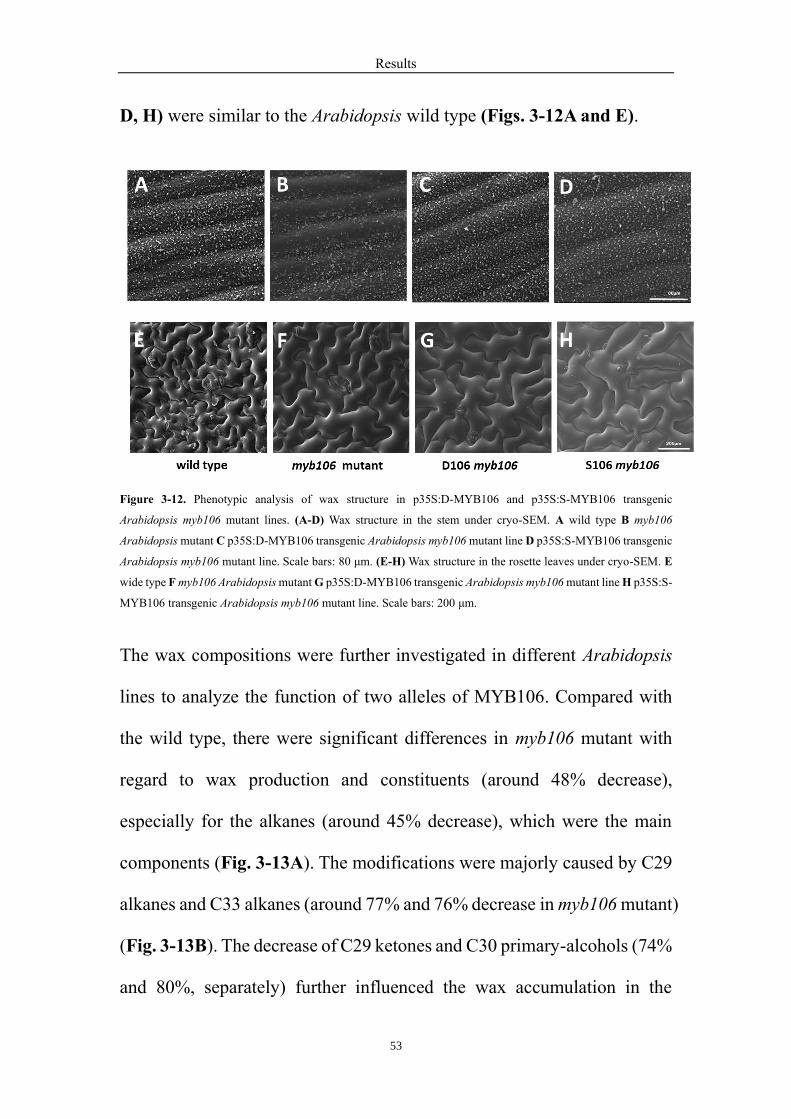
Results
53
D, H) were similar to the Arabidopsis wild type (Figs. 3-12A and E).
Figure 3-12. Phenotypic analysis of wax structure in p35S:D-MYB106 and p35S:S-MYB106 transgenic
Arabidopsis myb106 mutant lines. (A-D) Wax structure in the stem under cryo-SEM. A wild type B myb106
Arabidopsis mutant C p35S:D-MYB106 transgenic Arabidopsis myb106 mutant line D p35S:S-MYB106 transgenic
Arabidopsis myb106 mutant line. Scale bars: 80 μm. (E-H) Wax structure in the rosette leaves under cryo-SEM. E
wide type F myb106 Arabidopsis mutant G p35S:D-MYB106 transgenic Arabidopsis myb106 mutant line H p35S:S-
MYB106 transgenic Arabidopsis myb106 mutant line. Scale bars: 200 μm.
The wax compositions were further investigated in different Arabidopsis
lines to analyze the function of two alleles of MYB106. Compared with
the wild type, there were significant differences in myb106 mutant with
regard to wax production and constituents (around 48% decrease),
especially for the alkanes (around 45% decrease), which were the main
components (Fig. 3-13A). The modifications were majorly caused by C29
alkanes and C33 alkanes (around 77% and 76% decrease in myb106 mutant)
(Fig. 3-13B). The decrease of C29 ketones and C30 primary-alcohols (74%
and 80%, separately) further influenced the wax accumulation in the
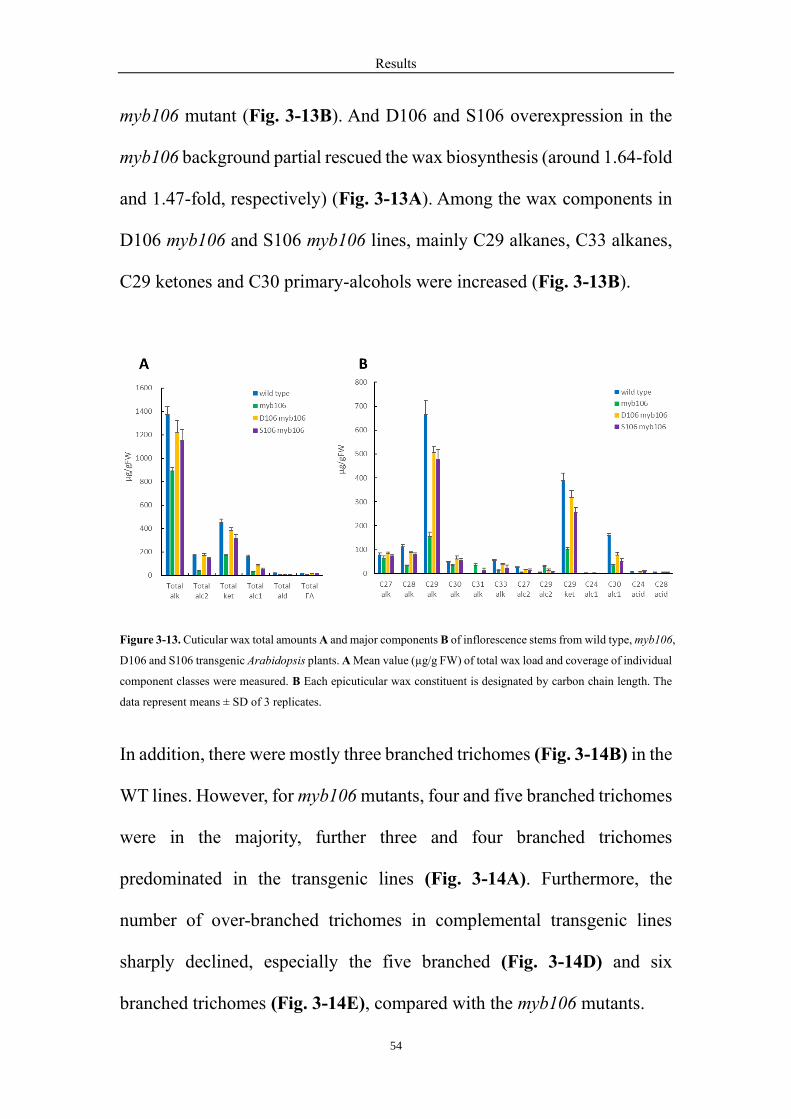
Results
54
myb106 mutant (Fig. 3-13B). And D106 and S106 overexpression in the
myb106 background partial rescued the wax biosynthesis (around 1.64-fold
and 1.47-fold, respectively) (Fig. 3-13A). Among the wax components in
D106 myb106 and S106 myb106 lines, mainly C29 alkanes, C33 alkanes,
C29 ketones and C30 primary-alcohols were increased (Fig. 3-13B).
Figure 3-13. Cuticular wax total amounts A and major components B of inflorescence stems from wild type, myb106,
D106 and S106 transgenic Arabidopsis plants. A Mean value (µg/g FW) of total wax load and coverage of individual
component classes were measured. B Each epicuticular wax constituent is designated by carbon chain length. The
data represent means ± SD of 3 replicates.
In addition, there were mostly three branched trichomes (Fig. 3-14B) in the
WT lines. However, for myb106 mutants, four and five branched trichomes
were in the majority, further three and four branched trichomes
predominated in the transgenic lines (Fig. 3-14A). Furthermore, the
number of over-branched trichomes in complemental transgenic lines
sharply declined, especially the five branched (Fig. 3-14D) and six
branched trichomes (Fig. 3-14E), compared with the myb106 mutants.
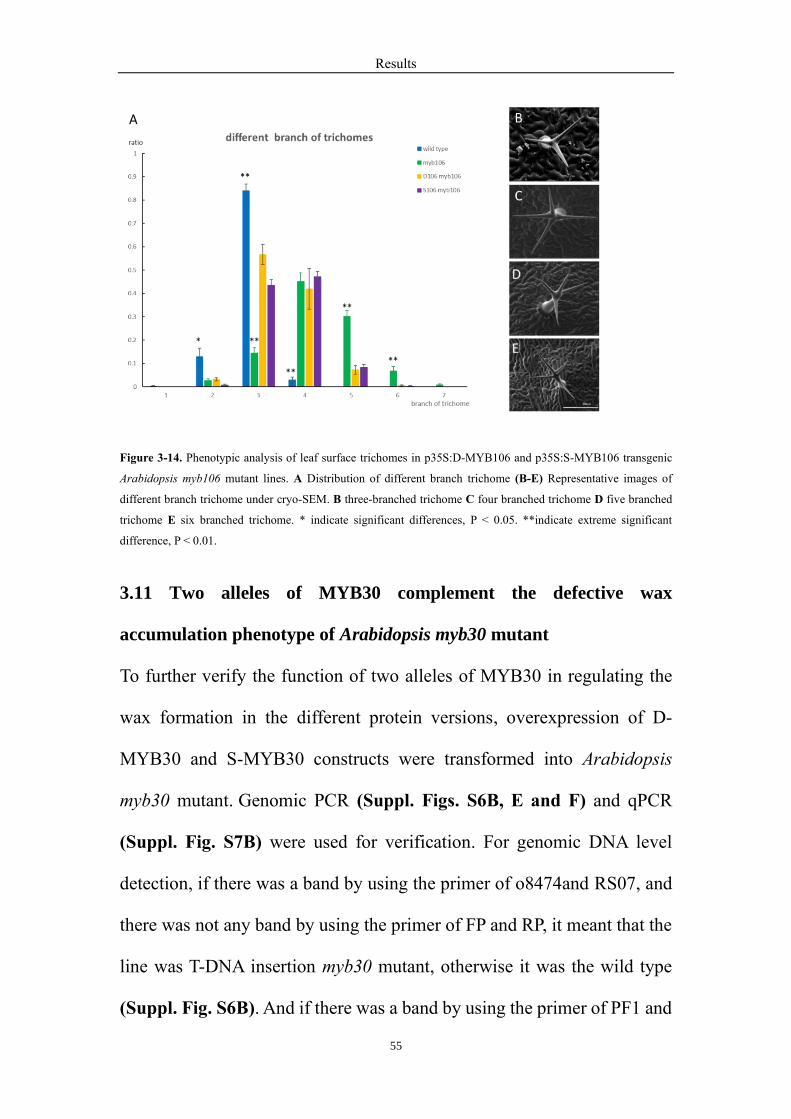
Results
55
Figure 3-14. Phenotypic analysis of leaf surface trichomes in p35S:D-MYB106 and p35S:S-MYB106 transgenic
Arabidopsis myb106 mutant lines. A Distribution of different branch trichome (B-E) Representative images of
different branch trichome under cryo-SEM. B three-branched trichome C four branched trichome D five branched
trichome E six branched trichome. * indicate significant differences, P < 0.05. **indicate extreme significant
difference, P < 0.01.
3.11 Two alleles of MYB30 complement the defective wax
accumulation phenotype of Arabidopsis myb30 mutant
To further verify the function of two alleles of MYB30 in regulating the
wax formation in the different protein versions, overexpression of D-
MYB30 and S-MYB30 constructs were transformed into Arabidopsis
myb30 mutant. Genomic PCR (Suppl. Figs. S6B, E and F) and qPCR
(Suppl. Fig. S7B) were used for verification. For genomic DNA level
detection, if there was a band by using the primer of o8474and RS07, and
there was not any band by using the primer of FP and RP, it meant that the
line was T-DNA insertion myb30 mutant, otherwise it was the wild type
(Suppl. Fig. S6B). And if there was a band by using the primer of PF1 and

Results
56
7F, it was the transgenic MYB30 lines (Suppl. Figs. S6E and F). And for
RNA level verification, the At MYB30 expression level has been examined
in the transgenic lines and it was obviously lower than in the wild type
(Suppl. Fig. S7B). For the examination of surface wax accumulation, the
stem and the rosette leaves of the transgenic lines, myb30 mutants and wild
types were examined by cryo-SEM (Fig. 3-15). From the figure, similar
with MYB106 function, the alleles of D-MYB30 (Figs. 3-15C and G) and
S-MYB30 (Figs. 3-15D and H) transgenic lines partially complemented
the phenotype of defect wax content in myb30 mutant background (Figs.
3-15B and F), not only in the stem, but also in the rosette leaves (Figs. 3-
15C, G and D, H).
Figure 3-15. Phenotypic analysis of wax structure in p35S:D-MYB30 and p35S:S-MYB30 transgenic Arabidopsis
myb30 mutant lines. (A-D) Wax structure in the stem under cryo-SEM. A wild type B myb30 Arabidopsis mutant C
p35S:D-MYB30 transgenic Arabidopsis myb30 mutant line D p35S:S-MYB30 transgenic Arabidopsis myb30
mutant line. Scale bars: 80 μm. (E-H) Wax structure in the rosette leaves under cryo-SEM. E wide type F myb30
Arabidopsis mutant G p35S:D-MYB30 transgenic Arabidopsis myb30 mutant line H p35S:S-MYB30 transgenic
Arabidopsis myb30 mutant line. Scale bars: 200 μm.
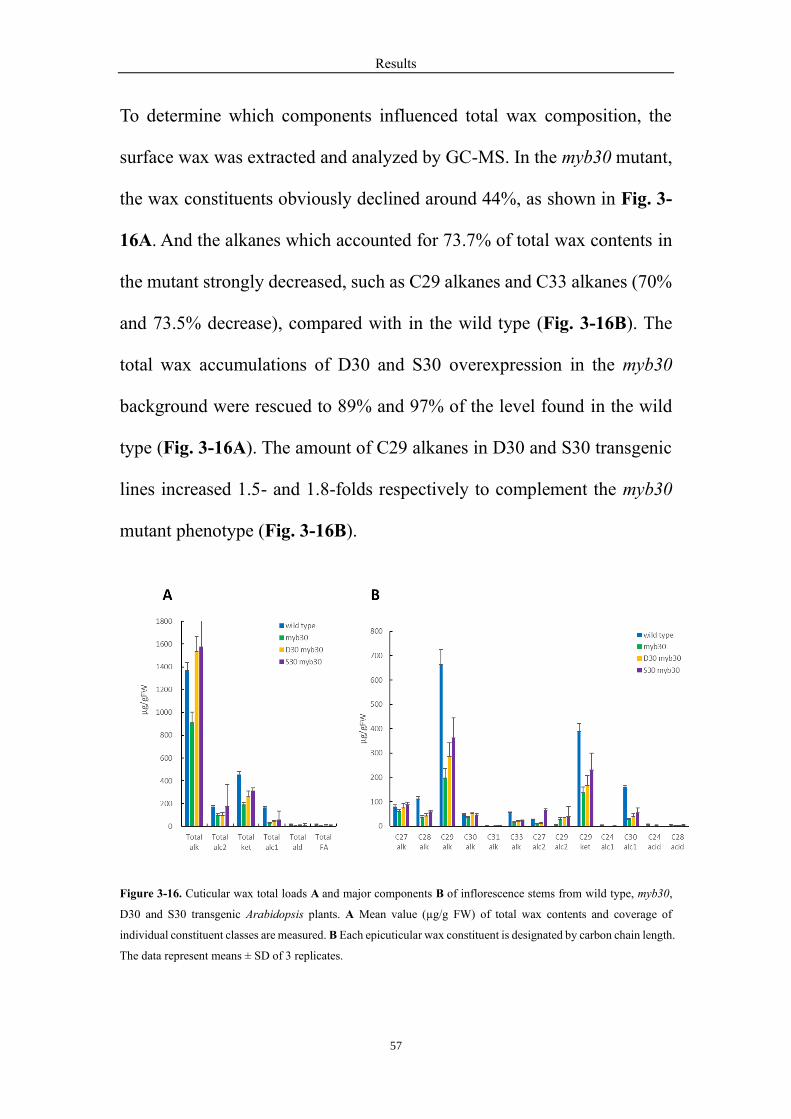
Results
57
To determine which components influenced total wax composition, the
surface wax was extracted and analyzed by GC-MS. In the myb30 mutant,
the wax constituents obviously declined around 44%, as shown in Fig. 3-
16A. And the alkanes which accounted for 73.7% of total wax contents in
the mutant strongly decreased, such as C29 alkanes and C33 alkanes (70%
and 73.5% decrease), compared with in the wild type (Fig. 3-16B). The
total wax accumulations of D30 and S30 overexpression in the myb30
background were rescued to 89% and 97% of the level found in the wild
type (Fig. 3-16A). The amount of C29 alkanes in D30 and S30 transgenic
lines increased 1.5- and 1.8-folds respectively to complement the myb30
mutant phenotype (Fig. 3-16B).
Figure 3-16. Cuticular wax total loads A and major components B of inflorescence stems from wild type, myb30,
D30 and S30 transgenic Arabidopsis plants. A Mean value (µg/g FW) of total wax contents and coverage of
individual constituent classes are measured. B Each epicuticular wax constituent is designated by carbon chain length.
The data represent means ± SD of 3 replicates.
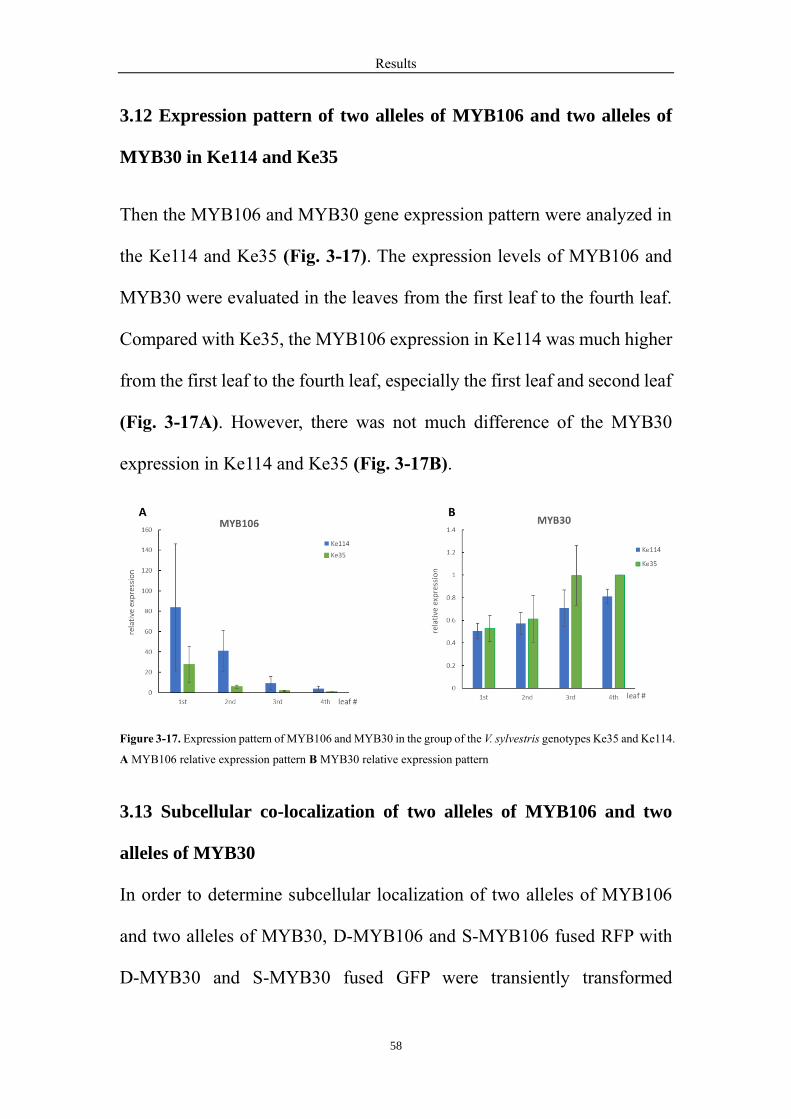
Results
58
3.12 Expression pattern of two alleles of MYB106 and two alleles of
MYB30 in Ke114 and Ke35
Then the MYB106 and MYB30 gene expression pattern were analyzed in
the Ke114 and Ke35 (Fig. 3-17). The expression levels of MYB106 and
MYB30 were evaluated in the leaves from the first leaf to the fourth leaf.
Compared with Ke35, the MYB106 expression in Ke114 was much higher
from the first leaf to the fourth leaf, especially the first leaf and second leaf
(Fig. 3-17A). However, there was not much difference of the MYB30
expression in Ke114 and Ke35 (Fig. 3-17B).
Figure 3-17. Expression pattern of MYB106 and MYB30 in the group of the V. sylvestris genotypes Ke35 and Ke114.
A MYB106 relative expression pattern B MYB30 relative expression pattern
3.13 Subcellular co-localization of two alleles of MYB106 and two
alleles of MYB30
In order to determine subcellular localization of two alleles of MYB106
and two alleles of MYB30, D-MYB106 and S-MYB106 fused RFP with
D-MYB30 and S-MYB30 fused GFP were transiently transformed
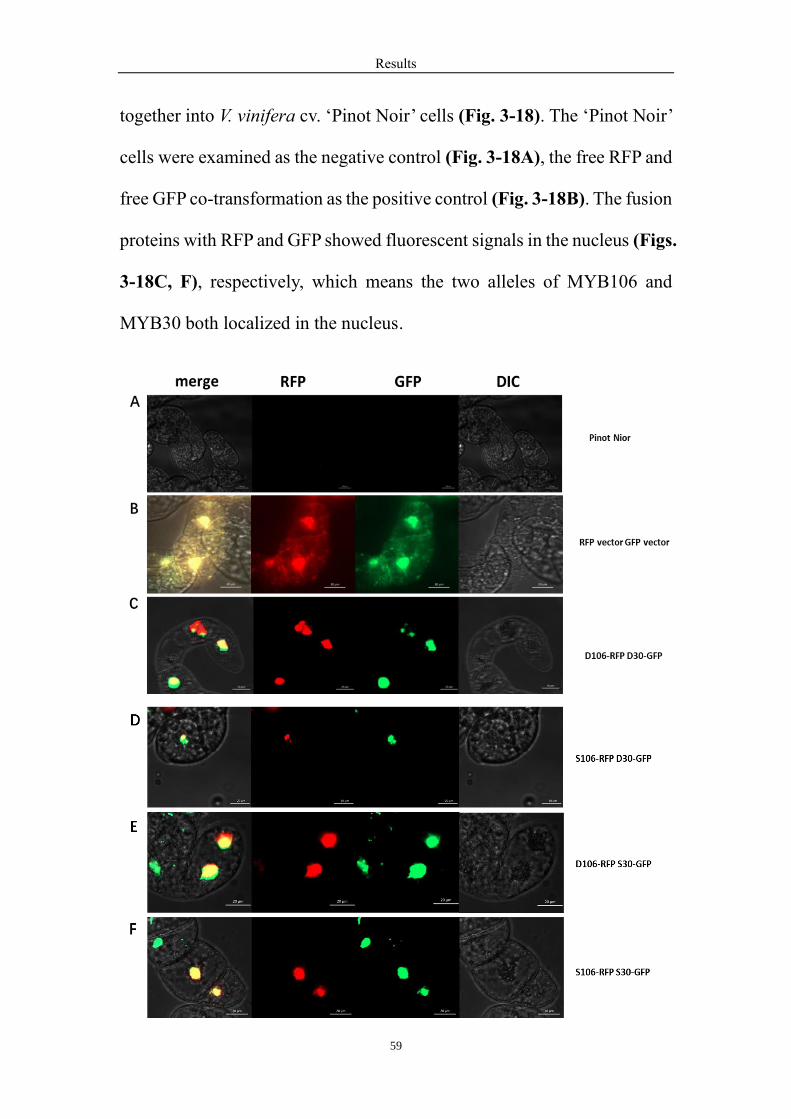
Results
59
together into V. vinifera cv. ‘Pinot Noir’ cells (Fig. 3-18). The ‘Pinot Noir’
cells were examined as the negative control (Fig. 3-18A), the free RFP and
free GFP co-transformation as the positive control (Fig. 3-18B). The fusion
proteins with RFP and GFP showed fluorescent signals in the nucleus (Figs.
3-18C, F), respectively, which means the two alleles of MYB106 and
MYB30 both localized in the nucleus.

Results
60
Figure 3-18. Subcellular co-localization of two alleles of MYB106-RFP (D106 and S106) and two alleles of
MYB30-GFP (D30 and S30) from the sylvestris genotypes Ke35 and Ke114 transient transformation in the ‘Pinot
Noir’ cells. A Empty ‘Pinot Noir’ cell as negative control B Free RFP and GFP co-transformation, as positive control
C D106-RFP and D30-GFP subcellular co-localization D S106-RFP and D30-GFP subcellular co-localization E
D106-RFP and S30-GFP subcellular co-localization F S106-RFP S30-GFP subcellular co-localization. Scale bars:
20 μm.
3.14 MYB106 interacts with MYB30 to regulate the wax formation in
the genotypes Ke114 and Ke35
MYB106 and MYB30 both partially complemented the phenotype of
defect wax content in myb106 mutant (Figs. 12 and 15). In addition, the
property of the MYB transcription factors is frequently forming polymers
to be functional (Dubos et al., 2010; Latchman, 1997; Riechmann et al.,
2000). We hypothesize that MYB106 interacts with MYB30 to regulate the
wax formation. To verify the hypothesis, bimolecular fluorescence
complementation (BiFC) assays were conducted in V. vinifera cv. ‘Pinot
Noir’ cells (Fig. 3-19). Further the YFP fluorescence was examined in
these combinations. It was discovered both in the D30YC D106YN
combination (Fig. 3-19A), as well as the YCD106 YND30 combination
(Fig. 3-19B), similar with the other type of MYB106 and MYB30
combinations. However, the YFP fluorescence was not detected in all
negative controls (Suppl. Fig. S8). These results suggested that two alleles
of MYB106 interact with two alleles of MYB30, both in C-terminal
interaction and in N-terminal interaction.

Results
61

Results
62
Figure 3-19. Protein interaction between two alleles of MYB30 and two alleles of MYB106 in the ‘Pinot Noir’ cells
by BiFC experiment. The C or N terminus of yellow fluorescent protein designated as YC or YN, respectively.
Different combinations of the fused constructs were used. A D30YC D106YN B D30YC S106YN C S30YC
D106YN D S30YC S106YN E YCD106 YND30 F YCD106 YNS30 G YCS106 YND30 H YCS106 YNS30.
3.15 Plant hormones, light and low temperature may regulate
MYB106 and MYB30 expression in the cis-acting regulatory elements
analysis
To further reveal the MYB106 and MYB30 regulation mechanism in the
pair, the promoter sequences of the two genes were cloned. The predicted
cis-acting regulatory elements were analyzed using the PlantCARE
database (Lescot et al., 2002). For promoter of MYB106, there were two
alleles in the pair, named pMYB106-1 and PMYB106-2, although the
predicted cis-acting regulatory elements were identical in the two alleles
(Figs. 20A and B). The two alleles of MYB106 were putatively regulated
by many factors, including plant hormones like abscisic acid, indicated by
the presence of ABA responsive elements (ABRE), auxin, indicated by the
presence of auxin-responsive elements (TGA-element), gibberellic acid,
indicated by the presence of gibberellin-responsive element (P-box and
TATC-box), and salicylic acid, indicated by the presence of TCA-elements.
There were also evidences for their regulation by environmental factor
such as low temperature (LTR elements), or light (G-Box, GT1-motif,
GATA-motif, LAMP element and TCT-motif). Furthermore, there were
MYB binding sites to regulate the two alleles of MYB106 expression. In
case of promoter of MYB30, there were additional motifs, like the MBS
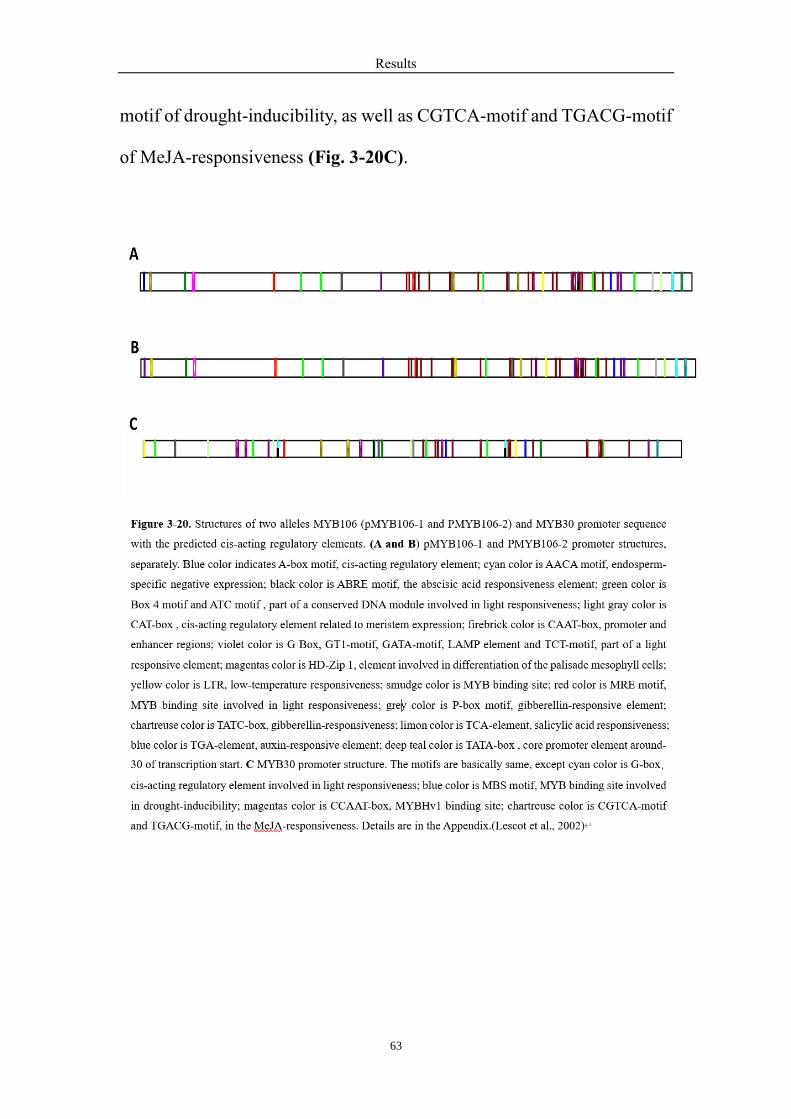
Results
63
motif of drought-inducibility, as well as CGTCA-motif and TGACG-motif
of MeJA-responsiveness (Fig. 3-20C).

Results
64
3.16 Chitosan regulates the promoter of MYB106 and MYB30 activity
The higher epicuticular wax abundance, in a certain threshold, could play
a role in the Powdery Mildew susceptibility by preventing the spores
further from generating the appressorium (Figs. 3-5 and 7). Therefore, the
activation of the promoters of MYB106 and MYB30 in response to fungal
chitosan as elicitor was tested in the ‘Pinot Noir’ and ‘Ke15’ cells by the
dual-luciferase reporter assay. The activity of reporter of pSTS with or
without the effector MYB14 was as the positive control (Fig. 3-21A). The
activity of promoter MYB30 was measured in response to chitosan and it
could be upregulated with 20μg/mL chitosan treatment (Fig. 3-21B). In
case of the two alleles of the MYB106 promoter, they were also regulated
in response to chitosan, but the responsiveness was different (Figs. 3-21C
and D). pMYB106-1 was slightly regulated with low concentration
chitosan (Fig. 3-21C), yet pMYB106-2 was strongly induced in response
to 20μg/mL chitosan treatment (Fig. 3-21D). These data indicated the
promoter of MYB106 and MYB30 could be regulated by chitosan as the
elicitor.

Results
65
Figure 3-21. Promoter activity assay of two alleles of MYB106 and MYB30 after the different concentration of
chitosan treatment. A The fold induction of STS promoter activity with MYB14 as the positive control. B The
MYB30 promoter activity after 1% acetic acid and 20μg/mL chitosan treatments. C pMYB106-1 promoter activity
after 1% acetic acid and 10μg/mL chitosan treatments. D pMYB106-2 promoter activity after 1% acetic acid,
20μg/mL chitosan treatments. * indicates the differences that are statistically significant on the P < 0.05 level. **
indicates the differences that are statistically extreme significant on the P < 0.01 level, 4 independent experimental
series.

Discussion
66
4. Discussion
In the study, we have investigated the surface wax morphology, distribution,
formation and wax accumulation in different grapevine accessions.
Furthermore, the relationship between epicuticular wax and resistance to
Powdery Mildew and regulation mechanism have been analyzed. One
phylogenetically closely related pair from the wild Vitis. collection has
been compared with regard to wax content. Then we have studied MYB106
and MYB30 function, expression pattern and regulation mechanism of
surface wax biosynthesis in wild grapevine genotypes. Chitosan, an elicitor
of plant defense, was used to check if it could regulate the promoter activity
of MYB106 and MYB30, further to regulate the grapevine wax
accumulation.
4.1 Genetic variation of surface wax morphology and development in
V. sylvestris
There are distinct wax morphologies, mostly like filaments, platelets,
crystals and tubules in Arabidopsis and other plants being verified (Fig. 1-
4) (Wilhelm Barthlott et al., 1998; Jetter et al., 2008; Rashotte & Feldmann,
1998). However, the knowledge about surface wax morphology in
grapevines is limited. 115 varieties in the wild ancestor grapevine
accession, along with a couple of commercial and traditional varieties
Discussion
67
(Suppl. Table S1) have been screened to investigate the surface wax
morphology and development. Here we have studied adaxial and abaxial
sides of fully expanded leaves under cryo-SEM and found that the wax
morphology in grapevine was different from other plants. There were
basically three types of the epicuticular wax structures, long wing-like
structures, small wax crystals and appearance of both long wax wings and
small wax crystals (Figs. 3-1 A, C).
Moreover, the wax distribution has shown significantly distinct. The
abundance of surface waxes at the upper side was generally higher than at
the lower side. The distribution of long wing-like wax structures was much
higher on the epidermal cells covering leaf veins, but less in intercostal
regions at the adaxial side (Fig. 3-1D). At the abaxial side, wax usually
accumulated on the surface of the accessory cells of the stomatal complex
(Fig. 3-1E).
The developmental time course of wax formation and accumulation
showed diversities in the representatives from all clades of the European
wild grapevine population. Some of the varieties formed wax earlier, faster
and more, while others accumulated higher amounts of wax, though slower.
And others developed wax earlier and faster, but at a low final wax content
(Figs. 3-2 and 3). In general, the process of wax accumulation was
basically stable in the full expansion leaves of diverse genotypes.
There was a considerable variety for the wax abundance of fully expanded
Discussion
68
leaves within individual clades, which were separated by molecular
phylogeny based on the entire genomes. But wax accumulation of the clade
A, C, D, E were statistically not obviously different, clade B had a
significantly lower median which meant wax accumulation was
significantly higher in this clade as compared to the others (Fig. 3-4). It
was reasonable to conclude that, the wax has shown genetic variation in
morphology, distribution, formation and accumulation of the V. sylvestris.
4.2 Low wax content genotypes are more susceptible to Powdery
Mildew
There have been several studies to investigate the relationship between wax
components, wax crystallization pattern and susceptibility to pathogens
(Lewandowska et al., 2020). The spore germination and differentiation of
Blumeria graminis on Maize adaxial leaf were significantly declined after
treatment with C22 fatty acid, C22 alcohol and C44-alkyl ester (Hansjakob,
Riederer, & Hildebrandt, 2011). And the reduction of cuticular monomers
in the atmin7 mutant, an ARF-GEF (ADP ribosylation factor guanine
nucleotide exchange factor protein) caused the increase of susceptibility to
the Pto (Pseudomonas syringae pathovar tomato) pathogen (Zhao et al.,
2020). However, there is limited knowledge about the relationship between
wax accumulation and Powdery Mildew in grapevines. Therefore, we have
investigated the relationship between the wax abundance and the resistance

Discussion
69
to Powdery Mildew in the different accessions available to us. The
susceptibility to Powdery Mildew was constantly low with the wax
increased accumulation above a certain threshold. During the Powdery
Mildew infection when wax abundance was below a certain threshold, this
strongly increased the Powdery Mildew infection (Fig.3-5A). Moreover,
the susceptibility to Powdery Mildew has been analyzed between 5 clades
of V. sylvestris. It was generally similar between the clades, except clade D
which was more susceptible. Clade B had higher wax abundance (Fig. 3-
4B), although the resistance to Powdery Mildew was similar with the other
three. This was consistent with the observation that susceptibility went up
only when the wax layer was below a certain threshold (Fig. 3-5A). These
results taken together indicate that low wax content genotypes were more
susceptible to Powdery Mildew.
4.3 Abundant surface waxes regulate appressorium formation of
Powdery Mildew spores
The spore germination and differentiation were regulated in maize leaves
with different wax components treatments like C22 fatty acid, C22 alcohol
or C44 wax ester. Wax morphology in maize leaves further was involved
in the regulation the plant resistance to pathogens by fungal colonization
process (Hansjakob et al., 2011; Reisberg, Hildebrandt, Riederer, &
Hentschel, 2013). Thus, we have examined the spores’ development in
Discussion
70
‘Müller-Thurgau’ and two V. sylvestris genotypes Ke114 and Ke35. The
developmental process of spores in two genotypes with relatively high
abundance of wax were much slower, compared with ‘Müller-Thurgau’.
The stage ap* with perturbed appressorium development appeared both in
Ke114 and Ke35. There was a constantly higher proportion of stage ap* in
Ke114 (where wax content was maximal), compared with Ke35 (where
wax accumulation was lower).
And over time, the proportion of stage ap* gradually decreased both in
Ke114 and Ke35, which meant that some spores in stage ap* also generated
normal appressorium after some delays (Fig. 3-7). In addition, the infection
severity and infection frequency of Powdery Mildew were highest in
‘Müller-Thurgau’, followed by Ke35, Ke114 was the least (Suppl. Fig. S4)
(Tisch, 2017). Here was the conclusion that abundant surface waxes
disturbed appressorium formation of Powdery Mildew spores to decline
the rate and number of spores’ differentiation into normal appressorium,
further to regulate plant defense in Müller-Thurgau’ and two genotypes
Ke114 and Ke35.
4.4 MYB106 and MYB30 are associated with wax biosynthesis
pathway in grapevines
MYB106 and MYB30 have been verified to take part in wax biosynthesis
pathway (Oshima et al., 2013; S. R. F. Vailleau et al., 2008). And

Discussion
71
MdMYB30 homolog also has been shown to be able to regulate the wax
biosynthesis in apple (X. Wang et al., 2020; Y.-L. Zhang et al., 2019). Here,
VvMYB106 was a MIXTA-like MYB family homolog in grapevine and
VvMYB30 was a R2R3MYB family homolog in grapevine (Fig. 3-10).
The transcriptional abundance of MYB106 was much higher in the leaves
of the genotype of Ke114 which belonged to the high wax accumulation
group, especially the second leaf, compared with the genotype Ke35 which
was in the low wax content cluster (Fig. 3-8 and 17). These results
indicated that MYB106 and MYB30 may regulate the wax biosynthesis in
grapevines.
Further in the complementation experiment of Arabidopsis mutants,
ectopic expression of MYB106 and MYB30 all promoted the wax
accumulation and very-long-chain compositions increase, especially the
C29 alkanes, C33 alkanes and C29 ketones which were the main wax
compounds, compared with Arabidopsis mutant, respectively (Figs. 3-12,
13,15,16). Hence our results revealed that MYB106 and MYB30 are likely
involved in the grapevine wax accumulation.
In addition, the MYB transcription factors usually form polymers to be
functional (Dubos et al., 2010; Latchman, 1997; Riechmann et al., 2000).
And MYB106 and MYB30 were relatively close to each other in the
phylogenetic tree (Fig. 3-10). Therefore, the BiFC assay was used to
investigated the physical interaction between MYB106 and MYB30 (Fig.
Discussion
72
3-19). All the results showed that they could interact with each other, which
uncovered that MYB106 interacted with MYB30 to regulate the wax
biosynthesis pathway in grapevine.
4.5 The genes’ functions of two alleles of MYB106 and two alleles of
MYB30 have less differences, separately
There were two alleles of MYB106 and MYB30 in Ke114 and Ke35 (Figs.
3-11 and Suppl. Fig. S5). There were two SNPs, T10P and S27A, between
D-MYB106 and S-MYB106 to be predicted near or in the DNA binding
domain (Fig. 3-11 A and C). Similar to MYB106, there was one P42T site
between D-MYB30 and S-MYB30 predicted in the DNA binding domain
(Fig. 3-11 B and C). We hypothesized that there was the possibility of
differences in the regulation of DNA binding in the two alleles MYB106
and two alleles of MYB30, because of alteration in the molecular backbone
in the encoded proteins due to the properties of proline and nucleophilic
serine. However, there was not any difference in nuclear localization of
two alleles of MYB106 and two alleles of MYB30, respectively (Fig. 3-
18). And all of them could partially complement the glossy phenotypes of
myb106 Arabidopsis mutant and myb30 Arabidopsis mutant, respectively
(Oshima et al., 2013; S. R. F. Vailleau et al., 2008). The wax content and
compositions of D-MYB106 and S-MYB106 (with proline and alanine in
the SNP sites) transgenic lines were in general similar, even though the wax
Discussion
73
components of C29 alkanes, C33 alkanes, C29 ketones and C30 primary-
alcohols were a little bit lower in S-MYB106 transgenic lines (Figs. 3-
12,13). For the two alleles of MYB30, the differences of wax accumulation
and components in the D-MYB30 and S-MYB30 complemented
Arabidopsis lines were consistent with the two alleles of MYB106
transgenic lines (Figs. 3-15,16).
In rescuing the phenotype of over-branched trichomes, for myb106 mutant,
four and five branched trichomes were in the majority, even there was quite
a bit of six branched trichomes. However, both D-MYB106 and S-
MYB106 transgenic lines had generally less five and six branched
trichomes, compared with myb106 mutant. And the number of over-
branched trichome reduction was actually similar with each other (Fig. 3-
14).
In addition, two alleles of MYB106 and two alleles of MYB30 could
interact with each other to regulate the wax biosynthesis in Ke114 and
Ke35 (Fig.3-19). These results suggested that for MYB106 and MYB30,
there were not any obvious differences in two alleles with regard to their
ability in wax formation or phenotypic alterations.
4.6 MYB106 is more relatively conserved, compared with MYB30
From the phylogenetic tree, the similarity of MYB106 in Arabidopsis
thaliana and MYB106 in V. vinifera cv. ‘Pinot Noir’ was relatively higher,

Discussion
74
compared with the similarity of MYB30 in Arabidopsis thaliana and
MYB30 in V. vinifera cv. ‘Pinot Noir’ (Fig. 3-10).
In the previous studies, modulation of MYB106 expression directly
influenced WIN1, further regulated the genes expression in the fatty acyl
chains elongation and in the alkane forming pathway (Kannangara et al.,
2007; Oshima et al., 2013). And MYB30 overexpression could also induce
gene expression in the fatty acyl chain elongation and in the alkane forming
pathway (S. R. F. Vailleau et al., 2008).
In the Arabidopsis mutant complementation experiments, the wax
components of C29 alkanes, C33 alkanes, C29 ketones and VLCFAs
increased around 3-fold in MYB106 transgenic Arabidopsis lines,
compared with myb106 mutant, although these compositions increased
only 1.5-fold in MYB30 transgenic Arabidopsis lines, compared with
myb30 mutant (Fig. 3-13,16).
Furthermore, MYB106 reduced the number of over-branched trichomes in
Arabidopsis (Fig. 3-14). Therefore, MYB106 of grapevine was
functionally more conserved to its Arabidopsis homolog, compared with
MYB30.
4.7 MYB106 and MYB30 are involved in defense regulation
For MYB30 in Arabidopsis and apple, it has been shown that the gene
expression level has significantly increased under pathogen attack, and the
Discussion
75
responsiveness to flg22 and B. dothidea infection was improved in the
DmMYB30ox lines. After inoculation with Pst DC3000 (Pseudomonas
syringae), MYB30 overexpression resulted in enhanced HR phenotype in
Arabidopsis (F. Vailleau et al., 2002; S. R. F. Vailleau et al., 2008; Y.-L.
Zhang et al., 2019). In this study, wax abundance below a certain threshold
(rank 70 in the separation by wax content) has been studied that it was
positively correlated with the resistance to Powdery Mildew (Fig. 3-5).
Fungal chitosan as elicitor was used to investigate the promoter activities
of MYB106 and MYB30 (Fig. 3-21B). The dual-luciferase assay indicated
that MYB106 and MYB30 could response to the fungal chitosan stressor,
which meant that MYB106 and MYB30 could regulate the plant defense
under the fungus attack.
4.8 Conclusion
We have examined the surface wax property and the link between surface
wax and the resistance to Powdery Mildew in European wild grapevine
accession, further explored MYB106 and MYB30 wax biosynthesis
mechanism in Vitis. in our study. Based on our results, we can conclude
that there are basically three types of the epicuticular wax structures, long
wing-like structures, small wax crystals and appearance of both long wax
wings and small wax crystals in the wild grapevine accessions. We also
conclude that:

Discussion
76
1. Surface wax morphology, distribution, formation and accumulation are
genetically variable in V. sylvestris.
2. Low wax abundance is positively correlated with the susceptibility to
Powdery Mildew.
3. Abundant surface wax can interfere with appressorium formation, and
influence the penetration of Powdery Mildew spores.
4. MYB106 physically interacts with MYB30 indicating that they might
regulate grapevine wax biosynthesis pathway together.
5. D-MYB106 and S-MYB106 function have only small differences in the
regulation of wax biosynthesis and in rescuing the over-branched
phenotype of respective Arabidopsis mutants, similar to D-MYB30 and S-
MYB30.
6. MYB106 is more functionally conserved to its Arabidopsis orthologue,
compared with MYB30.
7. MYB106 and MYB30 are regulated by the fungal chitosan stressor
indicating a possible role in defense gene regulation.
Discussion
77
4.9 Outlook
Wax crystallization pattern, wax components and their proportions played
roles in regulating pathogen infection (Gniwotta et al., 2005; Reisberg et
al., 2013; Tsuba, Katagiri, Takeuchi, Takada, & Yamaoka, 2002; X. Wang
et al., 2020; Zhao et al., 2020).
Therefore, the wax components in the different accession need to be further
analyzed and to figure out if there are also other factors regulate the plant
resistance to Powdery Mildew.
And we could also investigate that if there are some differences in wax
content, wax components and proportions under different abiotic stress,
such as drought stress, UV light stress. Then the key regulators should also
be analyzed. Furthermore, we could understand the wax biosynthesis and
regulation pathway in the Vitis.
For well understood what kinds of genes in the wax biosynthesis take part
into the resistance to Powdery Mildew regulation, the transcriptional
expression level of related genes needs to be examined after Powdery
Mildew inoculation. Then we could find out the link between them and
deduce the regulation mechanism.
To further understand the regulation mechanism in the transgenic MYB106
and MYB30 lines, the related wax biosynthesis genes need to be
investigated and further to verified the function and regulation network.

Appendix
78
Appendix
Supplementary Table 1. Identity and origin of the grapevine accessions used in this study
Taxon Voucher ID Source Origin
Vitis vinifera ssp. vinifera
Commercial cultivars
cv. Müller-Thurgau 5585 WBI Freiburg Economically important German
variety
cv. Cabernet Sauvignon 7471 JKI Siebeldingen Economically important French
variety
cv. Pinot Noir 7474 JKI Siebeldingen Economically important traditional
French variety, background of
genome project
cv. Riesling 6144 WBI Freiburg Traditional German variety
cv. Gewürztraminer 7464 Antes Nursery Traditional Alsacian variety
cv. Chardonnay 7472 JKI Siebeldingen Traditional French variety
Hybrid varieties
cv. Merzling 6150 WBI Freiburg German variety, pedigrée of North
American and Chinese species
cv. Regent 5895 JKI Siebeldingen German variety, pedigrée of North
American species
Traditional landraces
cv. Razegui 5894 Borj Cedria Tunisian landrace
cv. Augster Weiß 7443 JKI Siebeldingen Central European medieval
landrace, male sterile
cv. El Tanque 5898 Tenerife, Canarian Islands Canarian landrace
cv. Guimar 5899 Tenerife, Canarian Islands Canarian landrace
cv. San Andres 5889 Tenerife, Canarian Islands Canarian landrace
Vitis vinifera ssp. sylvestris
Isolated, Upper Rhine
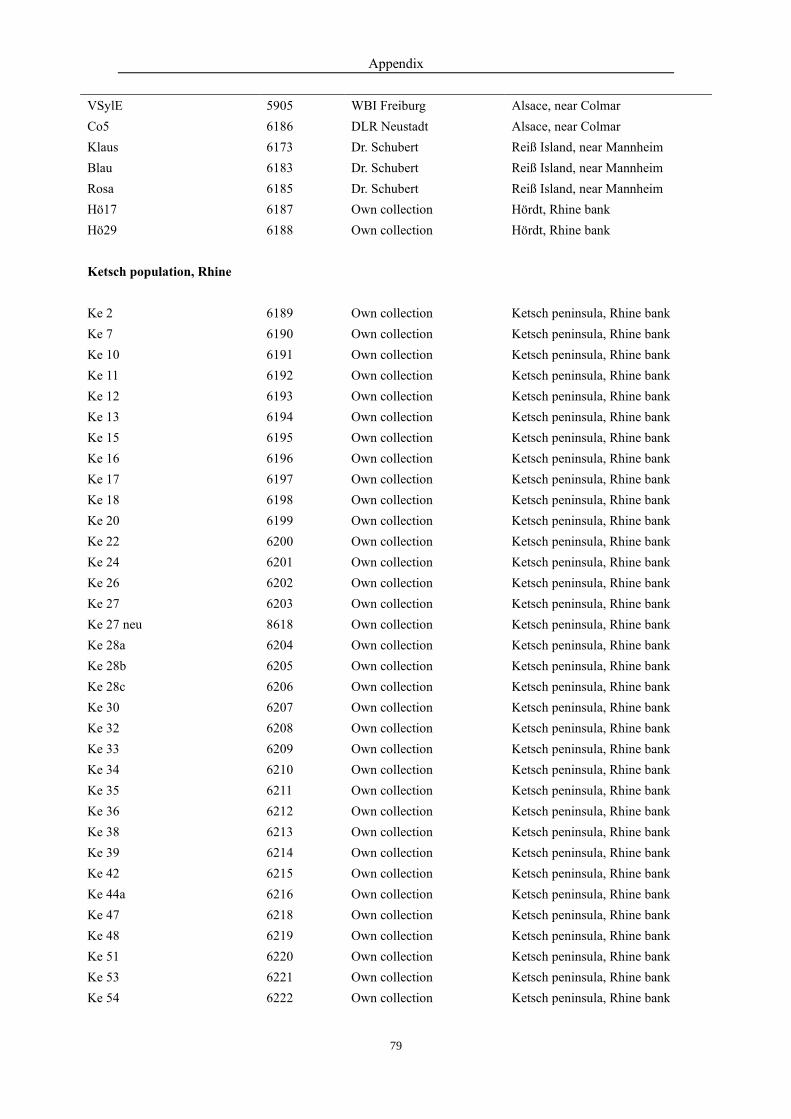
Appendix
79
VSylE 5905 WBI Freiburg Alsace, near Colmar
Co5 6186 DLR Neustadt Alsace, near Colmar
Klaus 6173 Dr. Schubert Reiß Island, near Mannheim
Blau 6183 Dr. Schubert Reiß Island, near Mannheim
Rosa 6185 Dr. Schubert Reiß Island, near Mannheim
Hö17 6187 Own collection Hördt, Rhine bank
Hö29 6188 Own collection Hördt, Rhine bank
Ketsch population, Rhine
Ke 2 6189 Own collection Ketsch peninsula, Rhine bank
Ke 7 6190 Own collection Ketsch peninsula, Rhine bank
Ke 10 6191 Own collection Ketsch peninsula, Rhine bank
Ke 11 6192 Own collection Ketsch peninsula, Rhine bank
Ke 12 6193 Own collection Ketsch peninsula, Rhine bank
Ke 13 6194 Own collection Ketsch peninsula, Rhine bank
Ke 15 6195 Own collection Ketsch peninsula, Rhine bank
Ke 16 6196 Own collection Ketsch peninsula, Rhine bank
Ke 17 6197 Own collection Ketsch peninsula, Rhine bank
Ke 18 6198 Own collection Ketsch peninsula, Rhine bank
Ke 20 6199 Own collection Ketsch peninsula, Rhine bank
Ke 22 6200 Own collection Ketsch peninsula, Rhine bank
Ke 24 6201 Own collection Ketsch peninsula, Rhine bank
Ke 26 6202 Own collection Ketsch peninsula, Rhine bank
Ke 27 6203 Own collection Ketsch peninsula, Rhine bank
Ke 27 neu 8618 Own collection Ketsch peninsula, Rhine bank
Ke 28a 6204 Own collection Ketsch peninsula, Rhine bank
Ke 28b 6205 Own collection Ketsch peninsula, Rhine bank
Ke 28c 6206 Own collection Ketsch peninsula, Rhine bank
Ke 30 6207 Own collection Ketsch peninsula, Rhine bank
Ke 32 6208 Own collection Ketsch peninsula, Rhine bank
Ke 33 6209 Own collection Ketsch peninsula, Rhine bank
Ke 34 6210 Own collection Ketsch peninsula, Rhine bank
Ke 35 6211 Own collection Ketsch peninsula, Rhine bank
Ke 36 6212 Own collection Ketsch peninsula, Rhine bank
Ke 38 6213 Own collection Ketsch peninsula, Rhine bank
Ke 39 6214 Own collection Ketsch peninsula, Rhine bank
Ke 42 6215 Own collection Ketsch peninsula, Rhine bank
Ke 44a 6216 Own collection Ketsch peninsula, Rhine bank
Ke 47 6218 Own collection Ketsch peninsula, Rhine bank
Ke 48 6219 Own collection Ketsch peninsula, Rhine bank
Ke 51 6220 Own collection Ketsch peninsula, Rhine bank
Ke 53 6221 Own collection Ketsch peninsula, Rhine bank
Ke 54 6222 Own collection Ketsch peninsula, Rhine bank

Appendix
80
Ke 56 6223 Own collection Ketsch peninsula, Rhine bank
Ke 58 6224 Own collection Ketsch peninsula, Rhine bank
Ke 61 6225 Own collection Ketsch peninsula, Rhine bank
Ke 71 6226 Own collection Ketsch peninsula, Rhine bank
Ke 74 6227 Own collection Ketsch peninsula, Rhine bank
Ke 75 6228 Own collection Ketsch peninsula, Rhine bank
Ke 76 6229 Own collection Ketsch peninsula, Rhine bank
Ke 77 6230 Own collection Ketsch peninsula, Rhine bank
Ke 78 6231 Own collection Ketsch peninsula, Rhine bank
Ke 81 6233 Own collection Ketsch peninsula, Rhine bank
Ke 82 6234 Own collection Ketsch peninsula, Rhine bank
Ke 83 6235 Own collection Ketsch peninsula, Rhine bank
Ke 84 6236 Own collection Ketsch peninsula, Rhine bank
Ke 86 6237 Own collection Ketsch peninsula, Rhine bank
Ke 87 6238 Own collection Ketsch peninsula, Rhine bank
Ke 88 6239 Own collection Ketsch peninsula, Rhine bank
Ke 89 6240 Own collection Ketsch peninsula, Rhine bank
Ke 90 6241 Own collection Ketsch peninsula, Rhine bank
Ke 91 6242 Own collection Ketsch peninsula, Rhine bank
Ke 92 6243 Own collection Ketsch peninsula, Rhine bank
Ke 93 6244 Own collection Ketsch peninsula, Rhine bank
Ke 94 6245 Own collection Ketsch peninsula, Rhine bank
Ke 95 6246 Own collection Ketsch peninsula, Rhine bank
Ke 96 6247 Own collection Ketsch peninsula, Rhine bank
Ke 98 6248 Own collection Ketsch peninsula, Rhine bank
Ke 99 6249 Own collection Ketsch peninsula, Rhine bank
Ke 100 6250 Own collection Ketsch peninsula, Rhine bank
Ke 101 6251 Own collection Ketsch peninsula, Rhine bank
Ke 1016 6252 Own collection Ketsch peninsula, Rhine bank
Ke 103 6253 Own collection Ketsch peninsula, Rhine bank
Ke 104 6254 Own collection Ketsch peninsula, Rhine bank
Ke 106 6256 Own collection Ketsch peninsula, Rhine bank
Ke 107 6257 Own collection Ketsch peninsula, Rhine bank
Ke 108 6258 Own collection Ketsch peninsula, Rhine bank
Ke 109 6259 Own collection Ketsch peninsula, Rhine bank
Ke 110 6260 Own collection Ketsch peninsula, Rhine bank
Ke 112 6261 Own collection Ketsch peninsula, Rhine bank
Ke 114 6262 Own collection Ketsch peninsula, Rhine bank
Ke 115 6263 Own collection Ketsch peninsula, Rhine bank
Ke 116 6264 Own collection Ketsch peninsula, Rhine bank
Ke 118 6265 Own collection Ketsch peninsula, Rhine bank
Ke 119 6266 Own collection Ketsch peninsula, Rhine bank
Ke 120 6267 Own collection Ketsch peninsula, Rhine bank
K2 DLR 6268 DLR Neustadt Ketsch peninsula, Rhine bank
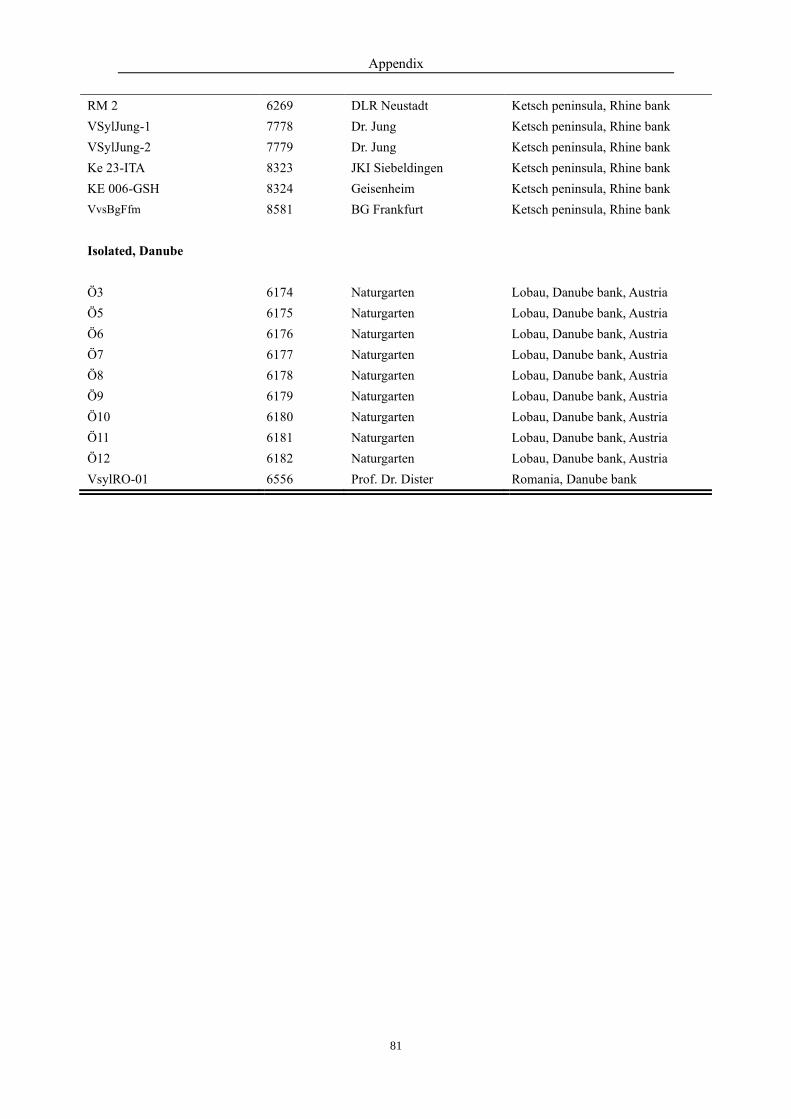
Appendix
81
RM 2 6269 DLR Neustadt Ketsch peninsula, Rhine bank
VSylJung-1 7778 Dr. Jung Ketsch peninsula, Rhine bank
VSylJung-2 7779 Dr. Jung Ketsch peninsula, Rhine bank
Ke 23-ITA 8323 JKI Siebeldingen Ketsch peninsula, Rhine bank
KE 006-GSH 8324 Geisenheim Ketsch peninsula, Rhine bank
VvsBgFfm 8581 BG Frankfurt Ketsch peninsula, Rhine bank
Isolated, Danube
Ö3 6174 Naturgarten Lobau, Danube bank, Austria
Ö5 6175 Naturgarten Lobau, Danube bank, Austria
Ö6 6176 Naturgarten Lobau, Danube bank, Austria
Ö7 6177 Naturgarten Lobau, Danube bank, Austria
Ö8 6178 Naturgarten Lobau, Danube bank, Austria
Ö9 6179 Naturgarten Lobau, Danube bank, Austria
Ö10 6180 Naturgarten Lobau, Danube bank, Austria
Ö11 6181 Naturgarten Lobau, Danube bank, Austria
Ö12 6182 Naturgarten Lobau, Danube bank, Austria
VsylRO-01 6556 Prof. Dr. Dister Romania, Danube bank
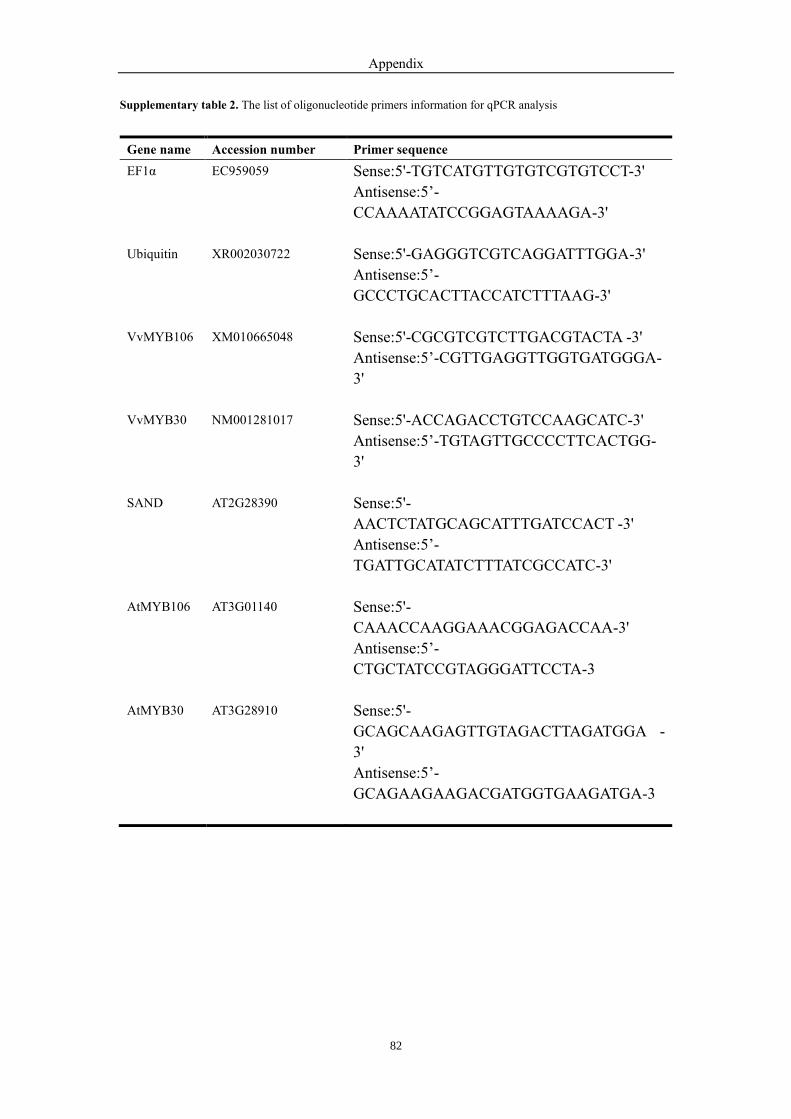
Appendix
82
Supplementary table 2. The list of oligonucleotide primers information for qPCR analysis
Gene name Accession number Primer sequence
EF1α EC959059
Sense:5'-TGTCATGTTGTGTCGTGTCCT-3'
Antisense:5’-
CCAAAATATCCGGAGTAAAAGA-3'
Ubiquitin XR002030722 Sense:5'-GAGGGTCGTCAGGATTTGGA-3'
Antisense:5’-
GCCCTGCACTTACCATCTTTAAG-3'
VvMYB106 XM010665048 Sense:5'-CGCGTCGTCTTGACGTACTA -3'
Antisense:5’-CGTTGAGGTTGGTGATGGGA-
3'
VvMYB30 NM001281017 Sense:5'-ACCAGACCTGTCCAAGCATC-3'
Antisense:5’-TGTAGTTGCCCCTTCACTGG-
3'
SAND AT2G28390 Sense:5'-
AACTCTATGCAGCATTTGATCCACT -3'
Antisense:5’-
TGATTGCATATCTTTATCGCCATC-3'
AtMYB106 AT3G01140 Sense:5'-
CAAACCAAGGAAACGGAGACCAA-3'
Antisense:5’-
CTGCTATCCGTAGGGATTCCTA-3
AtMYB30 AT3G28910
Sense:5'-
GCAGCAAGAGTTGTAGACTTAGATGGA -
3'
Antisense:5’-
GCAGAAGAAGACGATGGTGAAGATGA-3

Appendix
83
Supplementary table 3. The list of primers information for the constructs of MYB106 and MYB30 and their
promoters
Primer
name
Primer sequence Destination vector
MYB106-S GGGGACAAGTTTGTACAAAAAAGCAGGCTTCAT
GGGAGGATCTCCCTGC
PH7FWG2.0
PH7RWG2.0
pMAV-GW-YN
pMAV-YC-GW
MYB106-A GGGGACCACTTTGTACAAGAAAGCTGGGTCGAA
GTTGGGCGAACG
MYB30-S GGGGACAAGTTTGTACAAAAAAGCAGGCTTCAT
GGGGAGGCCACCTTG
PH7FWG2.0
pMAV-GW-YC
pMAV-YN-GW
MYB30-A GGGGACCACTTTGTACAAGAAAGCTGGGTCGAA
GAGCTGAACAGTGTCCT
pMYB106-S GGGGACAAGTTTGTACAAAAAAGCAGGCTTCGC
TGATCTACCCATGTTGTGTCC
pLUC pMYB106-A GGGGACCACTTTGTACAAGAAAGCTGGGTCTTT
GAGGGAGTGCCCAGTGA
pMYB30-S GGGGACAAGTTTGTACAAAAAAGCAGGCTTCTT
TTCGGTATTTTTACTCGATTGTG
pLUC pMYB30-A GGGGACCACTTTGTACAAGAAAGCTGGGTCGGC
TTTTCGCTCTCTCTCTCTG

Appendix
84
Supplementary Figure S1. Quantification of surface wax from cryo-SEM images. A Original cryo-SEM image of
a grapevine leaf surface with wax structures. Scale bars: 50 μm. B Inverted binary image used for automatic detection.
Inset refers to the zoom-in in D, C Automatic detection of surface wax structures using the Analyze Particle tool, the
inset refers to the zoom-in in E. D and E show a zoom in of the inverted binary image and the automatically
recognized wax structures used for quantification.
Supplementary Figure S2. Phylogenetic relationship of the sylvestris accessions inferred from whole-genome
sequencing by Maximum Likelihood (from Liang et al. 2019) and position of the five clades and the representative
genotypes shown in Figure.
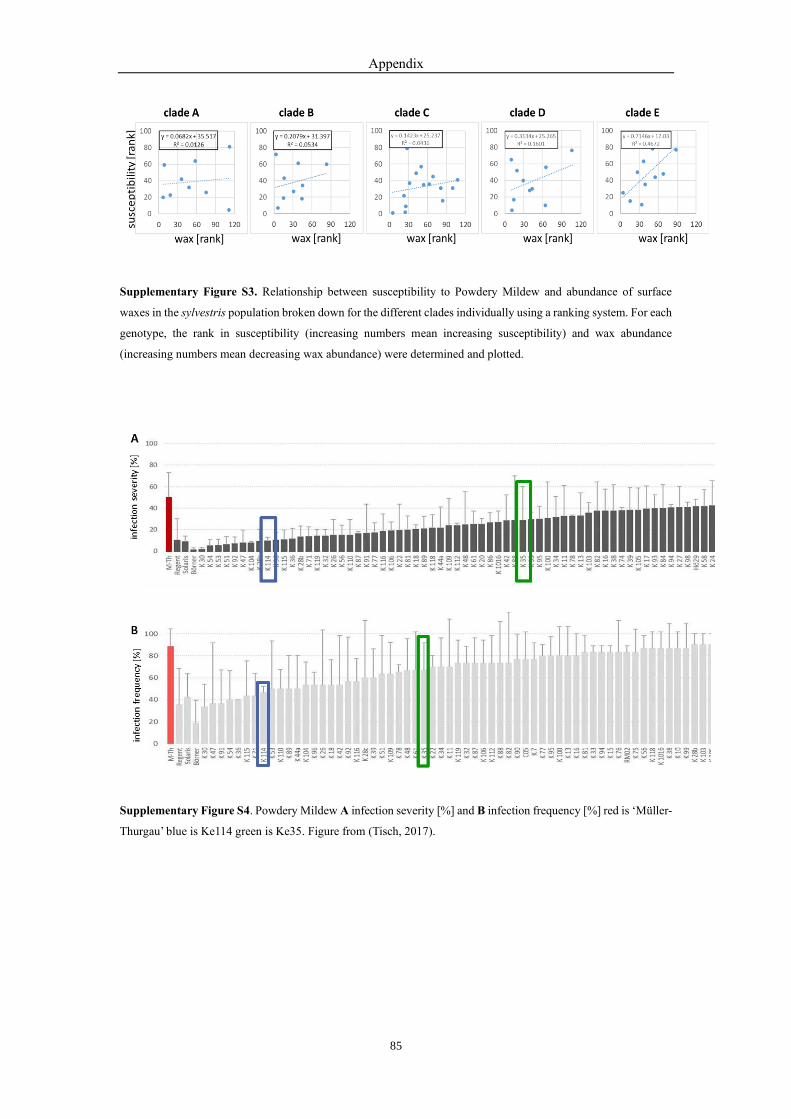
Appendix
85
Supplementary Figure S3. Relationship between susceptibility to Powdery Mildew and abundance of surface
waxes in the sylvestris population broken down for the different clades individually using a ranking system. For each
genotype, the rank in susceptibility (increasing numbers mean increasing susceptibility) and wax abundance
(increasing numbers mean decreasing wax abundance) were determined and plotted.
Supplementary Figure S4. Powdery Mildew A infection severity [%] and B infection frequency [%] red is ‘Müller-
Thurgau’ blue is Ke114 green is Ke35. Figure from (Tisch, 2017).
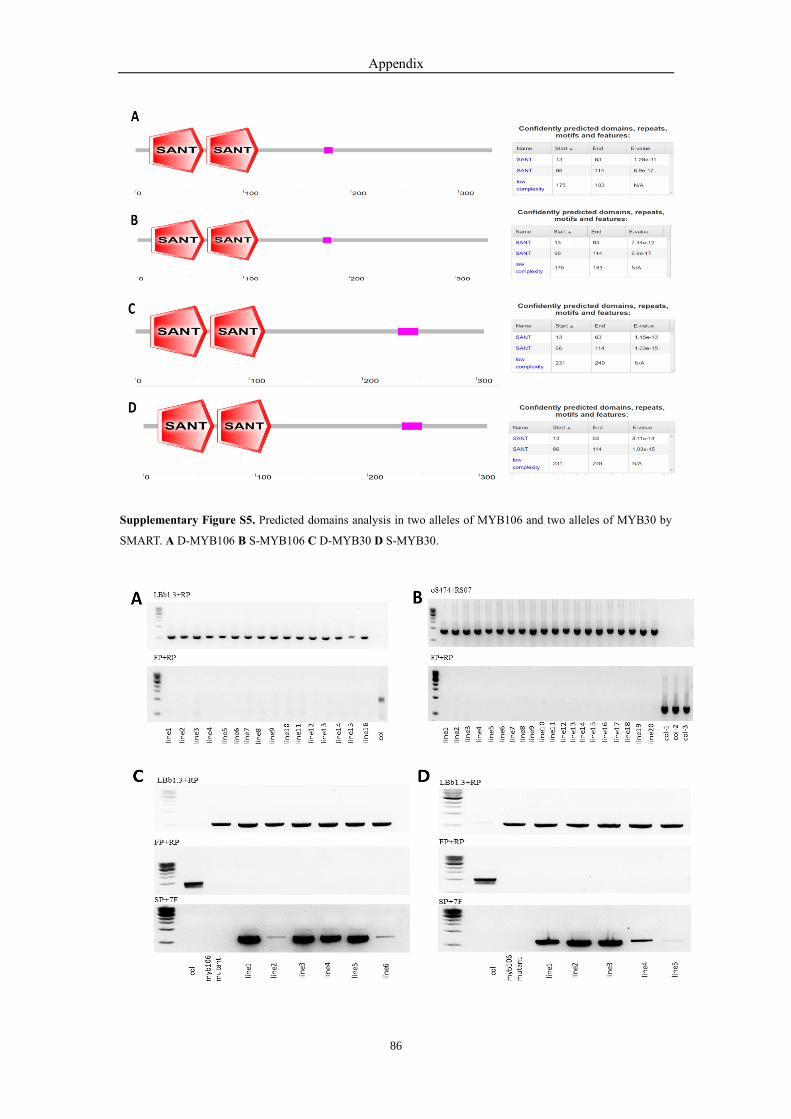
Appendix
86
Supplementary Figure S5. Predicted domains analysis in two alleles of MYB106 and two alleles of MYB30 by
SMART. A D-MYB106 B S-MYB106 C D-MYB30 D S-MYB30.

Appendix
87
Supplementary Figure S6. Confirmation the homolog of T-DNA insertion Arabidopsis myb106, myb30 mutants
and transgenic MYB106 lines, transgenic MYB30 lines. A myb106 mutants detection with primers: LBb1.3 5’-
ATTTTGCCGATTTCGGAAC-3’, FP 5’-TTCAATTGCTTGCACTCAGC-3’, and RP 5’-
CCAAGGTAAGGGACACATCG-3’ B myb30 mutants detection with primers: o8474 5’-
ATAATAACGCTGCGGACATCTACATTTT-3’, RS07 5’- CACTTCTCAAACAAAGACCATTGA-3’, FP 5’-
TTCATTCATCATCTCTCCTCTCTACC -3’, and RP 5’- AGTTTTGAGTCTTCGGCGAGT -3’ (C and D)
transgenic MYB106 lines with primers: LBb1.3 5’-ATTTTGCCGATTTCGGAAC-3’, FP 5’-
TTCAATTGCTTGCACTCAGC-3’, RP 5’- CCAAGGTAAGGGACACATCG-3’, SP 5’-
CGCGTCGTCTTGACGTACTA -3’ and 7F 5’-CTGCACGCCGTAGGTCAG-3’ C transgenic D-MYB106 lines D
transgenic S-MYB106 lines (E and F) transgenic MYB30 lines with primers: o8474 5’-
ATAATAACGCTGCGGACATCTACATTTT-3’, RS07 5’- CACTTCTCAAACAAAGACCATTGA-3’, FP 5’-
TTCATTCATCATCTCTCCTCTCTACC -3’, RP 5’- AGTTTTGAGTCTTCGGCGAGT -3’, PF1 5’-
ACCAGACCTGTCCAAGCATC -3’ and 7F 5’-CTGCACGCCGTAGGTCAG-3’ E transgenic D-MYB30 lines F
transgenic S-MYB30 lines.
Supplementary Figure S7. Detection AtMYB106 and AtMYB30 expression in the transgenic Arabidopsis lines
and Arabidopsis mutant background. A AtMYB106 relative expression B AtMYB30 relative expression.
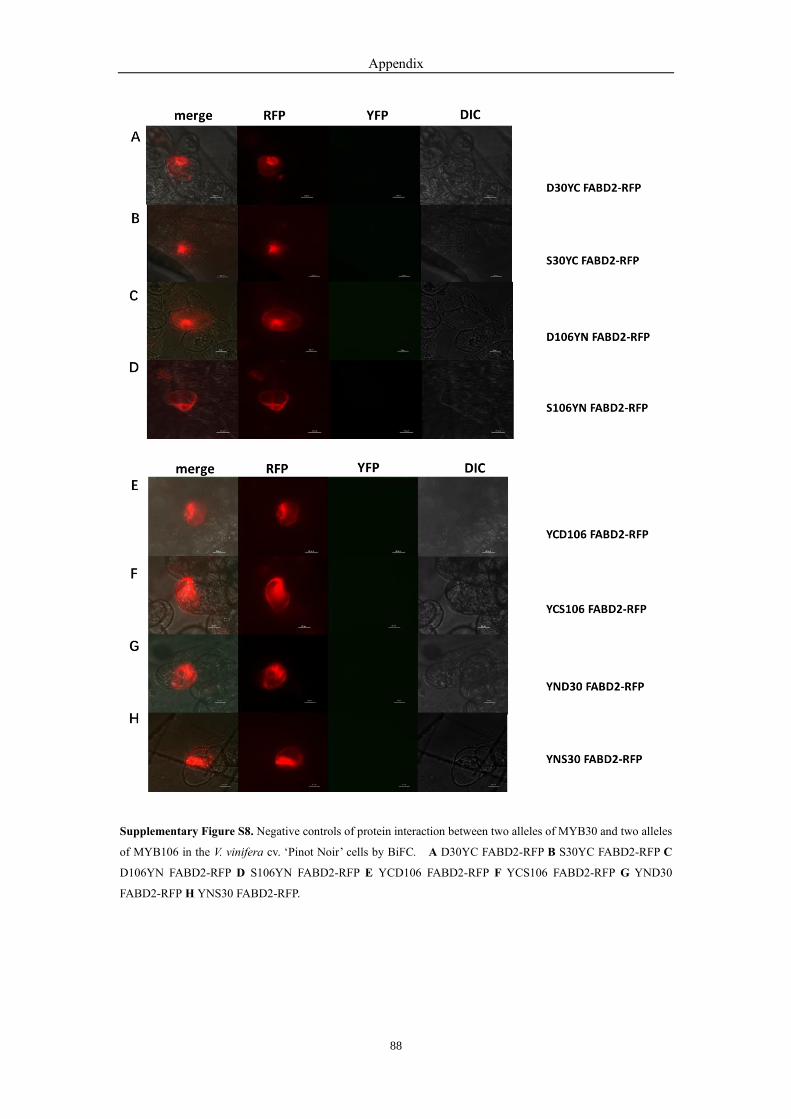
Appendix
88
Supplementary Figure S8. Negative controls of protein interaction between two alleles of MYB30 and two alleles
of MYB106 in the V. vinifera cv. ‘Pinot Noir’ cells by BiFC. A D30YC FABD2-RFP B S30YC FABD2-RFP C
D106YN FABD2-RFP D S106YN FABD2-RFP E YCD106 FABD2-RFP F YCS106 FABD2-RFP G YND30
FABD2-RFP H YNS30 FABD2-RFP.

Appendix
89
Supplementary Figure S9. The promoter activity of two alleles MYB106 and MYB30 in time course of chitosan
treatment. A The fold induction of promoter activities STS with MYB14 as the positive control B the promoter of
MYB30 activity after 1% acetic acid, 20μg/ml chitosan,50μg/ml chitosan, and 100μg/ml chitosan treatments. C
pMYB106-1 promoter activity after 1% acetic acid, 5μg/ml chitosan,10μg/ml chitosan 20μg/ml chitosan,50μg/ml
chitosan, and 100μg/ml chitosan treatments. D pMYB106-2 promoter activity after 1% acetic acid, 5μg/ml
chitosan,10μg/ml chitosan 20μg/ml chitosan,50μg/ml chitosan, and 100μg/ml chitosan treatments. 1 independent
experimental series.
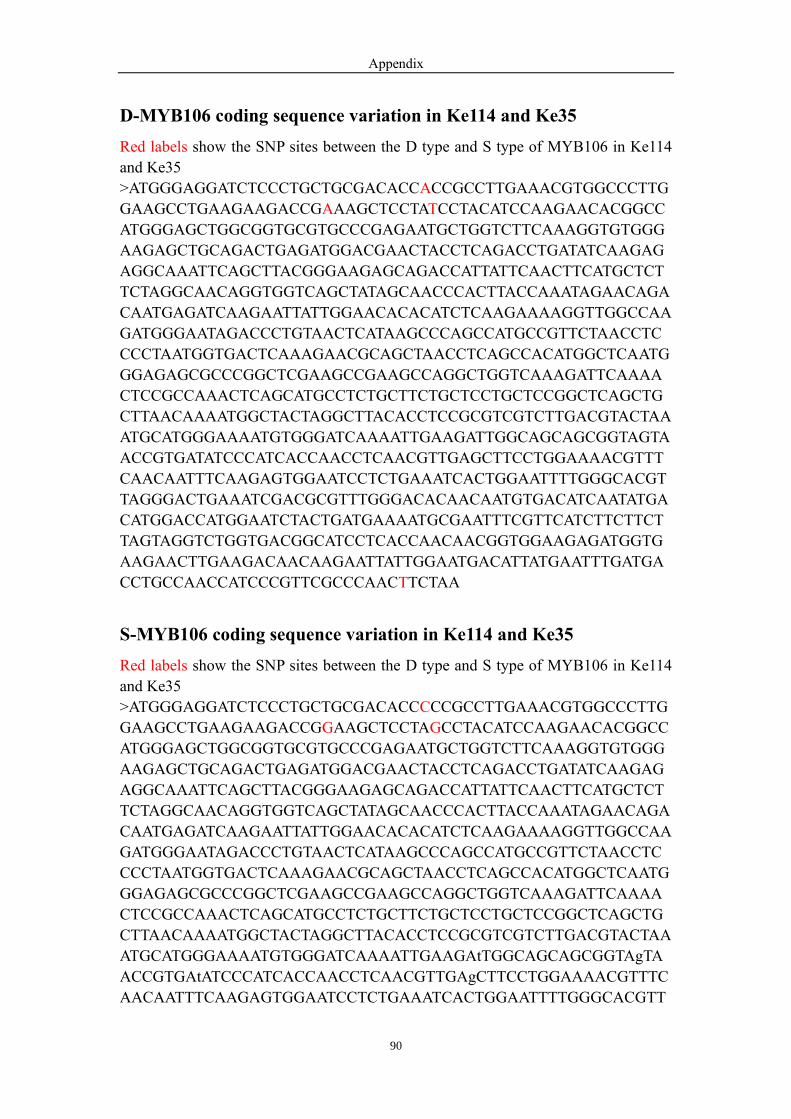
Appendix
90
D-MYB106 coding sequence variation in Ke114 and Ke35
Red labels show the SNP sites between the D type and S type of MYB106 in Ke114
and Ke35
>ATGGGAGGATCTCCCTGCTGCGACACCACCGCCTTGAAACGTGGCCCTTG
GAAGCCTGAAGAAGACCGAAAGCTCCTATCCTACATCCAAGAACACGGCC
ATGGGAGCTGGCGGTGCGTGCCCGAGAATGCTGGTCTTCAAAGGTGTGGG
AAGAGCTGCAGACTGAGATGGACGAACTACCTCAGACCTGATATCAAGAG
AGGCAAATTCAGCTTACGGGAAGAGCAGACCATTATTCAACTTCATGCTCT
TCTAGGCAACAGGTGGTCAGCTATAGCAACCCACTTACCAAATAGAACAGA
CAATGAGATCAAGAATTATTGGAACACACATCTCAAGAAAAGGTTGGCCAA
GATGGGAATAGACCCTGTAACTCATAAGCCCAGCCATGCCGTTCTAACCTC
CCCTAATGGTGACTCAAAGAACGCAGCTAACCTCAGCCACATGGCTCAATG
GGAGAGCGCCCGGCTCGAAGCCGAAGCCAGGCTGGTCAAAGATTCAAAA
CTCCGCCAAACTCAGCATGCCTCTGCTTCTGCTCCTGCTCCGGCTCAGCTG
CTTAACAAAATGGCTACTAGGCTTACACCTCCGCGTCGTCTTGACGTACTAA
ATGCATGGGAAAATGTGGGATCAAAATTGAAGATTGGCAGCAGCGGTAGTA
ACCGTGATATCCCATCACCAACCTCAACGTTGAGCTTCCTGGAAAACGTTT
CAACAATTTCAAGAGTGGAATCCTCTGAAATCACTGGAATTTTGGGCACGT
TAGGGACTGAAATCGACGCGTTTGGGACACAACAATGTGACATCAATATGA
CATGGACCATGGAATCTACTGATGAAAATGCGAATTTCGTTCATCTTCTTCT
TAGTAGGTCTGGTGACGGCATCCTCACCAACAACGGTGGAAGAGATGGTG
AAGAACTTGAAGACAACAAGAATTATTGGAATGACATTATGAATTTGATGA
CCTGCCAACCATCCCGTTCGCCCAACTTCTAA
S-MYB106 coding sequence variation in Ke114 and Ke35
Red labels show the SNP sites between the D type and S type of MYB106 in Ke114
and Ke35
>ATGGGAGGATCTCCCTGCTGCGACACCCCCGCCTTGAAACGTGGCCCTTG
GAAGCCTGAAGAAGACCGGAAGCTCCTAGCCTACATCCAAGAACACGGCC
ATGGGAGCTGGCGGTGCGTGCCCGAGAATGCTGGTCTTCAAAGGTGTGGG
AAGAGCTGCAGACTGAGATGGACGAACTACCTCAGACCTGATATCAAGAG
AGGCAAATTCAGCTTACGGGAAGAGCAGACCATTATTCAACTTCATGCTCT
TCTAGGCAACAGGTGGTCAGCTATAGCAACCCACTTACCAAATAGAACAGA
CAATGAGATCAAGAATTATTGGAACACACATCTCAAGAAAAGGTTGGCCAA
GATGGGAATAGACCCTGTAACTCATAAGCCCAGCCATGCCGTTCTAACCTC
CCCTAATGGTGACTCAAAGAACGCAGCTAACCTCAGCCACATGGCTCAATG
GGAGAGCGCCCGGCTCGAAGCCGAAGCCAGGCTGGTCAAAGATTCAAAA
CTCCGCCAAACTCAGCATGCCTCTGCTTCTGCTCCTGCTCCGGCTCAGCTG
CTTAACAAAATGGCTACTAGGCTTACACCTCCGCGTCGTCTTGACGTACTAA
ATGCATGGGAAAATGTGGGATCAAAATTGAAGAtTGGCAGCAGCGGTAgTA
ACCGTGAtATCCCATCACCAACCTCAACGTTGAgCTTCCTGGAAAACGTTTC
AACAATTTCAAGAGTGGAATCCTCTGAAATCACTGGAATTTTGGGCACGTT
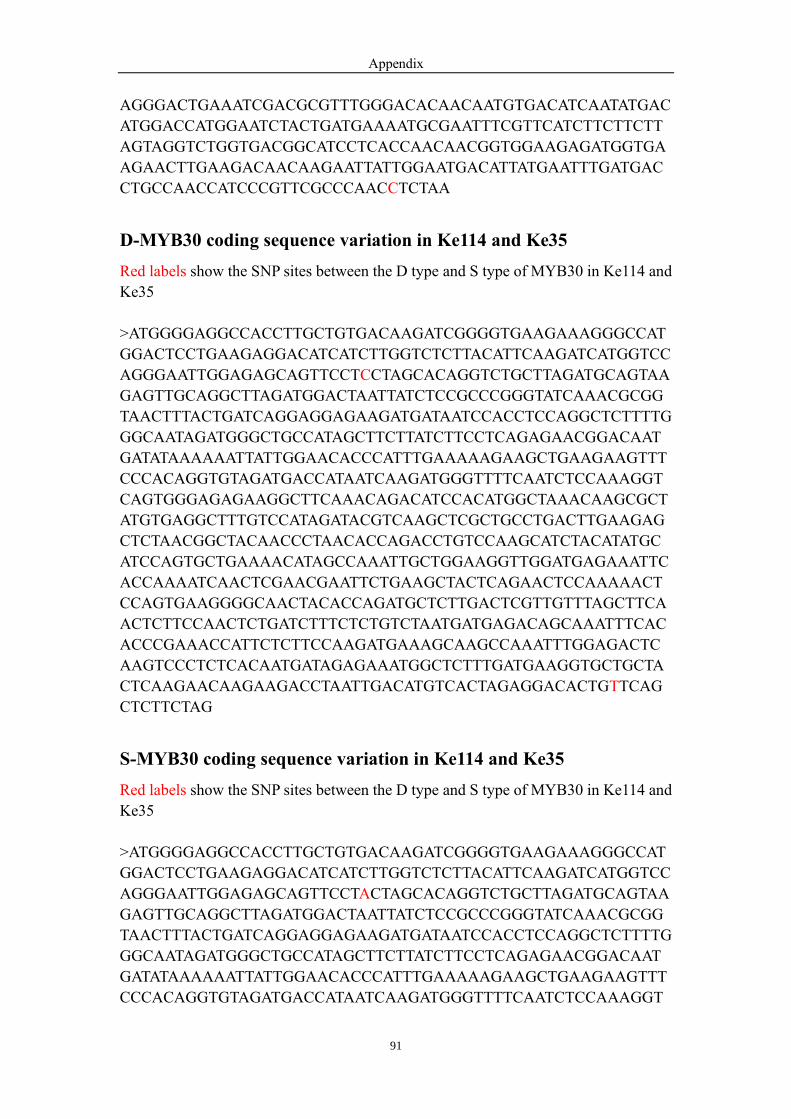
Appendix
91
AGGGACTGAAATCGACGCGTTTGGGACACAACAATGTGACATCAATATGAC
ATGGACCATGGAATCTACTGATGAAAATGCGAATTTCGTTCATCTTCTTCTT
AGTAGGTCTGGTGACGGCATCCTCACCAACAACGGTGGAAGAGATGGTGA
AGAACTTGAAGACAACAAGAATTATTGGAATGACATTATGAATTTGATGAC
CTGCCAACCATCCCGTTCGCCCAACCTCTAA
D-MYB30 coding sequence variation in Ke114 and Ke35
Red labels show the SNP sites between the D type and S type of MYB30 in Ke114 and
Ke35
>ATGGGGAGGCCACCTTGCTGTGACAAGATCGGGGTGAAGAAAGGGCCAT
GGACTCCTGAAGAGGACATCATCTTGGTCTCTTACATTCAAGATCATGGTCC
AGGGAATTGGAGAGCAGTTCCTCCTAGCACAGGTCTGCTTAGATGCAGTAA
GAGTTGCAGGCTTAGATGGACTAATTATCTCCGCCCGGGTATCAAACGCGG
TAACTTTACTGATCAGGAGGAGAAGATGATAATCCACCTCCAGGCTCTTTTG
GGCAATAGATGGGCTGCCATAGCTTCTTATCTTCCTCAGAGAACGGACAAT
GATATAAAAAATTATTGGAACACCCATTTGAAAAAGAAGCTGAAGAAGTTT
CCCACAGGTGTAGATGACCATAATCAAGATGGGTTTTCAATCTCCAAAGGT
CAGTGGGAGAGAAGGCTTCAAACAGACATCCACATGGCTAAACAAGCGCT
ATGTGAGGCTTTGTCCATAGATACGTCAAGCTCGCTGCCTGACTTGAAGAG
CTCTAACGGCTACAACCCTAACACCAGACCTGTCCAAGCATCTACATATGC
ATCCAGTGCTGAAAACATAGCCAAATTGCTGGAAGGTTGGATGAGAAATTC
ACCAAAATCAACTCGAACGAATTCTGAAGCTACTCAGAACTCCAAAAACT
CCAGTGAAGGGGCAACTACACCAGATGCTCTTGACTCGTTGTTTAGCTTCA
ACTCTTCCAACTCTGATCTTTCTCTGTCTAATGATGAGACAGCAAATTTCAC
ACCCGAAACCATTCTCTTCCAAGATGAAAGCAAGCCAAATTTGGAGACTC
AAGTCCCTCTCACAATGATAGAGAAATGGCTCTTTGATGAAGGTGCTGCTA
CTCAAGAACAAGAAGACCTAATTGACATGTCACTAGAGGACACTGTTCAG
CTCTTCTAG
S-MYB30 coding sequence variation in Ke114 and Ke35
Red labels show the SNP sites between the D type and S type of MYB30 in Ke114 and
Ke35
>ATGGGGAGGCCACCTTGCTGTGACAAGATCGGGGTGAAGAAAGGGCCAT
GGACTCCTGAAGAGGACATCATCTTGGTCTCTTACATTCAAGATCATGGTCC
AGGGAATTGGAGAGCAGTTCCTACTAGCACAGGTCTGCTTAGATGCAGTAA
GAGTTGCAGGCTTAGATGGACTAATTATCTCCGCCCGGGTATCAAACGCGG
TAACTTTACTGATCAGGAGGAGAAGATGATAATCCACCTCCAGGCTCTTTTG
GGCAATAGATGGGCTGCCATAGCTTCTTATCTTCCTCAGAGAACGGACAAT
GATATAAAAAATTATTGGAACACCCATTTGAAAAAGAAGCTGAAGAAGTTT
CCCACAGGTGTAGATGACCATAATCAAGATGGGTTTTCAATCTCCAAAGGT

Appendix
92
CAGTGGGAGAGAAGGCTTCAAACAGACATCCACATGGCTAAACAAGCGCT
ATGTGAGGCTTTGTCCATAGATACGTCAAGCTCGCTGCCTGACTTGAAGAG
CTCTAACGGCTACAACCCTAACACCAGACCTGTCCAAGCATCTACATATGC
ATCCAGTGCTGAAAACATAGCCAAATTGCTGGAAGGTTGGATGAGAAATTC
ACCAAAATCAACTCGAACGAATTCTGAAGCTACTCAGAACTCCAAAAACT
CCAGTGAAGGGGCAACTACACCAGATGCTCTTGACTCGTTGTTTAGCTTCA
ACTCTTCCAACTCTGATCTTTCTCTGTCTAATGATGAGACAGCAAATTTCAC
ACCCGAAACCATTCTCTTCCAAGATGAAAGCAAGCCAAATTTGGAGACTC
AAGTCCCTCTCACAATGATAGAGAAATGGCTCTTTGATGAAGGTGCTGCTA
CTCAAGAACAAGAAGACCTAATTGACATGTCACTAGAGGACACTGCTCAG
CTCTTCTAG
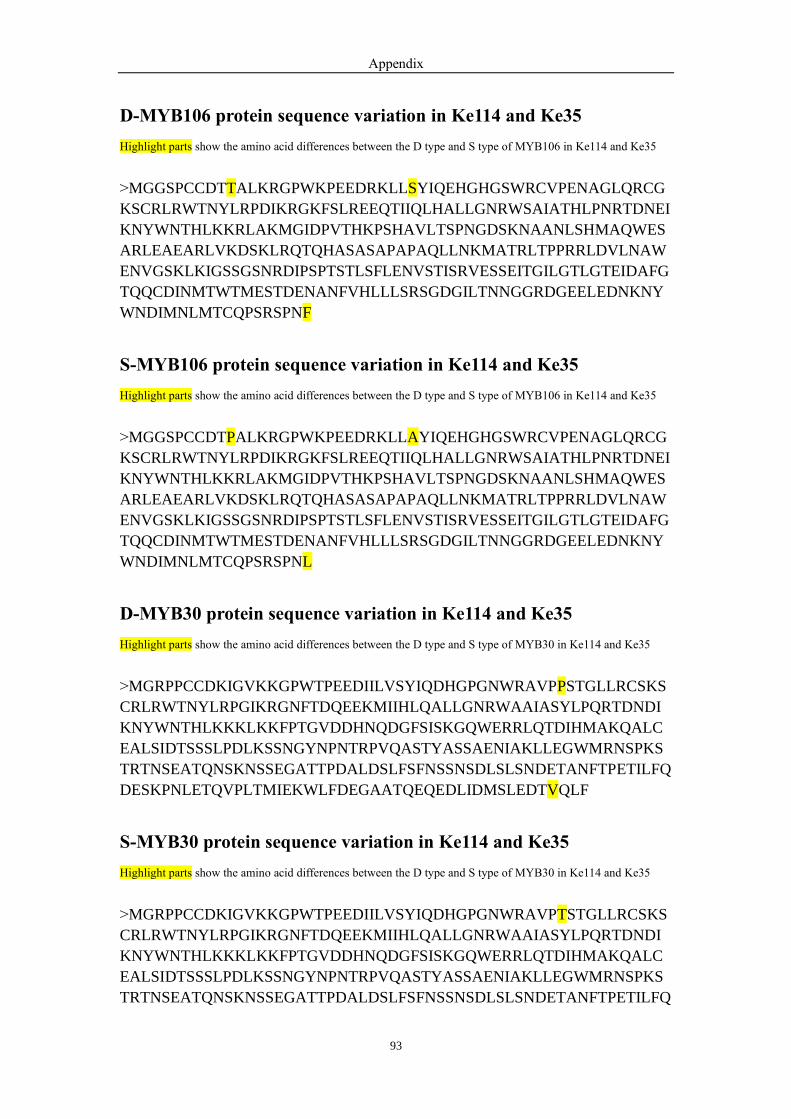
Appendix
93
D-MYB106 protein sequence variation in Ke114 and Ke35
Highlight parts show the amino acid differences between the D type and S type of MYB106 in Ke114 and Ke35
>MGGSPCCDTTALKRGPWKPEEDRKLLSYIQEHGHGSWRCVPENAGLQRCG
KSCRLRWTNYLRPDIKRGKFSLREEQTIIQLHALLGNRWSAIATHLPNRTDNEI
KNYWNTHLKKRLAKMGIDPVTHKPSHAVLTSPNGDSKNAANLSHMAQWES
ARLEAEARLVKDSKLRQTQHASASAPAPAQLLNKMATRLTPPRRLDVLNAW
ENVGSKLKIGSSGSNRDIPSPTSTLSFLENVSTISRVESSEITGILGTLGTEIDAFG
TQQCDINMTWTMESTDENANFVHLLLSRSGDGILTNNGGRDGEELEDNKNY
WNDIMNLMTCQPSRSPNF
S-MYB106 protein sequence variation in Ke114 and Ke35
Highlight parts show the amino acid differences between the D type and S type of MYB106 in Ke114 and Ke35
>MGGSPCCDTPALKRGPWKPEEDRKLLAYIQEHGHGSWRCVPENAGLQRCG
KSCRLRWTNYLRPDIKRGKFSLREEQTIIQLHALLGNRWSAIATHLPNRTDNEI
KNYWNTHLKKRLAKMGIDPVTHKPSHAVLTSPNGDSKNAANLSHMAQWES
ARLEAEARLVKDSKLRQTQHASASAPAPAQLLNKMATRLTPPRRLDVLNAW
ENVGSKLKIGSSGSNRDIPSPTSTLSFLENVSTISRVESSEITGILGTLGTEIDAFG
TQQCDINMTWTMESTDENANFVHLLLSRSGDGILTNNGGRDGEELEDNKNY
WNDIMNLMTCQPSRSPNL
D-MYB30 protein sequence variation in Ke114 and Ke35
Highlight parts show the amino acid differences between the D type and S type of MYB30 in Ke114 and Ke35
>MGRPPCCDKIGVKKGPWTPEEDIILVSYIQDHGPGNWRAVPPSTGLLRCSKS
CRLRWTNYLRPGIKRGNFTDQEEKMIIHLQALLGNRWAAIASYLPQRTDNDI
KNYWNTHLKKKLKKFPTGVDDHNQDGFSISKGQWERRLQTDIHMAKQALC
EALSIDTSSSLPDLKSSNGYNPNTRPVQASTYASSAENIAKLLEGWMRNSPKS
TRTNSEATQNSKNSSEGATTPDALDSLFSFNSSNSDLSLSNDETANFTPETILFQ
DESKPNLETQVPLTMIEKWLFDEGAATQEQEDLIDMSLEDTVQLF
S-MYB30 protein sequence variation in Ke114 and Ke35
Highlight parts show the amino acid differences between the D type and S type of MYB30 in Ke114 and Ke35
>MGRPPCCDKIGVKKGPWTPEEDIILVSYIQDHGPGNWRAVPTSTGLLRCSKS
CRLRWTNYLRPGIKRGNFTDQEEKMIIHLQALLGNRWAAIASYLPQRTDNDI
KNYWNTHLKKKLKKFPTGVDDHNQDGFSISKGQWERRLQTDIHMAKQALC
EALSIDTSSSLPDLKSSNGYNPNTRPVQASTYASSAENIAKLLEGWMRNSPKS
TRTNSEATQNSKNSSEGATTPDALDSLFSFNSSNSDLSLSNDETANFTPETILFQ

Appendix
94
DESKPNLETQVPLTMIEKWLFDEGAATQEQEDLIDMSLEDTAQLF

Appendix
95
Promoter sequence of MYB30 in Ke114 and Ke35
Highlight parts with different colors show the cis-acting regulatory elements (Lescot et al., 2002)
>TTTTCGGTATTTTTACTCGATTGTGATTCTCTTCTTATTTATGAAAATTTG
AATTTTAAAATTAATGTAAAAATAAATTTAAGACAAATTTTGGGACATATT
TTTTTATATATTTTTTTCTCAAAAAAGGAAAAACTTATGTTAAAGAAGAGT
TGCCAACGTATCCAAAAGGTTGCTAAAAATGAGGTATACAAACACAACTT
TTCCACTTCGGAAATATATATGTATATATTTTTTTTGCAAAAAAGACACAA
GCAAGAAAGAAAAAAAAAACGCCCATCGTCCATATTCATTTTGTCTTCTA
CTGGGAACAATTAGAGGCATGAACAATGGGTAGATGACGAAAGGGGTAG
ATGCATTCACAGTATGGAGAGCATGTGTGCGTCCATATCAGCTTCTTTCCA
CCCAAGAAATTAAACAAAAACTGTGAAAGTGGACAATAGTCAAAAACAG
CGTGCTTATACATTTATGAATCCAACATCAAGTCTTCTCCCTTCTCCCTTCT
CTCTTCTCTCTTCTCTCTTCTCTCTTCTATGAGTCTTATCTTTTCTGTGTCTT
CTGTCTCGCTAACTGCTCATTAATCATCCACTACTGCGTATGTGTATGCAC
ACCTCACAGTCAATTAGTCATAGACTCGTAGATAAGTTTTGCAACCCTTCT
TACCCATGCAGGTCACAATCTTCTGACGCAGTTTTCAACCATCACCACGTA
TCAGTCTTTTGTACCTATCCCTTGTTTGTTAGGTTTTTATTTTCCATCCCTAT
AAATCCTCTTTCAAACTCTCACTGATTACTTTTCAAGGTGTTTGCATTCATA
CCCTAAAAGATTCTCTGGTAACTAAAGTGGATTTTTTTCTTTTTTTGAGGC
GGGGCTATGGTTGCCCATCATAGGGGGTGAATCCTGAAGGAACAAAGTAG
AGGCATTACTCAATTAAAAAAATGGGTTGGGATGATTTACAAGTTTTATAT
ATGGATTGAACTACAATGATCATGTTTCCTAATATGAACGCAATGAAAGT
AGACCACGGATGAGGGGCTCCACAGTCCTCACGGCTAAGCTAAGCTCTCA
TATTCCATCCTTTTCTGAATTGAATGATGGGCCCCTAACAAGCCTAATATG
GGGAGTCCTCCAAAGTAATCCTCTCTCCCTCTCCCTCTGTCTATTCAAAAT
TTCAAATTTTCCACACATTGAACGCTATCCACATCACCCCCTTCCCACGTC
GTGCACACAACCTCAGAATCAAAAGGTACCTGCCGACTCCGTTGTTTTTCT
AAAGCTAATAAATCTTCTGGAACATGCAATAGTATATTTCTTATGCAGCTA
GCCATGAAATCGGTTTTCAATTTCCACTGTTCACATTGATTTTCTGATGAA
TCTAGTTGTAATGCCGTAACGCACACAAACCCAATTTGTGACGCCTAGGG
CCACTGGCCAAATTGGAGATTCACAAAGTTGATAATTAGTGGTGTAGTTA
CACAAATTCTGAATAATTAATTCTAGGCTTCCCTCCTAACTATAGTAGTCA
CATGGTGTCTAAATCCAAATACATGCATATTGGCTACATGTATCACCTCTT
ATCTATTCCTAAATGAAGCCGTCCTTTCAGCCATTATAACTATGTGATGAA
TAACAATATTTTCATGGACAACGAGTGCCGTGTGGTTTCACTCGGTACAGC
TCTTTTCATGTACTCTTTCCCCCAGATGATGACTATGCTTGATGCATATATA
CATATATAGATATACGCACAACTATATTTCATGGTACCATAGAATATCAAT
TGGTAATTAAGTTGTTGATCTAGTAGTGGACATTAATATAGGTGAGGCAG
ACAACTGAGGAGTGGATTGTGAGTTGAGACAAACCCAACTTGGCCATAAC
CTCCATGGAATGGATCCACTTGGAATGCACGTATCACAAGTACCAAATCA
ATGTATTGCAAGGACGTACACTTCCATCTTCCGAAATTGGGTATGATCTGA
AATTCGTAATTAGAAGAATTAGATGGATCATGGACGGACACATTTTTTTTA
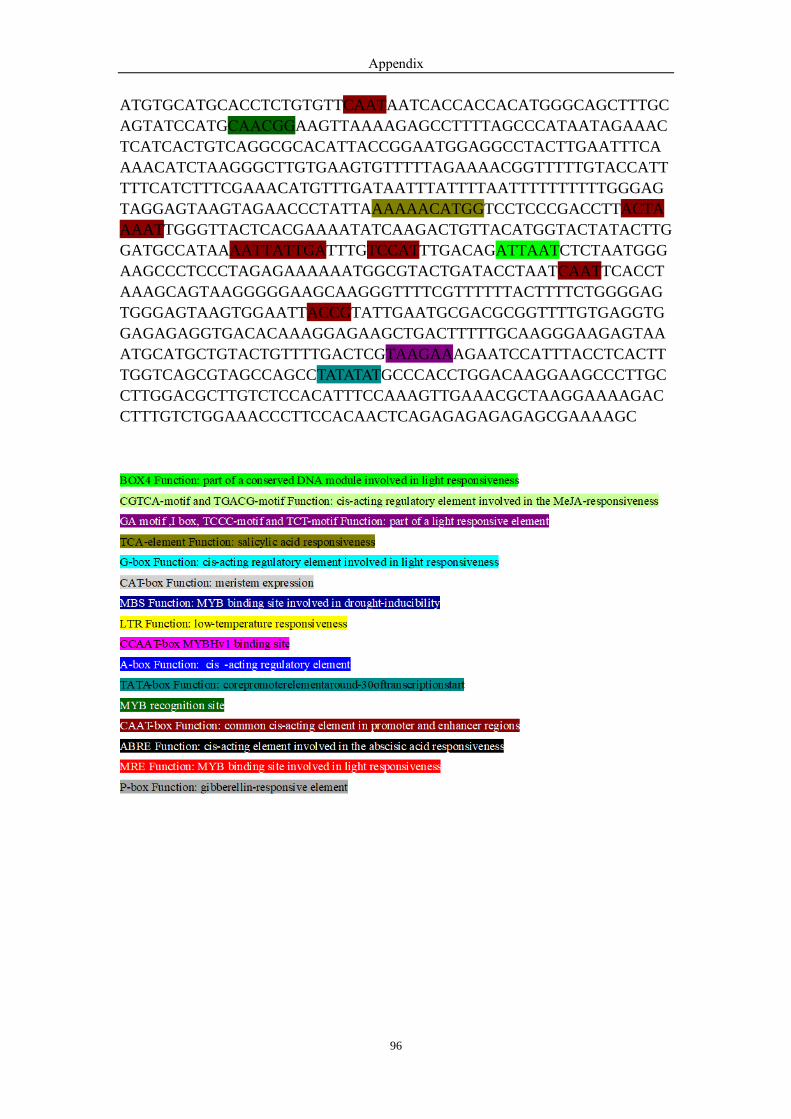
Appendix
96
ATGTGCATGCACCTCTGTGTTCAATAATCACCACCACATGGGCAGCTTTGC
AGTATCCATGCAACGGAAGTTAAAAGAGCCTTTTAGCCCATAATAGAAAC
TCATCACTGTCAGGCGCACATTACCGGAATGGAGGCCTACTTGAATTTCA
AAACATCTAAGGGCTTGTGAAGTGTTTTTAGAAAACGGTTTTTGTACCATT
TTTCATCTTTCGAAACATGTTTGATAATTTATTTTAATTTTTTTTTTGGGAG
TAGGAGTAAGTAGAACCCTATTAAAAAACATGGTCCTCCCGACCTTACTA
AAATTGGGTTACTCACGAAAATATCAAGACTGTTACATGGTACTATACTTG
GATGCCATAAAATTATTGATTTGTCCATTTGACAGATTAATCTCTAATGGG
AAGCCCTCCCTAGAGAAAAAATGGCGTACTGATACCTAATCAATTCACCT
AAAGCAGTAAGGGGGAAGCAAGGGTTTTCGTTTTTTACTTTTCTGGGGAG
TGGGAGTAAGTGGAATTACCGTATTGAATGCGACGCGGTTTTGTGAGGTG
GAGAGAGGTGACACAAAGGAGAAGCTGACTTTTTGCAAGGGAAGAGTAA
ATGCATGCTGTACTGTTTTGACTCGTAAGAAAGAATCCATTTACCTCACTT
TGGTCAGCGTAGCCAGCCTATATATGCCCACCTGGACAAGGAAGCCCTTGC
CTTGGACGCTTGTCTCCACATTTCCAAAGTTGAAACGCTAAGGAAAAGAC
CTTTGTCTGGAAACCCTTCCACAACTCAGAGAGAGAGAGCGAAAAGC
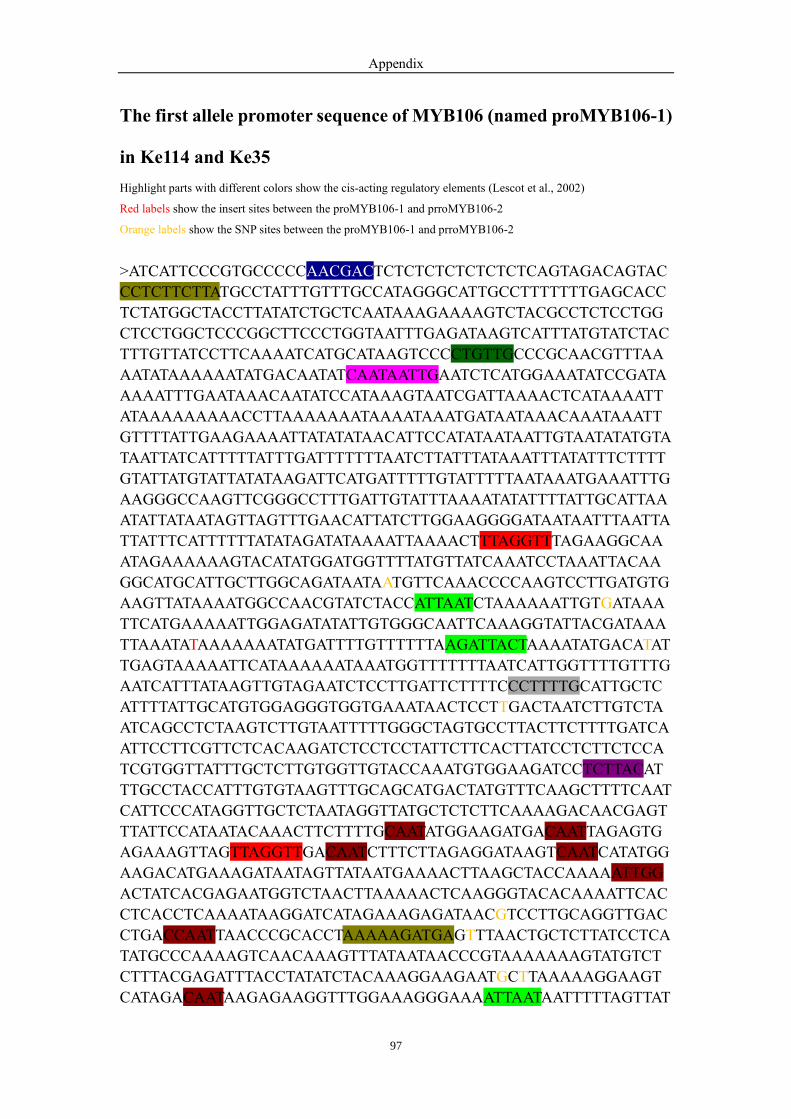
Appendix
97
The first allele promoter sequence of MYB106 (named proMYB106-1)
in Ke114 and Ke35
Highlight parts with different colors show the cis-acting regulatory elements (Lescot et al., 2002)
Red labels show the insert sites between the proMYB106-1 and prroMYB106-2
Orange labels show the SNP sites between the proMYB106-1 and prroMYB106-2
>ATCATTCCCGTGCCCCCAACGACTCTCTCTCTCTCTCTCAGTAGACAGTAC
CCTCTTCTTATGCCTATTTGTTTGCCATAGGGCATTGCCTTTTTTTGAGCACC
TCTATGGCTACCTTATATCTGCTCAATAAAGAAAAGTCTACGCCTCTCCTGG
CTCCTGGCTCCCGGCTTCCCTGGTAATTTGAGATAAGTCATTTATGTATCTAC
TTTGTTATCCTTCAAAATCATGCATAAGTCCCCTGTTGCCCGCAACGTTTAA
AATATAAAAAATATGACAATATCAATAATTGAATCTCATGGAAATATCCGATA
AAAATTTGAATAAACAATATCCATAAAGTAATCGATTAAAACTCATAAAATT
ATAAAAAAAAACCTTAAAAAAATAAAATAAATGATAATAAACAAATAAATT
GTTTTATTGAAGAAAATTATATATAACATTCCATATAATAATTGTAATATATGTA
TAATTATCATTTTTATTTGATTTTTTTAATCTTATTTATAAATTTATATTTCTTTT
GTATTATGTATTATATAAGATTCATGATTTTTGTATTTTTAATAAATGAAATTTG
AAGGGCCAAGTTCGGGCCTTTGATTGTATTTAAAATATATTTTATTGCATTAA
ATATTATAATAGTTAGTTTGAACATTATCTTGGAAGGGGATAATAATTTAATTA
TTATTTCATTTTTTATATAGATATAAAATTAAAACTTTAGGTTTAGAAGGCAA
ATAGAAAAAAGTACATATGGATGGTTTTATGTTATCAAATCCTAAATTACAA
GGCATGCATTGCTTGGCAGATAATAATGTTCAAACCCCAAGTCCTTGATGTG
AAGTTATAAAATGGCCAACGTATCTACCATTAATCTAAAAAATTGTGATAAA
TTCATGAAAAATTGGAGATATATTGTGGGCAATTCAAAGGTATTACGATAAA
TTAAATATAAAAAAATATGATTTTGTTTTTTAAGATTACTAAAATATGACATAT
TGAGTAAAAATTCATAAAAAATAAATGGTTTTTTTAATCATTGGTTTTGTTTG
AATCATTTATAAGTTGTAGAATCTCCTTGATTCTTTTCCCTTTTGCATTGCTC
ATTTTATTGCATGTGGAGGGTGGTGAAATAACTCCTTGACTAATCTTGTCTA
ATCAGCCTCTAAGTCTTGTAATTTTTGGGCTAGTGCCTTACTTCTTTTGATCA
ATTCCTTCGTTCTCACAAGATCTCCTCCTATTCTTCACTTATCCTCTTCTCCA
TCGTGGTTATTTGCTCTTGTGGTTGTACCAAATGTGGAAGATCCTCTTACAT
TTGCCTACCATTTGTGTAAGTTTGCAGCATGACTATGTTTCAAGCTTTTCAAT
CATTCCCATAGGTTGCTCTAATAGGTTATGCTCTCTTCAAAAGACAACGAGT
TTATTCCATAATACAAACTTCTTTTGCAATATGGAAGATGACAATTAGAGTG
AGAAAGTTAGTTAGGTTGACAATCTTTCTTAGAGGATAAGTCAATCATATGG
AAGACATGAAAGATAATAGTTATAATGAAAACTTAAGCTACCAAAAATTGG
ACTATCACGAGAATGGTCTAACTTAAAAACTCAAGGGTACACAAAATTCAC
CTCACCTCAAAATAAGGATCATAGAAAGAGATAACGTCCTTGCAGGTTGAC
CTGACCAATTAACCCGCACCTAAAAAGATGAGTTTAACTGCTCTTATCCTCA
TATGCCCAAAAGTCAACAAAGTTTATAATAACCCGTAAAAAAAGTATGTCT
CTTTACGAGATTTACCTATATCTACAAAGGAAGAATGCTTAAAAAGGAAGT
CATAGACAATAAGAGAAGGTTTGGAAAGGGAAAATTAATAATTTTTAGTTAT

Appendix
98
TCATGAAGATCTTTGAGCATCTTCAAAAACCATGGTTTTTAGATGTAAATTC
AAACCTTTTTTTTATAAAAATAAAAGATAAATGGCGAGACAAAATAACCATT
TTGAACCATTGTTTCAAAAGGTTACCACAATACCTTACCGTAGTGGTCAAG
TTGGAACCAAAACTCCATATTTTTCTCCAGCTTGTCAGAGTTAGTAGCCAG
AAATGAATAAAATGCCACCTAAATTGACTGGCAACATTTATCAGTATTGTAA
GATATGACATGACCGTGGAATTTATAATATTCGTCCTTGGTGGGTACCTTTCG
GGTCATGGGCTTAGGCTAAAATTTAAGAACAAGTTCAGAAAACTTATGAAT
TGGAGACTCTAGACCAAAATATTGGTACGGTAAGTAAGGGTCTATGACCTA
AACTTACTTCTTTGGGTCACCACCGATATTTTGCCCCTTTGGGTCATCACTG
ATAAAGTTAATTGCCAATCAATTACCATGCATACACGTAACGTTATTGTTCAT
GCATCAATGGGAGTCAGGGAGGTTCCTTTCAGAATCGGTCCCCTTGGTTAC
AGGAGCCATATTAATGGTGTACAATTAATGGATGGTGATGTGTTGTAGAGGA
ACTTACACTCTAAACAATTAAAAGCTGGGGTACGGGTTTTTCATAACCTTCA
TCCAGGACGGCACAGTGATTGGAACAAGCTATGGGAGACGAATTAACCAC
AGTAAAATGATAGGGAATGGTTGGACAGTGTAGCTGTGTAACAATGATTTAT
TTGCTATGTTCTAATCGCTTAATTTTAAAAATTAATGGGTGGATAAGTTCAGA
AGGATGTGTGTTTTTTTGGTTTAGATGAGGTAAAAATCTGTCTTCCATAAAG
AGCAGGGCAGGGGTAGGGGCAGTATGCCACTAATTACAGAGGTTTACACA
ATTTAATGGAATTCAATACTTTATCCCATAAATAGTGCTGATCGTTGCCCATT
TCTCTATCCTCTGGTGTCTCCCATTTTTCTAACAAACTCCCTTTCCATCTCCT
GATCATCATCATTCACCTCAAAGAAGCTTCTTATATCCAGCTGCCTCATTCTG
CTTTGCTCGCCGTGTCACTGGGCACTCCCTCAAA
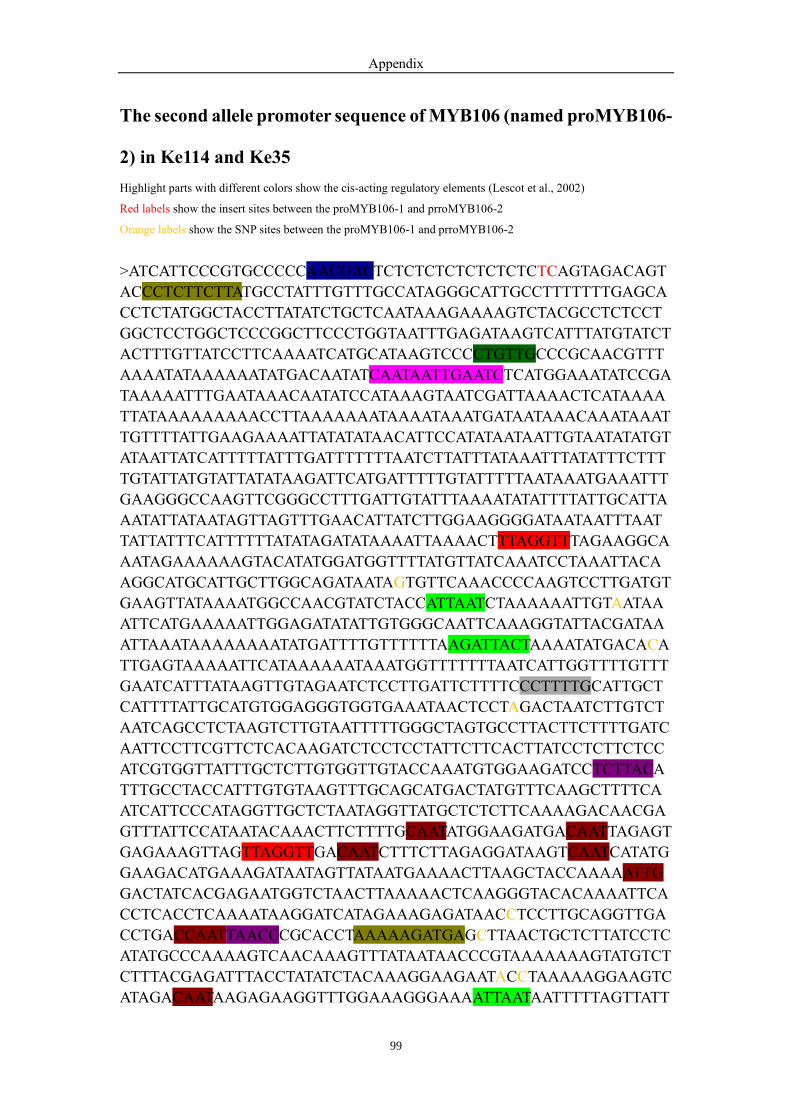
Appendix
99
The second allele promoter sequence of MYB106 (named proMYB106-
2) in Ke114 and Ke35
Highlight parts with different colors show the cis-acting regulatory elements (Lescot et al., 2002)
Red labels show the insert sites between the proMYB106-1 and prroMYB106-2
Orange labels show the SNP sites between the proMYB106-1 and prroMYB106-2
>ATCATTCCCGTGCCCCCAACGACTCTCTCTCTCTCTCTCTCAGTAGACAGT
ACCCTCTTCTTATGCCTATTTGTTTGCCATAGGGCATTGCCTTTTTTTGAGCA
CCTCTATGGCTACCTTATATCTGCTCAATAAAGAAAAGTCTACGCCTCTCCT
GGCTCCTGGCTCCCGGCTTCCCTGGTAATTTGAGATAAGTCATTTATGTATCT
ACTTTGTTATCCTTCAAAATCATGCATAAGTCCCCTGTTGCCCGCAACGTTT
AAAATATAAAAAATATGACAATATCAATAATTGAATCTCATGGAAATATCCGA
TAAAAATTTGAATAAACAATATCCATAAAGTAATCGATTAAAACTCATAAAA
TTATAAAAAAAAACCTTAAAAAAATAAAATAAATGATAATAAACAAATAAAT
TGTTTTATTGAAGAAAATTATATATAACATTCCATATAATAATTGTAATATATGT
ATAATTATCATTTTTATTTGATTTTTTTAATCTTATTTATAAATTTATATTTCTTT
TGTATTATGTATTATATAAGATTCATGATTTTTGTATTTTTAATAAATGAAATTT
GAAGGGCCAAGTTCGGGCCTTTGATTGTATTTAAAATATATTTTATTGCATTA
AATATTATAATAGTTAGTTTGAACATTATCTTGGAAGGGGATAATAATTTAAT
TATTATTTCATTTTTTATATAGATATAAAATTAAAACTTTAGGTTTAGAAGGCA
AATAGAAAAAAGTACATATGGATGGTTTTATGTTATCAAATCCTAAATTACA
AGGCATGCATTGCTTGGCAGATAATAGTGTTCAAACCCCAAGTCCTTGATGT
GAAGTTATAAAATGGCCAACGTATCTACCATTAATCTAAAAAATTGTAATAA
ATTCATGAAAAATTGGAGATATATTGTGGGCAATTCAAAGGTATTACGATAA
ATTAAATAAAAAAAATATGATTTTGTTTTTTAAGATTACTAAAATATGACACA
TTGAGTAAAAATTCATAAAAAATAAATGGTTTTTTTAATCATTGGTTTTGTTT
GAATCATTTATAAGTTGTAGAATCTCCTTGATTCTTTTCCCTTTTGCATTGCT
CATTTTATTGCATGTGGAGGGTGGTGAAATAACTCCTAGACTAATCTTGTCT
AATCAGCCTCTAAGTCTTGTAATTTTTGGGCTAGTGCCTTACTTCTTTTGATC
AATTCCTTCGTTCTCACAAGATCTCCTCCTATTCTTCACTTATCCTCTTCTCC
ATCGTGGTTATTTGCTCTTGTGGTTGTACCAAATGTGGAAGATCCTCTTACA
TTTGCCTACCATTTGTGTAAGTTTGCAGCATGACTATGTTTCAAGCTTTTCA
ATCATTCCCATAGGTTGCTCTAATAGGTTATGCTCTCTTCAAAAGACAACGA
GTTTATTCCATAATACAAACTTCTTTTGCAATATGGAAGATGACAATTAGAGT
GAGAAAGTTAGTTAGGTTGACAATCTTTCTTAGAGGATAAGTCAATCATATG
GAAGACATGAAAGATAATAGTTATAATGAAAACTTAAGCTACCAAAAATTG
GACTATCACGAGAATGGTCTAACTTAAAAACTCAAGGGTACACAAAATTCA
CCTCACCTCAAAATAAGGATCATAGAAAGAGATAACCTCCTTGCAGGTTGA
CCTGACCAATTAACCCGCACCTAAAAAGATGAGCTTAACTGCTCTTATCCTC
ATATGCCCAAAAGTCAACAAAGTTTATAATAACCCGTAAAAAAAGTATGTCT
CTTTACGAGATTTACCTATATCTACAAAGGAAGAATACCTAAAAAGGAAGTC
ATAGACAATAAGAGAAGGTTTGGAAAGGGAAAATTAATAATTTTTAGTTATT
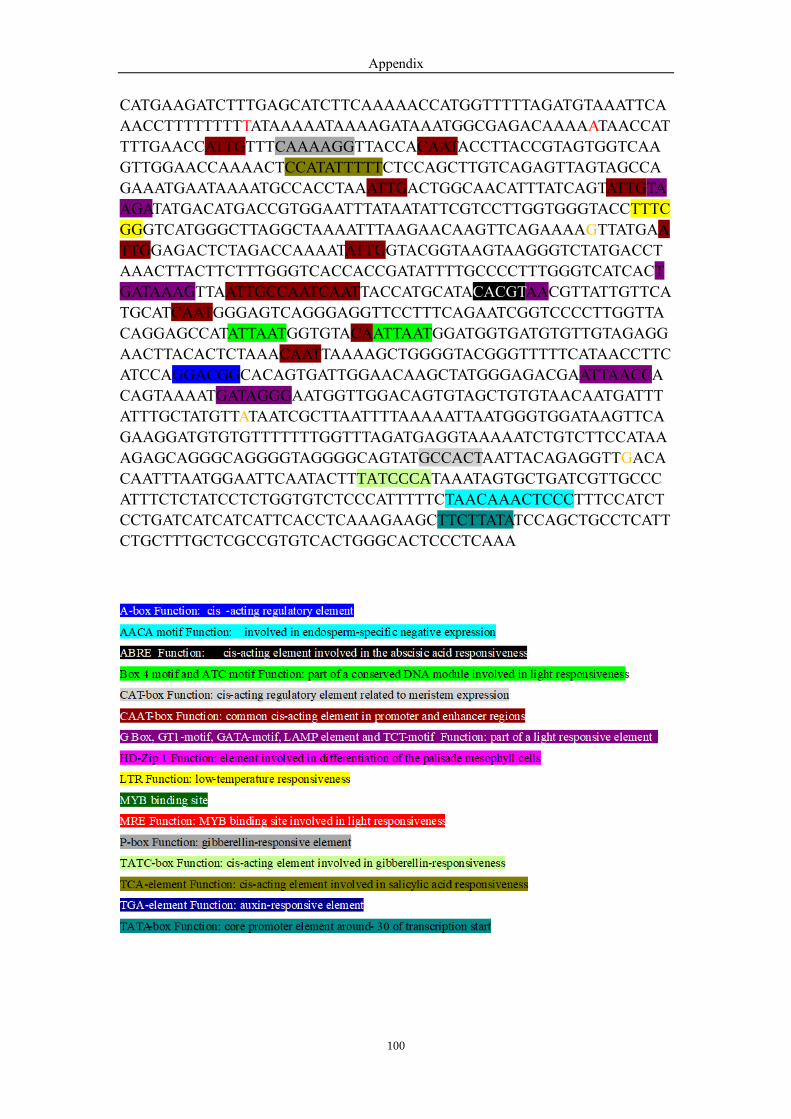
Appendix
100
CATGAAGATCTTTGAGCATCTTCAAAAACCATGGTTTTTAGATGTAAATTCA
AACCTTTTTTTTTATAAAAATAAAAGATAAATGGCGAGACAAAAATAACCAT
TTTGAACCATTGTTTCAAAAGGTTACCACAATACCTTACCGTAGTGGTCAA
GTTGGAACCAAAACTCCATATTTTTCTCCAGCTTGTCAGAGTTAGTAGCCA
GAAATGAATAAAATGCCACCTAAATTGACTGGCAACATTTATCAGTATTGTA
AGATATGACATGACCGTGGAATTTATAATATTCGTCCTTGGTGGGTACCTTTC
GGGTCATGGGCTTAGGCTAAAATTTAAGAACAAGTTCAGAAAAGTTATGAA
TTGGAGACTCTAGACCAAAATATTGGTACGGTAAGTAAGGGTCTATGACCT
AAACTTACTTCTTTGGGTCACCACCGATATTTTGCCCCTTTGGGTCATCACT
GATAAAGTTAATTGCCAATCAATTACCATGCATACACGTAACGTTATTGTTCA
TGCATCAATGGGAGTCAGGGAGGTTCCTTTCAGAATCGGTCCCCTTGGTTA
CAGGAGCCATATTAATGGTGTACAATTAATGGATGGTGATGTGTTGTAGAGG
AACTTACACTCTAAACAATTAAAAGCTGGGGTACGGGTTTTTCATAACCTTC
ATCCAGGACGGCACAGTGATTGGAACAAGCTATGGGAGACGAATTAACCA
CAGTAAAATGATAGGGAATGGTTGGACAGTGTAGCTGTGTAACAATGATTT
ATTTGCTATGTTATAATCGCTTAATTTTAAAAATTAATGGGTGGATAAGTTCA
GAAGGATGTGTGTTTTTTTGGTTTAGATGAGGTAAAAATCTGTCTTCCATAA
AGAGCAGGGCAGGGGTAGGGGCAGTATGCCACTAATTACAGAGGTTGACA
CAATTTAATGGAATTCAATACTTTATCCCATAAATAGTGCTGATCGTTGCCC
ATTTCTCTATCCTCTGGTGTCTCCCATTTTTCTAACAAACTCCCTTTCCATCT
CCTGATCATCATCATTCACCTCAAAGAAGCTTCTTATATCCAGCTGCCTCATT
CTGCTTTGCTCGCCGTGTCACTGGGCACTCCCTCAAA
Curriculum Vitae
101
References
Alonso, J. M., Stepanova, A. N., Leisse, T. J., Kim, C. J., Chen, H., Shinn, P., …
Joseph R. Ecker. (2003). Genome-Wide Insertional Mutagenesis of Arabidopsis
thaliana. Science, 301(5633), 653–657. https://doi.org/10.1126/science.1086391
Armijo, G., Schlechter, R., Agurto, M., Muñoz, D., Nuñez, C., & Arce-Johnson, P.
(2016). Grapevine pathogenic microorganisms: Understanding infection
strategies and host response scenarios. Frontiers in Plant Science, Vol. 7.
https://doi.org/10.3389/fpls.2016.00382
Arnold, C., Schnitzler, A., Douard, A., Peter, R., & Gillet, F. (2005). Is there a future
for wild grapevine (Vitis vinifera subsp. silvestris) in the Rhine Valley?
Biodiversity and Conservation, Vol. 14, pp. 1507–1523.
https://doi.org/10.1007/s10531-004-9789-9
Austin, C. N., & Wilcox, W. F. (2011). Effects of fruit-zone leaf removal, training
systems, and irrigation on the development of grapevine powdery mildew.
American Journal of Enology and Viticulture, 62(2).
https://doi.org/10.5344/ajev.2010.10084
Bach, L., Michaelson, L. V., Haslam, R., Bellec, Y., Gissot, L., Marion, J., … Faure,
J. D. (2008). The very-long-chain hydroxy fatty acyl-CoA dehydratase
PASTICCINO2 is essential and limiting for plant development. Proceedings of
the National Academy of Sciences of the United States of America, 105(38).
https://doi.org/10.1073/pnas.0805089105
Barthlott, W., & Neinhuis, C. (1997). Purity of the sacred lotus, or escape from
contamination in biological surfaces. Planta, 202(1).
https://doi.org/10.1007/s004250050096
Barthlott, Wilhelm, Neinhuis, C., Cutler, D., Ditsch, F., Meusel, I., Theisen, I., &
Wilhelmi, H. (1998). Classification and terminology of plant epicuticular waxes.
Botanical Journal of the Linnean Society, 126(3). https://doi.org/10.1111/j.1095-
8339.1998.tb02529.x
Beaudoin, F., Wu, X., Li, F., Haslam, R. P., Markham, J. E., Zheng, H., … Kunst, L.
(2009). Functional characterization of the Arabidopsis β-ketoacyl-coenzyme a
reductase candidates of the fatty acid elongase. Plant Physiology, 150(3), 1174–
1191. https://doi.org/10.1104/pp.109.137497
Beckett, A., & Read, N. D. (1986). Low-Temperature Scanning Electron Microscopy.
In H. C. Aldrich & W. J. Todd (Eds.), Ultrastructure Techniques for
Microorganisms (pp. 45–86). https://doi.org/10.1007/978-1-4684-5119-1_2
Bernard, A., Domergue, F., Pascal, S., Jetter, R., Renne, C., Faure, J. D., … Joubès, J.
(2012). Reconstitution of plant alkane biosynthesis in yeast demonstrates that
Arabidopsis ECERIFERUM1 and ECERIFERUM3 are core components of a
very-long-chain alkane synthesis complex. Plant Cell, 24(7).
https://doi.org/10.1105/tpc.112.099796
Bernard, A., & Joubès, J. (2013, January). Arabidopsis cuticular waxes: Advances in
synthesis, export and regulation. Progress in Lipid Research, Vol. 52, pp. 110–

Curriculum Vitae
102
129. https://doi.org/10.1016/j.plipres.2012.10.002
Bird, D. A. (2008). The role of ABC transporters in cuticular lipid secretion. Plant
Science, Vol. 174. https://doi.org/10.1016/j.plantsci.2008.03.016
Bird, D., Beisson, F., Brigham, A., Shin, J., Greer, S., Jetter, R., … Samuels, L.
(2007). Characterization of Arabidopsis ABCG11/WBC11, an ATP binding
cassette (ABC) transporter that is required for cuticular lipid secretion. Plant
Journal, 52(3). https://doi.org/10.1111/j.1365-313X.2007.03252.x
Bonaventure, G., Salas, J. J., Pollard, M. R., & Ohlrogge, J. B. (2003). Disruption of
the FATB gene in Arabidopsis demonstrates an essential role of saturated fatty
acids in plant growth. Plant Cell, 15(4). https://doi.org/10.1105/tpc.008946
Bourdenx, B., Bernard, A., Domergue, F., Pascal, S., Léger, A., Roby, D., … Joubès,
J. (2011). Overexpression of Arabidopsis ECERIFERUM1 promotes wax very-
long-chain alkane biosynthesis and influences plant response to biotic and abiotic
stresses. Plant Physiology, 156(1). https://doi.org/10.1104/pp.111.172320
Brewer, M. T., & Milgroom, M. G. (2010). Phylogeography and population structure
of the grape powdery mildew fungus, Erysiphe necator, from diverse Vitis
species. BMC Evolutionary Biology, 10, 268. https://doi.org/10.1186/1471-2148-
10-268
Burton, Z., & Bhushan, B. (2006). Surface Characterization and Adhesion and
Friction Properties of Hydrophobic Leaf Surfaces and Nanopatterned Polymers
for Superhydrophobic Surfaces. https://doi.org/10.1007/3-540-26910-x_3
Chen, N., Song, B., Tang, S., He, J., Zhou, Y., Feng, J., … Xu, X. (2018).
Overexpression of the ABC transporter gene TsABCG11 increases cuticle lipids
and abiotic stress tolerance in Arabidopsis. Plant Biotechnology Reports, 12(5).
https://doi.org/10.1007/s11816-018-0495-6
Chen, X., Goodwin, S. M., Boroff, V. L., Liu, X., & Jenks, M. A. (2003). Cloning and
characterization of the WAX2 gene of Arabidopsis involved in cuticle membrane
and wax production. Plant Cell, 15(5). https://doi.org/10.1105/tpc.010926
Clark, J. B., & Lister, G. R. (1975). Photosynthetic Action Spectra of Trees: II. The
Relationship of Cuticle Structure to the Visible and Ultraviolet Spectral
Properties of Needles from Four Coniferous Species. Plant Physiology, 55(2).
https://doi.org/10.1104/pp.55.2.407
Clough, S. J., & Bent, A. F. (1998). Floral dip: A simplified method for
Agrobacterium-mediated transformation of Arabidopsis thaliana. Plant Journal,
16(6). https://doi.org/10.1046/j.1365-313X.1998.00343.x
Collinge, D. B. (2009). Cell wall appositions: The first line of defence. Journal of
Experimental Botany, Vol. 60, pp. 351–352. https://doi.org/10.1093/jxb/erp001
Culberson, C. F., Martin, J. T., & Juniper, B. E. (1971). The Cuticles of Plants. The
Bryologist, 74(3). https://doi.org/10.2307/3241660
Czemmel, S., Stracke, R., Weisshaar, B., Cordon, N., Harris, N. N., Walker, A. R., …
Bogs, J. (2009). The grapevine R2R3-MYB transcription factor VvMYBF1
regulates flavonol synthesis in developing grape berries. Plant Physiology, Vol.
151, pp. 1513–1530. https://doi.org/10.1104/pp.109.142059
Davies, B. H. (1980). Advances in the Biochemistry and Physiology of Plant Lipids.
Curriculum Vitae
103
Biochemical Society Transactions, 8(2). https://doi.org/10.1042/bst0080236
DeBono, A. G. (2011). The role and behavior of Arabidopsis thaliana lipid transfer
proteins during cuticular wax deposition. UBC Thesis, (November).
Delp, C. J. (1954). Effect of temperature and humidity on the Grape powdery mildew
fungus. Phytopathology, 44(11), 615-626 pp.
Doyle, J. ., & Doyle, J. . (1987). A rapid isolation procedure for small amounts of leaf
tissue. Phytochemical Bulletin, 19.
Duan, D., Fischer, S., Merz, P., Bogs, J., Riemann, M., & Nick, P. (2016). An
ancestral allele of grapevine transcription factor MYB14 promotes plant defence.
Journal of Experimental Botany, 67(6), 1795–1804.
https://doi.org/10.1093/jxb/erv569
Duan, D., Halter, D., Baltenweck, R., Tisch, C., Tröster, V., Kortekamp, A., … Nick,
P. (2015). Genetic diversity of stilbene metabolism in Vitis sylvestris. Journal of
Experimental Botany, 66(11), 3243–3257. https://doi.org/10.1093/jxb/erv137
Dubos, C., Stracke, R., Grotewold, E., Weisshaar, B., Martin, C., & Lepiniec, L.
(2010). MYB transcription factors in Arabidopsis. Trends in Plant Science, Vol.
15. https://doi.org/10.1016/j.tplants.2010.06.005
Edstam, M. M., Blomqvist, K., Eklöf, A., Wennergren, U., & Edqvist, J. (2013).
Coexpression patterns indicate that GPI-anchored non-specific lipid transfer
proteins are involved in accumulation of cuticular wax, suberin and
sporopollenin. Plant Molecular Biology, 83(6), 625–649.
https://doi.org/10.1007/s11103-013-0113-5
Eigenbrode, S. D., & Espelie, K. E. (1995). Effects of plant epicuticular lipids on
insect herbivores. Annual Review of Entomology. Vol. 40.
https://doi.org/10.1146/annurev.ento.40.1.171
El-kenawy, M. (2017). Effect of Chitosan, Salicylic Acid and Fulvic Acid on
Vegetative Growth, Yield and Fruit Quality of Thompson Seedless Grapevines.
Egyptian Journal of Horticulture, 44(1).
https://doi.org/10.21608/ejoh.2017.1104.1007
Ellis, M. A. (2008). Powdery Mildew of Grape. 1–3.
English-Loeb, G., Norton, A. P., Gadoury, D. M., Seem, R. C., & Wilcox, W. F.
(1999). Control of powdery mildew in wild and cultivated grapes by a tydeid
mite. Biological Control, 14(2). https://doi.org/10.1006/bcon.1998.0681
English-Loeb, G., Norton, A. P., Gadoury, D., Seem, R., & Wilcox, W. (2007).
Biological control of grape powdery mildew using mycophagous mites. Plant
Disease, 91(4). https://doi.org/10.1094/PDIS-91-4-0421
Felsenstein, J. (1985). Confidence Limits on Phylogenies: An Approach Using the
Bootstrap. Evolution, 39(4). https://doi.org/10.2307/2408678
Fiebig, A., Mayfield, J. A., Miley, N. L., Chau, S., Fischer, R. L., & Preuss, D.
(2000). Alterations in CER6, a gene identical to CUT1, differentially affect long-
chain lipid content on the surface of pollen and stems. Plant Cell, 12(10).
https://doi.org/10.1105/tpc.12.10.2001
Franke, R., Höfer, R., Briesen, I., Emsermann, M., Efremova, N., Yephremov, A., &
Schreiber, L. (2009). The DAISY gene from Arabidopsis encodes a fatty acid

Curriculum Vitae
104
elongase condensing enzyme involved in the biosynthesis of aliphatic suberin in
roots and the chalaza-micropyle region of seeds. Plant Journal, 57(1).
https://doi.org/10.1111/j.1365-313X.2008.03674.x
Fulda, M., Shockey, J., Werber, M., Wolter, F. P., & Heinz, E. (2002). Two long-
chain acyl-CoA synthetases from Arabidopsis thaliana involved in peroxisomal
fatty acid β-oxidation. Plant Journal, 32(1). https://doi.org/10.1046/j.1365-
313X.2002.01405.x
Gadoury, D. M., Pearson, R. C., Riegel, D. G., Seem, R. C., Becker, C. M., &
Pscheidt, J. W. (1994). Reduction of powdery mildew and other diseases by
over-the-trellis applications of lime sulfur to dormant grapevines. Plant Disease,
78(1). https://doi.org/10.1094/PD-78-0083
Gadoury, D. M., Seem, R. C., Pearson, R. C., & Wilcox, W. F. (2001). Effects of
powdery mildew on vine growth, yield, and quality of Concord grapes. Plant
Disease, 85(2), 137–140. https://doi.org/10.1094/PDIS.2001.85.2.137
Gadoury, David M. (1990). Germination of Ascospores and Infection of Vitis by
Uncinula necator. Phytopathology, 80(11). https://doi.org/10.1094/phyto-80-
1198
Gadoury, David M. (1991). Heterothallism and Pathogenic Specialization in Uncinula
necator. Phytopathology, 81(10). https://doi.org/10.1094/phyto-81-1287
Gadoury, David M., Cadle-Davidson, L., Wilcox, W. F., Dry, I. B., See, R. C., & Mil,
M. G. (2012). Grapevine powdery mildew (Erysiphe necator a fascinating.pdf
(pp. 1–16). pp. 1–16. https://doi.org/10.1111/J.1364-3703.2011.00728.X
Gadoury, David M., Cadle-Davidson, L., Wilcox, W. F., Dry, I. B., Seem, R. C., &
Milgroom, M. G. (2012). Grapevine powdery mildew (Erysiphe necator): A
fascinating system for the study of the biology, ecology and epidemiology of an
obligate biotroph. Molecular Plant Pathology, 13(1), 1–16.
https://doi.org/10.1111/j.1364-3703.2011.00728.x
Gadoury, David M., Seem, R. C., Ficke, A., & Wilcox, W. F. (2003). Ontogenic
resistance to powdery mildew in grape berries. Phytopathology, Vol. 93, pp.
547–555. https://doi.org/10.1094/PHYTO.2003.93.5.547
Gemmrich, A. R., & Seidel, M. (1996). Immunodetection of overwintering oidium
mycelium in bud scales of Vitis vinifera. Vitis, 35(1).
Gniwotta, F., Vogg, G., Gartmann, V., Carver, T. L. W., Riederer, M., & Jetter, R.
(2005). What do microbes encounter at the plant surface? Chemical composition
of pea leaf cuticular waxes. Plant Physiology, Vol. 139.
https://doi.org/10.1104/pp.104.053579
Grabski, S., De Feijter, A. W., & Schindler, M. (1993). Endoplasmic Reticulum
Forms a Dynamic Continuum for Lipid Diffusion between Contiguous Soybean
Root Cells. The Plant Cell. https://doi.org/10.1105/tpc.5.1.25
Greer, S., Wen, M., Bird, D., Wu, X., Samuels, L., Kunst, L., & Jetter, R. (2007). The
cytochrome P450 enzyme CYP96A15 is the midchain alkane hydroxylase
responsible for formation of secondary alcohols and ketones in stem cuticular
wax of arabidopsis. Plant Physiology, 145(3).
https://doi.org/10.1104/pp.107.107300
Curriculum Vitae
105
Guan, P., Terigele, Schmidt, F., Riemann, M., Fischer, J., Thines, E., & Nick, P.
(2020). Hunting modulators of plant defence: The grapevine trunk disease
fungus Eutypa lata secretes an amplifier for plant basal immunity. Journal of
Experimental Botany, 71(12). https://doi.org/10.1093/jxb/eraa152
Halleen, F., & Holz, G. (2017). An Overview of the Biology, Epidemiology and
Control of Uncinula necator (Powdery Mildew) on Grapevine, with Ref ere nee
to South Africa. South African Journal of Enology & Viticulture, 22(2).
https://doi.org/10.21548/22-2-2205
Hansjakob, A., Riederer, M., & Hildebrandt, U. (2011). Wax matters: Absence of
very-long-chain aldehydes from the leaf cuticular wax of the glossy11 mutant of
maize compromises the prepenetration processes of Blumeria graminis. Plant
Pathology, Vol. 60, pp. 1151–1161. https://doi.org/10.1111/j.1365-
3059.2011.02467.x
Heintz, C., & Blaich, R. (1990). Ultrastructural and histochemical studies on
interactions between Vitis vinifera L. and Uncinula necator (Schw.) Burr. New
Phytologist, Vol. 115, pp. 107–117. https://doi.org/10.1111/j.1469-
8137.1990.tb00928.x
Holmes, M. G., & Keiller, D. R. (2002). Effects of pubescence and waxes on the
reflectance of leaves in the ultraviolet and photosynthetic wavebands: A
comparison of a range of species. Plant, Cell and Environment, 25(1).
https://doi.org/10.1046/j.1365-3040.2002.00779.x
Hooker, T. S., Lam, P., Zheng, H., & Kunst, L. (2007). A core subunit of the RNA-
processing/degrading exosome specifically influences cuticular wax biosynthesis
in Arabidopsis. Plant Cell, 19(3). https://doi.org/10.1105/tpc.106.049304
Jakoby, M. J., Falkenhan, D., Mader, M. T., Brininstool, G., Wischnitzki, E., Platz,
N., … Schnittger, A. (2008). Transcriptional profiling of mature Arabidopsis
trichomes reveals that NOECK encodes the MIXTA-like transcriptional
regulator MYB106. Plant Physiology, 148(3).
https://doi.org/10.1104/pp.108.126979
Jeffree, C. E. (2007). The Fine Structure of the Plant Cuticle. In Annual Plant Reviews
(Vol. 23). https://doi.org/10.1002/9780470988718.ch2
Jenks, M. A., Rashotte, A. M., Tuttle, H. A., & Feldmann, K. A. (1996). Mutants in
Arabidopsis thaliana altered in epicuticular wax and leaf morphology. Plant
Physiology, 110(2). https://doi.org/10.1104/pp.110.2.377
Jenks, M. A., Tuttle, H. A., Eigenbrode, S. D., & Feldmann, K. A. (1995). Leaf
epicuticular waxes of the Eceriferum mutants in Arabidopsis. Plant Physiology,
108(1). https://doi.org/10.1104/pp.108.1.369
Jetter, R. ., Kunst, L., & Samuels, A. L. (2008). Biology of the plant cuticle:
Composition of plant cuticular waxes. In Systematic Botany (Vol. 33).
https://doi.org/10.1600/036364408785679914
Jetter, R., Schäffer, S., & Riederer, M. (2000). Leaf cuticular waxes are arranged in
chemically and mechanically distinct layers: Evidence from Prunus laurocerasus
L. Plant, Cell and Environment, 23(6). https://doi.org/10.1046/j.1365-
3040.2000.00581.x
Curriculum Vitae
106
Jiao, Y., Xu, W., Duan, D., Wang, Y., & Nick, P. (2016). A stilbene synthase allele
from a Chinese wild grapevine confers resistance to powdery mildew by
recruiting salicylic acid signalling for efficient defence. Journal of Experimental
Botany, 67(19). https://doi.org/10.1093/jxb/erw351
Jones, L., Riaz, S., Morales-Cruz, A., Amrine, K. C. H., McGuire, B., Gubler, W.
D., … Cantu, D. (2014). Adaptive genomic structural variation in the grape
powdery mildew pathogen, Erysiphe necator. BMC Genomics, 15(1).
https://doi.org/10.1186/1471-2164-15-1081
Kannangara, R., Branigan, C., Liu, Y., Penfield, T., Rao, V., Mouille, G., … Broun,
P. (2007). The transcription factor WIN1/SHN1 regulates cutin biosynthesis in
Arabidopsis thaliana. Plant Cell, 19(4). https://doi.org/10.1105/tpc.106.047076
Karimi, M., Inzé, D., & Depicker, A. (2002). GATEWAY vectors for Agrobacterium-
mediated plant.pdf. TRENDS in Plant Science, Vol. 7, pp. 193–195. Retrieved
from file:///C:/Users/Risa/Downloads/1-s2.0-S1360138502022513-main.pdf
Khattab, I. M., Sahi, V. P., Baltenweck, R., Maia-Grondard, A., Hugueney, P., Bieler,
E., … Nick, P. (2020). Ancestral chemotypes of cultivated grapevine with
resistance to Botryosphaeriaceae-related dieback allocate metabolism towards
bioactive stilbenes. New Phytologist. https://doi.org/10.1111/nph.16919
Kim, H., Lee, S. B., Kim, H. J., Min, M. K., Hwang, I., & Suh, M. C. (2012).
Characterization of glycosylphosphatidylinositol-anchored lipid transfer protein
2 (LTPG2) and overlapping function between LTPG/LTPG1 and LTPG2 in
cuticular wax export or accumulation in arabidopsis thaliana. Plant and Cell
Physiology, 53(8). https://doi.org/10.1093/pcp/pcs083
Kim, H. U. (2020). Lipid metabolism in plants. Plants, Vol. 9.
https://doi.org/10.3390/plants9070871
Kim, J., Jung, J. H., Lee, S. B., Go, Y. S., Kim, H. J., Cahoon, R., … Suh, M. C.
(2013). Arabidopsis 3-ketoacyl-coenzyme a synthase9 is involved in the
synthesis of tetracosanoic acids as precursors of cuticular waxes, suberins,
sphingolipids, and phospholipids. Plant Physiology, 162(2).
https://doi.org/10.1104/pp.112.210450
Kircher, S., Kozma-Bognar, L., Kim, L., Adam, E., Harter, K., Schäfe, E., & Nagy, F.
(1999). Light Quality–Dependent Nuclear Import of the Plant Photoreceptors
Phytochrome A and B. The Plant Cell, 11, 1445–1456.
Kleinboelting, N., Huep, G., Kloetgen, A., Viehoever, P., & Weisshaar, B. (2012).
GABI-Kat SimpleSearch: New features of the Arabidopsis thaliana T-DNA
mutant database. Nucleic Acids Research, Vol. 40.
https://doi.org/10.1093/nar/gkr1047
Klotz, J., & Nick, P. (2012). A novel actin-microtubule cross-linking kinesin, NtKCH,
functions in cell expansion and division. New Phytologist, Vol. 193, pp. 576–
589. https://doi.org/10.1111/j.1469-8137.2011.03944.x
Koch, K., & Barthlott, W. (2006). Plant epicuticular waxes: Chemistry, form, self-
Assembly and function. Natural Product Communications, 1(11).
https://doi.org/10.1177/1934578x0600101123
Koch, K., & Ensikat, H. J. (2008). The hydrophobic coatings of plant surfaces:
Curriculum Vitae
107
Epicuticular wax crystals and their morphologies, crystallinity and molecular
self-assembly. Micron, Vol. 39. https://doi.org/10.1016/j.micron.2007.11.010
Koch, K., Neinhuis, C., Ensikat, H. J., & Barthlott, W. (2004). Self assembly of
epicuticular waxes on living plant surfaces imaged by atomic force microscopy
(AFM). Journal of Experimental Botany, 55(397).
https://doi.org/10.1093/jxb/erh077
Kumar, S., Stecher, G., & Tamura, K. (2016). MEGA7: Molecular Evolutionary
Genetics Analysis Version 7.0 for Bigger Datasets. Molecular Biology and
Evolution, 33(7). https://doi.org/10.1093/molbev/msw054
Kunst, L., & Samuels, A. L. (2003). Biosynthesis and secretion of plant cuticular wax.
Progress in Lipid Research, 42(1), 51–80. https://doi.org/10.1016/S0163-
7827(02)00045-0
Kunst, L, Taylor, D., & Underhill, E. (1992). Fatty acid elongation in developing
seeds of Arabidopsis thaliana. Plant Physiology and Biochemistry (Paris), 30(4).
Kunst, Ljerka, & Samuels, L. (2009). Plant cuticles shine: advances in wax
biosynthesis and export. Current Opinion in Plant Biology, Vol. 12.
https://doi.org/10.1016/j.pbi.2009.09.009
Lacey Samuels, A., Mcfarlane, H. E., Shin, J. J. H., & Bird, D. A. (2010). Arabidopsis
ABCG transporters, which are required for export of diverse cuticular lipids,
dimerize in different combinations. Plant Cell, 22(9).
https://doi.org/10.1105/tpc.110.077974
Lange, C. (1996). Braun, U. 1995. The Powdery Mildews (Erysiphales) of Europe.
Nordic Journal of Botany, 16(2). https://doi.org/10.1111/j.1756-
1051.1996.tb00953.x
Latchman, D. S. (1997). Transcription factors: An overview. International Journal of
Biochemistry and Cell Biology, 29(12). https://doi.org/10.1016/S1357-
2725(97)00085-X
Lee, S. B., Go, Y. S., Bae, H. J., Park, J. H., Cho, S. H., Cho, H. J., … Suh, M. C.
(2009). Disruption of glycosylphosphatidylinositol-anchored lipid transfer
protein gene altered cuticular lipid composition, increased plastoglobules, and
enhanced susceptibility to infection by the fungal pathogen alternaria
brassicicola. Plant Physiology, 150(1). https://doi.org/10.1104/pp.109.137745
Lee, S. B., & Suh, M. C. (2015). Advances in the understanding of cuticular waxes in
Arabidopsis thaliana and crop species. Plant Cell Reports, 34(4), 557–572.
https://doi.org/10.1007/s00299-015-1772-2
Leinhos, G. m. E., Randall E. Gold, Düggelin, M., & Guggenheim, R. (1997).
Development and morphology of Uncinula necator following treatment with the
fungicides kresoxim-methyl and penconazole. Mycological Research, 101(9),
1033–1046.
Lescot, M., Déhais, P., Thijs, G., Marchal, K., Moreau, Y., Van De Peer, Y., …
Rombauts, S. (2002). PlantCARE, a database of plant cis-acting regulatory
elements and a portal to tools for in silico analysis of promoter sequences.
Nucleic Acids Research, 30(1). https://doi.org/10.1093/nar/30.1.325
Leveau, J. H. J. (2018). Microbial Communities in the Phyllosphere. In Annual Plant

Curriculum Vitae
108
Reviews online. https://doi.org/10.1002/9781119312994.apr0239
Lewandowska, M., Keyl, A., & Feussner, I. (2020). Tansley review Wax biosynthesis
in response to danger: its regulation upon abiotic and biotic stress. New
Phytologist, 227(698–713). https://doi.org/10.1111/nph.16571
Li-Beisson, Y., Shorrosh, B., Beisson, F., Andersson, M. X., Arondel, V., Bates, P.
D., … Ohlrogge, J. (2013). Acyl-Lipid Metabolism. The Arabidopsis Book, 11.
https://doi.org/10.1199/tab.0161
Li, F., Wu, X., Lam, P., Bird, D., Zheng, H., Samuels, L., … Kunst, L. (2008).
Identification of the wax ester synthase/acyl-coenzyme a:diacylglycerol
acyltransferase WSD1 required for stem wax ester biosynthesis in Arabidopsis.
Plant Physiology, 148(1). https://doi.org/10.1104/pp.108.123471
Li, L., Yu, X., Thompson, A., Guo, M., Yoshida, S., Asami, T., … Yin, Y. (2009).
Arabidopsis MYB30 is a direct target of BES1 and cooperates with BES1 to
regulate brassinosteroid-induced gene expression. Plant Journal, 58(2).
https://doi.org/10.1111/j.1365-313X.2008.03778.x
Li, N., Xu, C., Li-Beisson, Y., & Philippar, K. (2016). Fatty Acid and Lipid Transport
in Plant Cells. Trends in Plant Science, Vol. 21.
https://doi.org/10.1016/j.tplants.2015.10.011
Liang, Z., Duan, S., Sheng, J., Zhu, S., Ni, X., Shao, J., … Dong, Y. (2019). Whole-
genome resequencing of 472 Vitis accessions for grapevine diversity and
demographic history analyses. Nature Communications, Vol. 10.
https://doi.org/10.1038/s41467-019-09135-8
Liu, L., Zhang, J., Adrian, J., Gissot, L., Coupland, G., Yu, D., & Turck, F. (2014).
Elevated levels of MYB30 in the phloem accelerate flowering in Arabidopsis
through the regulation of FLOWERING LOCUS T. PLoS ONE, 9(2).
https://doi.org/10.1371/journal.pone.0089799
Livak, K. J., & Schmittgen, T. D. (2001). Analysis of relative gene expression data
using real-time quantitative PCR and the 2-ΔΔCT method. Methods, 25(4).
https://doi.org/10.1006/meth.2001.1262
Logemann, E., Birkenbihl, R. P., Ülker, B., & Somssich, I. E. (2006). An improved
method for preparing Agrobacterium cells that simplifies the Arabidopsis
transformation protocol. Plant Methods, 2(1). https://doi.org/10.1186/1746-4811-
2-16
Mabuchi, K., Maki, H., Itaya, T., Suzuki, T., Nomoto, M., Sakaoka, S., …
Tsukagoshi, H. (2018). MYB30 links ROS signaling, root cell elongation, and
plant immune responses. Proceedings of the National Academy of Sciences of the
United States of America, 115(20). https://doi.org/10.1073/pnas.1804233115
Maisch, J., Fierová, J., Fischer, L., & Nick, P. (2009). Tobacco Arp3 is localized to
actin-nucleating sites in vivo. Journal of Experimental Botany, 60(2).
https://doi.org/10.1093/jxb/ern307
Marcell, L. M., & Beattie, G. A. (2002). Effect of leaf surface waxes on leaf
colonization by Pantoea agglomerans and Clavibacter michiganensis. Molecular
Plant-Microbe Interactions, 15(12).
https://doi.org/10.1094/MPMI.2002.15.12.1236
Curriculum Vitae
109
Mazliak, P. (1973). Lipid Metabolism in Plants. Annual Review of Plant Physiology,
24(1). https://doi.org/10.1146/annurev.pp.24.060173.001443
McDonald, K. (2007). Cryopreparation Methods for Electron Microscopy of Selected
Model Systems. Methods in Cell Biology, 79, 23–56.
https://doi.org/10.1016/S0091-679X(06)79002-1
McDonald, K. L. (2009). A review of high-pressure freezing preparation techniques
for correlative light and electron microscopy of the same cells and tissues.
Journal of Microscopy, 235(3), 273–281. https://doi.org/10.1111/j.1365-
2818.2009.03218.x
McFarlane, H. E., Watanabe, Y., Yang, W., Huang, Y., Ohlrogge, J., & Samuels, A.
L. (2014). Golgi- and trans-golgi network-mediated vesicle trafficking is
required for wax secretion from epidermal cells. Plant Physiology, 164(3).
https://doi.org/10.1104/pp.113.234583
McNevin, J. P., Woodward, W., Hannoufa, A., Feldmann, K. A., & Lemieux, B.
(1993). Isolation and characterization of eceriferum (cer) mutants induced by T-
DNA insertions in Arabidopsis thaliana. Genome, 36(3).
https://doi.org/10.1139/g93-082
Metz, J. G., Pollard, M. R., Anderson, L., Hayes, T. R., & Lassner, M. W. (2000).
Purification of a jojoba embryo fatty acyl-coenzyme A reductase and expression
of its cDNA in high erucic acid rapeseed. Plant Physiology, 122(3).
https://doi.org/10.1104/pp.122.3.635
Millar, A. A., Clemens, S., Zachgo, S., Michael Giblin, E., Taylor, D. C., & Kunst, L.
(1999). CUT1, an Arabidopsis gene required for cuticular wax biosynthesis and
pollen fertility, encodes a very-long-chain fatty acid condensing enzyme. Plant
Cell, 11(5). https://doi.org/10.1105/tpc.11.5.825
Millar, A. A., Wrischer, M., & Kunst, L. (1998). Accumulation of very-long-chain
fatty acids in membrane glycerolipids is associated with dramatic alterations in
plant morphology. Plant Cell, 10(11). https://doi.org/10.1105/tpc.10.11.1889
Moharramipour, S., Tsumuki, H., Sato, K., Murata, S., & Kanehisa, K. (1997). Effects
of leaf color, epicuticular wax amount and gramine content in barley hybrids on
cereal aphid populations. Applied Entomology and Zoology, 32(1).
https://doi.org/10.1303/aez.32.1
Nakagawa, T., Ishiguro, S., & Kimura, T. (2009). Gateway vectors for plant
transformation. Plant Biotechnology, Vol. 26, pp. 275–284.
https://doi.org/10.5511/plantbiotechnology.26.275
Ni, X., Quisenberry, S. S., Siegfried, B. D., & Lee, K. W. (1998). Influence of cereal
leaf epicuticular wax on Diuraphis noxia probing behavior and nymphoposition.
Entomologia Experimentalis et Applicata, 89(2). https://doi.org/10.1046/j.1570-
7458.1998.00389.x
Norton, A. P., English-Loeb, G., Gadoury, D., & Seem, R. C. (2000). Mycophagous
mites and foliar pathogens: Leaf domatia mediate tritrophic interactions in
grapes. Ecology, 81(2), 490–499. https://doi.org/10.1890/0012-
9658(2000)081[0490:MMAFPL]2.0.CO;2
Oshima, Y., Shikata, M., Koyama, T., Ohtsubo, N., Mitsuda, N., & Nobutaka
Curriculum Vitae
110
Mitsuda, M. O.-T. (2013). MIXTA-Like Transcription Factors and WAX
INDUCER1/SHINE1 Coordinately Regulate Cuticle Development in
Arabidopsis and Torenia fournieri. The Plant Cell, 25, 1609–1624. Retrieved
from Online version contains Web-only
datwww.plantcell.org/cgi/doi/10.1105/tpc.113.110783
Panikashvili, D., Savaldi-Goldstein, S., Mandel, T., Yifhar, T., Franke, R. B., Höfer,
R., … Aharoni, A. (2007). The arabidopsis DESPERADO/AtWBC11 transporter
is required for cutin and wax secretion. Plant Physiology, 145(4).
https://doi.org/10.1104/pp.107.105676
Patwari, P., Salewski, V., Gutbrod, K., Kreszies, T., Dresen-Scholz, B., Peisker,
H., … Dörmann, P. (2019). Surface wax esters contribute to drought tolerance in
Arabidopsis. Plant Journal, 98(4). https://doi.org/10.1111/tpj.14269
Pighin, J. A., Zheng, H., Balakshin, L. J., Goodman, J. P., Western, T. L., Jetter,
R., … Samuels, A. L. (2004). Plant cuticular lipid export requires an ABC
transporter. Science, 306(5696). https://doi.org/10.1126/science.1102331
Portu, J., López, R., Baroja, E., Santamaría, P., & Garde-Cerdán, T. (2016).
Improvement of grape and wine phenolic content by foliar application to
grapevine of three different elicitors: Methyl jasmonate, chitosan, and yeast
extract. Food Chemistry, 201. https://doi.org/10.1016/j.foodchem.2016.01.086
Post-Beittenmiller, D. (1996). Biochemistry and molecular biology of wax production
in plants. Annual Review of Plant Physiology and Plant Molecular Biology,
47(1), 405–430. https://doi.org/10.1146/annurev.arplant.47.1.405
Premachandra, gnanasiri s., Saneoka, H., Fujita, K., & Ogata, S. (1992). Leaf Water
Relations, Osmotic Adjustment, Cell Membrane Stability, Epicuticular Wax
Load and Growth as Affected by Increasing Water Deficits in Sorghum. Journal
of Experimental Botany, 43(12). https://doi.org/10.1093/jxb/43.12.1569
Qiu, W., Feechan, A., & Dry, I. (2015). Current understanding of grapevine defense
mechanisms against the biotrophic fungus (Erysiphe necator), the causal agent of
powdery mildew disease. Horticulture Research, Vol. 2.
https://doi.org/10.1038/hortres.2015.20
Racovita, R. C., Peng, C., Awakawa, T., Abe, I., & Jetter, R. (2015). Very-long-chain
3-hydroxy fatty acids, 3-hydroxy fatty acid methyl esters and 2-alkanols from
cuticular waxes of Aloe arborescens leaves. Phytochemistry, 113.
https://doi.org/10.1016/j.phytochem.2014.08.005
Rashotte, A. M., & Feldmann, K. A. (1998). Correlations between epicuticular wax
structures and chemical composition in Arabidopsis thaliana. International
Journal of Plant Sciences, 159(5). https://doi.org/10.1086/297596
Razeq, F. M., Kosma, D. K., Rowland, O., & Molina, I. (2014). Extracellular lipids of
Camelina sativa: Characterization of chloroform-extractable waxes from aerial
and subterranean surfaces. Phytochemistry, 106.
https://doi.org/10.1016/j.phytochem.2014.06.018
Reisberg, E. E., Hildebrandt, U., Riederer, M., & Hentschel, U. (2013). Distinct
Phyllosphere Bacterial Communities on Arabidopsis Wax Mutant Leaves. PLoS
ONE, 8(11), e78613. https://doi.org/10.1371/journal.pone.0078613
Curriculum Vitae
111
Rhee, Y., Hlousek-Radojcic, A., Ponsamuel, J., Liu, D., & Post-Beittenmiller, D.
(1998). Epicuticular Wax Accumulation and Fatty Acid Elongation Activities
Are Induced during Leaf Development of Leeks. Plant Physiology, 116(3).
https://doi.org/10.1104/pp.116.3.901
Riechmann, J. L., Heard, J., Martin, G., Reuber, L., Jiang, C. Z., Keddie, J., … Yu, G.
L. (2000). Arabidopsis transcription factors: Genome-wide comparative analysis
among eukaryotes. Science, 290(5499).
https://doi.org/10.1126/science.290.5499.2105
Rosso, M. G., Li, Y., Strizhov, N., Reiss, B., Dekker, K., & Weisshaar, B. (2003). An
Arabidopsis thaliana T-DNA mutagenized population (GABI-Kat) for flanking
sequence tag-based reverse genetics. Plant Molecular Biology, Vol. 53, pp. 247–
259. https://doi.org/10.1023/B:PLAN.0000009297.37235.4a
Rumbolz, J., Kassemeyer, H.-H., V Steinmetz, H. B. D., Mendgen, K., D Mathys, S.
W., & Guggenheim, R. (2000). Differentiation of infection structures of the
powdery mildew fungus Uncinula necator and adhesion to the host cuticle (pp.
409–421). pp. 409–421. Retrieved from https://doi.org/10.1139/b00-016
Rumbolz, J., Kassemeyer, H. H., Steinmetz, V., Deising, H. B., Mendgen, K., Mathys,
D., … Guggenheim, R. (2000). Differentiation of infection structures of the
powdery mildew fungus Uncinula necator and adhesion to the host cuticle.
Canadian Journal of Botany, Vol. 78, pp. 409–421. https://doi.org/10.1139/cjb-
78-7-984
Russell, P. E. (2005). A century of fungicide evolution. Journal of Agricultural
Science, Vol. 143. https://doi.org/10.1017/S0021859605004971
Saitou, N., & Nei, M. (1987). The neighbor-joining method: a new method for
reconstructing phylogenetic trees. Molecular Biology and Evolution, 4(4).
https://doi.org/10.1093/oxfordjournals.molbev.a040454
Salas, J. J., & Ohlrogge, J. B. (2002). Characterization of substrate specificity of plant
FatA and FatB acyl-ACP thioesterases. Archives of Biochemistry and Biophysics,
403(1). https://doi.org/10.1016/S0003-9861(02)00017-6
Sall, M. A. (1982). Perennation of Powdery Mildew in Buds of Grapevines. Plant
Disease, 66(1). https://doi.org/10.1094/pd-66-678
Samuels, L., Kunst, L., & Jetter, R. (2008). Sealing plant surfaces: Cuticular wax
formation by epidermal cells. Annual Review of Plant Biology, Vol. 59.
https://doi.org/10.1146/annurev.arplant.59.103006.093219
Schneider-Belhaddad, F., & Kolattukudy, P. (2000). Solubilization, partial
purification, and characterization of a fatty aldehyde decarbonylase from a
higher plant, Pisum sativum. Archives of Biochemistry and Biophysics, 377(2).
https://doi.org/10.1006/abbi.2000.1798
Schonherr, J., & Riederer, M. (1989). Foliar penetration and accumulation of organic
chemicals in plant cuticles. Reviews of Environmental Contamination and
Toxicology, 108. https://doi.org/10.1007/978-1-4613-8850-0_1
Sharma, P., Kothari, S. L., Rathore, M. S., & Gour, V. S. (2018). Properties,
variations, roles, and potential applications of epicuticular wax: A review.
Turkish Journal of Botany, Vol. 42. https://doi.org/10.3906/bot-1702-25
Curriculum Vitae
112
Shetty, D. S., Narkar, S. P., Sawant, I. S., & Sawant, S. D. (2014). Efficacy of
quinone outside inhibitors (QoI) and demethylation inhibitors (DMI) fungicides
against grape anthracnose. Indian Phytopathology, 67(2).
Shockey, J. M., Fulda, M. S., & Browse, J. A. (2002). Arabidopsis contains nine long-
chain acyl-coenzyme A synthetase genes that participate in fatty acid and
glycerolipid metabolism. Plant Physiology, 129(4).
https://doi.org/10.1104/pp.003269
Staehelin, L. A., & Chapman, R. L. (1987). Secretion and membrane recycling in
plant cells: novel intermediary structures visualized in ultrarapidly frozen
sycamore and carrot suspension-culture cells. Planta, 171(1).
https://doi.org/10.1007/BF00395066
Stolpe, T., Süßlin, C., Marrocco, K., Nick, P., Kretsch, T., & Kircher, S. (2005). In
planta analysis of protein-protein interactions related to light signaling by
bimolecular fluorescence complementation. Protoplasma, 226(3–4), 137–146.
https://doi.org/10.1007/s00709-005-0122-6
Suh, M. C., Samuels, A. L., Jetter, R., Kunst, L., Pollard, M., Ohlrogge, J., & Beisson,
F. (2005). Cuticular lipid composition, surface structure, and gene expression in
Arabidopsis stem epidermis. Plant Physiology, 139(4).
https://doi.org/10.1104/pp.105.070805
Svyatyna, K., Jikumaru, Y., Brendel, R., Reichelt, M., Mithöfer, A., Takano, M., …
Riemann, M. (2014). Light induces jasmonate-isoleucine conjugation via
OsJAR1-dependent and -independent pathways in rice. Plant, Cell and
Environment, 37(4). https://doi.org/10.1111/pce.12201
Tisch, C. (2017). Biologie der schwarzfäule an reben und potentielle
abwehrmechanismen bei der europäischen wildrebe und verschieden resistenten
sorten.
Todd, J., Post-Beittenmiller, D., & Jaworski, J. G. (1999). KCS1 encodes a fatty acid
elongase 3-ketoacyl-CoA synthase affecting wax biosynthesis in Arabidopsis
thaliana. Plant Journal, 17(2). https://doi.org/10.1046/j.1365-
313X.1999.00352.x
Tsuba, M., Katagiri, C., Takeuchi, Y., Takada, Y., & Yamaoka, N. (2002). Chemical
factors of the leaf surface involved in the morphogenesis of Blumeria graminis.
Physiological and Molecular Plant Pathology, 60(2).
https://doi.org/10.1006/pmpp.2002.0376
Vailleau, F., Daniel, X., Tronchet, M., Montillet, J. L., Triantaphylidès, C., & Roby,
D. (2002). A R2R3-MYB gene, AtMYB30, acts as a positive regulator of the
hypersensitive cell death program in plants in response to pathogen attack.
Proceedings of the National Academy of Sciences of the United States of
America, 99(15). https://doi.org/10.1073/pnas.152047199
Vailleau, S. R. F., Le´ger, A., S, J. J., Miersch, O., Huard, C., Ble´e, E., … Dominique
Roby. (2008). A MYB Transcription Factor Regulates Very-Long-Chain Fatty
Acid Biosynthesis for Activation of the Hypersensitive Cell Death Response in
Arabidopsis. The Plant Cell, 20, 752–767. Retrieved from
www.plantcell.org/cgi/doi/10.1105/tpc.107.054858
Curriculum Vitae
113
Von Wettstein-Knowles, P. M. (2018). Waxes, cutin, and suberin. In Lipid
Metabolism in Plants. https://doi.org/10.1201/9781351074070
Wang, S., Duan, L., Eneji, A. E., & Li, Z. (2007). Variations in growth,
photosynthesis and defense system among four weed species under increased
UV-B radiation. Journal of Integrative Plant Biology, 49(5).
https://doi.org/10.1111/j.1744-7909.2007.00466.x
Wang, W., Zhang, Y., Xu, C., Ren, J., Liu, X., Black, K., … Ren, H. (2014).
Cucumber ECERIFERUM1 (CsCER1), which influences the cuticle properties
and drought tolerance of cucumber, plays a key role in VLC alkanes
biosynthesis. Plant Molecular Biology, Vol. 87, pp. 219–233.
https://doi.org/10.1007/s11103-014-0271-0
Wang, X., Kong, L., Zhi, P., & Chang, C. (2020). Update on cuticular wax
biosynthesis and its roles in plant disease resistance. International Journal of
Molecular Sciences, Vol. 21, pp. 1–15. https://doi.org/10.3390/ijms21155514
Welter, L. J., Tisch, C., Kortekamp, A., Töpfer, R., & Zyprian, E. (2017). Powdery
mildew responsive genes of resistant grapevine cultivar “Regent” (pp. 181–188).
pp. 181–188. https://doi.org/10.5073/vitis.2017.56.181-188
Weng, H., Molina, I., Shockey, J., & Browse, J. (2010). Organ fusion and defective
cuticle function in a lacs1 lacs2 double mutant of Arabidopsis. Planta, 231(5).
https://doi.org/10.1007/s00425-010-1110-4
Wenping Qiu, A. F. and I. D. (2015). Current understanding of grapevine defense
mechanisms against the biotrophic.pdf (pp. 2052–7276). pp. 2052–7276.
https://doi.org/10.1038/hortres.2015.20
Wille, G., Hellal, J., Ollivier, P., Richard, A., Burel, A., Jolly, L., … Michel, C.
(2017). Cryo-Scanning Electron Microscopy (SEM) and Scanning Transmission
Electron Microscopy (STEM)-in-SEM for Bio- and Organo-Mineral Interface
Characterization in the Environment. Microscopy and Microanalysis, 23(6),
1159–1172. https://doi.org/10.1017/S143192761701265X
Williams, M. H., Rosenqvist, E., & Buchhave, M. (2000). The effect of reducing
production water availability on the post-production quality of potted miniature
roses (Rosa x hybrida). Postharvest Biology and Technology, 18(2).
https://doi.org/10.1016/S0925-5214(99)00076-9
Wollenweber, E., Kraut, L., & Mues, R. (1998). External accumulation of
biflavonoids on gymnosperm leaves. Zeitschrift Fur Naturforschung - Section C
Journal of Biosciences, 53(11–12). https://doi.org/10.1515/znc-1998-11-1202
Wollenweber, Eckhard. (1978). The Distribution and Chemical Constituents of the
Farinose Exudates in Gymnogrammoid Ferns. American Fern Journal, 68(1).
https://doi.org/10.2307/1546411
Wollenweber, Eckhard, & H. Dietz, V. (1981). Occurrence and distribution of free
flavonoid aglycones in plants. Phytochemistry, Vol. 20.
https://doi.org/10.1016/0031-9422(81)83001-4
Yeats, T. H., & Rose, J. K. C. (2013). The formation and function of plant cuticles.
Plant Physiology, Vol. 163, pp. 5–20. https://doi.org/10.1104/pp.113.222737
Zeisler-Diehl, V. V., Barthlott, W., & Schreiber, L. (2018). Plant Cuticular Waxes:
Curriculum Vitae
114
Composition, Function, and Interactions with Microorganisms. In Hydrocarbons,
Oils and Lipids: Diversity, Origin, Chemistry and Fate.
https://doi.org/10.1007/978-3-319-54529-5_7-1
Zhang, X., Henriques, R., Lin, S. S., Niu, Q. W., & Chua, N. H. (2006).
Agrobacterium-mediated transformation of Arabidopsis thaliana using the floral
dip method. Nature Protocols, 1(2), 641–646.
https://doi.org/10.1038/nprot.2006.97
Zhang, Y.-L., Zhang, C.-L., Wang, G.-L., Wang, Y.-X., Qi, C.-H., Zhao, Q., … Hao,
Y.-J. (2019). The R2R3 MYB transcription factor MdMYB30 modulates plant
resistance against pathogens by regulating cuticular wax biosynthesis. BMC
Plant Biology, 19(362). https://doi.org/10.1186/s12870-019-1918-4
Zhao, Z., Yang, X., Lü, S., Fan, J., Opiyo, S., Yang, P., … Xia, Y. (2020).
Deciphering the Novel Role of AtMIN7 in Cuticle Formation and Defense
against the Bacterial Pathogen Infection. International Journal of Molecular
Sciences, 21(5547). https://doi.org/10.3390/ijms21155547
Zheng, H., Rowland, O., & Kunst, L. (2005). Disruptions of the Arabidopsis enoyl-
CoA reductase gene reveal an essential role for very-long-chain fatty acid
synthesis in cell expansion during plant morphogenesis. Plant Cell, 17(5).
https://doi.org/10.1105/tpc.104.030155
Zheng, Y., Schumaker, K. S., & Guo, Y. (2012). Sumoylation of transcription factor
MYB30 by the small ubiquitin-like modifier E3 ligase SIZ1 mediates abscisic
acid response in Arabidopsis thaliana. Proceedings of the National Academy of
Sciences of the United States of America, 109(31).
https://doi.org/10.1073/pnas.1202630109
Zoecklein, B. W., Wolf, T. K., Duncan, N. W., Judge, J. M., & Cook, M. K. (1992).
Effects of Fruit Zone Leaf Removal on Yield, Fruit Composition, and Fruit Rot
Incidence of Chardonnay and White Riesling (Vitis vinifera L.) Grapes.
American Journal of Enology and Viticulture, 43(2).