Embed Size (px)
Citation preview

Surfing with the Tides: The Macroeconomic Case for Active Asset Allocation
Ryan Kimmel Macro Asset Allocation, DoubleLine Capital
March 2019
2
Surfing with the Tides: The Macroeconomic Case for Active Asset Allocation
Macro Case for Active Asset Allocation 3/1/19
From the flawless right-hand point breaks of Santa Barbara and Malibu to the thumping beach breaks of Oxnard and Newport Beach, Southern California hosts an abundance of surf spots. On the best days, these surf breaks are world class. Unfortunately for the surfers among us, the requisite conditions don’t always line up, leaving us to make do with less-than-ideal surf. Such is life.
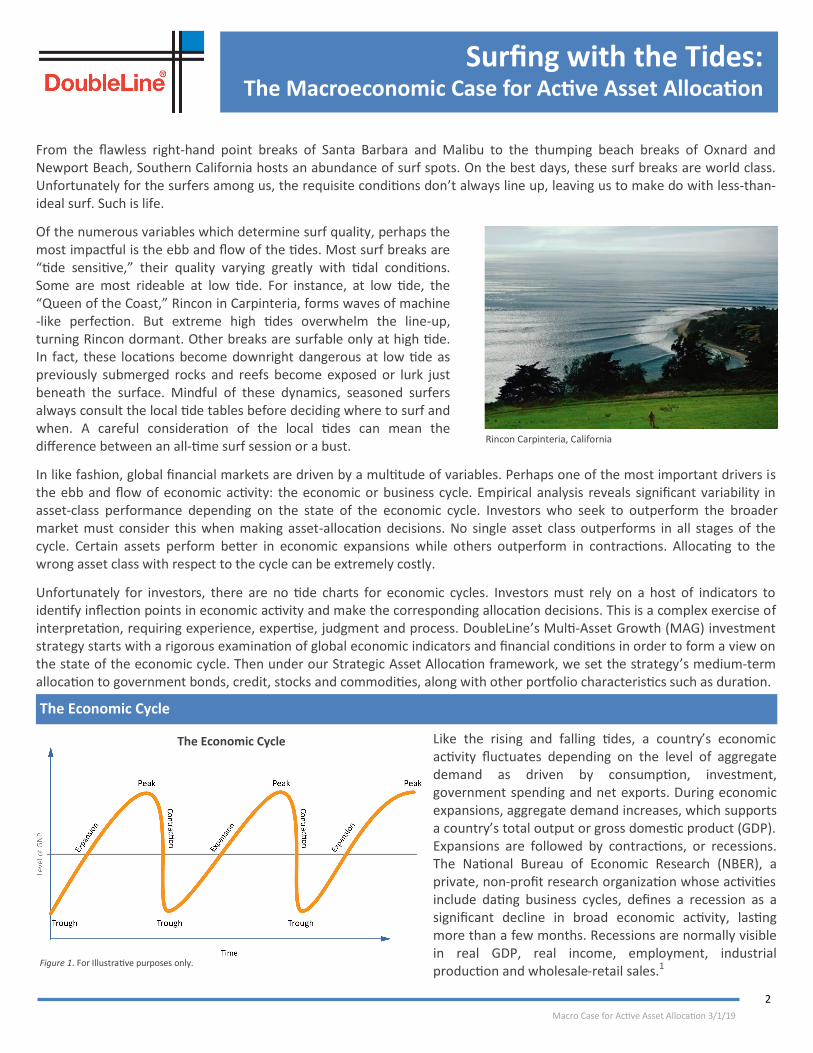
Of the numerous variables which determine surf quality, perhaps the most impactful is the ebb and flow of the tides. Most surf breaks are “tide sensitive,” their quality varying greatly with tidal conditions. Some are most rideable at low tide. For instance, at low tide, the “Queen of the Coast,” Rincon in Carpinteria, forms waves of machine-like perfection. But extreme high tides overwhelm the line-up, turning Rincon dormant. Other breaks are surfable only at high tide. In fact, these locations become downright dangerous at low tide as previously submerged rocks and reefs become exposed or lurk just beneath the surface. Mindful of these dynamics, seasoned surfers always consult the local tide tables before deciding where to surf and when. A careful consideration of the local tides can mean the difference between an all-time surf session or a bust.
In like fashion, global financial markets are driven by a multitude of variables. Perhaps one of the most important drivers is the ebb and flow of economic activity: the economic or business cycle. Empirical analysis reveals significant variability in asset-class performance depending on the state of the economic cycle. Investors who seek to outperform the broader market must consider this when making asset-allocation decisions. No single asset class outperforms in all stages of the cycle. Certain assets perform better in economic expansions while others outperform in contractions. Allocating to the wrong asset class with respect to the cycle can be extremely costly.
Unfortunately for investors, there are no tide charts for economic cycles. Investors must rely on a host of indicators to identify inflection points in economic activity and make the corresponding allocation decisions. This is a complex exercise of interpretation, requiring experience, expertise, judgment and process. DoubleLine’s Multi-Asset Growth (MAG) investment strategy starts with a rigorous examination of global economic indicators and financial conditions in order to form a view on the state of the economic cycle. Then under our Strategic Asset Allocation framework, we set the strategy’s medium-term allocation to government bonds, credit, stocks and commodities, along with other portfolio characteristics such as duration.
The Economic Cycle
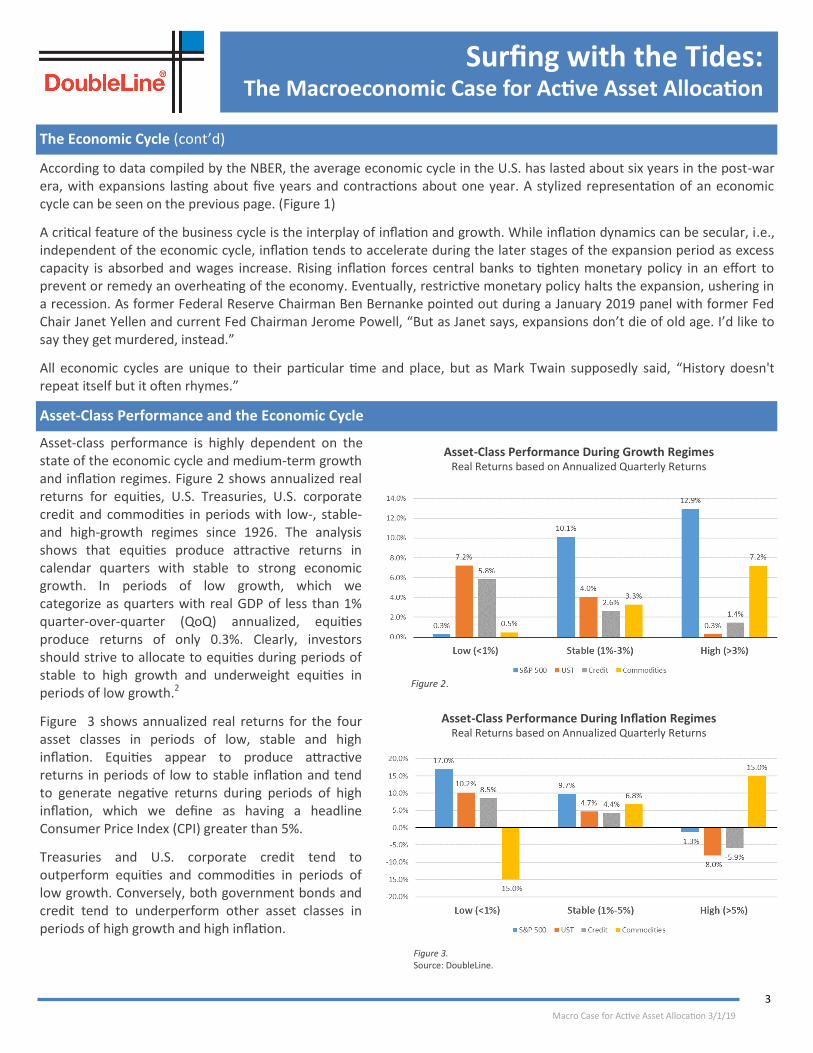
Like the rising and falling tides, a country’s economic activity fluctuates depending on the level of aggregate demand as driven by consumption, investment, government spending and net exports. During economic expansions, aggregate demand increases, which supports a country’s total output or gross domestic product (GDP). Expansions are followed by contractions, or recessions. The National Bureau of Economic Research (NBER), a private, non-profit research organization whose activities include dating business cycles, defines a recession as a significant decline in broad economic activity, lasting more than a few months. Recessions are normally visible in real GDP, real income, employment, industrial production and wholesale-retail sales.1
Rincon Carpinteria, California
The Economic Cycle
Figure 1. For Illustrative purposes only.
The Economic Cycle
3
Surfing with the Tides: The Macroeconomic Case for Active Asset Allocation
Macro Case for Active Asset Allocation 3/1/19
According to data compiled by the NBER, the average economic cycle in the U.S. has lasted about six years in the post-war era, with expansions lasting about five years and contractions about one year. A stylized representation of an economic cycle can be seen on the previous page. (Figure 1)
A critical feature of the business cycle is the interplay of inflation and growth. While inflation dynamics can be secular, i.e., independent of the economic cycle, inflation tends to accelerate during the later stages of the expansion period as excess capacity is absorbed and wages increase. Rising inflation forces central banks to tighten monetary policy in an effort to prevent or remedy an overheating of the economy. Eventually, restrictive monetary policy halts the expansion, ushering in a recession. As former Federal Reserve Chairman Ben Bernanke pointed out during a January 2019 panel with former Fed Chair Janet Yellen and current Fed Chairman Jerome Powell, “But as Janet says, expansions don’t die of old age. I’d like to say they get murdered, instead.”
All economic cycles are unique to their particular time and place, but as Mark Twain supposedly said, “History doesn't repeat itself but it often rhymes.”
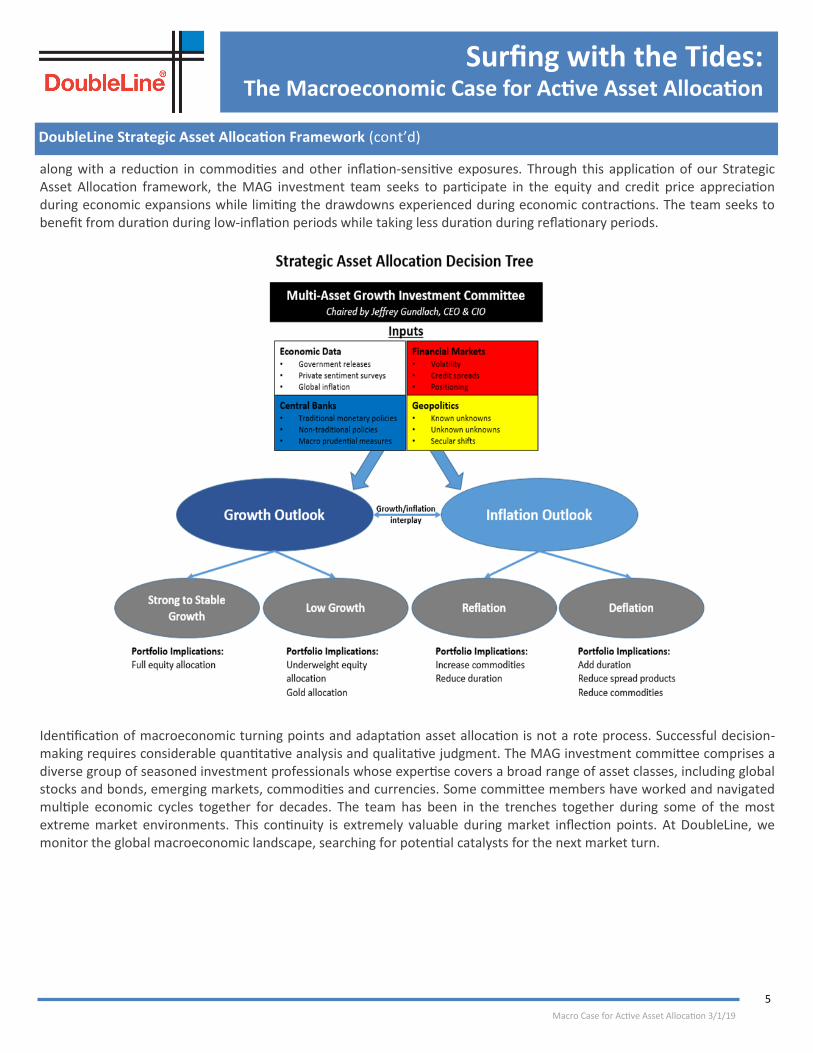
Asset-class performance is highly dependent on the state of the economic cycle and medium-term growth and inflation regimes. Figure 2 shows annualized real returns for equities, U.S. Treasuries, U.S. corporate credit and commodities in periods with low-, stable- and high-growth regimes since 1926. The analysis shows that equities produce attractive returns in calendar quarters with stable to strong economic growth. In periods of low growth, which we categorize as quarters with real GDP of less than 1% quarter-over-quarter (QoQ) annualized, equities produce returns of only 0.3%. Clearly, investors should strive to allocate to equities during periods of stable to high growth and underweight equities in periods of low growth.2
Figure 3 shows annualized real returns for the four asset classes in periods of low, stable and high inflation. Equities appear to produce attractive returns in periods of low to stable inflation and tend to generate negative returns during periods of high inflation, which we define as having a headline Consumer Price Index (CPI) greater than 5%.
Treasuries and U.S. corporate credit tend to outperform equities and commodities in periods of low growth. Conversely, both government bonds and credit tend to underperform other asset classes in periods of high growth and high inflation.
The Economic Cycle (cont’d)
Asset-Class Performance and the Economic Cycle
Figure 3. Source: DoubleLine.
Asset-Class Performance During Growth Regimes Real Returns based on Annualized Quarterly Returns
Asset-Class Performance During Inflation Regimes Real Returns based on Annualized Quarterly Returns
Figure 2.

4
Surfing with the Tides: The Macroeconomic Case for Active Asset Allocation
Macro Case for Active Asset Allocation 3/1/19
The diversification provided by Treasuries relative to equities in periods of low growth is beneficial for portfolios as Treasuries tend to rise in value and dampen volatility during recessionary periods. However, stocks and bonds do not always exhibit negative correlation to each other. In periods of high inflation, as witnessed in the U.S. during the late 1960s through early 1980s, the stock-bond correlation can be positive. Positive stock-bond correlation reduces the diversification benefit from government bonds. As seen in Figure 4, the stock-bond correlation was consistently positive during the late 1960s through early 1980s, a period which coincided with higher core inflation.
Empirical evidence shows that commodities produce attractive real returns in periods of high inflation and thus can be an effective diversifier to both stocks and bonds during such environments.
To summarize the analysis above, no single asset class outperforms in all economic regimes. History shows that different asset classes tend to outperform and underperform given the context of the economic cycle and rate of inflation. This dynamism creates opportunities for actively managed asset allocation to outperform the relatively static asset weightings of traditional asset-allocation strategies.
DoubleLine Strategic Asset Allocation Framework
Traditional asset-allocation strategies are generally agnostic to the economic cycle, maintaining a fixed allocation to different asset classes regardless of the growth and inflation regime. One of the more common asset-allocation strategies is the 60/40 portfolio, which allocates 60% to equities and 40% to fixed income. While this strategy has generated annualized real returns of 5.7% since 1926 with annualized volatility around 14.1%, it suffers from large drawdowns, particularly during recessionary and stagflationary periods.3
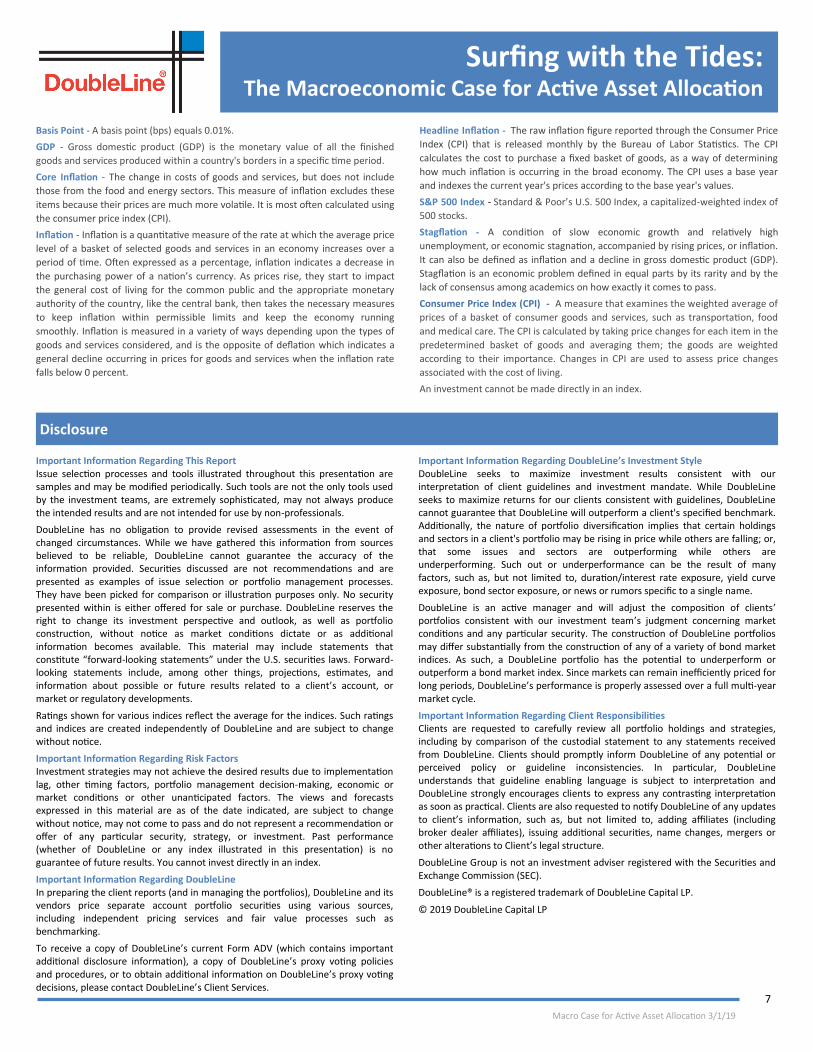
Predicting recessions is easier said than done. There is no crystal ball to signal with absolute certainty the imminent arrival of the next recession. That said, tools do exist to help diagnose the macroeconomic environment. At DoubleLine, the Multi-Asset Growth (MAG) investment committee holds two meetings which drive asset-allocation decisions: the weekly MAG meeting and the monthly Global Asset Allocation (GAA) meeting. Chaired by DoubleLine Chief Executive Officer and Chief Investment Officer Jeffrey Gundlach, the committee reviews a wide data set covering global growth and inflation, global financial markets, central bank policies and geopolitics. Each chart book is tailored to the developments taking place during that particular week. As part of the Strategic Asset Allocation framework, the investment committee synthesizes the key macroeconomic and financial market inputs and develops a diagnosis for the state of the economic cycle.
Careful scrutiny of the macroeconomic landscape helps the committee identify inflection points in growth and inflation. If the investment committee expects growth to remain stable, the MAG strategy will likely be geared toward a full equity allocation. However, if the committee expects a slowdown in growth or possibly elevated risk of a recession, the equity allocation will likely be reduced, and the strategy’s bond allocation will be increased. If a reflationary environment or period of rising inflation is expected, the committee may reduce the interest-rate exposure in the portfolio and consider inflation hedges, such as commodities. If an onset of deflation is identified, a higher portfolio duration would be considered
Asset-Class Performance and the Economic Cycle (cont’d)
DoubleLine Strategic Asset Allocation Framework
Stock-Bond Correlation and Core Inflation
Figure 4. Source: DoubleLine, Bloomberg, Ibbotson
5
Surfing with the Tides: The Macroeconomic Case for Active Asset Allocation
Macro Case for Active Asset Allocation 3/1/19
along with a reduction in commodities and other inflation-sensitive exposures. Through this application of our Strategic Asset Allocation framework, the MAG investment team seeks to participate in the equity and credit price appreciation during economic expansions while limiting the drawdowns experienced during economic contractions. The team seeks to benefit from duration during low-inflation periods while taking less duration during reflationary periods.
Identification of macroeconomic turning points and adaptation asset allocation is not a rote process. Successful decision-making requires considerable quantitative analysis and qualitative judgment. The MAG investment committee comprises a diverse group of seasoned investment professionals whose expertise covers a broad range of asset classes, including global stocks and bonds, emerging markets, commodities and currencies. Some committee members have worked and navigated multiple economic cycles together for decades. The team has been in the trenches together during some of the most extreme market environments. This continuity is extremely valuable during market inflection points. At DoubleLine, we monitor the global macroeconomic landscape, searching for potential catalysts for the next market turn.
DoubleLine Strategic Asset Allocation Framework (cont’d)

6
Surfing with the Tides: The Macroeconomic Case for Active Asset Allocation
Macro Case for Active Asset Allocation 3/1/19
Conclusion
Asset-class performance is highly dependent on the state of the economic cycle and the medium-term growth and inflation dynamics. History shows that equities perform well in stable to high-growth regimes and underperform in low-growth regimes and negative-growth regimes (recessions). Government bonds show a higher sensitivity to inflation and, along with other interest-rate sensitive securities, underperform in reflationary environments and outperform in deflationary environments.
Traditional asset allocation is agnostic to the economic cycle and generally maintains a static allocation regardless of the growth and inflation regimes, making such strategies susceptible to large drawdowns observed during recessions and stagflationary periods. DoubleLine believes superior risk-adjusted performance can be achieved through active asset allocation, implemented under our Strategic Asset Allocation framework, incorporating the investment committee’s view of growth and inflation. We prefer to take advantage of the ebb and flow of the economic cycle and inflation regime, as it’s a lot harder to go against the tide.
1 http://www.nber.org/cycles.html
2 Analysis is based on data starting December 1926 and ending December 2018. Equity performance based on S&P 500 monthly returns from data provided from Ibbotson before January 31, 1988 and Bloomberg from January 31, 1988 to present. Thirty-year Treasury performance is based on data from Ibbotson before June 30, 1973 and the Bloomberg Barclays U.S. Long Treasury Total Return Index from June 30, 1973 to present. Long U.S. Corporate bond performance is based on data from Ibbotson before June 30, 1973 and the Bloomberg Barclays U.S. Credit Total Return Index from January 31, 1973 to present. Commodities returns from September 30, 1959 to December 31, 1970 are based on work from Gorton and Rouwenhorst, which generated a commodity return series based on front-month commodity futures with equal weighting. Commodities returns from January 31, 1970 to present are based on the S&P Goldman Sachs Commodity Index Total Return Index. High growth denotes quarters when real GDP is greater than 3.0% QoQ annualized. Stable growth: between 1.0% and 3.0%. Low growth: less than 1.0%. High inflation denotes quarters when headline CPI is greater than 5.0% QoQ annualized. Stable inflation: between 1.0% and 5.0%. Low inflation: less than 1.0%.
3 Based on data from Bloomberg and Ibbotson. The 60/40 portfolio assumes a 60% allocation to S&P 500, 32% exposure to U.S. Long Treasuries, and 8% Long U.S. Corporate Credit.
Conclusion
Ryan Kimmel
Analyst, Macro-Asset Allocation
Ryan Kimmel is an Analyst for DoubleLine Capital’s Multi-Asset Growth Strategy. Mr. Kimmel joined DoubleLine in 2012. Prior to DoubleLine, Mr. Kimmel was a Proprietary Trader at The Gelber Group, trading currencies for the Foreign Currency Group. Before Gelber, Mr. Kimmel was an Investment Banking Analyst in Morgan Stanley’s Mergers and Acquisitions Group. Mr. Kimmel holds a BA in Business Economics from the University of California, Los Angeles and holds an MBA from the Anderson School of Management at the University of California, Los Angeles.
7
Surfing with the Tides: The Macroeconomic Case for Active Asset Allocation
Macro Case for Active Asset Allocation 3/1/19
Important Information Regarding This Report Issue selection processes and tools illustrated throughout this presentation are samples and may be modified periodically. Such tools are not the only tools used by the investment teams, are extremely sophisticated, may not always produce the intended results and are not intended for use by non-professionals.
DoubleLine has no obligation to provide revised assessments in the event of changed circumstances. While we have gathered this information from sources believed to be reliable, DoubleLine cannot guarantee the accuracy of the information provided. Securities discussed are not recommendations and are presented as examples of issue selection or portfolio management processes. They have been picked for comparison or illustration purposes only. No security presented within is either offered for sale or purchase. DoubleLine reserves the right to change its investment perspective and outlook, as well as portfolio construction, without notice as market conditions dictate or as additional information becomes available. This material may include statements that constitute “forward-looking statements” under the U.S. securities laws. Forward-looking statements include, among other things, projections, estimates, and information about possible or future results related to a client’s account, or market or regulatory developments.
Ratings shown for various indices reflect the average for the indices. Such ratings and indices are created independently of DoubleLine and are subject to change without notice.
Important Information Regarding Risk Factors Investment strategies may not achieve the desired results due to implementation lag, other timing factors, portfolio management decision-making, economic or market conditions or other unanticipated factors. The views and forecasts expressed in this material are as of the date indicated, are subject to change without notice, may not come to pass and do not represent a recommendation or offer of any particular security, strategy, or investment. Past performance (whether of DoubleLine or any index illustrated in this presentation) is no guarantee of future results. You cannot invest directly in an index.
Important Information Regarding DoubleLine In preparing the client reports (and in managing the portfolios), DoubleLine and its vendors price separate account portfolio securities using various sources, including independent pricing services and fair value processes such as benchmarking.
To receive a copy of DoubleLine’s current Form ADV (which contains important additional disclosure information), a copy of DoubleLine’s proxy voting policies and procedures, or to obtain additional information on DoubleLine’s proxy voting decisions, please contact DoubleLine’s Client Services.
Important Information Regarding DoubleLine’s Investment Style DoubleLine seeks to maximize investment results consistent with our interpretation of client guidelines and investment mandate. While DoubleLine seeks to maximize returns for our clients consistent with guidelines, DoubleLine cannot guarantee that DoubleLine will outperform a client's specified benchmark. Additionally, the nature of portfolio diversification implies that certain holdings and sectors in a client's portfolio may be rising in price while others are falling; or, that some issues and sectors are outperforming while others are underperforming. Such out or underperformance can be the result of many factors, such as, but not limited to, duration/interest rate exposure, yield curve exposure, bond sector exposure, or news or rumors specific to a single name.
DoubleLine is an active manager and will adjust the composition of clients’ portfolios consistent with our investment team’s judgment concerning market conditions and any particular security. The construction of DoubleLine portfolios may differ substantially from the construction of any of a variety of bond market indices. As such, a DoubleLine portfolio has the potential to underperform or outperform a bond market index. Since markets can remain inefficiently priced for long periods, DoubleLine’s performance is properly assessed over a full multi-year market cycle.
Important Information Regarding Client Responsibilities Clients are requested to carefully review all portfolio holdings and strategies, including by comparison of the custodial statement to any statements received from DoubleLine. Clients should promptly inform DoubleLine of any potential or perceived policy or guideline inconsistencies. In particular, DoubleLine understands that guideline enabling language is subject to interpretation and DoubleLine strongly encourages clients to express any contrasting interpretation as soon as practical. Clients are also requested to notify DoubleLine of any updates to client’s information, such as, but not limited to, adding affiliates (including broker dealer affiliates), issuing additional securities, name changes, mergers or other alterations to Client’s legal structure.
DoubleLine Group is not an investment adviser registered with the Securities and Exchange Commission (SEC).
DoubleLine® is a registered trademark of DoubleLine Capital LP.
© 2019 DoubleLine Capital LP
Disclosure
Basis Point - A basis point (bps) equals 0.01%.
GDP - Gross domestic product (GDP) is the monetary value of all the finished
goods and services produced within a country's borders in a specific time period.
Core Inflation - The change in costs of goods and services, but does not include
those from the food and energy sectors. This measure of inflation excludes these
items because their prices are much more volatile. It is most often calculated using
the consumer price index (CPI).
Inflation - Inflation is a quantitative measure of the rate at which the average price
level of a basket of selected goods and services in an economy increases over a
period of time. Often expressed as a percentage, inflation indicates a decrease in
the purchasing power of a nation’s currency. As prices rise, they start to impact
the general cost of living for the common public and the appropriate monetary
authority of the country, like the central bank, then takes the necessary measures
to keep inflation within permissible limits and keep the economy running
smoothly. Inflation is measured in a variety of ways depending upon the types of
goods and services considered, and is the opposite of deflation which indicates a
general decline occurring in prices for goods and services when the inflation rate
falls below 0 percent.
Headline Inflation - The raw inflation figure reported through the Consumer Price
Index (CPI) that is released monthly by the Bureau of Labor Statistics. The CPI
calculates the cost to purchase a fixed basket of goods, as a way of determining
how much inflation is occurring in the broad economy. The CPI uses a base year
and indexes the current year's prices according to the base year's values.
S&P 500 Index - Standard & Poor’s U.S. 500 Index, a capitalized-weighted index of
500 stocks.
Stagflation - A condition of slow economic growth and relatively high
unemployment, or economic stagnation, accompanied by rising prices, or inflation.
It can also be defined as inflation and a decline in gross domestic product (GDP).
Stagflation is an economic problem defined in equal parts by its rarity and by the
lack of consensus among academics on how exactly it comes to pass.
Consumer Price Index (CPI) - A measure that examines the weighted average of
prices of a basket of consumer goods and services, such as transportation, food
and medical care. The CPI is calculated by taking price changes for each item in the
predetermined basket of goods and averaging them; the goods are weighted
according to their importance. Changes in CPI are used to assess price changes
associated with the cost of living.
An investment cannot be made directly in an index.