Embed Size (px)
Citation preview
Surrey Energy Economics Centre
Energy demand and energy efficiency in the OECD Energy demand and energy efficiency in the OECD countries: a stochastic demand frontier approachcountries: a stochastic demand frontier approachcountries: a stochastic demand frontier approachcountries: a stochastic demand frontier approach
IEFE IEFE decemberdecember 20092009
Massimo Filippini and Lester HuntMassimo Filippini and Lester Hunt
Surrey Energy Economics Centre
Outline
Motivation and goals
MethodologyMethodology
Model Specification
Data
Results
Conclusions
2
Surrey Energy Economics Centre
Motivation and Goals
• Energy efficiency has a critical role in addressing energy security, environmental and economic issuesenvironmental and economic issues
• All OECD countries are implementing energy efficiency policies• All OECD countries are implementing energy efficiency policies
• The promotion of energy efficiency policy is also a very important • The promotion of energy efficiency policy is also a very important activity of the IEA.
333
Surrey Energy Economics Centre
Motivation However the exact definition/ measurement of
‘energy efficiency’ remains rather vagueenergy efficiency remains rather vague
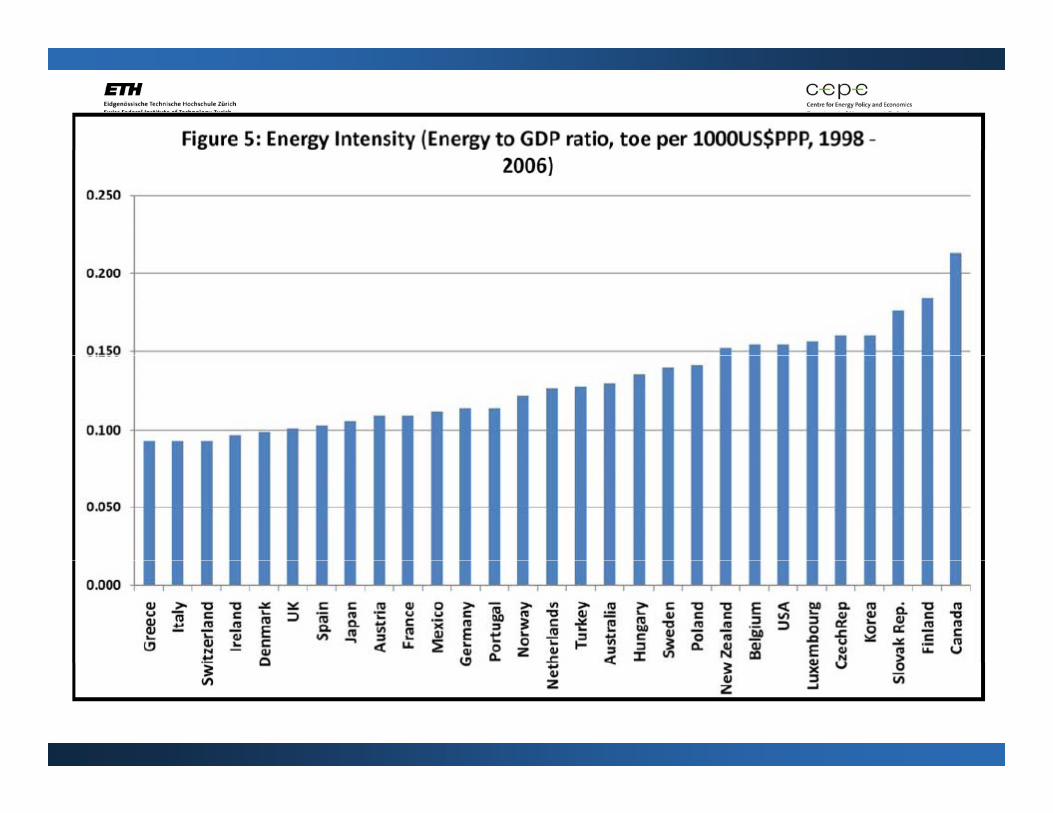
W h f d ‘ ’ With energy intensity often used as a ‘proxy’ i.e. the simple energy consumption to GDP ratio
444
4
Surrey Energy Economics Centre
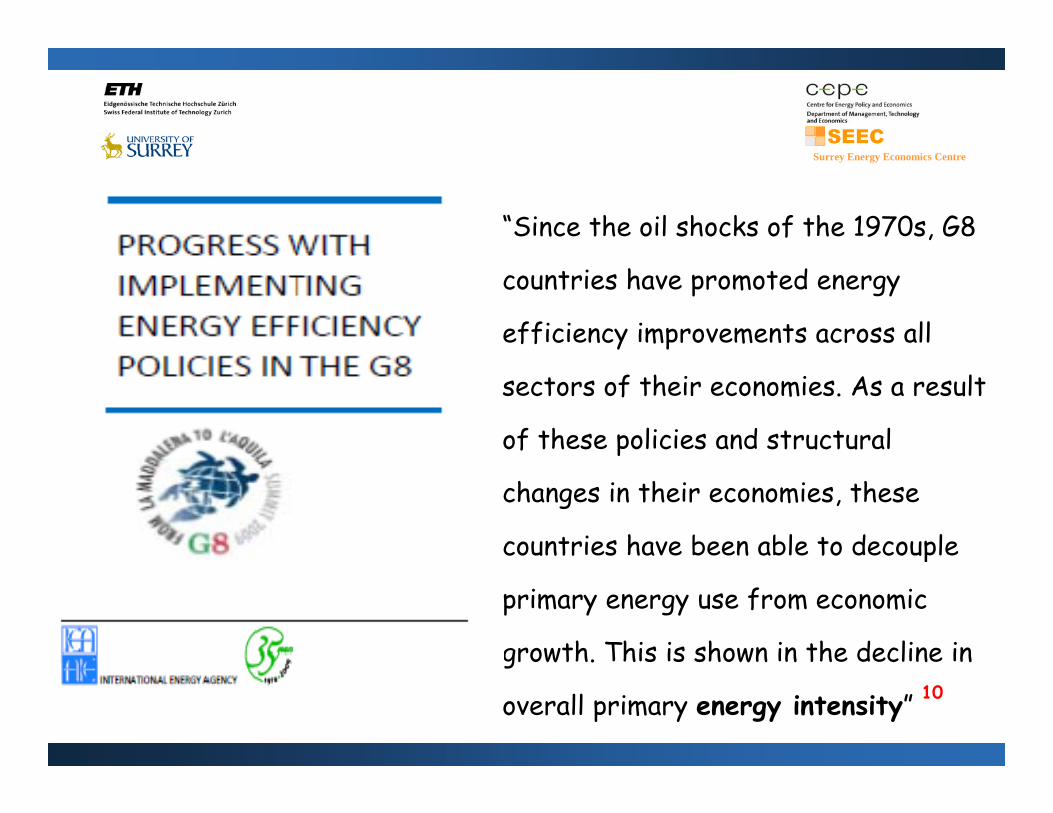
“Since the oil shocks of the 1970s, G8
countries have promoted energy
efficiency improvements across all
sectors of their economies. As a result
of these policies and structural
changes in their economies, these
countries have been able to decouple p
primary energy use from economic
growth. This is shown in the decline in g
overall primary energy intensity” 10
Surrey Energy Economics Centre
Footnote 10
Energy intensity is the amount of energy used per unit of
activity. It is commonly calculated as the ratio of energy use to y y gy
GDP. Energy intensity is often taken as a proxy for energy
efficiency, although this is not entirely accurate since changes in ff y, g y g
energy intensity are a function of changes in several factors
including the structure of the economy and energy efficiency.including the structure of the economy and energy efficiency.
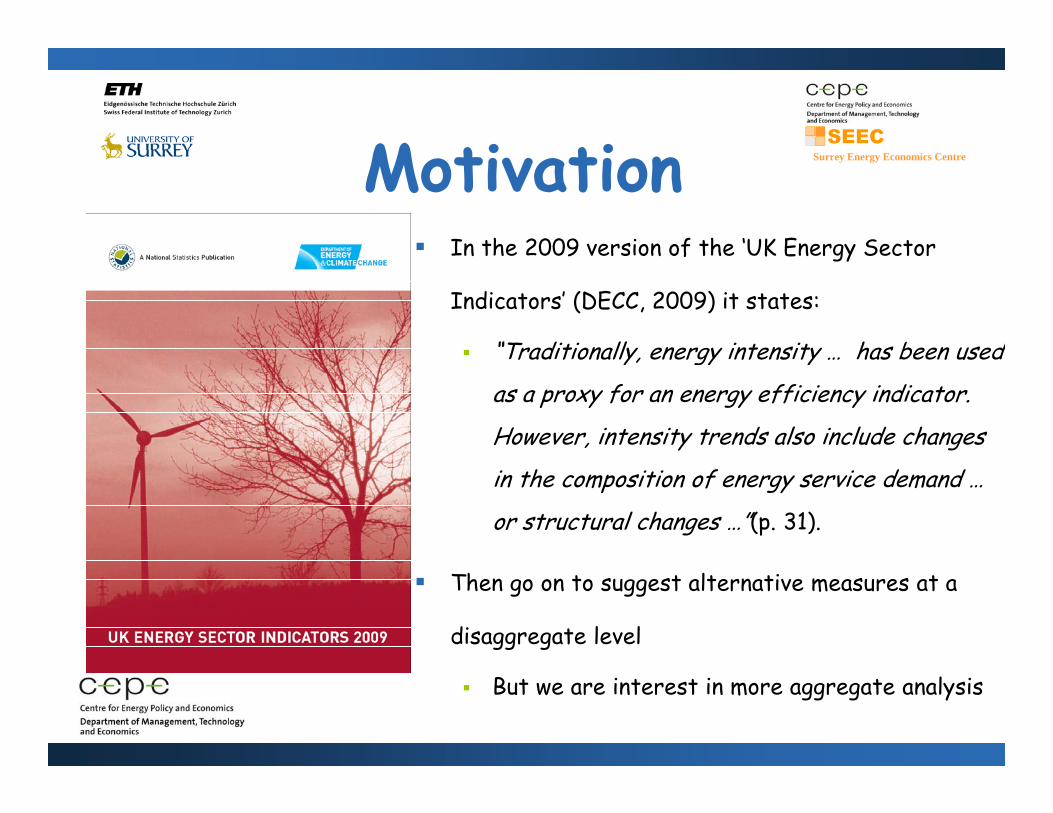
M ti ti Surrey Energy Economics CentreMotivation In the 2009 version of the ‘UK Energy Sector In the 2009 version of the UK Energy Sector
Indicators’ (DECC, 2009) it states:
“Traditionally energy intensity has been used Traditionally, energy intensity … has been used
as a proxy for an energy efficiency indicator.
However, intensity trends also include changes
in the composition of energy service demand …
or structural changes …”(p. 31).
Then go on to suggest alternative measures at a
disaggregate level
But we are interest in more aggregate analysis
7
Surrey Energy Economics Centre
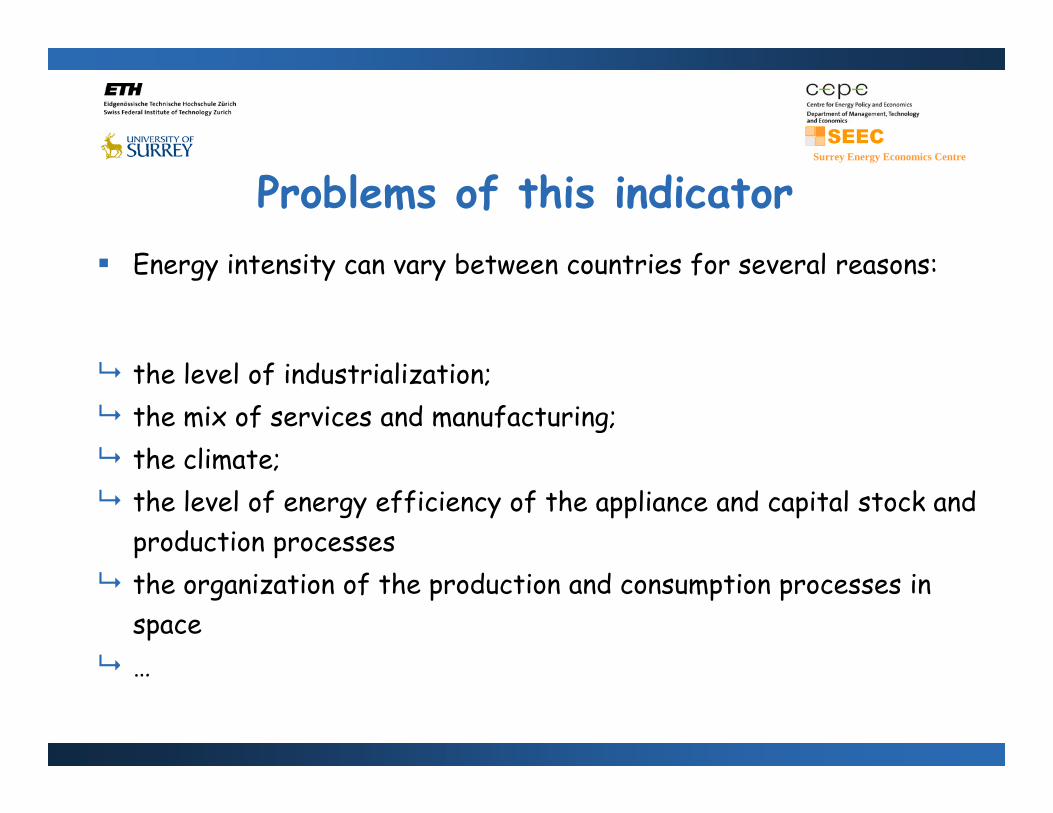
Problems of this indicator E f l Energy intensity can vary between countries for several reasons:
the level of industrialization; the mix of services and manufacturing; the climate; the climate; the level of energy efficiency of the appliance and capital stock and
production processes the organization of the production and consumption processes in
space …
Surrey Energy Economics Centre
Surrey Energy Economics Centre
Goals of the paper
• To estimate the economy-wide level of energy efficiency for a
sample of OECD countries using an alternative approach based p g pp
on two branches of the literature:
frontier estimation and frontier estimation and
energy demand modelling.
• Estimation of an aggregate energy demand frontier function
in order to derive the “underlying energy efficiency” for
each country
10
Surrey Energy Economics Centre
MethodologyAn aggregate frontier energy demand modelAn aggregate frontier energy demand model
I l f ti f ti i th i l i i l l l f • In general, a frontier function gives the maximal or minimal level of an economic indicator attainable by an economic agent.
• In the case of an aggregate energy demand function the frontier • In the case of an aggregate energy demand function the frontier gives the minimum level of energy necessary for an economy to produce any given level of goods and services.
• The distance from the frontier measures the level of energy consumption above the baseline demand, e.g. the level of energy inefficiency.
11
Surrey Energy Economics Centre
E
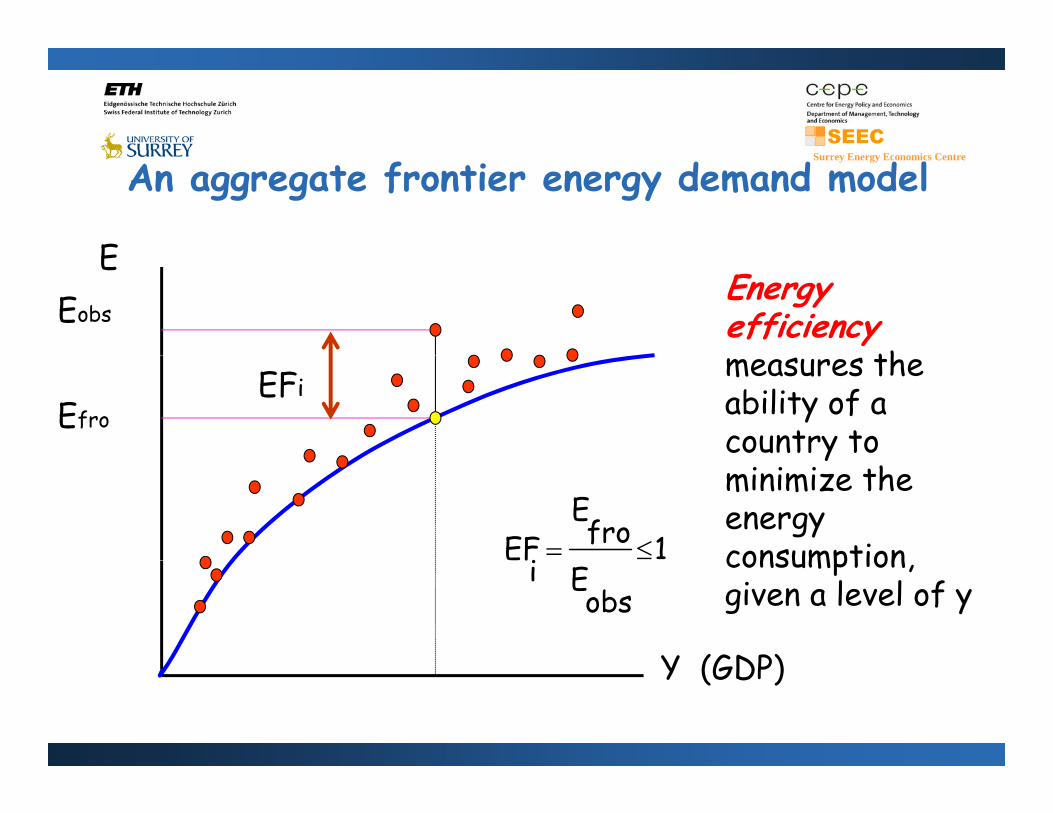
An aggregate frontier energy demand model
EEobs
Energy efficiency
th Efro
EFimeasures the ability of a country to
1froE
iEF
yminimize the energy consumption
Y (GDP)
obsEi
F consumption, given a level of y
12
Y (GDP)
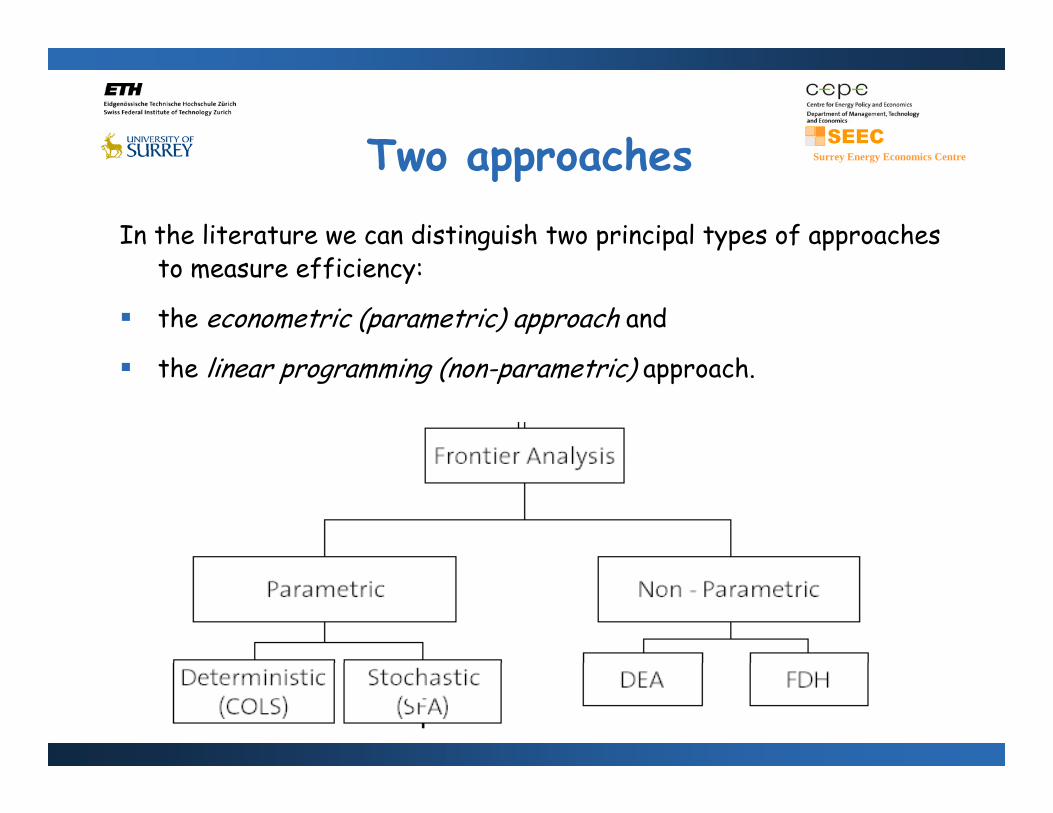
Two approaches Surrey Energy Economics CentreTwo approachesIn the literature we can distinguish two principal types of approaches
to measure efficiency:
the econometric (parametric) approach and
the linear programming (non-parametric) approach.
Surrey Energy Economics Centre
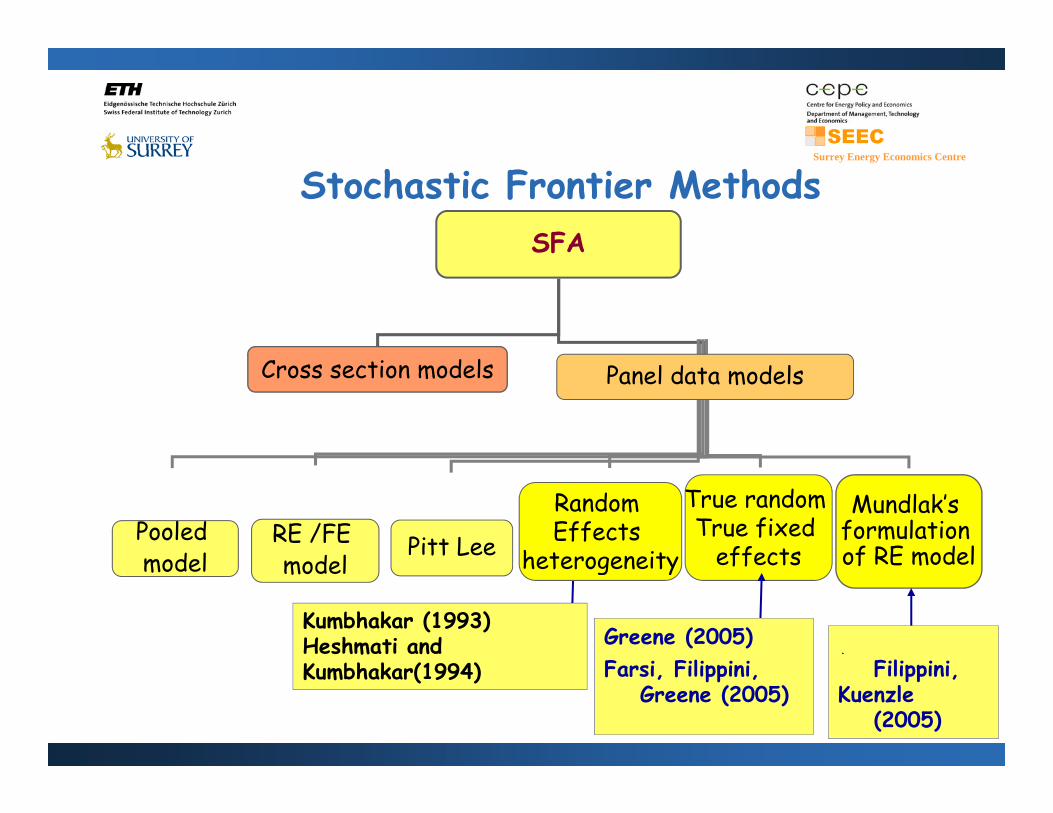
Stochastic Frontier MethodsSFAF
Panel data modelsCross section models
Pooled model
RE /FE m d l
Pitt Lee
Random Effects
heterogeneity
True random True fixed
effects
Mundlak’s formulation of RE modelmodel model heterogeneity effects of RE model
Greene (2005)F i Fili i i
Kumbhakar (1993) Heshmati andK bh k (1994)
F�����
Fili i i
14
Farsi, Filippini, Greene (2005)
Kumbhakar(1994) Filippini,Kuenzle
(2005)
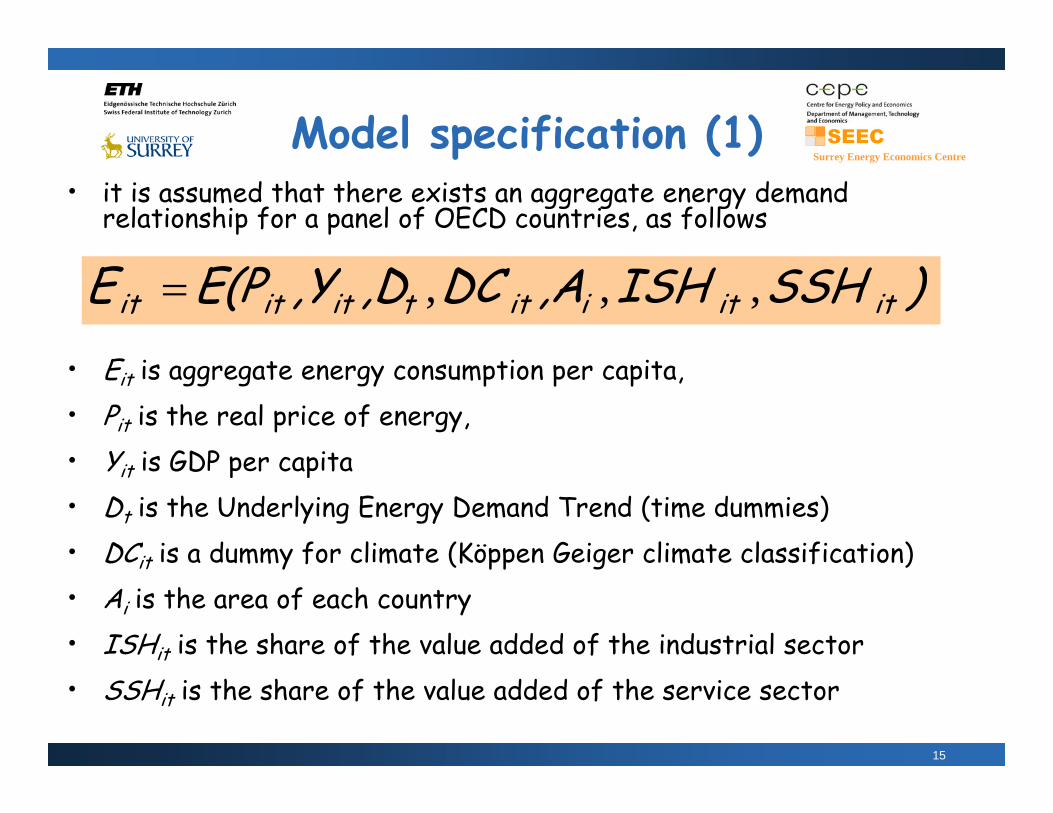
Model specification (1)Surrey Energy Economics Centre
p f ( )• it is assumed that there exists an aggregate energy demand
relationship for a panel of OECD countries, as follows
)SSHISH,ADC,D,YE(PE ititiittititit ,,,
• Eit is aggregate energy consumption per capita, • Pit is the real price of energy, • Y is GDP per capita• Yit is GDP per capita• Dt is the Underlying Energy Demand Trend (time dummies)• DCit is a dummy for climate (Köppen Geiger climate classification)DCit is a dummy for climate (Köppen Geiger climate classification)• Ai is the area of each country• ISHit is the share of the value added of the industrial sector• SSHit is the share of the value added of the service sector
15
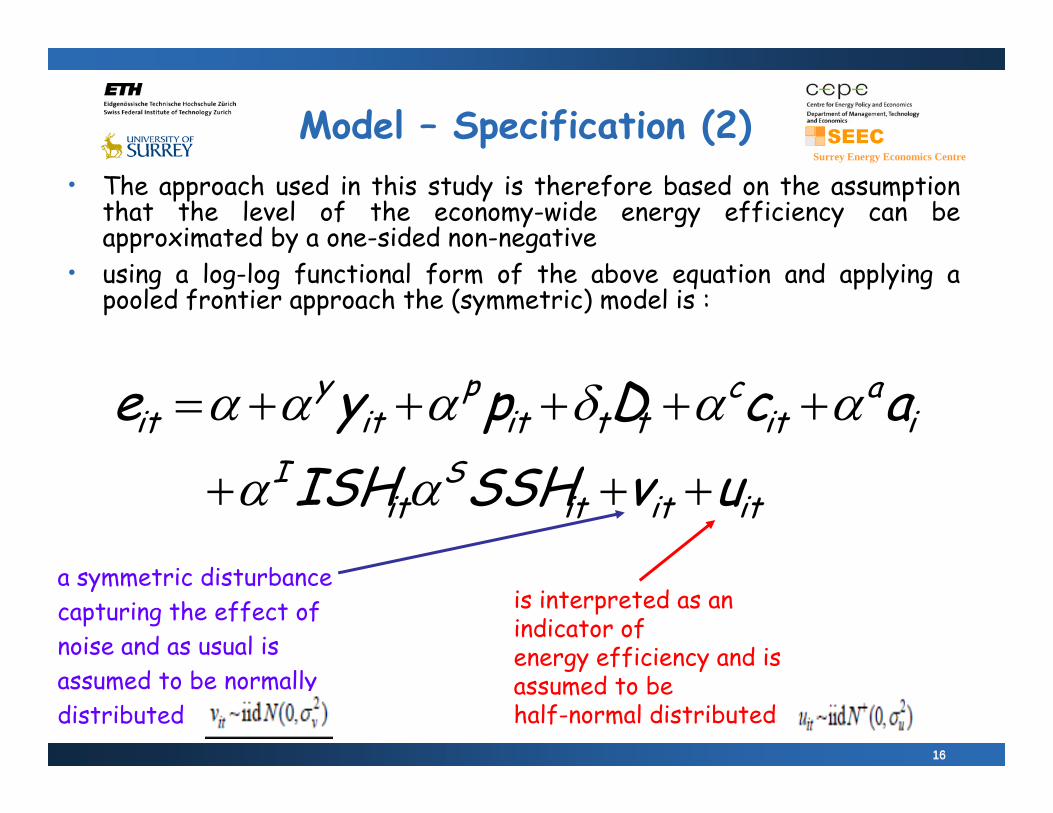
Model – Specification (2)Surrey Energy Economics Centre
• The approach used in this study is therefore based on the assumptionthat the level of the economy-wide energy efficiency can beapproximated by a one-sided non-negativepp y g
• using a log-log functional form of the above equation and applying apooled frontier approach the (symmetric) model is :
ia
itc
ttitp
ity
it acDpye
itititS
itI uvSSHISH
a symmetric disturbance capturing the effect of noise and as usual is
is interpreted as an indicator of energy efficiency and is
1616
assumed to be normally distributed
energy efficiency and is assumed to be half-normal distributed
Surrey Energy Economics Centre
Model specification The above is a pooled model The above is a pooled model
i.e. slopes and the constant (α) are homogenous
B t did id But did consider Fixed effects model
R d ff t d l Random effects model And other variations
B h h l d d l i i But argue that the pooled model is appropriate for the analysis being undertaken here
17
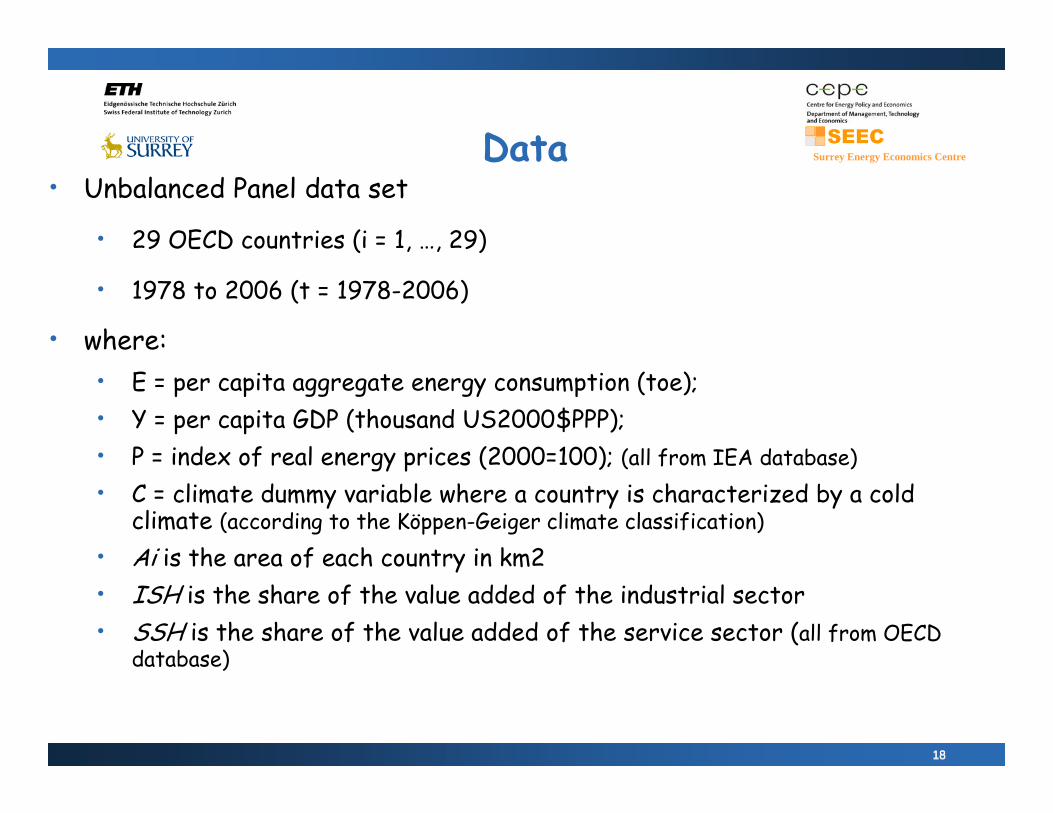
Data Surrey Energy Economics CentreData• Unbalanced Panel data set
• 29 OECD countries (i = 1, …, 29)( )
• 1978 to 2006 (t = 1978-2006)
• where:• E = per capita aggregate energy consumption (toe);• Y = per capita GDP (thousand US2000$PPP);• P = index of real energy prices (2000=100); (all from IEA database)P = index of real energy prices (2000=100); (all from IEA database)• C = climate dummy variable where a country is characterized by a cold
climate (according to the Köppen-Geiger climate classification)• Ai is the area of each country in km2Ai is the area of each country in km2• ISH is the share of the value added of the industrial sector • SSH is the share of the value added of the service sector (all from OECD
database)
1818
database)
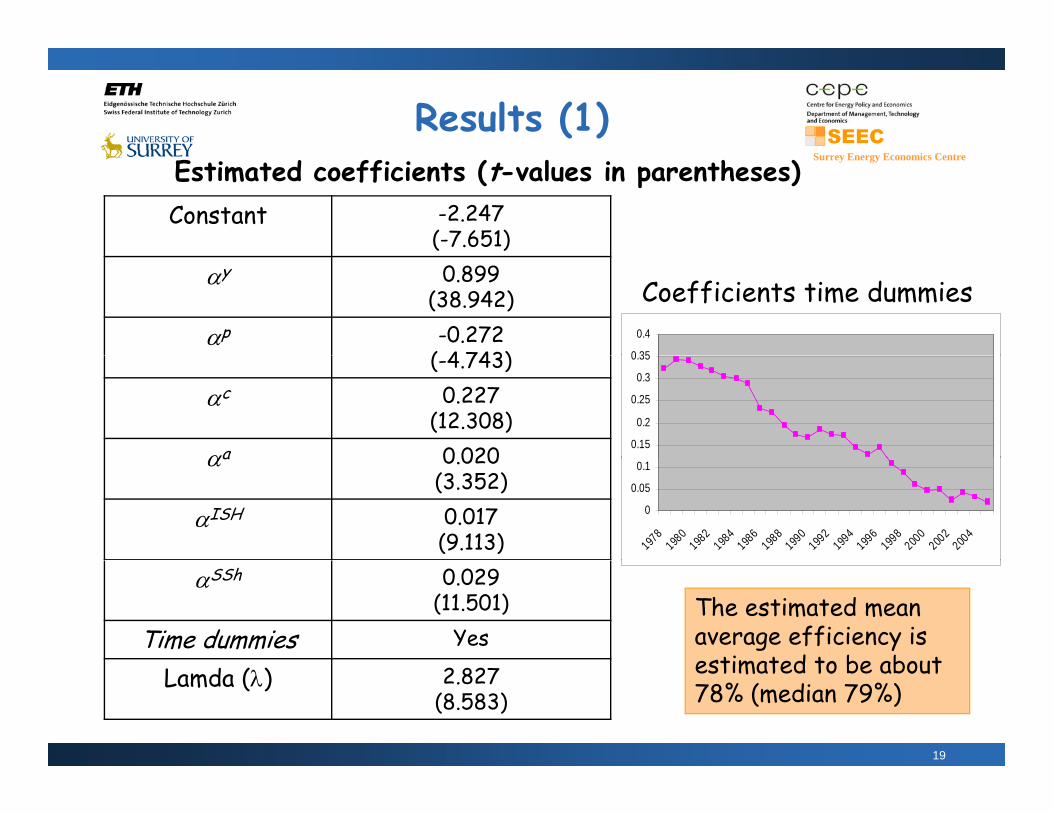
Results (1)Surrey Energy Economics Centre
Estimated coefficients (t-values in parentheses)Constant -2.247
(-7.651)
y 0.899(38.942)
p -0.272( 4 743) 0 35
0.4
Coefficients time dummies
(-4.743)
c 0.227(12.308)
a 0 0200.15
0.2
0.25
0.3
0.35
a 0.020(3.352)
ISH 0.017(9.113)
0
0.05
0.1
1978
1980
1982
1984
1986
1988
1990
1992
1994
1996
1998
2000
2002
2004
SSh 0.029(11.501)
Time dummies YesThe estimated mean average efficiency is estimated to be about
19
Lamda () 2.827(8.583)
estimated to be about 78% (median 79%)
Results Surrey Energy Economics CentreResults Shows that the estimated coefficients and lambda have the Shows that the est mated coeff c ents and am da ha e the
expected signs and are statistically significant
Lambda (λ) gives information on the relative contribution of uitLambda (λ) gives information on the relative contribution of uit
and vit
- Showing that in this case the one-sided error component is l ti l lrelatively large
The estimated income elasticity is about 0.9
The estimated price elasticity is about -0.3
both not out of line with previous estimates
20
ResultsSurrey Energy Economics Centre
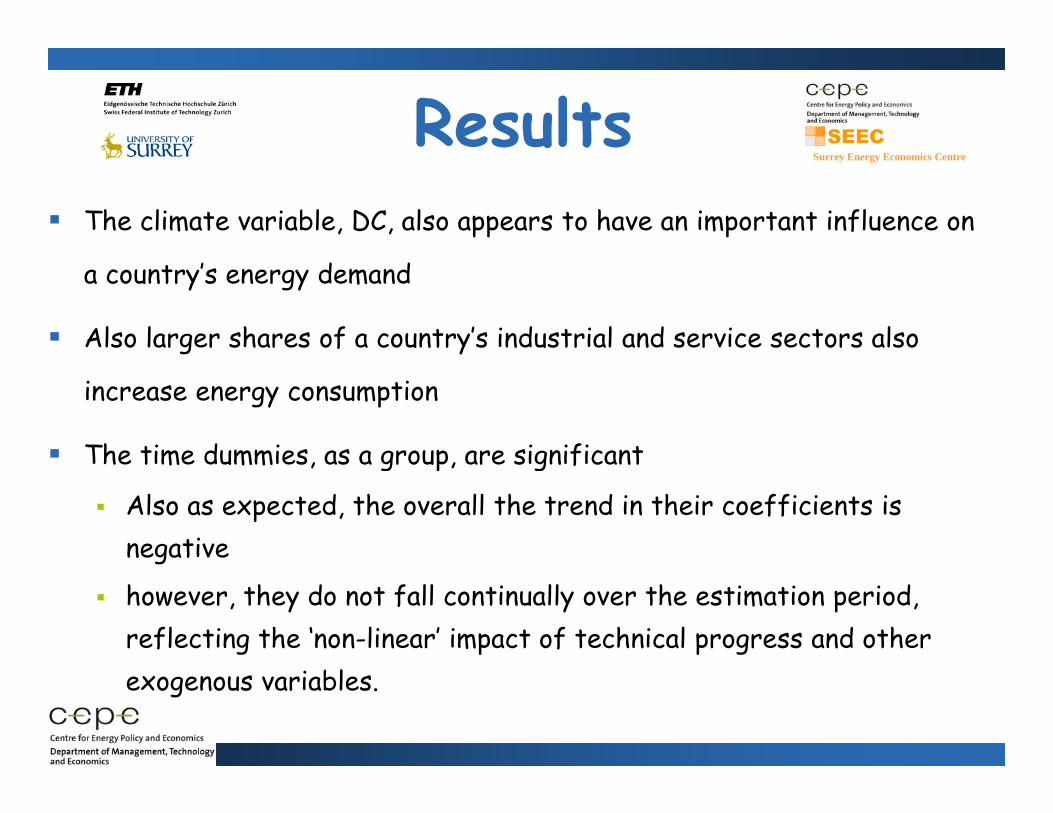
The climate variable, DC, also appears to have an important influence on
a country’s energy demand
Also larger shares of a country’s industrial and service sectors also
increase energy consumption
The time dummies as a group are significantThe time dummies, as a group, are significant
Also as expected, the overall the trend in their coefficients is negativeg
however, they do not fall continually over the estimation period, reflecting the ‘non-linear’ impact of technical progress and other exogenous variables.
21
Results (2)Surrey Energy Economics Centre
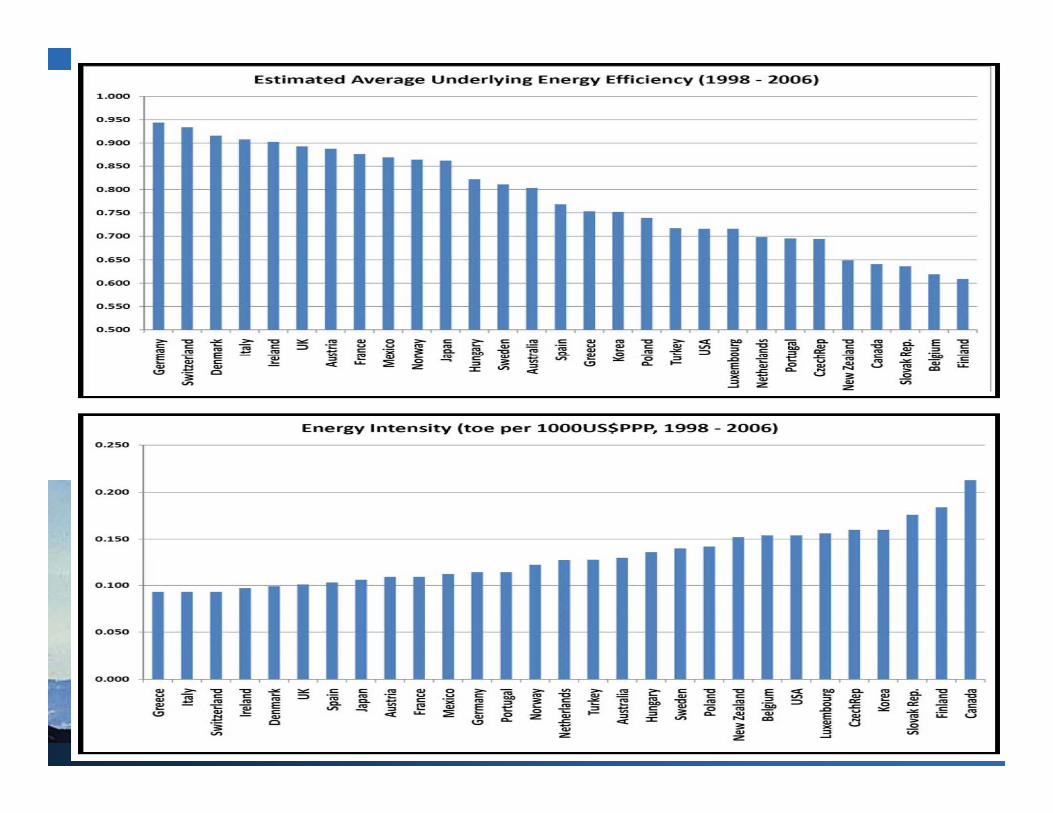
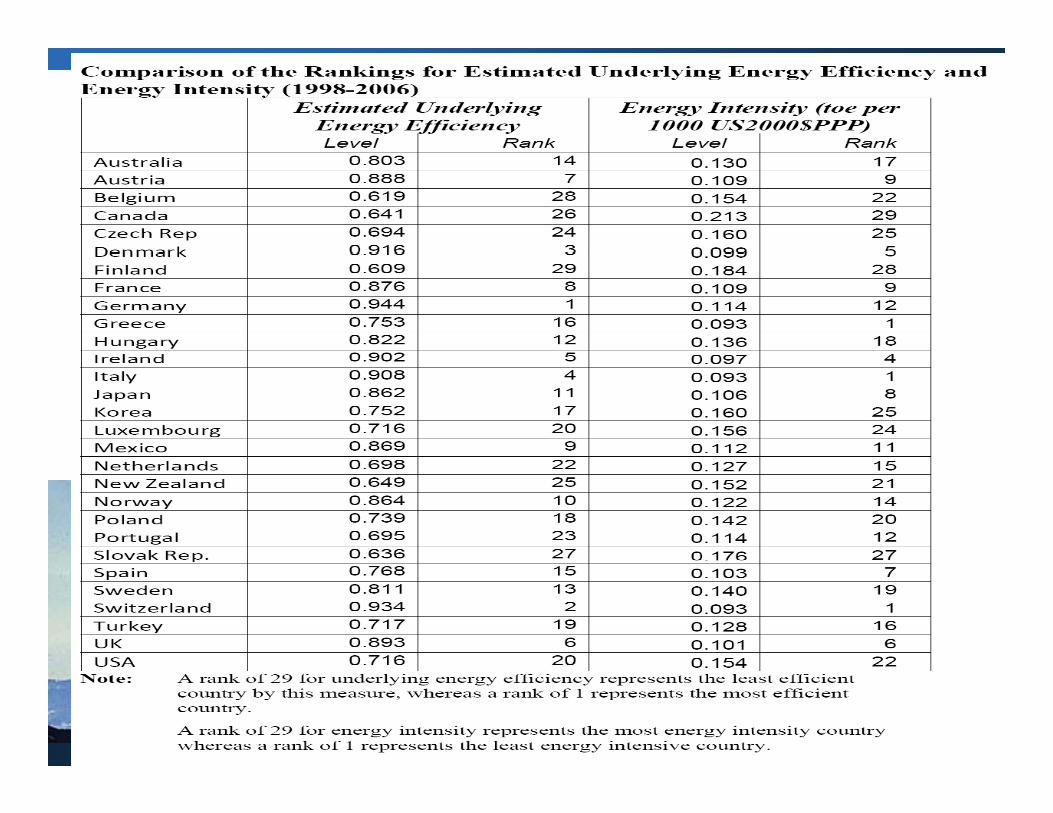
• For some countries the (negative) correlation between Energy I t it d th ti t d E Effi i i it hi h b t f Intensity and the estimated Energy Efficiency is quite high, but for some it is not and for some it is positive.
• Therefore focussing only on Energy Intensity could give a misleading picture – hence the focus should be on the estimated Energy picture hence the focus should be on the estimated Energy Efficiency from the model
• For the Period 1998-2006 we observe the following:• See Table and FiguresSee Table and Figures
22
Surrey Energy Economics Centre
Surrey Energy Economics Centre
Conclusions Surrey Energy Economics CentreConclusions This research is a fresh attempt to isolate core energy efficiency for a
panel of 29 OECD countries, opposed to relying on the simple energy to
GDP ratio – or energy intensity
By estimating a measure of ‘underlying energy efficiency’ by combining
the approaches taken in energy demand modelling and frontier analysispp gy g y
The energy demand specification controls for income, price, climate,
country size structure of the economy and a common underlying energy country size, structure of the economy and a common underlying energy
demand trend, thus the ‘efficiency’ measure is obtained – in a similar way
t pr vi us rk n c st nd pr ducti n stim ti nto previous work on cost and production estimation
25
ConclusionsSurrey Energy Economics Centre
The estimates for core energy efficiency using this approach
show that although for a number of countries the change in
energy intensity over time might give a reasonable indication of
efficiency improvements
this is not always the case
both over time and across countries
Italy and Greece being prime examplesFor Italy energy intensity declines over the estimation - For Italy, energy intensity declines over the estimation period suggesting an improvement in energy efficiency, whereas the estimated underlying energy efficiency falls over the periodover the period
26
Surrey Energy Economics Centre
Conclusions Therefore unless the analysis advocated here is undertaken it is
not possible to know whether the energy intensity of a country is
a good proxy for energy efficiency or not
Hence, it is argued that this analysis should be undertaken in
order to give policy makers an additional indicator other than the
rather naïve measure of energy intensity in order to try to avoid
potentially misleading policy conclusions.
27
Surrey Energy Economics Centre
Reference
Filippini M., Hunt L. (2009). Energy demand and energy
efficiency in the OECD countries: a stochastic demant frontier
approach, CEPE Working Paper 68, Centre for Energy Policy and
Economics, ETH Zurich, October 2009. [pdf, 897 kB]
http://www.cepe.ethz.ch/publications/workingPapers
28