Embed Size (px)
Citation preview
Final Report
Survey of Non-BankFinancial Institutions
April 4, 2000
Dove Consulting iFinrpt.doc
Ed Bachelder and Sam Ditzion
Sam Ditzion, Daniel Losk, and Mike Heller
Kate Garnica, Sharon Petitpas, and Manisha Pai
Dove Consulting 1 Executive Summary
Executive Summary.....................................................................................................................5
Background.................................................................................................................................11
Study Objectives ........................................................................................................................16
Research Methodology..............................................................................................................20
Survey Administration...............................................................................................................23
Key Observations ......................................................................................................................25
Markets Summaries....................................................................................................................48
Case Studies ................................................................................................................................62
Appendices..................................................................................................................................70
Dove Consulting 2 Executive Summary
Overall Product Availability among NBFI Respondents ....................................................... 8
Check Cashing and Money Order Average Fee and Volume Data....................................... 9
Product Revenue as an Percentage of Total Revenue...........................................................10
Estimated Pre-tax Income per Outlet by Market Area and Type of NBFI .......................10
Where Lower-Income Households without Deposit Accounts Cash Their Checks........13
Number of Check Cashing Outlets in the US........................................................................14
Geographic Distribution of Check Cashing Outlets: United States....................................16
Geographic Distribution of Check Cashing Outlets: Northeast .........................................17
Geographic Distribution of Check Cashing Outlets: Southeast ..........................................17
Geographic Distribution of Check Cashing Outlets: Upper Midwest................................18
Geographic Distribution of Check Cashing Outlets: West ..................................................18
Number of NBFIs Surveyed vs. Total by Market..................................................................23
Overall Product Availability Among NBFI Respondents ....................................................25
Direct Deposit Service Products by Market ...........................................................................27
Days of Operation by Market Area and Type of NBFI........................................................29
Hours of Operation by Market Area and Type of NBFI .....................................................29
Average Distance from All NBFIs to Closest Bank, ATM, and Post Office ....................31
Fees to Cash a Payroll Check by Market and Type of NBFI...............................................34
Fees to Cash a Government Check by Market and Type of NBFI ....................................34
Fees to Cash a Personal Check by Market and Type of NBFI............................................35
Check Cashing Volume and Fees by Market and Type of NBFI........................................36
Check Cashing Volume and Fees by Market and Type of NBFI........................................37
Product Revenue as an Percentage of Total Revenue...........................................................42
Store Size by Market Area and Type of NBFI .......................................................................43
Dove Consulting 3 Executive Summary
Estimated Pre-tax Income per Outlet by Type of NBFI and Market Area .......................47
Atlanta Market Map....................................................................................................................48
Atlanta Check Cashing Fee Schedule.......................................................................................50
Boston Market Map....................................................................................................................52
Boston Check Cashing Fee Schedule.......................................................................................54
San Antonio Market Map ..........................................................................................................56
San Antonio Check Cashing Fee Schedule .............................................................................57
San Diego Market Map ..............................................................................................................59
San Diego Check Cashing Fee Schedule .................................................................................60
Comparison Between Ace Cash Express and Dollar Financial Group ..............................63
Financial Analysis of an Independent San Antonio NBFI...................................................69
Dove Consulting 4 Executive Summary
Survey Participation Rate............................................................................................................. 6
Reasons Why Unbanked Families Do Not Have Checking Accounts...............................11
Leading NBFI Chains – SIC Code 609903: Check Cashing Services.................................15
Market Comparison....................................................................................................................19
Participation Rate by Market.....................................................................................................21
Data Element Collection by Method.......................................................................................22
NBFI Participation Rate by Market .........................................................................................24
Product Availability by Market .................................................................................................26
Languages Spoken at NBFIs by Market ..................................................................................30
Correlations..................................................................................................................................32
Average Fee by Product.............................................................................................................33
Product Availability and Average Monthly Volumes by Product Line...............................38
Product Availability and Average Monthly Volumes by Product Line...............................38
Average Revenue by Market Area and NBFI Type...............................................................40
Staffing Levels by Market Area and Type of NBFI...............................................................43
Composite Cost Structure as a Percentage of Total Revenueby Market Area and Type of NBFI..........................................................................................45
Estimated Pre-tax Income per Outlet by Market Area and Type of NBFI .......................46
Atlanta 1990 Census Demographic Data ................................................................................49
Boston 1990 Census Demographic Data ................................................................................54
San Antonio 1990 Census Demographic Data.......................................................................57
San Diego 1990 Census Demographic Data...........................................................................60
Dove Consulting 5 Executive Summary
Dove Consulting was contracted by the Department of the Treasury to survey non-bankfinancial institutions (NBFIs) in four US markets. The NBFIs surveyed were selectedbecause their primary business activity is check cashing and/or money transmission,which is only one segment of the full range of money service businesses.
The purpose of this research was to gather new information on this growing financialservices industry segment for Treasury in the context of its broader EFT '99 research.Although the NBFI industry has grown rapidly over the last few years, there has beenlittle empirical research on the nature of the industry – its size, competitive structure,pricing and profitability. As these entities become more prominent players in thefinancial services industry generally, it will be of interest to researchers and policymakersto understand how NBFIs compare with traditional financial institutions. Bycommissioning this study, Treasury hoped to gain new data on NBFIs' businessstructures – where they locate, what products and services they offer, and the fees theycharge. Additionally, Treasury was interested in gauging the availability and demand forEFT products offered through NBFIs.
Together, Treasury and Dove selected four markets in which to survey NBFIs duringDecember 1999 and January 2000: the cities of Atlanta, Georgia; Boston, Massachusetts;San Antonio, Texas; and San Diego, California. These markets were selected to besurveyed because they represent four different US regions, encompass differentracial/ethnic segments of the US population, and are located in states with differentNBFI regulatory environments. Based on the Treasury requirement that at least 30NBFIs be surveyed in each market, Dove obtained responses from 130 NBFIs acrossthe four markets: Atlanta (36); Boston (31); San Antonio (31); and San Diego (32).
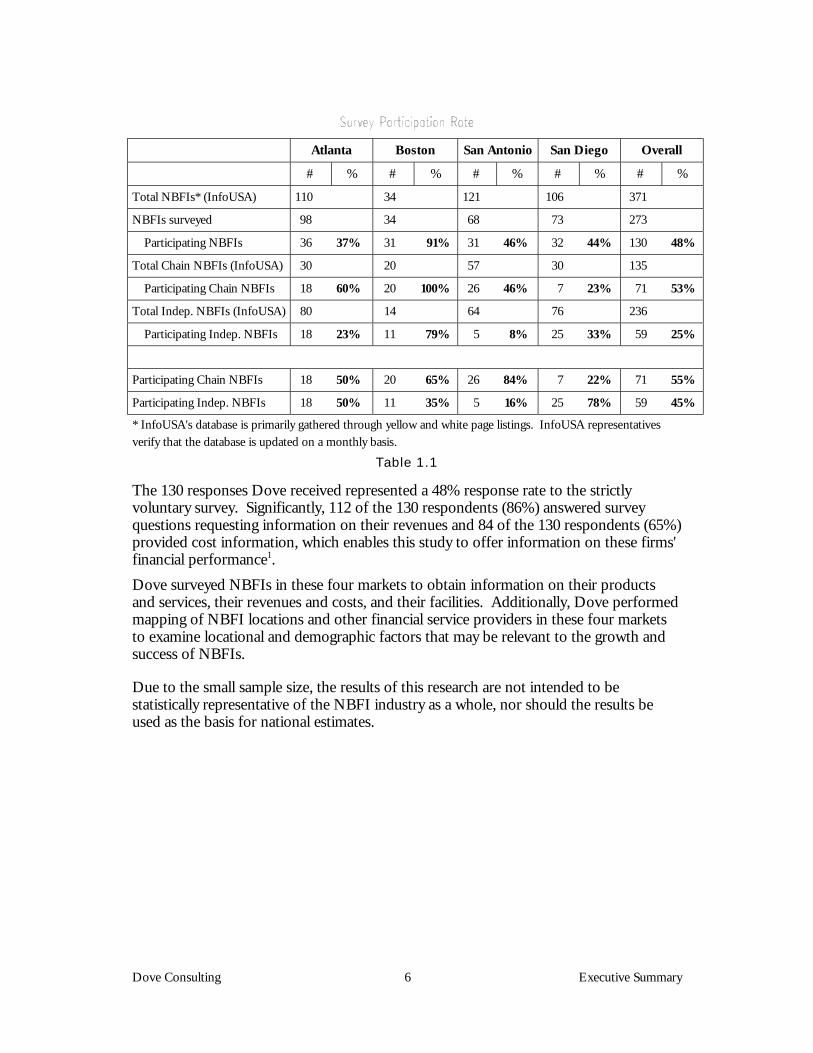
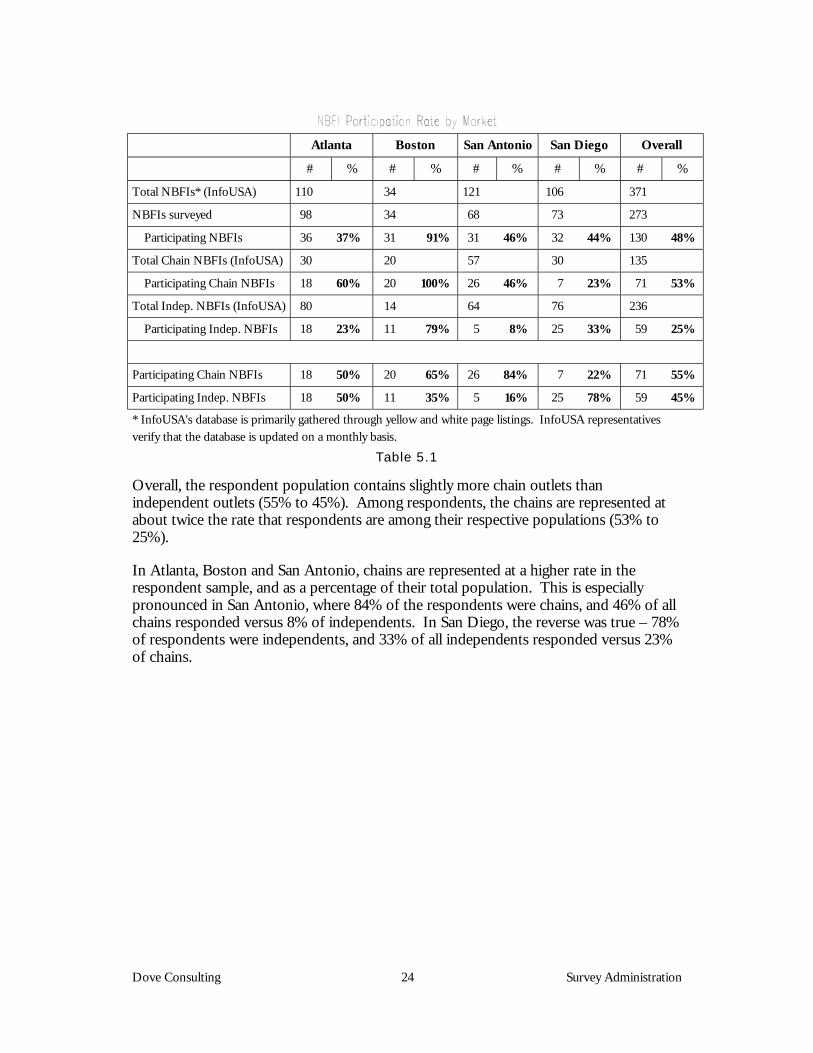
The NBFI participation rates for this survey are summarized for each market andbusiness type in the Table 1.1 below:
Dove Consulting 6 Executive Summary
Atlanta Boston San Antonio San Diego Overall
# % # % # % # % # %
Total NBFIs* (InfoUSA) 110 34 121 106 371
NBFIs surveyed 98 34 68 73 273
Participating NBFIs 36 37% 31 91% 31 46% 32 44% 130 48%
Total Chain NBFIs (InfoUSA) 30 20 57 30 135
Participating Chain NBFIs 18 60% 20 100% 26 46% 7 23% 71 53%
Total Indep. NBFIs (InfoUSA) 80 14 64 76 236
Participating Indep. NBFIs 18 23% 11 79% 5 8% 25 33% 59 25%
Participating Chain NBFIs 18 50% 20 65% 26 84% 7 22% 71 55%
Participating Indep. NBFIs 18 50% 11 35% 5 16% 25 78% 59 45%
* InfoUSA's database is primarily gathered through yellow and white page listings. InfoUSA representativesverify that the database is updated on a monthly basis.
Table 1.1
The 130 responses Dove received represented a 48% response rate to the strictlyvoluntary survey. Significantly, 112 of the 130 respondents (86%) answered surveyquestions requesting information on their revenues and 84 of the 130 respondents (65%)provided cost information, which enables this study to offer information on these firms'financial performance1.Dove surveyed NBFIs in these four markets to obtain information on their productsand services, their revenues and costs, and their facilities. Additionally, Dove performedmapping of NBFI locations and other financial service providers in these four marketsto examine locational and demographic factors that may be relevant to the growth andsuccess of NBFIs.
Due to the small sample size, the results of this research are not intended to bestatistically representative of the NBFI industry as a whole, nor should the results beused as the basis for national estimates.
Dove Consulting 7 Executive Summary
Based on this survey of NBFIs, there are eight key observations:
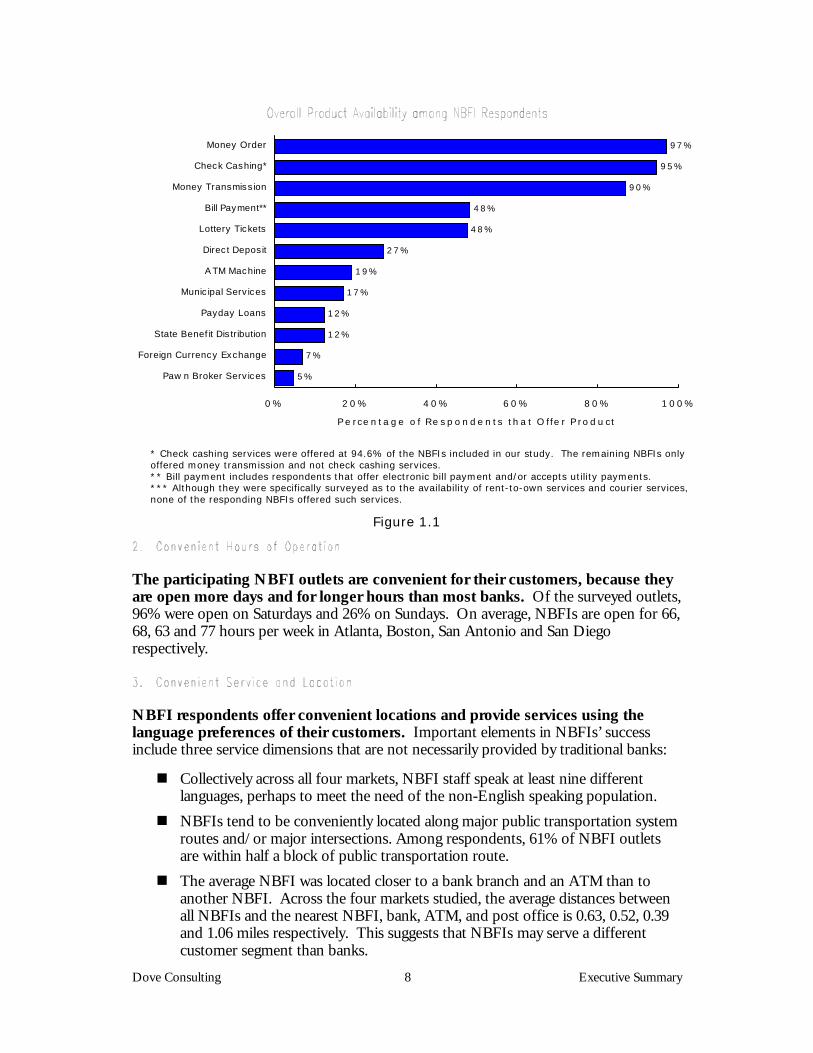
Non-Bank Financial Institutions offer a wide range of financial services andperform transactions that are needed by the underbanked population. Across allfour market areas studied, the three most commonly offered products by surveyparticipants include: Check Cashing (95%), Money Orders (97%) and MoneyTransmission (87%) services. Other financial services that were not as widely availableinclude Bill Payment (48%), Direct Deposit Services (27%) and ATMs (19%).2 SomeNBFIs offer a “one-stop shopping” format in their stores, while others limit thefinancial services offerings to money transmission and money orders. The availability ofthe products and services studied across all NBFIs participating in the survey is depictedin Figure 1.1.
Direct Deposit service products, which allow customers to access their electronicallydeposited payments at a NBFI, are offered at 27% of the responding NBFIs through avariety of banks. Surveyed NBFIs offer two types of direct deposit services:
! One type of product sends federal payments electronically to an ATM card-accessible account.
! The other type of product allows the NBFI to charge the customer a fee for printinghis/her federal check, and then charge the customer its standard fee to cash thecheck.
NBFI respondents reported that these newly available Direct Deposit products were notpopular in the marketplace because the price to the consumer is higher than cashing apaper check, and the revenue to the NBFI is lower than cashing a paper check.
Dove Consulting 8 Executive Summary
5%
7%
12%
12%
17%
19%
27%
48%
48%
90%
95%
97%
0 % 2 0 % 4 0 % 6 0 % 8 0 % 1 0 0%
Paw n Broker Serv ices
Foreign Currency Exchange
State Benef it Dis tribution
Payday Loans
Munic ipal Serv ices
A TM Machine
Direc t Deposit
Lottery Tickets
Bill Payment**
Money Transmiss ion
Check Cashing*
Money Order
P e rce n ta ge o f Re s p o n de n ts th a t O ffe r P ro d u ct
* Check cashing services were offered at 94.6% of the NBFIs included in our study. The remaining NBFIs onlyoffered money transmission and not check cashing services.** Bill payment includes respondents that offer electronic bill payment and/or accepts utility payments.*** Although they were specifically surveyed as to the availability of rent-to-own services and courier services,none of the responding NBFIs offered such services.
Figure 1.1
The participating NBFI outlets are convenient for their customers, because theyare open more days and for longer hours than most banks. Of the surveyed outlets,96% were open on Saturdays and 26% on Sundays. On average, NBFIs are open for 66,68, 63 and 77 hours per week in Atlanta, Boston, San Antonio and San Diegorespectively.
NBFI respondents offer convenient locations and provide services using thelanguage preferences of their customers. Important elements in NBFIs’ successinclude three service dimensions that are not necessarily provided by traditional banks:
! Collectively across all four markets, NBFI staff speak at least nine differentlanguages, perhaps to meet the need of the non-English speaking population.
! NBFIs tend to be conveniently located along major public transportation systemroutes and/or major intersections. Among respondents, 61% of NBFI outletsare within half a block of public transportation route.
! The average NBFI was located closer to a bank branch and an ATM than toanother NBFI. Across the four markets studied, the average distances betweenall NBFIs and the nearest NBFI, bank, ATM, and post office is 0.63, 0.52, 0.39and 1.06 miles respectively. This suggests that NBFIs may serve a differentcustomer segment than banks.
Dove Consulting 9 Executive Summary
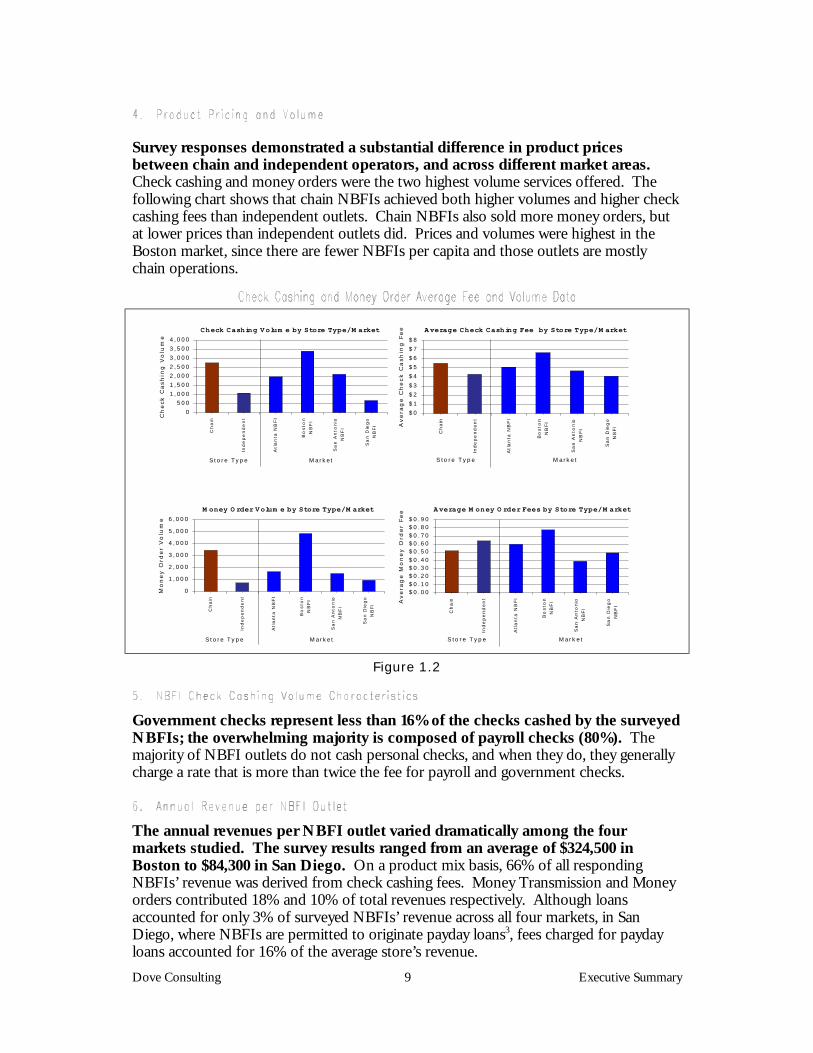
Survey responses demonstrated a substantial difference in product pricesbetween chain and independent operators, and across different market areas.Check cashing and money orders were the two highest volume services offered. Thefollowing chart shows that chain NBFIs achieved both higher volumes and higher checkcashing fees than independent outlets. Chain NBFIs also sold more money orders, butat lower prices than independent outlets did. Prices and volumes were highest in theBoston market, since there are fewer NBFIs per capita and those outlets are mostlychain operations.
0
500
1,000
1,500
2,000
2,500
3,000
3,500
4,000
Ch
ain
Ind
ep
en
de
nt
Atl
an
ta N
BF
I
Bo
sto
n
NB
FI
Sa
n A
nto
nio
NB
FI
Sa
n D
ieg
o
NB
FI
S to re Type M arket
Ch
eck C
ash
ing
Vo
lum
e
Check Cashing Volum e by Store Type/M arket
$0
$1
$2
$3
$4
$5
$6
$7
$8
Cha
in
Inde
pe
nd
en
t
Atl
an
ta N
BFI
Bo
sto
nN
BFI
Sa
n A
nto
nio
NB
FI
Sa
n D
ieg
oN
BFI
S to re Type M arket
Avera
ge C
he
ck C
ash
ing
Fe
e Average Check Cashing Fee by Store Type/M arket
0
1,000
2,000
3,000
4,000
5,000
6,000
Ch
ain
Ind
ep
en
de
nt
Atl
an
ta N
BF
I
Bo
sto
n
NB
FI
Sa
n A
nto
nio
NB
FI
Sa
n D
ieg
o
NB
FI
S to re Type M arket
Mo
ney O
rder
Vo
lum
e
M oney O rder Volum e by Store Type/M arket
$0.00$0.10$0.20$0.30$0.40$0.50$0.60$0.70$0.80$0.90
Cha
in
Inde
pe
nd
en
t
Atl
an
ta N
BFI
Bo
sto
nN
BFI
Sa
n A
nto
nio
NB
FI
Sa
n D
ieg
oN
BFI
S to re Type M arket
Avera
ge M
on
ey
Ord
er
Fee Average M oney O rder Fees by Store Type/M arket
Figure 1.2
Government checks represent less than 16% of the checks cashed by the surveyedNBFIs; the overwhelming majority is composed of payroll checks (80%). Themajority of NBFI outlets do not cash personal checks, and when they do, they generallycharge a rate that is more than twice the fee for payroll and government checks.
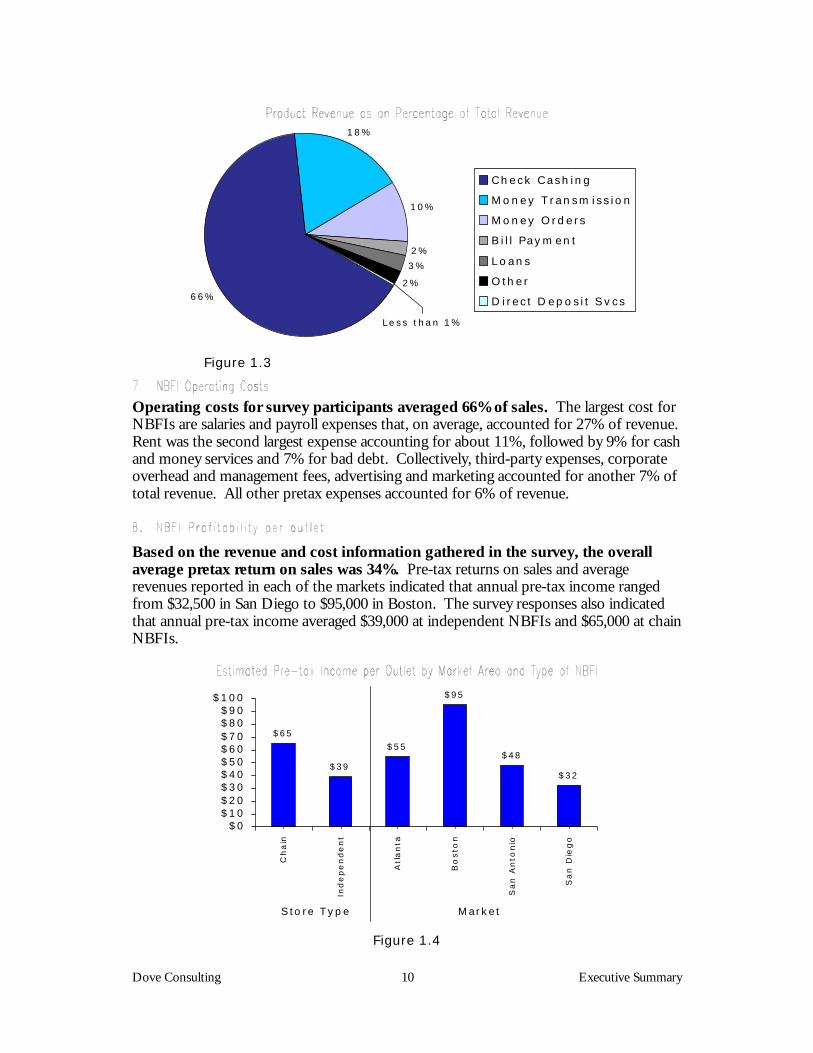
The annual revenues per NBFI outlet varied dramatically among the fourmarkets studied. The survey results ranged from an average of $324,500 inBoston to $84,300 in San Diego. On a product mix basis, 66% of all respondingNBFIs’ revenue was derived from check cashing fees. Money Transmission and Moneyorders contributed 18% and 10% of total revenues respectively. Although loansaccounted for only 3% of surveyed NBFIs’ revenue across all four markets, in SanDiego, where NBFIs are permitted to originate payday loans3, fees charged for paydayloans accounted for 16% of the average store’s revenue.
Dove Consulting 10 Executive Summary
66%
2%
3%
2%
Less than 1%
18%
10%
Check Cash ing
M oney T ransm iss ion
M oney O rders
B i l l Paym ent
Loans
O ther
D irect D eposit Svcs
Figure 1.3
Operating costs for survey participants averaged 66% of sales. The largest cost forNBFIs are salaries and payroll expenses that, on average, accounted for 27% of revenue.Rent was the second largest expense accounting for about 11%, followed by 9% for cashand money services and 7% for bad debt. Collectively, third-party expenses, corporateoverhead and management fees, advertising and marketing accounted for another 7% oftotal revenue. All other pretax expenses accounted for 6% of revenue.
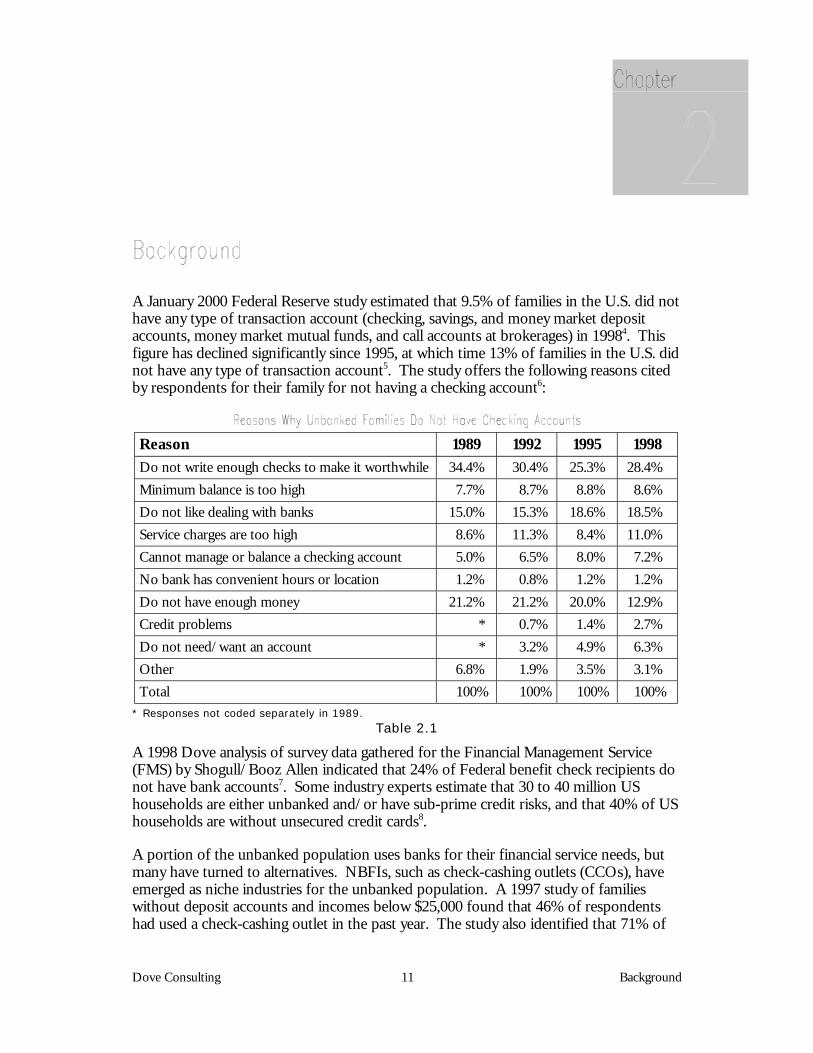
Based on the revenue and cost information gathered in the survey, the overallaverage pretax return on sales was 34%. Pre-tax returns on sales and averagerevenues reported in each of the markets indicated that annual pre-tax income rangedfrom $32,500 in San Diego to $95,000 in Boston. The survey responses also indicatedthat annual pre-tax income averaged $39,000 at independent NBFIs and $65,000 at chainNBFIs.
$65
$39
$55
$95
$48
$32
$0$10$20$30$40$50$60$70$80$90
$100
Ch
ain
Ind
ep
en
de
nt
Atl
an
ta
Bo
sto
n
Sa
n A
nto
nio
Sa
n D
ieg
o
S to re Type Market
Figure 1.4
Dove Consulting 11 Background
A January 2000 Federal Reserve study estimated that 9.5% of families in the U.S. did nothave any type of transaction account (checking, savings, and money market depositaccounts, money market mutual funds, and call accounts at brokerages) in 19984. Thisfigure has declined significantly since 1995, at which time 13% of families in the U.S. didnot have any type of transaction account5. The study offers the following reasons citedby respondents for their family for not having a checking account6:
Reason 1989 1992 1995 1998Do not write enough checks to make it worthwhile 34.4% 30.4% 25.3% 28.4%Minimum balance is too high 7.7% 8.7% 8.8% 8.6%Do not like dealing with banks 15.0% 15.3% 18.6% 18.5%Service charges are too high 8.6% 11.3% 8.4% 11.0%Cannot manage or balance a checking account 5.0% 6.5% 8.0% 7.2%No bank has convenient hours or location 1.2% 0.8% 1.2% 1.2%Do not have enough money 21.2% 21.2% 20.0% 12.9%Credit problems * 0.7% 1.4% 2.7%Do not need/want an account * 3.2% 4.9% 6.3%Other 6.8% 1.9% 3.5% 3.1%Total 100% 100% 100% 100%
* Responses not coded separately in 1989.Table 2.1
A 1998 Dove analysis of survey data gathered for the Financial Management Service(FMS) by Shogull/Booz Allen indicated that 24% of Federal benefit check recipients donot have bank accounts7. Some industry experts estimate that 30 to 40 million UShouseholds are either unbanked and/or have sub-prime credit risks, and that 40% of UShouseholds are without unsecured credit cards8.
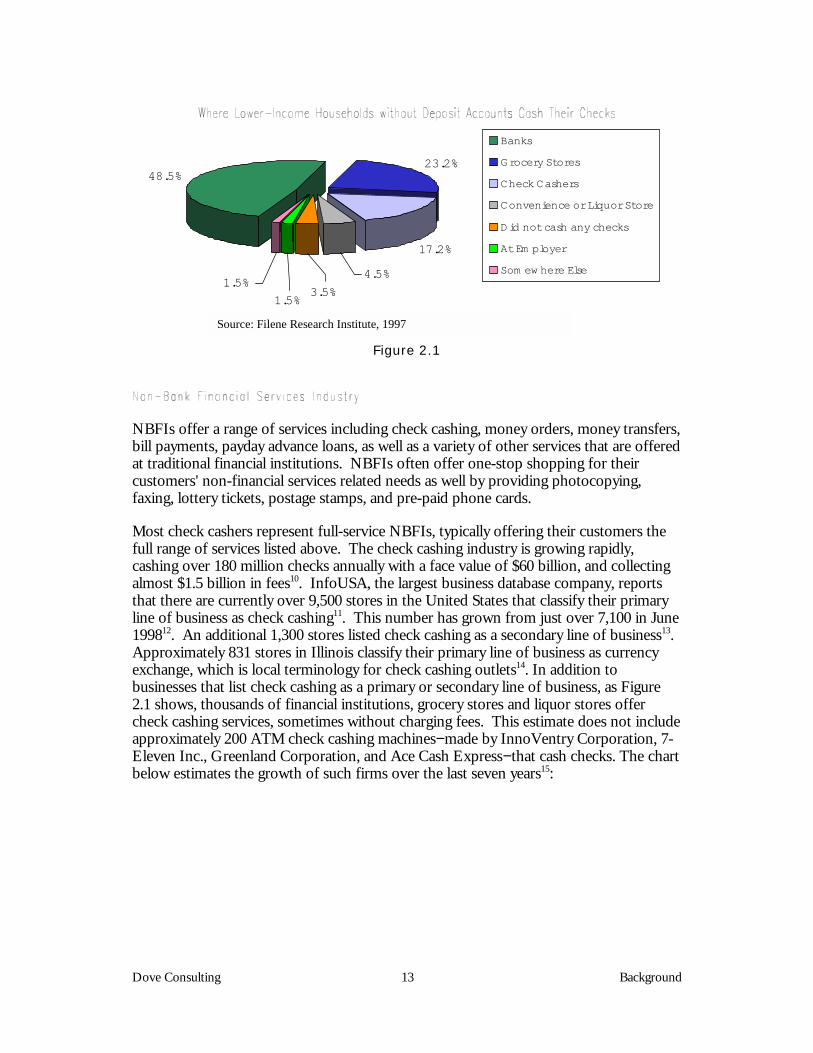
A portion of the unbanked population uses banks for their financial service needs, butmany have turned to alternatives. NBFIs, such as check-cashing outlets (CCOs), haveemerged as niche industries for the unbanked population. A 1997 study of familieswithout deposit accounts and incomes below $25,000 found that 46% of respondentshad used a check-cashing outlet in the past year. The study also identified that 71% of
Dove Consulting 12 Background
unbanked respondents had a checking or savings account at some point in the past.Figure 2.1 shows where these unbanked respondents cashed their checks most often9:
Dove Consulting 13 Background
48.5%23.2%
17.2%
4.5%
3.5%1.5%
1.5%
Banks
Grocery Stores
Check Cashers
Convenience or Liquor Store
Did not cash any checks
At Em ployer
Som ew here Else
Source: Filene Research Institute, 1997
Figure 2.1
NBFIs offer a range of services including check cashing, money orders, money transfers,bill payments, payday advance loans, as well as a variety of other services that are offeredat traditional financial institutions. NBFIs often offer one-stop shopping for theircustomers' non-financial services related needs as well by providing photocopying,faxing, lottery tickets, postage stamps, and pre-paid phone cards.
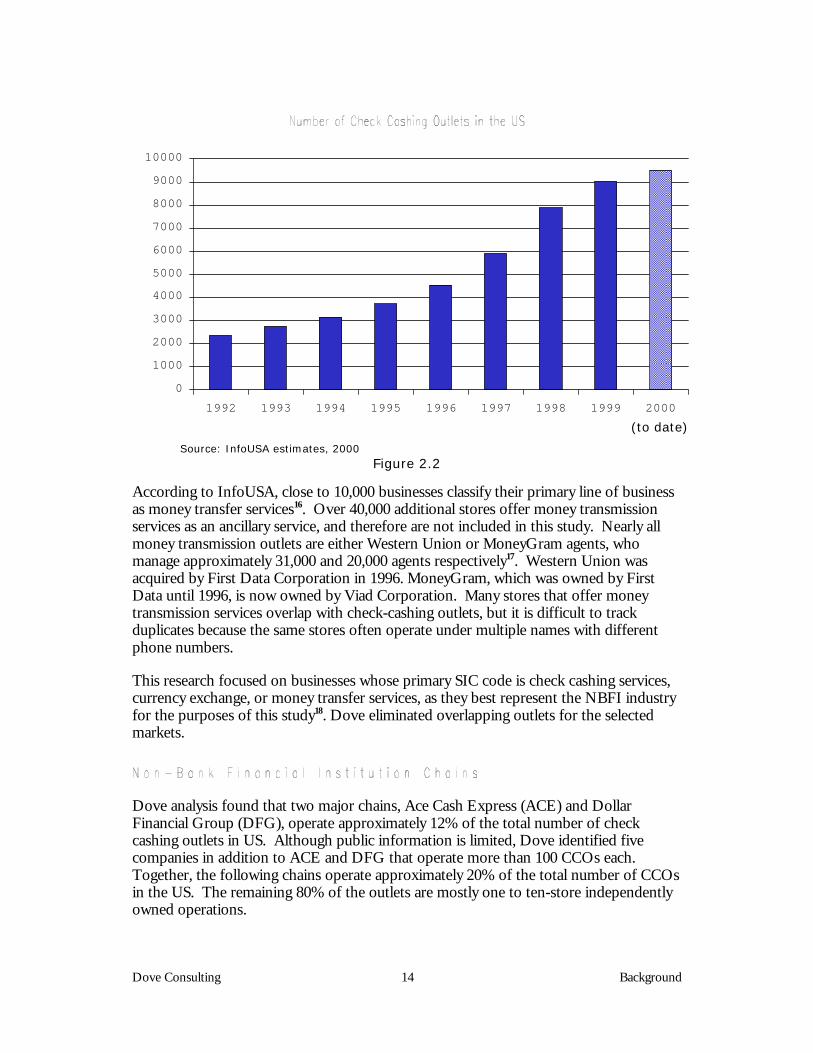
Most check cashers represent full-service NBFIs, typically offering their customers thefull range of services listed above. The check cashing industry is growing rapidly,cashing over 180 million checks annually with a face value of $60 billion, and collectingalmost $1.5 billion in fees10. InfoUSA, the largest business database company, reportsthat there are currently over 9,500 stores in the United States that classify their primaryline of business as check cashing11. This number has grown from just over 7,100 in June199812. An additional 1,300 stores listed check cashing as a secondary line of business13.Approximately 831 stores in Illinois classify their primary line of business as currencyexchange, which is local terminology for check cashing outlets14. In addition tobusinesses that list check cashing as a primary or secondary line of business, as Figure2.1 shows, thousands of financial institutions, grocery stores and liquor stores offercheck cashing services, sometimes without charging fees. This estimate does not includeapproximately 200 ATM check cashing machines−made by InnoVentry Corporation, 7-Eleven Inc., Greenland Corporation, and Ace Cash Express−that cash checks. The chartbelow estimates the growth of such firms over the last seven years15:
Dove Consulting 14 Background
������������������������������������������������������������������������������������������������������������������������������������������������������������������������������������
0
1000
2000
3000
4000
5000
6000
7000
8000
9000
10000
1992 1993 1994 1995 1996 1997 1998 1999 2000
(to date)
Source: InfoUSA estimates, 2000Figure 2.2
According to InfoUSA, close to 10,000 businesses classify their primary line of businessas money transfer services16. Over 40,000 additional stores offer money transmissionservices as an ancillary service, and therefore are not included in this study. Nearly allmoney transmission outlets are either Western Union or MoneyGram agents, whomanage approximately 31,000 and 20,000 agents respectively17. Western Union wasacquired by First Data Corporation in 1996. MoneyGram, which was owned by FirstData until 1996, is now owned by Viad Corporation. Many stores that offer moneytransmission services overlap with check-cashing outlets, but it is difficult to trackduplicates because the same stores often operate under multiple names with differentphone numbers.
This research focused on businesses whose primary SIC code is check cashing services,currency exchange, or money transfer services, as they best represent the NBFI industryfor the purposes of this study18. Dove eliminated overlapping outlets for the selectedmarkets.
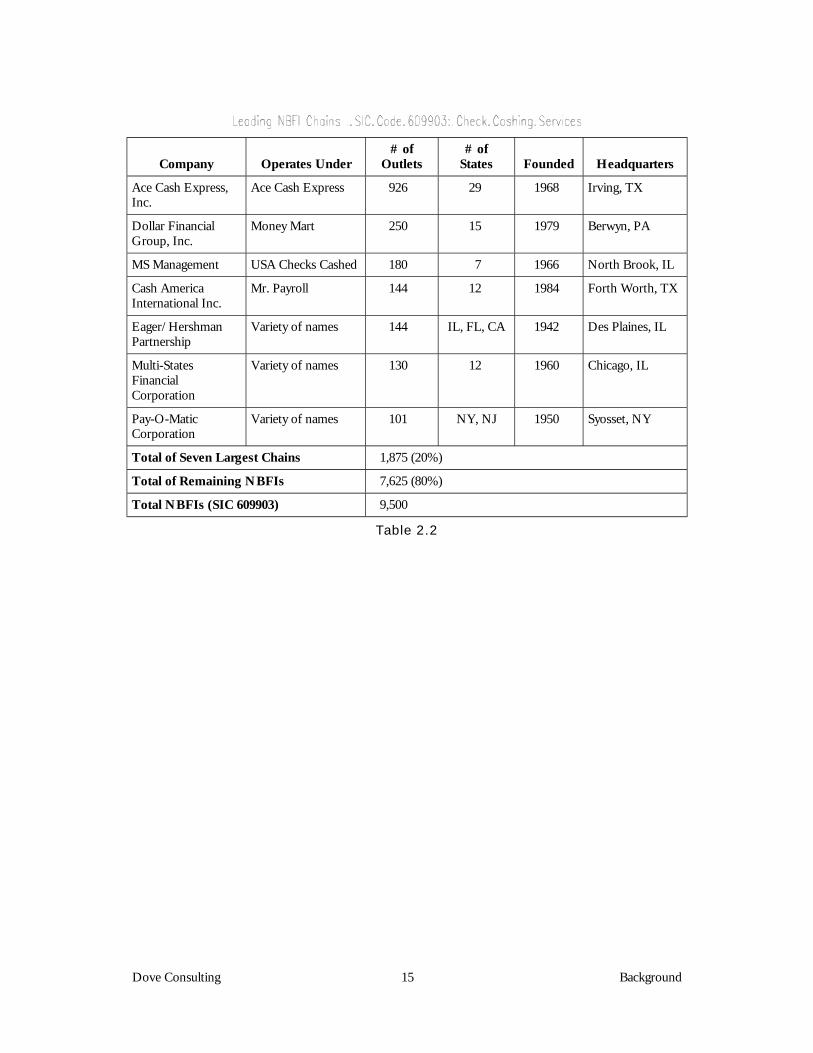
Dove analysis found that two major chains, Ace Cash Express (ACE) and DollarFinancial Group (DFG), operate approximately 12% of the total number of checkcashing outlets in US. Although public information is limited, Dove identified fivecompanies in addition to ACE and DFG that operate more than 100 CCOs each.Together, the following chains operate approximately 20% of the total number of CCOsin the US. The remaining 80% of the outlets are mostly one to ten-store independentlyowned operations.
Dove Consulting 15 Background
Company Operates Under# of
Outlets# of
States Founded Headquarters
Ace Cash Express,Inc.
Ace Cash Express 926 29 1968 Irving, TX
Dollar FinancialGroup, Inc.
Money Mart 250 15 1979 Berwyn, PA
MS Management USA Checks Cashed 180 7 1966 North Brook, IL
Cash AmericaInternational Inc.
Mr. Payroll 144 12 1984 Forth Worth, TX
Eager/HershmanPartnership
Variety of names 144 IL, FL, CA 1942 Des Plaines, IL
Multi-StatesFinancialCorporation
Variety of names 130 12 1960 Chicago, IL
Pay-O-MaticCorporation
Variety of names 101 NY, NJ 1950 Syosset, NY
Total of Seven Largest Chains 1,875 (20%)
Total of Remaining NBFIs 7,625 (80%)
Total NBFIs (SIC 609903) 9,500
Table 2.2
Dove Consulting 16 Study Objectives
The Treasury Department commissioned this study to gather empirical data andqualitative observations about NBFIs in four urban US markets. Treasury’s objective incommissioning the study was to gather new information about the rapidly growing non-bank financial services industry, including data on the number and types ofestablishments, geographical distribution, products and services offered, transactionvolumes, pricing and store profitability. Additionally, Treasury wished to gauge theavailability and demand for third-party direct deposit products in the context of theEFT’ 99 project. These products allow customers to receive payments, including federalbenefits, at an NBFI facility that are electronically deposited at a bank.
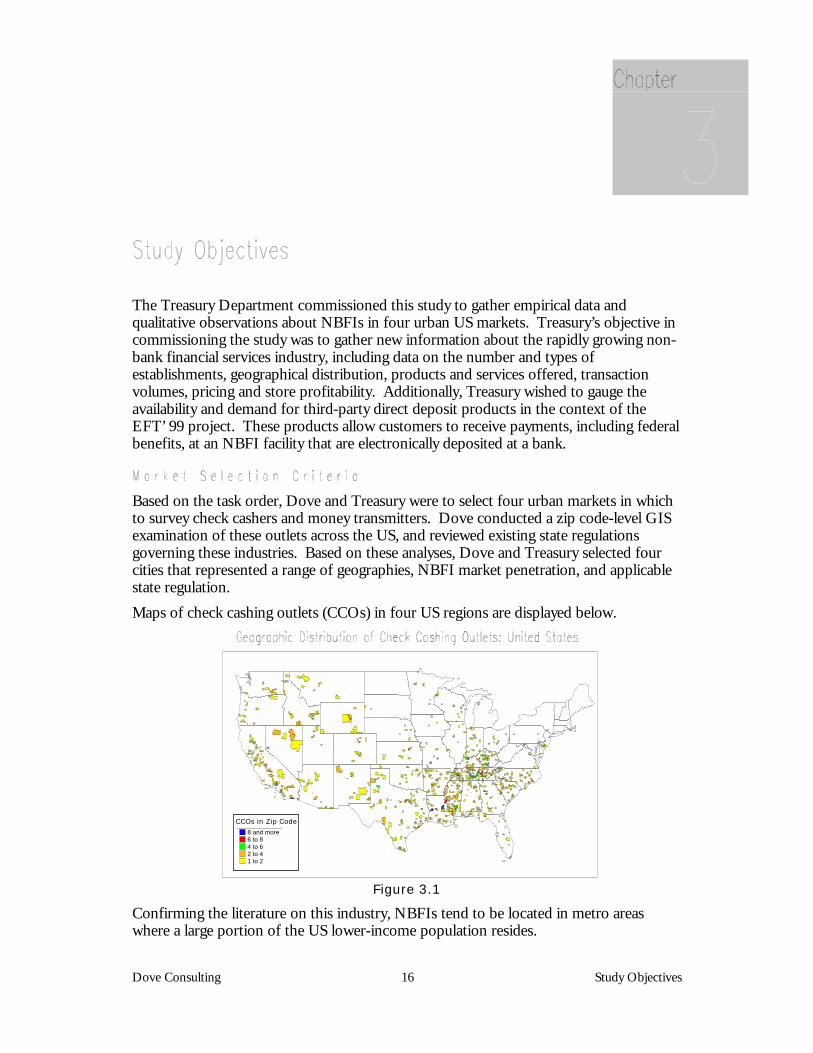
Based on the task order, Dove and Treasury were to select four urban markets in whichto survey check cashers and money transmitters. Dove conducted a zip code-level GISexamination of these outlets across the US, and reviewed existing state regulationsgoverning these industries. Based on these analyses, Dove and Treasury selected fourcities that represented a range of geographies, NBFI market penetration, and applicablestate regulation.Maps of check cashing outlets (CCOs) in four US regions are displayed below.
8 and more6 to 84 to 62 to 41 to 2
CCOs in Zip Code
Figure 3.1
Confirming the literature on this industry, NBFIs tend to be located in metro areaswhere a large portion of the US lower-income population resides.
Dove Consulting 17 Study Objectives
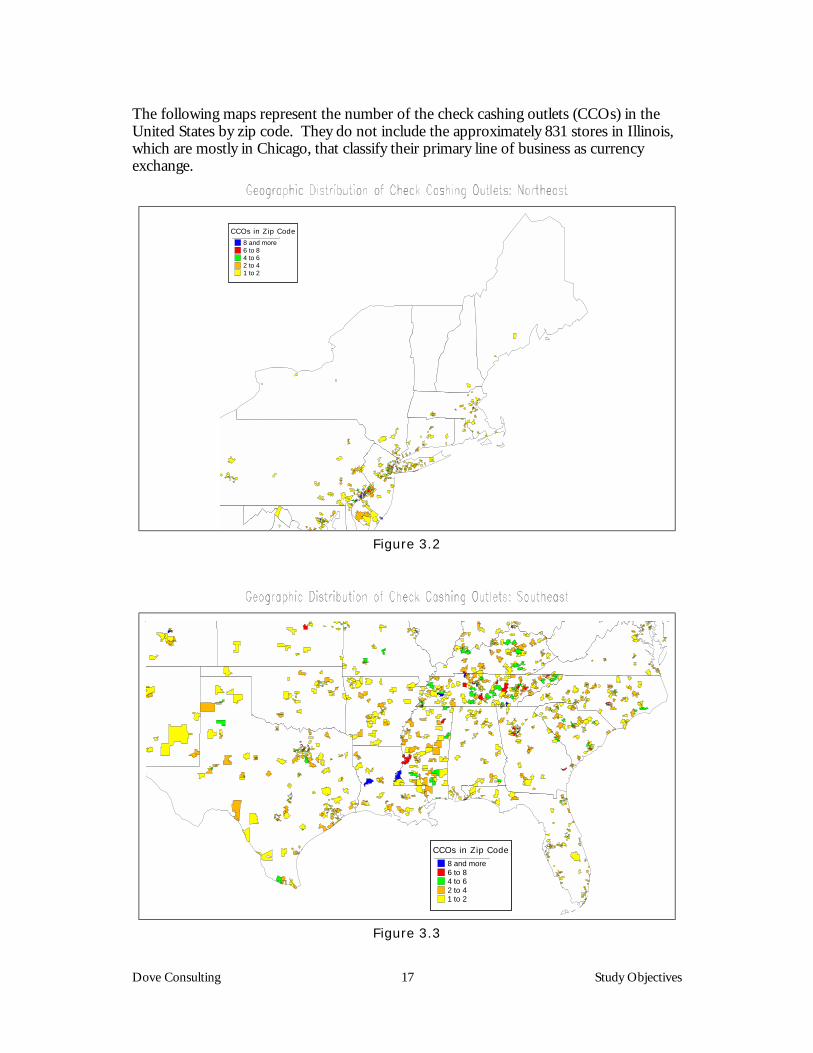
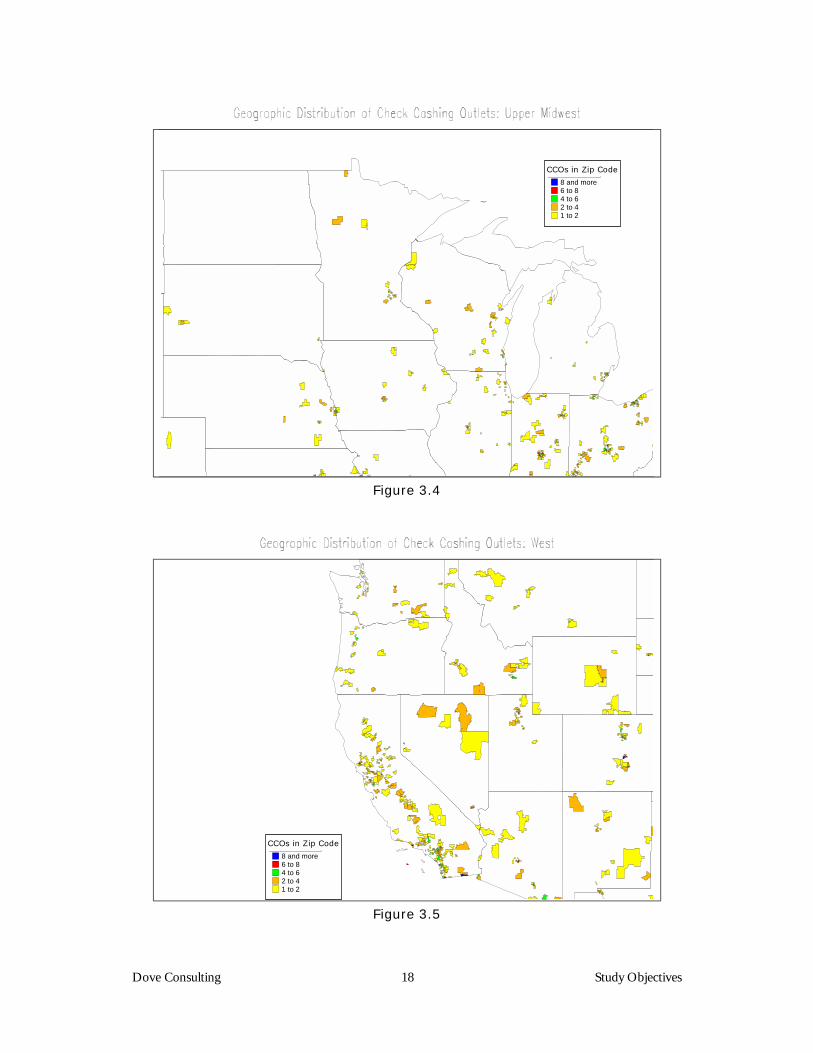
The following maps represent the number of the check cashing outlets (CCOs) in theUnited States by zip code. They do not include the approximately 831 stores in Illinois,which are mostly in Chicago, that classify their primary line of business as currencyexchange.
8 and more6 to 84 to 62 to 41 to 2
CCOs in Zip Code
Figure 3.2
8 and more6 to 84 to 62 to 41 to 2
CCOs in Zip Code
Figure 3.3
Dove Consulting 18 Study Objectives
8 and more6 to 84 to 62 to 41 to 2
CCOs in Zip Code
Figure 3.4
8 and more6 to 84 to 62 to 41 to 2
CCOs in Zip Code
Figure 3.5
Dove Consulting 19 Study Objectives
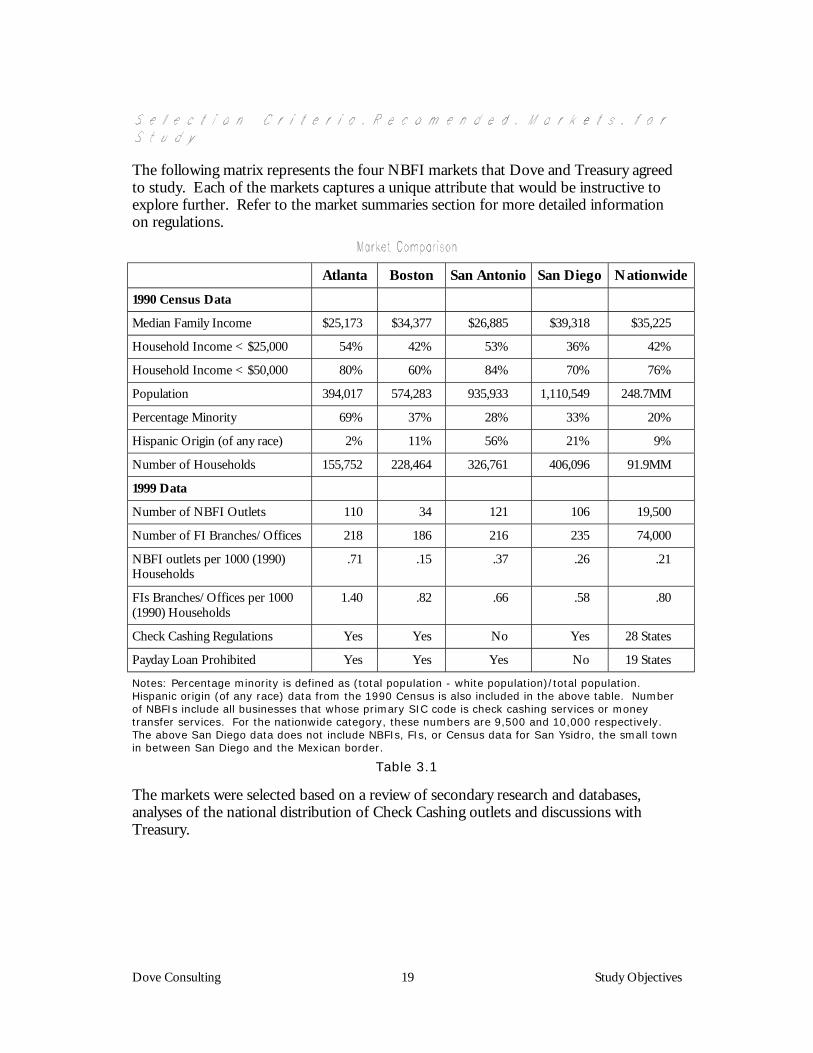
The following matrix represents the four NBFI markets that Dove and Treasury agreedto study. Each of the markets captures a unique attribute that would be instructive toexplore further. Refer to the market summaries section for more detailed informationon regulations.
Atlanta Boston San Antonio San Diego Nationwide1990 Census Data
Median Family Income $25,173 $34,377 $26,885 $39,318 $35,225
Household Income < $25,000 54% 42% 53% 36% 42%
Household Income < $50,000 80% 60% 84% 70% 76%
Population 394,017 574,283 935,933 1,110,549 248.7MM
Percentage Minority 69% 37% 28% 33% 20%
Hispanic Origin (of any race) 2% 11% 56% 21% 9%
Number of Households 155,752 228,464 326,761 406,096 91.9MM
1999 Data
Number of NBFI Outlets 110 34 121 106 19,500
Number of FI Branches/Offices 218 186 216 235 74,000
NBFI outlets per 1000 (1990)Households
.71 .15 .37 .26 .21
FIs Branches/Offices per 1000(1990) Households
1.40 .82 .66 .58 .80
Check Cashing Regulations Yes Yes No Yes 28 States
Payday Loan Prohibited Yes Yes Yes No 19 States
Notes: Percentage minority is defined as (total population - white population)/total population.Hispanic origin (of any race) data from the 1990 Census is also included in the above table. Numberof NBFIs include all businesses that whose primary SIC code is check cashing services or moneytransfer services. For the nationwide category, these numbers are 9,500 and 10,000 respectively.The above San Diego data does not include NBFIs, FIs, or Census data for San Ysidro, the small townin between San Diego and the Mexican border.
Table 3.1
The markets were selected based on a review of secondary research and databases,analyses of the national distribution of Check Cashing outlets and discussions withTreasury.
Dove Consulting 20 Research Methodology
The study was conducted with the purpose of gathering anecdotal data to provide casestudies and to provide descriptive data on the NBFI industry in each of the fourgeographic areas. Key research objectives were to gather the following information onNBFIs in each of the four markets to be studied:! Size! Products and Services! Competitive Structure! Pricing! Profitability
The population surveyed included businesses within the four selected cities that listedeither check cashing or money transmission as their primary industry classification in theInfoUSA database. This definition limited the survey population to those businessesthat derive the bulk of their revenues from one of these two activities. Exceptions weregrocery stores and pharmacies that had a separate NBFI operating on premises. Alsoexcluded from the survey population were non-depository institutions that providefinancial services other than check cashing and money transmission, such as retailforeign currency exchange outlets and travelers check issuers19.
Dove identified the number of check cashing outlets and money transmitters in eachmarket area through compiled databases and cross-verified the InfoUSA database withlocal telephone directories.
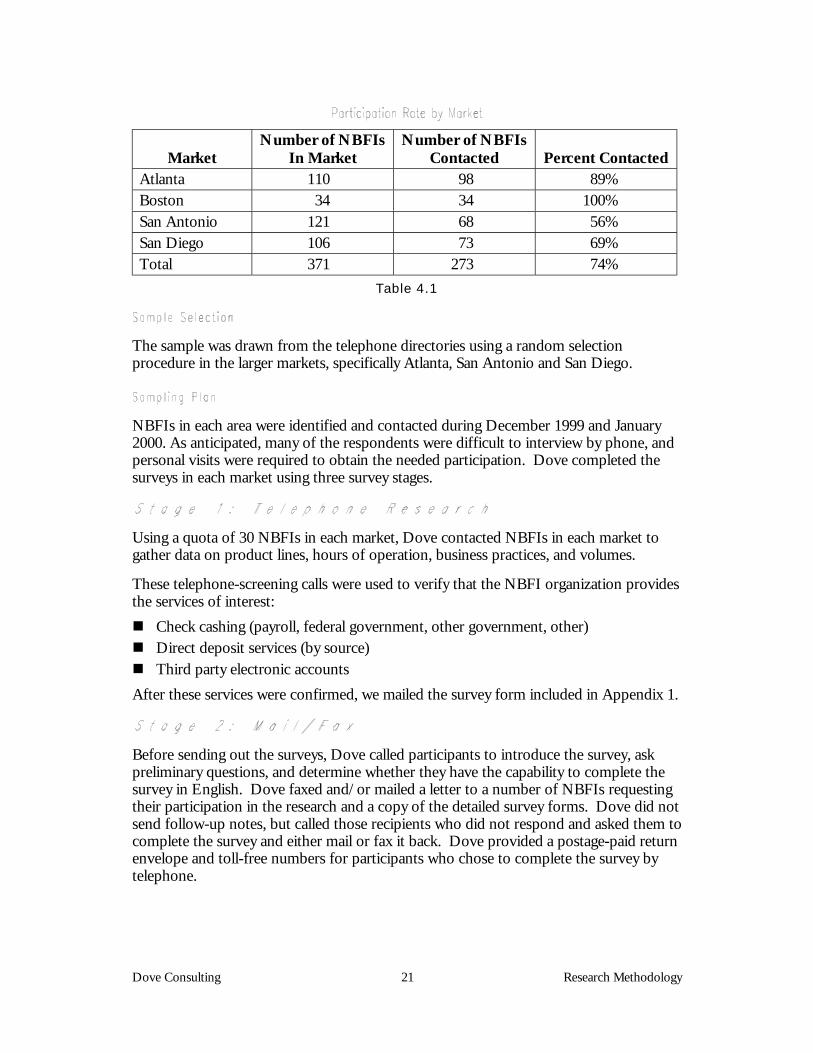
In Atlanta, San Antonio, and San Diego, a probability sample was used. Names ofNBFIs were drawn through random selection from telephone directories and otherappropriate listings for the geographies. In Boston – a smaller NBFI market – eachNBFI in the area was contacted. Overall, 74% of the NBFIs in the market areas studiedwere contacted and asked to participate in the survey.
Dove Consulting 21 Research Methodology
MarketNumber of NBFIs
In MarketNumber of NBFIs
Contacted Percent ContactedAtlanta 110 98 89%Boston 34 34 100%San Antonio 121 68 56%San Diego 106 73 69%Total 371 273 74%
Table 4.1
The sample was drawn from the telephone directories using a random selectionprocedure in the larger markets, specifically Atlanta, San Antonio and San Diego.
NBFIs in each area were identified and contacted during December 1999 and January2000. As anticipated, many of the respondents were difficult to interview by phone, andpersonal visits were required to obtain the needed participation. Dove completed thesurveys in each market using three survey stages.
Using a quota of 30 NBFIs in each market, Dove contacted NBFIs in each market togather data on product lines, hours of operation, business practices, and volumes.
These telephone-screening calls were used to verify that the NBFI organization providesthe services of interest:! Check cashing (payroll, federal government, other government, other)! Direct deposit services (by source)! Third party electronic accountsAfter these services were confirmed, we mailed the survey form included in Appendix 1.
Before sending out the surveys, Dove called participants to introduce the survey, askpreliminary questions, and determine whether they have the capability to complete thesurvey in English. Dove faxed and/or mailed a letter to a number of NBFIs requestingtheir participation in the research and a copy of the detailed survey forms. Dove did notsend follow-up notes, but called those recipients who did not respond and asked them tocomplete the survey and either mail or fax it back. Dove provided a postage-paid returnenvelope and toll-free numbers for participants who chose to complete the survey bytelephone.
Dove Consulting 22 Research Methodology
After the first wave of telephone research and mail/fax survey stages were completed,Dove conducted field observations and interviews to gather information that we couldnot have obtained otherwise. Dove field researchers used the data forms to capture datathrough both personal interviews with staff and materials provided to customers at thefacility. This permitted Dove to corroborate information gathered through prior stagesand to fill many holes that were left due to non-response.
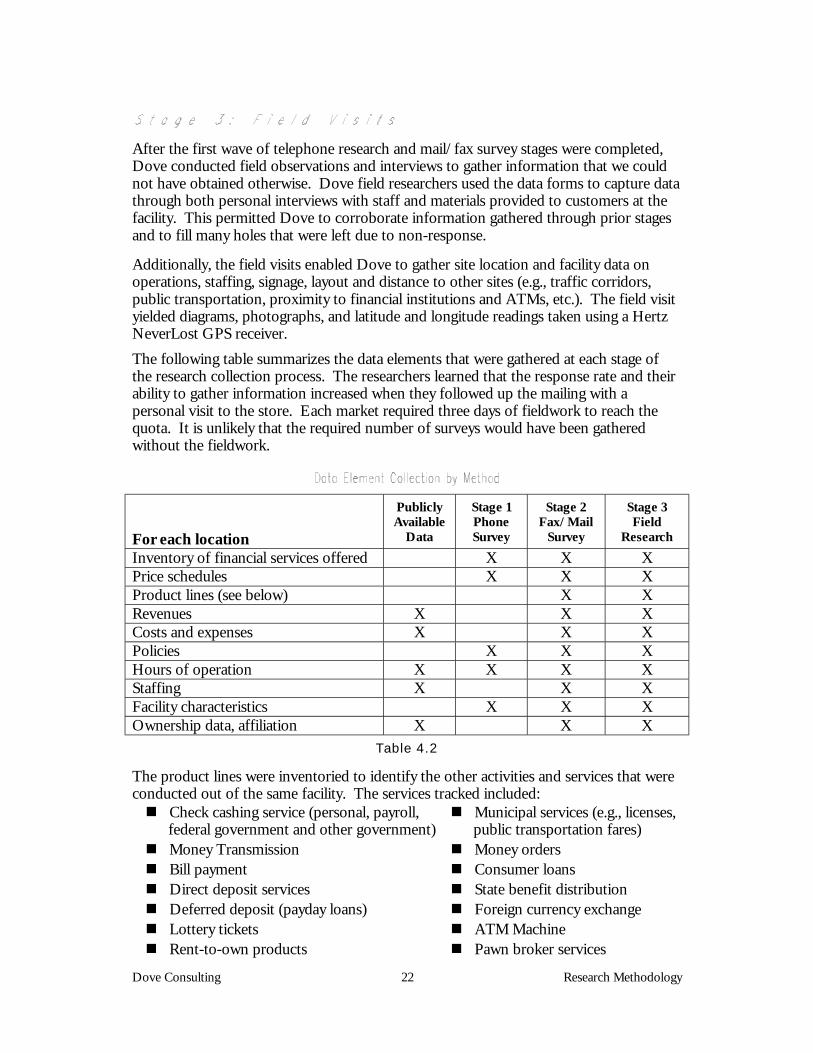
Additionally, the field visits enabled Dove to gather site location and facility data onoperations, staffing, signage, layout and distance to other sites (e.g., traffic corridors,public transportation, proximity to financial institutions and ATMs, etc.). The field visityielded diagrams, photographs, and latitude and longitude readings taken using a HertzNeverLost GPS receiver.The following table summarizes the data elements that were gathered at each stage ofthe research collection process. The researchers learned that the response rate and theirability to gather information increased when they followed up the mailing with apersonal visit to the store. Each market required three days of fieldwork to reach thequota. It is unlikely that the required number of surveys would have been gatheredwithout the fieldwork.
For each location
PubliclyAvailable
Data
Stage 1PhoneSurvey
Stage 2Fax/Mail
Survey
Stage 3Field
ResearchInventory of financial services offered X X XPrice schedules X X XProduct lines (see below) X XRevenues X X XCosts and expenses X X XPolicies X X XHours of operation X X X XStaffing X X XFacility characteristics X X XOwnership data, affiliation X X X
Table 4.2
The product lines were inventoried to identify the other activities and services that wereconducted out of the same facility. The services tracked included:! Check cashing service (personal, payroll,
federal government and other government)! Municipal services (e.g., licenses,
public transportation fares)! Money Transmission ! Money orders! Bill payment ! Consumer loans! Direct deposit services ! State benefit distribution! Deferred deposit (payday loans) ! Foreign currency exchange! Lottery tickets ! ATM Machine! Rent-to-own products ! Pawn broker services
Dove Consulting 23 Survey Administration
The survey was conducted using a six-page long paper-based questionnaire. A draftversion was developed and was pilot tested in Boston. Based on feedback from the pilottest, several revisions were made to the format, flow and wording of the questions.Suggestions from Treasury and OMB staff were incorporated into the structure of therevenue and cost questions on pages 5 and 6. A copy of the survey form is included inAppendix 1.
After receiving Treasury and OMB approval for the survey form OMB # 1505-0173 onDecember 16, 1999, Dove immediately started to administer the survey in the fourgeographic areas using the methodology described in Chapter 4.
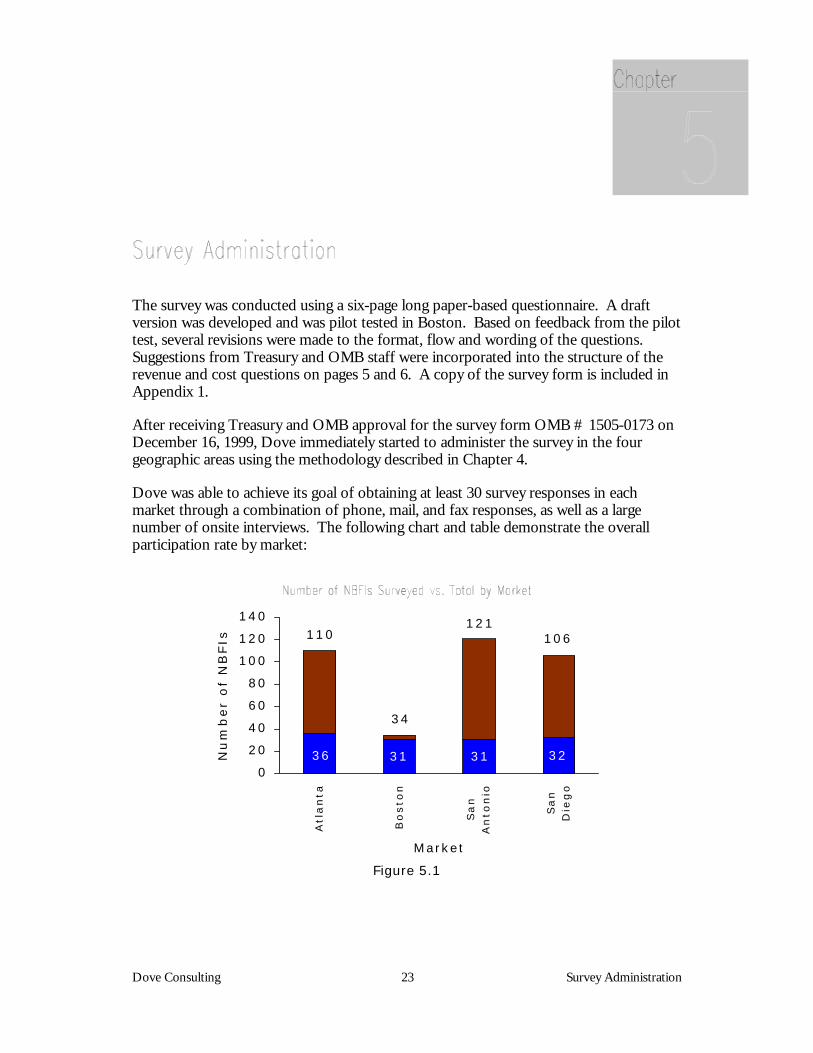
Dove was able to achieve its goal of obtaining at least 30 survey responses in eachmarket through a combination of phone, mail, and fax responses, as well as a largenumber of onsite interviews. The following chart and table demonstrate the overallparticipation rate by market:
36 31 31 32
110
34
121106
0
20
40
60
80
100
120
140
Atl
an
ta
Bo
sto
n
Sa
nA
nto
nio
Sa
nD
ieg
o
M arket
Nu
mb
er
of
NB
FIs
Figure 5.1
Dove Consulting 24 Survey Administration
Atlanta Boston San Antonio San Diego Overall
# % # % # % # % # %
Total NBFIs* (InfoUSA) 110 34 121 106 371
NBFIs surveyed 98 34 68 73 273
Participating NBFIs 36 37% 31 91% 31 46% 32 44% 130 48%
Total Chain NBFIs (InfoUSA) 30 20 57 30 135
Participating Chain NBFIs 18 60% 20 100% 26 46% 7 23% 71 53%
Total Indep. NBFIs (InfoUSA) 80 14 64 76 236
Participating Indep. NBFIs 18 23% 11 79% 5 8% 25 33% 59 25%
Participating Chain NBFIs 18 50% 20 65% 26 84% 7 22% 71 55%
Participating Indep. NBFIs 18 50% 11 35% 5 16% 25 78% 59 45%
* InfoUSA's database is primarily gathered through yellow and white page listings. InfoUSA representativesverify that the database is updated on a monthly basis.
Table 5.1
Overall, the respondent population contains slightly more chain outlets thanindependent outlets (55% to 45%). Among respondents, the chains are represented atabout twice the rate that respondents are among their respective populations (53% to25%).
In Atlanta, Boston and San Antonio, chains are represented at a higher rate in therespondent sample, and as a percentage of their total population. This is especiallypronounced in San Antonio, where 84% of the respondents were chains, and 46% of allchains responded versus 8% of independents. In San Diego, the reverse was true – 78%of respondents were independents, and 33% of all independents responded versus 23%of chains.
Dove Consulting 25 Key Observations
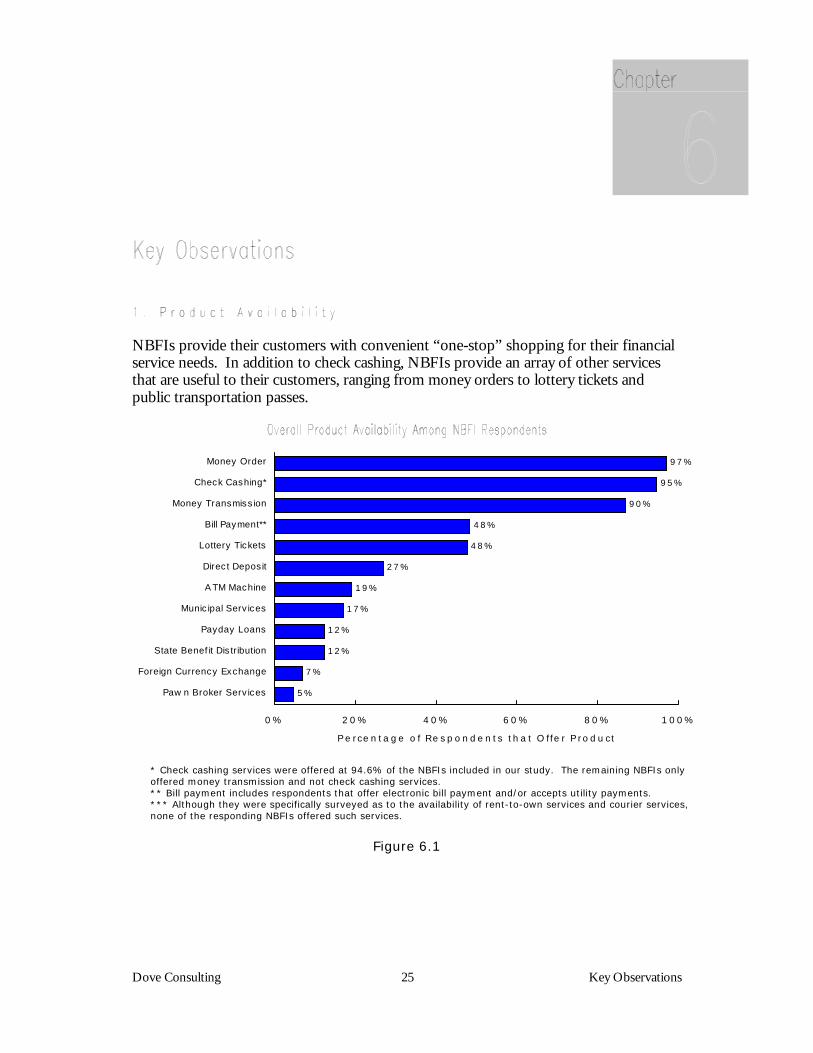
NBFIs provide their customers with convenient “one-stop” shopping for their financialservice needs. In addition to check cashing, NBFIs provide an array of other servicesthat are useful to their customers, ranging from money orders to lottery tickets andpublic transportation passes.
5%
7%
12%
12%
17%
19%
27%
48%
48%
90%
95%
97%
0 % 2 0 % 4 0 % 6 0 % 8 0 % 1 0 0%
Paw n Broker Serv ices
Foreign Currency Exchange
State Benef it Dis tribution
Payday Loans
Munic ipal Serv ices
A TM Machine
Direc t Deposit
Lottery Tickets
Bill Payment**
Money Transmiss ion
Check Cashing*
Money Order
P e rce n ta ge o f Re s p o n de n ts th a t O ffe r P ro d u ct
* Check cashing services were offered at 94.6% of the NBFIs included in our study. The remaining NBFIs onlyoffered money transmission and not check cashing services.** Bill payment includes respondents that offer electronic bill payment and/or accepts utility payments.*** Although they were specifically surveyed as to the availability of rent-to-own services and courier services,none of the responding NBFIs offered such services.
Figure 6.1
Dove Consulting 26 Key Observations
Check cashing was available at all NBFIs surveyed, except for seven NBFIs in Bostonthat offered money transmission but not check cashing. In terms of the types of checksthat the surveyed NBFIs cashed, payroll check cashing was the most widely available,followed by government check cashing and then personal check cashing. NBFIsgenerally either cashed all types of government checks – federal, state and local – ornone at all20.
Other than check cashing, the two other widely available products were money orders(97% of outlets surveyed) and money transmission (87% of outlets surveyed). Therewere some variations in the availability of these products across markets. For instance,money orders were almost universally available in all four of the cities, and in SanAntonio, 100% of surveyed outlets offered money orders. Money transmission wasslightly more difficult to find. While 100% of Boston outlets offered this service, only75% of Atlanta outlets and 78% of San Diego outlets offered the service.
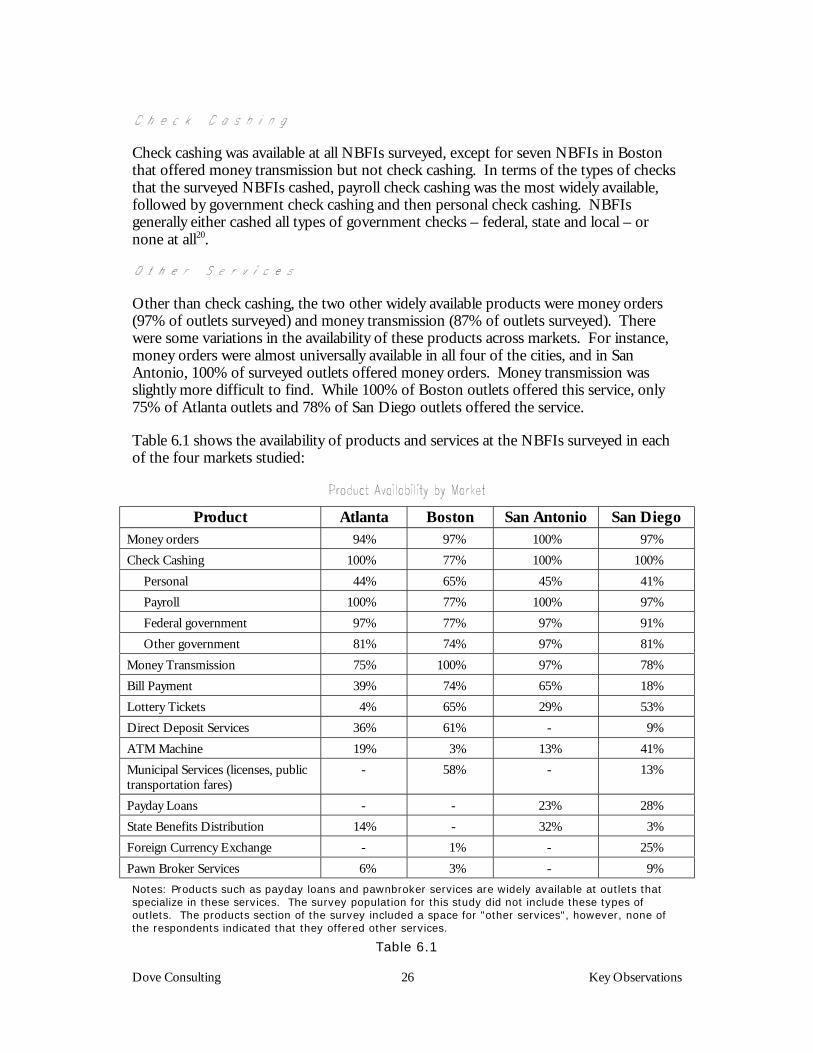
Table 6.1 shows the availability of products and services at the NBFIs surveyed in eachof the four markets studied:
Product Atlanta Boston San Antonio San DiegoMoney orders 94% 97% 100% 97%Check Cashing 100% 77% 100% 100% Personal 44% 65% 45% 41% Payroll 100% 77% 100% 97% Federal government 97% 77% 97% 91% Other government 81% 74% 97% 81%Money Transmission 75% 100% 97% 78%Bill Payment 39% 74% 65% 18%Lottery Tickets 4% 65% 29% 53%Direct Deposit Services 36% 61% - 9%ATM Machine 19% 3% 13% 41%Municipal Services (licenses, publictransportation fares)
- 58% - 13%
Payday Loans - - 23% 28%State Benefits Distribution 14% - 32% 3%Foreign Currency Exchange - 1% - 25%Pawn Broker Services 6% 3% - 9%Notes: Products such as payday loans and pawnbroker services are widely available at outlets thatspecialize in these services. The survey population for this study did not include these types ofoutlets. The products section of the survey included a space for "other services", however, none ofthe respondents indicated that they offered other services.
Table 6.1
Dove Consulting 27 Key Observations
Dove identified two types of direct deposit products available at NBFIs in the marketsstudied. The first type of product sends federal payments electronically to an ATMcard-accessible account. The other type of product allows the NBFI to charge thecustomer a fee for printing his/her federal check. Once the check is printed, the NBFItypically charges the customer its standard fee to cash the check. Although 35 of the 130responding (27%) NBFIs offer direct deposit service products through Western Union,Corus Bank, Bank of Delaware, River City Bank, and Bank of Agriculture andCommerce, very few customers have signed up. Among the 27% of NBFIs that offerthese products, the average number of direct deposit customers per store is 22. Incontrast, the average outlet that cashes federal government checks cashes about 200monthly. NBFI managers attributed this to the marginal benefits provided to thecustomer from these products, which also tend to require additional fees without addingconvenience. NBFIs do not benefit either, particularly when they lose their checkcashing fee and instead earn a small commission for a customer signing up for a WesternUnion Cash Card or Delaware Bank Card.
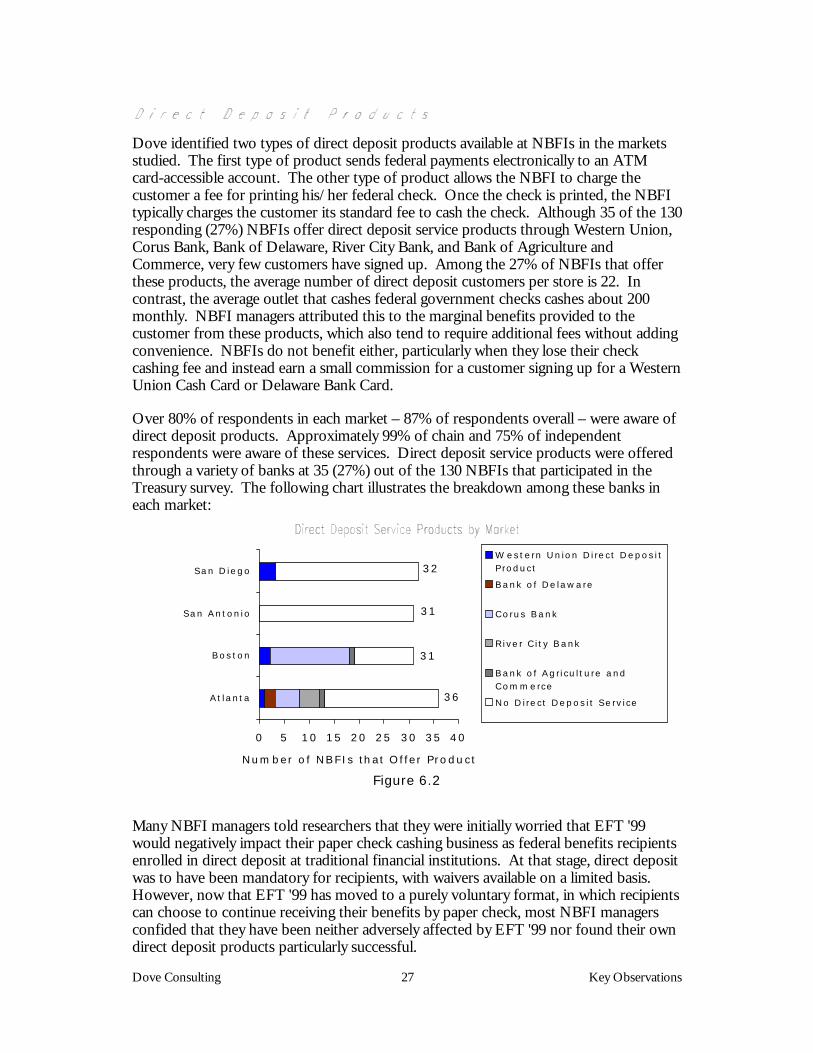
Over 80% of respondents in each market – 87% of respondents overall – were aware ofdirect deposit products. Approximately 99% of chain and 75% of independentrespondents were aware of these services. Direct deposit service products were offeredthrough a variety of banks at 35 (27%) out of the 130 NBFIs that participated in theTreasury survey. The following chart illustrates the breakdown among these banks ineach market:
36
31
31
32
0 5 10 15 20 25 30 35 40
At lanta
Bos ton
San Antonio
San D iego
Number o f NBFIs that O ffer Product
W este rn Union Dire ct Depos itP roduct
Bank o f De laware
Corus Bank
Rive r C ity Bank
Bank o f Agriculture andCommerce
No D ire ct Depos it Se rvice
Figure 6.2
Many NBFI managers told researchers that they were initially worried that EFT '99would negatively impact their paper check cashing business as federal benefits recipientsenrolled in direct deposit at traditional financial institutions. At that stage, direct depositwas to have been mandatory for recipients, with waivers available on a limited basis.However, now that EFT '99 has moved to a purely voluntary format, in which recipientscan choose to continue receiving their benefits by paper check, most NBFI managersconfided that they have been neither adversely affected by EFT '99 nor found their owndirect deposit products particularly successful.
Dove Consulting 28 Key Observations
Western Union offers two direct deposit products, Benefits Quick Cash and Cash Card,through Western Union Industrial Bank in Colorado.! Benefits Quick Cash allows customers to have Western Union wire their federal
checks to any Western Union agent. The customer pays a fee of $7.50 per monthfor this service, and can receive his or her money in cash or check.
! The Western Union Cash Card enables customers to receive a direct deposit of bothpayroll and Federal benefit checks. On the payment date, Federal recipientpayments are electronically deposited by the paying agency into the recipient's FDICinsured account at Western Union Industrial Bank in Colorado. The recipient'sfunds are then immediately transferred into a non-FDIC insured account in therecipient's name at the same bank. Customers can withdraw cash from their accountat any participating Western Union agent or at any PLUS or MAC ATM. They canalso use the card to make a purchase at any PLUS or MAC point-of-sale (POS)terminal. Western Union charges a monthly maintenance fee of $5.50 plus $1.00 foreach Western Union agent withdrawal or ATM transaction. The customer may incuran additional ATM surcharge as well. Western Union charges $0.50 for each POStransaction. Western Union provides cardholders with a toll-free customer servicenumber.
DBC Financial Inc. offers an ATM card product (Delaware Bank Card) for which theycharge a set-up fee of $19.95, a monthly account service fee of $9.95, and a cancellationfee of $39.95. On the payment date, Federal recipient payments are electronicallydeposited by the paying agency into the recipient's FDIC insured account at CountyBank in Rehoboth Beach, Delaware. Customers can withdraw cash from their accountat any PLUS or MAC ATM. They can also use the card to make a purchase at anyPLUS or MAC point-of-sale (POS) terminal. Delaware Bank Card charges $0.95 foreach ATM cash withdrawal, and the customer may incur an additional ATM surcharge aswell. Delaware Bank Card charges $0.95 for each POS transaction. Delaware Bank Cardprovides cardholders with a toll-free customer service number. DBC Financial Inc. hasrecently stopped marketing their Delaware Bank Card product through check cashingoutlets and is currently completely redesigning their product and marketing plan.
Corus Bank offers a direct deposit product called SecureCheck through NBFI chains inBoston and Atlanta. This product allows NBFIs to print their customer's monthlyfederal check for a fee of $1.50. The customer then pays a standard check cashing fee toreceive a cash payment.
River City Bank offers a product that is similar to the Corus Bank direct deposit product.This product allows NBFIs to print their customer's federal check for a fee of $2.95 pertransaction. The customer then pays a standard check cashing fee to receive a cashpayment.
Bank of Agriculture and Commerce also offers a product that is similar to the CorusBank direct deposit product. This product allows NBFIs to print a customer's federalcheck for a fee of $3.00 per transaction. The customer then pays a standard checkcashing fee to receive a cash payment.
Dove Consulting 29 Key Observations
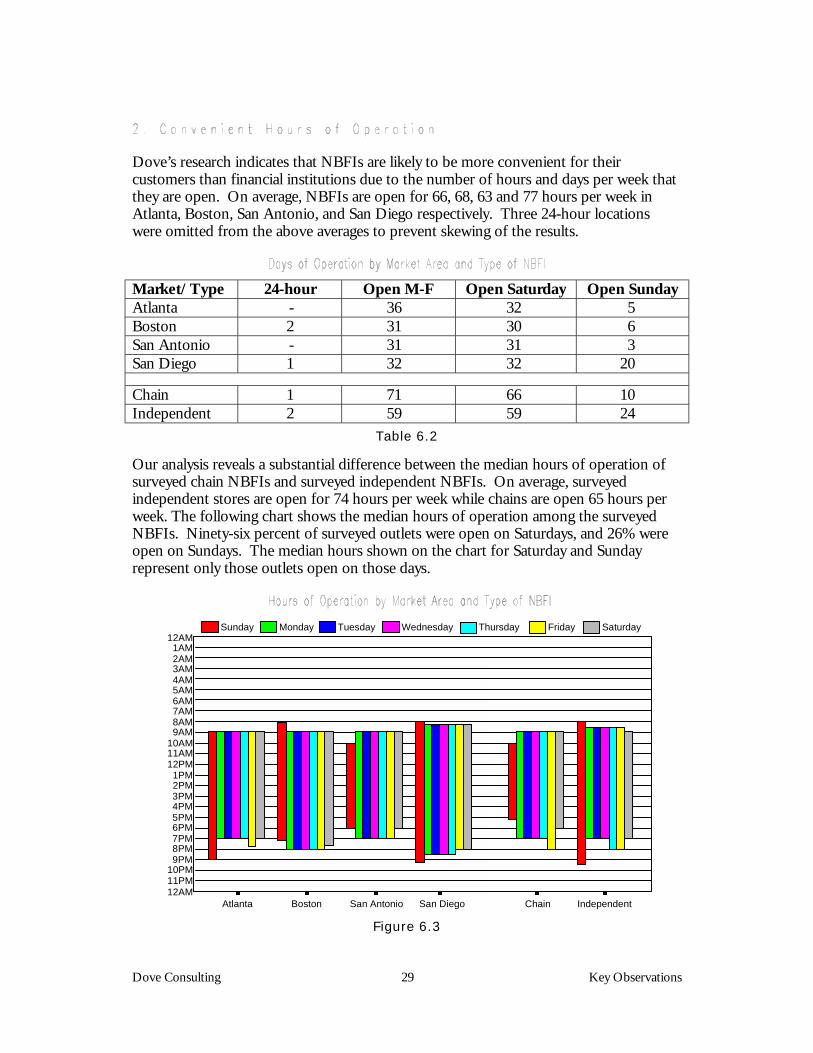
Dove’s research indicates that NBFIs are likely to be more convenient for theircustomers than financial institutions due to the number of hours and days per week thatthey are open. On average, NBFIs are open for 66, 68, 63 and 77 hours per week inAtlanta, Boston, San Antonio, and San Diego respectively. Three 24-hour locationswere omitted from the above averages to prevent skewing of the results.
Market/Type 24-hour Open M-F Open Saturday Open SundayAtlanta - 36 32 5Boston 2 31 30 6San Antonio - 31 31 3San Diego 1 32 32 20
Chain 1 71 66 10Independent 2 59 59 24
Table 6.2
Our analysis reveals a substantial difference between the median hours of operation ofsurveyed chain NBFIs and surveyed independent NBFIs. On average, surveyedindependent stores are open for 74 hours per week while chains are open 65 hours perweek. The following chart shows the median hours of operation among the surveyedNBFIs. Ninety-six percent of surveyed outlets were open on Saturdays, and 26% wereopen on Sundays. The median hours shown on the chart for Saturday and Sundayrepresent only those outlets open on those days.
San DiegoSan AntonioBostonAtlanta
12AM 1AM 2AM 3AM 4AM 5AM 6AM 7AM 8AM 9AM10AM11AM12PM 1PM 2PM3PM4PM5PM6PM7PM8PM9PM
10PM 11PM12AM
Sunday Monday Tuesday Wednesday Thursday Friday Saturday
Chain Independent
Figure 6.3
Dove Consulting 30 Key Observations
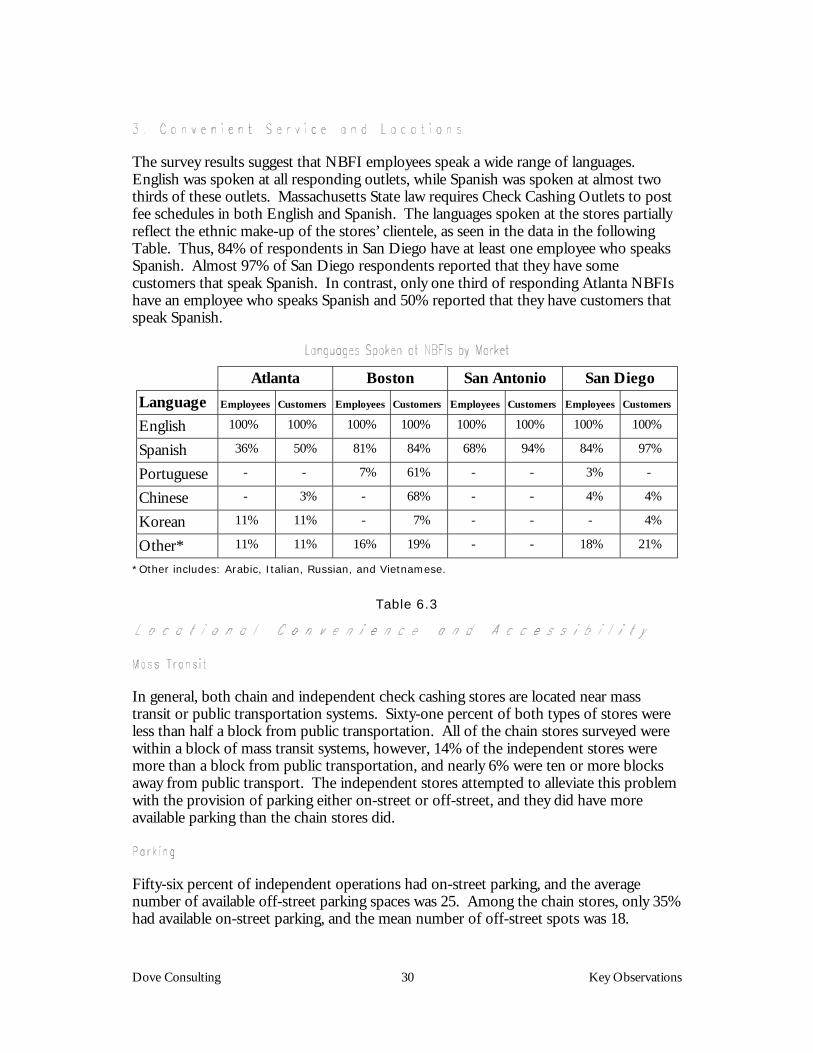
The survey results suggest that NBFI employees speak a wide range of languages.English was spoken at all responding outlets, while Spanish was spoken at almost twothirds of these outlets. Massachusetts State law requires Check Cashing Outlets to postfee schedules in both English and Spanish. The languages spoken at the stores partiallyreflect the ethnic make-up of the stores’ clientele, as seen in the data in the followingTable. Thus, 84% of respondents in San Diego have at least one employee who speaksSpanish. Almost 97% of San Diego respondents reported that they have somecustomers that speak Spanish. In contrast, only one third of responding Atlanta NBFIshave an employee who speaks Spanish and 50% reported that they have customers thatspeak Spanish.
Atlanta Boston San Antonio San DiegoLanguage Employees Customers Employees Customers Employees Customers Employees Customers
English 100% 100% 100% 100% 100% 100% 100% 100%
Spanish 36% 50% 81% 84% 68% 94% 84% 97%
Portuguese - - 7% 61% - - 3% -
Chinese - 3% - 68% - - 4% 4%
Korean 11% 11% - 7% - - - 4%
Other* 11% 11% 16% 19% - - 18% 21%
*Other includes: Arabic, Italian, Russian, and Vietnamese.
Table 6.3
In general, both chain and independent check cashing stores are located near masstransit or public transportation systems. Sixty-one percent of both types of stores wereless than half a block from public transportation. All of the chain stores surveyed werewithin a block of mass transit systems, however, 14% of the independent stores weremore than a block from public transportation, and nearly 6% were ten or more blocksaway from public transport. The independent stores attempted to alleviate this problemwith the provision of parking either on-street or off-street, and they did have moreavailable parking than the chain stores did.
Fifty-six percent of independent operations had on-street parking, and the averagenumber of available off-street parking spaces was 25. Among the chain stores, only 35%had available on-street parking, and the mean number of off-street spots was 18.
Dove Consulting 31 Key Observations
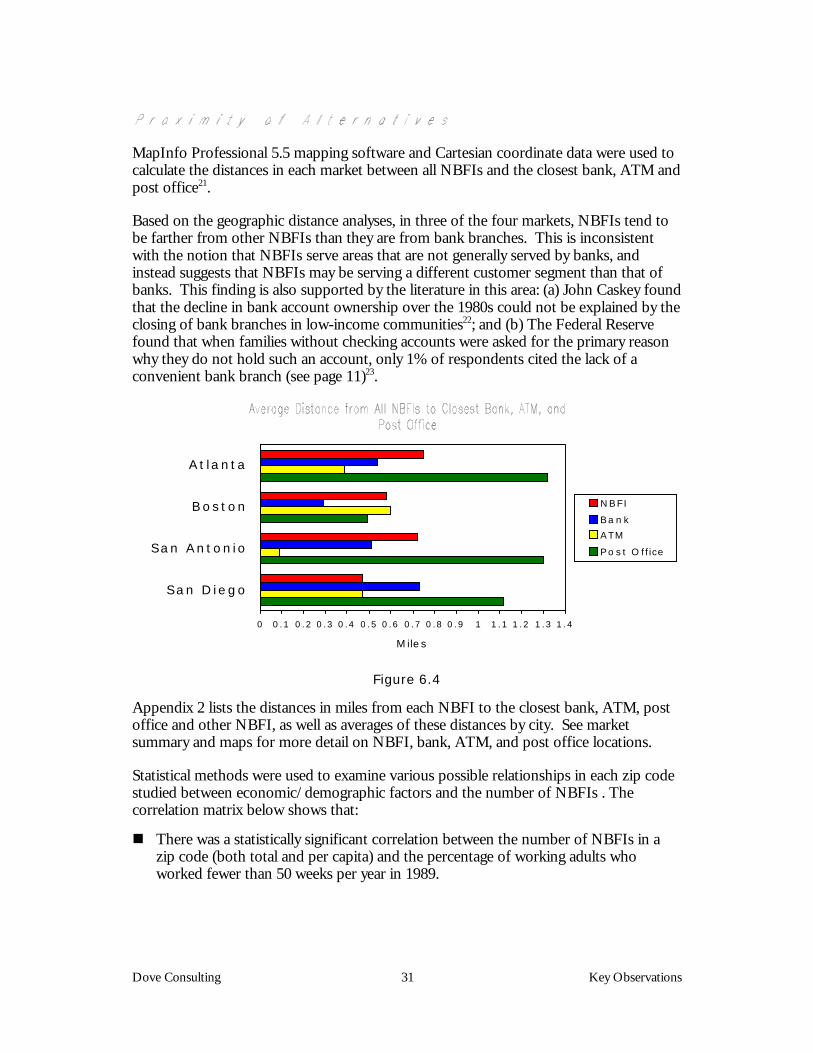
MapInfo Professional 5.5 mapping software and Cartesian coordinate data were used tocalculate the distances in each market between all NBFIs and the closest bank, ATM andpost office21.
Based on the geographic distance analyses, in three of the four markets, NBFIs tend tobe farther from other NBFIs than they are from bank branches. This is inconsistentwith the notion that NBFIs serve areas that are not generally served by banks, andinstead suggests that NBFIs may be serving a different customer segment than that ofbanks. This finding is also supported by the literature in this area: (a) John Caskey foundthat the decline in bank account ownership over the 1980s could not be explained by theclosing of bank branches in low-income communities22; and (b) The Federal Reservefound that when families without checking accounts were asked for the primary reasonwhy they do not hold such an account, only 1% of respondents cited the lack of aconvenient bank branch (see page 11)23.
0 0.1 0.2 0.3 0.4 0.5 0.6 0.7 0.8 0.9 1 1.1 1.2 1.3 1.4
San D iego
San Antonio
Bos ton
At la nta
M iles
NBFI
Ba n k
ATM
P o s t O ffice
Figure 6.4
Appendix 2 lists the distances in miles from each NBFI to the closest bank, ATM, postoffice and other NBFI, as well as averages of these distances by city. See marketsummary and maps for more detail on NBFI, bank, ATM, and post office locations.
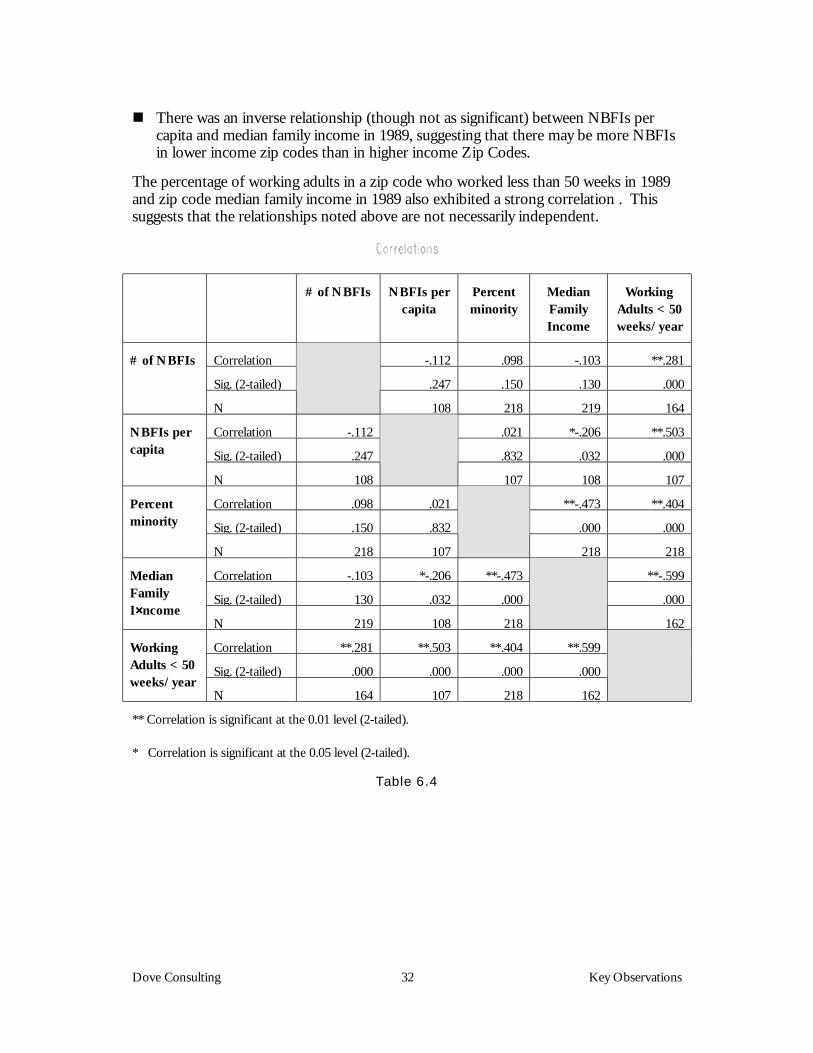
Statistical methods were used to examine various possible relationships in each zip codestudied between economic/demographic factors and the number of NBFIs . Thecorrelation matrix below shows that:
! There was a statistically significant correlation between the number of NBFIs in azip code (both total and per capita) and the percentage of working adults whoworked fewer than 50 weeks per year in 1989.
Dove Consulting 32 Key Observations
! There was an inverse relationship (though not as significant) between NBFIs percapita and median family income in 1989, suggesting that there may be more NBFIsin lower income zip codes than in higher income Zip Codes.
The percentage of working adults in a zip code who worked less than 50 weeks in 1989and zip code median family income in 1989 also exhibited a strong correlation . Thissuggests that the relationships noted above are not necessarily independent.
# of NBFIs NBFIs percapita
Percentminority
MedianFamilyIncome
WorkingAdults < 50weeks/year
Correlation -.112 .098 -.103 **.281
Sig. (2-tailed) .247 .150 .130 .000
# of NBFIs
N 108 218 219 164
Correlation -.112 .021 *-.206 **.503
Sig. (2-tailed) .247 .832 .032 .000
NBFIs percapita
N 108 107 108 107
Correlation .098 .021 **-.473 **.404
Sig. (2-tailed) .150 .832 .000 .000
Percentminority
N 218 107 218 218
Correlation -.103 *-.206 **-.473 **-.599
Sig. (2-tailed) 130 .032 .000 .000
MedianFamilyI××××ncome
N 219 108 218 162
Correlation **.281 **.503 **.404 **.599
Sig. (2-tailed) .000 .000 .000 .000
WorkingAdults < 50weeks/year
N 164 107 218 162
** Correlation is significant at the 0.01 level (2-tailed).
* Correlation is significant at the 0.05 level (2-tailed).
Table 6.4
Dove Consulting 33 Key Observations
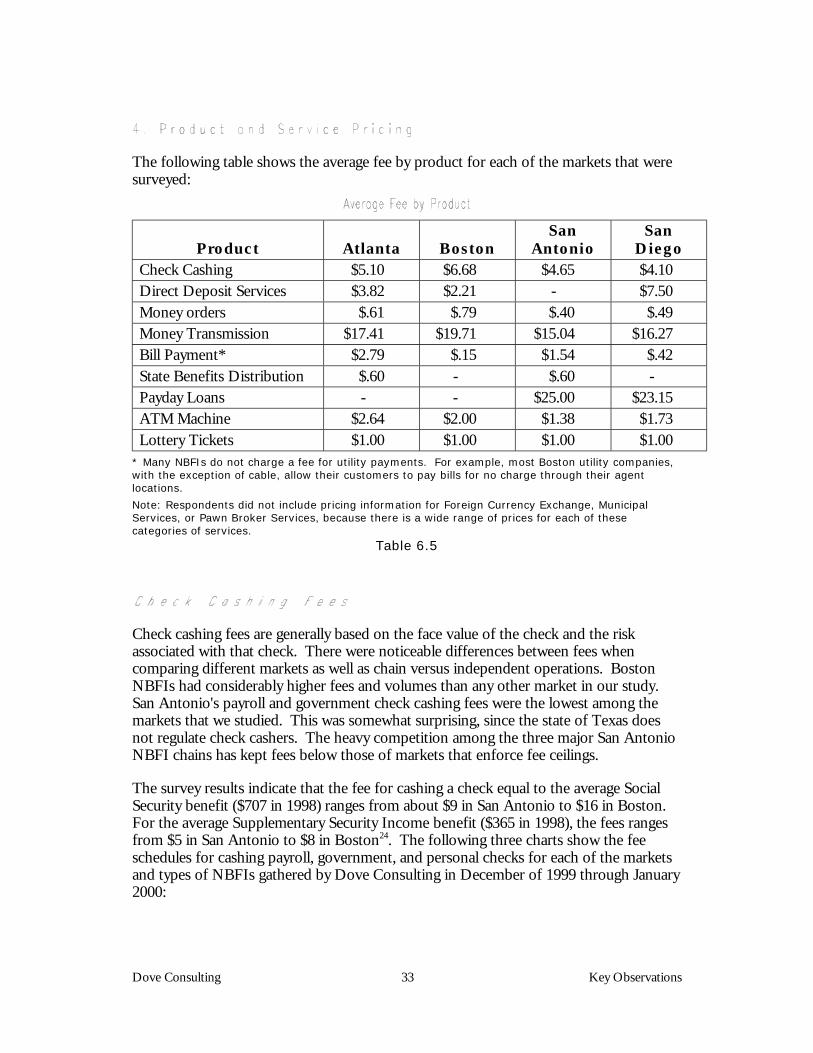
The following table shows the average fee by product for each of the markets that weresurveyed:
Product Atlanta BostonSan
AntonioSan
DiegoCheck Cashing $5.10 $6.68 $4.65 $4.10Direct Deposit Services $3.82 $2.21 - $7.50Money orders $.61 $.79 $.40 $.49Money Transmission $17.41 $19.71 $15.04 $16.27Bill Payment* $2.79 $.15 $1.54 $.42State Benefits Distribution $.60 - $.60 -Payday Loans - - $25.00 $23.15ATM Machine $2.64 $2.00 $1.38 $1.73Lottery Tickets $1.00 $1.00 $1.00 $1.00
* Many NBFIs do not charge a fee for utility payments. For example, most Boston utility companies,with the exception of cable, allow their customers to pay bills for no charge through their agentlocations.
Note: Respondents did not include pricing information for Foreign Currency Exchange, MunicipalServices, or Pawn Broker Services, because there is a wide range of prices for each of thesecategories of services.
Table 6.5
Check cashing fees are generally based on the face value of the check and the riskassociated with that check. There were noticeable differences between fees whencomparing different markets as well as chain versus independent operations. BostonNBFIs had considerably higher fees and volumes than any other market in our study.San Antonio's payroll and government check cashing fees were the lowest among themarkets that we studied. This was somewhat surprising, since the state of Texas doesnot regulate check cashers. The heavy competition among the three major San AntonioNBFI chains has kept fees below those of markets that enforce fee ceilings.
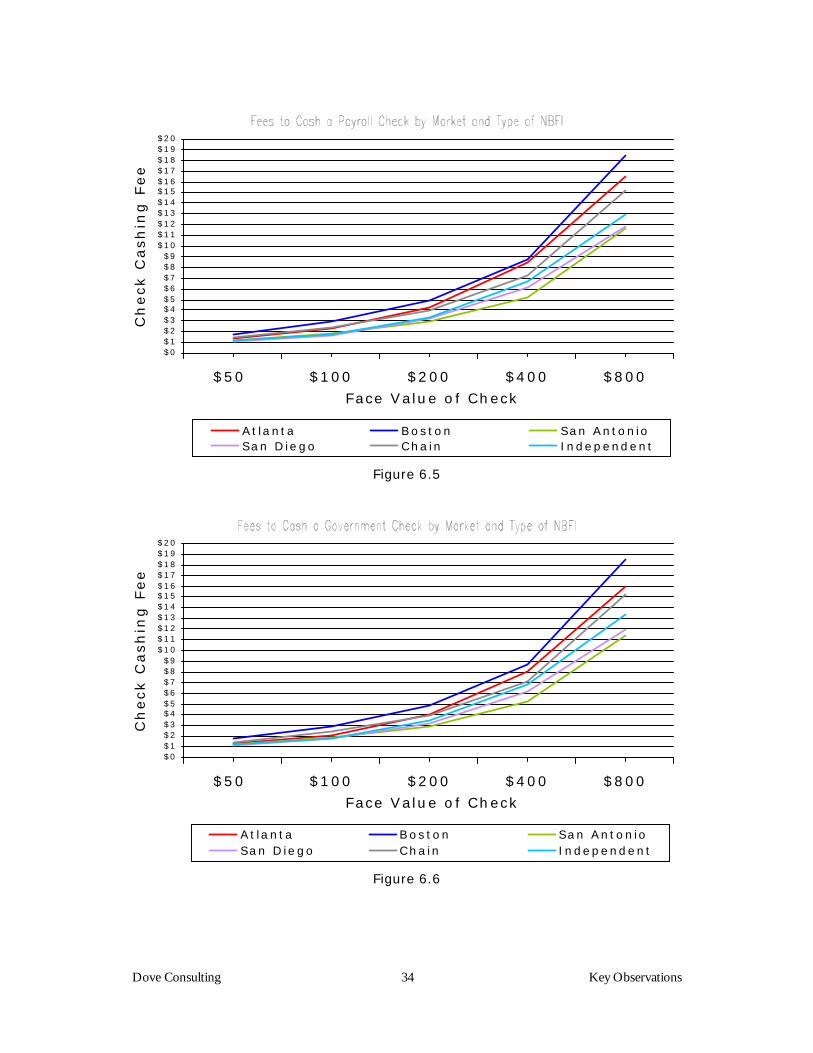
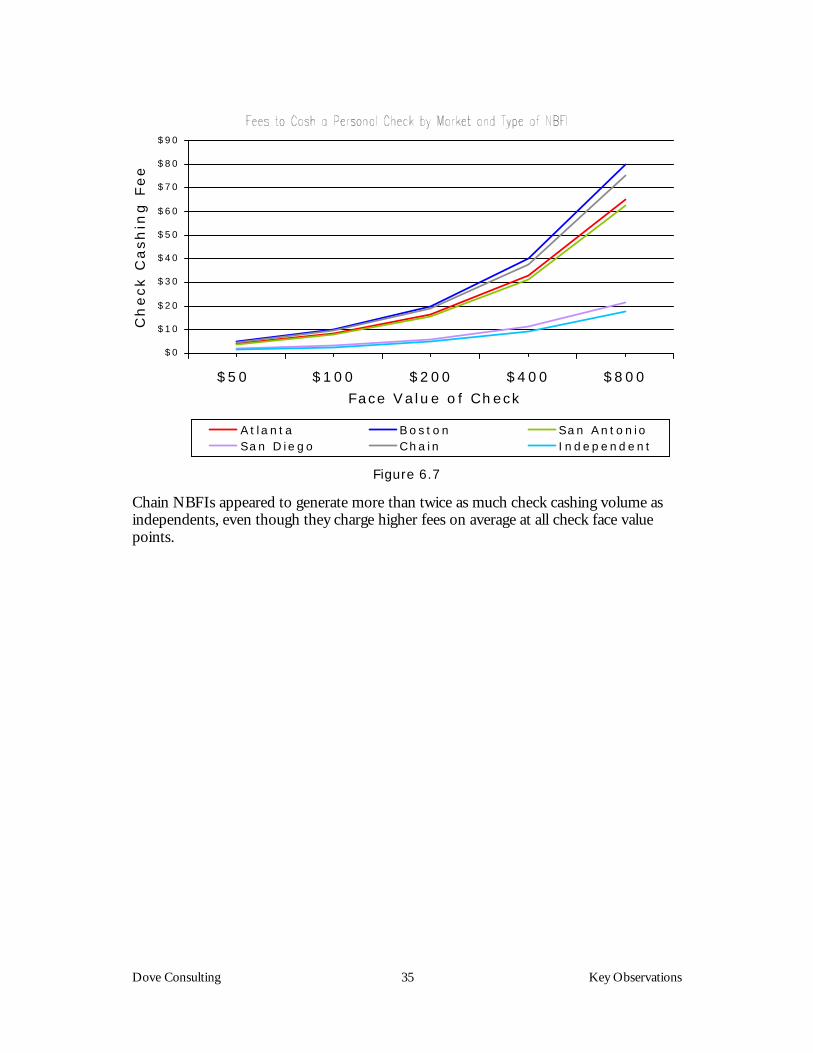
The survey results indicate that the fee for cashing a check equal to the average SocialSecurity benefit ($707 in 1998) ranges from about $9 in San Antonio to $16 in Boston.For the average Supplementary Security Income benefit ($365 in 1998), the fees rangesfrom $5 in San Antonio to $8 in Boston24. The following three charts show the feeschedules for cashing payroll, government, and personal checks for each of the marketsand types of NBFIs gathered by Dove Consulting in December of 1999 through January2000:
Dove Consulting 34 Key Observations
$0$1$2$3$4$5$6$7$8$9
$10$11$12$13$14$15$16$17$18$19$20
$50 $100 $200 $400 $800
Face Value o f Check
Ch
eck
Ca
sh
ing
Fe
e
A t la nta Bos ton San AntonioSan Die go Cha in Independent
Figure 6.5
$0$1$2$3$4$5$6$7$8$9
$10$11$12$13$14$15$16$17$18$19$20
$50 $100 $200 $400 $800
Face Value o f Check
Ch
eck
Ca
sh
ing
Fe
e
A t la nta Bos ton San AntonioSan Die go Cha in Independent
Figure 6.6
Dove Consulting 35 Key Observations
$0
$10
$20
$30
$40
$50
$60
$70
$80
$90
$50 $100 $200 $400 $800
Face Value o f Check
Ch
eck
Ca
sh
ing
Fe
e
A t la nta Bos ton San AntonioSan Die go Cha in Independent
Figure 6.7
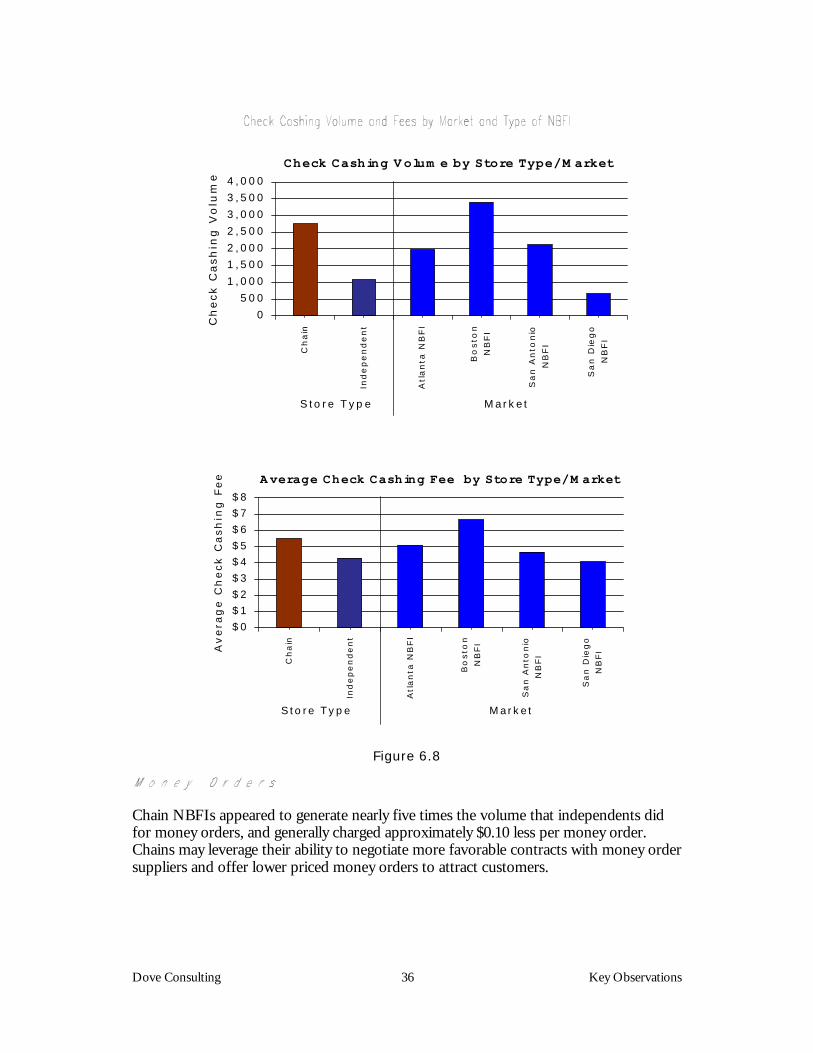
Chain NBFIs appeared to generate more than twice as much check cashing volume asindependents, even though they charge higher fees on average at all check face valuepoints.
Dove Consulting 36 Key Observations
0
500
1,000
1,500
2,000
2,500
3,000
3,500
4,000
Ch
ain
Ind
ep
en
de
nt
Atl
an
ta N
BF
I
Bo
sto
n
NB
FI
Sa
n A
nto
nio
NB
FI
Sa
n D
ieg
o
NB
FI
S to re Type Market
Ch
eck C
ash
ing
Vo
lum
e
Check Cashing Volum e by Store Type/M arket
$0
$1$2
$3
$4$5
$6
$7$8
Ch
ain
Ind
ep
en
de
nt
Atl
an
ta N
BF
I
Bo
sto
n
NB
FI
Sa
n A
nto
nio
NB
FI
Sa
n D
ieg
o
NB
FI
S to re Type Market
Av
era
ge
Ch
eck
Ca
sh
ing
Fe
e A verage Check Cashing Fee by Store Type/M arket
Figure 6.8
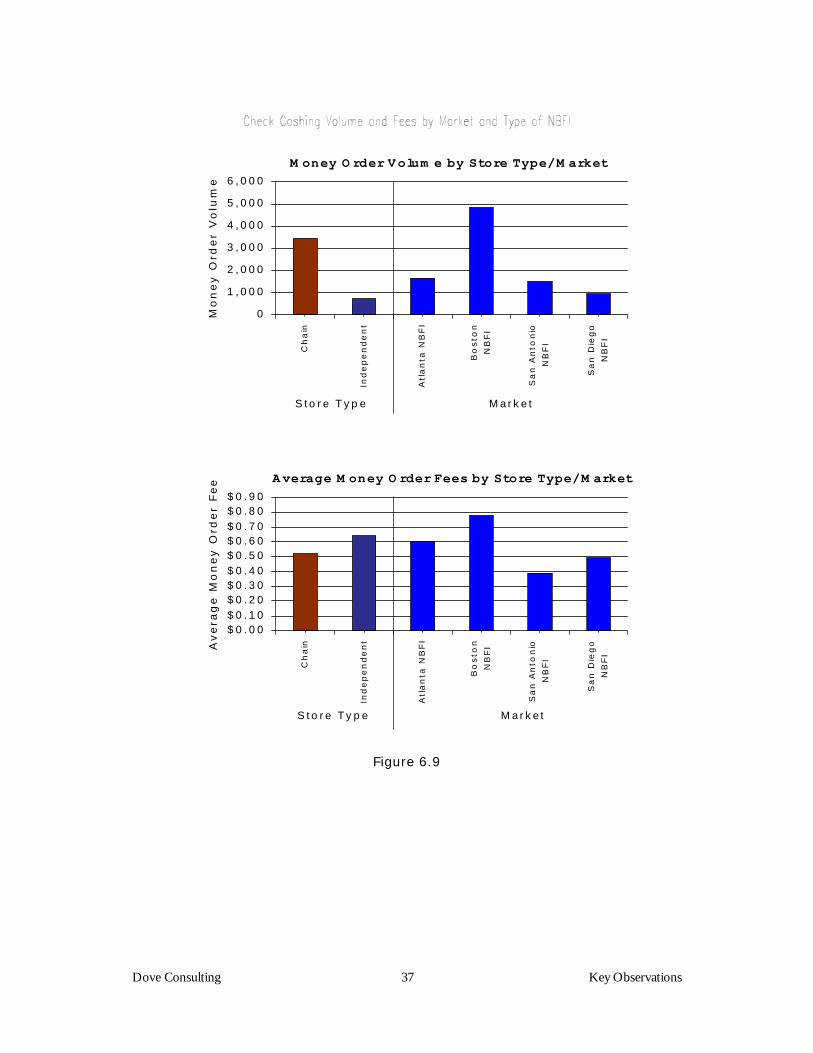
Chain NBFIs appeared to generate nearly five times the volume that independents didfor money orders, and generally charged approximately $0.10 less per money order.Chains may leverage their ability to negotiate more favorable contracts with money ordersuppliers and offer lower priced money orders to attract customers.
Dove Consulting 37 Key Observations
0
1,000
2,000
3,000
4,000
5,000
6,000
Ch
ain
Ind
ep
en
de
nt
Atl
an
ta N
BF
I
Bo
sto
n
NB
FI
Sa
n A
nto
nio
NB
FI
Sa
n D
ieg
o
NB
FI
S to re Type Market
Mo
ne
y O
rde
r V
olu
me
M oney O rder Volum e by Store Type/M arket
$0.00$0.10$0.20$0.30$0.40$0.50$0.60$0.70$0.80$0.90
Ch
ain
Ind
ep
en
de
nt
Atl
an
ta N
BF
I
Bo
sto
n
NB
FI
Sa
n A
nto
nio
NB
FI
Sa
n D
ieg
o
NB
FI
S to re Type M arket
Avera
ge M
on
ey O
rder
Fee Average M oney O rder Fees by Store Type/M arket
Figure 6.9
Dove Consulting 38 Key Observations
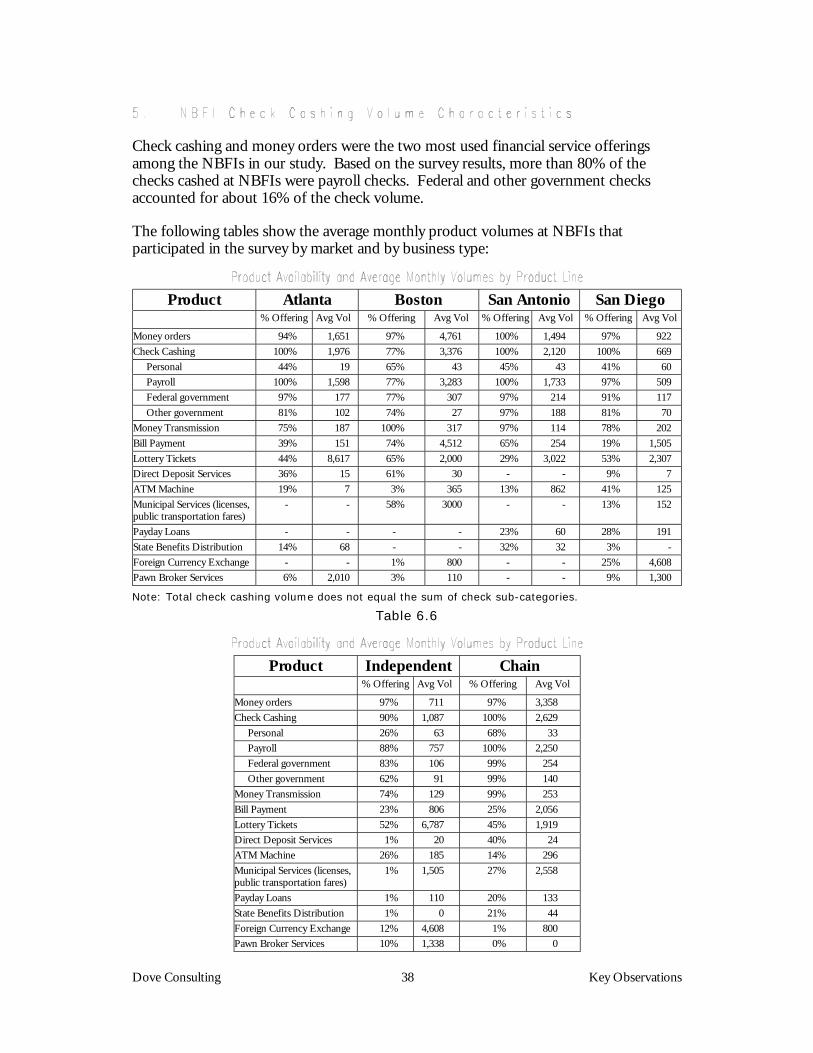
Check cashing and money orders were the two most used financial service offeringsamong the NBFIs in our study. Based on the survey results, more than 80% of thechecks cashed at NBFIs were payroll checks. Federal and other government checksaccounted for about 16% of the check volume.
The following tables show the average monthly product volumes at NBFIs thatparticipated in the survey by market and by business type:
Product Atlanta Boston San Antonio San Diego% Offering Avg Vol % Offering Avg Vol % Offering Avg Vol % Offering Avg Vol
Money orders 94% 1,651 97% 4,761 100% 1,494 97% 922Check Cashing 100% 1,976 77% 3,376 100% 2,120 100% 669 Personal 44% 19 65% 43 45% 43 41% 60 Payroll 100% 1,598 77% 3,283 100% 1,733 97% 509 Federal government 97% 177 77% 307 97% 214 91% 117 Other government 81% 102 74% 27 97% 188 81% 70Money Transmission 75% 187 100% 317 97% 114 78% 202Bill Payment 39% 151 74% 4,512 65% 254 19% 1,505Lottery Tickets 44% 8,617 65% 2,000 29% 3,022 53% 2,307Direct Deposit Services 36% 15 61% 30 - - 9% 7ATM Machine 19% 7 3% 365 13% 862 41% 125Municipal Services (licenses,public transportation fares)
- - 58% 3000 - - 13% 152
Payday Loans - - - - 23% 60 28% 191State Benefits Distribution 14% 68 - - 32% 32 3% -Foreign Currency Exchange - - 1% 800 - - 25% 4,608Pawn Broker Services 6% 2,010 3% 110 - - 9% 1,300
Note: Total check cashing volume does not equal the sum of check sub-categories.
Table 6.6
Product Independent Chain% Offering Avg Vol % Offering Avg Vol
Money orders 97% 711 97% 3,358Check Cashing 90% 1,087 100% 2,629 Personal 26% 63 68% 33 Payroll 88% 757 100% 2,250 Federal government 83% 106 99% 254 Other government 62% 91 99% 140Money Transmission 74% 129 99% 253Bill Payment 23% 806 25% 2,056Lottery Tickets 52% 6,787 45% 1,919Direct Deposit Services 1% 20 40% 24ATM Machine 26% 185 14% 296Municipal Services (licenses,public transportation fares)
1% 1,505 27% 2,558
Payday Loans 1% 110 20% 133State Benefits Distribution 1% 0 21% 44Foreign Currency Exchange 12% 4,608 1% 800Pawn Broker Services 10% 1,338 0% 0

Dove Consulting 39 Key Observations
Table 6.7
Dove Consulting 40 Key Observations
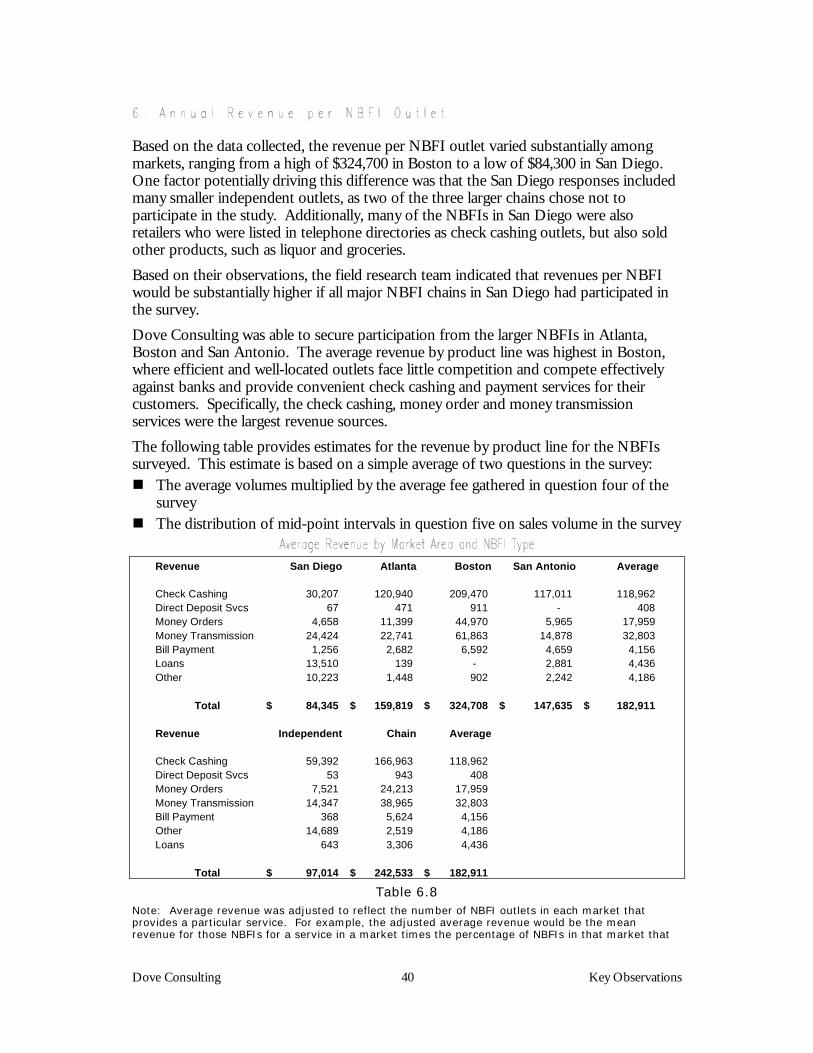
Based on the data collected, the revenue per NBFI outlet varied substantially amongmarkets, ranging from a high of $324,700 in Boston to a low of $84,300 in San Diego.One factor potentially driving this difference was that the San Diego responses includedmany smaller independent outlets, as two of the three larger chains chose not toparticipate in the study. Additionally, many of the NBFIs in San Diego were alsoretailers who were listed in telephone directories as check cashing outlets, but also soldother products, such as liquor and groceries.Based on their observations, the field research team indicated that revenues per NBFIwould be substantially higher if all major NBFI chains in San Diego had participated inthe survey.Dove Consulting was able to secure participation from the larger NBFIs in Atlanta,Boston and San Antonio. The average revenue by product line was highest in Boston,where efficient and well-located outlets face little competition and compete effectivelyagainst banks and provide convenient check cashing and payment services for theircustomers. Specifically, the check cashing, money order and money transmissionservices were the largest revenue sources.The following table provides estimates for the revenue by product line for the NBFIssurveyed. This estimate is based on a simple average of two questions in the survey:! The average volumes multiplied by the average fee gathered in question four of the
survey! The distribution of mid-point intervals in question five on sales volume in the survey
Revenue San Diego Atlanta Boston San Antonio Average
Check Cashing 30,207 120,940 209,470 117,011 118,962 Direct Deposit Svcs 67 471 911 - 408 Money Orders 4,658 11,399 44,970 5,965 17,959 Money Transmission 24,424 22,741 61,863 14,878 32,803 Bill Payment 1,256 2,682 6,592 4,659 4,156 Loans 13,510 139 - 2,881 4,436 Other 10,223 1,448 902 2,242 4,186
Total 84,345$ 159,819$ 324,708$ 147,635$ 182,911$
Revenue Independent Chain Average
Check Cashing 59,392 166,963 118,962 Direct Deposit Svcs 53 943 408 Money Orders 7,521 24,213 17,959 Money Transmission 14,347 38,965 32,803 Bill Payment 368 5,624 4,156 Other 14,689 2,519 4,186 Loans 643 3,306 4,436
Total 97,014$ 242,533$ 182,911$
Table 6.8Note: Average revenue was adjusted to reflect the number of NBFI outlets in each market thatprovides a particular service. For example, the adjusted average revenue would be the meanrevenue for those NBFIs for a service in a market times the percentage of NBFIs in that market that

Dove Consulting 41 Key Observations
provided that service. This method thus understates the revenue for stores that provide a givenproduct for all products that are not universally offered in a market.
Dove Consulting 42 Key Observations
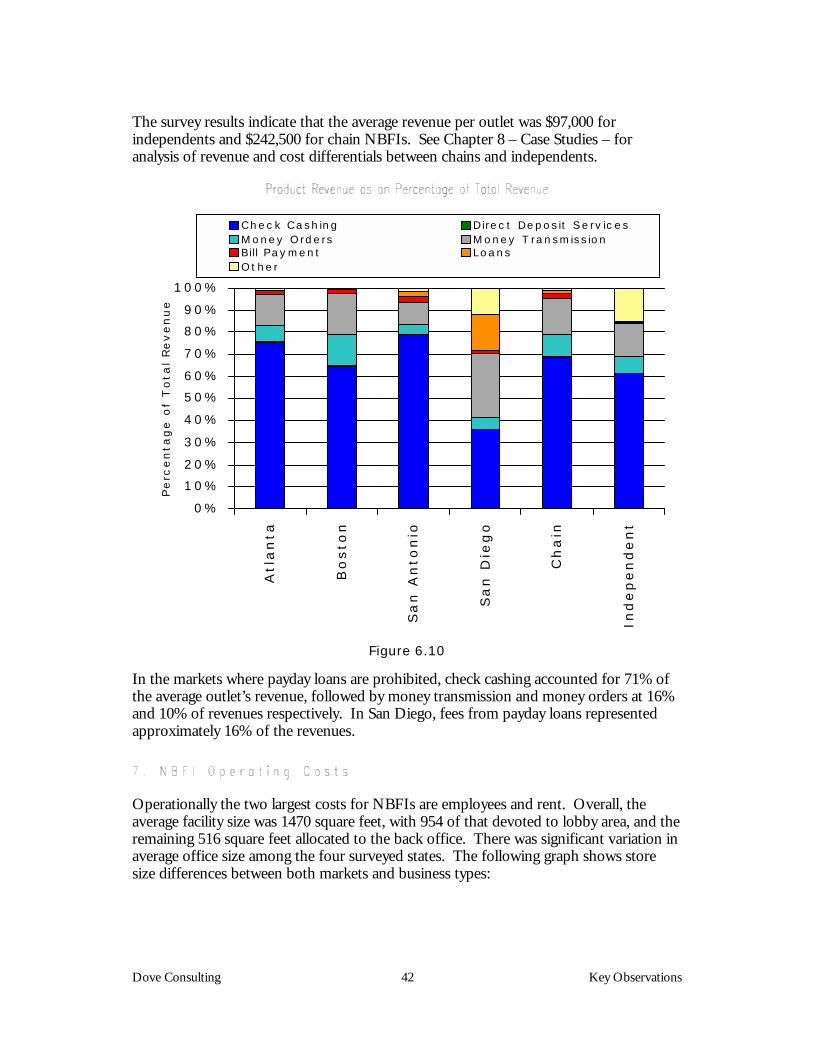
The survey results indicate that the average revenue per outlet was $97,000 forindependents and $242,500 for chain NBFIs. See Chapter 8 – Case Studies – foranalysis of revenue and cost differentials between chains and independents.
0%
10%
20%
30%
40%
50%
60%
70%
80%
90%
100%A
tla
nta
Bo
sto
n
Sa
n A
nto
nio
Sa
n D
ieg
o
Ch
ain
Ind
ep
en
de
nt
Pe
rce
nta
ge
of
To
tal
Re
ve
nu
e
Chec k Cashing Direc t Depos it Se rv ic esM oney Orde rs M oney T ransmiss ionBill Payment LoansOthe r
Figure 6.10
In the markets where payday loans are prohibited, check cashing accounted for 71% ofthe average outlet’s revenue, followed by money transmission and money orders at 16%and 10% of revenues respectively. In San Diego, fees from payday loans representedapproximately 16% of the revenues.
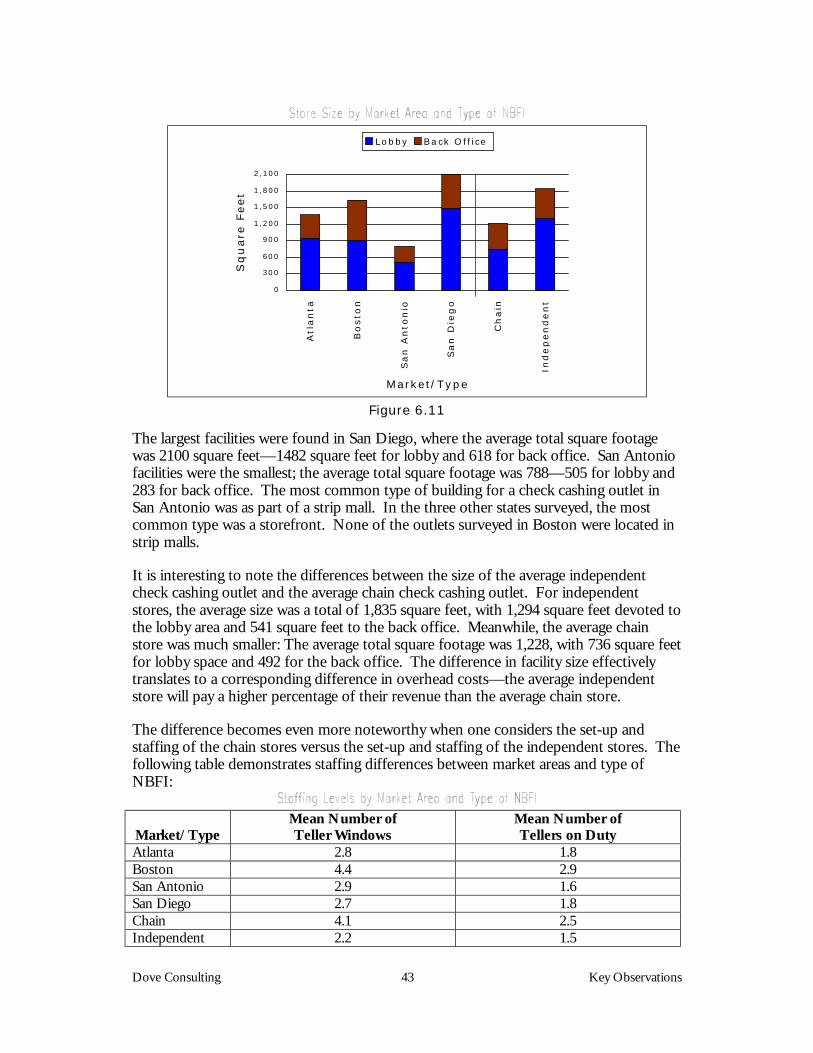
Operationally the two largest costs for NBFIs are employees and rent. Overall, theaverage facility size was 1470 square feet, with 954 of that devoted to lobby area, and theremaining 516 square feet allocated to the back office. There was significant variation inaverage office size among the four surveyed states. The following graph shows storesize differences between both markets and business types:
Dove Consulting 43 Key Observations
0
300
600
900
1,200
1,500
1,800
2,100
Atl
an
ta
Bo
sto
n
Sa
n A
nto
nio
Sa
n D
ieg
o
Ch
ain
Ind
ep
en
de
nt
M arket/Type
Sq
uare
Feet
Lobby Ba ck O ff ice
Figure 6.11
The largest facilities were found in San Diego, where the average total square footagewas 2100 square feet—1482 square feet for lobby and 618 for back office. San Antoniofacilities were the smallest; the average total square footage was 788—505 for lobby and283 for back office. The most common type of building for a check cashing outlet inSan Antonio was as part of a strip mall. In the three other states surveyed, the mostcommon type was a storefront. None of the outlets surveyed in Boston were located instrip malls.
It is interesting to note the differences between the size of the average independentcheck cashing outlet and the average chain check cashing outlet. For independentstores, the average size was a total of 1,835 square feet, with 1,294 square feet devoted tothe lobby area and 541 square feet to the back office. Meanwhile, the average chainstore was much smaller: The average total square footage was 1,228, with 736 square feetfor lobby space and 492 for the back office. The difference in facility size effectivelytranslates to a corresponding difference in overhead costs—the average independentstore will pay a higher percentage of their revenue than the average chain store.
The difference becomes even more noteworthy when one considers the set-up andstaffing of the chain stores versus the set-up and staffing of the independent stores. Thefollowing table demonstrates staffing differences between market areas and type ofNBFI:
Market/TypeMean Number ofTeller Windows
Mean Number ofTellers on Duty
Atlanta 2.8 1.8Boston 4.4 2.9San Antonio 2.9 1.6San Diego 2.7 1.8Chain 4.1 2.5Independent 2.2 1.5

Dove Consulting 44 Key Observations
Table 6.9
Dove Consulting 45 Key Observations
Chain stores had nearly twice as many teller windows as the independents—an averageof 4.1 teller windows for the chains compared to an average of 2.2 for the independentoutlets. Moreover, there was a higher average number of tellers on duty in the chainstores. For chain stores this number was 2.5; for independents the average number oftellers working was 1.5.
There are also significant differences among markets in terms of store set-up andstaffing. The average Boston check-cashing outlet had 4.4 teller windows and 2.9 tellerson duty. The mean number of teller windows for the other three states was between 2.7and 2.9; the mean average numbers of tellers on duty ranged from 1.6 to 1.8. Onepossible explanation could be that Boston has the fewest number of NBFIs among thefour markets studied, with only 0.15 NBFIs per 1,000 households (see Table 3.1).Because there is a lower supply of check cashers, there is a larger demand per store.Thus, by having a higher number of teller windows and tellers on duty, Boston NBFIoutlets are attempting to meet customer demand.
These variations between chain stores and independents indicate that the average chainstore spends less of its resources on overhead costs such as rent, yet utilizes its spacemore thoroughly, by installing more teller windows and keeping more tellers on duty.
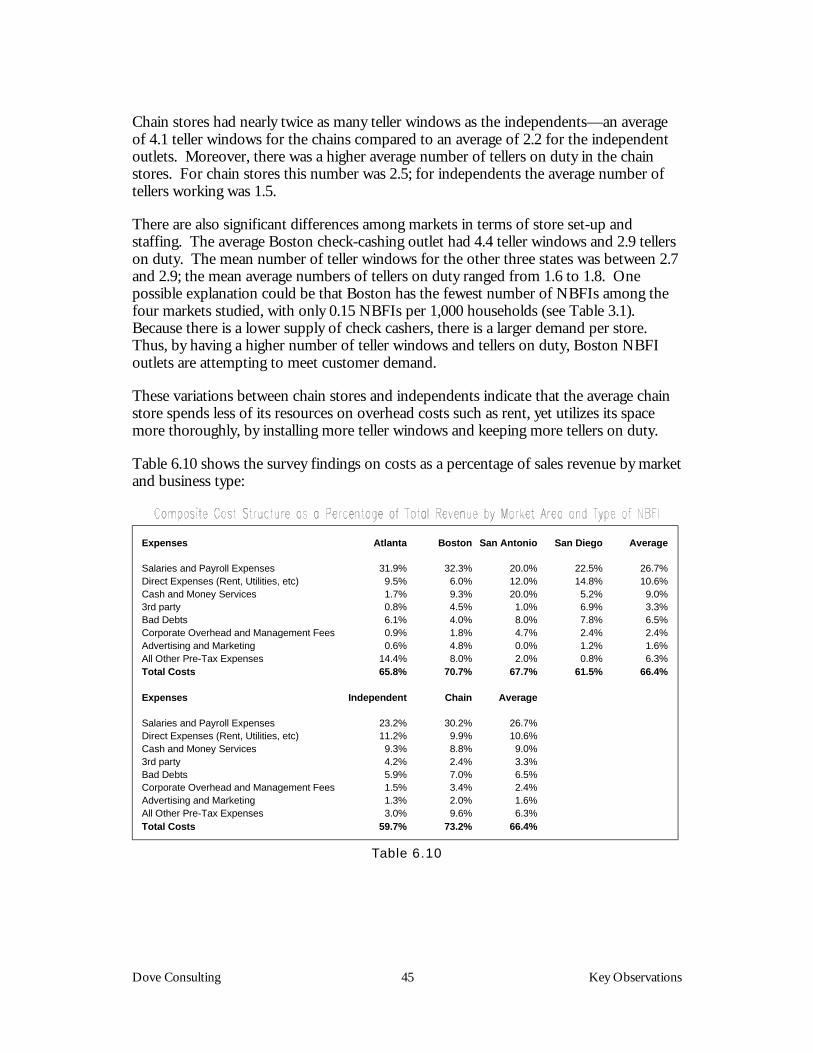
Table 6.10 shows the survey findings on costs as a percentage of sales revenue by marketand business type:
Expenses Atlanta Boston San Antonio San Diego Average
Salaries and Payroll Expenses 31.9% 32.3% 20.0% 22.5% 26.7%Direct Expenses (Rent, Utilities, etc) 9.5% 6.0% 12.0% 14.8% 10.6%Cash and Money Services 1.7% 9.3% 20.0% 5.2% 9.0%3rd party 0.8% 4.5% 1.0% 6.9% 3.3%Bad Debts 6.1% 4.0% 8.0% 7.8% 6.5%Corporate Overhead and Management Fees 0.9% 1.8% 4.7% 2.4% 2.4%Advertising and Marketing 0.6% 4.8% 0.0% 1.2% 1.6%All Other Pre-Tax Expenses 14.4% 8.0% 2.0% 0.8% 6.3%Total Costs 65.8% 70.7% 67.7% 61.5% 66.4%
Expenses Independent Chain Average
Salaries and Payroll Expenses 23.2% 30.2% 26.7%Direct Expenses (Rent, Utilities, etc) 11.2% 9.9% 10.6%Cash and Money Services 9.3% 8.8% 9.0%3rd party 4.2% 2.4% 3.3%Bad Debts 5.9% 7.0% 6.5%Corporate Overhead and Management Fees 1.5% 3.4% 2.4%Advertising and Marketing 1.3% 2.0% 1.6%All Other Pre-Tax Expenses 3.0% 9.6% 6.3%Total Costs 59.7% 73.2% 66.4%
Table 6.10
Dove Consulting 46 Key Observations
Based on the survey data, the average pre-tax return on sales for NBFIs is in the rangeof 29% to 39% of sales revenue. Due to confidentiality concerns only 84 of the 130participating NBFIs (65%) provided the requested cost data. Although these estimatedprofit margins might appear to be high, they are fairly close to the 32% averagedocumented in the 1998 Income Statements filed with state regulators in Massachusetts.The other markets did not have corroborating evidence from financial informationreported to state authorities.
The higher margins in San Diego and San Antonio may be due to fees associated withshort-term lending businesses allowed in those states. For example, payday loans areavailable at NBFIs in California and consumer appliance and car title loans are availablein Texas. The data suggest that NBFI respondents that offer payday loans may do sowithout significant increases in their fixed costs for labor and occupancy. There may,however, be an increase in costs for funding the loans (especially if the check casher isfunding them through an affiliated bank - see Market Summary for San Antonio).
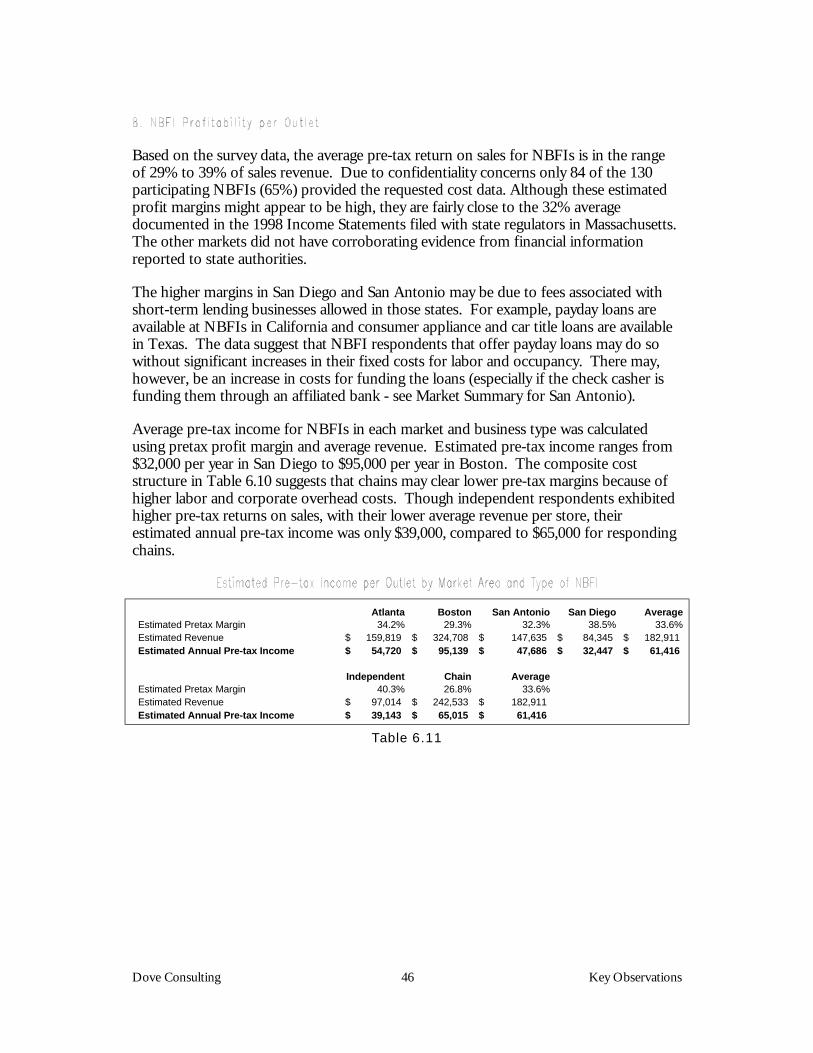
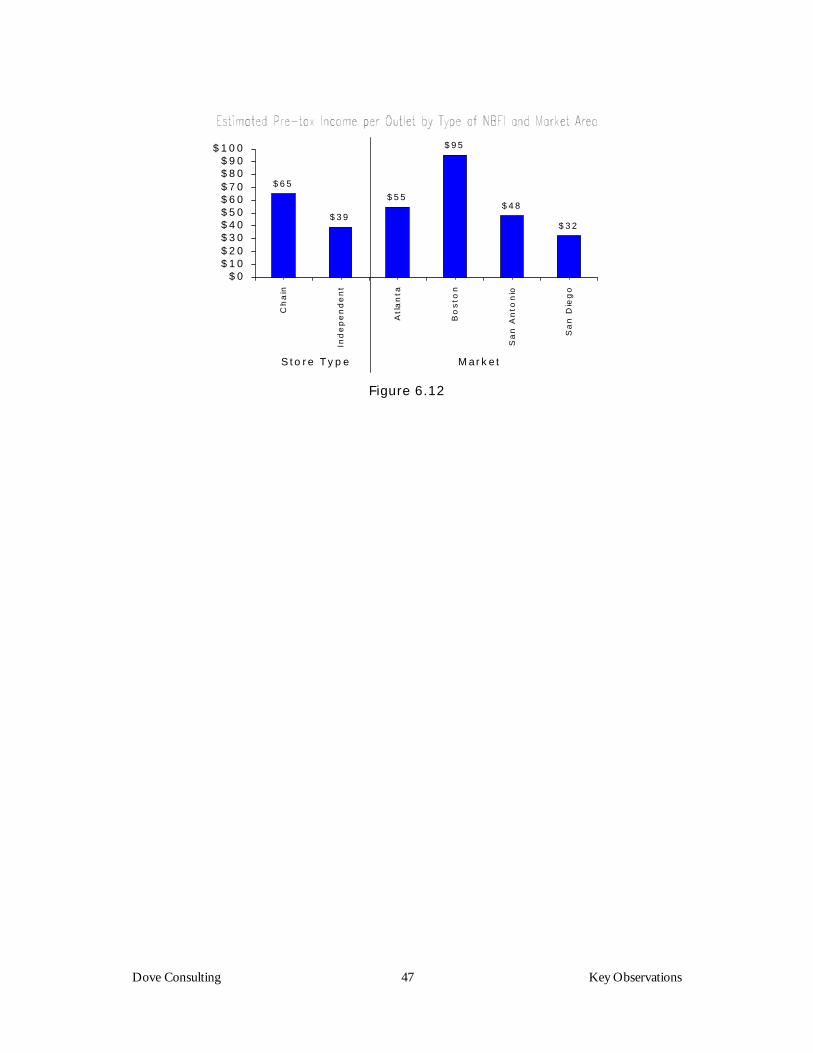
Average pre-tax income for NBFIs in each market and business type was calculatedusing pretax profit margin and average revenue. Estimated pre-tax income ranges from$32,000 per year in San Diego to $95,000 per year in Boston. The composite coststructure in Table 6.10 suggests that chains may clear lower pre-tax margins because ofhigher labor and corporate overhead costs. Though independent respondents exhibitedhigher pre-tax returns on sales, with their lower average revenue per store, theirestimated annual pre-tax income was only $39,000, compared to $65,000 for respondingchains.
Atlanta Boston San Antonio San Diego AverageEstimated Pretax Margin 34.2% 29.3% 32.3% 38.5% 33.6%Estimated Revenue 159,819$ 324,708$ 147,635$ 84,345$ 182,911$ Estimated Annual Pre-tax Income 54,720$ 95,139$ 47,686$ 32,447$ 61,416$
Independent Chain AverageEstimated Pretax Margin 40.3% 26.8% 33.6%Estimated Revenue 97,014$ 242,533$ 182,911$ Estimated Annual Pre-tax Income 39,143$ 65,015$ 61,416$
Table 6.11
Dove Consulting 47 Key Observations
$65
$39
$55
$95
$48
$32
$0$10$20$30$40$50$60$70$80$90
$100
Ch
ain
Ind
ep
en
de
nt
Atl
an
ta
Bo
sto
n
Sa
n A
nto
nio
Sa
n D
ieg
o
S to re Type Market
Figure 6.12
Dove Consulting 48 Markets Summaries
Four diverse market areas were selected for this study to provide the Department of theTreasury areas with information about the similarities and differences in NBFIoperations across a range of regulatory and demographic dimensions. Each market wasselected in an effort to understand the extent to which unique market specific attributesmay explain the growth and role of NBFIs in providing financial services to theunderbanked. Although there were many similarities among the four markets,particularly among cities with the same national chains, our analysis also found severalnoticeable differences with respect to prices, product offerings, access to traditionalfinancial service providers, geography, demographics and regulatory environments. Thesummaries show that each of the markets studied tended to have its own competitiveenvironment, which resulted in disparate pricing and profitability.
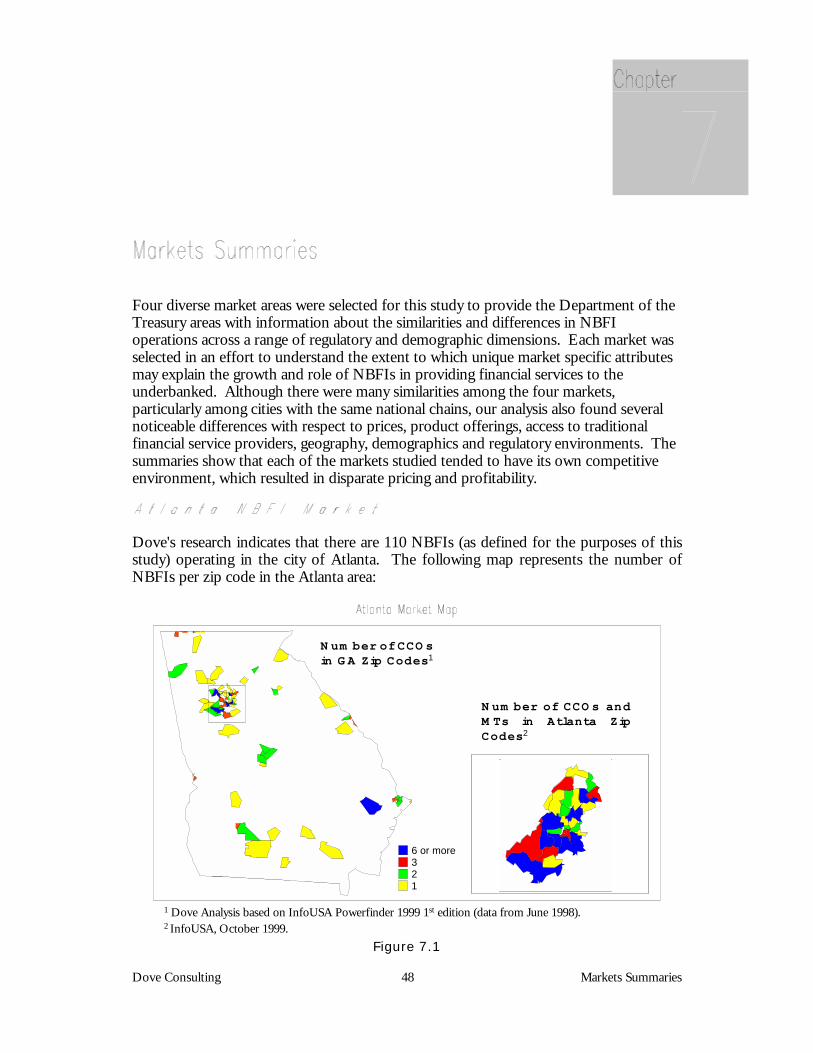
Dove's research indicates that there are 110 NBFIs (as defined for the purposes of thisstudy) operating in the city of Atlanta. The following map represents the number ofNBFIs per zip code in the Atlanta area:
6 or more321
N um ber of CCO s andM Ts in Atlanta ZipCodes2
N um ber of CCO s in G A Zip Codes1
1 Dove Analysis based on InfoUSA Powerfinder 1999 1st edition (data from June 1998).2 InfoUSA, October 1999.
Figure 7.1
Dove Consulting 49 Markets Summaries
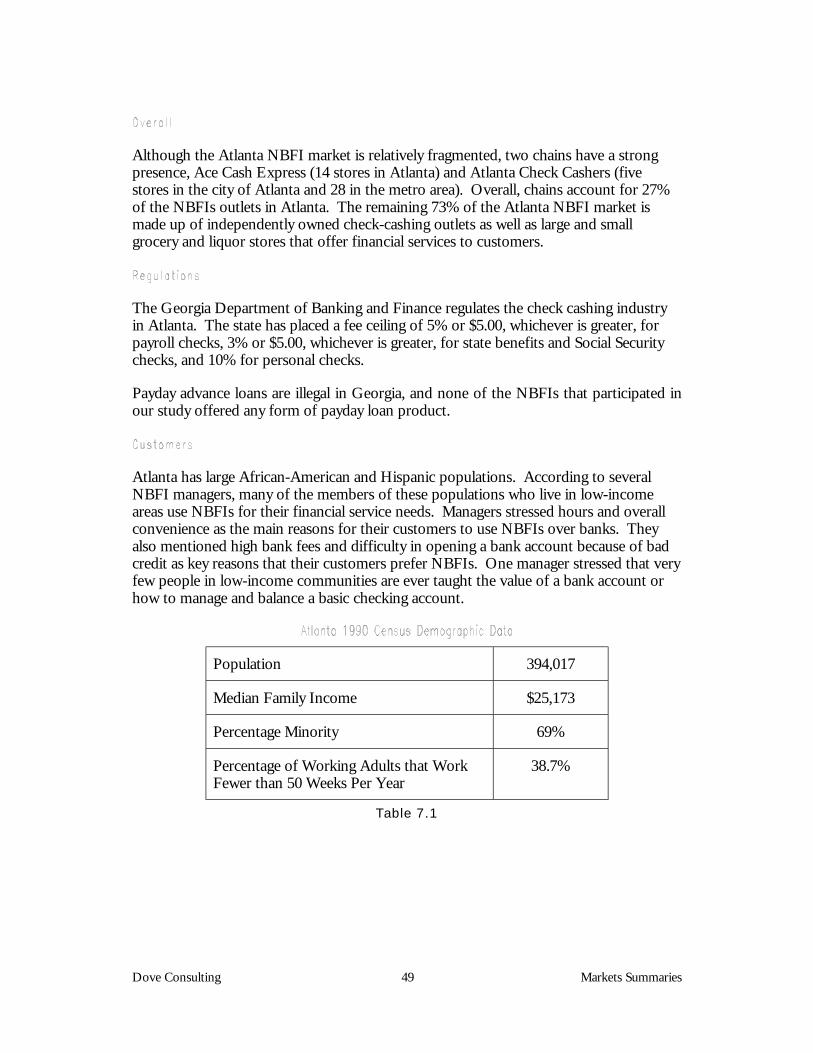
Although the Atlanta NBFI market is relatively fragmented, two chains have a strongpresence, Ace Cash Express (14 stores in Atlanta) and Atlanta Check Cashers (fivestores in the city of Atlanta and 28 in the metro area). Overall, chains account for 27%of the NBFIs outlets in Atlanta. The remaining 73% of the Atlanta NBFI market ismade up of independently owned check-cashing outlets as well as large and smallgrocery and liquor stores that offer financial services to customers.
The Georgia Department of Banking and Finance regulates the check cashing industryin Atlanta. The state has placed a fee ceiling of 5% or $5.00, whichever is greater, forpayroll checks, 3% or $5.00, whichever is greater, for state benefits and Social Securitychecks, and 10% for personal checks.
Payday advance loans are illegal in Georgia, and none of the NBFIs that participated inour study offered any form of payday loan product.
Atlanta has large African-American and Hispanic populations. According to severalNBFI managers, many of the members of these populations who live in low-incomeareas use NBFIs for their financial service needs. Managers stressed hours and overallconvenience as the main reasons for their customers to use NBFIs over banks. Theyalso mentioned high bank fees and difficulty in opening a bank account because of badcredit as key reasons that their customers prefer NBFIs. One manager stressed that veryfew people in low-income communities are ever taught the value of a bank account orhow to manage and balance a basic checking account.
Population 394,017
Median Family Income $25,173
Percentage Minority 69%
Percentage of Working Adults that WorkFewer than 50 Weeks Per Year
38.7%
Table 7.1
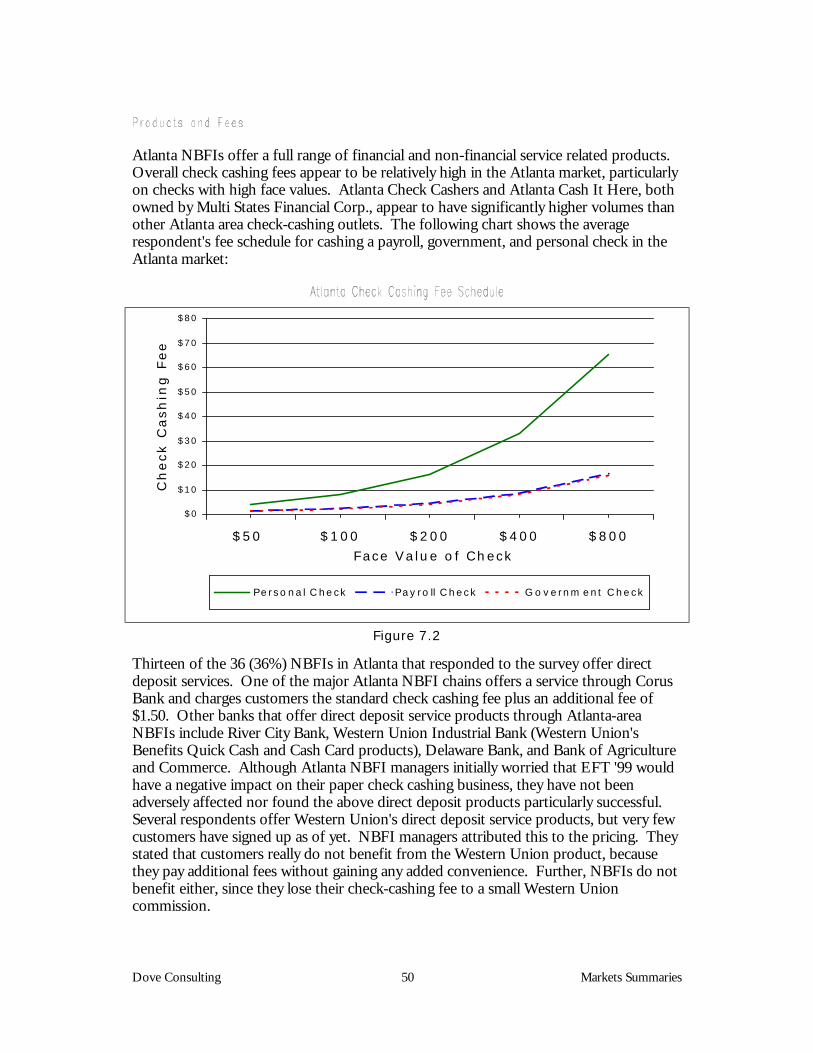
Dove Consulting 50 Markets Summaries
Atlanta NBFIs offer a full range of financial and non-financial service related products.Overall check cashing fees appear to be relatively high in the Atlanta market, particularlyon checks with high face values. Atlanta Check Cashers and Atlanta Cash It Here, bothowned by Multi States Financial Corp., appear to have significantly higher volumes thanother Atlanta area check-cashing outlets. The following chart shows the averagerespondent's fee schedule for cashing a payroll, government, and personal check in theAtlanta market:
$0
$10
$20
$30
$40
$50
$60
$70
$80
$50 $100 $200 $400 $800
Face Value o f Check
Ch
eck C
ash
ing
Fee
Pe rso na l C heck Payro ll C heck G o vernm ent C heck
Figure 7.2
Thirteen of the 36 (36%) NBFIs in Atlanta that responded to the survey offer directdeposit services. One of the major Atlanta NBFI chains offers a service through CorusBank and charges customers the standard check cashing fee plus an additional fee of$1.50. Other banks that offer direct deposit service products through Atlanta-areaNBFIs include River City Bank, Western Union Industrial Bank (Western Union'sBenefits Quick Cash and Cash Card products), Delaware Bank, and Bank of Agricultureand Commerce. Although Atlanta NBFI managers initially worried that EFT '99 wouldhave a negative impact on their paper check cashing business, they have not beenadversely affected nor found the above direct deposit products particularly successful.Several respondents offer Western Union's direct deposit service products, but very fewcustomers have signed up as of yet. NBFI managers attributed this to the pricing. Theystated that customers really do not benefit from the Western Union product, becausethey pay additional fees without gaining any added convenience. Further, NBFIs do notbenefit either, since they lose their check-cashing fee to a small Western Unioncommission.
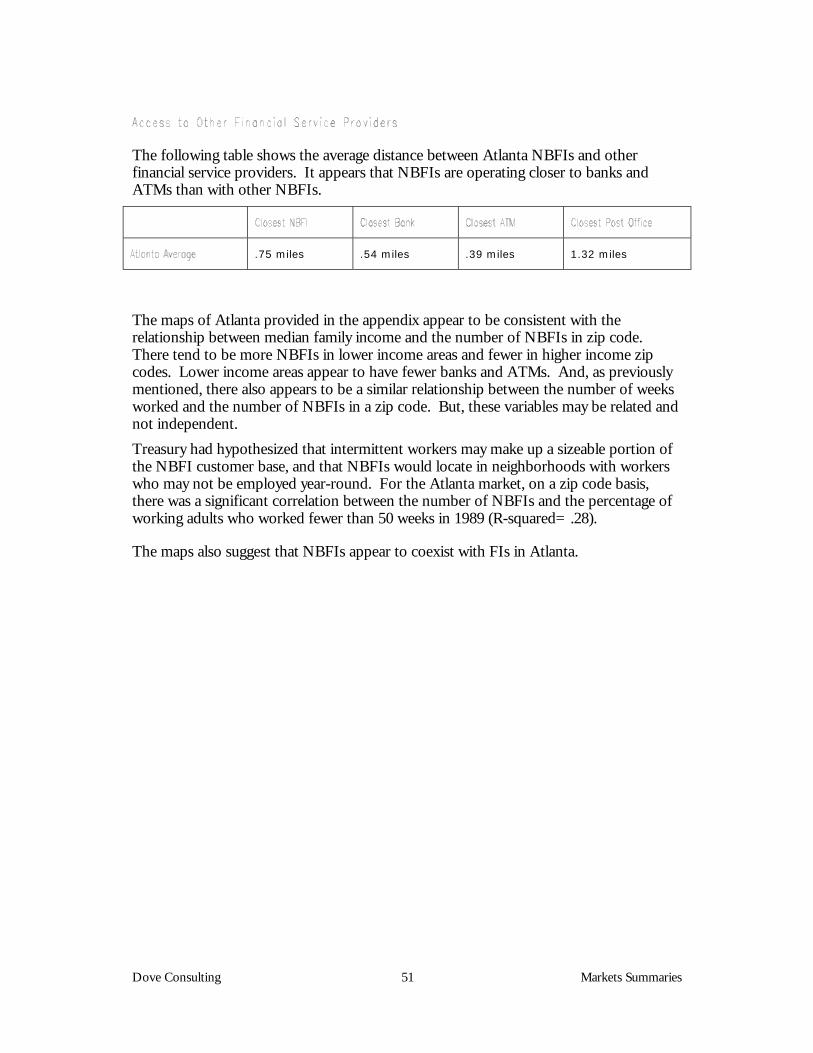
Dove Consulting 51 Markets Summaries
The following table shows the average distance between Atlanta NBFIs and otherfinancial service providers. It appears that NBFIs are operating closer to banks andATMs than with other NBFIs.
.75 miles .54 miles .39 miles 1.32 miles
The maps of Atlanta provided in the appendix appear to be consistent with therelationship between median family income and the number of NBFIs in zip code.There tend to be more NBFIs in lower income areas and fewer in higher income zipcodes. Lower income areas appear to have fewer banks and ATMs. And, as previouslymentioned, there also appears to be a similar relationship between the number of weeksworked and the number of NBFIs in a zip code. But, these variables may be related andnot independent.Treasury had hypothesized that intermittent workers may make up a sizeable portion ofthe NBFI customer base, and that NBFIs would locate in neighborhoods with workerswho may not be employed year-round. For the Atlanta market, on a zip code basis,there was a significant correlation between the number of NBFIs and the percentage ofworking adults who worked fewer than 50 weeks in 1989 (R-squared= .28).
The maps also suggest that NBFIs appear to coexist with FIs in Atlanta.
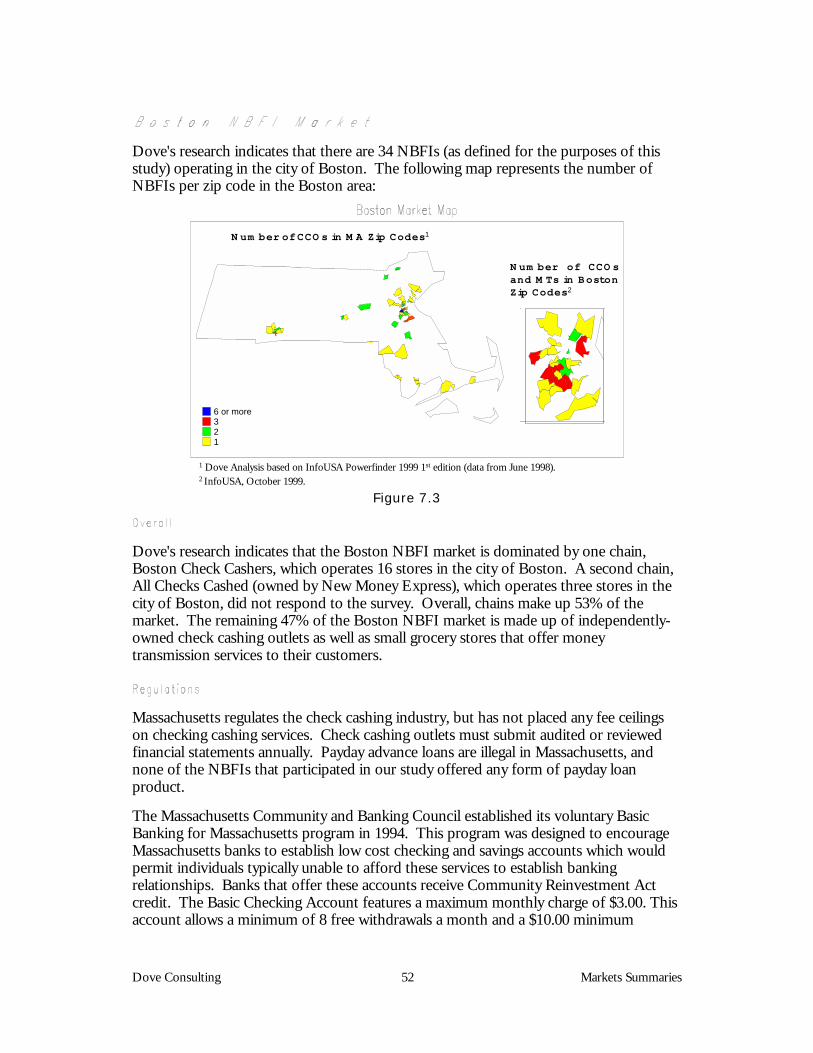
Dove Consulting 52 Markets Summaries
Dove's research indicates that there are 34 NBFIs (as defined for the purposes of thisstudy) operating in the city of Boston. The following map represents the number ofNBFIs per zip code in the Boston area:
N um ber of CCO sand M Ts in BostonZip Codes2
N um ber of CCO s in M A Zip Codes1
6 or more321
1 Dove Analysis based on InfoUSA Powerfinder 1999 1st edition (data from June 1998).2 InfoUSA, October 1999.
Figure 7.3
Dove's research indicates that the Boston NBFI market is dominated by one chain,Boston Check Cashers, which operates 16 stores in the city of Boston. A second chain,All Checks Cashed (owned by New Money Express), which operates three stores in thecity of Boston, did not respond to the survey. Overall, chains make up 53% of themarket. The remaining 47% of the Boston NBFI market is made up of independently-owned check cashing outlets as well as small grocery stores that offer moneytransmission services to their customers.
Massachusetts regulates the check cashing industry, but has not placed any fee ceilingson checking cashing services. Check cashing outlets must submit audited or reviewedfinancial statements annually. Payday advance loans are illegal in Massachusetts, andnone of the NBFIs that participated in our study offered any form of payday loanproduct.
The Massachusetts Community and Banking Council established its voluntary BasicBanking for Massachusetts program in 1994. This program was designed to encourageMassachusetts banks to establish low cost checking and savings accounts which wouldpermit individuals typically unable to afford these services to establish bankingrelationships. Banks that offer these accounts receive Community Reinvestment Actcredit. The Basic Checking Account features a maximum monthly charge of $3.00. Thisaccount allows a minimum of 8 free withdrawals a month and a $10.00 minimum
Dove Consulting 53 Markets Summaries
balance. Currently, 153 banks based in Massachusetts and over 80 percent of bankbranches participate in the Basic Banking for Massachusetts program25.
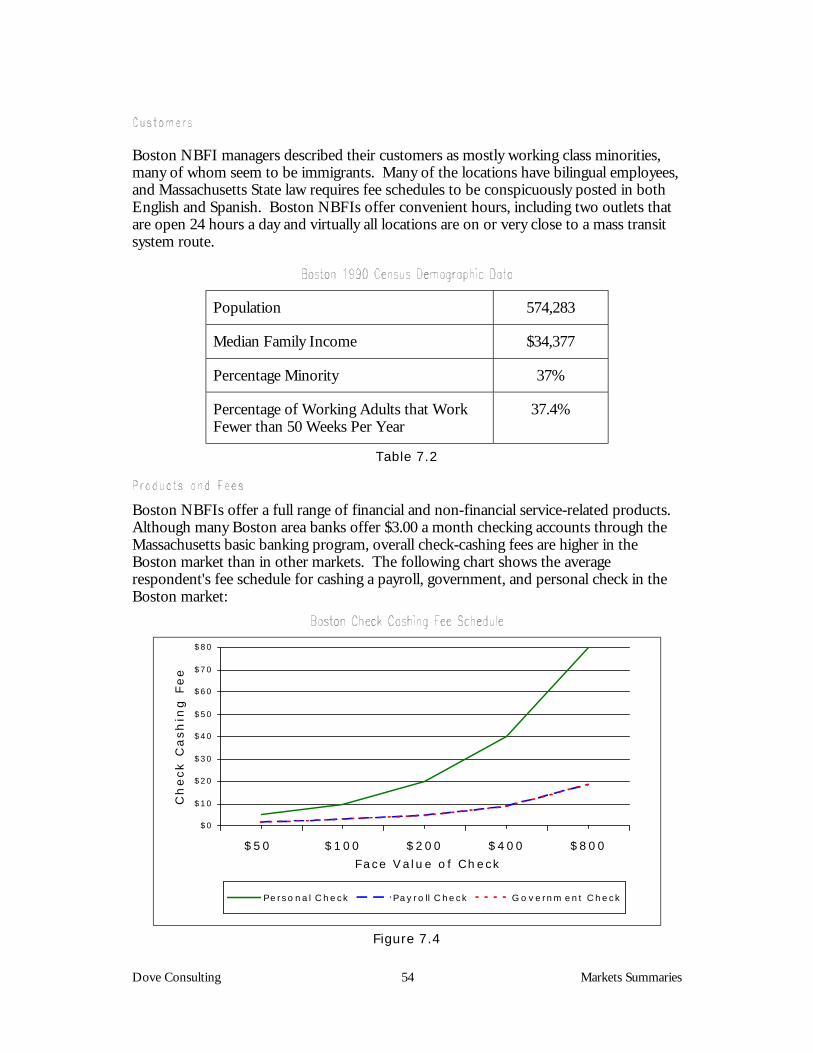
Dove Consulting 54 Markets Summaries
Boston NBFI managers described their customers as mostly working class minorities,many of whom seem to be immigrants. Many of the locations have bilingual employees,and Massachusetts State law requires fee schedules to be conspicuously posted in bothEnglish and Spanish. Boston NBFIs offer convenient hours, including two outlets thatare open 24 hours a day and virtually all locations are on or very close to a mass transitsystem route.
Population 574,283
Median Family Income $34,377
Percentage Minority 37%
Percentage of Working Adults that WorkFewer than 50 Weeks Per Year
37.4%
Table 7.2
Boston NBFIs offer a full range of financial and non-financial service-related products.Although many Boston area banks offer $3.00 a month checking accounts through theMassachusetts basic banking program, overall check-cashing fees are higher in theBoston market than in other markets. The following chart shows the averagerespondent's fee schedule for cashing a payroll, government, and personal check in theBoston market:
$0
$10
$20
$30
$40
$50
$60
$70
$80
$50 $100 $200 $400 $800
Face Value o f Check
Ch
eck
Cash
ing
Fee
P e rso na l C heck Payro ll C heck G o vernm ent C heck
Figure 7.4
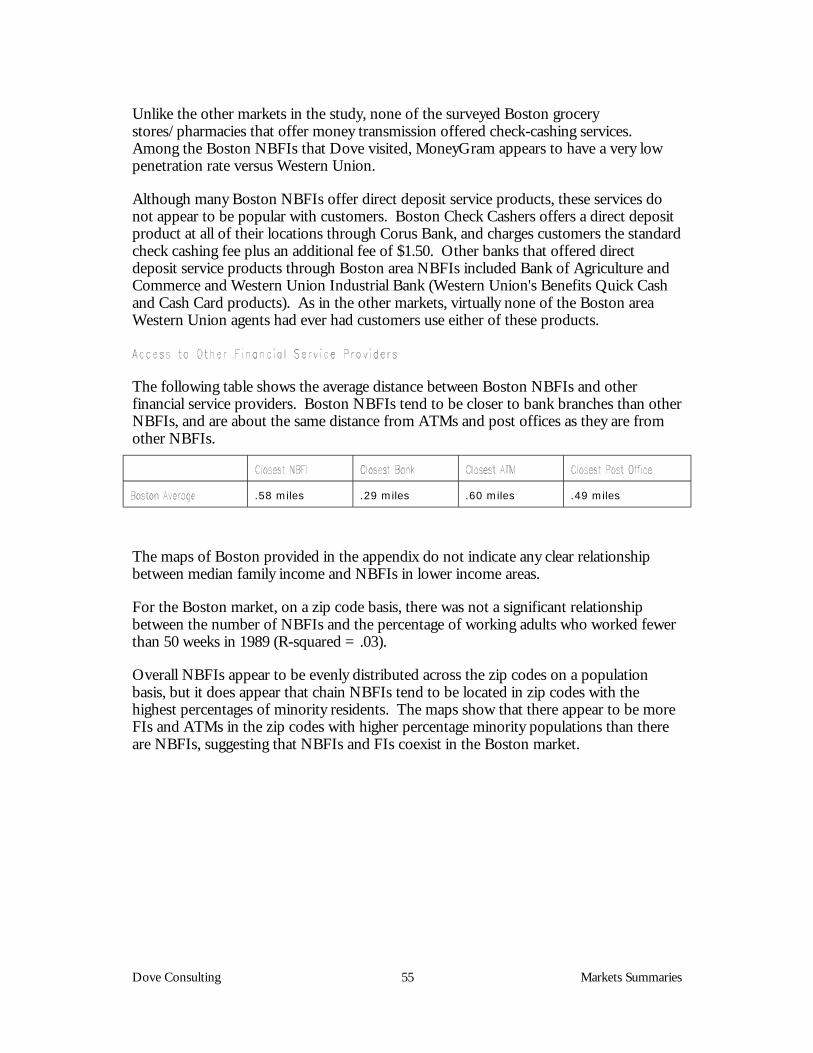
Dove Consulting 55 Markets Summaries
Unlike the other markets in the study, none of the surveyed Boston grocerystores/pharmacies that offer money transmission offered check-cashing services.Among the Boston NBFIs that Dove visited, MoneyGram appears to have a very lowpenetration rate versus Western Union.
Although many Boston NBFIs offer direct deposit service products, these services donot appear to be popular with customers. Boston Check Cashers offers a direct depositproduct at all of their locations through Corus Bank, and charges customers the standardcheck cashing fee plus an additional fee of $1.50. Other banks that offered directdeposit service products through Boston area NBFIs included Bank of Agriculture andCommerce and Western Union Industrial Bank (Western Union's Benefits Quick Cashand Cash Card products). As in the other markets, virtually none of the Boston areaWestern Union agents had ever had customers use either of these products.
The following table shows the average distance between Boston NBFIs and otherfinancial service providers. Boston NBFIs tend to be closer to bank branches than otherNBFIs, and are about the same distance from ATMs and post offices as they are fromother NBFIs.
.58 miles .29 miles .60 miles .49 miles
The maps of Boston provided in the appendix do not indicate any clear relationshipbetween median family income and NBFIs in lower income areas.
For the Boston market, on a zip code basis, there was not a significant relationshipbetween the number of NBFIs and the percentage of working adults who worked fewerthan 50 weeks in 1989 (R-squared = .03).
Overall NBFIs appear to be evenly distributed across the zip codes on a populationbasis, but it does appear that chain NBFIs tend to be located in zip codes with thehighest percentages of minority residents. The maps show that there appear to be moreFIs and ATMs in the zip codes with higher percentage minority populations than thereare NBFIs, suggesting that NBFIs and FIs coexist in the Boston market.
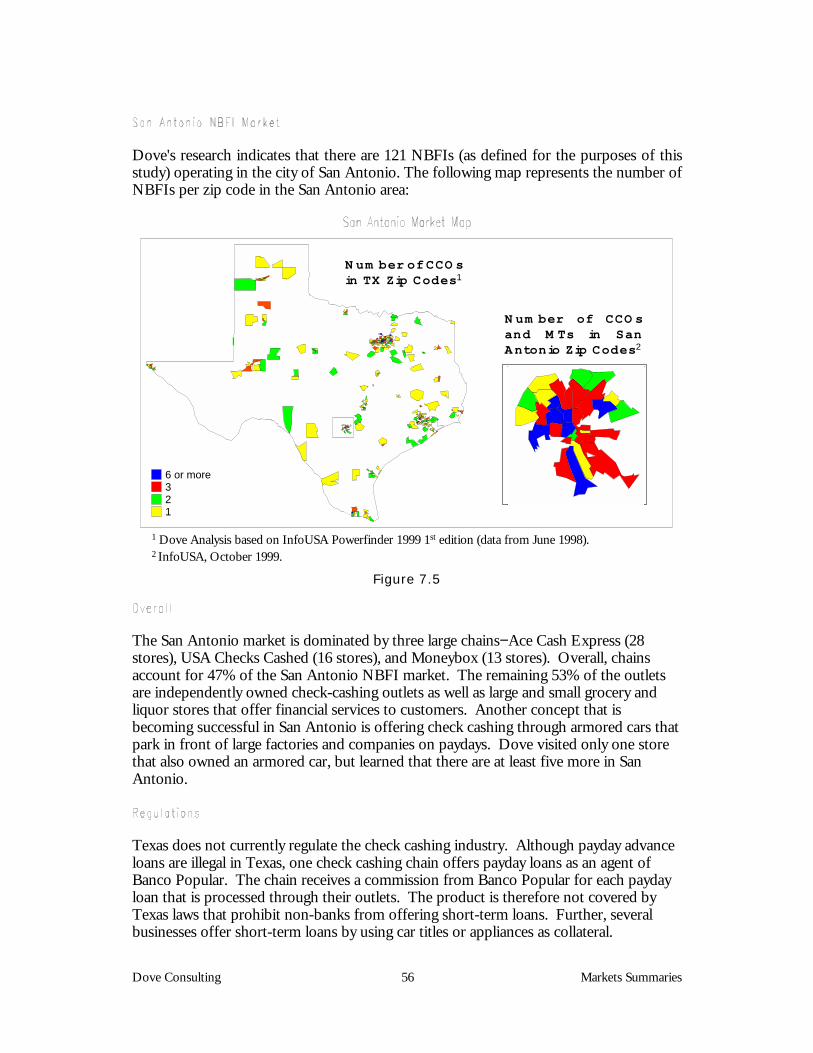
Dove Consulting 56 Markets Summaries
Dove's research indicates that there are 121 NBFIs (as defined for the purposes of thisstudy) operating in the city of San Antonio. The following map represents the number ofNBFIs per zip code in the San Antonio area:
6 or more321
N um ber of CCO s in TX Zip Codes1
N um ber of CCO sand M Ts in SanAntonio Zip Codes2
1 Dove Analysis based on InfoUSA Powerfinder 1999 1st edition (data from June 1998).2 InfoUSA, October 1999.
Figure 7.5
The San Antonio market is dominated by three large chains−Ace Cash Express (28stores), USA Checks Cashed (16 stores), and Moneybox (13 stores). Overall, chainsaccount for 47% of the San Antonio NBFI market. The remaining 53% of the outletsare independently owned check-cashing outlets as well as large and small grocery andliquor stores that offer financial services to customers. Another concept that isbecoming successful in San Antonio is offering check cashing through armored cars thatpark in front of large factories and companies on paydays. Dove visited only one storethat also owned an armored car, but learned that there are at least five more in SanAntonio.
Texas does not currently regulate the check cashing industry. Although payday advanceloans are illegal in Texas, one check cashing chain offers payday loans as an agent ofBanco Popular. The chain receives a commission from Banco Popular for each paydayloan that is processed through their outlets. The product is therefore not covered byTexas laws that prohibit non-banks from offering short-term loans. Further, severalbusinesses offer short-term loans by using car titles or appliances as collateral.
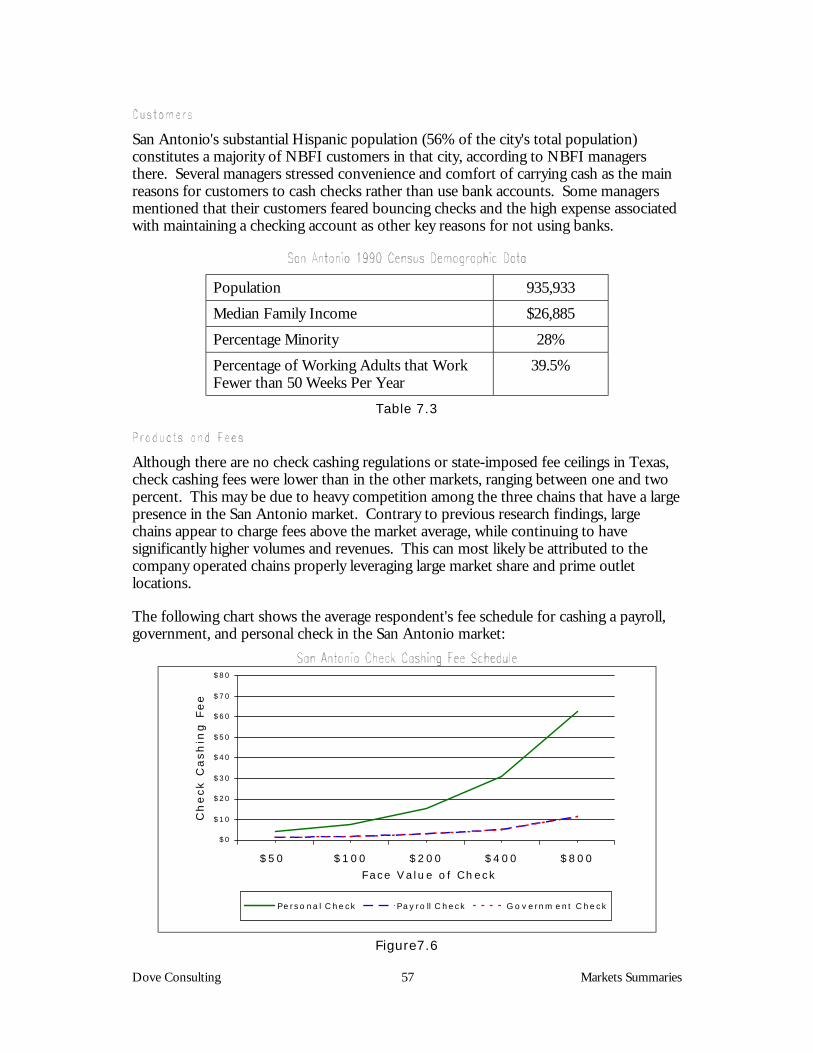
Dove Consulting 57 Markets Summaries
San Antonio's substantial Hispanic population (56% of the city's total population)constitutes a majority of NBFI customers in that city, according to NBFI managersthere. Several managers stressed convenience and comfort of carrying cash as the mainreasons for customers to cash checks rather than use bank accounts. Some managersmentioned that their customers feared bouncing checks and the high expense associatedwith maintaining a checking account as other key reasons for not using banks.
Population 935,933
Median Family Income $26,885
Percentage Minority 28%
Percentage of Working Adults that WorkFewer than 50 Weeks Per Year
39.5%
Table 7.3
Although there are no check cashing regulations or state-imposed fee ceilings in Texas,check cashing fees were lower than in the other markets, ranging between one and twopercent. This may be due to heavy competition among the three chains that have a largepresence in the San Antonio market. Contrary to previous research findings, largechains appear to charge fees above the market average, while continuing to havesignificantly higher volumes and revenues. This can most likely be attributed to thecompany operated chains properly leveraging large market share and prime outletlocations.
The following chart shows the average respondent's fee schedule for cashing a payroll,government, and personal check in the San Antonio market:
$0
$10
$20
$30
$40
$50
$60
$70
$80
$50 $100 $200 $400 $800
Face Value o f Check
Ch
eck
Cash
ing
Fee
Pe rso na l C heck Payro ll C heck G o vernm ent C heck
Figure7.6
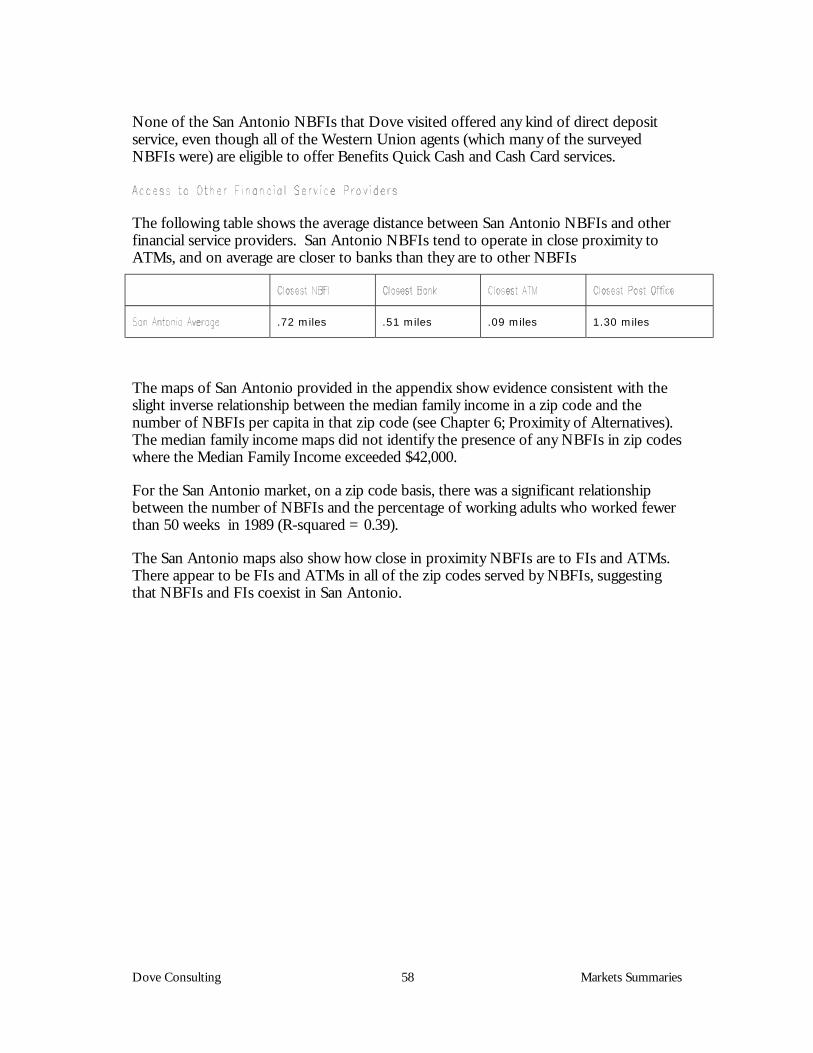
Dove Consulting 58 Markets Summaries
None of the San Antonio NBFIs that Dove visited offered any kind of direct depositservice, even though all of the Western Union agents (which many of the surveyedNBFIs were) are eligible to offer Benefits Quick Cash and Cash Card services.
The following table shows the average distance between San Antonio NBFIs and otherfinancial service providers. San Antonio NBFIs tend to operate in close proximity toATMs, and on average are closer to banks than they are to other NBFIs
.72 miles .51 miles .09 miles 1.30 miles
The maps of San Antonio provided in the appendix show evidence consistent with theslight inverse relationship between the median family income in a zip code and thenumber of NBFIs per capita in that zip code (see Chapter 6; Proximity of Alternatives).The median family income maps did not identify the presence of any NBFIs in zip codeswhere the Median Family Income exceeded $42,000.
For the San Antonio market, on a zip code basis, there was a significant relationshipbetween the number of NBFIs and the percentage of working adults who worked fewerthan 50 weeks in 1989 (R-squared = 0.39).
The San Antonio maps also show how close in proximity NBFIs are to FIs and ATMs.There appear to be FIs and ATMs in all of the zip codes served by NBFIs, suggestingthat NBFIs and FIs coexist in San Antonio.
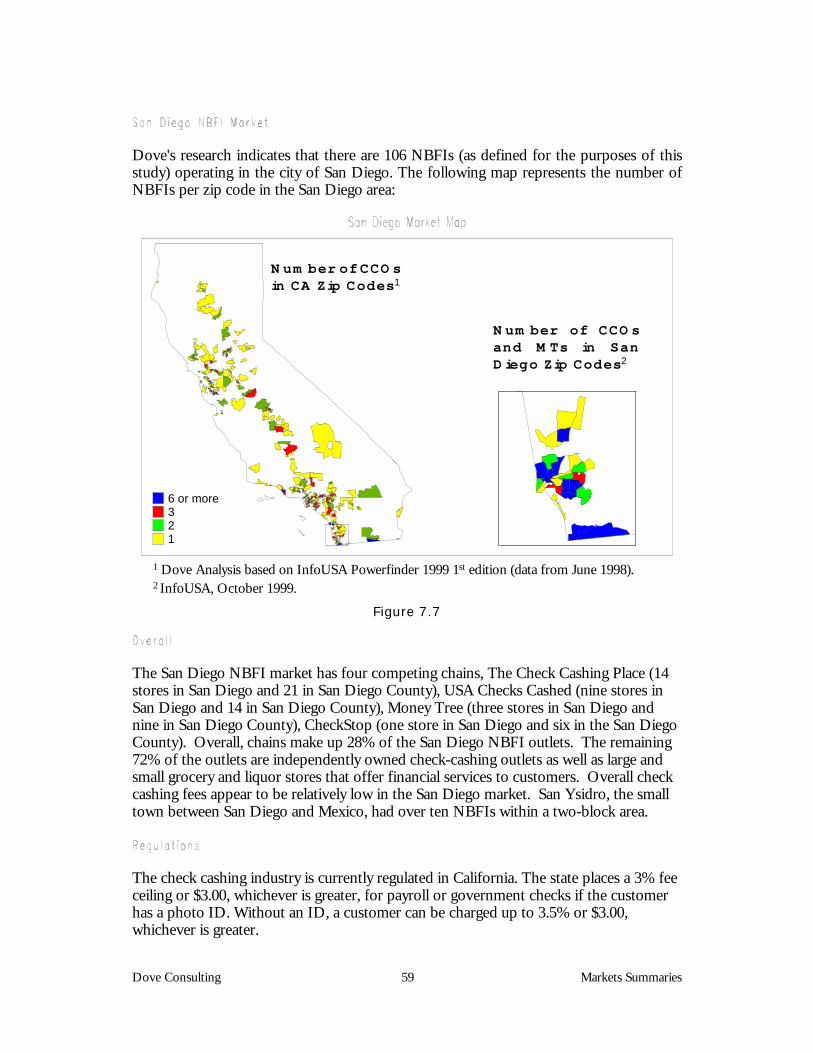
Dove Consulting 59 Markets Summaries
Dove's research indicates that there are 106 NBFIs (as defined for the purposes of thisstudy) operating in the city of San Diego. The following map represents the number ofNBFIs per zip code in the San Diego area:
6 or more321
N um ber of CCO s in CA Zip Codes1
N um ber of CCO sand M Ts in SanD iego Zip Codes2
1 Dove Analysis based on InfoUSA Powerfinder 1999 1st edition (data from June 1998).2 InfoUSA, October 1999.
Figure 7.7
The San Diego NBFI market has four competing chains, The Check Cashing Place (14stores in San Diego and 21 in San Diego County), USA Checks Cashed (nine stores inSan Diego and 14 in San Diego County), Money Tree (three stores in San Diego andnine in San Diego County), CheckStop (one store in San Diego and six in the San DiegoCounty). Overall, chains make up 28% of the San Diego NBFI outlets. The remaining72% of the outlets are independently owned check-cashing outlets as well as large andsmall grocery and liquor stores that offer financial services to customers. Overall checkcashing fees appear to be relatively low in the San Diego market. San Ysidro, the smalltown between San Diego and Mexico, had over ten NBFIs within a two-block area.
The check cashing industry is currently regulated in California. The state places a 3% feeceiling or $3.00, whichever is greater, for payroll or government checks if the customerhas a photo ID. Without an ID, a customer can be charged up to 3.5% or $3.00,whichever is greater.
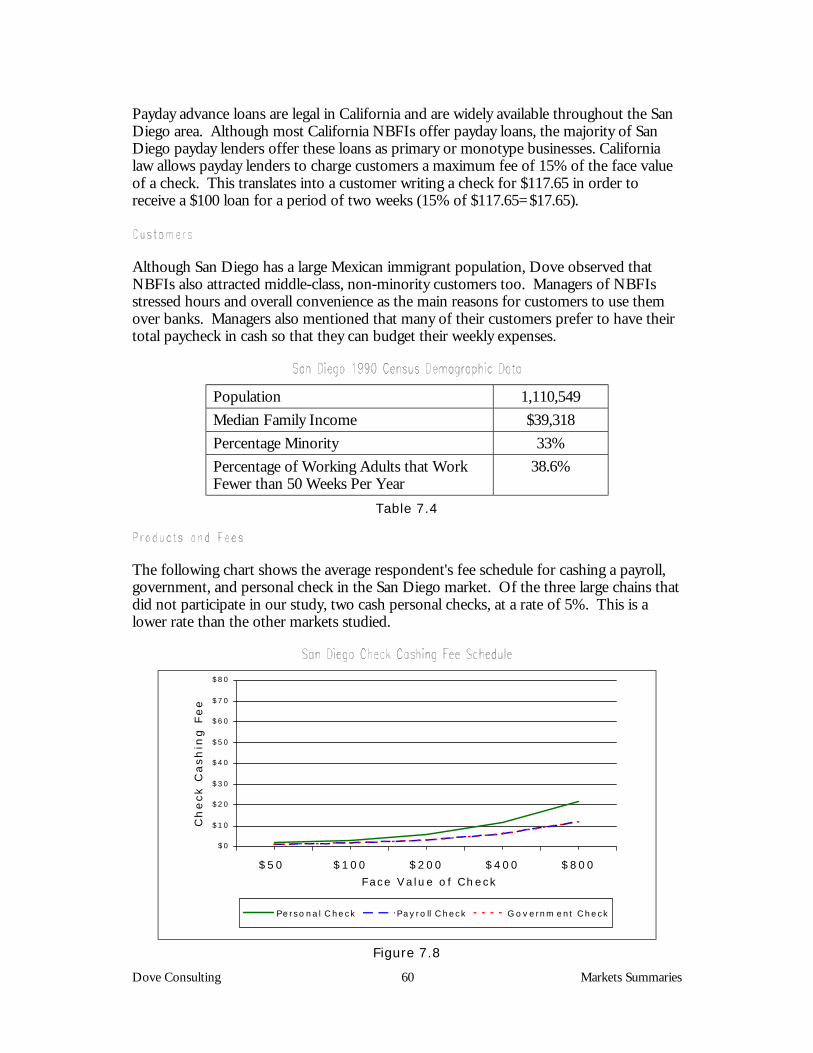
Dove Consulting 60 Markets Summaries
Payday advance loans are legal in California and are widely available throughout the SanDiego area. Although most California NBFIs offer payday loans, the majority of SanDiego payday lenders offer these loans as primary or monotype businesses. Californialaw allows payday lenders to charge customers a maximum fee of 15% of the face valueof a check. This translates into a customer writing a check for $117.65 in order toreceive a $100 loan for a period of two weeks (15% of $117.65=$17.65).
Although San Diego has a large Mexican immigrant population, Dove observed thatNBFIs also attracted middle-class, non-minority customers too. Managers of NBFIsstressed hours and overall convenience as the main reasons for customers to use themover banks. Managers also mentioned that many of their customers prefer to have theirtotal paycheck in cash so that they can budget their weekly expenses.
Population 1,110,549Median Family Income $39,318Percentage Minority 33%Percentage of Working Adults that WorkFewer than 50 Weeks Per Year
38.6%
Table 7.4
The following chart shows the average respondent's fee schedule for cashing a payroll,government, and personal check in the San Diego market. Of the three large chains thatdid not participate in our study, two cash personal checks, at a rate of 5%. This is alower rate than the other markets studied.
$0
$10
$20
$30
$40
$50
$60
$70
$80
$50 $100 $200 $400 $800
Face Value o f Check
Ch
eck
Cash
ing
Fe
e
Pe rso nal C heck Payro ll C heck G o vernm ent Check
Figure 7.8
Dove Consulting 61 Markets Summaries
Direct deposit products were only available through Western Union agents at the SanDiego NBFIs that Dove visited. Only a small number of stores offered WesternUnion's direct deposit service products, for which virtually no customers have signed up.As in other markets, NBFI managers attributed this to the fact that customers really donot benefit from the Western Union product, in that they pay unnecessarily high fees forno added convenience.
The following table shows the average distance between San Diego NBFIs and otherfinancial service providers. San Diego was the only market studied in which NBFIstended to be closer to other NBFIs than to banks. This is most likely due to the highdensity of NBFIs – and limited number of banks – in San Ysidro, the small border townbetween San Diego and the Mexico.
.47 miles .73 miles .47 miles 1.12 miles
The San Diego maps provided in the appendix suggest that NBFIs tend to be present inzip codes where Median Family Income is less than $35,000. On a zip code basis, therewas a significant relationship between the number of NBFIs and the percentage ofworking adults who worked fewer than 50 weeks in 1989. As noted in Chapter 6, it isnot clear that either of these variables are causal, since there was also a significantrelationship between median family income and intermittent workers in 1989.
The maps indicate that NBFIs coexist with other financial service providers in SanAntonio; every zip code with an NBFI also had FI branches or ATMs.
Dove Consulting 62 Case Studies
Chain NBFIs comprise 84 of the 371 outlets identified in the four markets studied(Atlanta, Boston, San Antonio, and San Diego). Chains operate stores in convenientlocations in high volume markets. Their strategies rely heavily on providing theircustomers with a full range of retail financial services while maintaining a larger networkof stores than those of their competitors in the market.
Ace Cash Express (ACE), the largest nationwide check cashing chain, is the only publiclytraded check cashing chain in the United States. Dollar Financial Group, the secondlargest chain, has publicly traded bonds. Stockholders in the company includemanagement, as well as Goldman, Sachs & Company and Leonard Green & PartnersL.P. The following chart compares the two chains from information available in theirSEC filings:
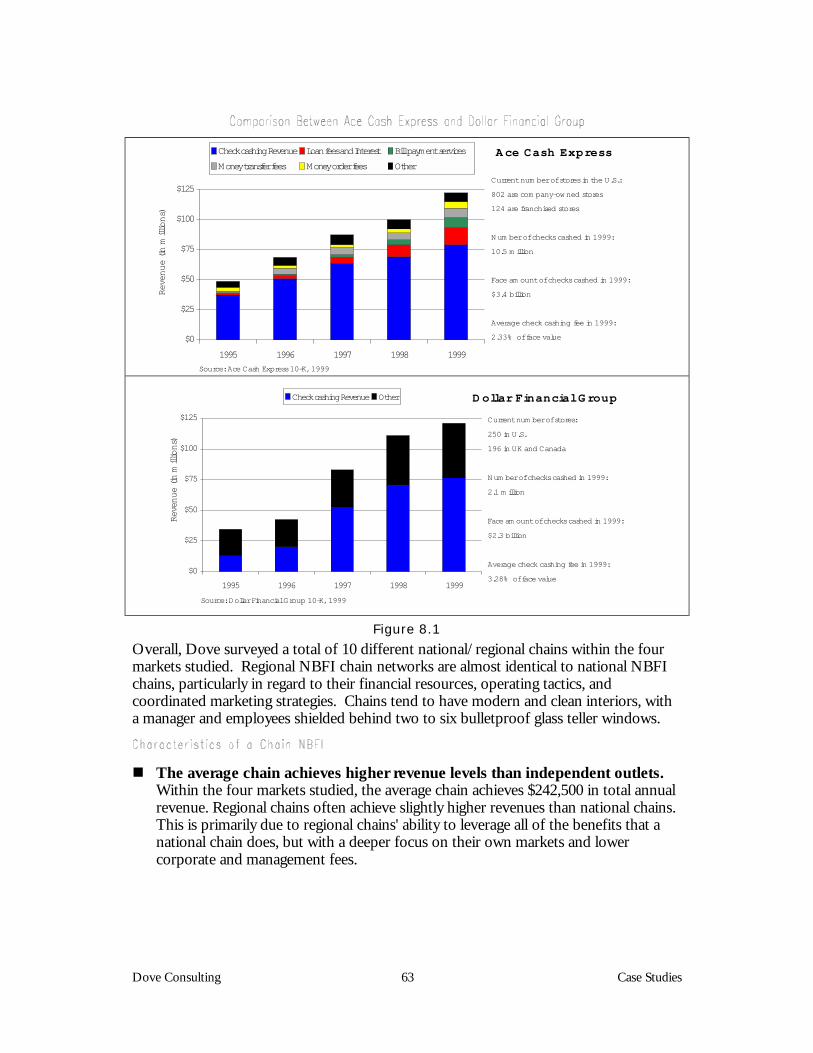
Dove Consulting 63 Case Studies
$0
$25
$50
$75
$100
$125
1995 1996 1997 1998 1999
Check cashing Revenue Loan fees and Interest Bill payment services
Money transfer fees Money order fees Other
A ce Cash ExpressRevenue (in millions)
Source: Ace Cash Express 10-K, 1999
Current num ber of stores in the U.S.:
802 are com pany-ow ned stores
124 are franchised stores
Num ber of checks cashed in 1999:
10.5 m illion
Face am ount of checks cashed in 1999:
$3.4 billion
Average check cashing fee in 1999:
2.33% of face value
D ollar Financial G roup
Revenue (in millions)
Source: Dollar Financial Group 10-K, 1999
Current num ber of stores:
250 in U.S.
196 in UK and Canada
Num ber of checks cashed in 1999:
2.1 m illion
Face am ount of checks cashed in 1999:
$2.3 billion
Average check cashing fee in 1999:
3.28% of face value$0
$25
$50
$75
$100
$125
1995 1996 1997 1998 1999
Check cashing Revenue Other
Figure 8.1
Overall, Dove surveyed a total of 10 different national/regional chains within the fourmarkets studied. Regional NBFI chain networks are almost identical to national NBFIchains, particularly in regard to their financial resources, operating tactics, andcoordinated marketing strategies. Chains tend to have modern and clean interiors, witha manager and employees shielded behind two to six bulletproof glass teller windows.
! The average chain achieves higher revenue levels than independent outlets.Within the four markets studied, the average chain achieves $242,500 in total annualrevenue. Regional chains often achieve slightly higher revenues than national chains.This is primarily due to regional chains' ability to leverage all of the benefits that anational chain does, but with a deeper focus on their own markets and lowercorporate and management fees.
Dove Consulting 64 Case Studies
! Chain NBFIs typically offer a wide range of financial and non-financialrelated services. These services include check-cashing, money orders, moneytransmission, bill-payment, and, where legal, payday loans. Many chain outlets alsooffer lottery tickets, public transportation passes, photocopying and faxing services,postage stamps and phone cards.
! The average chain NBFI cashes a higher volume of checks than independentoutlets. The average chain outlet within the markets studied cashed 2,629 checkseach month, compared to the 1,087 checks cashed by the average independentoperator. This difference in check cashing volume can best be explained by theconvenient locations of many chain NBFIs, particularly their close proximity tomajor intersections and mass transit routes, as well as the business impacts of brandrecognition and a coordinated marketing strategy.
! The fees charged by national chains are higher than those charged byindependent NBFIs. In the four markets studied, the chain NBFIs charged anaverage of $5.50 per check cashed, whereas the independent check cashers chargednearly 30% less for the same transaction, an average of $4.25. The independentcheck cashers charge lower fees to establish a loyal customer base and to competewith the larger chains, which are widespread in the markets in more convenientlocations. Although check-cashing fees are higher among chain NBFIs, chainsusually charge less for money orders.
! Chain NBFIs tend to be open fewer hours than independent NBFIs.Although some chains, particularly on the regional level, are open 24 hours and/oron Sundays, the average chain in our study is open from 9:00 a.m. until 7:00 p.m.,Monday through Thursday, 9:00 a.m. until 8:00 p.m. on Friday, 9:00 a.m. until 7:00p.m. on Saturday, and closed Sunday.
! Chain NBFIs have smaller stores than independent outlets, while havingmore employees and teller windows, and closer proximity to majorintersections and mass transit routes. Specifically, the average chain NBFIemploys 2.5 tellers, has a combined lobby/office space of less than 1,300 square feet,and is 0.3 blocks away from the nearest mass transit stop. Overall, it appears thatthe chains use their industry knowledge to minimize costs and maximize theusefulness of their store's space.
Chain NBFIs compete with all other check cashing stores, grocery stores, banks, and anyretail businesses that cashes checks, sells money orders, or provides money transferservices. National chain NBFIs are particularly invulnerable to new entrants. A newcompetitor would have difficulty threatening a well-established large chain that alreadyhas a coordinated marketing strategy, high brand recognition, and a loyal customer base.A major competitive advantage for chain NBFIs is that many of them offer frequentmember cards. These cards often offer discounts and allow a customer to cash checks atany outlet within a chain's network.
Dove Consulting 65 Case Studies
The alternative avenues to customers forces chain NBFIs to compete on fees, additionalservices, and hours. Although chains' fees appear to be higher on average, customerswould seek an alternative financial service provider if fees became too high.
Unlike independent NBFIs, which are constrained by their limited bargaining power,chain NBFIs are able to leverage their size to negotiate more favorable contracts withbanks and money order and transmission providers.Substitute products and services may offer a competitive advantage over the high feesassociated with a national NBFI. Customers may be willing to trade off a large numberof locations for a conveniently located independent outlet that charges lower fees. If alarge network of outlets is a customer's priority, then a bank may be a viable alternative.The rivalry among the existing chain NBFIs contributes substantially to the competitionof this industry segment. The chains in the four markets leveraged their strong marketpresence and brand recognition to charge higher fees. The competitive markets,particularly those with more than one chain, keep pricing in close proximity to theoverall market averages.
A basic financial analysis of the revenues and expenses of chain NBFIs reveals that theyare more profitable than the other players in this industry.
! The average annual revenue of chain NBFIs is higher than independentoutlets. The average chain outlet that responded to the Treasury survey generatedper-store annual revenues of $242,500.
! The average chain outlet that responded to our study incurs average annualper-store expenses of $177,500.
! The average chain outlet achieves greater pre-tax profits than the averageindependent outlet. The average chain outlet had a net income of $65,000 peryear, representing 28.6% of total revenues. In contrast, independents generated ahigher profit rate on a smaller revenue base per outlet.
Large chains have positioned themselves to benefit from industry consolidation. Manynational and regional chains now offer payday loans, where laws permit, to offerfinancial services for the growing banked population. Large chains have the funding andresources necessary for developing new products to attract both new and old customers,such as direct deposit products or check cashing ATMs. At a time when everything isbecoming electronic, these and other innovations may be necessary for NBFIs tocompete effectively in the future and to ensure their long-term success.
Dove Consulting 66 Case Studies
Independent check cashers comprise 236 of the 371 check cashers identified in the fourmarkets studied (Atlanta, Boston, San Antonio, and San Diego). Because independentstores make up 64% of the check cashing outlets in these cities, it is useful to understandthe characteristics that set the independent check cashers apart from regional andnational chain NBFIs. While the chain outlets have developed a coordinated andstrategic approach to offering check cashing and other financial services, theindependent stores offer nearly all of the same services, but at lower prices. These lowerfees, combined with good customer service with a personal touch, are the keys toindependent check cashers' ability to compete.Store A, the independent NBFI upon which this case study is based, is located on amajor road in San Antonio. The store is both modern and clean, and the owner and twoemployees sit in the back office shielded behind two bulletproof glass teller windows.
! Store A generated approximately $144,000 ($12,000 per month) in 1999. Thisrevenue level is consistent with other independent outlets in this market.
! Store A provides many of the same services offered by chain NBFIs. Theseservice offerings include check cashing, money orders, money transmission, phonecards, transportation passes, and lottery tickets. In an effort to become morecompetitive and increase revenues, Store A also offers on-site check cashing servicesto large companies through the use of an armored car. Like many independentoperations, Store A is willing to cash personal checks for regular clientele. Chainsoften refrain from such activities.
! Store A cashes approximately 850 checks each month, compared to the 2,629checks cashed by the average chain operator. This significant difference incheck cashing volume can best be explained by the convenient locations of manychain NBFIs, as well as the business impacts of brand recognition and a coordinatedmarketing strategy.
! Store A, and other independent outlets in the markets studied, charged lowerfees than chain NBFIs. Store A charged an average of $4.95 per check cashed. Inthe four markets studied, the independent NBFIs charged an average of $4.25 percheck cashed, whereas the chain check cashers charged nearly 30% more for thesame transaction, an average of $5.50. The independent check cashers charge lowerfees to establish a loyal customer base and to compete with the larger chains, whichare widespread in the markets in very convenient locations.
Dove Consulting 67 Case Studies
! The hours of operation of the average independent check casher are moreextensive than those offered by the chain NBFIs. Store A is open from 9:00a.m. until 7:00 p.m., Monday through Thursday, 9:00 a.m. until 7:30 p.m. on Friday,9:00 a.m. until 5:00 p.m. on Saturday, and closed Sunday. Although these hours arenot more extensive than the average San Antonio chain, on average, an independentstore is open 8.3 hours more each week than a chain operation. Specifically, theaverage independent check casher is open 73.8 hours each week and is operationalon Sundays. In contrast, the chain NBFIs are open 65.5 hours each week, 11%fewer hours than the independent stores. The longer working hours allow theindependents to become more competitive vis-à-vis the larger chain stores.
! When compared to chain NBFIs, the average independent check casher islarger in size, has fewer employees, and is farther away from mass transitstops. Specifically, the average independent outlet is storefront, employs 1.5 tellers,has a combined lobby/office space of over 1,800 square feet, and is 1.6 blocks awayfrom the nearest mass transit stop. In contrast, the average chain/franchise NBFI ispart of a strip mall, employs 2.5 tellers, has a combined lobby/office space of under1,300 square feet, and is 0.3 blocks away from the nearest mass transit stop. Thislast point supports the idea that chain NBFIs are situated in the most convenientlocations. Store A resembled the size and location of a chain by having an 800-square feet lobby/office space, with two tellers on duty, and being situated only 0.5blocks away from the nearest bus route.
As is evident from the points mentioned above, the average independent check casherfaces strong competition from chain NBFIs as well as other small independentoperators. The independents compete with the larger chain stores and with each otherin terms of location (namely convenience for the customer), positioning, fees, services,and hours of operation.The constant threat of new check cashing outlets opening greatly affects the competitivelandscape for the independent NBFIs. Despite the intense competition among existingfirms, well-located and organized outlets can be lucrative for independent and chainNBFIs alike. Therefore, the industry as a whole is vulnerable to new entrants, many ofwhom are implementing the one-stop shopping model by incorporating the checkcashing services in supermarkets, grocery stores, and malls.The alternatives for customers are affecting the competitive positioning of theindependents and causing them to have to compete on fees, additional services, andhours. The independent check cashers have positioned themselves as economicalneighborhood financial centers with a personal touch, going beyond the proposition ofthe chain stores. By doing so, the independents have attracted a loyal customer base thatvalues lower fees and more extensive hours.
Dove Consulting 68 Case Studies
Independent NBFIs often have difficulty negotiating as good of a deal with banks forcash and money services as chains, which adversely affects their ability to compete andtheir profitability. The low check volume of the independent check cashers limits theirability to negotiate favorable terms with servicing banks. Store A, for example, pays20% of their total revenues to a bank for cash, credit, and money services. They pay theprime rate plus 1% on an average float of five days, during which time Store A's checksare in the process of being credited to their account. Chain NBFIs, on the other hand,may be able to negotiate immediate credit on funds, or may have sufficient cash reservesto finance their daily operations and cash needs.Substitute products and services, such as the affiliation products of the chain NBFIs, canthreaten the independent NBFIs’ ability to compete. For example, one chain offerscustomers a connected database similar to branch banking in its 20+ stores in SanAntonio. This allows customers to cash checks conveniently at multiple locationsaround the city. Such networks severely limit the ability of the independents to competeon convenience.During the trade audits in the four markets, several independent NBFIs reported thattheir pricing policies were influenced by those of other independents in the area. Ingeneral, the independents underpriced for check cashing services vis-à-vis chain outlets,but continued to compete below this ceiling among fellow independent stores. As such,the presence of independent outlets and the portfolio of products and services theyoffer, together with their pricing policies, will drive the competition in this industrysegment.
A basic financial analysis of the revenues and expenses of the independent and chainNBFIs reveals that, in general, all check cashing outlets are generating significant profits.
! The average annual revenues of independent operations are lower than chainNBFIs. This disparity in revenues results from independent check cashers’ lowerfees and lower volumes. Store A generated approximately $144,000 in revenue in1999. This is within $4,000 of the average San Antonio respondent, but well abovethe average respondent across all markets.
! The hours of operation for independent outlets and higher bank fees result inhigher costs and reduced profitability. Store A incurred $90,720 (63% of totalrevenues) in expenses in 1999, which, as a percentage, is slightly below other SanAntonio respondents and the average respondent across all four markets.Independent check cashers may pay up to 20% of total revenues to the servicingbanks that provide cash credit, and other financial services. In addition to these highcosts, the independents have greater operating costs associated with extensiveworking hours and the inability to benefit from economies of scale. The followingchart represents a basic cost analysis of Store A:
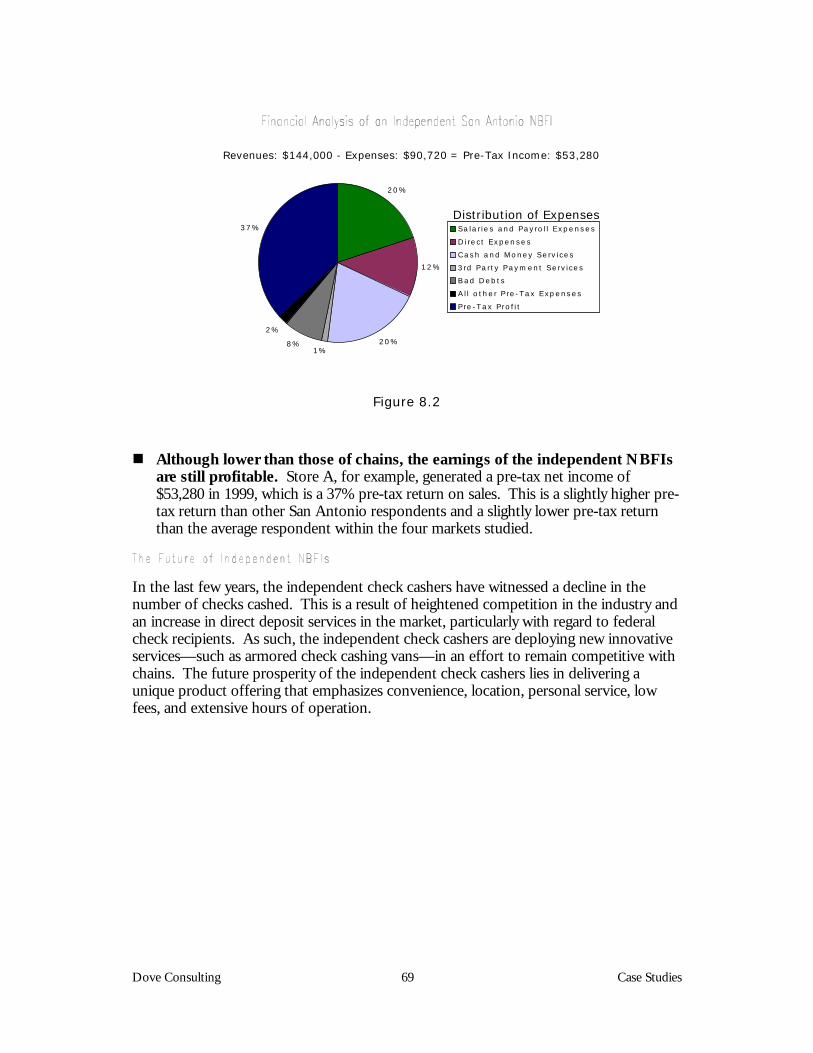
Dove Consulting 69 Case Studies
20%
12%
20%1%
8%
2%
37% Sa la rie s and Payro ll Expenses
Direct Expense s
Cash and Money Services
3rd Pa rty Payment Services
Bad Debts
A ll o the r P re -Tax Expenses
Pre -Tax Pro fit
Revenues: $144,000 - Expenses: $90,720 = Pre-Tax Income: $53,280
Distribution of Expenses
Figure 8.2
! Although lower than those of chains, the earnings of the independent NBFIsare still profitable. Store A, for example, generated a pre-tax net income of$53,280 in 1999, which is a 37% pre-tax return on sales. This is a slightly higher pre-tax return than other San Antonio respondents and a slightly lower pre-tax returnthan the average respondent within the four markets studied.
In the last few years, the independent check cashers have witnessed a decline in thenumber of checks cashed. This is a result of heightened competition in the industry andan increase in direct deposit services in the market, particularly with regard to federalcheck recipients. As such, the independent check cashers are deploying new innovativeservices—such as armored check cashing vans—in an effort to remain competitive withchains. The future prosperity of the independent check cashers lies in delivering aunique product offering that emphasizes convenience, location, personal service, lowfees, and extensive hours of operation.
Dove Consulting 70 Appendices
Dove Consulting 1 Appendices
Department of the TreasuryNon-Bank Financial Institutions Survey
Dove Consulting will ensure the confidentiality of all responses to this survey, and will notrelease any data that could be used to identify your facility to the U.S. Department of the
Treasury or any other party.
ESPAÑOL: Si usted necesita una copia en español, por favor
llame a Kate Garnica al numero gratuito 1-800-895-3900 Ext. 255
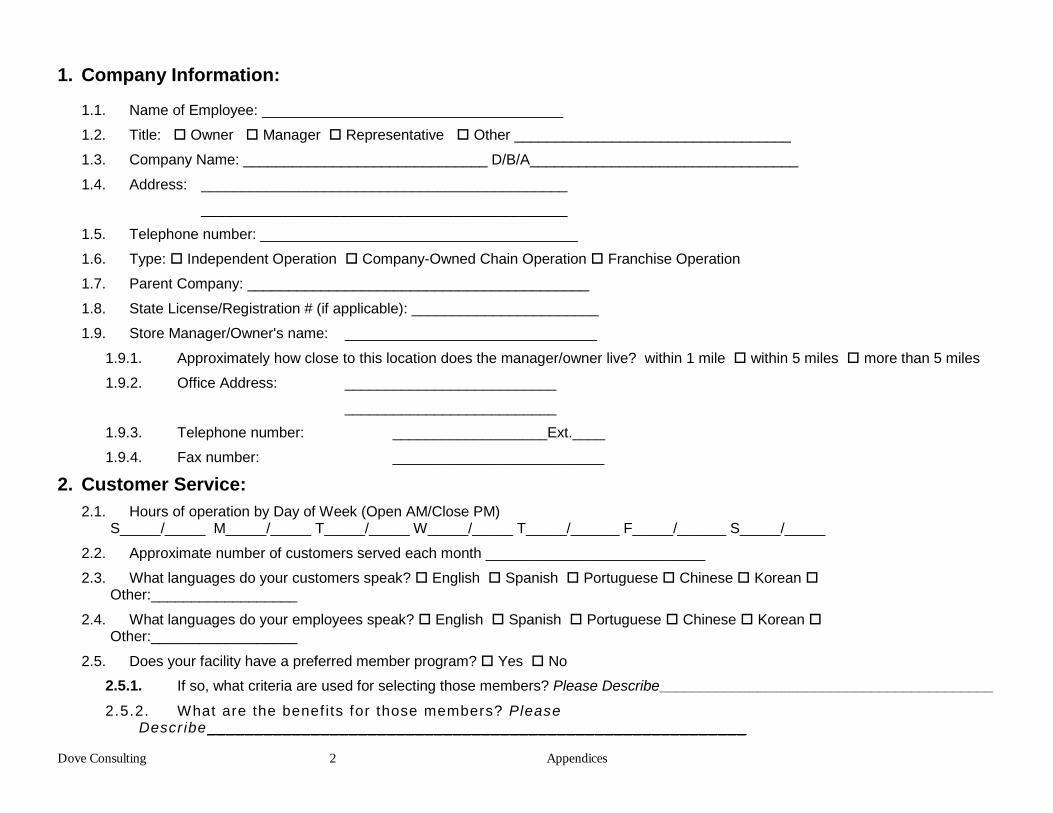
Dove Consulting 2 Appendices
1. Company Information:
1.1. Name of Employee: _____________________________________1.2. Title: ! Owner ! Manager ! Representative ! Other __________________________________1.3. Company Name: ______________________________ D/B/A_________________________________1.4. Address: _____________________________________________
_____________________________________________1.5. Telephone number: _______________________________________1.6. Type: ! Independent Operation ! Company-Owned Chain Operation ! Franchise Operation1.7. Parent Company: __________________________________________1.8. State License/Registration # (if applicable): _______________________1.9. Store Manager/Owner's name: _______________________________
1.9.1. Approximately how close to this location does the manager/owner live? within 1 mile ! within 5 miles ! more than 5 miles1.9.2. Office Address: __________________________
__________________________1.9.3. Telephone number: ___________________Ext.____1.9.4. Fax number: __________________________
2. Customer Service:2.1. Hours of operation by Day of Week (Open AM/Close PM)
S_____/_____ M_____/_____ T_____/_____ W_____/_____ T_____/______ F_____/______ S_____/_____2.2. Approximate number of customers served each month ___________________________2.3. What languages do your customers speak? ! English ! Spanish ! Portuguese ! Chinese ! Korean !
Other:__________________2.4. What languages do your employees speak? ! English ! Spanish ! Portuguese ! Chinese ! Korean !
Other:__________________2.5. Does your facility have a preferred member program? ! Yes ! No
2.5.1. If so, what criteria are used for selecting those members? Please Describe_________________________________________2.5.2. What are the benef its for those members? Please
Descr ibe_________________________________________________________
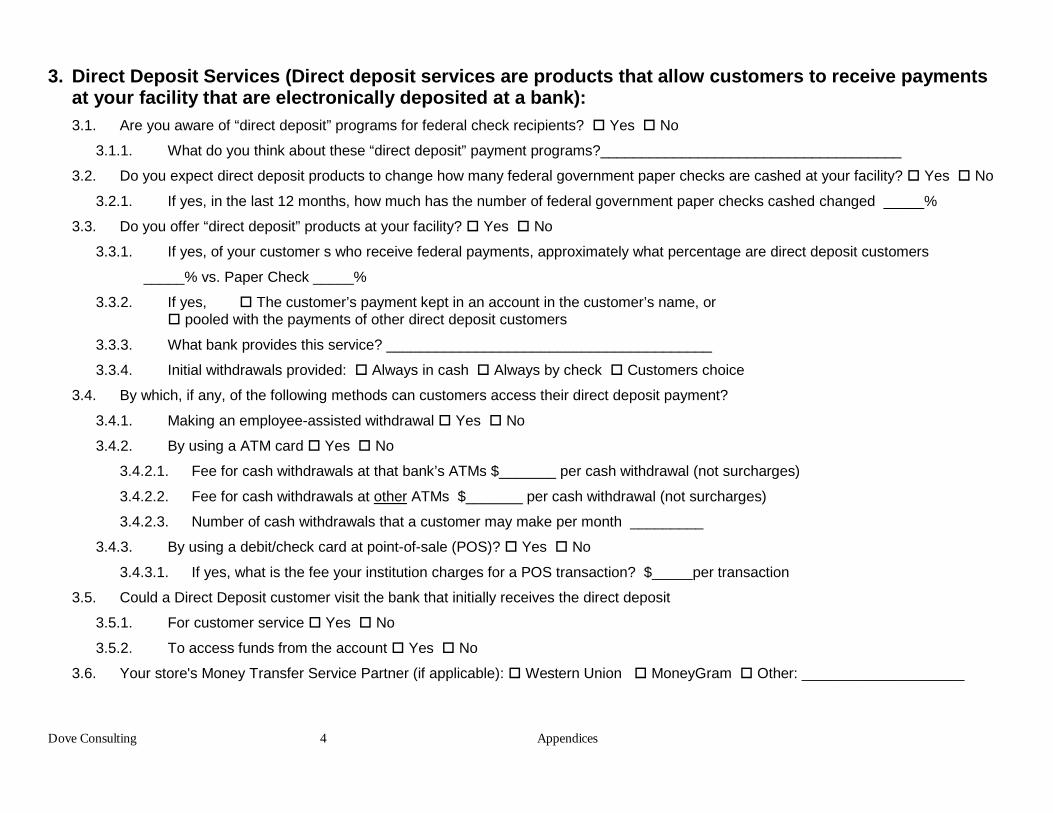
Dove Consulting 4 Appendices
3. Direct Deposit Services (Direct deposit services are products that allow customers to receive paymentsat your facility that are electronically deposited at a bank):3.1. Are you aware of “direct deposit” programs for federal check recipients? " Yes " No
3.1.1. What do you think about these “direct deposit” payment programs?_____________________________________
3.2. Do you expect direct deposit products to change how many federal government paper checks are cashed at your facility? " Yes " No
3.2.1. If yes, in the last 12 months, how much has the number of federal government paper checks cashed changed _____%
3.3. Do you offer “direct deposit” products at your facility? " Yes " No
3.3.1. If yes, of your customer s who receive federal payments, approximately what percentage are direct deposit customers
_____% vs. Paper Check _____%
3.3.2. If yes, " The customer’s payment kept in an account in the customer’s name, or " pooled with the payments of other direct deposit customers
3.3.3. What bank provides this service? ________________________________________
3.3.4. Initial withdrawals provided: " Always in cash " Always by check " Customers choice
3.4. By which, if any, of the following methods can customers access their direct deposit payment?
3.4.1. Making an employee-assisted withdrawal " Yes " No
3.4.2. By using a ATM card " Yes " No
3.4.2.1. Fee for cash withdrawals at that bank’s ATMs $_______ per cash withdrawal (not surcharges)
3.4.2.2. Fee for cash withdrawals at other ATMs $_______ per cash withdrawal (not surcharges)
3.4.2.3. Number of cash withdrawals that a customer may make per month _________
3.4.3. By using a debit/check card at point-of-sale (POS)? " Yes " No
3.4.3.1. If yes, what is the fee your institution charges for a POS transaction? $_____per transaction
3.5. Could a Direct Deposit customer visit the bank that initially receives the direct deposit
3.5.1. For customer service " Yes " No
3.5.2. To access funds from the account " Yes " No
3.6. Your store's Money Transfer Service Partner (if applicable): " Western Union " MoneyGram " Other: ____________________
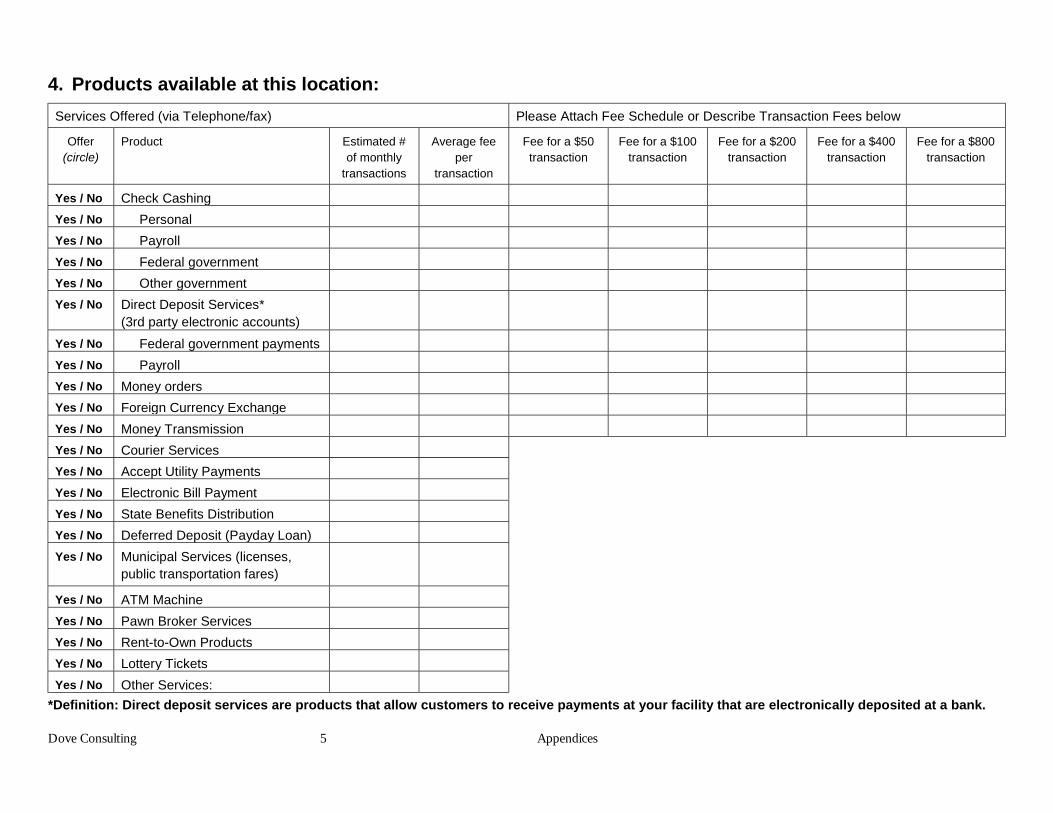
Dove Consulting 5 Appendices
4. Products available at this location:Services Offered (via Telephone/fax) Please Attach Fee Schedule or Describe Transaction Fees below
Offer(circle)
Product Estimated #of monthly
transactions
Average feeper
transaction
Fee for a $50transaction
Fee for a $100transaction
Fee for a $200transaction
Fee for a $400transaction
Fee for a $800transaction
Yes / No Check CashingYes / No PersonalYes / No PayrollYes / No Federal governmentYes / No Other governmentYes / No Direct Deposit Services*
(3rd party electronic accounts)Yes / No Federal government paymentsYes / No PayrollYes / No Money ordersYes / No Foreign Currency ExchangeYes / No Money TransmissionYes / No Courier ServicesYes / No Accept Utility PaymentsYes / No Electronic Bill PaymentYes / No State Benefits DistributionYes / No Deferred Deposit (Payday Loan)Yes / No Municipal Services (licenses,
public transportation fares)
Yes / No ATM MachineYes / No Pawn Broker ServicesYes / No Rent-to-Own ProductsYes / No Lottery TicketsYes / No Other Services:
*Definition: Direct deposit services are products that allow customers to receive payments at your facility that are electronically deposited at a bank.
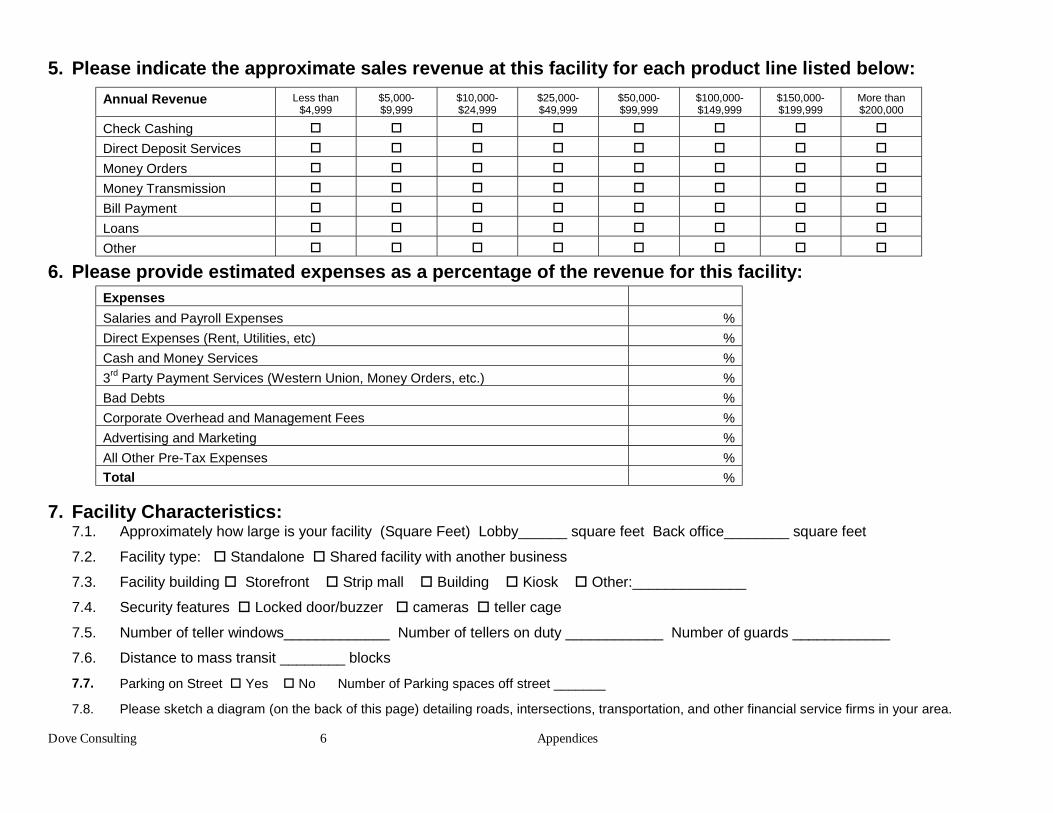
Dove Consulting 6 Appendices
5. Please indicate the approximate sales revenue at this facility for each product line listed below:Annual Revenue Less than
$4,999$5,000-$9,999
$10,000-$24,999
$25,000-$49,999
$50,000-$99,999
$100,000-$149,999
$150,000-$199,999
More than$200,000
Check Cashing " " " " " " " "
Direct Deposit Services " " " " " " " "
Money Orders " " " " " " " "
Money Transmission " " " " " " " "
Bill Payment " " " " " " " "
Loans " " " " " " " "
Other " " " " " " " "
6. Please provide estimated expenses as a percentage of the revenue for this facility:ExpensesSalaries and Payroll Expenses %Direct Expenses (Rent, Utilities, etc) %Cash and Money Services %3rd Party Payment Services (Western Union, Money Orders, etc.) %Bad Debts %Corporate Overhead and Management Fees %Advertising and Marketing %All Other Pre-Tax Expenses %Total %
7. Facility Characteristics:7.1. Approximately how large is your facility (Square Feet) Lobby______ square feet Back office________ square feet
7.2. Facility type: " Standalone " Shared facility with another business
7.3. Facility building " Storefront " Strip mall " Building " Kiosk " Other:______________
7.4. Security features " Locked door/buzzer " cameras " teller cage
7.5. Number of teller windows_____________ Number of tellers on duty ____________ Number of guards ____________
7.6. Distance to mass transit ________ blocks7.7. Parking on Street " Yes " No Number of Parking spaces off street _______
7.8. Please sketch a diagram (on the back of this page) detailing roads, intersections, transportation, and other financial service firms in your area.
Dove Consulting 1 Appendices
1 Given the constraints of the study, Treasury did not ask Dove to survey traditional financial institutionsfor similar information on their products, prices and profitability.
2 Forty-eight (48) percent of surveyed NBFIs also offered Lottery Tickets as an inducement to attractcustomer traffic.
3 Payday loans were also available through Banco Popular in a small number of NBFIs in San Antonio.
4 Arthur B. Kennickell, Martha Starr-McCluer, and Brian J. Surette, "Recent Changes in U.S. FamilyFinances: Results from the 1998 Survey of Consumer Finances," Federal Reserve Bulletin, January 2000.
5 Arthur B. Kennickell, Martha Starr-McCluer, and Annika E. Sunden, "Family Finances in the U.S.:Recent Evidence from the Survey of Consumer Finances," Federal Reserve Bulletin, January 1997.
6 Arthur B. Kennickell, Martha Starr-McCluer, and Brian J. Surette, "Recent Changes in U.S. FamilyFinances: Results from the 1998 Survey of Consumer Finances," Federal Reserve Bulletin, January 2000.
7 Dove Analysis based on Booz Allen & Hamilton/Shugoll Research Mandatory EFT DemographicStudy, 1997
8 Stephens Inc., Specialty Finance Industry Report, March 9, 1999.
9 John Caskey, Lower-Income Americans, High-Cost Financial Services, Filene Research Institute, 1997.
10 Dove Analysis based on "Where Cash is King", Fortune Magazine, June 8, 1998.
11 InfoUSA, March 2000.
12 Dove Analysis based on InfoUSA Powerfinder 1999 1st edition (data from June 1998).
13 InfoUSA, October 1999.
14 InfoUSA, March 2000.
15 Check-Cashing Outlet defined as businesses that are listed in InfoUSA's telephone database under theprimary SIC code 609903 (check cashing services).
16 InfoUSA, October 1999. SIC Code # 609910: Money Transfer Service.
17 First Data Investor Relations, November 30, 1999. Viad Corporation Investor Relations, November 30,1999.
18 SIC Code # 609903: Check Cashing Services, SIC Code # 609901: Currency Exchange, SIC Code #609910: Money Transfer Service.
19 Coopers & Lybrand, Non-Bank Financial Institutions: A Study of Five Sectors, Financial CrimesEnforcement Network, February 1997.
Dove Consulting 2 Appendices
20 Some respondents did not differentiate between “federal” and “other” government checks (seeAppendix 1 – Questionnaire) and therefore left the “other” category blank.
21ATM location data is from the 1998 Visa Plus Network CD-ROM Directory. Post offices were includedin the analysis for two reasons: (1) they are suppliers of some financial services that NBFIs offer, such asmoney orders; and (2) Treasury is participating in a pilot in which ATMs are being placed in post officelobbies in six lower-income communities that are underserved by traditional financial institutions.
22 John P. Caskey. Fringe Banking: Check-Cashing Outlets, Pawn Shops and the Poor. Russell SageFoundation, 1996.
23 Arthur B. Kennickell, Martha Starr-McCluer, and Brian J. Surette, "Recent Changes in U.S. FamilyFinances: Results from the 1998 Survey of Consumer Finances," Federal Reserve Bulletin, January 2000.
24 Social Security Administration, Annual Statistical Supplement,http://www.ssa.gov/statistics/Supplement/1999/tables/html/index.html.
25 The Massachusetts Division of Banks Check Casher Report, March 1999.


![Ghana: Non-Bank Financial Institutions Business …...NON-BANK FINANCIAL INSTITUTIONS BUSINESS [BOG] RULES (AS APPLICABLE TO NON-DEPOSIT TAKING INSTITUTIONS) BANK OF GHANA NON-BANK](https://img.pdfslide.net/doc/110x75/5e5b7d7377393d790959caf8/ghana-non-bank-financial-institutions-business-non-bank-financial-institutions.jpg)