Embed Size (px)
Citation preview

OEDA-Spanish Observatoryon Drugs and AddictionsOEDA-Spanish Observatoryon Drugs and Addictions
Survey on Drugs and other addictions among Secondary School Teachers
Government Delegationfor the National Plan on Drugs
EPAD 2016

MANAGEMENT, ANALYSIS AND DRAFTING
Spanish Observatory on Drugs and Addictions. Governement Delegation for the National Plan on Drugs (DGPNSD)
Rosario SENDINO. Director of the Information Systems and Documentation Unit
Elena ÁLVAREZ, Begoña BRIME, Noelia LLORENS, Eva SÁNCHEZ
ACKNOWLEDGEMENTS
Coordinators of the Autonomous Communities Drug Departments and staff belonging to the Information Systems on Drugs and Addictions in the Autonomous Communities/Cities
Ministry of Education, Culture and Sports and Departments of Education of the Autonomous Communities
CONTACT
Address: Delegación del Gobierno para el Plan Nacional sobre Drogas. Plaza de España,17-28008 Madrid
Phone: 918220000-Fax: 918226108
E-mail: [email protected]
http://www.pnsd.msssi.gob.es/
EDITED AND DISTRIBUTED BY:
© MINISTRY OF HEALTH, SOCIAL SERVICES AND EQUALITY
Publications Center
© SECRETARIAT OF STATE OF SOCIAL SERVICES AND EQUALITY
Delegation of the Government for the National Plan on Drugs
NIPO

ContentIntroduction4
Objectives5
Methodology6
Results10
Scope / importance of the problem of psychoactive substances use at School · 13
Effects of psychoactive substances use on the students´ academic performance and behaviour · 22
Training received by teachers on psychoactive substances and other addictions · 27
Actions undertaken by teachers on psychoactive substances and other addictions · 36
Actions undertaken within the educational centers on psychoactive substances and other addictions · 40
Assessment of the actions undertaken within th educational center on psychoactive substances and other addictions · 45
Usefulness/applicability of training received by teachers · 32
Visibility and consequences of the misuse of new technologies · 23
Students training needs in addictions and related subjects · 24
Visibility of psychoactive substances inside and outside school · 15
Risk associated with psychoactive substances use · 18
Perceptions and opinions of Secondary School teachers on psychoactive substances and other addictions . 13
Perceptions and opinions of Secondary School teachers on the training received on psychoactive substances and other addictions . 27
Perceptions and opinions of Secondary School teachers on the actions undertaken in educational ccenters on psychoactive substances and other addictions . 36
Recommendations50
Conclusions47

2016 · EPAD · 4
Introducción
This document is presenting the main results of the “2016 Survey on Drugs and other addictions among Secondary School Teachers “.
Young people are one of the population groups most exposed to the consumption of psychoactive subs-tances, and their attitudes and behaviors regarding consumption change quite quickly. Consequently, it is important to have regular and updated information on these phenomena in order to develop and rationally evaluate programs and interventions aimed at reducing consumption and associated problems.
In order to have a global vision of the phenomenon, it is necessary to contrast information obtained through various sources of information. In Spain, a periodic survey on the use of drugs among secondary school students (ESTUDES) is carried out and it is very useful to be able to complete the information obtained through the students with the opinions of their teachers. This is how the EPAD survey came about, which is carried out simultaneously with ESTUDES to know the perceptions and opinions of Secondary School teachers regarding different aspects of drug use and other addictions.
The strong presence that new technologies currently have in our society has led to the inclusion, in both 2014 and 2016 EPAD editions, of a series of additional questions about the use, risks and negative consequences derived from the misuse of thereof. Questions about this area have also been introduced in the 2014 and 2016 ESTUDES survey.
The EPAD survey began in 2000 with a biennial periodicity, so this is the ninth edition. Its financing and promotion corresponds to the Government Delegation for the National Plan on Drugs (DGPNSD) and has the collaboration of the governments of the Autonomous Communities (Autonomous Communities Drug and Education Departments) and the Spanish Ministry of Education, Culture and Sports.
Finally, the opportunity provided by schools to carry out interventions in the field of addictions preventions and health promotion should be born in mind; so their information and feedback is really useful.

2016 · EPAD · 5
Objectives
The objective of the EPAD survey is to know the perceptions and opinions of Secondary School teachers regarding different aspects related to drug use and other addictions.
The results should help design and evaluate, on the basis of knowledge, interventions in this field.
In addition to complying with the general objective stated above, among the specific objectives of this survey is to gather information on:
• Teachers’ perceptions and opinions regarding certain aspects related to the consumption of psychoactive substances and other addictions. These include the importance given to the problem of drugs and other addictions at school, the visibility of the phenomenon, drug use risk perception, the consequences of legal and illegal drugs use and of the inappropriate use of new technologies in the students´ behavior and academic performance, and also teachers´ opinions on students training needs.
• Teachers´ perceptions and opinions on the training they have received on psychoactive substances and other addictions, addressing different aspects such as the percentage of teachers who have received training, its contents and main features, the reasons why they may have not received it, the usefulness / applicability of training at schools and the type of institution where the training programs are coming from.
• Teachers´ perceptions and opinions on the actions taken / carried out in educational centers in relation to psychoactive substances and other addictions, which includes information on the actions carried out by the educational center and those carried out by teachers in particular, as well as the opinion of the teachers on the actions carried out in the centers.
The EPAD 2016 questionnaire, when talking about other addictions, refers basically to the misuse of new technolo-gies, mobile phones, the internet and social networks.

2016 · EPAD · 6
Methodology
Summary of the main methodological aspects of the 2016 Survey on Drugs and other addictions among Secondary School Teachers EPAD 2016
GENERAL FEATURES
Description Survey carried out at school centers among Secondary School teachers This survey is carried out simultaneously with the 14 to 18 year old Secondary School Students Survey on Drugs (ESTUDES)
Periodicity Biennial since 2000
Responsible Spanish Observatory on Drugs and Addictions (Spanish: OEDA). Government Delegation for the National Plan on Drugs (DGPNSD). Ministry of Health, Social Services and Equality (MSSSI).
SCOPE OF THE SURVEY
Geographical The survey is carried out throughout the national territory. The results are representative at the national level.
Demographics The universe is made up of Secondary school teachers in Spain: 3rd and 4th ESO grade, 1st and 2nd year of Bachillerato, Basic Vocational Education Cycles and Medium Level Vocational Educational Cycles.
Time frame Fieldwork period lasted from November 18, 2016 to March 8, 2017.
DESIGN AND CHARACTERISTICS OF THE SAMPLE. WEIGHING
Sample design and sampling
The selection of educational centers is made from lists of the State Registry of Educational Centers of the Ministry of Education, Culture and Sports are used to select the survey sample. Previous stratification by communities/ autonomous cities (19 strata) and by type of center (2 strata: public and private schools) is required.
For the selection of the teachers´ sample, a sampling by two-stage conglomerates has been used where schools have been randomly selected as first stage units and teachers as second stage units.
Weighing The sample has been aproportionally divided in order to guarantee a minimum number in each stratum. The results have been weighted according to the number of teachers per autonomous communities/cities and type of center (public or private) to restore proportionality to the universe.
Sample size 4,366 teachers
Sample error Maximum sample error (95% confidence level for p = 0.5) of 1.5%.

2016 · EPAD · 7
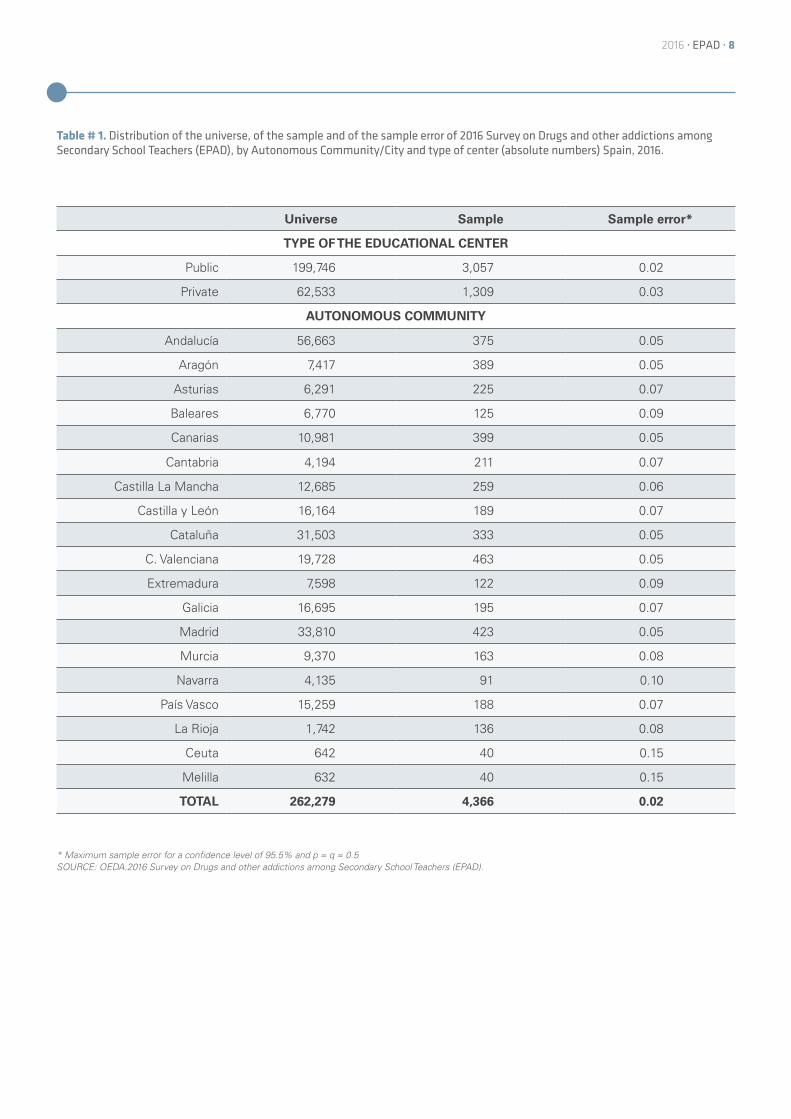
Tables are showing the distribution of teachers of Secondary Education in Spain, the distribution of teachers included in the 2016 EPAD sample, breakdown of sample errors by Autonomous Community/City and number of provided, collected, cancelled and valid 2016 EPAD questionnaires.
FIELD WORK
Data collection Pencil and paper self-administered questionnaire to be filled by teachers and collected by the interviewer at school on the same day the the 14 to 18 year old Secondary School Students Survey on Drugs (ESTUDES) takes place.
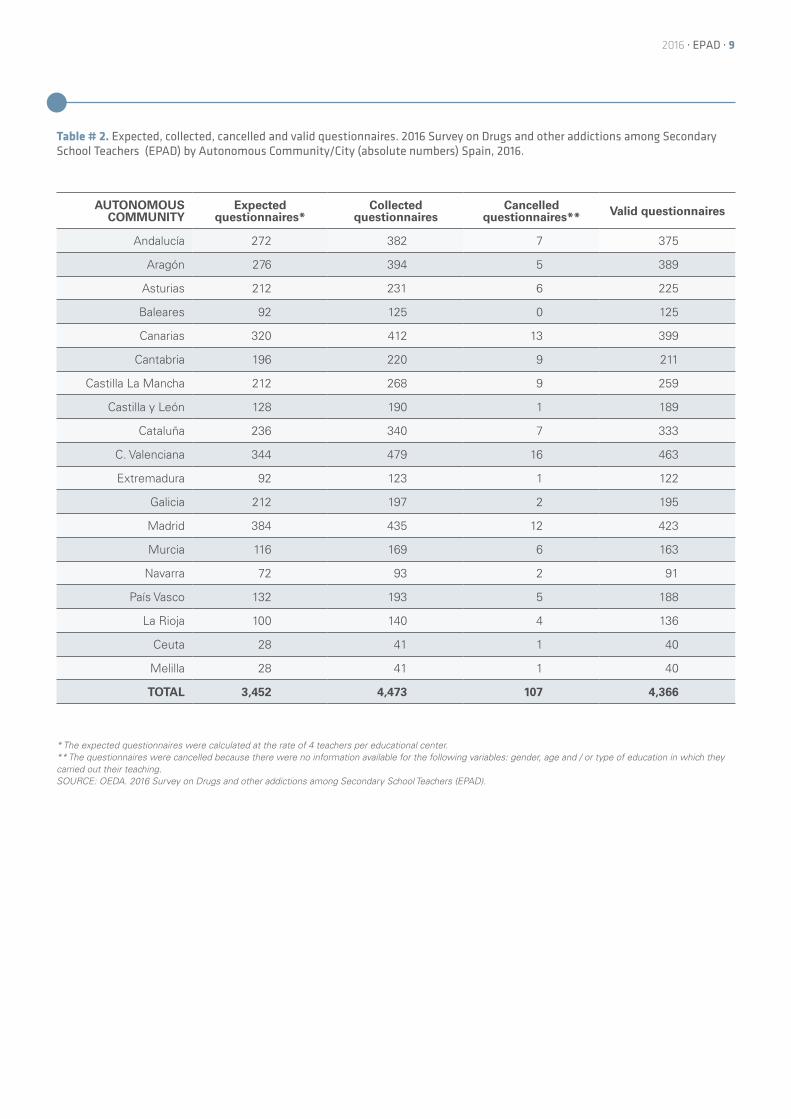
Response rate Teachers of 97.3% of those centers survey for ESTUDES collaborated on EPAD Survey. The remaining 2.7% of the teachers did not give explicit refusal, but finally did not provide the information within the expected collection period. It has been possible to collect a total of 4,473 questionnaires, of which it was necessary to cancel 107 for the following reasons: no data on gender or age, being under 20 or over 70 years old, teaching only in grades other than those surveyable in ESTUDES. Finally 4,366 questionnaires turned out to be valid for the study.
Taking into account all the questionnaires collected and those that have been canceled, a response rate of 97.6% of teachers has been obtained.
Taking into account the 863 schools surveyed and the 4,366 valid questionnaires, an average of 5.1 questionnaires per center is obtained.
METHODOLOGICAL CONSIDERATIONS AND LIMITATIONS
• The questions are addressed to teachers of educational centers and show their opinions and perceptions so this must be taken into account when interpreting the results.
• The information obtained from all the variables of the survey is extensive; only the most relevant results are presented in this document.
• 2016 EPAD survey used the same methodology as in previous years. Results are comparable, although temporary changes should always be interpreted with caution.
2016 · EPAD · 8
Universe Sample Sample error*
TYPE OF THE EDUCATIONAL CENTER
Public 199,746 3,057 0.02
Private 62,533 1,309 0.03
AUTONOMOUS COMMUNITY
Andalucía 56,663 375 0.05
Aragón 7,417 389 0.05
Asturias 6,291 225 0.07
Baleares 6,770 125 0.09
Canarias 10,981 399 0.05
Cantabria 4,194 211 0.07
Castilla La Mancha 12,685 259 0.06
Castilla y León 16,164 189 0.07
Cataluña 31,503 333 0.05
C. Valenciana 19,728 463 0.05
Extremadura 7,598 122 0.09
Galicia 16,695 195 0.07
Madrid 33,810 423 0.05
Murcia 9,370 163 0.08
Navarra 4,135 91 0.10
País Vasco 15,259 188 0.07
La Rioja 1,742 136 0.08
Ceuta 642 40 0.15
Melilla 632 40 0.15
TOTAL 262,279 4,366 0.02
* Maximum sample error for a confidence level of 95.5% and p = q = 0.5SOURCE: OEDA.2016 Survey on Drugs and other addictions among Secondary School Teachers (EPAD).
Table # 1. Distribution of the universe, of the sample and of the sample error of 2016 Survey on Drugs and other addictions among Secondary School Teachers (EPAD), by Autonomous Community/City and type of center (absolute numbers) Spain, 2016.
2016 · EPAD · 9
AUTONOMOUS COMMUNITY
Expected questionnaires*
Collected questionnaires
Cancelled questionnaires** Valid questionnaires
Andalucía 272 382 7 375
Aragón 276 394 5 389
Asturias 212 231 6 225
Baleares 92 125 0 125
Canarias 320 412 13 399
Cantabria 196 220 9 211
Castilla La Mancha 212 268 9 259
Castilla y León 128 190 1 189
Cataluña 236 340 7 333
C. Valenciana 344 479 16 463
Extremadura 92 123 1 122
Galicia 212 197 2 195
Madrid 384 435 12 423
Murcia 116 169 6 163
Navarra 72 93 2 91
País Vasco 132 193 5 188
La Rioja 100 140 4 136
Ceuta 28 41 1 40
Melilla 28 41 1 40
TOTAL 3,452 4,473 107 4,366
Table # 2. Expected, collected, cancelled and valid questionnaires. 2016 Survey on Drugs and other addictions among Secondary School Teachers (EPAD) by Autonomous Community/City (absolute numbers) Spain, 2016.
* The expected questionnaires were calculated at the rate of 4 teachers per educational center.** The questionnaires were cancelled because there were no information available for the following variables: gender, age and / or type of education in which they carried out their teaching.SOURCE: OEDA. 2016 Survey on Drugs and other addictions among Secondary School Teachers (EPAD).

2016 · EPAD · 10
Among those surveyed, 41.4% were men and 58.6% were women, the majority of teachers belonging to the 40-49 year- old range (39.6%) and 31.9% to the 50-59 year-old group.
Results
Sample features overview
58.6%
Figure# 1. Distribution of the 2016 Survey on Drugs and other addictions among Secondary School Teachers sample (EPAD) . Distribution by age and by gender (percentage). Spain, 2016.
41.4%
Men
GENDER EDAD
Women≤29 years ≥60 years40-49
years 50-59 years
30-39 years
3.3%
21.4%
39.6%
31.9%
3.9%
SOURCE: OEDA. 2016 Survey on Drugs and other addictions among Secondary School Teachers (EPAD).
Note: Multiple answers, the same teacher can teach different types of teaching.
SOURCE: OEDA. 2016 Survey on Drugs and other addictions among Secondary School Teachers. (EPAD).
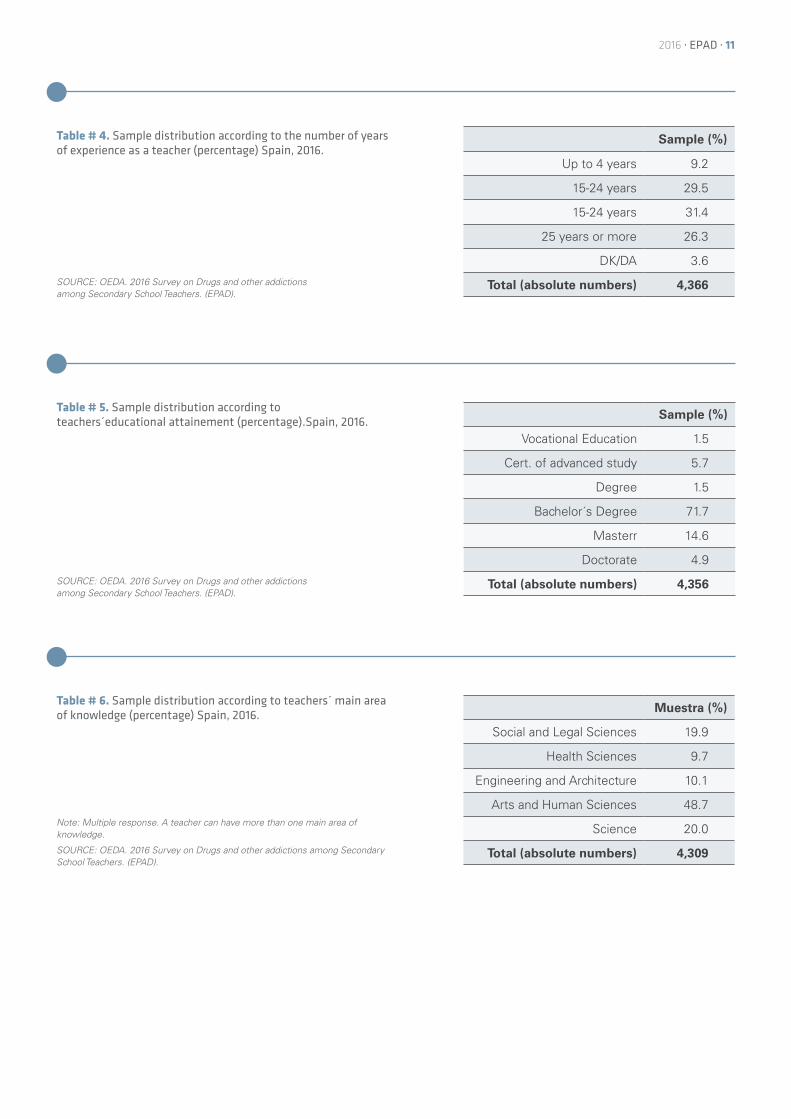
Charts 3, 4, 5 and 6 show the distribution of teachers according to the type of education in which they are involved, to the years of experience as a teacher, to their educational attainement and to their main area of knowledge. It could be said that the average teacher in the sample teaches in the 2nd cycle of the ESO (76.9%), has a teaching experience of 15 to 24 years (31.4%), has completed a university degree (71.7%) and his/her main area of knowledge is Arts and Human Sciences (48.7%).
Table # 3. Sample distribution according to the type of education in which teachers are involved (percentage) Spain, 2016.
Sample (%)
ESO1st cycle 57.9
ESO2nd cycle 76.9
Bachillerato (baccalaureate) 60.0
Vocational Education, basic cycles 8.3
Vocational Education, medium cycle 8.9
Other 5.1
Total (absolute numbers) 4,340
2016 · EPAD · 11
Table # 4. Sample distribution according to the number of years of experience as a teacher (percentage) Spain, 2016.
Table # 5. Sample distribution according to teachers´educational attainement (percentage).Spain, 2016.
Table # 6. Sample distribution according to teachers´ main area of knowledge (percentage) Spain, 2016.
Sample (%)
Up to 4 years 9.2
15-24 years 29.5
15-24 years 31.4
25 years or more 26.3
DK/DA 3.6
Total (absolute numbers) 4,366SOURCE: OEDA. 2016 Survey on Drugs and other addictions among Secondary School Teachers. (EPAD).
SOURCE: OEDA. 2016 Survey on Drugs and other addictions among Secondary School Teachers. (EPAD).
Sample (%)
Vocational Education 1.5
Cert. of advanced study 5.7
Degree 1.5
Bachelor´s Degree 71.7
Masterr 14.6
Doctorate 4.9
Total (absolute numbers) 4,356
Muestra (%)
Social and Legal Sciences 19.9
Health Sciences 9.7
Engineering and Architecture 10.1
Arts and Human Sciences 48.7
Science 20.0
Total (absolute numbers) 4,309
Note: Multiple response. A teacher can have more than one main area of knowledge.
SOURCE: OEDA. 2016 Survey on Drugs and other addictions among Secondary School Teachers. (EPAD).
2016 · EPAD · 12
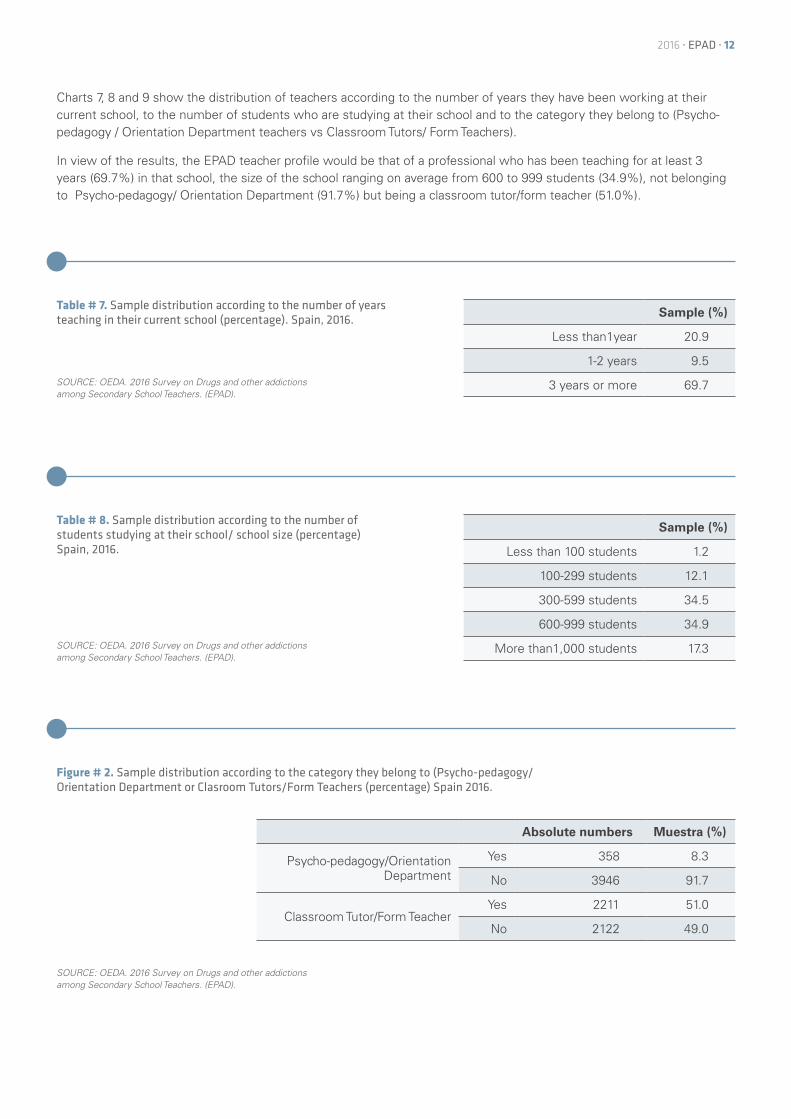
Charts 7, 8 and 9 show the distribution of teachers according to the number of years they have been working at their current school, to the number of students who are studying at their school and to the category they belong to (Psycho-pedagogy / Orientation Department teachers vs Classroom Tutors/ Form Teachers).
In view of the results, the EPAD teacher profile would be that of a professional who has been teaching for at least 3 years (69.7%) in that school, the size of the school ranging on average from 600 to 999 students (34.9%), not belonging to Psycho-pedagogy/ Orientation Department (91.7%) but being a classroom tutor/form teacher (51.0%).
Table # 7. Sample distribution according to the number of years teaching in their current school (percentage). Spain, 2016.
SOURCE: OEDA. 2016 Survey on Drugs and other addictions among Secondary School Teachers. (EPAD).
Table # 8. Sample distribution according to the number of students studying at their school/ school size (percentage) Spain, 2016.
SOURCE: OEDA. 2016 Survey on Drugs and other addictions among Secondary School Teachers. (EPAD).
Figure # 2. Sample distribution according to the category they belong to (Psycho-pedagogy/Orientation Department or Clasroom Tutors/Form Teachers (percentage) Spain 2016.
SOURCE: OEDA. 2016 Survey on Drugs and other addictions among Secondary School Teachers. (EPAD).
Sample (%)
Less than1year 20.9
1-2 years 9.5
3 years or more 69.7
Sample (%)
Less than 100 students 1.2
100-299 students 12.1
300-599 students 34.5
600-999 students 34.9
More than1,000 students 17.3
Absolute numbers Muestra (%)
Psycho-pedagogy/Orientation Department
Yes 358 8.3
No 3946 91.7
Classroom Tutor/Form TeacherYes 2211 51.0
No 2122 49.0

2016 · EPAD · 13
42.8% of teachers consider that drug use is a serious problem in their school center. The most frequent perception is that this problem is limited to a small number of students (37.6%), while the remaining 5.2% believe that it affects a rela-tively high number of students.
On the contrary, 57.2% of the teachers declare that drug use is not relevant in their school center. 35.8% perceive it as a problem that is not very important at the moment but that may worsen in the immediate future, while 21.4% say that this problem does not exist at all. (Figure 2)
Perceptions and opinions of Secondary School teachers on psychoactive substances and other addictionsScope / Importance of the problem of psychoactive substances use at school (teachers´ perceptions)
• Four out of ten teachers believe that drugs are a serious problem in their school center, 4 out of 10 that it is currently not a problem but it may get worse, and 2 out of ten that this problem does not exist in their school.
• According to the type of psychoactive substances, 87.2% of teachers believe that the magnitude of tobacco smoking is important in their school, 74.7% for alcohol and 66.9% for cannabis.
• The teachers’ index on concern about drugs is showing a slightly downward trend from 2004 to 2016.
Figure # 2. Magnitude of the drugs problem in their school center (percentage of teachers selecting each statement) Spain, 2016.
35.8% 21.4%
5.2%
37.6%
It is a serious problem affecting a relatively high number of students
It is a serious problem limited to a small number of students
At the moment, the problem is not very important, although it may get worse in the near future
It is a problem that does not exist in the school
Indicate the magnitude of the drugs problem in youir school center:
Note: Information obtained from the opinions and perceptions of Secondary School teachers.
SOURCE: OEDA. 2016 Survey on Drugs and other addictions among Secondary School Teachers. (EPAD).
2016 · EPAD · 14
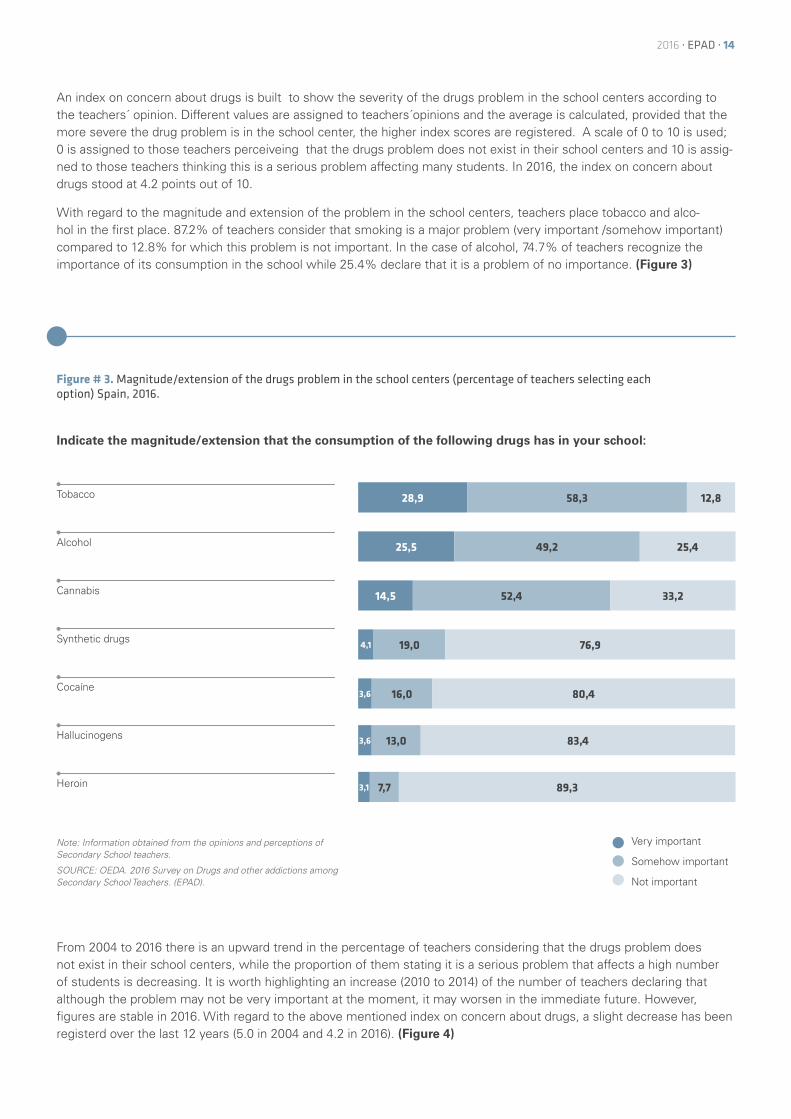
An index on concern about drugs is built to show the severity of the drugs problem in the school centers according to the teachers´ opinion. Different values are assigned to teachers´opinions and the average is calculated, provided that the more severe the drug problem is in the school center, the higher index scores are registered. A scale of 0 to 10 is used; 0 is assigned to those teachers perceiveing that the drugs problem does not exist in their school centers and 10 is assig-ned to those teachers thinking this is a serious problem affecting many students. In 2016, the index on concern about drugs stood at 4.2 points out of 10.
With regard to the magnitude and extension of the problem in the school centers, teachers place tobacco and alco-hol in the first place. 87.2% of teachers consider that smoking is a major problem (very important /somehow important) compared to 12.8% for which this problem is not important. In the case of alcohol, 74.7% of teachers recognize the importance of its consumption in the school while 25.4% declare that it is a problem of no importance. (Figure 3)
28,9 58,3 12,8
25,5 49,2 25,4
14,5 52,4 33,2
4,1 19,0 76,9
3,6 16,0 80,4
3,6 13,0 83,4
3,1 7,7 89,3
Figure # 3. Magnitude/extension of the drugs problem in the school centers (percentage of teachers selecting each option) Spain, 2016.
Note: Information obtained from the opinions and perceptions of Secondary School teachers.
SOURCE: OEDA. 2016 Survey on Drugs and other addictions among Secondary School Teachers. (EPAD).
Indicate the magnitude/extension that the consumption of the following drugs has in your school:
Tobacco
Alcohol
Cannabis
Synthetic drugs
Cocaíne
Hallucinogens
Heroin
From 2004 to 2016 there is an upward trend in the percentage of teachers considering that the drugs problem does not exist in their school centers, while the proportion of them stating it is a serious problem that affects a high number of students is decreasing. It is worth highlighting an increase (2010 to 2014) of the number of teachers declaring that although the problem may not be very important at the moment, it may worsen in the immediate future. However, figures are stable in 2016. With regard to the above mentioned index on concern about drugs, a slight decrease has been registerd over the last 12 years (5.0 in 2004 and 4.2 in 2016). (Figure 4)
Very important
Somehow important
Not important

2016 · EPAD · 15
45
30
15
0
6
5
4
3
2000 2002 2004 2006 2008 2010 2012 2014 2016
Figure # 4. Evolution of the magnitude/extension of the drugs problem in the school centers (percentage of teachers selecting each statement and index of concern about drugs) Spain, 2000-2016.
Indicate the magnitude/extension that consumption of the following drugs has in your school:
Notes: Values of Index of concern about drugs range from 0 to 10 (0 = no problems, 10 = many problems). Information obtained from the opinions and perceptions of Secondary School teachers.
SOURCE: OEDA. 2016 Survey on Drugs and other addictions among Secondary School Teachers (EPAD).
It is a serious problem affecting a relatively high number of students
It is a serious problem limited to a small number of students
At the moment, the problem is not very important, although it may get worse in the immediate future
It is a problem that does not exist in the school
Index concern about drugs (scale 0-10)
Visibility of psychoactive substances inside and outside school (teachers´ perceptions and opinions)
• 1 out of 10 teachers declare having observed (from time to time or very often) students attending school under the influence of drugs.
• 4 out of 10 teachers have seen students smoking cannabis in the school surroounding area.
• 1 out of 10 teachers have seen students smoking cannabis in the school center.
• The percentage of teachers who have seen students smoking tobacco in the school center (40.7%) is higher than that of those who have seen their teaching colleagues smoking tobacco in the school center (9.2%).
41.2% of teachers state that they have never seen students attending school under the influence of drugs. However, 13.1% of them declare they have seen students attending school under the influence of drugs (occasionally or very often). (Figura 5)

2016 · EPAD · 16
Figure # 5. Visibility of students attending school under the effects of drugs (last 12 months). (% of teachers selecting each option). Spain, 2016.
Figure # 6. Visibility of tobacco and illegal drugs inside and outside the school grounds (last 12 months). (% of teachers who answer each option). Spain, 2016.
Indicate the frequency with which you observed students attending school under the effects of drugs (last 12 months):
Indicate how often (last 12 months) you have seen each of the following events with regard to 14 to 18 year-old students at your school:
1.1%
12%
45.8%
41.2% Very often
Now and then
Rarely
Never
Note: Information obtained from the opinions and perceptions of Secondary School teachers.
SOURCE: OEDA. Survey of Secondary Education Teachers of on Drugs and other Addictions in Spain (EPAD).
9.1% of teachers declare having seen students smoking cannabis sometimes at school; 42.3 % if consumption is refe-rred to the school surroundings. Among the latter, 17% of teachers report having seen students smoking cannabis very often/from time to time.
24.3% of teachers repot having seen students involved in cannabis swapping, dealing and supply in school surroundings and 7.8% inside the school grounds.
Most teachers state they have not seen students involved in synthetic drugs swapping, dealing and supply either inside the school grounds (98.7%) or outside in the school surroundings (93.4%). (Figure 6)
Never Now and then
Note: Information obtained from the opinions and perceptions of Secondary School teachers.
SOURCE: OEDA. 2016 Survey on Drugs and other addictions among Secondary School Teachers (EPAD).
98,7
92,2 6,8
75,7 17,4 6,2
93,4 5,4
90,9 7,6
57,7 25,3 13,9 3,1
5,5 14,8 37,8 41,8
Swap/deal/supply of synthetic drugs
Swap/deal/supply of cannabis
Cannabis smoking (students)
Tobacco smoking (teachers)
Tobacco smoking (students)
Inside school grounds (students)
School surroundings (students)
60,1 27,7 9,4
Swap/deal/supply of synthetic drugs
Swap/deal/supply of cannabis
Cannabis smoking (students)
Tobacco smoking (teachers)
Tobacco smoking (students)
8,8 19,6 38,4 33,2
91,6 5,0
Rarely Very often
1,1 0,2 0,0
1,0 0,1
1,2 0,3
0,7
1,1 0,2
2,4 0,9
2,8

2016 · EPAD · 17
91.6%38.4%
2.4%
8.8%5%
33.2%
0.9% 19.6%
When it comes to tobacco consumption, the percentage of teachers who have seen students smoking tobacco inside the school grounds is higher (39.9%) than that of those who have seen their fellow teachers smoking (8.4%). (Tables 6&7)
Most teachers (91.6%) say they have never seen other fellow teachers smoking inside the school grounds. However, 7 out of 10 admit having seen them in areas where their colleagues can be seen by students (33.2% very often and 38.4% from time to time). (Figure 7)
Indicate how often (last 12 months) you have seen other teachers smoking tobacco at your school:
Figure # 7. Visibility of tobacco consumption by teachers inside and outside the school grounds (last 12 months). (% of teachers selecting each option) Spain, 2016.
School surroundings (teachers)Inside school grounds (teachers)
Note: Information obtained from the opinions and perceptions of Secondary School teachers.
SOURCE: OEDA. 2016 Survey on Drugs and other addictions among Secondary School Teachers (EPAD).
Very often
Now and then
Rarely
Never

2016 · EPAD · 18
Many teachers consider that the consumption of illegal drugs, either regularly1 or occasionally2, can produce many pro-blems. The drugs whose habitual consumption is perceived as more dangerous by a greater proportion of teachers are: hallucinogens (99.4%), heroin (99.4%), ecstasy (99.4%), cocaine powder (99.4%) and amphetamines or speed (99.3%).
67.5% of the teachers believe that smoking cannabis occasionally2 can cause many problems; this percentage increases to 98.3% when referring to regular use of cannabis, reahing similar figures to those registered for other drugs. Regarding alcohol, 67.0% of teachers believe that consuming alcoholic beverages (1 or 2 beers / drinks) per day can produce many problems, registering an increase up to 69.4% when the question is referred to the consumption of 5 or 6 beers/ drinks during the weekend.
Finally, it is worth noting the high risk perception associated to tobbacco use, for which 98.9% of teachers declare that smoking one tobacco package a day can produce many problems. (Figure 8)
There is certainly a link between prevalence of psychoactive substance use, drug use risk perception and their perceived availability; hence the importance of knowing the risk perception among general population and especially among the most vulnerable groups such as young people. Drug use risk perception of secondary school teachers is compared with that registered for 14 to 18 year-old students.
Comparing drug use risk perception in teachers and students (the latter obtained from the 2016 ESTUDES Survey), results show that there is a greater proportion of teachers than of students who perceive drug use as a problem genera-ting source for each psychoactive substance.
Although similar levels are recorded for bothe groups (teachwers and students), the greatest differences for regular con-sumption (once a week or more frequently) are noted for electronic cigarettes use, consumption of 1 or 2 beers/drinks daily, consumption of 5 or 6 beers/drinks on weekends and for smoking 1 to 5 cigarettes per day (29.6, 14.1, 13.3 and 11.8 percentage point difference respectively). (Figure 9)
Analyzing the occasional use of illegal drugs (once a month or less frequently), it is observed that although the risk per-ceptions decreases in both groups (teachers and students) probably due to the sporadic nature of this consumption, there is once more a greater proportion of teachers than students considering their consumption may entail many or quite a few problems. In this sense, the psychoactive substances showing greater differences are hallucinogens, heroin and powder cocaine (16.3, 15.8 and 15.8 percentage point difference respectively). (Figure 10)
It is worth highlighting the lower risk perception registered for both teachers and students when sporadic/occasional cannabis use is considered (once a month or less frequently) instead of considering regular use (once a week or more frequently).
1. Regular use: once per week or more often.
2. Once a month or less regularly.
Risk associated with psychoactive substances use (teachers´perceptions and opinions)
• Most teachers (93%) think that the use of cocaine, amphetamines, hallucinogens, ecstasy, heroin and hypnosedatives, either habitually or sometimes, can produce many problems.
• 3 out of 10 teachers believe that drinking alcohol (1 or 2 drinks / each day) or smoking cannabis (once a month or less) can cause only very few problems or no problems at all.
• Almost all teachers (98.9%) declare that smoking one tobacco package per day entails a high risk.

2016 · EPAD · 19
Smoking electronic cigarettes
Consuming 1 or 2 beers/ drinks daily
Smoking cannabis occasionally
Consuming 5 or 6 beers/drinks on the weekend
Smoking 1 to 5 cigarettes a day
Consuming cocaine powder occasionally
Consuming hypnos-sedatives regularly
Consuming magic mushrooms occasionally
Consume amphetamines or speed occasionally
Consume amphetamines or speed occasionally
Consuming ecstasy occasionally
Consuming methamphetamine occasionally
Smoking Cocaine (Base, Crack) occasionally
Consuming heroin occasionally
Consuming GHB occasionally
Smoking cannabis regularly
Consuming 5 or 6 beers / drinks daily
Injecting drugs occasionally
Smoking 1 tobacco package a day
Consuming amphetamines or speed regularly
Consuming hallucinogens regularly
Consuming ecstasy regularly
Consuming cocaine powder regularly
Consuming heroin regularly
....................................................... 63.8
.................................................... 67.0
................................................... 67.5
................................................. 69.4
................................... 80.0
.................. 93.9
................ 95.1
............... 95.1
.............. 95.7
.............. 96.0
.............. 96.6
.............. 97.1
............... 97.3
.............. 98.1
........... 98.2
........... 98.3
........... 98.4
........... 98.6
........... 98.9
........... 99.3
........... 99.4
.......... 99.4
.......... 99.4
.......... 99.4
Regular use: once per week of more often / Occasional: once per month or less frequently.
Note: Information obtained from the opinions and perceptions of Secondary School teachers.
SOURCE: OEDA 2016 Survey on Drugs and other addictions among Secondary School Teachers (EPAD).
Indicate your opinion about the health problems (or any other type of problems) that the following events/behaviours may cause
(none, a few, quite a few, many). (% of teachers that answers many or quite a few problems):
Figure # 8. Risk perception of psychoactive substances use among teachers (% of teachers who think that each behaviour may cause many or quite a few problems) Spain, 2016.

2016 · EPAD · 20
96.4
90.7
96.2
68.2
52,9
96.4
87.7
91.8
56.1
34.2
99.4
98.3
99.4
80.0
67,0
99.4
95.1
98.9
69.4
63.8
Figure # 9. Risk perception of psychoactive substances among teachers and 14 to 18 year-old students. (% of teachers and students who think that consuming each substance regularly-once a week or more frequently-can produce quite a few or many problems) Spain, 2016.
Indicate your opinion about the health problems (or any other type of problems) that the following events/behaviours may cause
(none, few, quite a few or many). (% of teachers and of students that answers quite a few or many problems):
Note: Information obtained from the opinions and perceptions of Secondary School teachers.
SOURCE: 2016 Survey on Drugs and other addictions among Secondary School Teachers (EPAD).
Students
Teachers
Heroin
Cocaine powder
Ectasy
Tobacco (1 package a day)
Cannabis
Hypno-sedatives
Tobacco (1 to 5 cigarettes a day))
Consuming 5 or 6 beers / drinks on the weekend
Consuming 1 or 2 beers / drinks daily
Smoking electronic cigarettes

2016 · EPAD · 21
Figure # 10. Risk perception of psychoactive substances among teachers and 14 to 18 year-old students. (% of teachers and students who think that consuming each substance occasionally-once a month or less frequently-can produce many or quite a few problems). Spain, 2016.
Indicate your opinion about the health problems (or any other type of problems) that the following events/behaviours may cause (none, few, quite a few or many). (% of teachers and of students that answers quite a few or many problems):
Note: Information obtained from the opinions and perceptions of Secondary School teachers.
SOURCE: OEDA. 2016 Survey on Drugs and other addictions among Secondary School Teachers (EPAD).
82.3
80.4
80.3
78.1
85.9
83.0
80.3
54.1
98.1
95.7
96.6
93.9
97.1
95.1
96.0
67.5
Heroin
Methamphetamine
Hallucinogens
Ectasy
Amphetamines
Magic mushrooms
Cocaine powder
Cannabis
Students
Teachers

2016 · EPAD · 22
The students´ BEHAVIOR (passivity, drowsiness ...)
The students´ ACADEMIC PERFORMANCE (low concentration, lack of interest ...)
The students´ BEHAVIOR (passivity, drowsiness ...)
The students´ ACADEMIC PERFORMANCE (low concentration, lack of interest ...)
7.3 27.9 36.9 27.8
8.0 31.9 36.5 23.6
8.1 2.3 33.0 34.6
7,7 24.6 33.5 34.1
Figure # 11. Effects of alcohol and cannabis consumption on the behavior and academic performance of students (% of teachers selecting each option) Spain, 2016.
During the last 12 months, for each of the following statements, indicate the frequency with which they are observed among students attending your school.
The effects of drinking ALCOHOL over the weekend negatively affect:
The effects of consuming CANNABIS over the weekend negatively affect:
Note: Information obtained from the opinions and perceptions of the Secondary School teachers.
SOURCE: 2016 Survey on Drugs and other addictions among Secondary School Teachers (EPAD).
Effects of psychoactive substances use on the students´ academic performance and behaviour (teachers´ perceptions and opinions)
• 39.9% of teachers believe that drinking alcohol during the weekend can negatively affect the students´ academic performance. 35.2% of teachers think that it can negatively affect the students´ behaviour.
• 32.4% of teachers think that consuming cannabis during the weekend can have a negative effect on the academic performance of students and 32.3% on their behavior. (Note: percentage of teachers who answer very often or now and then).
Most teachers think that the consumption of alcohol and cannabis can adversely affect the academic performance and behavior of students.
Thus, 35.2% of teachers think that drinking alcohol during the weekend has a negative effect on the students´ beha-vior and 39.9% that it negatively affects their academic performance. Regarding the consumption of cannabis during the weekend, the percentage of teachers who think that it negatively affects behavior and academic performance is similar. (Figure 11)
Very often Now and then Rarely Never

2016 · EPAD · 23
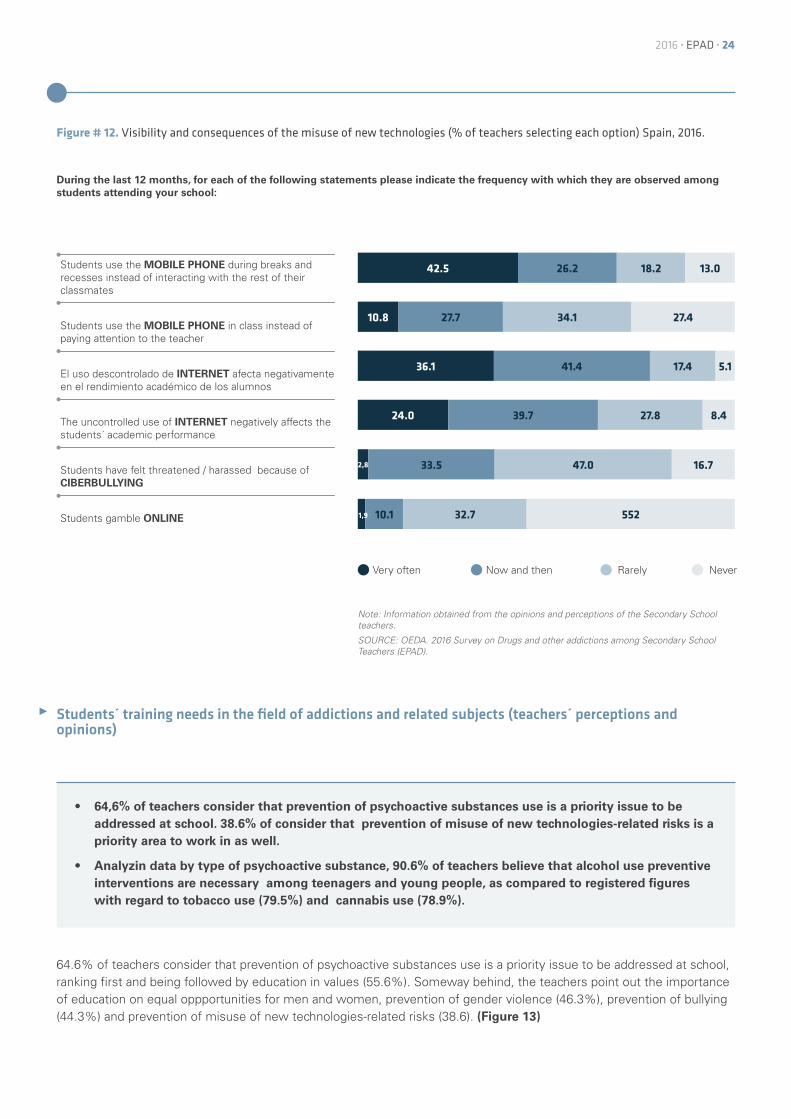
• 77.5% of teachers believe that the uncontrolled use of the Internet can negatively affect the students´ academic performance and 63.7% that it can influence their behavior.
• 68.7% of teachers recognize that students use the mobile phone at breaks rather than interacting with their classmates and 38.4% state that they use them during classes instead of paying attention to the teacher.
• 36.3% of teachers believe that students may have been subjected to threats/harrasment via the internet (cyberbullying). (Note: percentage of teachers who answer very often or now and then).
Visibility and consequences of the misuse of new technologies (teachers´perceptions and opinions)
Most teachers recognize that students misuse mobile phones at school.
38.4% say that students use their mobile phones in class instead of paying attention to the teacher (27.7% now and then and 10.8% very often). In addition, 68.7% of teachers state that students use their mobile phones during breaks and recesses instead of using this time to interact with their classmates (26.2% now and then and 42.5% very often).
Additionally, as in the case of alcohol and cannabis consumption, most teachers think that the uncontrolled use of the internet has negative effects on the students´ academic performance and behaviour. Thus, 77.5% of teachers think that the misuse of the internet negatively affects academic performance (very often or from time to time) and 63.7% state it influences students´behaviour.
36.3% of teachers say they have observed students who feel threatened/harassed because of cyberbullying. 33.5% of them report to have seen this now and then and 2.8% of them declare to have seen it very often.
In line with the above mentioned, 15.8% of students aged 14 to 18 years report being subject of harassment or bullying, at least once, through the internet (data from the 2016 ESTUDES survey).
With regard to the online gambling, 12% of teachers declare to have observed this behaviour among their students (very often or now and then). (Figure 12)
According to 2016 ESTUDES survey data, 6.4% of students aged 14 to 18 recognize that they have gambled online in the last year.
2016 · EPAD · 24
42.5 26.2 18.2 13.0
10.8 27.7 34.1 27.4
36.1 41.4 17.4 5.1
24.0 39.7 27.8 8.4
2,8 33.5 47.0 16.7
10.1 32.7 552
Figure # 12. Visibility and consequences of the misuse of new technologies (% of teachers selecting each option) Spain, 2016.
During the last 12 months, for each of the following statements please indicate the frequency with which they are observed among students attending your school:
Students use the MOBILE PHONE during breaks and recesses instead of interacting with the rest of their classmates
Students use the MOBILE PHONE in class instead of paying attention to the teacher
El uso descontrolado de INTERNET afecta negativamente en el rendimiento académico de los alumnos
The uncontrolled use of INTERNET negatively affects the students´ academic performance
Students have felt threatened / harassed because of CIBERBULLYING
Students gamble ONLINE
Muy a menudo De vez en cuando Raramente Nunca
Note: Information obtained from the opinions and perceptions of the Secondary School teachers.
SOURCE: OEDA. 2016 Survey on Drugs and other addictions among Secondary School Teachers (EPAD).
64.6% of teachers consider that prevention of psychoactive substances use is a priority issue to be addressed at school, ranking first and being followed by education in values (55.6%). Someway behind, the teachers point out the importance of education on equal oppportunities for men and women, prevention of gender violence (46.3%), prevention of bullying (44.3%) and prevention of misuse of new technologies-related risks (38.6). (Figure 13)
• 64,6% of teachers consider that prevention of psychoactive substances use is a priority issue to be addressed at school. 38.6% of consider that prevention of misuse of new technologies-related risks is a priority area to work in as well.
• Analyzin data by type of psychoactive substance, 90.6% of teachers believe that alcohol use preventive interventions are necessary among teenagers and young people, as compared to registered figures with regard to tobacco use (79.5%) and cannabis use (78.9%).
Students´ training needs in the field of addictions and related subjects (teachers´ perceptions and opinions)
Very often Now and then Rarely Never
1,9

2016 · EPAD · 25
38,6
44,3
46,3
55,6
64,6
7,6
7,9
12,5
5,0
24,7
5,7
8,7
2,9
41,6
28,5
44,2
59,7
69,6
8,3
7,6
14,9
5,3
27,6
6,5
8,6
3,5
Figure # 13. Students´ training needs in the field of addictions and related subjects (% of teachers selecting each option) Spain, 2014-2016.
Of the following, which of them do you consider to be the priority subjects to be adressed at school?
Prevention of drug addictions (tobacco, alcohol and other drugs)
education on moral and civic values
Education for equal opportunities for men and women
Prevention of bullying
Prevention of new technologies-related risks
Sexual education
Education on nutrition
Environmental education
Edcation on interculturality
Education for peace
Education on physical activity
Consumer education
Road safety education
2014
2016
Note: Information obtained from the opinions and perceptions of Secondary School teachers.
SOURCE: OEDA. 2016 Survey on Drugs and other addictions among Secondary School Teachers (EPAD).
Comparing 2016 results with those obtained in previous EPAD Survey waves, prevention of drug addictions has always ranked first (66.5% in 2006, 61.8% in 2008, 64.6% in 2010, 60.0 % in 2012 and 69.6 in 2014), outnumbering the rest of subjects mentioned. With regard to the prevention of bullying, it is noteworthy that the percentage of teachers consi-dering this subject as a priority to be addressed at school has almost doubled (44.3% in 2016 instead of 28.5% in 2014).

2016 · EPAD · 26
With regard to the specific type of psychoactive substances for which teachers consider that preventive interventions are a priority, 90.6% of the teachers select alcohol, 79.5% of them select tobacco and 78.9% select cannabis. The rest of psychoactive substances do not seem to be such a priority and show clearly lower ranking values. (Figure 14)
Figure # 14. Students´ training needs in the field of addictions and related subjects (% of teachers selecting each option) Spain, 2016.
Of the following psychoactive substances, which of them do you consider to be the priority ones to be adressed at school?
90.6
79.5
78.9
20.6
20.0
10.4
8.3
5.5
Alcohol
Tobacco
Hashish / marijuana
Cocaine
Ecstasy or other synthetic drugs
Amphetamines or speed
Hallucinogens
Alucinógenos
Other0,0
Note: Information obtained from the opinions and perceptions of Secondary School teachers.
SOURCE: OEDA. 2016 Survey on Drugs and other addictions among Secondary School Teachers (EPAD).

2016 · EPAD · 27
46.5 53.5
32.6 67.4
Perceptions and opinions of Secondary School teachers on the training received in psychoactive substances and other addictions
Training received by teachers in psychoactive substances and other addictions (teachers´ perceptions and opinions)
• Half of the teachers declare that they have not received any training either on tobacco, alcohol and illegal drugs use or on other addictions for the last 5 years. Most of them attribute it to the lack of training opportunities.
• Based on the contents of the implemented training programs, 80.9% of teachers have been trained on the misuse of new technologies-related risks, 61.3% have been trained on the prevention of legal drugs use and 45.6% on the prevention of illegal drug use.
Less than half of teachers (46.2%) declare not having been trained on the prevention of tobacco, alcohol, illegal drugs or other addictions for the last 5 years while just over half of teachers (53,8%) declare they have been trained. In compari-son with 2014, the proportion of teachers that admitt to having been trained on the the prevention of tobacco, alcohol, illegal drugs or other addictions has increased by 13.9%. (Figure 15)
Figure # 15. Teachers who have been trained on the prevention of tobacco, alcohol and illegal drugs use or other addictions (% of teachers selecting each option ) Spain, 2014-2016.
Have you been trained on the prevention of tobacco, alcohol and illegal drugs use or other addictions for the last 5 years?:
Yes, I have been trained
No, I have not been trained
2016
2014
Note: Information obtained from the opinions and perceptions of Secondary School teachers.
SOURCE: OEDA. 2016 Survey on Drugs and other addictions among Secondary School Teachers (EPAD).
Analyzing the reasons why teachers have not been trained in the prevention of tobacco, alcohol, illegal drugs use or other addictions, approximately 60% declare that this is due to the lack of training opportunities since thay have not been offe-red to be be trained (61.5% for prevention of tobacco, alcohol or illegal drugs, 62.1% for prevention of other addictions). Around 22.5% attribute their lack of training to the fact that their available time for training is limited (both in case of the prevention of tobaco, alcohol and illegal drugs and in case of the prevention of other addictions). (Figure 16)

2016 · EPAD · 28
62.1
22.5
17.7
7.9
8.9
9.6
2.9
2.1
1.0
0.3
61.5
22.5
20.3
10.2
9.0
8,8
4.0
2.4
0.8
0.3
Figure # 16. Reasons why teachers say they have not received training in the prevention of tobacco, alcohol and illegal drugs use and other addictions (% of teachers selecting each option) Spain, 2016.
Indicate the reasons why you have not received training in the prevention of tobacco, alcohol and illegal drugs use and other addictions for the last five years.
Lack of time
Porque tengo otras prioridades formativas
Because I already have training in the topic
For incompatibility with my schedule as …
Other
Because the problem is not relevant
Because I do not consider them necessary
Because I am reluctant to address these issues
Because I am not interested in the subjects
Prevention of other addictions
I have not been trained in the prevention of tobacco, alcohol and illegal drugs use
Note: Information obtained from the opinions and perceptions of Secondary School teachers.
SOURCE: OEDA. 2016 Survey on Drugs and other addictions among Secondary School Teachers (EPAD)
With regard to the origin of the training in prevention of the tobacco, alcohol and illegal drugs use and other addictions, the Autonomous Communities Drug Plans, the Continuous Training Centers for Teachers and some other public entities have been the institutions from which most of the of the training programs originated. (Figure 17)
Because I have not been offered these training programs (ignorance)

2016 · EPAD · 29
45.9
29.8
26.7
26.8
19.3
13.6
4.7
37.8
22.7
19.9
12.6
3.8
Figure # 17. Origin of the training received by the teachers (% of teachers selecting each option) Spain, 2016.
Indicate the origin of the training programs you have received with regard to the prevention of tobacco, alcohol and illegal drugs use and other addictions for the last five years:
Autonomous Communities Drug Plans
Other public institutions
Continuous training centers for teachers
Prívate institutions
Other sources
On prevention of tobacco, alcohol and illegal drugs use
On prevention of other addictions
Note: Information obtained from the opinions and perceptions of Secondary School teachers.
SOURCE: OEDA. 2016 Survey on Drugs and other addictions among Secondary School Teachers (EPAD).
Considering the type of center in which the teachers work, there is a greater presence of teachers who have been trained in the prevention of both drugs use and other addictions in public centers.
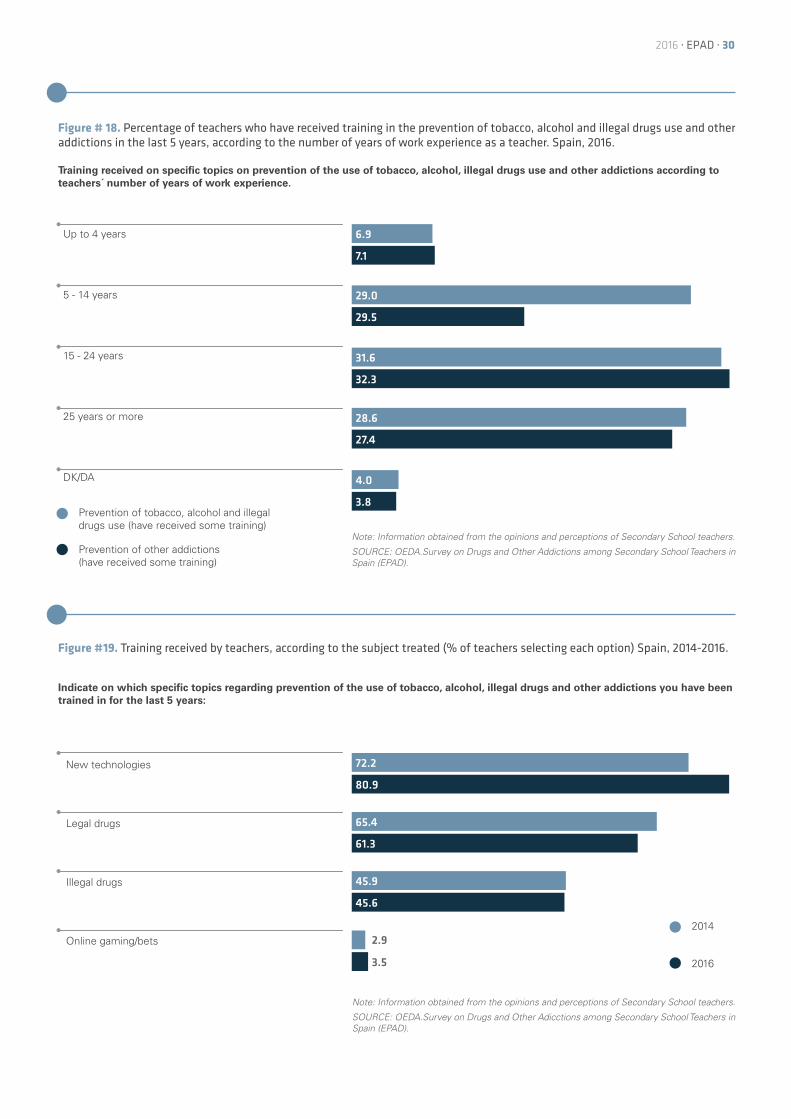
With regard to the teachers´ number of years of work experience, no remarkable differences are observed in terms of the proportion of professionals trained in drugs (legal or illegal) or in other addictions prevention (Figure 18). Teachers ack-nowledging training, regardless of the type, are mostly those referring 15 to 24 years of work experience, followed by those who have been teaching for 5 to 14 years.
Focusing on the specific topics that this training has covered (Figure 19), new technologies have been present in the tra-ining received by 80.9% of the surveyed teachers (almost 10% more teachers than in 2014). In turn, prevention of legal drugs use is showing an increased presence than that of illegal drugs in training programs (61.3% versus 45.6%, respec-tively). Nonetheless, the proportion of teachers that have been trained on the prevention of legal drugd use has slightly decreased since 2014.
Educational/Training colleges, Teachers Support Centres, University.
2016 · EPAD · 30
6.9
7.1
32.3
27.4
3.8
29.0
29.5
31.6
28.6
4.0
Figure # 18. Percentage of teachers who have received training in the prevention of tobacco, alcohol and illegal drugs use and other addictions in the last 5 years, according to the number of years of work experience as a teacher. Spain, 2016.
Figure #19. Training received by teachers, according to the subject treated (% of teachers selecting each option) Spain, 2014-2016.
Training received on specific topics on prevention of the use of tobacco, alcohol, illegal drugs use and other addictions according to teachers´ number of years of work experience.
Indicate on which specific topics regarding prevention of the use of tobacco, alcohol, illegal drugs and other addictions you have been trained in for the last 5 years:
Up to 4 years
5 - 14 years
15 - 24 years
25 years or more
DK/DA
New technologies
Legal drugs
Illegal drugs
Online gaming/bets
Prevention of tobacco, alcohol and illegal drugs use (have received some training)
Prevention of other addictions (have received some training)
Note: Information obtained from the opinions and perceptions of Secondary School teachers.
SOURCE: OEDA.Survey on Drugs and Other Addictions among Secondary School Teachers in Spain (EPAD).
Note: Information obtained from the opinions and perceptions of Secondary School teachers.
SOURCE: OEDA.Survey on Drugs and Other Adicctions among Secondary School Teachers in Spain (EPAD).
80.9
65.4
45.9
72.2
61.3
45.6
3.5
2.92014
2016

2016 · EPAD · 31
22.4
21.0
10.6
9.5
8.5
7.9
6.7
6.5
5.2
1.7
With regard to the components of training, the majority of teachers admit having been trained in the consequences of the misuse of new technologies (22.4%) or in drug use associated harms and effects (21, 0%). A lower proportion of tea-chers has been trained in other specific areas such as social skills (10.6%), self-esteem (9.5%), emotional self-control (8.5%), decision taking (7.9%) or peer pressure resisting skills (6.7%). (Figure 20)
From 2000 to 2016, training in drug use associated harms and effects has ranked first among all training components (around 30% of the surveyed teachers admitted having been trained in this area) until 2016, when training in the new technologies misuse has reached a greatest presence.
Figure # 20. Training received by teachers according to different training components (% of teachers selecting each option) Spain, 2016.
Indicate the components you have been trained in the prevention of tobacco, alcohol and illegal drugs use and other addictions for the last five years.
Information on new technologies
Information on drug use
Social skills
Self-esteem
Emotional self-control
Decision taking
Skills to resist peer pressure
Participatory techniques (group dynamics, role play)
Leisure time activities
Other training components
Note: Information obtained from the opinions and perceptions of Secondary School teachers.
SOURCE: OEDA. 2016 Survey on Drugs and Other Addictions among Secondary School Teachers (EPAD).
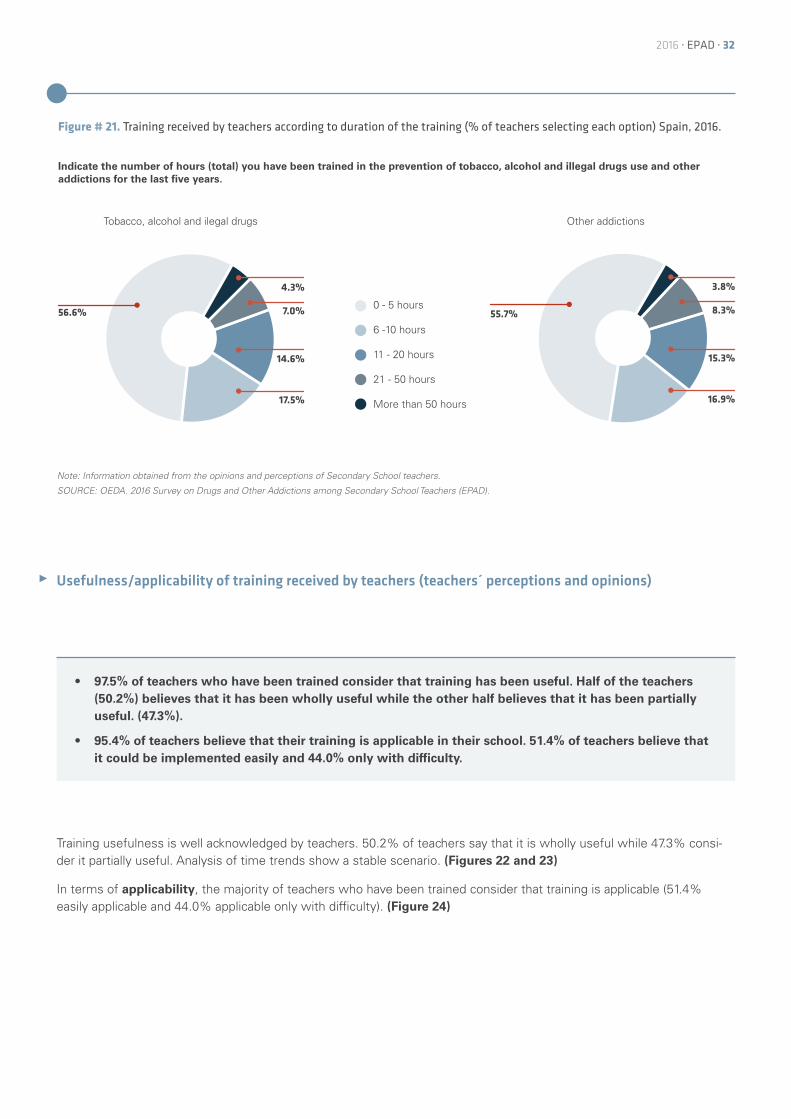
As for duration of the training in the prevention of tobacco, alcohol and illegal drugs use and other addictions, most of the teachers (74.1% and 72.6% respectively) report that training was 10-hour duration or shorter, which might indicate that training could be mainly consisiting in one-off activities (Figure 21). Since 2014, the percentage of teachers indica-ting that training duration is in the 0 to 5 hours range has increased.
2016 · EPAD · 32
Figure # 21. Training received by teachers according to duration of the training (% of teachers selecting each option) Spain, 2016.
Indicate the number of hours (total) you have been trained in the prevention of tobacco, alcohol and illegal drugs use and other addictions for the last five years.
Other addictionsTobacco, alcohol and ilegal drugs
4.3% 3.8%
7.0% 8.3%
14.6% 15.3%
17.5% 16.9%
56.6% 55.7%0 - 5 hours
6 -10 hours
11 - 20 hours
21 - 50 hours
More than 50 hours
Note: Information obtained from the opinions and perceptions of Secondary School teachers.
SOURCE: OEDA. 2016 Survey on Drugs and Other Addictions among Secondary School Teachers (EPAD).
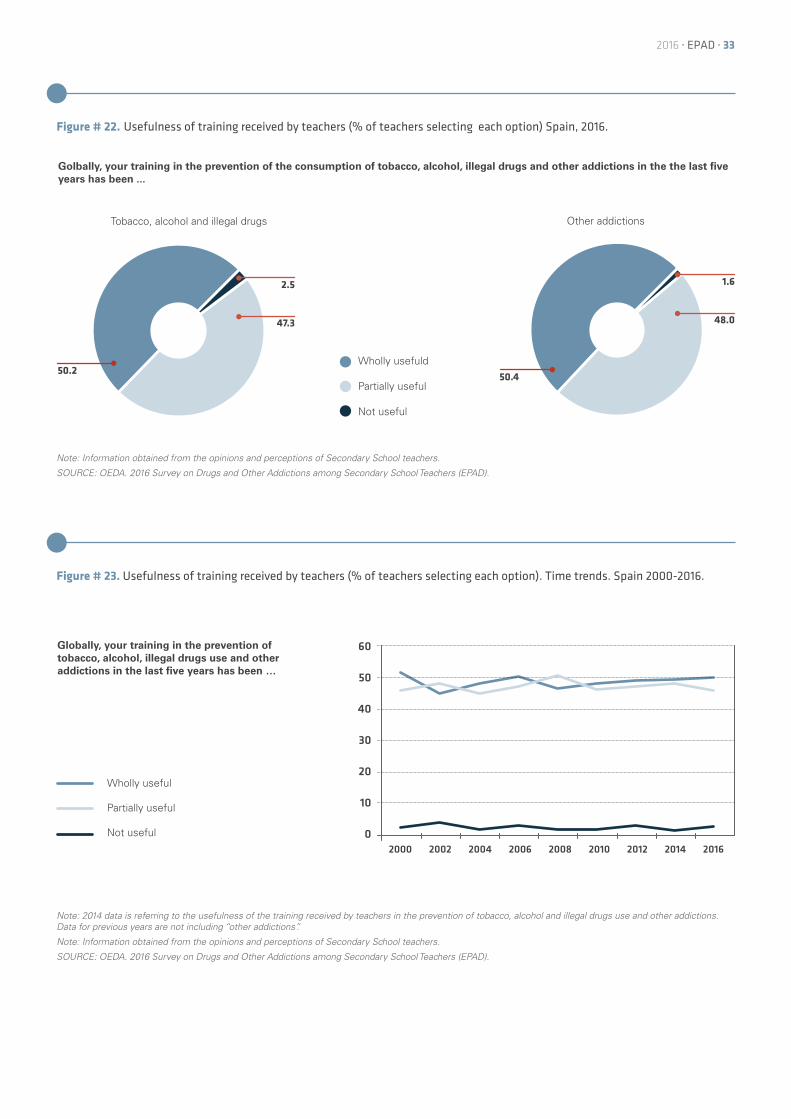
Usefulness/applicability of training received by teachers (teachers´ perceptions and opinions)
• 97.5% of teachers who have been trained consider that training has been useful. Half of the teachers (50.2%) believes that it has been wholly useful while the other half believes that it has been partially useful. (47.3%).
• 95.4% of teachers believe that their training is applicable in their school. 51.4% of teachers believe that it could be implemented easily and 44.0% only with difficulty.
Training usefulness is well acknowledged by teachers. 50.2% of teachers say that it is wholly useful while 47.3% consi-der it partially useful. Analysis of time trends show a stable scenario. (Figures 22 and 23)
In terms of applicability, the majority of teachers who have been trained consider that training is applicable (51.4% easily applicable and 44.0% applicable only with difficulty). (Figure 24)
2016 · EPAD · 33
50.250.4
2.5 1.6
47.3 48.0
Figure # 22. Usefulness of training received by teachers (% of teachers selecting each option) Spain, 2016.
Figure # 23. Usefulness of training received by teachers (% of teachers selecting each option). Time trends. Spain 2000-2016.
Golbally, your training in the prevention of the consumption of tobacco, alcohol, illegal drugs and other addictions in the the last five years has been ...
Globally, your training in the prevention of tobacco, alcohol, illegal drugs use and other addictions in the last five years has been …
Other addictionsTobacco, alcohol and illegal drugs
Wholly usefuld
Partially useful
Not useful
Note: Information obtained from the opinions and perceptions of Secondary School teachers.
SOURCE: OEDA. 2016 Survey on Drugs and Other Addictions among Secondary School Teachers (EPAD).
60
50
40
30
20
10
02000 2002 2004 2006 2008 2010 2012 2014 2016
Note: 2014 data is referring to the usefulness of the training received by teachers in the prevention of tobacco, alcohol and illegal drugs use and other addictions. Data for previous years are not including “other addictions”.
Note: Information obtained from the opinions and perceptions of Secondary School teachers.
SOURCE: OEDA. 2016 Survey on Drugs and Other Addictions among Secondary School Teachers (EPAD).
Wholly useful
Partially useful
Not useful

2016 · EPAD · 34
Considering the evolution of applicability, a downward trend in the percentage believing that the training can be applied with difficulty is observed, while the percentage of those thinking that it is easily applicable in the school where they work increases. (Figure 25)
Figure # 24. Applicability of training received by teachers (% of teachers selecting each option) Spain, 2016.
Figure # 25. Applicability of training received by teachers (% of teachers selecting each option). Time trends. Spain 2000-2016.
Regarding applicability, you would say that your training in the prevention of tobacco, alcohol and illegal drugs use and other addictions in the last five years is ...
4.6 4.8
44.0 43.4
51.4 51.8
A. Easily applicable
B. Applicable only with difficulty
C. Not applicable
Note: Information obtained from the opinions and perceptions of Secondary School teachers.
SOURCE: OEDA. 2016 Survey on Drugs and Other Addictions among Secondary School Teachers (EPAD).
Note: 2014 data is referring to the applicability of the training received by teachers in the prevention of tobacco, alcohol and illegal drugs use and other addictions. Data for previous years are not including “other addictions”.
Note: Information obtained from the opinions and perceptions of Secondary School teachers.
SOURCE: OEDA. 2016 Survey on Drugs and other addictions among Secondary School Teachers (EPAD).
60
50
40
30
20
10
02000 2002 2004 2006 2008 2010 2012 2014 2016
Regarding the applicability, you would say that your training in the prevention of tobacco, alcohol and illegal drugs use and other addictions in the last five years is …
Other addictionsTobacco, alcohol and illegal drugs
A. Easily applicable
B. Applicable only with difficulty
C. Not applicable

2016 · EPAD · 35
Teachers are asked about the specific skills they have acquired after being trained. 49.4% of teachers consider that they have been sufficiently trained to implement (12.9%) or collaborate in the implementetion (36.5%) of tobacco, alcohol and illegal drugs use prevention programs in the classroom. Among the rest of teachers 45.7% consider that the training has not allowed them to assume direct responsibilities in order to promote a prevention program and 4.9% state that the training has hardly provided them with information on the prevention of addictions (4.9%). (Figure 26). Figures are similar for the category of “other addictions”. Time trends show a stable trend in terms of the proportion of teachers that have acquired specific skillls after having been trained. (Figure 27)
Figure # 26. Skills acquired by teachers after being trained (% of teachers selecting each option) Spain, 2016.
Figure # 27. Skills acquired by teachers after being trained (% of teachers selecting each option). Time trends. Spain, 2000-2016.
Regarding the skills you have acquired after being trained in the prevention of tobacco, alcohol and illegal drugs use and other addictions in the last five years, you would say that they have proved useful for ...
Regarding the skills acquired after being trained in the Prevention of tobacco, alcohol, illegal drugs use and other addictions in the last five years, you would say they have proved useful for
4.96.0
12.913.9
36.534.9
45.7 45.2
Other addictions Tobacco, alcohol and ilegal drugs
Implementing prevention programs in the classroom
Collaborating in the implementation of programs in the classroom
Providing information, but not sufficient to allow me to assume responsibilities in the implementation of prevention porgrams in the classroom
Providing very little information
Implementing prevention programs in the classroom
Collaborating in the implementation of programs in the classroom
Providing information, but not sufficient to allow me to assume responsibilities in the implementation of prevention porgrams in the classroom
Providing very little information
Note: Information obtained from the opinions and perceptions of Secondary School teachers.
SOURCE: OEDA. 2016 Survey on Drugs and other addictions among Secondary School Teachers (EPAD).
Note: 2014 data is referring to the acquired skills by trained teachers in the prevention of tobacco, alcohol and illegal drugs use and other addictions. Data for previous years are not including “other addictions”.
Note: Information obtained from the opinions and perceptions of Secondary School teachers.
SOURCE: OEDA. 2016 Survey on Drugs and other addictions among Secondary School Teachers (EPAD).
50
25
02000 2002 2004 2006 2008 2010 2012 2014 2016

2016 · EPAD · 36
31.2
68.8
68.8% of teachers declare that they have carried out some actions aimed at students to prevent tobacco, alcohol and illegal drugs use and other addictions in the last five years. (Figure28). The proportion of teachers who have carried out actions aimed at students in the prevention of tobacco, alcohol and illegal drugs use has shown an increasing trend since 2000. (Figure 29)
With regard to the specific contents/topics that teachers have dealt with in these interventions, legal drugs are the main players as 79.2% of teachers have covered them. On the other hand, teachers dealing with misuse of new techno-logies outnumber those dealing with prevention of illegal drugs use (77.3% and 54.9%, respectively). (Figure 30)
Perceptions and opinions of Secondary School teachers on the actions undertaken on psychoactive substances and other addictions in educational centers
Actions undertaken by teachers on psychoactive substances and other addictions (teachers´ perceptions and opinions)
• More than half (68.8%) of teachers have carried out actions aimed at students to prevent drug use (legal or illegal) and other addictions in the last five years. Upward trend since 2010.
• Among those that have carried out actions and according to the topic treated, 79.2% of teachers have intervened on legal drugs, 77.3% on new technologies and 54.9% on illegal drugs.
• With regard to the approach used for prevention, most teachers provide information (78.3% of teachers on drugs and 73.9% on new technologies misuse), addressing other aspects to a lesser extent (39.9% skills to resist peer pressure and advertising pressure and 39.8% self-esteem).
Figure # 28. Percentage of teachers declaring having carried out actions aimed at students to prevent tobacco, alcohol, illegal drugs use and other addictions use in the last five years. Spain, 2016.
Have you carried out any action aimed at students to prevent tobacco, alcohol and illegal drugs use and other addictions in the last five years?
Have carried out actions
Have not carried out actions
Note: Information obtained from the opinions and perceptions of Secondary School teachers.
SOURCE: OEDA 2016. Survey on Drugs and other addictions among Secondary School Teachers (EPAD).

2016 · EPAD · 37
2000 2002 2004 2006 2008 2010 2012 2014 2016
45.2 46.0
65.4
Figure # 29. Percentage of teachers declaring having carried out actions aimed at students to prevent tobacco, alcohol, illegal drugs use and other addictions use in the last five years. Time trend. Spain, 2014-2016.
Figure # 30. Actions taken by teachers and aimed at students to prevent tobacco, alcohol, illegal drugs use and other addictions use in the last five years, according to specific contents/topics (% of teachers selecting each option) Spain, 2016.
Note: Information obtained from the opinions and perceptions of Secondary School teachers.
SOURCE: OEDA. 2016 Survey on Drugs and other addictions among Secondary School Teachers (EPAD).
Note: Information obtained from the opinions and perceptions of Secondary School teachers.
SOURCE: OEDA 2016. Survey on Drugs and other addictions among Secondary School Teachers (EPAD).
Indicate which specific contents/topics you have dealt with in regard to your actions taken and aimed at students to prevent tobacco, alcohol and illegal drugs and other addictions in the last five years:
79.2
77.3
54.9
5.3
Legal drugs
New technologies
Illegal drugs
On-line bets

2016 · EPAD · 38
84.2
29.0
60.9
30.0
32.9
25.1
34.0
20.7
1.0
78.3
38.3
73.9
36.6
39.9
30.0
39.8
26.9
6.3
Figure # 31. Aspects specifically addressed by teachers carrying out interventions to prevent tobacco, alcohol and illegal drugs use and other addictions (% of teachers selecting each option) Spain, 2014-2016.
When carrying out interventions aimed at preventing tobacco, alcohol and illegal drugs use and other addictions, what aspects do you specifically address?:
Information on drugs
Information on new technologies
Skills to overcome pressure from advertising and peer pressure
Self-esteem
Social skills
Decision takings
Emotional self-control
Leisure activities
Other aspects
2014
2016
Note: Information obtained from the opinions and perceptions of Secondary School teachers.
SOURCE: OEDA. 2016 Survey on Drugs and other addictions among Secondary School Teachers (EPAD).
Regarding the aspects that are specifically addressed by teachers carrying out interventions, most of them report that they have provided information on the effects of drugs (78.3%) or on the consequences of the misuse of new tech-nologies (73.9%). Skills to resist pressure from advertising and peer pressure (39.9%), to improve self-esteem (39.8%) or social skills (38.3%) are addressed by a smaller proportion of teachers, which is in line with the proportion of teachers being trained in this specific training components. (FIgure 31).

2016 · EPAD · 39
25.2
17.4
18.8
15.1
6.6
1.4
1.1
25.7
18.3
18.1
15.5
7.0
1.3
1.1
0.4
0.4
Figure # 32. Reasons why teachers say they have not carried out interventions aimed at students (% of teachers selecting each option). Spain, 2016.
Indicate the reasons why you have not carried out any intervention aimed at students to prevent tobacco, alcohol and illegal drugs use and other addictions in the last five years:
Interventions are carried out by external individuals
Interventions carried out by Psychopedagogical
Lack of the necessary training
Interventions are carried out by tutors
Lack of time
Difficulties in implementation
It is an extra work
No interest
Prevention of other addictions
Prevention of tobacco, alcohol and ilegal drugs use
Note: Information obtained from the opinions and perceptions of Secondary School teachers.
SOURCE: OEDA. 2016 Survey on Drugs and other addictions among Secondary School Teachers (EPAD).
The reasons given by teachers for not having carried out interventions aimed at the students are mainly related to the fact that it is not them but other professionals who are in charge of carrying them out: training is carried out by external staff (25.7%), by the school´s psychopedagogical department/ educational counselling staff (18.3%) or by tutors (15.5%). (Figure 32)
Department/ Educational counselling staff

2016 · EPAD · 40
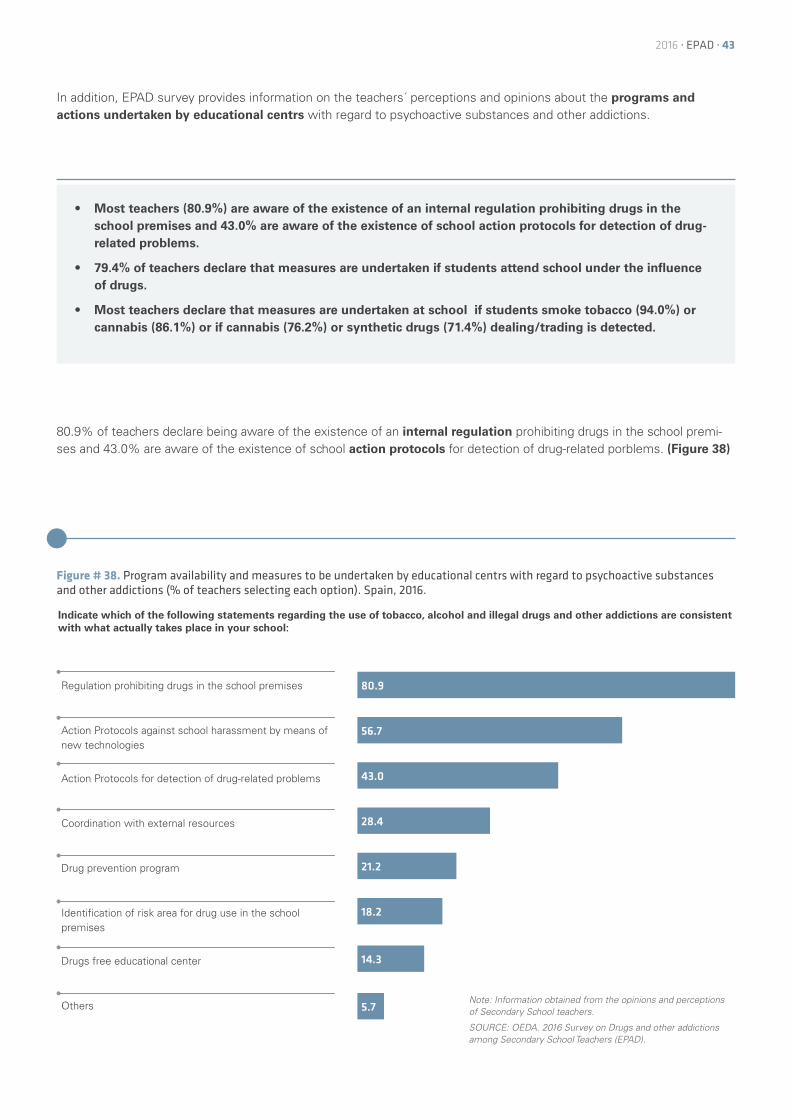
Apart from gathering information on those actions carried out by teachers, it is also relevant to know about their percep-tion about the interventions that take place in the school in which they work.
Teachers are of the opinion that the Psychopedagogical/Educational Counselling Department and the students´ tutors are the main actors (71.3% and 64.5% respectively) carrying out the preventive interventions on drugs use and other addictions. On the contrary, in the opinion of the teachers, it seems that parents´associations and private institutions (NGOs, foundations, etc.) play a rather modest role in carrying out these type of interventions (15.3% and 29.2% respec-tively). (Figure 33)
Actions undertaken within the educational centers on psychoactive substances and other addictions (teacher´s perceptions and opinions)
• 71.3% of the teachers state that the Psychopedagogical/Education Counselling Department is the one dealing with with drug prevention training programs in their educational center. 64.5% report that tutors are responsible.
• Teachers point out that interventions and activities carried out in the educational centers are mainly aimed at the students (according to 91.6% of teachers), mostly as one-off actions (according to 74.9% of the teachers) and in a lecture/conference format (according to 93.6% of teachers).
• As for the training content, 77.4% of the teachers report that interventions and activities to prevent psychoactive substances and other addictions in their educational centers focus on legal drugs, 70.9% on the correct use of new technologies and 61.6% on illegal drugs.
68.6
61.1
55.7
35.1
22,3
14,7
71.3
64.5
62.7
37,1
29,2
15,3
The Psychopedagogical/Educational Counselling Department staff
Tutors
Public institutions
Teachers
Private institutions
Parents´ associations
Figure # 33. Type of professionals who have carried actions to prevent the consumption of tobacco, alcohol, illegal drugs and other addictions at school (% of teachers answering each option) Spain, 2014-2016.
Indicate who carries or is involved in actions to prevent the use of tobacco, alcohol, illegal drugs and other addictions in your school in the last five years:
2014
2016
Note: Information obtained from the opinions and perceptions of Secondary School teachers.
SOURCE: OEDA. 2016 Survey on Drugs and other addictions among Secondary School Teachers (EPAD).

2016 · EPAD · 41
99.2
88.8
22.2
74.5
9.8
68.6
91.6
77.4
23.3
70.9
10.6
61.6
2.8
3.4
With regard to the groups to whom these actions are addressed (prevention of tobacco, alcohol and illegal drugs use and other addictions in the last 5 years), almost all teachers consider that students are the target population (91.6%). However, a few of them consider that the students´ families (23.3%) and the school staff (10.6%) have also been a target of these preventive actions. 2016 data are very similar to those registered in 2014. (Figure 34)
Figure # 34. Groups to whom preventive actions on tobacco, alcohol, illegal drugs use and other addictions have been addressed at school in the last 5 years. Spain, 2014-2016.
Figure # 35. Main work areas on which preventive actions on tobacco, alcohol and illegal drugs use and other addictions have focused at school in the last 5 years. Spain, 2014-2016.
Indicate those groups to whom the actions carried out in prevention of tobacco, alcohol and illegal drugs use and other addictions have been addressed in your school in the last five years.
Indicate which are the main work areas on which preventive actions on tobacco, alcohol and illegal drugs use and other addictions have focused in your school in the last five years:
Students
Students´ Families
School Staff
Legal drugs
New technologies
Illegal drugs
On-line gambling/betting
2014
2016
2014
2016
Note: Information obtained from the opinions and perceptions of Secondary School teachers.
SOURCE: OEDA. 2016 Survey on Drugs and other addictions among Secondary School Teachers (EPAD).
Note: Information obtained from the opinions and perceptions of Secondary School teachers.
SOURCE: OEDA. 2016 Survey on Drugs and other addictions among Secondary School Teachers (EPAD).
Legal drugs are once more the main work area on which preventive actions have focused in the last five years within the educational centers (77.4%), ranking behind prevention of the misuse of new technologies (70.9%), prevention of illegal drugs (61.6%) use and prevention of the misuse of online gambling, tha latter at a considerable distance. (Figure 35)

2016 · EPAD · 42
As for the continuity of the preventive actions carried out in schools, 74.9% of the teachers regard them them as punctual, that is to say, one-off actions lasting one or more days, while 29.3% regard them as systematic actions, mea-ning that they have a structured program, entailing specific activities to reach specific goals. Additionally, 5.0% of the teachers declare that both type of actions (punctual and systematic) have been carried out in their educational centers in the last five years.
In comparison with 2014, 2016 data are showing an increase of the number of teachers declaring one-off actions and a decrease of those declaring systematic ones. (Figure 36)
Figure # 36. Continuity of the actions carried out at school for the prevention of tobacco, alcohol and illegal drugs use and other addictions in the last 5 years. Spain, 2014-2016.
Figure # 37. Nature of actions undertaken for the prevention of tobacco, alcohol and illegal drugs use and other addictions at school in the last 5 years. Spain, 2014-2016.
Indicate the type of actions that have been carried out for the prevention of tobacco, alcohol and illegal drugs use and other addictions in your school in the last five years:
Indicate the nature of actions undertaken for the prevention of tobacco, alcohol and illegal drugs use and other addictions in your school in the last five years:
58.3
36.5
5.2
74.9
29.3
5.0
Punctual
Systematic
Both punctual and systematic
Conferences or speeches
Posters and leaflets
Contests and workshops
Sport activities
2014
2016
2014
2016
Note: Information obtained from the opinions and perceptions of Secondary School teachers.
SOURCE: OEDA. 2016 Survey on Drugs and other addictions among Secondary School Teachers (EPAD).
Note: Information obtained from the opinions and perceptions of Secondary School teachers.
SOURCE: OEDA. 2016 Survey on Drugs and other addictions among Secondary School Teachers (EPAD).
With regard to the nature of these actions, 93.6% of teachers state that lectures/ conferences/speeches have been given at their center, 37.5% that posters and leaflets on drugs use and misuse of new technologies prevention have been produced and handed out or displayed in the classrooms, 21.8% that sport activities have been organized and 19.0% declare that contests or workshops have taken place. 2016 data are very similar to those obtained in 2014. (Figure 37)
94.9
39.5
20.9
21.3
93.6
37.5
21.8
19.0
2016 · EPAD · 43
80.9
56.7
43.0
28.4
21.2
18.2
14.3
5.7
In addition, EPAD survey provides information on the teachers´ perceptions and opinions about the programs and actions undertaken by educational centrs with regard to psychoactive substances and other addictions.
• Most teachers (80.9%) are aware of the existence of an internal regulation prohibiting drugs in the school premises and 43.0% are aware of the existence of school action protocols for detection of drug-related problems.
• 79.4% of teachers declare that measures are undertaken if students attend school under the influence of drugs.
• Most teachers declare that measures are undertaken at school if students smoke tobacco (94.0%) or cannabis (86.1%) or if cannabis (76.2%) or synthetic drugs (71.4%) dealing/trading is detected.
80.9% of teachers declare being aware of the existence of an internal regulation prohibiting drugs in the school premi-ses and 43.0% are aware of the existence of school action protocols for detection of drug-related porblems. (Figure 38)
Figure # 38. Program availability and measures to be undertaken by educational centrs with regard to psychoactive substances and other addictions (% of teachers selecting each option). Spain, 2016.
Indicate which of the following statements regarding the use of tobacco, alcohol and illegal drugs and other addictions are consistent with what actually takes place in your school:
Regulation prohibiting drugs in the school premises
Action Protocols against school harassment by means of new technologies
Action Protocols for detection of drug-related problems
Coordination with external resources
Drug prevention program
Identification of risk area for drug use in the school premises
Drugs free educational center
OthersNote: Information obtained from the opinions and perceptions of Secondary School teachers.
SOURCE: OEDA. 2016 Survey on Drugs and other addictions among Secondary School Teachers (EPAD).

2016 · EPAD · 44
As for the different actions undertaken by educational centers with regard to psychoactive substances and other addictions, 79.4% of teachers declare that measures are undertaken if students attend school under the influence of drugs, registering higher figures when teachers are asked about actions undertaken if students are smoking cannabis (86.1%) or tobacco (94.0%) within the school premises.
According to the teachers, whenever there is psychoactive substances use (as smoking cannabis or tobacco within the school premises), actions are impemented within the educational community (94.0% for tobacco and 86.1% for can-nabis) by means of measures such as talking with parents or expelling students from school. However, other measures involving social services and tutoring-agents are also implemented (5.3% for tobacco and 13.7% for cannabis) outside the educational community.
With regard to dealing/ trading psychoactive substances, 76.2% of teachers report that actions are undertaken in the case of cannabis and 71.4% of them declare so in the case of synthetic drugs. These actions are implemented both within and outside the the educational community.
For each one of the above mentioned situations, there is a small proportion of teachers declaring that no measures are implemented in their school when conmsumption or dealing/trading of psychoactive substances is detected (below 1.6% in all cases).
Nonetheless, it should be taken in account that a considerable percentage of teachers declare that they do not know about the established procedures in their educational centers if situations of this kind were eventually detected. Actually, over 20% of surveyed teachers say they do not know if their educational centers are supposed to undertake any actions if cannabis or synthetic drugs dealing/trading is detected within the school premises. (Figure 10)
Figure # 39. Actions undertaken by the educational centers with regard to psychoactive substances and other addictions. (% of teachers answering each option). Spain, 2016.
Are measures implemented in your educational center when any of the following situations is detected?
% Yes (within /outside the educational community)*
% NO
% Don´t know
Students attend school under the influence of drugs 79.4 (75.2/4.2) 1.5 19.1
Students smoke tobacco in the school premises 94.0 (93.1/0.9) 0.7 5.3
Students smoke cannabis in the school premises 86.0 (81,9/4,2) 0.2 13.7
Students deal/trade cannabis in the school premises 76.2 (60.2/16.0) 0.3 23.5
Students deal/trade synthetic drugs in the school premises 71.4 (54.8/16.6) 0.2 28.4
Students use the smartphone during lessons 96.1 (95.8/0.3) 1.4 2.5
Students suffer cyber-bullying 93.7 (87.5/6.2) 0.1 6.2
* Within the educational community: measures involving students, family members and teachers, such as: talking with parents, being expelled one day from school, etc. Outside the educational community: measures involving community social services, tutoring agents, etc.
Note: Information obtained from the opinions and perceptions of Secondary School teachers.
SOURCE: OEDA. 2016 Survey on Drugs and other addictions among Secondary School Teachers (EPAD).

2016 · EPAD · 45
63.1
23.2
13.7
72.8
24.9
2.3
60.6
22.5
16.9
73.4
22.6
4.0
Teachers are also asked about their opinion on the actions carried out in their educactional centers (last five years) to prevent the use of tobacco, alcohol and illegal drugs and other addictions.
53.5% of the surveyed teachers consider that they are sufficient and 46.5% that they are insufficient.
In terms of impact, nine out of ten teachers believe that actions undertaken are at least partially effective for the prevention of psychoactive substances and other addictions.
With regard to acceptance of preventive actions by students, 75% of teachers consider that these are well received by students. (Figure 39)
Assessment of the actions undertaken within the educational centers on psychoactive substances and other addictions (teachers´ perceptions and opinions)
• 5 out of 10 teachers are of the opinion that actions on the prevention of psychoactive substances use and other addictions carried out in schools are sufficient.
• 9 out of 10 teachers believe they are effective.
• 7 out of 10 teachers consider that they are well-received by students.
Note: Information obtained from the opinions and perceptions of Secondary School teachers.
SOURCE: OEDA. 2016 Survey on Drugs and other addictions among Secondary School Teachers (EPAD).
Figure # 40. Effectiveness and acceptance by students of the actions undertaken on the prevention of psychoactive substances use and other addictions (% of teachers who answer each option) Spain, 2016.
In overall, what is your assesment of the actions undertaken in your school (in the last five years) to prevent the use of tobaco, alcohol and illegal drugs and other addictions?
Partially effective
Effective
Little or not effective
Well received
Indifferent
Not accepted
EFFECTIVENESS
ACCEPTANCE BY STUDENTS
In prevention of tobacco, alcohol and ilegal drugs consumption
In preventing other addictions

2016 · EPAD · 46
2000 2002 2004 2006 2008 2010 2012 2014 2016
77.4
24,737.7
79.5
27.1
72.8
53.5
23.2
Over time teachers´ perceived effectiveness of implemented actions has improved since 2000 when only 8.6% of them considered activities to be effective or partially effective. Since 2004 the proportion of teachers who believe that these actions are well received by students has increased, although a 7 percentage point decrease was registered from 2012 to 2016. (Figure 40)
Notes: 2014 data are referred to effectiveness, sufficiency and acceptance by students of implemented actions to prevent tobacco, alcohol and illegal drugs use and other addictions. Data from previous years do not include other addictions.
Note: Information obtained from the opinions and perceptions of Secondary School teachers.
SOURCE: OEDA. 2016 Survey on Drugs and other addictions among Secondary School Teachers (EPAD).
Figure # 41. Teachers´opinion on the effectiveness, sufficiency and acceptance by students of implemented actions to prevent tobacco, alcohol and ilegal drugs use and other addictions (% of teachers answering each option) Spain 2000-2016
In overal, what is your assessment of implemented actions to prevent tobacco, alcohol and ilegal drugs use and other addictions in your school (in the last five years)?
Well received
Sufficient
Effective

2016 · EPAD · 47
The Survey on Drugs and other Addictions among Secondary School Teachers in Spain (EPAD) is a useful tool to obtain information on the perceptions and opinions of Secondary School teachers on different aspects of drugs use and other addictions.
By conducting two surveys simultaneously (ESTUDES among Secondary School students and EPAD among Secondary School teachers) it is possible to obtain complementary information and a global vision of the phenomenon. In addition, this synergy makes it possible to achieve an efficient management of the available resources. Additionally, long historical surveys series provides data trends.
The information obtained from this survey should help design, plan and evaluate evidence-based specific interventions in this area and, ultimately, should be useful for improving the health of teenagers and young people.
Perceptions and opinions of Secondary School teachers on psychoactive substances and other addictions
Most teachers consider that illegal drugs use, either habitually or sporadically, may lead to many/quite a few problems. However, smoking cannabis sometimes is perceived as problematic by 67.5% of respondents.
In overall, risk perception about legal drugs use is lower than that associated with illegal drugs, particularly if alcohol use is considered: 67.0% of teachers consider that daily consumption of 1 or 2 beers or drinks may lead to many/quite a few problems and 69.4 % for consumption of 5 or 6 beers or drinks on the weekends.
Comparing risk perception of 14 to 18 year old students (ESTUDES 2016) and that of teachers (EPAD 2016), it is made clear that for the majority of drugs there is a greater proportion of teachers considering drug use as a potential trouble-making factor than students considering so. Nonetheless, registered figures for some drugs such as heroin, cocaine powder and ecstasy are almost the same in both populations.
With regard to regular use, the biggest differences in risk perception are registered for electronic cigarettes use (34.2% among students and 63.8% among teachers), for 1 or 2 drinks or beers daily use (59.2% among students and 67,0% among teachers), for 5 or 6 beers or drinks on the weekends use (56.1% among students and 69.4% among teachers) and for smoking 1 to 5 cigarettes per day (68.2% among students and 80.0% among teachers).
Regarding the extent and scale of the drugs problem within schools, two out of every five teachers (42.8%) declare that it is currently a serious problem, but just 5.2% of them believe this problem may be affecting a relatively high number of students.
In the opinion of those teachers surveyed, tobacco is the most widespread psychoactive substance among secondary school students, followed by alcohol and cannabis. However, when it comes to choosing the most relevant drugs for prevention, a greater percentage of teachers believe that prevention against alcohol consumption is more necessary than smoking prevention.
The new technologies have burst into our lives and specially into young people´s daily life. Teachers are aware of this phenomenon and also of the risks that the misuse of new technologies can lead to. A considerable percentage of tea-chers are of the opinion that the uncontrolled use of Internet is affecting the students´ academic performance in a negative way (77.5%) as well as the students´ behavior (63.7%), in which a negative impact is observed.
Conclusions

2016 · EPAD · 48
Perceptions and opinions of Secondary School teachers on the training received in psychoactive substances and other addictions
More than half of the surveyed teachers (53.8%) state that they have been trained either in the prevention of drugs use (legal and illegal) (46.5%) or in other addictions (52.0%), a proportion that has significantly increased with respect to values observed in previous years.
The specific topics covered by this training are including new technologies (80.9%), prevention of legal drugs use (61.3%), prevention of illegal drugs use (45.6%) and online gaming and betting (3.5%).
The main promoters of these training programs were the Autonomous Communities Drug Plans (45.9% for prevention of tobacco, alcohol and illegal drugs use and 26.7% for prevention of other addictions) and other public institutions (29.8% for tobacco, alcohol and illegal drugs and 37.8% for other addictions).
Regarding the content of the training received in psychoactive substances and other addictions, new technologies misuse related risks (22.4%) and drug use associated harm and effects ( 21.0%) were the training components mentio-ned by a larger percentage of teachers.
As for duration of training, 56.6% of the teachers who were trained in the prevention of tobacco, alcohol and illegal drugs use and 55.7% of those trained in the prevention of other addictions declared they had received 0 to 5 hour duration cour-ses. Training lasting longer 20 hours or longer represented 11.3% (prevention of legal and illegal drugs use) and 12.1% (prevention of other addictions).
A large proportion of those teachers that reported having been trained in psychoactive substances and other addictions are of the opinion that training has provided them with some information but not to the extent to enable them to take on direct reponsibility for implementing preventive programs: 45.7% (tobacco, alcohol and other illegal drugs prevention) and 45.2% (prevention of other addictions).
Far from questioning neither training applicability nor usefulness, teachers consider it easily applicable (51.4%) or applica-ble with difficulty (44.0%), totally useful (50.2%) or partially useful (47.3%).
Perceptions and opinions of Secondary School teachers on the actions undertaken in educational centers on psychoactive substances and other addictions
Actions undertaken by teachers
68.8% of teachers state that they have carried out some action aimed at students to prevent drugs use (65.4%) or other addictions (68.8%) in the last 5 years, thus confirming the upward trend observed since 2010.
The specific contents/topics teachers have dealt with are including legal drugs (79.2%), new technologies (77.3%), illegal drugs (54.9%) and online gaming or beting (5.3%). Specifically addressed aspects by teachers carrying out interventions were drugs effects and related harms (78.3%) and the consequences of the misuse of new technologies (73.9%).
Actions undertaken within the educational centers
With regard to the actions undertaken at schools in the last five years, most teachers state that the Psychopedagogical/ Education Counselling Department (71.3%) and class tutors (64.5%) are responsible for drug prevention programs imple-mentation. Teachers are of the opinion that these programs are mainly aimed at the students (91.6%).
According to the teachers, these programs have focused mostly on legal drugs (77.4%), new technologies (70.9%) and illegal drugs (61.6%). 74,9% of the teachers regard these actions as puctual (one-off actions lasting one or more days) while 29.3% of them consider they could be categorized as systematic (structured programs). Only 5.0% of the surve-yed teachers declare that both type of actions have been carried out in the last five years.

2016 · EPAD · 49
Lectures, conferences or speeches (93.6%) and production of posters and leaflets on drugs use and misuse of new tech-nologies to be handed out or displayed at school (37.5%) were the type of activities which, in the teachers´opinion, were carred out the most.
It seems that 80.9% of the teachers declare being aware of the existence of an internal regulation prohibiting drugs in the school premises, 56.7% of action protocols to address cyberbullying and 43.0% of action protocols for the detection of drug-related problems.
As for measures undertaken within the educational centers with regard to psychoactive substances use or dealing/tra-ffiking, to mobile phones being used during class time or to a possible case of cyberbullying, most teachers state that measures are taken within the educational community. However, when it comes to cannabis and/or synthehtic drugs dealing/trading in the school premises,measures are also usually taken outside the educational community.
Assessment of actions undertaken
Finally, actions undertaken for the prevention of tobacco, alcohol and illegal drugs and other addictions have been subject to an overall assessment by the surveyed teachers. Results are as follows: 53.5% of the teachers consider that actions undertaken at school to prevent tobacco, alcohol and illegal drugs use are sufficient (46.6% regarding prevention of other addictions); 86.3% consider that actions undertaken at school to prevent tobacco, alcohol and illegal drugs use are effective (81.1% regading prevention of other addictions) and 72.8% think that actions undertaken at school to prevent tobacco, alcohol and illegal drugs use are well received by students (73.4% regarding prevention of other addictions).

2016 · EPAD · 50
Based on the results of the EPAD survey, a series of recommendations are presented, taking into account that the educational centers are providing a unique opportunity to carry out interventions in the field of prevention of addictions and health promotion.
1. Inclusion of useful training in psychoactive substances (especially alcohol and cannabis with a polydrug approach) and in the proper use of new technologies (use of mobile devices and internet, cyberbullying and online gambling/bet-ting) in the school curricula. This training should use an overaching and transversal approach, being oriented not only to provide information to students but tools for social and emotional skills development, for decision making and for adoption of healthy lifestyle habits.
2. Provision of training on psychoactive substances (especially alcohol and cannabis with a polydrug approach) and in the proper use of new technologies (use of mobile devices and internet, cyberbullying and online gambling/betting) to school teachers. Training should be practical and the educational centers should facilitate their implementation.
3. Identification of those responsible for training students in the prevention of psychoactive substances and other addictions within the educational centers, gearing training towards this group. In any case, teachers and tutors must be given training and tools to promote and convey healthy lifestyle habits among students.
4. Promotion of specific regulation and action protocols on psychoactive substances to be implemented if drugs use or dealing were identified within the educational center. In case regulation and action protocols existed already, work should be done so that teachers are aware of them and may apply them if necessary.
5. Continuation and increase of drug dealing/trading surveillance activities in the school surroundings, since it has porved to be effective in reducing drug traffic and consumption.
6. Compliance with current legislation3 that prohibits smoking in educational centers.
7. Raise awareness about alcohol and cannabis associated risks (particularly for young people) among teachers, stu-dents and society at large.
8. Provide information to students and their families on the teachers´ perceptions with regard to the effects of alcohol or cannabis use and internet misuse on the students´ academic performance and behaviour. Further research in this area is recommended.
9. Ensure that guides on the proper use of mobile devices within the educational centers are readily available.
10. Continuation and reinforcement of cyberbullying monitoring activities in school-aged children.
11. Continuation of work in this area, conducting EPAD survey periodically while adapting it according to the specific needs and scenario. Futher studies and complementary analyses are necessary to study in depth the potential con-sequences of psychoactive substances use and of the misuse of new technologies especially among the youngest..
12. Foster collaboration among different actors involved, which will require a strong commitment and coordination of the General State Administration (Ministry of Health, Social Services and Equality, Ministry of Interior, Ministry of Education, Culture and Sports, etc.), the Autonomous Communities and Cities (Departments of Health, Education, Social Affairs, Culture and Sports, Police Corps, etc.), non-governmental organizations, parents associations, research institutions and universities, etc.
Recommendations
3. Section d) of article 7 of Law 28/2005, of December 26, on health measures against smoking and regulating the sale, supply, consumption and advertising of tobacco products.