Embed Size (px)
Citation preview

C R E A T I V I T Y R E S E A R C H P R A C T I C A L I T Y A P P L I C A T I O N
Survey SAYS: Great Grapes!An IPM Success Story
The results of a 2005 survey show that, for Washington State wine and juice
grape growers, the glass is empty on pesticide use and full on integrated pest management.
That’s grape news for producers, consumers, and the environment!
EB2025E
This publication authored with pride by Holly Ferguson, Sally O’Neal, and Douglas Walsh, WSU Prosser IAREC
What would you call an 84% reduction in insecticide use
and a 73% reduction in fungicide use over the course of a
decade? We call it GRAPE NEWS! WSU Research and Extension
is proud of the part we have played in this reduction. But IPM
(integrated pest management) is more than just reducing
pesticide use. Our survey also showed that over 80% of grape
growers surveyed scout for pests regularly and that over half
use economic thresholds or disease forecasting models. Kudos
to our state’s forward-thinking growers.
This publication and the 2005 survey were supported in
part by the Washington Wine Industry Foundation and the
Washington Association of Wine Grape Growers. We also
thank Gary Grove, Kevin Corliss, Rick Hamman, and Cathe-
rine Daniels for their valuable editorial assistance and Mercy
Olmstead for assisting in distributing the survey. Special
thanks to Chateau Ste. Michelle and Ron Wight for provid-
ing many of the photos. The grape mealybug photo on
page 4 (far right) is courtesy of USDA-ARS, Bugwood.org.
Washington State already leads the nation in juice grape production, is #2 in wine
grape production, and is recognized worldwide as a producer of super-premium wines.
This survey shows that our grape growers lead the nation in IPM as well.
i
C R E A T I V I T Y R E S E A R C H P R A C T I C A L I T Y A P P L I C A T I O N
h o w g r a p et h o u a r tWhen we set out to survey the grape growers of Washington State on
their pest management practices in October 2005, we had no idea we
were tracking an absolute phenomenon in integrated pest management
adoption. When the data were compared with pest management practices
recorded in the mid 1990s, the results were astonishing.
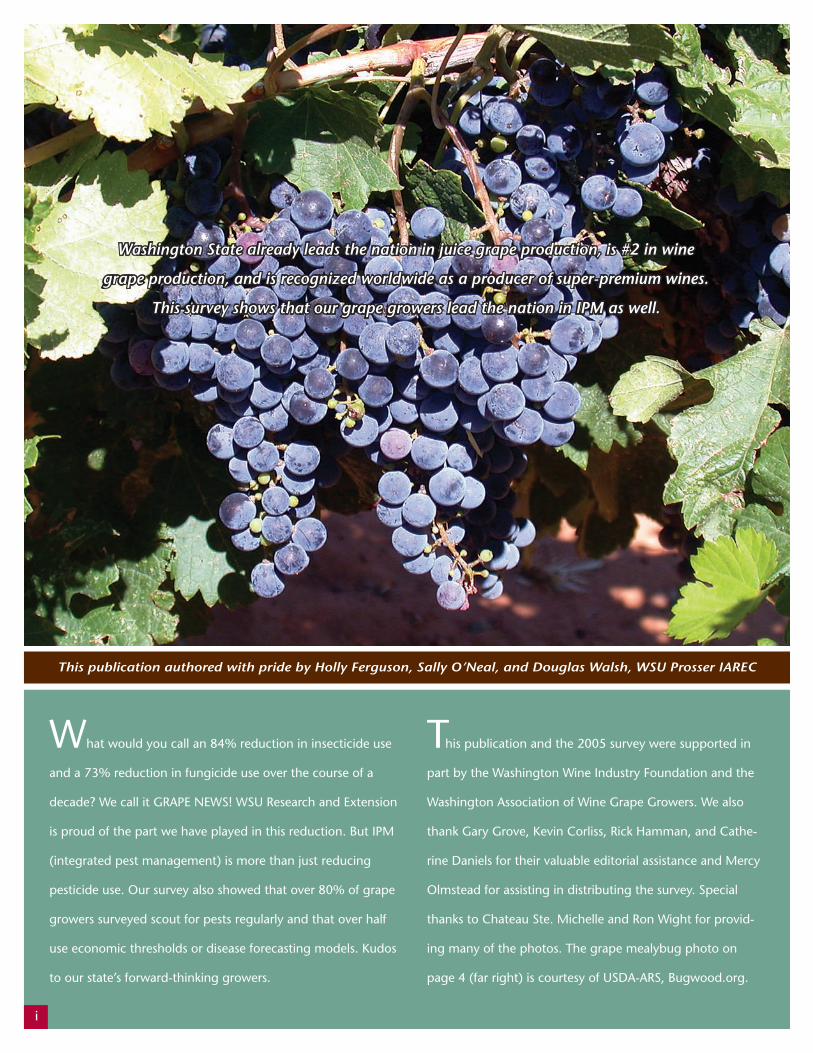
What a difference a decade makes. In ten short years, entirely new
practices have evolved for dealing with major grape pests. Powdery
mildew and cutworm are approached with a completely different set of
practices and tools. A new herbicide treatment paradigm now enables
growers to deal with suckers, those unwanted shoots that rob fruit-
bearing vines of vital nutrients, without costly hand labor.
It takes a true partnership between research and industry to bring about
such wholesale change in so short a time. The industry was motivated,
and Washington State University Research and Extension answered the
challenge.
How does an industry reduce its
insecticide/miticide use by 84%? Its
fungicide use by 73%? Motivation and
teamwork. This bulletin summarizes
data from our 2005 survey, compares
it to data collected in the 1990s,
and analyzes the reasons behind this
impressive adoption of new, safer, more
integrated pest management strategies.
ii

iii
t a b l e o fc o n t e n t sThe Data 1
Survey Respondents 2
Production Practices 3
Pests 4
Arthropods/Mollusks 4
Weeds 6
Diseases 7
Integrated Pest Management 8
Information Sources 11
Pesticide Usage 12
Reported by Crop Growth Stage 12
Delayed Dormant/Bud Break Period 13
Rapid Shoot Growth Period 15
Bloom to Veraison Period 17
Veraison Period 20
Statewide Estimates 21
Insecticides/Miticides 21
Herbicides 23
Fungicides 24
Summary and Conclusions 26
Appendix 31
References 31

t h e d a t aIn October 2005, a ten-page questionnaire was mailed to grape
growers throughout Washington State using confidential mailing
lists of the Washington Association of Wine Grape Growers and the
Washington State Grape Society. The survey queried growers on the
type and severity of their pest problems, their pesticide usage, their
use of IPM practices, and their pest management information sources.
The result was the first comprehensive survey of chemical and non-
chemical pest management practices used by wine and juice grape
growers in Washington State.
The data collected in 2005 were compared with and contrasted
to data gathered earlier by WSU Extension personnel (Morrell
and Schreiber 1998) and by the Washington Agricultural Statistics
Service (WASS 2002, 2006). The 1998 WSU Extension publication
covered the impact of pesticide use on Pacific Northwest wine and
juice grapes using pesticide application records from 1992 to 1994;
it did not address cultural practices or IPM adoption. WASS conducts
a survey of grape agrichemical usage every two years; however its
information is limited to summaries of major pesticide use. It does
not separate wine grape and juice grape pesticide usage and, like the
1998 WSU publication, it provides no information on non-chemical
pest management practices.
This report summarizes the data
gleaned from our 2005 survey,
ranking the arthropod, weed,
and disease pests identified by
the growers and detailing the
pest management strategies
they employed. Data from earlier
surveys and application records
are used to track changes in pest
management practices over time.
A S S E S S R E V I E W V E R I F Y A N A L Y Z E
1

s u r v e y r e s p o n d e n t sWashington State ranks as the number 1 state in the nation in the production of Concord and Niagara grapes
(juice grapes) and is the number 2 state in wine grape and total grape production. Both the wine grape and the
juice grape industries experienced significant economic growth in Washington from 1994 to 2005. Wine grape
acreage increased 118%, from 12,862 to 28,000 acres. Juice grape acreage increased 18%, from 22,000 to 26,000
bearing acres. Growers responding to the survey represented production and pest management practices on
3,912.5 acres of Concord grapes, 66.6 acres of Niagara grapes and 6,273.83 acres of wine grapes. This represents
approximately 15% of the juice grape acreage and 22% of the wine grape acreage in Washington State.
Growers responded from all appellations of the state at the time of the survey. An appellation, also called an
American Viticultural Area (AVA), is defined as a wine grape-growing region distinguished by name, climate,
soil, and physical characteristics from other growing regions. In 2005, there were seven AVAs in Washington
State: Columbia Gorge, Columbia Valley, Horse Heaven Hills, Puget Sound, Walla Walla Valley, Yakima Valley,
and Red Mountain. At this writing there are nine appellations with the recent additions of Rattlesnake Hills and
Wahluke Slope. In 1994, there were only four appellations—the Columbia Valley, Yakima Valley, Walla Walla
Valley, and Puget Sound. While most of the 2005 survey respondents were from the Yakima Valley (54%), most
of the reported wine acreage was in the Horse Heaven Hills area near Paterson (3,939 acres, 63% of reported
wine grape acreage). The remainder of the wine grape acreage represented was located mostly in the Columbia
Valley (18%), the Walla Walla Valley (9%), and the Yakima Valley (8%), all in eastern Washington. Most of the
reported Concord juice grape acreage was located in the Walla Walla Valley in the southeastern part of the state
(2,383 acres, 61% of reported Concord grape acreage). The rest of the reported Concord juice grape acreage was
located in the Yakima Valley (36%) and the Columbia Valley (3%), with the exception of a small 2-acre parcel
west of the Cascades. All of the reported Niagara juice grape acreage was in the Yakima Valley region.
T A B L E 1
AVA %*N u m b e r o f A c r e sWine
GrapesConcord Grapes
NiagaraGrapes
Columbia Gorge 4 30.00 -- --
Columbia Valley 10 1,127.80 111.80 --
Horse Heaven Hills 7 3,939.00 -- --
Puget Sound 4 15.00 2.00 --
Walla Walla Valley 10 545.90 2,383.00 --
Yakima Valley 54 504.48 1,415.70 66.60
Red Mountain 4 77.00
Other† 11 33.65
Total 6,272.83 3,912.50 66.60
* Percentage of survey respondents. Numbers do not add up to 100 because some growers had grapes in more than one AVA. † North Okanogan, Lake Roosevelt, Lake Chelan, Clark County.
Map and table below show percentage of 2005 survey respondents and respect ive grape acreage reported within speci f ic American Vit icultural Areas (AVAs) in Washington State
Map shows percentages of reported acreage (wine grape/juice grape) from the various AVAs recognized in 2005. Rattlesnake Hills was not recognized as an AVA until 2006; responses from this region were included in Yakima Valley.
Base map courtesy of Washington Wine Commission. 2

p r o d u c t i o n p r a c t i c e sFifty percent of the survey respondents reported that
they were full-time grape growers, and 44% said they
maintained part-time farming operations. Twenty-nine
percent of the survey respondents described themselves
as conventional producers, 10% described themselves
as organic producers, and 7% described themselves as
being in transition to organic. As a write-in response,
4% said they were practicing sustainable farming.
Growers reported using several methods of irrigation.
Most of the reported grape acreage (57%) was irrigated by
drip systems. Drip irrigation was predominant in wine
grapes. Impact sprinkler irrigation was used on 35% of
the total acreage and was the predominant irrigation
technique used on juice grapes. Furrow (also known as
“rill”) irrigation was used on approximately 5% of the
total grape acreage. Other methods of irrigation reported
included microsprinklers, center pivot systems, and
rotator sprinklers.
Although wine grape acreage has increased substantially
over the past 10 years, yields per acre have decreased over
the same time period. In 1997, the yield for wine grapes
was 4.77 tons per acre while in 2005, the state average
for tons per acre, according to WASS, had decreased to
3.93. Respondents to our 2005 survey reported a higher
average (but still down slightly from the 1997 numbers)
of 4.5 tons of wine grapes per acre. The decrease in
yield reflects the adoption of deficit irrigation systems
that have been documented as improving grape and
subsequently wine quality. Winemakers also prefer
yields of 3.5 tons/acre or less. Yield from juice grape
vineyards can fluctuate substantially among years. In
1996, yields averaged 4 tons per acre and in 2005 record
yields of 11.7 tons per acre were documented.
Drip irrigation, as shown at top, was predominant in
wine grapes. Furrow irrigation, shown immediately
above, has fallen out of favor for a variety of reasons;
it was reported on only 5% of the total grape
acreage. Sprinkler irrigation, as shown below, was
the most popular method in juice grapes.
3

p e s t s
a r t h r o p o d s / m o l l u s k s
Survey respondents were asked to estimate the severity
of the arthropod, weed, and disease pest problems in
their vineyards using the following index:
1 = SEVERE PROBLEM limits where grapes can be grown
2 = SEVERE PROBLEM decreases yield significantly
3 = MODERATE PROBLEM decreases yield somewhat
4 = MINOR PROBLEM decreases yield slightly
5 = PRESENT but not problematic
6 = NOT PRESENT or unsure if present
The results of the pest severity ratings are shown in
Tables 2-4. In order to standardize the severity ratings,
weighted averages were calculated for each pest for
wine, Concord, and Niagara grapes separately. To
obtain a weighted average, rating scores reported by
each grower were multiplied by the fraction their
acreage represented of the total acreage of that variety
surveyed. These products were totaled to obtain a
sum-product of the weighted ratings, which was
divided by the proportion of total acreage responding.
The number in parentheses adjacent to the rating is
the percentage of total acreage within the variety
responding to the question. Note that while certain
vertebrates (most notably birds, rodents, and deer)
are known to be pests in grape vineyards, they were
considered beyond the scope of this survey.
Arthropods can directly reduce grape yield by feeding
on buds, shoots, or fruit (cutworms, black vine weevil,
flea beetles), by sucking on plant juices (leafhoppers,
thrips, spider mites, scales), or by feeding on roots
(grape phylloxera, root weevils, June beetles). Some
arthropods (e.g., grape mealybugs, hornworms, and
multicolored Asian lady beetles) and slugs (which are
mollusks) are also potential food contaminants of the
fruit at harvest.
The grape mealybug problem merits a separate
discussion. As a direct pest, grape mealybug is merely a
nuisance, creating damage that can contribute to sooty
mold on clusters in cases of severe infestations. However,
grape mealybug is a documented vector for grapevine
leafroll disease, a progressive and untreatable condition
resulting from infestation by a topsovirus or complex
of topsoviruses. Grapevine leafroll is discussed further
in the Diseases section. Mealybugs in leafroll-infected
The [arthropod] pests with the worst severity ratings were leafhoppers, cutworms, and grape mealybugs.
4

T A B L E 2
Arthropod/Mollusk*
Average Severity Rating by Grape Variety(% Variety Acreage Responding)
Overall Rating of
PestWine Concord NiagaraCutworms 2.8 (99) 4.9 (96) 4.7 (100) 4.1
Grape Mealybugs 3.0 (99) 5.6 (96) 4.9 (100) 4.5
Leafhoppers† 3.1 (14) 3.6 (6) n.d. 3.4
Wireworms 3.6 (82) 5.8 (89) 5.8 (83) 5.1
Flea Beetles 4.7 (85) 5.3 (88) 6.0 (83) 5.3
Hornworms 5.3 (95) 6.0 (88) 6.0 (83) 5.8
Sage Weevils 5.3 (82) 6.0 (88) 6.0 (83) 5.8
Grape Phylloxera 6.0 (85) 5.9 (88) 6.0 (83) 6.0
Slugs 6.0 (82) 6.0 (88) 6.0 (83) 6.0
June Beetles 6.0 (82) 5.3 (88) 6.0 (83) 5.8
Root Weevils 6.0 (82) 6.0 (88) 6.0 (83) 6.0
Spider Mites† 4.0 (1) -- -- 4.0
Thrips† 4.0 (<1) 2 (4) 2 (9) --
Overall by Variety 4.6 5.5 5.7
* Other insects noted by growers were: yellow jackets and multicolored Asian lady beetles.† Write-in. Spider mites and thrips were rated by one or two growers only.
vineyards are treated like a quarantine pest (i.e., a zero-
population treatment threshold is observed).
The results of pest severity ratings are shown in Table
2. In wine grapes, cutworms were given the worst rat-
ing: 2.8 overall. This indicates that survey respondents
perceived that cutworm feeding on buds causes a sig-
nificant decrease in yield. Mealybugs, leafhoppers, and
wireworms were rated of secondary importance at 3.0,
3.1, and 3.6, respectively. Pests of minor importance
in wine grapes were flea beetles (4.7) and hornworms
(5.3). Pests not considered important to grower respon-
dents were slugs, June beetles, and root weevils. Both
thrips and spider mites were rated 4.0, indicating that
they are a minor problem when present, but only one
(in the case of thrips) or two (in the case of mites) grow-
ers indicated their presence.
Concord grape growers reported fewer arthropod prob-
lems. The worst severity rating (3.6) was given to leaf-
hoppers, but this rating was compiled from only 6% of
the Concord grape acreage representatives. In contrast
to their high importance in wine grapes, cutworms
were assigned a rating of 4.6, indicating this pest was
perceived to be of only minor importance. Pests rated
as not important or not present in Concord grapes
were flea beetles and June beetles (both 5.3), wire-
worms (5.8), grape phylloxera (5.9), and hornworms,
sage weevils, slugs, and root weevils (all rated 6.0).
The arthropod/mollusk pest problem with the worst
severity rating in Niagara grapes was cutworms at 4.7,
though this rating indicated that cutworms were a
very minor problem for the four Niagara grape growers
responding to the survey. Grape mealybugs were rated
as a minor problem in Niagara grapes as well. None of
the other invertebrate pests in the survey were deemed
problematic to the Niagara grape growers.
Overall across varieties, the pests with the worst
severity ratings were leafhoppers, cutworms, and grape
mealybugs. Pest severity ratings were, on the average,
worse in wine grapes, at 4.6, compared with 5.5 for
Concord and 5.7 for Niagara grapes. This indicates
either that wine grapes are more susceptible to pests
of this nature or that damage by chewing and sucking
pests is more economically significant in wine grapes,
which have less foliage than juice grapes.
C U T W O R M S M E A L Y B U G S L E A F H O P P E R S W I R E W O R M S
5
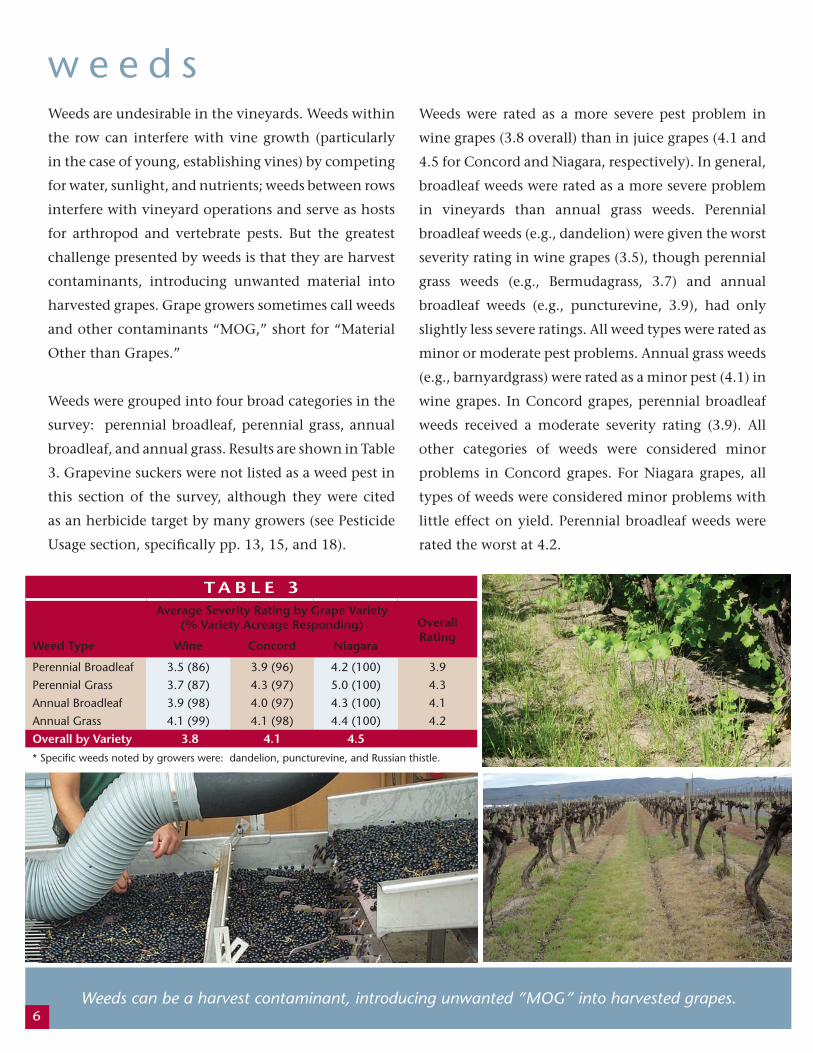
Weeds can be a harvest contaminant, introducing unwanted “MOG” into harvested grapes.
Weeds are undesirable in the vineyards. Weeds within
the row can interfere with vine growth (particularly
in the case of young, establishing vines) by competing
for water, sunlight, and nutrients; weeds between rows
interfere with vineyard operations and serve as hosts
for arthropod and vertebrate pests. But the greatest
challenge presented by weeds is that they are harvest
contaminants, introducing unwanted material into
harvested grapes. Grape growers sometimes call weeds
and other contaminants “MOG,” short for “Material
Other than Grapes.”
Weeds were grouped into four broad categories in the
survey: perennial broadleaf, perennial grass, annual
broadleaf, and annual grass. Results are shown in Table
3. Grapevine suckers were not listed as a weed pest in
this section of the survey, although they were cited
as an herbicide target by many growers (see Pesticide
Usage section, specifically pp. 13, 15, and 18).
6
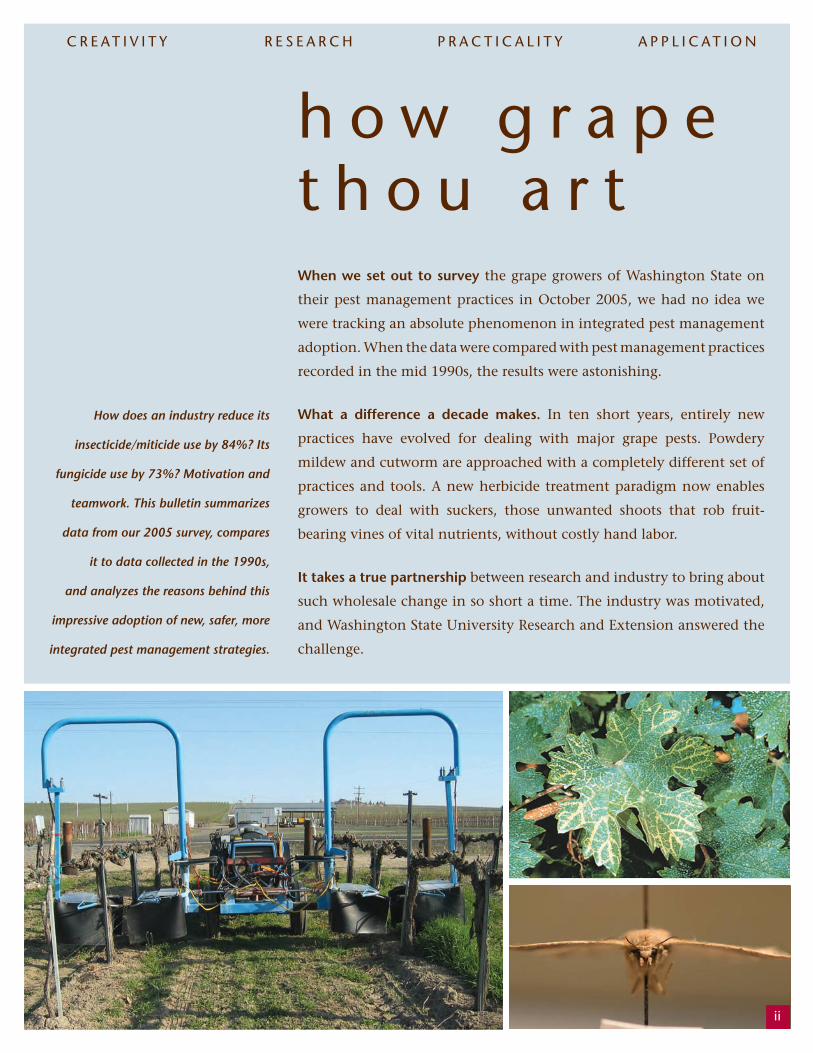
T A B L E 3Average Severity Rating by Grape Variety
(% Variety Acreage Responding) Overall Rating
Weed Type Wine Concord Niagara
Perennial Broadleaf 3.5 (86) 3.9 (96) 4.2 (100) 3.9
Perennial Grass 3.7 (87) 4.3 (97) 5.0 (100) 4.3
Annual Broadleaf 3.9 (98) 4.0 (97) 4.3 (100) 4.1
Annual Grass 4.1 (99) 4.1 (98) 4.4 (100) 4.2
Overall by Variety 3.8 4.1 4.5
* Specific weeds noted by growers were: dandelion, puncturevine, and Russian thistle.
w e e d sWeeds were rated as a more severe pest problem in
wine grapes (3.8 overall) than in juice grapes (4.1 and
4.5 for Concord and Niagara, respectively). In general,
broadleaf weeds were rated as a more severe problem
in vineyards than annual grass weeds. Perennial
broadleaf weeds (e.g., dandelion) were given the worst
severity rating in wine grapes (3.5), though perennial
grass weeds (e.g., Bermudagrass, 3.7) and annual
broadleaf weeds (e.g., puncturevine, 3.9), had only
slightly less severe ratings. All weed types were rated as
minor or moderate pest problems. Annual grass weeds
(e.g., barnyardgrass) were rated as a minor pest (4.1) in
wine grapes. In Concord grapes, perennial broadleaf
weeds received a moderate severity rating (3.9). All
other categories of weeds were considered minor
problems in Concord grapes. For Niagara grapes, all
types of weeds were considered minor problems with
little effect on yield. Perennial broadleaf weeds were
rated the worst at 4.2.

7
Survey respondents were given the opportunity to rate
five diseases (Table 4). Additionally, Eutypa dieback
was written in by a few Concord grape growers.
Fungal diseases were reported as severe problems in
wine grapes but were rarely considered problematic in
juice grapes. This is due to a variety of factors including
differences in susceptibility between wine and juice
grape varieties to both powdery mildew and Botrytis
bunch rots. Powdery mildew affects vine growth and
yield and is recognized by a white, powdery coating
on foliage and berries, along with discoloration,
puckering, and distortion of the leaves. Bunch rot
fungi affect the berries from flowers infected during a
wet spring. The berries split open, allowing the fungal
infection to spread to neighboring berries within the
bunch. The incurable, virus-caused grapevine leafroll
disease causes leaf curl and leaf discoloration. Fruit on
infected vines matures more slowly than fruit on non-
infected vines, which complicates harvest logistics.
Other bacterial and fungal diseases such as crown
gall and Eutypa dieback, respectively, can infect and
kill parts or all of the vine following severe winters.
The infestation of the majority of vines by the crown
gall bacterium drives vineyard retraining decisions
following a severe winter.
In wine grapes, powdery mildew and grape leafroll
virus were deemed to be the most problematic
diseases (2.9); they were considered severe problems
by almost all of the respondents. Nematode-related
diseases were considered a moderate problem in
wine grapes (3.9), while both crown gall and Botrytis
bunch rot were noted to be minor problems (4.3 and
4.4, respectively). However, it should be noted that
crown gall would perhaps be considered a far more
serious problem had this survey taken place following
a severe winter. While powdery mildew is perhaps
the most manageable disease of grapevines, the costs
associated with management represent a significant
and perennial fixed input cost.
As previously noted, diseases were less of an issue in
juice grapes; the worst severity rating was given to
Eutypa dieback (3.1) in Concord grapes (which was
written in by 67% of the responding acreage). Other
diseases were present but not reported as problematic.
One grower indicated that black leaf (a physiological
condition, not a disease) was a minor problem
in Concord grapes (4). Black leaf is caused by a
combination of water stress and overexposure to UVB
radiation. No significant problems with disease were
indicated by the Niagara grape growers surveyed.
d i s e a s e s
T A B L E 4Average Severity Rating by Grape Variety
(% Variety Acreage Responding) Overall Rating
Disease Wine Concord Niagara
Powdery Mildew 2.9 (100) 5.2 (92) 6.0 (100) 4.7
Grape Leafroll Virus 2.9 (98) 5.9 (94) 6.0 (100) 4.9
Nematode-Related 3.9 (86) 5.9 92) 6.0 (100) 5.3
Crown Gall 4.3 (99) 5.9 (92) 6.0 (100) 5.4
Botrytis 4.4 (98) 5.3 (92) 6.0 (100) 5.2
Eutypa no data 3.1 (67) no data 3.1
Overall by Variety 3.7 5.2 6.0
M I L D E W L E A F R O L L B O T R Y T I S E U T Y PA

8
i n t e g r a t e d p e s tm a n a g e m e n tPrevious grape grower pest management practices surveys in Washington
State had focused primarily on pesticide usage. In developing and
administering this survey we felt that it was important to gather data on
the utilization of integrated pest management (IPM) in the vineyards. The
survey results indicate widespread awareness and adoption of a range of
IPM practices. Results of this part of the survey are summarized in Table 5.
When queried regarding the frequency of certain non-chemical control
methods, most growers responded that they often or sometimes employed
scouting, mechanical control of weeds, reduced pesticide rates, and
economic thresholds (80%, 70%, 60%, and 54%, respectively). Augmentative
biological control (i.e., intentional introduction/addition of biocontrol
agents to the vineyard ecosystem) was used often or sometimes by a third
of the grower respondents. (The survey is not representative of growers that
practice passive conservation biological control, i.e., the use of pest control
practices designed to avoid injury to beneficial organisms.) More than half
T A B L E 5
IPM Practice Utilized†Percent of Growers with Response*
Often Sometimes Seldom NeverField Monitoring (Scouting) 59 21 9 6
Mechanical Control of Weeds 51 19 9 14
Reduced Pesticide Rates 24 36 7 17
Economic Thresholds 23 31 7 20
Biological Control 14 17 11 39
Integrated Mite Management 7 11 3 61
Crop Rotation for Disease Control 3 1 10 67* For these questions, % non-responders ranged from 6 to 19% of the total surveys returned. † Other IPM practices noted were canopy management and heat unit modeling.
A W A R E N E S S S C O U T I N G B I O C O N T R O L R O T A T I O N
Pesticide usage is just one small
part of the pest management story.
By including questions on IPM
practices, our 2005 survey gave a
more comprehensive picture of the
full spectrum of pest management
activities employed by our state’s
wine and juice grape growers.
9
of the growers reported never using integrated mite
management or crop rotation for disease control (61
and 67%, respectively); this was expected as mites are
not a key direct pest in grapes and crop rotation is
impractical in perennial vineyard systems.
Wine grape growers frequently employ a variety
of techniques designed to increase light and air
movement in the canopy. These include cordon
suckering, shoot removal, and leafing (strategic
removal of some leaves). The resulting openness of
the canopy can aid in reduction of rot, mildew, and
some leafhopper pressures.
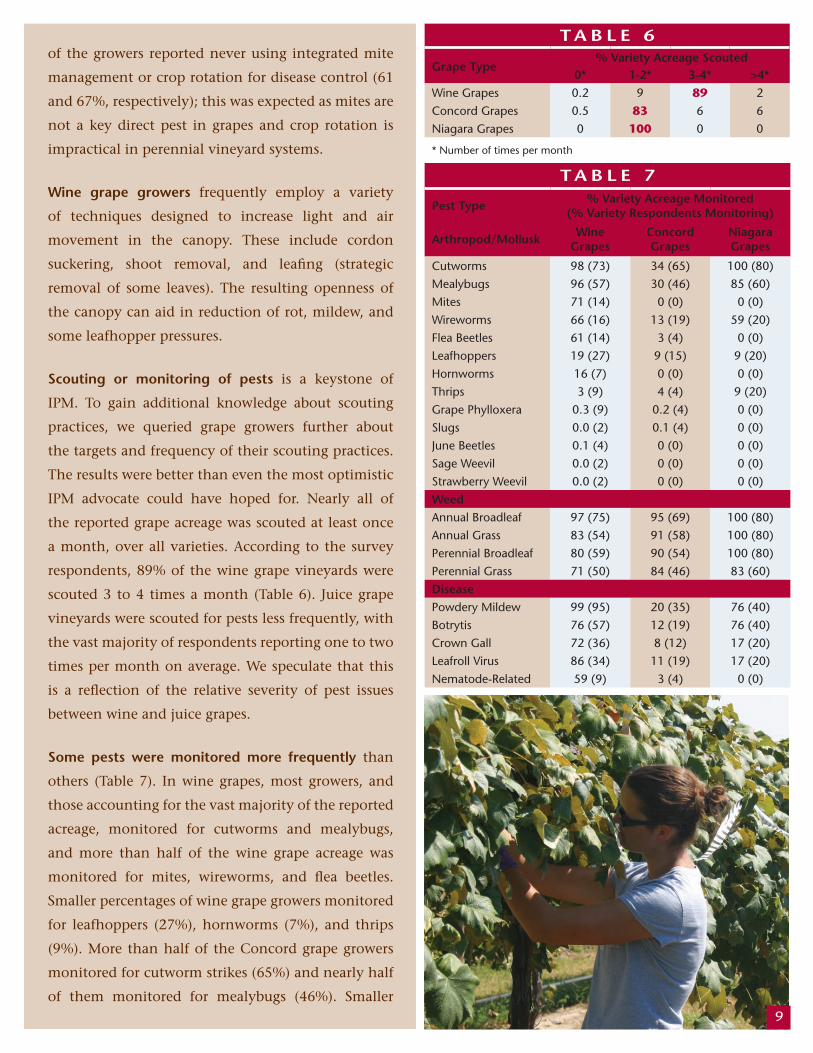
Scouting or monitoring of pests is a keystone of
IPM. To gain additional knowledge about scouting
practices, we queried grape growers further about
the targets and frequency of their scouting practices.
The results were better than even the most optimistic
IPM advocate could have hoped for. Nearly all of
the reported grape acreage was scouted at least once
a month, over all varieties. According to the survey
respondents, 89% of the wine grape vineyards were
scouted 3 to 4 times a month (Table 6). Juice grape
vineyards were scouted for pests less frequently, with
the vast majority of respondents reporting one to two
times per month on average. We speculate that this
is a reflection of the relative severity of pest issues
between wine and juice grapes.
Some pests were monitored more frequently than
others (Table 7). In wine grapes, most growers, and
those accounting for the vast majority of the reported
acreage, monitored for cutworms and mealybugs,
and more than half of the wine grape acreage was
monitored for mites, wireworms, and flea beetles.
Smaller percentages of wine grape growers monitored
for leafhoppers (27%), hornworms (7%), and thrips
(9%). More than half of the Concord grape growers
monitored for cutworm strikes (65%) and nearly half
of them monitored for mealybugs (46%). Smaller
T A B L E 6
Grape Type % Variety Acreage Scouted
0* 1-2* 3-4* >4*Wine Grapes 0.2 9 89 2
Concord Grapes 0.5 83 6 6
Niagara Grapes 0 100 0 0
* Number of times per month
T A B L E 7
Pest Type% Variety Acreage Monitored
(% Variety Respondents Monitoring)
Arthropod/MolluskWine
GrapesConcord Grapes
Niagara Grapes
Cutworms 98 (73) 34 (65) 100 (80)
Mealybugs 96 (57) 30 (46) 85 (60)
Mites 71 (14) 0 (0) 0 (0)
Wireworms 66 (16) 13 (19) 59 (20)
Flea Beetles 61 (14) 3 (4) 0 (0)
Leafhoppers 19 (27) 9 (15) 9 (20)
Hornworms 16 (7) 0 (0) 0 (0)
Thrips 3 (9) 4 (4) 9 (20)
Grape Phylloxera 0.3 (9) 0.2 (4) 0 (0)
Slugs 0.0 (2) 0.1 (4) 0 (0)
June Beetles 0.1 (4) 0 (0) 0 (0)
Sage Weevil 0.0 (2) 0 (0) 0 (0)
Strawberry Weevil 0.0 (2) 0 (0) 0 (0)
WeedAnnual Broadleaf 97 (75) 95 (69) 100 (80)
Annual Grass 83 (54) 91 (58) 100 (80)
Perennial Broadleaf 80 (59) 90 (54) 100 (80)
Perennial Grass 71 (50) 84 (46) 83 (60)
DiseasePowdery Mildew 99 (95) 20 (35) 76 (40)
Botrytis 76 (57) 12 (19) 76 (40)
Crown Gall 72 (36) 8 (12) 17 (20)
Leafroll Virus 86 (34) 11 (19) 17 (20)
Nematode-Related 59 (9) 3 (4) 0 (0)

10
percentages monitored for wireworms (19%) and leafhoppers (15%). While only five Niagara grape growers
participated in the survey, most were actively scouting their vineyards for key pests such as cutworms (100% of
reported acreage) and mealybugs (85% of the acreage).
Weeds were a major concern in all vineyards (Table 7). Nearly all of the grape acreage reported in the survey
was monitored for all types of weeds. Annual broadleaf weeds were cited more frequently for each grape variety,
followed by annual grasses, followed by perennial broadleaf weeds, followed by perennial grasses.
According to the respondents, the disease that was most frequently monitored was powdery mildew, with 99%
of the wine grape acreage scouted for this common disease. Other diseases that were commonly monitored in
were grapevine leafroll, 86% of wine grape acreage; Botrytis bunch rot, 76%; crown gall, 72%; and nematode-
related diseases, 59%. Juice grapes were monitored less frequently, as diseases are less problematic. Thirty-five
percent of the Concord grape growers and 40% of the Niagara grape growers monitored for powdery mildew.
Botrytis bunch rot was monitored at a similar frequency in Niagara grapes (40% of the growers), though only
19% of the Concord grape growers looked for symptoms and signs of this disease. Low percentages of juice
grape acreage were monitored for crown gall, leafroll virus, and nematode-related diseases. Eutypa dieback was
written in by two of the Concord grape growers as a disease for which they scouted.
E X P E R I E N C E A S S O C I A T I O N S H A N D B O O K S E X T E N S I O N
11
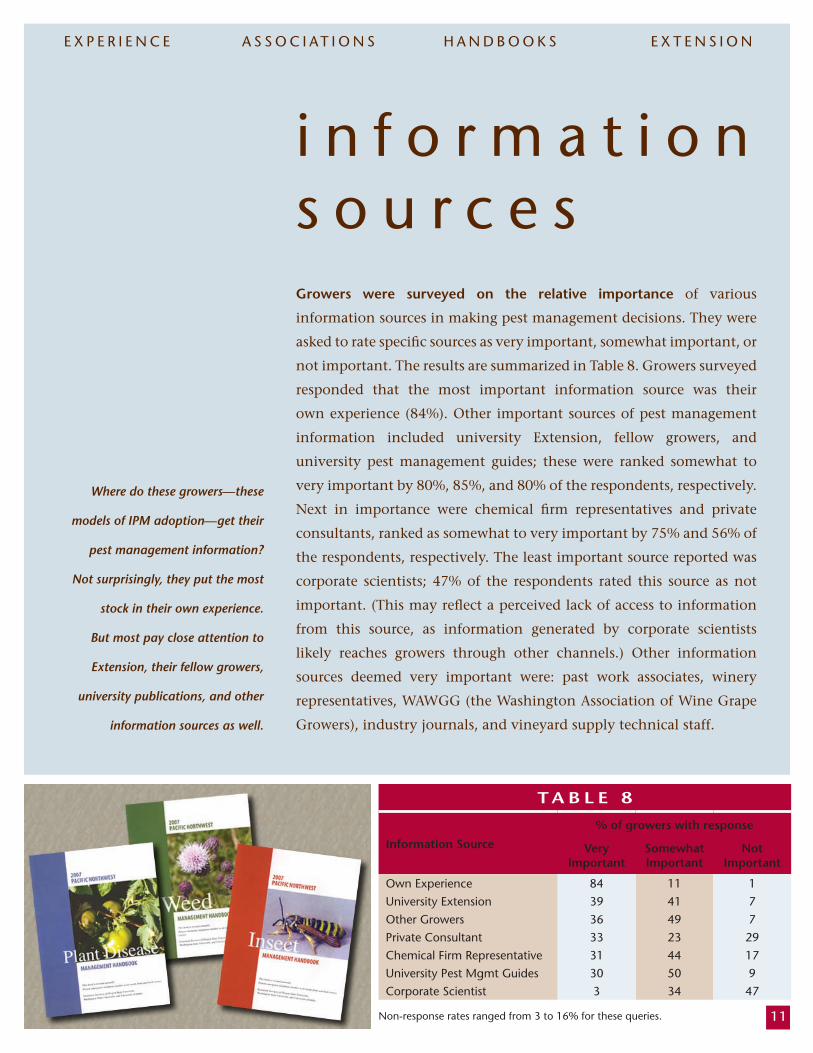
T A B L E 8
Information Source
% of growers with response
VeryImportant
SomewhatImportant
NotImportant
Own Experience 84 11 1
University Extension 39 41 7
Other Growers 36 49 7
Private Consultant 33 23 29
Chemical Firm Representative 31 44 17
University Pest Mgmt Guides 30 50 9
Corporate Scientist 3 34 47
Non-response rates ranged from 3 to 16% for these queries.
i n f o r m a t i o ns o u r c e sGrowers were surveyed on the relative importance of various
information sources in making pest management decisions. They were
asked to rate specific sources as very important, somewhat important, or
not important. The results are summarized in Table 8. Growers surveyed
responded that the most important information source was their
own experience (84%). Other important sources of pest management
information included university Extension, fellow growers, and
university pest management guides; these were ranked somewhat to
very important by 80%, 85%, and 80% of the respondents, respectively.
Next in importance were chemical firm representatives and private
consultants, ranked as somewhat to very important by 75% and 56% of
the respondents, respectively. The least important source reported was
corporate scientists; 47% of the respondents rated this source as not
important. (This may reflect a perceived lack of access to information
from this source, as information generated by corporate scientists
likely reaches growers through other channels.) Other information
sources deemed very important were: past work associates, winery
representatives, WAWGG (the Washington Association of Wine Grape
Growers), industry journals, and vineyard supply technical staff.
Where do these growers—these
models of IPM adoption—get their
pest management information?
Not surprisingly, they put the most
stock in their own experience.
But most pay close attention to
Extension, their fellow growers,
university publications, and other
information sources as well.

12
p e s t i c i d e u s a g e
Washington State grape growers are making fewer
pesticide applications today than in years past. An
overwhelming majority of growers responding to the
2005 survey reported that their use of pesticides on
grapes had either stayed the same (60%) or decreased
(24.3%) over the past five years. A small percentage
of the respondents stated that they did not use
pesticides (4.3%). The remaining growers responding
to this question reported that their pesticide usage
had increased (5.7%). It is worth noting that these
responses are indicative only of the number of pesticide
applications. They do not take into consideration
pesticide application rates (that may have reduced or
increased) nor the fact that some applications are of
newer, reduced-risk alternative pesticides.
Two sections follow. The first details the pesticide
applications reported by survey respondents; it is
organized by crop growth stage. The second section
estimates pesticide use statewide by extrapolation,
using multipliers that reflect reported acreage as a
percentage of overall acreage of that type. The latter
section (p. 21) is organized by pesticide type (i.e.,
insecticide/miticide, herbicide, fungicide).
. . . b y c r o p g r o w t h s t a g eGrowers were asked about their pesticide use in 2005,
including dates applied, application methods, number
of acres treated, spray volume per acre, target pests,
pesticide used, and rate per acre. Summary tables of
all pesticides reported by respondents appear in the
Appendix, pages 31–32. Both treated and base acres
were determined for each pesticide. Treated acres are
the reported data and base acres were calculated by
dividing the number of treated acres by the number
of treatments a block of grapes had received with the
same pesticide.
This section is organized by the various stages of vine
and fruit development as follows: delayed dormant/
bud break (mid-February through April); rapid
shoot growth (May); bloom to veraison (June, July);
and veraison (August, early September). The timing
of these stages is based on the 2005 season in the
WSU foundation block at the Irrigated Agriculture
Research & Extension Center (IAREC) in Prosser.
No pesticide applications were reported during the
harvest (mid-September through October) and post-
harvest/dormant (November through mid-February)
periods. Within each crop stage discussed, pesticide
applications are grouped by target pest.
Pesticide rates in this section generally refer to
amount of formulated product per acre. Percentages
refer to percent base acres treated of all variety acreage
reported. Rates are given when data were available.
13This section summarizes the actual pesticide applications reported by survey respondents.
D E L AY E D D O R M A N T A N D B U D B R E A K P E R I O D Insecticides/miticides employed at this time are intended to control overwintering insect and mite pests coming
out of diapause before they enter the buds and cause damage. Grapevine suckers and winter annual weeds are
common herbicide targets during the early spring. If the spring is unusually wet, treatment for powdery mildew
and other diseases may occur during this time period.
C U T W O R M S
Chlorpyrifos (Lorsban®) Two growers reported using
Lorsban® at 1.5 pints per acre (pts/A). Thirty-five acres
of wine grapes (<1%) were treated prior to bud break.
Fenpropathrin (Danitol®) A barrier spray (i.e., spray
directed at the base of the vine and trellis where they
touch the soil) of fenpropathrin was applied to 3,344.1
wine grape acres (53%) to prevent cutworms from
climbing to feed on buds. The average application
rate was 10 fluid ounces per acre (fl oz/A).
Petroleum oil (Superior Spray Oil®) Superior Oil was
applied to 31.5 wine grape acres (<1%) by one grower
at a 1% rate.
L E A F H O P P E R S
Dimethoate (unspecified formulation) One juice grape
grower with 75 acres (2%) used dimethoate at 1 pt/A.
G R A P E V I N E S U C K E R S
Paraquat (Gramoxone®) A total of 33.69 wine grape
acres (<1%) was treated with a band application of
Gramoxone® at 1.7 pts/A.
W E E D S
Carfentrazone-ethyl (Aim®) A few acres of wine grapes
(12.8 acres, <1%) were sprayed with Aim® at 1.15
ounces per acre (oz/A).
Glyphosate (Roundup®, others) Juice grapes (1,427.4
base acres or 36%) and wine grapes (2,495.8 base acres
or 40%) were treated with glyphosate, primarily to
control winter annuals (one grower reported using this
chemical to kill a cover crop). Allowing for multiple
applications, 1,429.4 juice grape acres and 3,338.2
wine grape acres were treated with glyphosate. While
1.27 quarts per acre (qts/A) was the rate on juice
grapes, 1.9 qts/A was the average rate on wine grapes.
During this crop period, one Concord grape grower
sprayed twice, while the other 8 sprayed only once;
likewise 3 out of 14 wine grape growers sprayed twice,
making the average number of applications 1.1 and
1.15, respectively.
Norflurazon (Solicam®) Concord grapes (953 acres or
24%) and wine grapes (2.7 acres or <1%) were treated
with Solicam® at 1 to 2 pounds per acre (lbs/A).
Oryzalin (Surflan®) A small number of wine grape
(19.6 or <1%) and Concord grape (180 or 5%) acres
were treated with Surflan®. The average rate on wine
grapes was 3.4 qts/A and on Concords, 1.2 qts/A.
Oxyfluorfen (Goal®) Goal® was applied to weeds on
94.94 acres or 2% of wine grapes during this early
spring period.
Paraquat (Gramoxone Max®, Gramoxone Inteon®)
Less than 1% of wine grapes (20.18 acres) and Concord
grapes (2 acres) were treated with a Gramoxone®
product at this time, at an average rate of 2.8 pts/A on
wine grapes and 2.2 pts/A on Concord grapes.
14
Simazine (unspecified formulation) Applications of
Simazine occurred only during this early spring time
period. There were 85.3 (1%) wine grape acres and
953 (24%) Concord grape acres treated at an average
rate of 2 qts/A and 0.4 qt/A, respectively.
2,4-D One application of 2,4-D was performed at a
rate of 1.5 lbs/A on 3.6 wine grape acres (<1%). This
was the only 2,4-D application reported. Wine grapes
are very sensitive to 2,4-D, so growers are inclined
to choose other products for weed control in the
vineyards.
P O W D E R Y M I L D E W
Fenarimol (Rubigan®) A few acres (10, <1%) of wine
grapes were sprayed twice with Rubigan® during this
time. A low rate (2 fl oz/A) was used.
Kresoxim-methyl (Sovran®) A few acres (25, <1%) of
wine grapes were treated with Sovran®. A low rate of
4 oz/A was used.
Quinoxyfen (Quintec®) Only five wine grape acres
were treated with Quintec® this time of year at a rate
of 4 oz/A.
Paraffinic oils (JMS Stylet Oil®, others) Both regular
JMS Stylet Oil® and organic JMS Stylet Oil® were applied
during the early spring period. A total of 1,144.5 wine
grape acres (18%) were treated 1.5 times with JMS
Stylet Oil® at a 1.6% rate. One grower reported using
organic JMS Stylet Oil® on 114.9 wine grape acres (2%)
1.2 times, using a 1% rate. In addition, an unspecified
paraffinic oil was applied to a small block of 14 wine
grape acres at a rate of 1.5%.
Sulfur products (Microthiol®, lime sulfur, Kumulus®,
sulfur dust, others) Applications of all solid sulfur
formulations were grouped together for analysis; liquid
lime sulfur applications were analyzed separately.
During the early spring period, 929.2 wine grape
acres (15%) were treated with wettable sulfur or sulfur
dust. Some blocks were treated more than once for an
average of 1.03 applications at rates ranging from 4.3
lbs/A (92-98% products) to 5.7 lbs/A (80% products).
Lime sulfur solution was used by two of the reporting
growers on 16 wine grape acres (<1%).
Tebuconazole (Elite®) One block of 31.5 wine grape
acres (<1%) was sprayed with Elite® at 4 oz/A.
U N S P E C I F I E D T A R G E T
Metam-sodium (Vapam®) Two wine grape acres (<1%)
were fumigated with Vapam® during this early spring
period at a rate of 50 gallons per acre (gal/A). The
target was unspecified.

15
T H R I P S , L E A F H O P P E R S , M E A L Y B U G S
Carbaryl (Sevin®) Only five wine grape acres (<1%)
were sprayed with carbaryl at an unspecified rate to
control thrips.
Dimethoate (unspecified formulation) Two juice
grape growers with 332 acres (8%) and two wine
grape growers with 54.5 acres (<1%) reported using
dimethoate at 0.8 to 1 pt/A to control leafhoppers
and thrips. Of the wine grape acreage, 31.5 acres were
treated twice.
Fenpropathrin (Danitol®) A foliar spray of 5.5 fl
oz/A fenpropathrin was applied to 26 wine grape acres
(<1%) to control thrips.
Imidacloprid (Admire®) This insecticide is generally
applied via chemigation to control mealybugs and
leafhoppers. Three growers had mealybugs to control
on 110 wine grape acres (2%) and an average rate of 1
pt/A was used.
Imidacloprid (Provado®) This formulation is applied
as a foliar spray to control mealybugs and leafhoppers.
At this crop stage, 171 wine grape acres (3%) were
sprayed at an average rate of 0.6 oz/A.
Spinosad (Success®) One grower used Success® on 193
acres (3%) of wine grapes at 6 oz/A to control thrips.
G R A P E V I N E S U C K E R S
Carfentrazone-ethyl (Aim®) A few blocks of wine
grapes (141.5 acres, 2%) were sprayed with the
herbicide Aim® specifically for sucker control. The
rate per acre was generally 0.1 oz.
Paraquat (Gramoxone®) Gramoxone® was used at 2.1
pts/A in a band application on 101.68 acres (2%).
Oxyfluorfen (Goal®) Goal® was applied to 86.5 acres
(1%) of wine grapes at a low average rate of 0.7 pt/A.
W E E D S
Carfentrazone-ethyl (Aim®) A small block of Concord
grapes (17 acres, <1%), and a few blocks of wine grapes
(346 acres, 6%) were sprayed with Aim® at 0.1 oz/A or
with Aim® EW at 1 fl oz/A. Some blocks were treated
more than once in a band application.
Diuron (unspecified formulation) Diuron use was
reported only during the rapid shoot growth period.
Fewer than 1% of Concord grape acres (17) were
treated, at a rate of 2 lbs/A.
Glyphosate (Roundup®, others) Juice grapes (268.5
acres or 7%) and wine grapes (363.6 acres or 6%) were
treated with glyphosate at average rates of 1.3 qts/A
for Concord grapes and 1.9 qts/A for wine grapes.
R A P I D S H O O T G R O W T H P E R I O D Pesticides are employed at this late springtime period to control early insect pests (thrips, leafhoppers, mealybugs),
grapevine suckers, perennial and winter annual weeds, and diseases (powdery mildew, Botrytis bunch rot).

16
Norflurazon (Solicam®) Fewer than 1% of Concord
grape acres (17) were treated with the herbicide
Solicam®, at a rate of 2.5 lbs/A.
Oryzalin (Surflan®) Nine wine grape acres (<1%) were
treated with Surflan® at an average rate of 5 qts/A.
Paraquat (Gramoxone®) Commonly used during this
late spring period in wine grapes (966.15 base treated
acres or 15%), Gramoxone® was applied at an average
rate of 2.5 pts/A. A few blocks of wine grapes were
sprayed twice. Fewer than 1% of Concord grapes were
also sprayed (8.8 acres) at 2.2 pts/A.
Sethoxydim (Poast®) The herbicide Poast® was utilized
on a few Concord grape acres (6.8 or <1%). The rate
used was 1.25 pts/A.
P O W D E R Y M I L D E W, B O T R Y T I S B U N C H R O T
Boscalid + pyraclostrobin (Pristine®) Not a widely
known fungicide, Pristine® was applied only to two
acres, two times, to control both powdery mildew and
Botrytis bunch rot. The rate was low, 9.2 oz/A.
Fenarimol (Rubigan®) A large percentage of wine
grape acres (3,172.95 or 51%) was sprayed with
Rubigan® an average of 1.2 times during late spring.
On the average, a moderate rate (3.4 fl oz/A) was used.
This product is popular more for its low cost than its
superior efficacy.
Myclobutanil (Rally®) Wine grapes (86.5 acres or 1%)
were treated with Rally® during the late spring at an
average rate of 4.5 oz/A.
Potassium bicarbonate products (Kaligreen®) A few
wine grape acres (3.25 or <1%) were treated with
Kaligreen® with two acres sprayed twice during May.
The rate was 2.3 lbs/A.
Quinoxyfen (Quintec®) Only two wine grape acres
(<1%) were treated with Quintec® this time of year at
the maximum rate of 6.6 fl oz/A.
Paraffinic oils (JMS Stylet Oil®, others) Both regular JMS
Stylet Oil® and organic JMS Stylet Oil® were applied
during the late spring period. There were 2,837.2 wine
grape acres (45%) treated 1.3 times with JMS Stylet
Oil® at a 1.6% dilution. One grower reported using
organic JMS Stylet Oil® on 602.01 wine grape acres
(10%), 1.5 times, at a 0.9% dilution rate. In addition,
Omni® oil was applied to 130.89 wine grape acres
(2%), 1.7 times, at a 0.9% dilution rate.
Sulfur products (Microthiol®, Kumulus®, others)
During the late spring period, 1,142.84 wine grape
acres (18%) were treated with micronized wettable
sulfur products. Some blocks were treated more than
once; an average of 1.8 applications were made during
this period at a rate of 3.9 lbs/A.
Trifloxystrobin (Flint®) One quarter of the reported
wine grape acres were sprayed with Flint® during late
spring (1,555.51 or 25%), and a few acres were sprayed
more than once. The average rate was 2 oz/A.
Triflumizole (Procure®) Procure® was used on 1,723.9
acres of wine grapes (27%) in late spring. The average
rate was 4.3 oz/A. Fourteen acres were sprayed twice.
This section details the actual pesticide applications reported
by survey respondents; it is organized by crop growth stage:
delayed dormant/bud break, p. 13; rapid shoot growth, p. 15;
bloom to veraison, p. 17; and veraison, p. 20.
The section beginning on p. 21 estimates pesticide use
statewide by extrapolation of survey data by grape type. The
statewide estimate section is organized by pesticide type (i.e.,
insecticide/miticide, herbicide, fungicide).

17
S P I D E R M I T E S
Bifenazate (Acramite®) A total of 420.96 wine grape
acres (7%) were treated with Acramite® during the
summer at a rate of 0.76 lbs product/A.
Fenpyroximate (FujiMite®) Fourteen wine grape acres
(<1%) were treated with Fujimite® during the summer
at a rate of 1 qt/A.
Potassium laurate (M-Pede®) A single grower treated
eight wine grape acres (<1%) with M-Pede® with two
targets: spider mites and powdery mildew. The rate
was 1%. More acres were treated with M-Pede® for
powdery mildew alone, and this use is reported on
the next page, under the heading “Powdery Mildew/
Botrytis Bunch Rot.”
Propargite (Omite®) One wine grape grower with
33.01 acres (<1%) used Omite® at a rate of 5.6 lbs/A.
T H R I P S , L E A F H O P P E R S , M E A L Y B U G S
Acetamiprid (Assail®) A total of 96.5 wine grape acres
(2%) was treated with Assail® to control leafhoppers.
The average rate was low at 0.8 oz/A.
Azadirachtin (Aza-Direct®) One wine grape grower
used Aza-Direct® to control leafhoppers on 406.83
acres (6%) at an average rate of 1.7 pts/A. An average
of 1.3 applications was made to this acreage during
the summer.
Buprofezin (Applaud®) Two wine grape growers
utilized Applaud® (138.68 acres or 2%) to control
leafhoppers and mealybugs at a rate of 11 oz/A.
B L O O M T O V E R A I S O N P E R I O D These pesticide applications were implemented during the period beginning just before bloom and continuing
through fruit development to veraison (i.e., ripening). Generally, these sprays occurred during June and July, with
some occurring in early August. Summertime was when the greatest pesticide use occurred. Common targets were
spider mites, leafhoppers, mealybugs, thrips, weeds, powdery mildew, and Botrytis bunch rot.
Carbaryl (Sevin®) A total of 58.13 base wine grape
acres (1%) were sprayed with carbaryl to control
leafhoppers at 1.25 qts/A. Four acres were sprayed
twice during the summer.
Dimethoate (unspecified formulation) One wine
grape grower with 3.6 acres (<1%) reported using
dimethoate at 1 pt/A to control leafhoppers.
Dinotefuran (Venom®) A few wine grape acres (31.5
or <1%) were sprayed with this new insecticide to
control unspecified insects. The rate was 1.1 lb/A.
Fenpropathrin (Danitol®) A foliar spray of 5.6 fl oz/A
was applied to 26 wine grape acres (<1%) to control
leafhoppers.
Imidacloprid (Admire®) This insecticide is generally
applied via chemigation to control mealybugs and
leafhoppers. Three growers had mealybugs to control
on 77.58 wine grape acres (1%) and used a low rate of
8.3 oz/A.
Imidacloprid (Provado®) This formulation of
imidacloprid is applied as a foliar spray. Most
commonly, leafhoppers were the target, though
mealybugs, thrips, and flea beetles were targeted by
some growers. There were 1,727.52 wine grape acres
(32%) treated at an average rate of 0.8 oz/A. Some
acres (32.25) were treated twice. There were 156 juice
grape acres (4%) sprayed with Provado® at a rate of
0.5 oz/A.
Spinosad (Success®) A few wine grape acres (8.68 or
<1%) were sprayed with 7.4 oz/A of Success® against
an unspecified target insect.

18
G R A P E V I N E S U C K E R S
Carfentrazone-ethyl (Aim®): A few blocks of wine
grapes (108 acres or 2%) were sprayed with the
herbicide Aim® to control suckers. The rate per acre
was either 0.1 oz of Aim® or 1 oz of Aim® EW.
Oxyfluorfen (Goal®) Goal® was applied to a few wine
grapevines during the summer to control suckers. A
total of 53 acres (<1%) received Goal® at a low average
rate of 0.8 pt/A.
Paraquat (Gramoxone®) Gramoxone® was applied to
suckers in 55 acres of wine grapes (<1%) at a rate of
2 pts/A.
W E E D S
Carfentrazone-ethyl (Aim®) A small block of Concord
grapes (20.5 acres or <1%) and several blocks of wine
grapes (325.9 acres or 5%) were sprayed with the
herbicide Aim®. The rate per acre was either 0.1 oz of
Aim® or 1 oz of Aim® EW and 5.85 wine grape acres
were treated twice.
Glyphosate (Roundup®, others) Concord grapes (1,376
acres or 35%) and wine grapes (440.28 or 7%) were
treated with glyphosate. The Concord grape acreage
was sprayed an average 1.5 times and the wine grapes
an average 1.03 times. An average rate of 1.6 qts/A
for Concord grapes and 1.8 qts/A for wine grapes
was used.
Oryzalin (Surflan®) Two Concord grape acres (<1%)
were treated with Surflan® at a rate of 1.9 qts/A.
Paraquat (Gramoxone®) Gramoxone® was sprayed in
wine grapes (1,139.8 base treated acres or 18%) at an
average rate of 1.8 pts/A. There were 1.3 applications
made in this wine grape acreage. Concord grapes were
sprayed as well (287.3 acres or 7%), at 2 pts/A.
Sethoxydim (Poast®) The herbicide Poast® was utilized
on a few Concord grape acres (6.8 or <1%) at 1 pt/A.
P O W D E R Y M I L D E W, B O T R Y T I S B U N C H R O T
Azoxystrobin (Abound®) One wine grape grower used
Abound® on 25.08 acres at a rate of 11.8 fl oz/A.
Bacillus subtilis (Serenade®) This biopesticide was
sprayed on 8.65 wine grape acres at or near the
maximum rate. Of this acreage, 2.5 acres were sprayed
twice more. The primary target was powdery mildew,
although one grower targeted bunch rot as well.
Boscalid + pyraclostrobin (Pristine®) Pristine® was
applied to 483.2 wine grape acres (8%) an average 1.4
times to control both powdery mildew and Botrytis
bunch rot. The rate was low, at 9.4 oz/A.

Summertime—bloom through veraison—is when the greatest amount of pesticide use occurs.19
Cyprodinil (Vangard®) Vangard® was only used during
the summertime on 254.78 wine grape acres (4%) at
an average rate of 9.1 oz/A. Six acres were treated twice
with Vangard®.
Fenarimol (Rubigan®) Eight percent of wine grape
acres (471.68) were sprayed with Rubigan® an average
of 1.7 times during the summer. On the average, a
moderate rate (4.1 fl. oz/A) was used.
Fenhexamid (Elevate®) Elevate® was only used during
the summertime on 221.21 wine grape acres (4%); 21
of those acres were treated twice.
Kresoxim-methyl (Sovran®) There were 821.6 wine
grape acres (13%) treated with Sovran® during the
summer at a rate of 5.2 oz/A.
Myclobutanil (Rally®) Four percent of wine grape acres
(235.08) were treated with Rally® an average of 1.4
times at a rate of 4.5 oz/A during the summertime
bloom through veraison period.
Paraffinic oils (JMS Stylet Oil®, others) Both regular
JMS Stylet Oil® and organic JMS Stylet Oil® were
applied during the summertime. A total of 930.58 wine
grape acres (15%) were treated an average two times
with JMS Stylet Oil® at a 1.3% dilution. One grower
reported using organic JMS Stylet Oil® on 667.17 wine
grape acres (11%), 1.2 times, at a 1.1% dilution rate.
In addition, Omni® Oil was applied to 56 wine grape
acres (<1%), at a 1% dilution rate.
Potassium bicarbonate products (Kaligreen®,
Milstop®) A few wine grape acres were treated with
Kaligreen® or Milstop® (121.72 or 2%). An average of
2.2 applications were made during the summer and
the rate was 3 lbs/A.
Potassium laurate (M-Pede®) Of the 49.75 wine grape
acres (<1%) treated with M-Pede® at the maximum
labeled rate, 40 acres were treated twice.
Pyrimethanil (Scala®) Scala® was applied only during
the summertime on 42.5 wine grape acres, with four
acres treated twice.
Quinoxyfen (Quintec®) The greatest number of
Quintec® applications occurred during the summer-
time. A total of 2,603.89 wine grape acres (42%) were
treated with an average of 4.5 fl oz/A. There were
26.42 acres sprayed twice.
Sulfur products (Microthiol®, Kumulus®, others)
During the summertime, 970.85 wine grape acres
(15%) were treated with micronized wettable sulfur
products. Some blocks were treated more than once;
there were approximately 2.3 applications made at a
rate of 3.3 lbs/A.
Tebuconazole (Elite®) Sixty-two acres of wine
grapes (<1%) were treated with Elite® during the
summertime.
Triadimefon (Bayleton®) A few wine grape acres (5.88
or <1%) were treated with Bayleton® at 4.1 oz/A.
Trifloxystrobin (Flint®) Nearly 3,000 of the reported
wine grape acres were sprayed with Flint® during the
summer (2,833.02 or 45%), with some acreage sprayed
more than once. The average rate was 2 oz/A.
Triflumizole (Procure®) Procure® was used an average
of 1.4 times during the summer on 1,369.66 base acres
(22%) of wine grapes. The average rate was 6.1 oz/A.
M I T E S & T H R I P S G R A S S W E E D S V I N E S U C K E R S M I L D E W & R O T

20
L E A F H O P P E R S
Imidacloprid (Provado®) Growers
used Provado® on 5.5 wine grape
acres (<1%) at a rate of 0.75 oz/A
during the veraison period. This
formulation of imidacloprid is
applied as a foliar spray.
W E E D S
Glyphosate (Roundup®, others) A
few Concord grape acres (8 or <1%)
and a few wine grape acres (8 or
<1%) were treated with glyphosate
during the early fall prior to harvest
at an average rate of 1.2 qts/A for
Concord grapes and an unspecified
rate for wine grapes.
P O W D E R Y M I L D E W, B O T R Y T I S B U N C H R O T
Bacillus subtilis (Serenade®) This biopesticide was sprayed on 60.27
wine grape acres at the maximum labeled rate. Serenade® can be
applied to fruit up to and including the day of harvest.
Fenarimol (Rubigan®) Ten wine grape acres (<1%) were sprayed with
Rubigan® at a low (2 fl oz/A) rate.
Potassium bicarbonate products (Kaligreen®) Three wine grape acres
were treated with Kaligreen® (<1%) at 3 lbs/A just prior to harvest.
Sulfur products (Microthiol®, Kumulus®, others) Three wine grape
acres were treated with micronized sulfur during veraison at 3 lbs/A.
Thiophanate-methyl (Topsin®) This is the only time period in which
Topsin® was used. Twelve wine grape acres were treated at 1 lb/A.
Triflumizole (Procure®) Seven acres were reported to be treated with
Procure® at 8 oz/A.
V E R A I S O N P E R I O D Veraison is defined as when the grape berries begin to ripen and change in color, consistency, volume, weight, and
sugar content. In most grape-growing regions of Washington, veraison typically begins in early- to mid-August. Very
few pesticide applications were performed during this time because of the imminence of harvest.
21
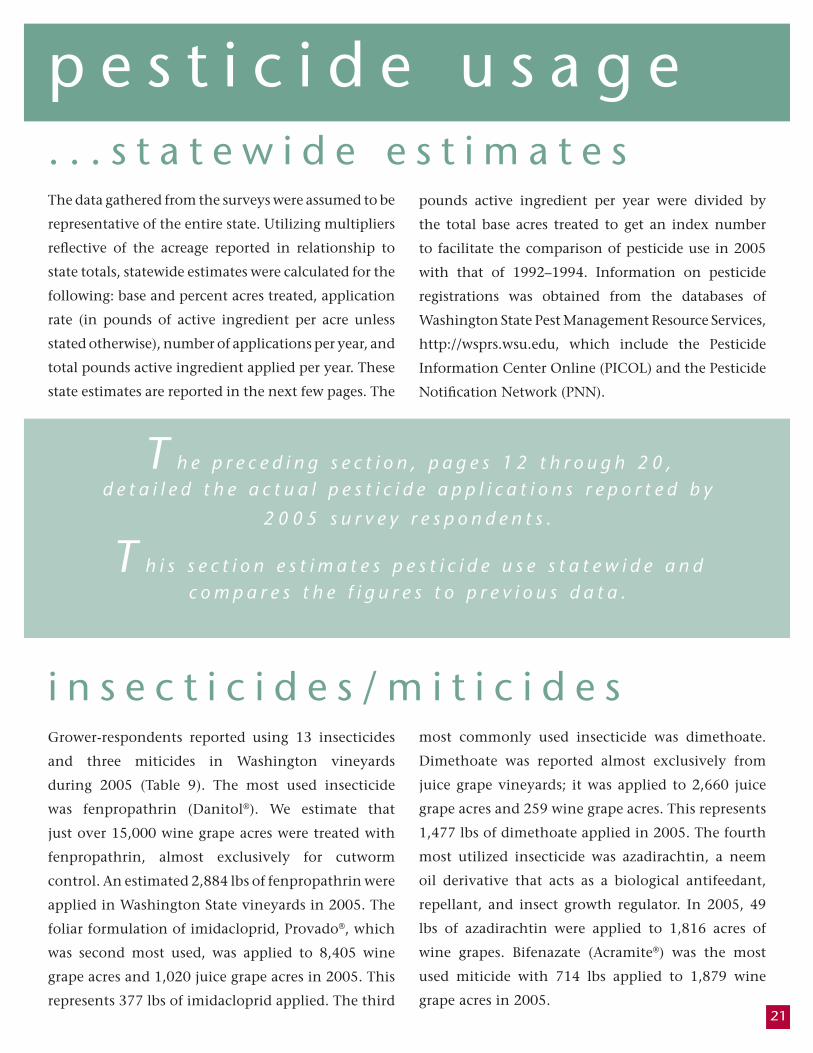
The data gathered from the surveys were assumed to be
representative of the entire state. Utilizing multipliers
reflective of the acreage reported in relationship to
state totals, statewide estimates were calculated for the
following: base and percent acres treated, application
rate (in pounds of active ingredient per acre unless
stated otherwise), number of applications per year, and
total pounds active ingredient applied per year. These
state estimates are reported in the next few pages. The
p e s t i c i d e u s a g e
. . . s t a t e w i d e e s t i m a t e spounds active ingredient per year were divided by
the total base acres treated to get an index number
to facilitate the comparison of pesticide use in 2005
with that of 1992–1994. Information on pesticide
registrations was obtained from the databases of
Washington State Pest Management Resource Services,
http://wsprs.wsu.edu, which include the Pesticide
Information Center Online (PICOL) and the Pesticide
Notification Network (PNN).
Grower-respondents reported using 13 insecticides
and three miticides in Washington vineyards
during 2005 (Table 9). The most used insecticide
was fenpropathrin (Danitol®). We estimate that
just over 15,000 wine grape acres were treated with
fenpropathrin, almost exclusively for cutworm
control. An estimated 2,884 lbs of fenpropathrin were
applied in Washington State vineyards in 2005. The
foliar formulation of imidacloprid, Provado®, which
was second most used, was applied to 8,405 wine
grape acres and 1,020 juice grape acres in 2005. This
represents 377 lbs of imidacloprid applied. The third
i n s e c t i c i d e s / m i t i c i d e smost commonly used insecticide was dimethoate.
Dimethoate was reported almost exclusively from
juice grape vineyards; it was applied to 2,660 juice
grape acres and 259 wine grape acres. This represents
1,477 lbs of dimethoate applied in 2005. The fourth
most utilized insecticide was azadirachtin, a neem
oil derivative that acts as a biological antifeedant,
repellant, and insect growth regulator. In 2005, 49
lbs of azadirachtin were applied to 1,816 acres of
wine grapes. Bifenazate (Acramite®) was the most
used miticide with 714 lbs applied to 1,879 wine
grape acres in 2005.
T h e p r e c e d i n g s e c t i o n , p a g e s 1 2 t h r o u g h 2 0 , d e t a i l e d t h e a c t u a l p e s t i c i d e a p p l i c a t i o n s r e p o r t e d b y
2 0 0 5 s u r v e y r e s p o n d e n t s .
T h i s s e c t i o n e s t i m a t e s p e s t i c i d e u s e s t a t e w i d e a n d c o m p a r e s t h e f i g u r e s t o p r e v i o u s d a t a .

22
These state estimates document a significant improve-
ment when compared to pesticide use reports from
1992–1994. The extensively used insecticides in
1992–1994 in order of acres treated were dimethoate,
chlorpyrifos, carbaryl, and endosulfan. The use of
dimethoate in Washington State vineyards dropped
dramatically after the registrant voluntarily cancelled
the registration on grapes in July 2005 due to risk cup
issues recognized in the course of implementing the
1996 Food Quality Protection Act. Chlorpyrifos use
plummeted to less than 1% of acreage by 2005 because
most growers had switched to using fenpropathrin
in a low-volume targeted band application for con-
trol of climbing cutworms in the spring. Chlorpyrifos
and dimethoate use for mealybugs in 1992-1994 was
replaced by chemigation with imidacloprid or foliar
sprays of buprofezin. Carbaryl use declined as growers
chose more effective alternatives to control insects.
No respondent reported using endosulfan in 2005.
The shift in type and amount of insecticides and miti-
cides over the last decade is nothing short of remark-
able. It represents a wholesale switch by the industry
away from broad-spectrum organophosphate, carba-
mate, or organochlorine insecticides to new alterna-
tive and/or reduced-risk, pest-specific chemistries.
T A B L E 9
Insecticide/Miticide
Variety
State Estimates 2005 State Estimates Averaged 1992-1994*Base acres
treated (% total)
Avg rate (lb ai/acre)
Apps/yr
Total lb ai/yr
Base acres treated
(% total)
Avg rate(lb ai/acre)
Apps/yr
Total lb ai/yr
fenpropathrin(Danitol®)
wine 15,045 (54) 0.17 1.1 2,884 not registered
imidacloprid(Provado®)
wine 8,405 (30) 0.04 1.1 353no data
juice 1,020 (4) 0.02 1.0 24
dimethoate(various)
wine 259 (<1) 0.43 1.3 147 4,833 (38) 1.30 1.0 6,283
juice 2,660 (10) 0.50 1.0 1,330 329 (1) 1.30 1.0 428
bifenazate(Acramite®)
wine 1,879 (7) 0.38 1.0 714 not registered
azadirachtin(Aza-Direct®)
wine 1,816 (6) 0.02 1.3 49 no data
spinosad(Success®)
wine 900 (3) 0.10 1.0 94 not registered
buprofezin(Applaud®)
wine 619 (2) 0.48 1.0 298 not registered
imidacloprid(Admire®)
wine 525 (2) 0.19 1.5 149 not registered
acetamiprid(Assail®)
wine 431 (1.5) 0.04 1.0 15 not registered
carbaryl (Sevin®)
wine 282 (1) 1.25 1.3 440 1,660 (13) 2.00 1.0 3,320
juice no data 113 (<1) 2.00 1.0 226
chlorpyrifos(Lorsban®)
wine 156 (<1) 0.75 1.0 117 1,314 (10) 1.00 1.0 1,314
juice no data 1,073 (5) 1.00 1.0 1,073
Other† wine 527 (2) not applicable 762 (6) no data
juice no data 875 (4) no data
Other from 1994§
wine not applicable 2,694 (21) varied varied 3,446
juice not applicable 625 (3) varied varied 600
* From Morrell and Schreiber, 1998. † Fewer than 150 acres statewide. 2005 figures include applications of propargite (Omite®), petroleum oil (Superior Oil®), dinotefuran (Venom®), fenpyroximate (FujiMite®), and potassium laurate (M-Pede®). The 1994 figures include petroleum oil, potassium laurate, and propargite only.
§ Includes endosulfan, diazinon, malathion-methoxychlor, malathion, azinphos-methyl, methomyl, BT, vegetable oil, pyrethrins, carbofuran.

T A B L E 1 0
Herbicide Variety
State Estimates 2005 State Estimates Averaged 1992-1994*
Base acres treated
(% total)
Avg rate(lb ai/acre)
Apps/year
Total lb ai/year
Base acres treated
(% total)
Avg rate(lb ai/acre)
Apps/year
Total lb ai/year
glyphosate (Glyfos®, Roundup®, others)†
wine 12,321 (44) 1.50 1.37 25,442 6,949 (54) 1.00 1.40 9,729
juice 11,564 (44) 1.07 1.96 24,230 10,991 (50) 1.00 1.20 13,189
paraquat(Gramoxone®)§
wine 5,576 (20) 0.84 1.59 7,414 3,207 (25) 1.25 1.00 4,009
juice 1,891 (7) 0.79 1.29 1,911 2,761 (13) 1.25 1.10 3,796
simazine (various)wine 348 (1) 2.03 1.05 741 2,163 (17) 2.00 1.00 4,326
juice 6,229 (24) 0.40 1.00 2,492 3,443 (16) 2.00 1.00 6,886
norflurazon (Solicam®)
wine 12 (<1) 0.79 1.00 9 368 (3) 2.36 1.00 868
juice 6,340 (24) 1.77 1.00 11,212 2,443 (11) 2.36 1.00 5,765
carfentrazone-ethyl(Aim/Aim EW®)
wine 2,525 (9) 0.01 1.82 37not registered
juice 245 (1) 0.02 1.00 5
oxyfluorfen (Goal®)wine 1,047 (4) 0.29 1.01 305 2,368 (18) 2.00 1.00 4,736
juice not registered 2,111 (10) 2.00 1.00 4,222
oryzalin (Surflan®)wine 119 (<1) 3.92 1.20 558 2,157 (17) 2.00 1.00 4,314
juice 1,190 (5) 1.54 1.00 1,829 6,023 (27) 2.00 1.00 12,046
glufosinate (Rely®) wine 96 (<1) 0.41 1.00 40 no data
diuronwine no data 20 (<1) 2.40 1.00 48
juice 111 (<1) 1.60 1.00 178 1,934 (9) 2.40 1.00 4,642
sethoxydim (Poast®) juice 44 (<1) 0.21 2.00 19 9 (<1) n.d. 1.00 n.d.
2,4-D (various)†wine 16 (<1) 1.35 1.00 22 53 (<1) n.d. 1.00 n.d.
juice no data 675 (3) n.d. 1.00 n.d.
Other from 1994wine not applicable 124 (1) varied 1.00 241
juice not applicable 1,687 (8) varied 1.00 3,254
* From Morrell and Schreiber, 1998. † Acid equivalent used for active ingredient calculations. § Cation equivalent used for active ingredient calculations.23
Applications of eleven herbicides were reported
by grape growers in 2005 (Table 10). The most
used herbicide in the 2005 survey was glyphosate
(Roundup® and others); it is estimated that 12,321
wine grape acres and 11,564 juice grape acres received
one to three applications, resulting in approximately
25,442 lbs of glyphosate applied to wine grapes and
24,230 lbs applied to juice grapes. The second most
used herbicide was paraquat, a restricted-use product
applied to 5,576 acres of wine grapes and 1,891 acres
of juice grapes. In total we estimate that 9,325 lbs of
paraquat was applied in 2005. Two pre-emergence
herbicides, simazine and norflurazon, were applied
extensively in juice grape vineyards. A total of 6,229
acres were treated with 2,492 lbs of simazine and 6,340
acres were treated with 11,212 lbs of norflurazon.
Much less prevalent in wine grape vineyards, 741
lbs of simazine were applied to 348 acres and 9 lbs
norflurazon to 12 acres. We estimate that 2,770 grape
acres were treated with 41 lbs of carfentrazone-ethyl
in various formulations of the product Aim® in 2005.
In contrast to the insecticides/miticides, most of
the major herbicides that were registered for use on
grapes in 2005 were also registered in 1992-1994. The
earlier survey found glyphosate to be the most applied
herbicide, with oryzalin in second place, followed by
paraquat, simazine, oxyfluorfen, and norflurazon.
While use of oryzalin, simazine, oxyfluorfen, and
diuron decreased considerably in 11 years, use of
h e r b i c i d e s

24
glyphosate and norflurazon has increased. It should
be pointed out that only three growers—one wine
grape grower and two juice grape growers—reported
using norflurazon in 2005, so while the quantity in lbs
increased, this chemical was not widely used among
grape growers. The same level of paraquat usage was
reported for both survey time periods.
The increase in glyphosate could be attributed to
several factors. First, the patent held by the original
registrant termed, leading to the market introduction
of substantially less expensive generic glyphosate
products. Second, glyphosate is safer for applicators
to apply than some other registered herbicides; even
carrying reduced-risk status for numerous specialty
crop fruits and vegetables. Third, soil-active herbicides
such as diuron, simazine, and norflurazon can damage
grapevine roots and cause injury or death to vines
by leaching into the vine’s root zone if not properly
selected and applied for the vineyard conditions.
Oryzalin is a less hazardous soil-active herbicide but it
is not effective against certain mustard and nightshade
weed species. Oxyfluorfen is an effective and versatile
herbicide, but it is very expensive compared to
alternatives that are commercially available.
Based on survey responses, the use of paraquat
remained steady from 1994 to 2005. However, it is
expected that use of this acutely toxic, restricted-use
herbicide will decline in the coming years as more
growers choose newer, less hazardous compounds to
control weeds and grapevine suckers. For example,
an estimated 604 acres were treated with paraquat for
sucker control in 2005. The registration of the reduced-
risk carfentrazone-ethyl (Aim®) along with the full
registration of oxyfluorfen (Goal 2XL®) for sucker
control both occurred in 2005, providing growers with
two alternatives to paraquat for sucker suppression.
A fourth compound, glufosinate-ammonium (Rely®),
is also registered for sucker control, but very little
use of Rely® was reported during 2005 and none was
reported during 1992–1994.
f u n g i c i d e sFungicide use was reported on wine grapes only
(Table 11). Most of the pesticide inputs to vineyards
in Washington were fungicidal because the most
important manageable pest of wine grapes is powdery
mildew. Mildew management requires a rigorous
season-long management program. WSU scientists
have developed control programs that include
fungicide rotation to delay the onset of fungicide
resistance. Most but not all fungicides applied to
control powdery mildew can provide bunch rot
suppression as well.
The number one product applied to Washington wine
grape vineyards in 2005, both in terms of base acres
treated and lbs applied, was paraffinic oil. Several
paraffinic oil products were reported; applications of
all are combined in our summary data. An estimated
20,931 base acres were treated with a total 250,917 lbs
paraffinic oil. The second most used active ingredient
was trifloxystrobin (Flint®), with 19,592 acres treated
and 1,255 lbs applied. Fenarimol (Rubigan®) was
third, with 15,078 acres treated and 805 lbs applied.
Sulfur products (including micronized, wettable, dust,
and water-dispersible granule formulations) could be
considered in fourth place based on pounds of active
ingredient applied in 2005. The number of acres
treated with sulfur products, quinoxyfen (Quintec®),
and triflumizole (Procure®) was fairly similar (11,675;
11,633; and 11,230; respectively), although naturally
the pounds of sulfur applied far outweighed that of
quinoxyfen and triflumizole. Fourteen other fungicides
were reported, used on less than 15% of the acreage.

25
Currently, the options for powdery mildew and bunch
rot control are many and diverse as shown by the 2005
survey data, but this was not the case during 1992–
1994. Five fungicides were used on wine grapes during
this earlier survey period. In order of base acres treated,
these fungicides were fenarimol, sulfur, myclobutanil,
triadimefon, and iprodione. Growers currently have
more efficacious choices than iprodione for bunch rot
management in wine grapes and its use has all but
disappeared. The largest fungicidal input during 1992–
1994 in terms of lbs active ingredient applied per year
was sulfur. There are several disadvantages to using
sulfur: multiple applications at closely timed intervals
are needed in high mildew-pressure situations, it can
be phytotoxic at high temperatures and ineffective at
low temperatures, it can be hazardous to applicators,
T A B L E 1 1
Fungicide
State Estimates 2005 State Estimates Averaged 1992-1994*
Base acres treated
(% total)
Avg rate (lb ai/acre)
Apps/year
Total lb ai/year
Base acres treated
(% total)
Avg rate(lb ai/acre)
Apps/year
Total lb ai/year
paraffinic oil (several products) 20,931 (75)5.59
(1.5%)2.14 250,917 none reported
trifloxystrobin (Flint®) 19,592 (70) 0.06 1.06 1,255 not registered
fenarimol (Rubigan®) 15,078 (54) 0.03 2.03 805 9,358 (73) 0.05 3.58 1,675
sulfur† 11,675 (42) 3.06 3.12 111,551 8,982 (70) 4.00 3.40 122,155
quinoxyfen (Quintec®) 11,633 (42) 0.08 1.08 970 not registered
triflumizole (Procure®) 11,230 (40) 0.18 1.45 2,969 no data
kresoxim-methyl (Sovran®) 3,779 (14) 0.16 1.00 623 not registeredpyraclostrobin + boscalid (Pristine®)
2,166 (8) 0.22 1.46 710 not registered
myclobutanil (Rally®) 1,436 (5) 0.11 1.40 227 2,035 (16) 0.10 3.00 611
cyprodinil (Vangard®) 1,137 (4) 0.43 1.29 627 not registered
fenhexamid (Elevate®) 988 (4) 0.50 1.33 660 not registeredpotassium bicarbonate (Kaligreen®, Milstop®)
557 (2) 2.41 3.00 4,030 not registered
tebuconazole (Elite®) 417 (1) 0.13 1.00 53 not availableBacillus subtilis QST 713 (Serenade®)
302 (1) 0.07 1.50 31 not registered
potassium laurate (M-Pede®) 222 (<1)7.00
(2.6%)1.33 2,073 no data
pyrimethanil (Scala®) 190 (<1) 0.53 1.33 133 not registered
azoxystrobin (Abound®) 112 (<1) 0.19 1.00 21 not registered
lime sulfur 71 (<1) 16.89 1.00 1,207 no data
thiophanate-methyl (Topsin M®) 54 (<1) 0.70 1.00 38 not registered
triadimefon (Bayleton®) 26 (<1) 0.13 1.00 3 833 (6) 0.15 1.33 166
iprodione (Rovral®) No data 393 (3) 1.00 1.63 641
* From Morrell and Schreiber, 1998. † Includes micronized sulfur, wettable sulfur, sulfur dust, and water dispersible granule sulfur.
and it can be detrimental to beneficial arthropods
if overused. But because it is very effective against
powdery mildew and no resistance has developed,
sulfur continues to be a component in many disease
management programs. However, based on the 2005
survey responses, paraffinic oil has replaced sulfur as
the major fungicidal protectant used in wine grapes.
Use of the demethylation inhibiting (DMI) fungicides
fenarimol, myclobutanil, triflumizole, tebuconazole,
and triadimefon decreased over 11 years as multiple
new compounds were registered, many with
different modes of action. Providing growers with
numerous options for powdery mildew and bunch
rot management has allowed additional flexibility in
following resistance management guidelines.

T A B L E 1 2
Pesticide Type and Grape Variety
State Estimates 2005 State Averages 1992-1994*
Baseacres
treated**
Total lbsai/yr
lb ai/acre
Base acres
treated†
Total lbsai/yr
lb ai/acre
Insecticide/miticide
Wine 30,844 6,173 0.20 11,263 14,363 1.28
Juice 3,680 1,354 0.37 3,015 2,327 0.77
Herbicide
Wine 22,060 34,568 1.57 17,409 28,271 1.62
Juice 27,614 41,876 1.52 32,077 53,800 1.68
Fungicide
Wine (oil included) 101,596 378,903 3.73 21,601 125,248 5.80
Wine (no oil incl.) 80,665 127,986 1.59 no oil
* From Morrell and Schreiber, 1998.† Numbers reflect the summation of acreage treated with each chemical; thus totals greatly exceed the number of farmed grape acres.26
O P T I O N S A W A R E N E S S O U T R E A C H A T T I T U D E S
s u m m a r y a n dc o n c l u s i o n sThe Washington State grape industry has made enormous
improvements in integrated pest management adoption and
environmental stewardship over the past decade. Table 12 provides
summaries of each type of pesticide used in 1992–1994 and in
2005. By comparing these figures, it is clear that pesticide use has
declined in both wine and juice grapes. Insecticide/miticide usage
in wine grapes dropped by 84% from 1.28 to 0.2 lb ai/acre, and
in juice grapes dropped by 52% from 0.77 to 0.37 lbs ai/acre. The
decline in herbicide usage was not as pronounced: a 3% decrease
in herbicide inputs was determined in wine grapes and a 10%
decrease in juice grapes. Even though fungicide inputs totaled
378,903 lbs ai applied statewide during 2005, this represented a
36% decrease in overall use of fungicides on a per-acre basis (from
5.80 to 3.73 lbs ai per acre). If the paraffinic oil application figures
are removed to allow for a more direct comparison between
survey years, the lb ai/acre for fungicides applied in 2005 is 1.59
compared to 5.80 in 1992–1994, a 73% reduction in 11 years.
In both time periods, fungicides were the most-used control,
followed by herbicide and insecticide use, respectively.
Factors contributing to IPM
adoption in Washington grapes:
• passage of the FQPA;
• availability of lower-risk, more
specifically targeted pesticides;
• emphasis on weather-driven
disease management programs;
• vigorous Extension outreach;
• growers’ willingness to
explore new options.

C O M P A R I N G A C R E S O F P E S T I C I D E A P P L I C A T I O N V I A W A S S
27
65% in 2005. Insecticides were used on approximately
70% of total acres in 1997 and only on 57% in 2005.
Fungicide usage on a percent of acres basis increased
from 50% of the acreage in 1997 to approximately
58% in 2005. Confounding this comparison is the
fact that the petroleum oil (distillate) applications
reported by WASS were grouped with the insecticides.
While some petroleum oil was applied to control
insects, the overwhelming majority of petroleum
(paraffinic, mineral) oil applications in grapes are
fungicidal treatments to control powdery mildew.
Washington Agricultural Statistics Service has
conducted an agricultural chemical usage survey for
grapes every two years since 1997; the last one was
in 2005 (WASS 2002, 2006). While the WASS reports
provide no comparison of pounds active ingredient
applied, they do provide a percentage figure for the
amount of total crop acreage that received application
of each type of pesticide. Comparing these figures
also shows a substantial decline in both herbicide and
insecticide usage. In 1997, approximately 90% of grape
acres received herbicide applications; this decreased to
A number of factors, some fortuitous and some the
result of considerable forethought, worked together
over time to create the current pest management
context in Washington vineyards. Some of these are
outlined in the paragraphs that follow.
I M P A C T O F F Q P AA significant legislative event occurred shortly after
the earlier survey data were collected that contributed
greatly to these pesticide usage reductions. The
Food Quality Protection Act (FQPA) arrived in 1996
with its stated purpose to re-assess food tolerances
of all pesticides. Organophosphates (OPs) and
other neurotoxic compounds were targeted first.
Environmental Protection Agency (EPA) actions
following FQPA enactment resulted in lost insecticide
registrations on grapes. The grape uses of the OPs
azinphos-methyl, dimethoate, and methoxychlor
were voluntarily cancelled by their registrants. Other
organophosphates such as malathion and malathion-
methoxychlor disappeared as the Washington State
Department of Agriculture discontinued registering
their labels for use in grapes. Carbofuran is another
example; this neurotoxic carbamate is known to be
poisonous to birds, and even though a tolerance for
grapes exists, there are no labels containing carbofuran
for use on grapes in Washington State.
E X P A N D E D A L T E R N A T I V E S
The 1992-1994 study predicted several alternatives for
certain pesticides that were targeted for removal from
the market. However, in many cases, these alternatives
were not available in 2005 or better alternative
chemicals or application methods have become
available. A good example is the use of chlorpyrifos
for control of cutworms in the early spring. The
earlier survey predicted that growers would choose
carbaryl or methomyl to control cutworms should
chlorpyrifos become unavailable. However, even
though chlorpyrifos was still available in 2005, the
majority of wine grape growers were choosing to
apply fenpropathrin (Danitol®), a pyrethroid. This
was due to a new application technology that could
not be foreseen a decade ago. Rather than applying
foliar sprays to control cutworm, growers had
adopted a technique developed by WSU Extension
researchers whereby an early spring (delayed dormant
period) application directed at the base of the vine
prevented cutworms from climbing up from the soil
to damage buds. This technique used a very low rate
of fenpropathrin, making it more economical as
well as softer on non-target species. The result was a
dramatic, 15-fold reduction in the use of chlorpyrifos
(Lorsban®).

M O R E P O T E N C Y = F E W E R L B S A IWhile no fungicide or herbicide registrations were
lost on grapes between 1994 and 2005, all pesticide
categories (insecticide, fungicide, and herbicide)
gained registrations during the same period. This
contributed to the reduction in active ingredient
applied to grapes as the newer compounds were often
more potent, which meant that formulated pesticide
could treat more acreage or could be extended over
multiple applications. Examples of insecticides
effective at low active-ingredient-per-acre (ai/A) rates
include fenpropathrin (0.1 lb) and acetamiprid (0.8
oz). Similarly, imidacloprid is effective at 0.56–0.75
oz ai/A, and while it is not new, its use has increased.
28
T A B L E 1 3 - A1992-1994* 2005 Since 1994
Target Pest Group
Active ingredients
commonly usedAlternatives used
Active ingredients
commonly usedAlternatives used Registrations lost
Registrations gained
Insects
black vine weevil
cutworms
leafhoppers
mealybugs
thrips
carbaryl
carbofuran
chlorpyrifos
dimethoate
endosulfan
azinphos-methyl
diazinon
malathion
malathion+ methoxychlor
methomyl
petroleum oil
fenpropathrin
imidacloprid
acetamiprid
azadirachtin
buprofezin
carbaryl
chlorpyrifos
dimethoate
azinphos-methyl†
carbofuran‡
dimethoate§
ethion**
lindane**
methoxychlor**
methyl parathion**
mevinphos‡
acetamiprid
beta-cyfluthrin
bifenthrin
buprofezin
capsaicin
cyfluthrin
dinotefuran
fenpropathrin
kaolin
methoxyfenozide
pyriproxyfen
spinosad
Mites propargite potassium laurate
bifenazate fenpyroximate
potassium laurate
propargite
none abamectin
bifenazate
clofentezine
etoxazole
fenpyroximate
hexythiazox
pyridaben
spirodiclofen
*From Morrell and Schreiber, 1998.†Tolerance for grapes still exists. Azinphos-methyl use on grapes was cancelled 8/27/03. ‡Tolerance for grapes still exists though there are no labels for carbofuran or mevinphos in Washington State.§Tolerance for grapes still exists. Dimethoate use on grapes was cancelled 7/17/05. Growers were allowed to buy and use existing stocks until exhausted; registrants were not allowed to sell product labeled for use on grapes after 7/20/06.
**Tolerances revoked as follows: ethion on 10/26/98, methyl parathion on 1/05/01, methoxychlor on 7/17/02, and lindane on 9/21/05.
An example of an herbicide effective at low rates is
the newly registered carfentrazone-ethyl, which is
effective at 0.03 lb ai/A. Several newly registered
fungicides are also effective at low ai/A: trifloxystrobin
(0.75–1 oz), azoxystrobin (0.18–0.24 fl oz), and
quinoxyfen (0.05–0.06 lb). These amounts are indeed
small when compared to the 1994 averages of 3 lbs
per acre reported for sulfur and the nearly 4 lbs per
acre rate reported for the herbicide oryzalin.
R E D U C E D R I S K P R O D U C T SMany of the newly registered compounds were
designated as “reduced-risk” by EPA. To gain reduced-
risk status a pesticide must exhibit: low toxicity
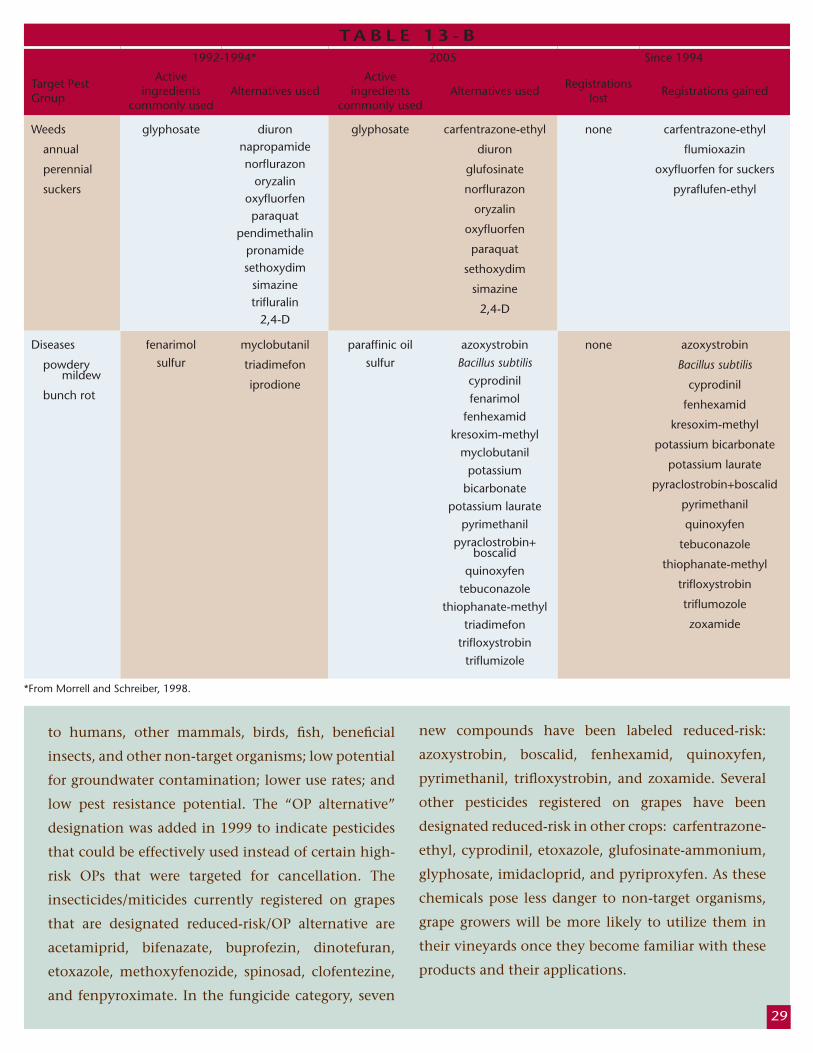
to humans, other mammals, birds, fish, beneficial
insects, and other non-target organisms; low potential
for groundwater contamination; lower use rates; and
low pest resistance potential. The “OP alternative”
designation was added in 1999 to indicate pesticides
that could be effectively used instead of certain high-
risk OPs that were targeted for cancellation. The
insecticides/miticides currently registered on grapes
that are designated reduced-risk/OP alternative are
acetamiprid, bifenazate, buprofezin, dinotefuran,
etoxazole, methoxyfenozide, spinosad, clofentezine,
and fenpyroximate. In the fungicide category, seven 29
T A B L E 1 3 - B1992-1994* 2005 Since 1994
Target Pest Group
Active ingredients
commonly usedAlternatives used
Active ingredients
commonly usedAlternatives used
Registrations lost
Registrations gained
Weeds
annual
perennial
suckers
glyphosate diuronnapropamidenorflurazon
oryzalinoxyfluorfenparaquat
pendimethalinpronamidesethoxydim
simazinetrifluralin
2,4-D
glyphosate carfentrazone-ethyl
diuron
glufosinate
norflurazon
oryzalin
oxyfluorfen
paraquat
sethoxydim
simazine
2,4-D
none carfentrazone-ethyl
flumioxazin
oxyfluorfen for suckers
pyraflufen-ethyl
Diseases
powdery mildew
bunch rot
fenarimol myclobutanil
triadimefon
iprodione
paraffinic oil azoxystrobin
Bacillus subtilis
cyprodinil
fenarimol
fenhexamid
kresoxim-methyl
myclobutanil
potassium
bicarbonate
potassium laurate
pyrimethanil
pyraclostrobin+boscalid
quinoxyfen
tebuconazole
thiophanate-methyl
triadimefon
trifloxystrobin
triflumizole
none azoxystrobin
Bacillus subtilis
cyprodinil
fenhexamid
kresoxim-methyl
potassium bicarbonate
potassium laurate
pyraclostrobin+boscalid
pyrimethanil
quinoxyfen
tebuconazole
thiophanate-methyl
trifloxystrobin
triflumozole
zoxamide
sulfur sulfur
*From Morrell and Schreiber, 1998.
new compounds have been labeled reduced-risk:
azoxystrobin, boscalid, fenhexamid, quinoxyfen,
pyrimethanil, trifloxystrobin, and zoxamide. Several
other pesticides registered on grapes have been
designated reduced-risk in other crops: carfentrazone-
ethyl, cyprodinil, etoxazole, glufosinate-ammonium,
glyphosate, imidacloprid, and pyriproxyfen. As these
chemicals pose less danger to non-target organisms,
grape growers will be more likely to utilize them in
their vineyards once they become familiar with these
products and their applications.

30
A W A R E N E S S & A S S I M I L A T I O NResults of the 2005 survey indicate that the grape
growers’ collective experience and expanding
knowledge base contributed greatly to the reduction
in pesticide use in grapes. Grape growers have been
able to assimilate vast amounts of pest management
information from a number of sources, including
other growers, university Extension personnel and
publications, chemical company representatives, and
private consultants (see page 11). The growers have in
turn applied this knowledge in the form of integrated
pest management practices in their vineyard systems.
The use of field monitoring and economic thresholds
by the majority of the grower-respondents to guide
their pest management programs factored significantly
in the overall pesticide use reductions.
S U S T A I N E D E F F O R T While the pesticide usage reductions in grapes reported
in this document might sound almost too good to be
true, they did not occur overnight. They are the result
of a decade of focused research and extension and a
grower population willing to listen and apply new
things for the benefit of their crop, the terroir, human
Pesticide inputs will most
certainly continue to decrease
slightly in the next five years.
O P T I O N S A W A R E N E S S O U T R E A C H A T T I T U D E S
health, and the environment, as well as their bottom-
line production and profitability.
L O O K I N G A H E A D Pesticide inputs will most certainly continue to
decrease slightly in the next five years. Currently,
effective pesticides and suitable alternatives are
available for the major pests of wine and juice grapes.
New pest problems may emerge, necessitating the
development of new control program designs with
potentially new active ingredients. There are reduced-
risk pesticides still in the pipeline that are candidates
for registration on grape; these may serve as
alternatives to some of the higher-risk pesticides still
in use. The potential still exists for registrations to be
lost as EPA continues risk assessments. A decrease in
fungicide use may be realized as more growers utilize
precision bunch rot and powdery mildew computer
models that recommend longer spray intervals and
eliminate early-season applications. Finally, there is
a growing interest in organic grape production and
as more growers transition into organic pest control
programs, use of conventional pesticides will continue
to decline.

R E F E R E N C E S
Morrell, A. and A. Schreiber. 1998.
Impact of pesticide use of Pacific
Northwest wine and juice grapes:
Biologic and economic assessment.
Washington State University
Extension Pub. MISC0200.
Pest Management Guide for
Grapes in Washington. 2005.
Washington State University
Extension Bulletin EB0762.
US EPA, Office of Pesticide
Programs. 2006. Reduced risk/
organophosphate alternative
decisions for conventional
pesticides. Last updated
November 8, 2006.
University of California—
IPM. 2006. Pest Management
Guidelines Grape Supplement.
Washington Agricultural Statistics
Service. 2002, 2006. Washington
Agricultural Chemical Usage—
Grapes. Releases from August
2002 and September 2006.
Washington State Pest
Management Resource Services.
Pesticide Notification Network
(PNN). http://ext.wsu.edu/pnn/
Washington State Pest
Management Resource Services.
Pesticide Information Center
Online (PICOL). http://cru66.cahe.
wsu.edu/LabelTolerance.html
31
A P P E N D I XReported Applications of Insecticides, Miticides, and Fumigants
Used on Grapes in Washington State 2005
Active ingredient Formulation Grape Variety
%*Base
Acres†Treated Acres
I N S E C T I C I D E S / M I T I C I D E S fenpropathrin Danitol® 2.4EC wine 14 3,370.10 3,396.10
imidacloprid Provado® 1.6F
wine 23 1,882.67 1,936.27
Concord 1 117.00 117.00
Niagara 1 39.00 39.00
dimethoate various
wine 4 58.10 89.60
Concord 4 401.00 401.00
Niagara 1 6.00 6.00
bifenazate Acramite® 50WS wine 7 420.96 420.96
azadirachtin Aza-Direct® wine 1 406.83 518.80
spinosad Success® wine 3 201.68 201.68
imidacloprid Admire® 2F wine 6 117.58 187.58
buprofezin Applaud® wine 3 138.68 138.68
acetamiprid Assail® wine 3 96.50 96.50
carbaryl Sevin® wine 6 63.13 67.13
chlorpyrifos Lorsban® 4E wine 3 35.00 35.00
propargite Omite® 30WP wine 1 33.01 33.01
petroleum oilSuperior Spray
Oil®wine 1 31.50 31.50
dinotefuran Venom® wine 1 31.50 31.50
fenpyroximate FujiMite® 5EC wine 1 14.00 14.00
potassium laurate M-Pede® wine 1 8.00 8.00
T O T A L I N S E C T I C I D E S 7,472.24 7,769.31
F U M I G A N T S metam-sodium Vapam® 1 2.00 2.00
H E R B I C I D E S
glyphosateRoundup®/
Glyfos®
wine 27 2,759.80 4,157.76
Concord 20 1,763.30 3,203.00
Niagara 1 6.00 6.00
paraquat
Gramoxone Max®,
Gramoxone Inteon®
wine 16 1,249.12 2,409.73
Concord 10 289.30 298.10
simazine variouswine 3 78.06 85.29
Concord 1 953.00 953.00
norflurazon Solicam®wine 1 2.70 2.70
Concord 3 970.00 970.00
carfentrazone-ethyl Aim®/Aim EW®wine 4 565.69 919.49
Concord 3 37.50 37.50
oxyfluorfen Goal 2XL® wine 6 234.44 239.79
oryzalin Surflan®wine 7 26.60 28.60
Concord 3 182.00 182.00
glufosinate Rely® wine 1 21.49 21.49
diuron various Concord 1 17.00 17.00
sethoxydim Poast® Concord 1 6.80 13.60
2,4-D various wine 1 3.60 3.60
T O T A L H E R B I C I D E S 9,166.40 13,548.65
* Percentage of the survey respondents using this product/ingredient.† Base acres were determined by dividing the number of treated acres by the number of applications the blocks received.
C O N T I N U E D o n b a c k p a g e w i t h F U N G I C I D E S

WSU Extension bulletins contain material written and produced for
public distribution. You may reprint written material, provided you do
not use it to endorse a commercial product. Alternate formats of our
educational materials are available upon request for persons with
disabilities. Contact Washington State University Extension
Communications and Educational Support for more information.
You may download copies of this and other publications from
WSU Extension Publishing and Printing online at http://pubs.
wsu.edu, or call 1-800-723-1763. This publication is also available at
WSU’s integrated pest management web site, http://ipm.wsu.edu.
Issued by Washington State University Extension and the U.S.
Department of Agriculture in furtherance of the Acts of
May 8 and June 30, 1914. Extension programs and policies
are consistent with federal and state laws and regulations on
nondiscrimination regarding race, sex, religion, age, color, creed,
national or ethnic origin; physical, mental, or sensory disability; marital
status or sexual orientation; and status as a Vietnam-era or disabled
veteran. Evidence of noncompliance may be reported through your local Extension office. Trade names have been used to simplify information;
no endorsement is intended. Published August 2007. Subject codes 233, 350, 353. EB2025E.
Use pesticides with care. Apply them only to plants, animals, or sites listed on the label. When mixing and applying
pesticides, follow all label precautions to protect yourself and others around you. It is a violation of the law to disregard
label directions. If pesticides are spilled on skin or clothing, remove clothing and wash skin thoroughly. Store pesticides
in their original containers and keep them out of the reach of children, pets, and livestock.
Copyright 2007 Washington State University.
A P P E N D I X , c o n t i n u e d f r o m p . 3 1Reported Appl icat ions of Pest ic ides Used on Grapes in
Washington State in 2005
Active ingredient Formulation % * Base Acres† Treated Acres
F U N G I C I D E S ‡
trifloxystrobin Flint® 24 4,388.53 4,533.01
paraffinic oil JMS Stylet Oil® 21 3,636.40 6,613.10
fenarimol Rubigan® EC 19 3,377.50 4,210.94
quinoxyfen Quintec® 17 2,605.89 2,637.31
triflumizole Procure® 50WS 17 2,515.48 3,174.38
sulfur several 30 2,432.22 5,096.69
paraffinic oil JMS Organic Stylet Oil® 1 851.18 2,100.68
kresoxim-methyl Sovran® 7 846.60 846.60
pyraclostrobin+boscalid Pristine® 19 485.20 520.20
myclobutanil Rally® 40W 14 321.58 363.46
cyprodinil Vangard® 10 254.78 260.78
fenhexamid Elevate® 50WDG 4 221.21 225.09
paraffinic oil Omni Supreme Spray® 4 200.89 282.72
sulfur dust not reported 1 183.00 183.00
potassium bicarbonate Kaligreen®, Milstop® 7 124.72 146.72
tebuconazole Elite® 45DF 6 93.50 93.50
Bacillus subtilis QST 713 Serenade® 9 67.67 71.42
potassium laurate M-Pede® 4 49.75 89.75
pyrimethanil Scala® 4 42.50 46.50
azoxystrobin Abound® 1 25.08 25.08
lime sulfur not reported 1 16.00 16.00
thiophanate-methyl Topsin M® 1 12.00 12.00
triadimefon Bayleton® 3 5.88 5.88
T O T A L F U N G I C I D E S 22,757.56 31,554.81
* Percentage of the survey respondents using this product/ingredient.† Base acres = Treated acres divided by number of applications the blocks received.‡ All figures refer to wine grapes; no fungicide usage was reported on juice grapes.