Embed Size (px)
Citation preview
CONNECTICUT STATE DEPARTMENT OF EDUCATION
Suspensions and Expulsions in Connecticut
Connecticut State Department of Education (CSDE)
May 2017
1
“Submitted by the Connecticut State Department of Education in fulfillment of the requirements in Section 2(b) of Public Act 15-168.”
CONNECTICUT STATE DEPARTMENT OF EDUCATION
Questions
• What discipline data are collected by the CSDE?
• What is the trend for the three important sanctions of in-
school suspensions (ISS), out-of-school suspensions (OSS), and expulsions in Connecticut over the past five years?
• Who is suspended/expelled? Do suspensions rates vary by
grade, race/ethnicity, gender? Also, are there differences among these subgroups within different district categories (e.g., Ed-Reform, Charter, RESC)?
2

CONNECTICUT STATE DEPARTMENT OF EDUCATION
Questions (cont’d)
• Of the total number of suspensions, what is the percent of ISS, OSS and Expulsions within the different district categories?
• Why are students being suspended/expelled? What types of incidents are resulting in suspensions/expulsions? Do these vary by district categories and race/ethnicity?
• How long do suspensions and expulsions last? What do the data say regarding the rate of suspensions and the length of sanctions for the various district categories?
• What is the relationship to other indicators (e.g., chronic absenteeism, assessment participation)?
3
CONNECTICUT STATE DEPARTMENT OF EDUCATION
Definitions per C.G.S. 10-233a
• “Removal” “means an exclusion from a classroom for all or part of a single class period, provided such exclusion shall not extend beyond ninety minutes.”
• “In-school suspension” “means an exclusion from regular classroom activity for no more than ten consecutive school days, but not exclusion from school…”
• “Out-of-school suspension” “means an exclusion from school privileges or from transportation services only for no more than ten consecutive school days…”
• “Expulsion” “means an exclusion from school privileges for more than ten consecutive school days…”
4
CONNECTICUT STATE DEPARTMENT OF EDUCATION
Background
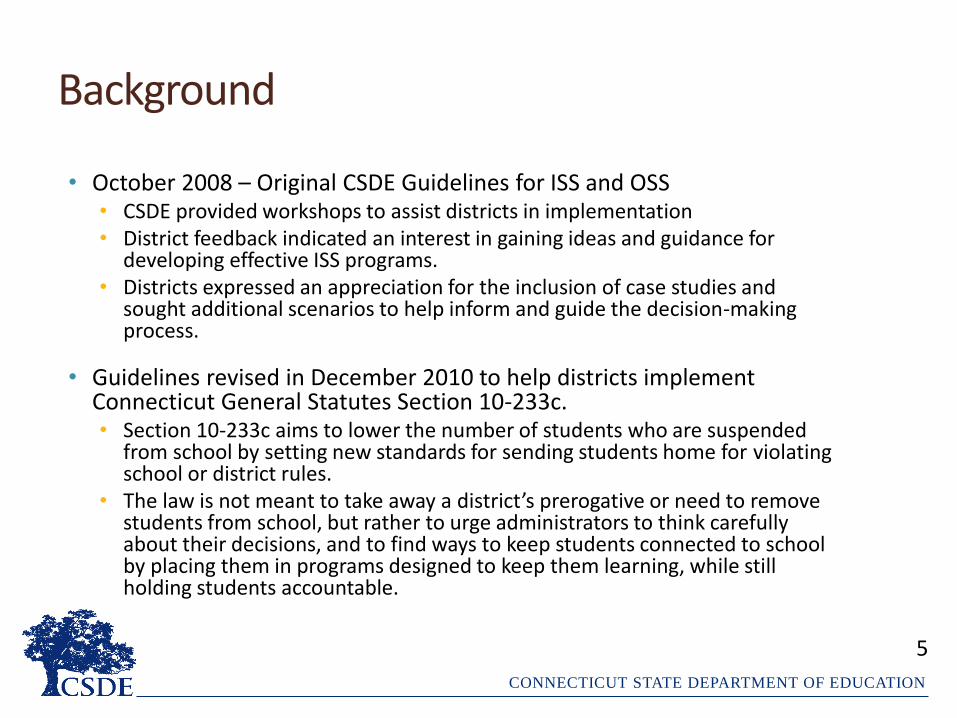
• October 2008 – Original CSDE Guidelines for ISS and OSS• CSDE provided workshops to assist districts in implementation• District feedback indicated an interest in gaining ideas and guidance for
developing effective ISS programs. • Districts expressed an appreciation for the inclusion of case studies and
sought additional scenarios to help inform and guide the decision-making process.
• Guidelines revised in December 2010 to help districts implement Connecticut General Statutes Section 10-233c.• Section 10-233c aims to lower the number of students who are suspended
from school by setting new standards for sending students home for violating school or district rules.
• The law is not meant to take away a district’s prerogative or need to remove students from school, but rather to urge administrators to think carefully about their decisions, and to find ways to keep students connected to school by placing them in programs designed to keep them learning, while still holding students accountable.
5
CONNECTICUT STATE DEPARTMENT OF EDUCATION
Subsection (g) of C.G.S. Section 10-233c
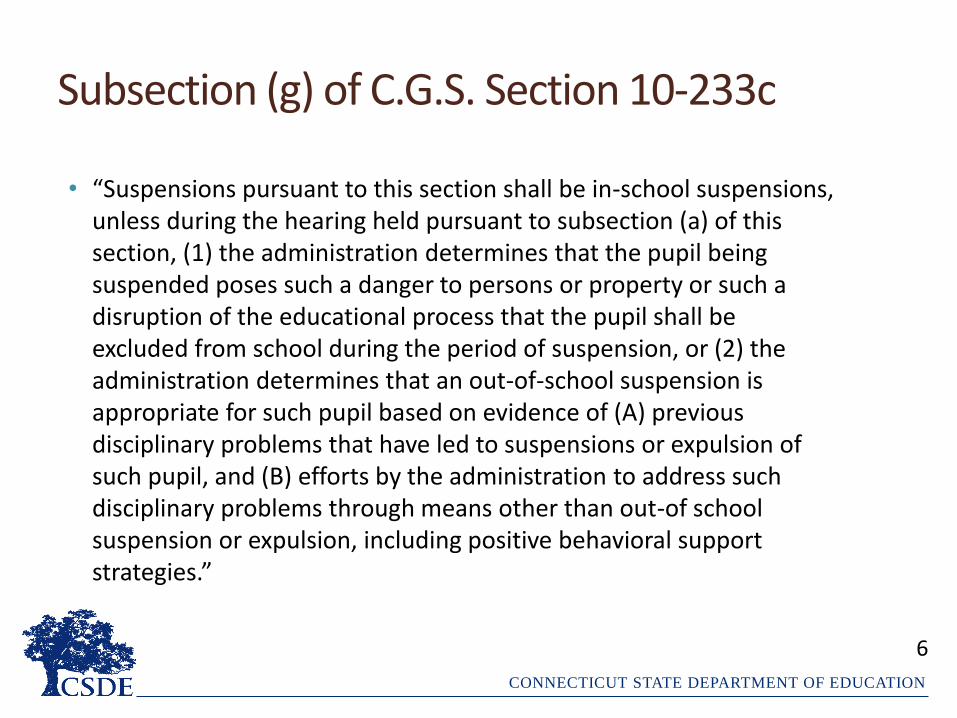
• “Suspensions pursuant to this section shall be in-school suspensions, unless during the hearing held pursuant to subsection (a) of this section, (1) the administration determines that the pupil being suspended poses such a danger to persons or property or such a disruption of the educational process that the pupil shall be excluded from school during the period of suspension, or (2) the administration determines that an out-of-school suspension is appropriate for such pupil based on evidence of (A) previous disciplinary problems that have led to suspensions or expulsion of such pupil, and (B) efforts by the administration to address such disciplinary problems through means other than out-of school suspension or expulsion, including positive behavioral support strategies.”
6
CONNECTICUT STATE DEPARTMENT OF EDUCATION
What data are collected?
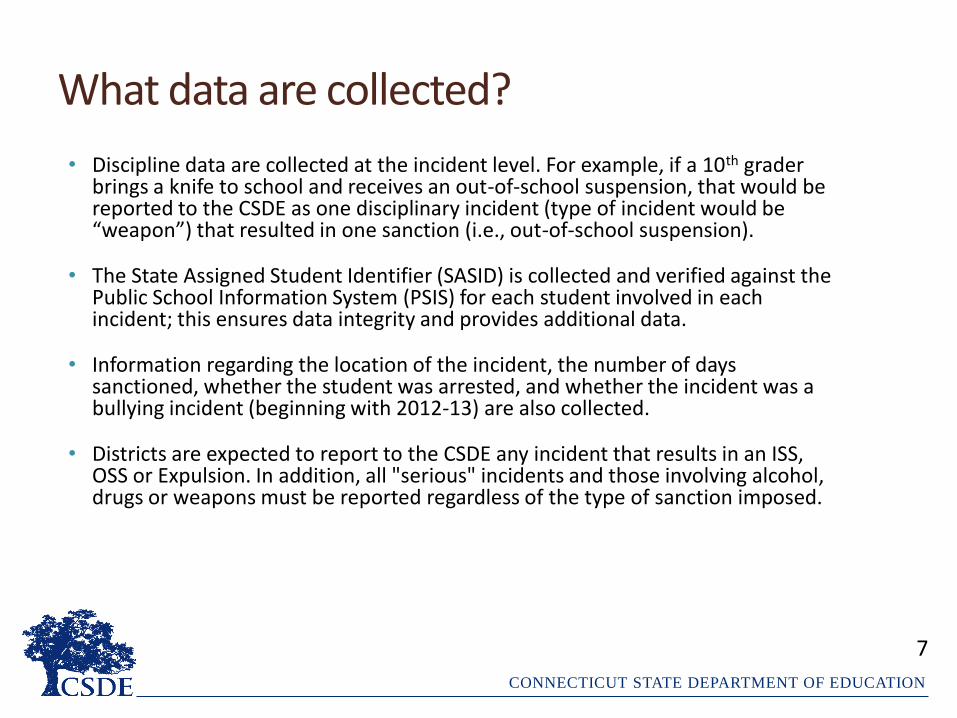
• Discipline data are collected at the incident level. For example, if a 10th grader brings a knife to school and receives an out-of-school suspension, that would be reported to the CSDE as one disciplinary incident (type of incident would be “weapon”) that resulted in one sanction (i.e., out-of-school suspension).
• The State Assigned Student Identifier (SASID) is collected and verified against the Public School Information System (PSIS) for each student involved in each incident; this ensures data integrity and provides additional data.
• Information regarding the location of the incident, the number of days sanctioned, whether the student was arrested, and whether the incident was a bullying incident (beginning with 2012-13) are also collected.
• Districts are expected to report to the CSDE any incident that results in an ISS, OSS or Expulsion. In addition, all "serious" incidents and those involving alcohol, drugs or weapons must be reported regardless of the type of sanction imposed.
7

CONNECTICUT STATE DEPARTMENT OF EDUCATION
What data are collected? (cont’d)
• Collecting data at this granular level enables determination of:• the frequency and triggers for disciplinary incidents; • the types of sanctions used for those incidents; • the actual unduplicated count of students involved in one or more
incidents; and• the duration of the sanctions.
• Both incident/sanction level data and the unduplicated number of students involved in those incidents are needed to fully understand the disciplinary practices of a school.
• For example, a student received two in-school suspensions (one in week 10 and another in week 20) and then received one out-of-school suspension (in week 30) from his school; this would be counted as three sanctions but only one student.
8
CONNECTICUT STATE DEPARTMENT OF EDUCATION
TREND IN ISS, OSS, AND EXPULSIONS
9
CONNECTICUT STATE DEPARTMENT OF EDUCATION
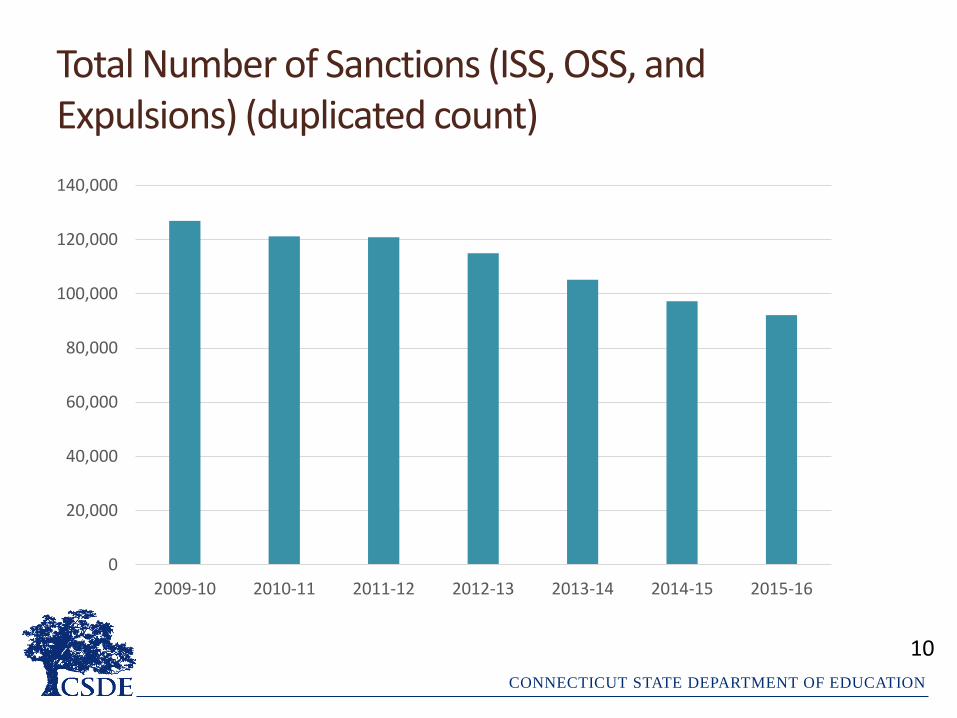
Total Number of Sanctions (ISS, OSS, and Expulsions) (duplicated count)
0
20,000
40,000
60,000
80,000
100,000
120,000
140,000
2009-10 2010-11 2011-12 2012-13 2013-14 2014-15 2015-16
10

CONNECTICUT STATE DEPARTMENT OF EDUCATION
Total Number of Sanctions Disaggregated by ISS, OSS, and Expulsions (duplicated count)
0
10,000
20,000
30,000
40,000
50,000
60,000
70,000
80,000
90,000
2009-10 2010-11 2011-12 2012-13 2013-14 2014-15 2015-16
ISS OSS Expulsion 11
CONNECTICUT STATE DEPARTMENT OF EDUCATION
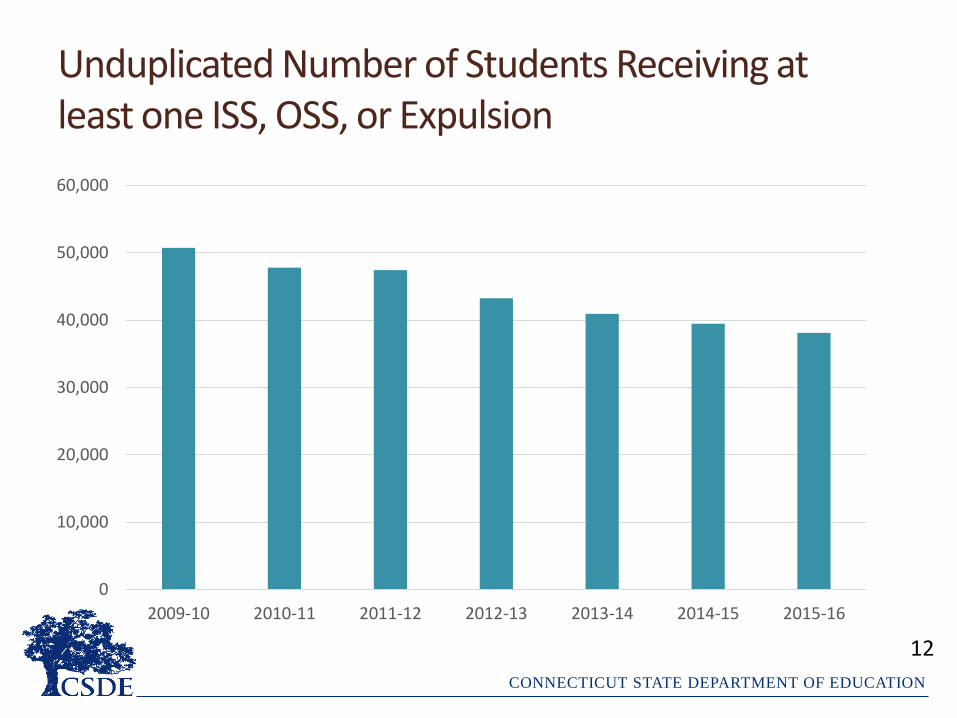
Unduplicated Number of Students Receiving at least one ISS, OSS, or Expulsion
12
0
10,000
20,000
30,000
40,000
50,000
60,000
2009-10 2010-11 2011-12 2012-13 2013-14 2014-15 2015-16

CONNECTICUT STATE DEPARTMENT OF EDUCATION
Trend Observations
• Over the past six years, the total number of suspensions (ISS and OSS) and expulsions has reduced by 27.4% from ͌127,000 in 2009-10 to ͌92,000 in 2015-16. The individual sanction types have also evidenced reductions during the same period:
• ISS by 22.4%
• OSS by 34.6%
• Expulsions by 19.3%
• The unduplicated count of students receiving at least one suspension or expulsion has also declined by 24.9% from ͌51,000 in 2009-10 to ͌38,000 in 2015-16.
13
CONNECTICUT STATE DEPARTMENT OF EDUCATION
WHO IS BEING SUSPENDED/EXPELLED?
This section looks at the unduplicated count of students who are being suspended and/or expelled.
14

CONNECTICUT STATE DEPARTMENT OF EDUCATION
Suspension/Expulsion Rate
𝑈𝑛𝑑𝑢𝑝𝑙𝑖𝑐𝑎𝑡𝑒𝑑 𝑛𝑢𝑚𝑏𝑒𝑟 𝑜𝑓 𝑠𝑡𝑢𝑑𝑒𝑛𝑡𝑠𝑟𝑒𝑐𝑒𝑖𝑣𝑖𝑛𝑔 𝑎𝑡 𝑙𝑒𝑎𝑠𝑡 𝑜𝑛𝑒𝐼𝑆𝑆, 𝑂𝑆𝑆 𝑜𝑟 𝐸𝑥𝑝𝑢𝑙𝑠𝑖𝑜𝑛𝑖𝑛 𝑡ℎ𝑒 𝑓𝑖𝑠𝑐𝑎𝑙 𝑦𝑒𝑎𝑟
𝑇𝑜𝑡𝑎𝑙 𝑛𝑢𝑚𝑏𝑒𝑟 𝑜𝑓 𝑠𝑡𝑢𝑑𝑒𝑛𝑡𝑠 𝑒𝑛𝑟𝑜𝑙𝑙𝑒𝑑𝑝𝑒𝑟 𝑂𝑐𝑡𝑜𝑏𝑒𝑟 𝑐𝑜𝑢𝑛𝑡
15
CONNECTICUT STATE DEPARTMENT OF EDUCATION
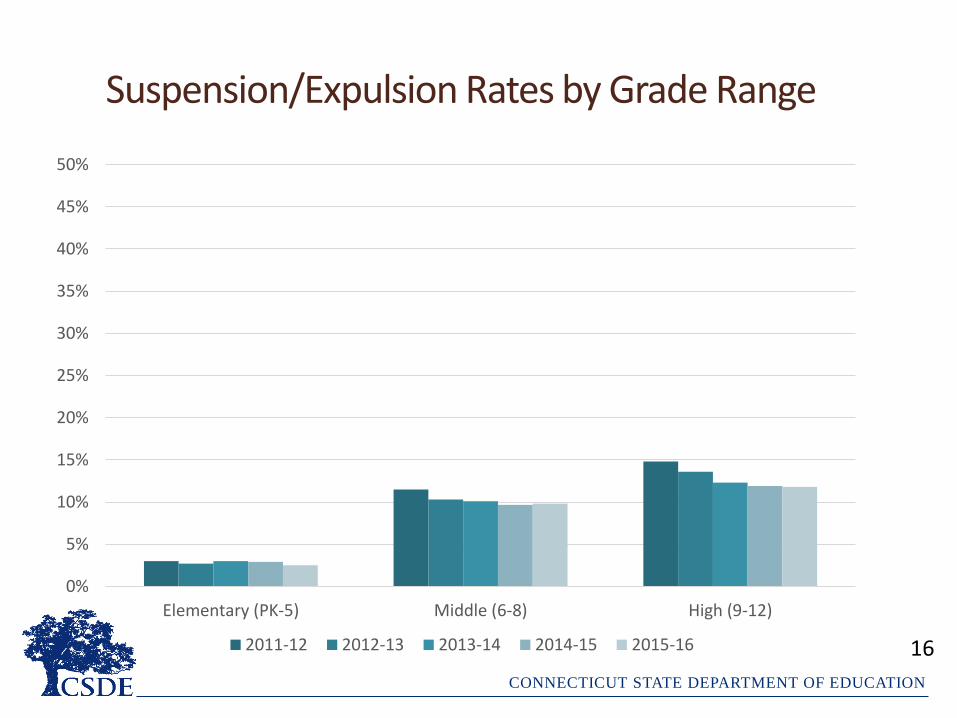
Suspension/Expulsion Rates by Grade Range
0%
5%
10%
15%
20%
25%
30%
35%
40%
45%
50%
Elementary (PK-5) Middle (6-8) High (9-12)
2011-12 2012-13 2013-14 2014-15 2015-16 16
CONNECTICUT STATE DEPARTMENT OF EDUCATION
Analyses by District Categories
• Educational (Ed) Reform Districts — 10 districts with the lowest performance statewide. They are Bridgeport, East Hartford, Hartford, Meriden, New Britain, New Haven, New London, Norwich, Waterbury and Windham. These districts are also considered Alliance Districts.
• Non Ed-Reform Alliance Districts — There are 30 total Alliance Districts. In addition to the 10 Ed Reform Districts, this category includes Ansonia, Bloomfield, Bristol, Danbury, Derby, East Haven, East Windsor, Hamden, Killingly, Manchester, Middletown, Naugatuck, Norwalk, Putnam, Stamford, Vernon, West Haven, Winchester, Windsor and Windsor Locks.
• All Other LEAs — All remaining local and regional school districts.
• Regional Education Service Centers (RESC) — ACES, CES, CREC, EASTCONN, Education Connection, and LEARN.
17
CONNECTICUT STATE DEPARTMENT OF EDUCATION
Analyses by District Categories
• Public Charter Schools
• Endowed Academies – They are Norwich Free Academy, The Gilbert School and Woodstock Academy.
• Connecticut Technical High School System
• State School Districts which includes Unified District #1 (Department of Corrections), Unified District #2 (Department of Children and Families) and Unified District #3 (Department of Developmental Services).
18
CONNECTICUT STATE DEPARTMENT OF EDUCATION
Suspension/Expulsion Rates in the Elementary Grades (PK-5) by District Category
0%
5%
10%
15%
20%
25%
30%
35%
40%
45%
50%
State Average Ed-Reform Non Ed-ReformAlliance
All OtherDistricts
RESC Public Charters
2011-12 2012-13 2013-14 2014-15 2015-1619
CONNECTICUT STATE DEPARTMENT OF EDUCATION
Suspension/Expulsion Rates in the Middle Grades (6-8) by District Category
0%
5%
10%
15%
20%
25%
30%
35%
40%
45%
50%
StateAverage
Ed-Reform Non Ed-Reform
All OtherDistricts
RESC PublicCharters
EndowedAcademies
StateSchool
Districts
2011-12 2012-13 2013-14 2014-15 2015-1620
CONNECTICUT STATE DEPARTMENT OF EDUCATION
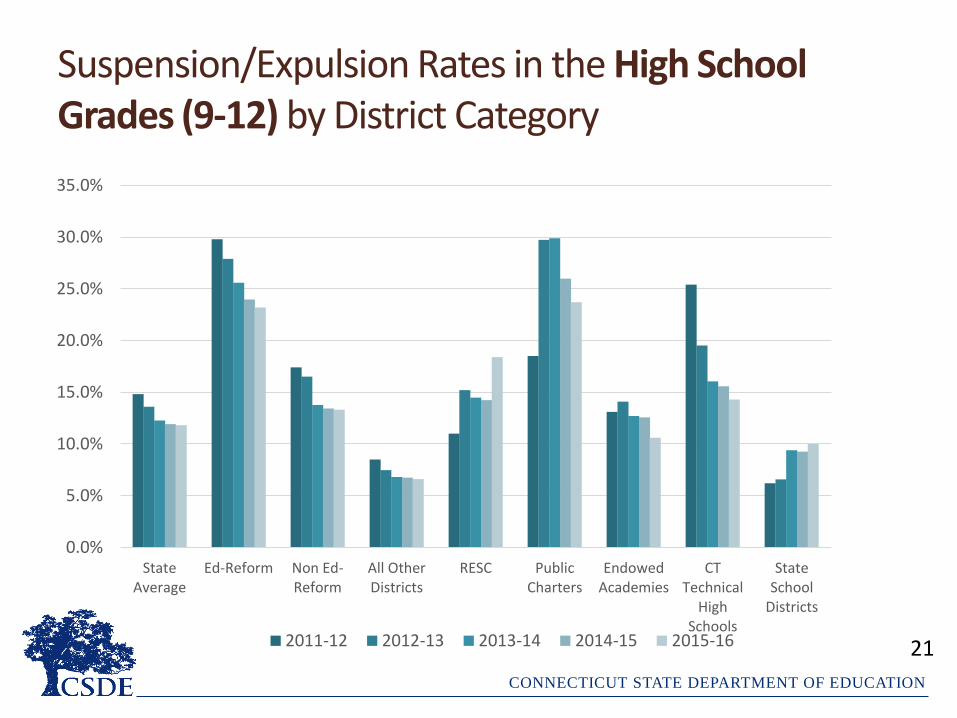
Suspension/Expulsion Rates in the High School Grades (9-12) by District Category
0.0%
5.0%
10.0%
15.0%
20.0%
25.0%
30.0%
35.0%
StateAverage
Ed-Reform Non Ed-Reform
All OtherDistricts
RESC PublicCharters
EndowedAcademies
CTTechnical
HighSchools
StateSchool
Districts
2011-12 2012-13 2013-14 2014-15 2015-16 21
CONNECTICUT STATE DEPARTMENT OF EDUCATION
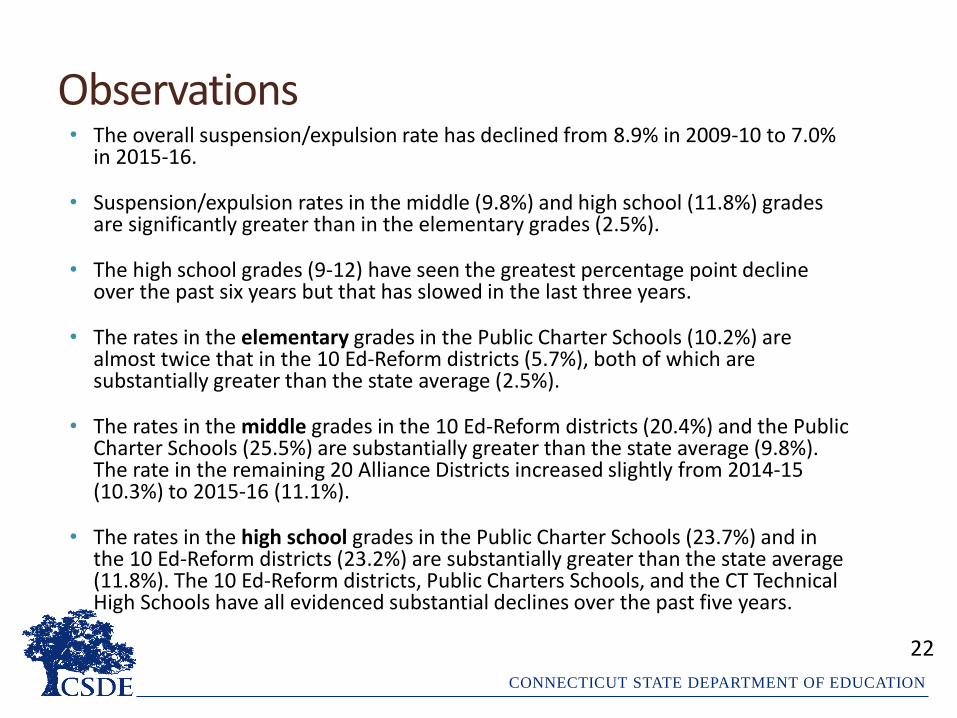
Observations• The overall suspension/expulsion rate has declined from 8.9% in 2009-10 to 7.0%
in 2015-16.
• Suspension/expulsion rates in the middle (9.8%) and high school (11.8%) grades are significantly greater than in the elementary grades (2.5%).
• The high school grades (9-12) have seen the greatest percentage point decline over the past six years but that has slowed in the last three years.
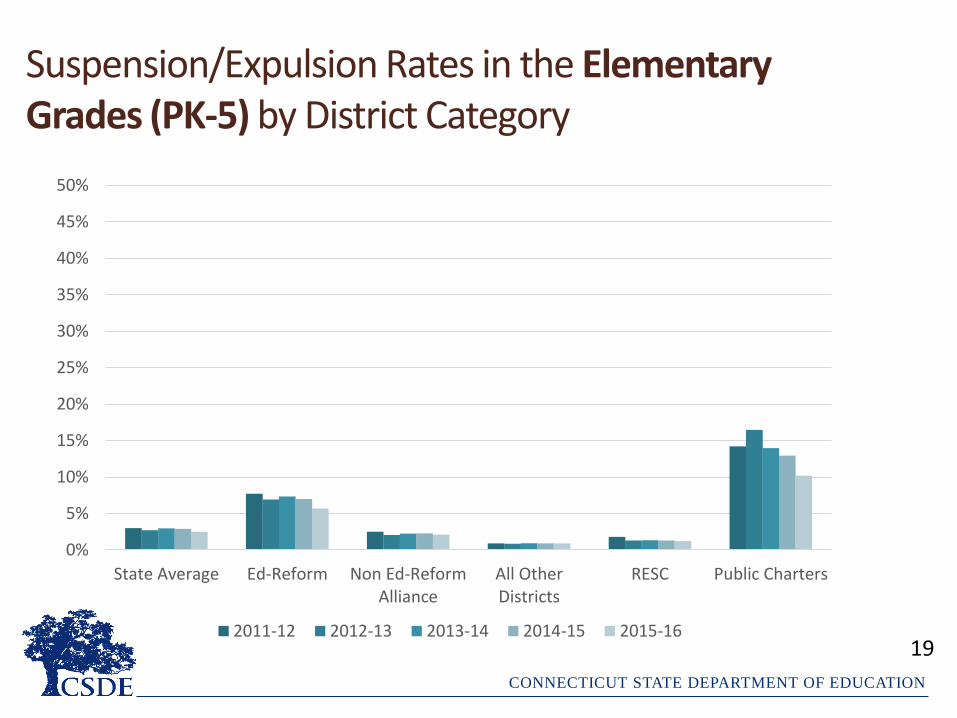
• The rates in the elementary grades in the Public Charter Schools (10.2%) are almost twice that in the 10 Ed-Reform districts (5.7%), both of which are substantially greater than the state average (2.5%).
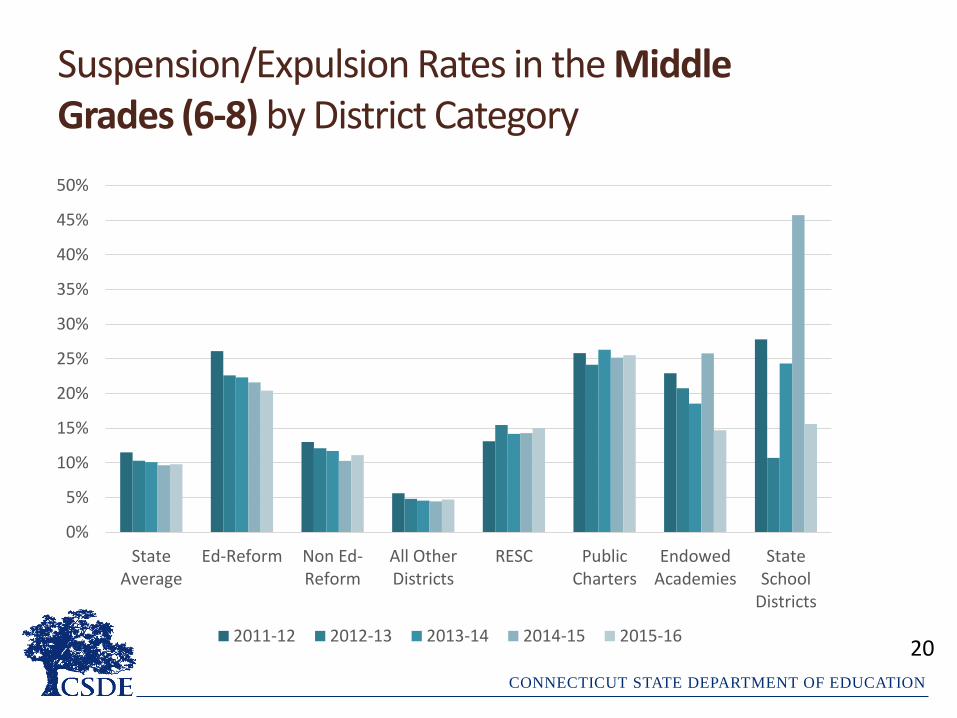
• The rates in the middle grades in the 10 Ed-Reform districts (20.4%) and the Public Charter Schools (25.5%) are substantially greater than the state average (9.8%). The rate in the remaining 20 Alliance Districts increased slightly from 2014-15 (10.3%) to 2015-16 (11.1%).
• The rates in the high school grades in the Public Charter Schools (23.7%) and in the 10 Ed-Reform districts (23.2%) are substantially greater than the state average (11.8%). The 10 Ed-Reform districts, Public Charters Schools, and the CT Technical High Schools have all evidenced substantial declines over the past five years.
22
CONNECTICUT STATE DEPARTMENT OF EDUCATION
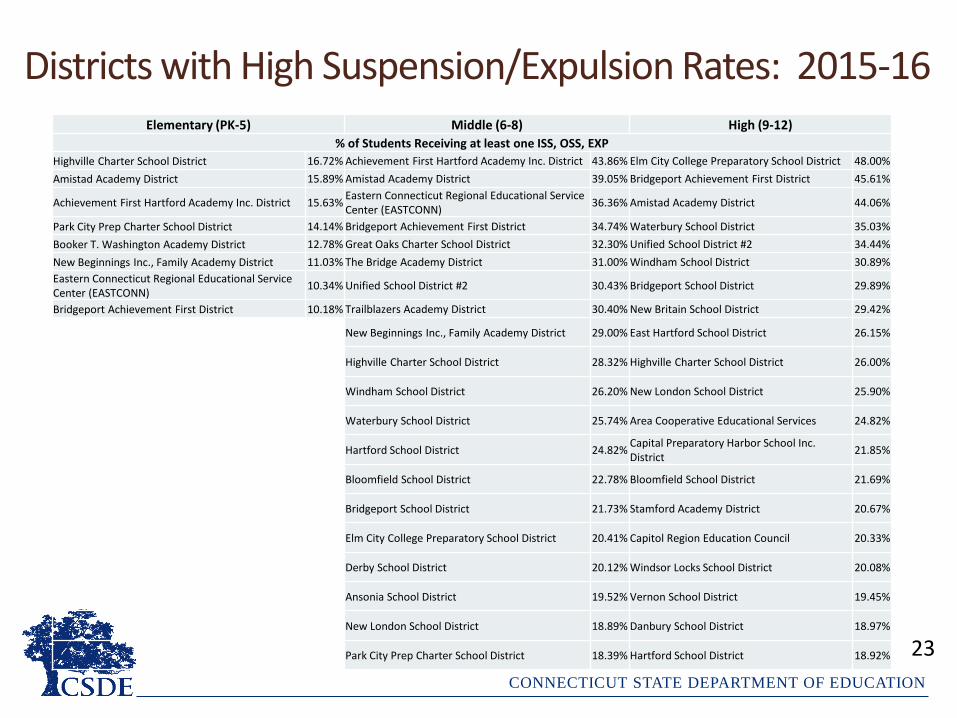
Districts with High Suspension/Expulsion Rates: 2015-16
23(only districts with at least 20 students enrolled are included)
Elementary (PK-5) Middle (6-8) High (9-12)
% of Students Receiving at least one ISS, OSS, EXP
Highville Charter School District 16.72% Achievement First Hartford Academy Inc. District 43.86% Elm City College Preparatory School District 48.00%
Amistad Academy District 15.89% Amistad Academy District 39.05% Bridgeport Achievement First District 45.61%
Achievement First Hartford Academy Inc. District 15.63%Eastern Connecticut Regional Educational Service Center (EASTCONN)
36.36% Amistad Academy District 44.06%
Park City Prep Charter School District 14.14% Bridgeport Achievement First District 34.74% Waterbury School District 35.03%
Booker T. Washington Academy District 12.78% Great Oaks Charter School District 32.30% Unified School District #2 34.44%
New Beginnings Inc., Family Academy District 11.03% The Bridge Academy District 31.00% Windham School District 30.89%
Eastern Connecticut Regional Educational Service Center (EASTCONN)
10.34% Unified School District #2 30.43% Bridgeport School District 29.89%
Bridgeport Achievement First District 10.18% Trailblazers Academy District 30.40% New Britain School District 29.42%
New Beginnings Inc., Family Academy District 29.00% East Hartford School District 26.15%
Highville Charter School District 28.32% Highville Charter School District 26.00%
Windham School District 26.20% New London School District 25.90%
Waterbury School District 25.74% Area Cooperative Educational Services 24.82%
Hartford School District 24.82%Capital Preparatory Harbor School Inc. District
21.85%
Bloomfield School District 22.78% Bloomfield School District 21.69%
Bridgeport School District 21.73% Stamford Academy District 20.67%
Elm City College Preparatory School District 20.41% Capitol Region Education Council 20.33%
Derby School District 20.12% Windsor Locks School District 20.08%
Ansonia School District 19.52% Vernon School District 19.45%
New London School District 18.89% Danbury School District 18.97%
Park City Prep Charter School District 18.39% Hartford School District 18.92%

CONNECTICUT STATE DEPARTMENT OF EDUCATION
Suspension/Expulsion Rates by Race/Ethnicity
0%
5%
10%
15%
20%
25%
30%
35%
40%
45%
50%
StateAverage
AmericanIndian or
Alaska Native
Asian Black orAfrican
American
HispanicLatino of any
race
NativeHawaiian orOther Pacific
Islander
Two or MoreRaces
White
2011-12 2012-13 2013-14 2014-15 2015-16 24
CONNECTICUT STATE DEPARTMENT OF EDUCATION
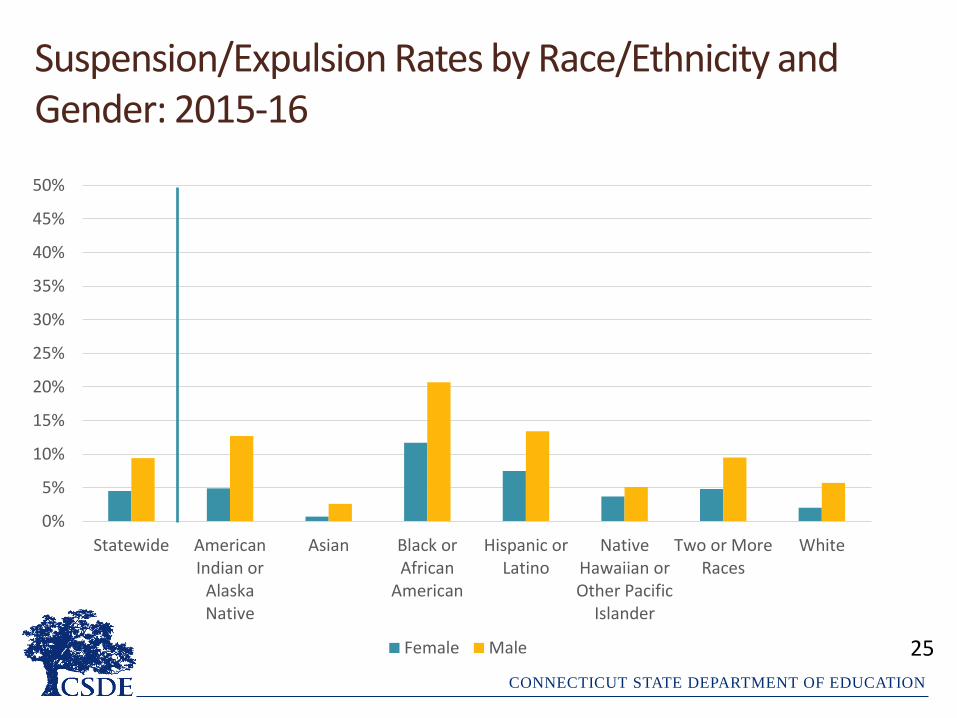
Suspension/Expulsion Rates by Race/Ethnicity and Gender: 2015-16
0%
5%
10%
15%
20%
25%
30%
35%
40%
45%
50%
Statewide AmericanIndian or
AlaskaNative
Asian Black orAfrican
American
Hispanic orLatino
NativeHawaiian orOther Pacific
Islander
Two or MoreRaces
White
Female Male 25
CONNECTICUT STATE DEPARTMENT OF EDUCATION
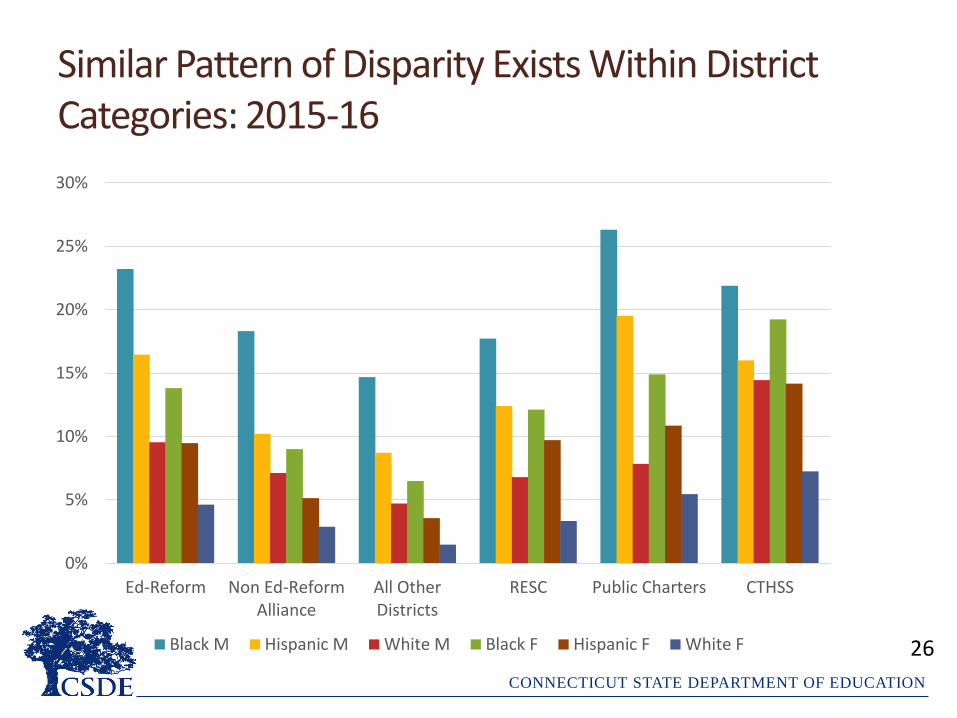
Similar Pattern of Disparity Exists Within District Categories: 2015-16
0%
5%
10%
15%
20%
25%
30%
Ed-Reform Non Ed-ReformAlliance
All OtherDistricts
RESC Public Charters CTHSS
Black M Hispanic M White M Black F Hispanic F White F 26

CONNECTICUT STATE DEPARTMENT OF EDUCATION
Observations
• Gender
• Suspension/expulsion rate for males is twice that of females.
• Similar disproportionality is evidenced in all racial/ethnic groups and within all district categories.
• Race/Ethnicity and Gender
• Suspension/expulsion rates for Black and Hispanic males are two to three times that of their White counterparts.
• Rate for Black females is approximately five times that of their White counterparts.
• Similar disproportionalities are evidenced in all district categories.
27
CONNECTICUT STATE DEPARTMENT OF EDUCATION
WHAT SANCTIONS ARE STUDENTS
RECEIVING?
28
CONNECTICUT STATE DEPARTMENT OF EDUCATION
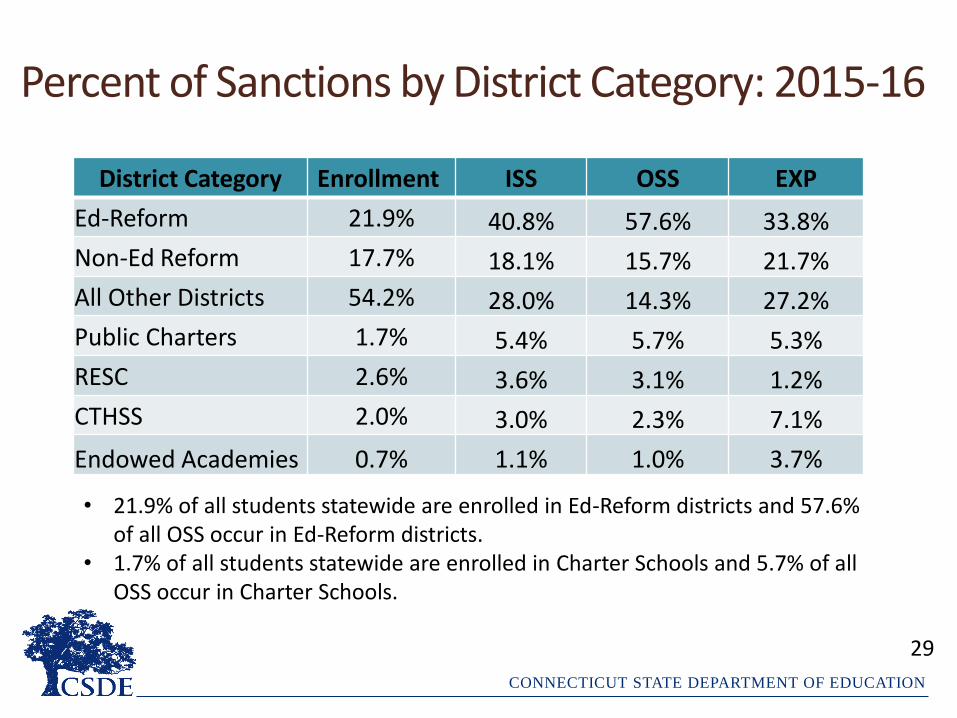
Percent of Sanctions by District Category: 2015-16
29
District Category Enrollment ISS OSS EXP
Ed-Reform 21.9% 40.8% 57.6% 33.8%
Non-Ed Reform 17.7% 18.1% 15.7% 21.7%
All Other Districts 54.2% 28.0% 14.3% 27.2%
Public Charters 1.7% 5.4% 5.7% 5.3%
RESC 2.6% 3.6% 3.1% 1.2%
CTHSS 2.0% 3.0% 2.3% 7.1%
Endowed Academies 0.7% 1.1% 1.0% 3.7%
• 21.9% of all students statewide are enrolled in Ed-Reform districts and 57.6% of all OSS occur in Ed-Reform districts.
• 1.7% of all students statewide are enrolled in Charter Schools and 5.7% of all OSS occur in Charter Schools.
CONNECTICUT STATE DEPARTMENT OF EDUCATION
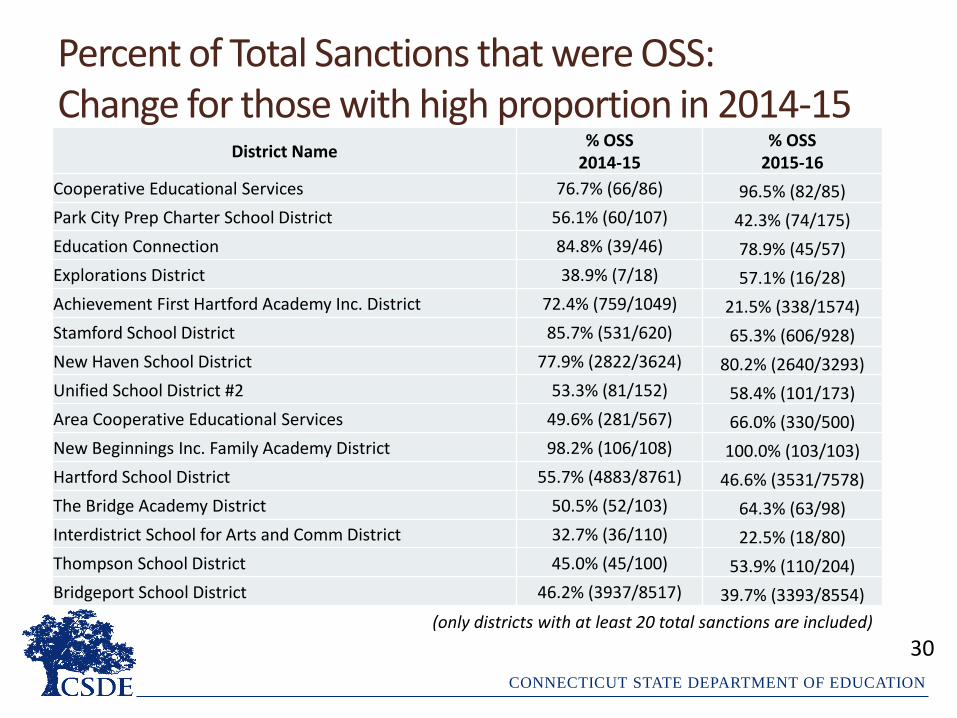
Percent of Total Sanctions that were OSS:Change for those with high proportion in 2014-15
30(only districts with at least 20 total sanctions are included)
District Name% OSS
2014-15% OSS
2015-16
Cooperative Educational Services 76.7% (66/86) 96.5% (82/85)
Park City Prep Charter School District 56.1% (60/107) 42.3% (74/175)
Education Connection 84.8% (39/46) 78.9% (45/57)
Explorations District 38.9% (7/18) 57.1% (16/28)
Achievement First Hartford Academy Inc. District 72.4% (759/1049) 21.5% (338/1574)
Stamford School District 85.7% (531/620) 65.3% (606/928)
New Haven School District 77.9% (2822/3624) 80.2% (2640/3293)
Unified School District #2 53.3% (81/152) 58.4% (101/173)
Area Cooperative Educational Services 49.6% (281/567) 66.0% (330/500)
New Beginnings Inc. Family Academy District 98.2% (106/108) 100.0% (103/103)
Hartford School District 55.7% (4883/8761) 46.6% (3531/7578)
The Bridge Academy District 50.5% (52/103) 64.3% (63/98)
Interdistrict School for Arts and Comm District 32.7% (36/110) 22.5% (18/80)
Thompson School District 45.0% (45/100) 53.9% (110/204)
Bridgeport School District 46.2% (3937/8517) 39.7% (3393/8554)
CONNECTICUT STATE DEPARTMENT OF EDUCATION
WHY ARE STUDENTS SUSPENDED OR
EXPELLED?
31
CONNECTICUT STATE DEPARTMENT OF EDUCATION
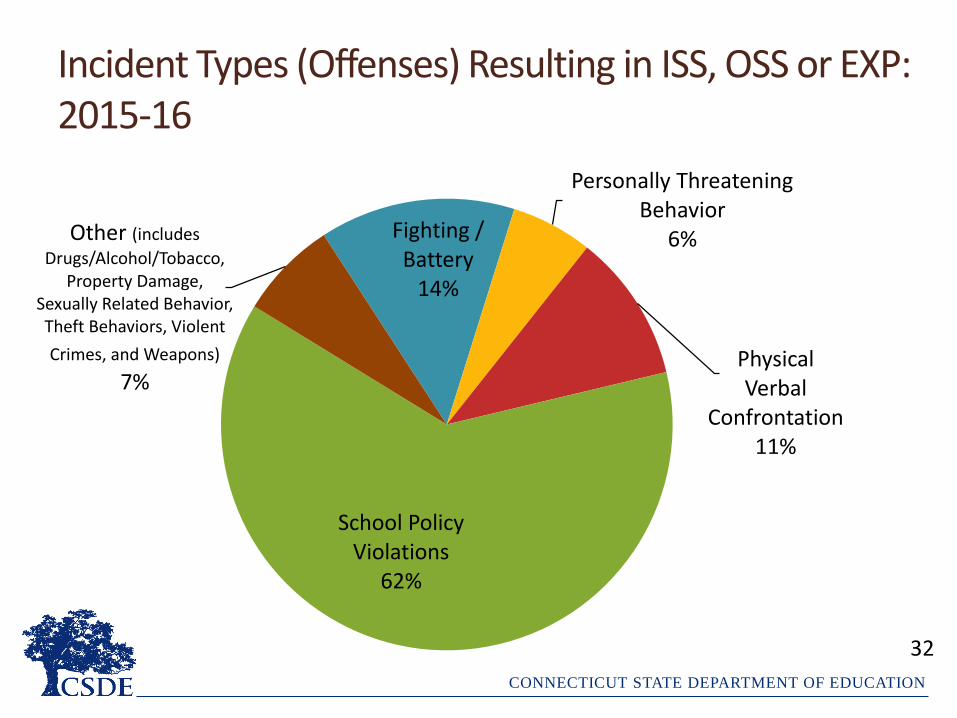
Incident Types (Offenses) Resulting in ISS, OSS or EXP: 2015-16
Fighting /Battery
14%
Personally Threatening Behavior
6%
PhysicalVerbal
Confrontation11%
School Policy Violations
62%
Other (includes
Drugs/Alcohol/Tobacco, Property Damage,
Sexually Related Behavior, Theft Behaviors, Violent
Crimes, and Weapons)
7%
32

CONNECTICUT STATE DEPARTMENT OF EDUCATION
Incident Types (Offenses) Resulting in ISS, OSS, EXP by District Category: 2015-16
0%
10%
20%
30%
40%
50%
60%
70%
80%
90%
100%
Ed-Reform Non Ed-ReformAlliance
All OtherDistricts
RESC Public Charters EndowedAcademies
CT TechnicalHigh Schools
School Policy Violations Fighting /Battery
Personally Threatening Behavior PhysicalVerbal Confrontation
Other
33
CONNECTICUT STATE DEPARTMENT OF EDUCATION
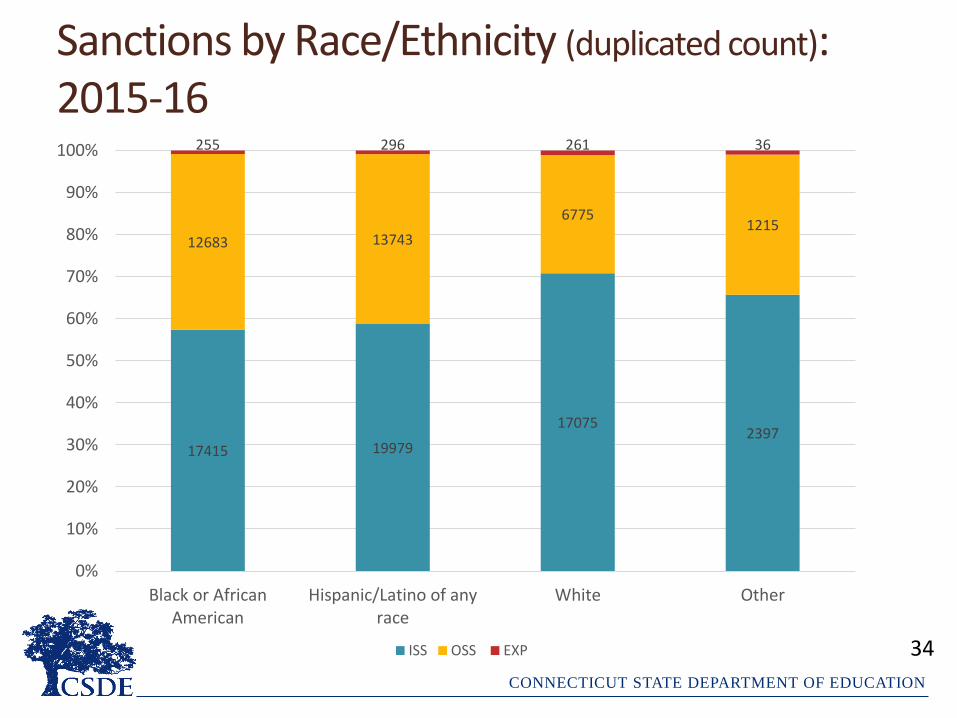
Sanctions by Race/Ethnicity (duplicated count): 2015-16
34
17415 19979
170752397
12683 13743
67751215
255 296 261 36
0%
10%
20%
30%
40%
50%
60%
70%
80%
90%
100%
Black or AfricanAmerican
Hispanic/Latino of anyrace
White Other
ISS OSS EXP

CONNECTICUT STATE DEPARTMENT OF EDUCATION
School Policy Violations by Race/Ethnicity (duplicated count): 2015-16
35
12580 1548112159 1721
4927 63692924 464
19 23 23 4
0%
10%
20%
30%
40%
50%
60%
70%
80%
90%
100%
Black or AfricanAmerican
Hispanic/Latino of anyrace
White Other
ISS OSS EXP
CONNECTICUT STATE DEPARTMENT OF EDUCATION
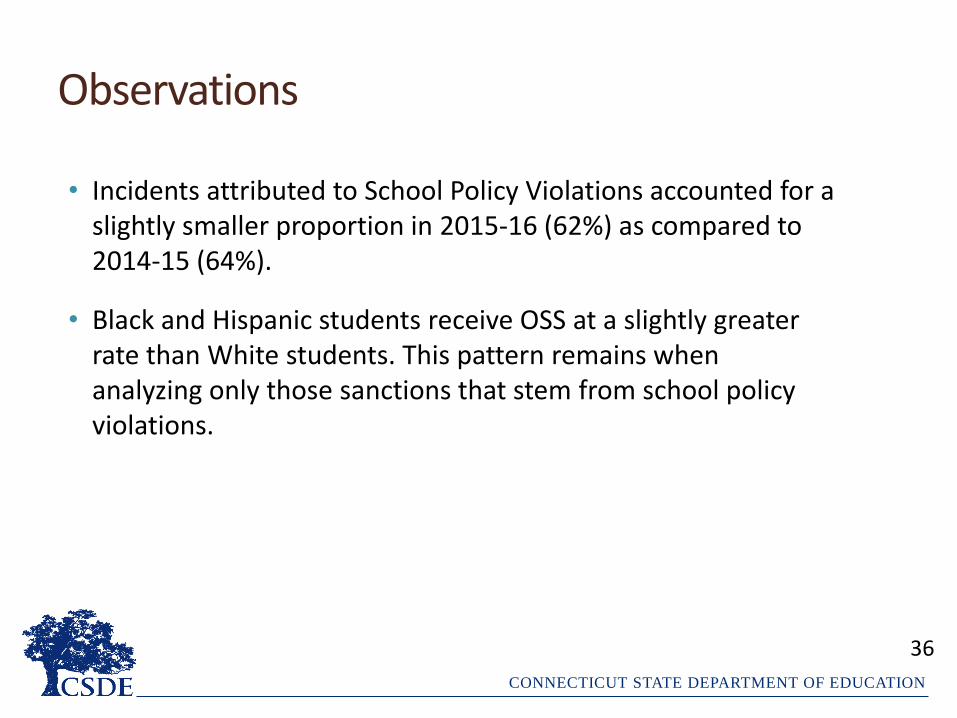
Observations
• Incidents attributed to School Policy Violations accounted for a slightly smaller proportion in 2015-16 (62%) as compared to 2014-15 (64%).
• Black and Hispanic students receive OSS at a slightly greater rate than White students. This pattern remains when analyzing only those sanctions that stem from school policy violations.
36
CONNECTICUT STATE DEPARTMENT OF EDUCATION
HOW LONG DO SUSPENSIONS AND
EXPULSIONS LAST?
37
CONNECTICUT STATE DEPARTMENT OF EDUCATION
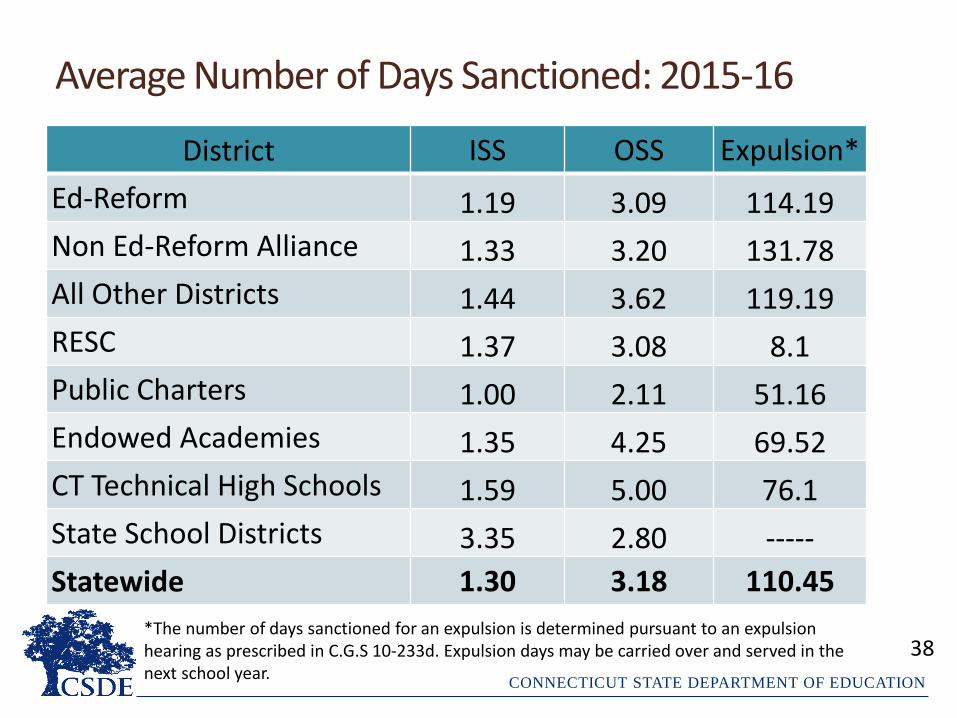
Average Number of Days Sanctioned: 2015-16
District ISS OSS Expulsion*
Ed-Reform 1.19 3.09 114.19
Non Ed-Reform Alliance 1.33 3.20 131.78
All Other Districts 1.44 3.62 119.19
RESC 1.37 3.08 8.1
Public Charters 1.00 2.11 51.16
Endowed Academies 1.35 4.25 69.52
CT Technical High Schools 1.59 5.00 76.1
State School Districts 3.35 2.80 -----
Statewide 1.30 3.18 110.45
38*The number of days sanctioned for an expulsion is determined pursuant to an expulsion hearing as prescribed in C.G.S 10-233d. Expulsion days may be carried over and served in the next school year.
CONNECTICUT STATE DEPARTMENT OF EDUCATION
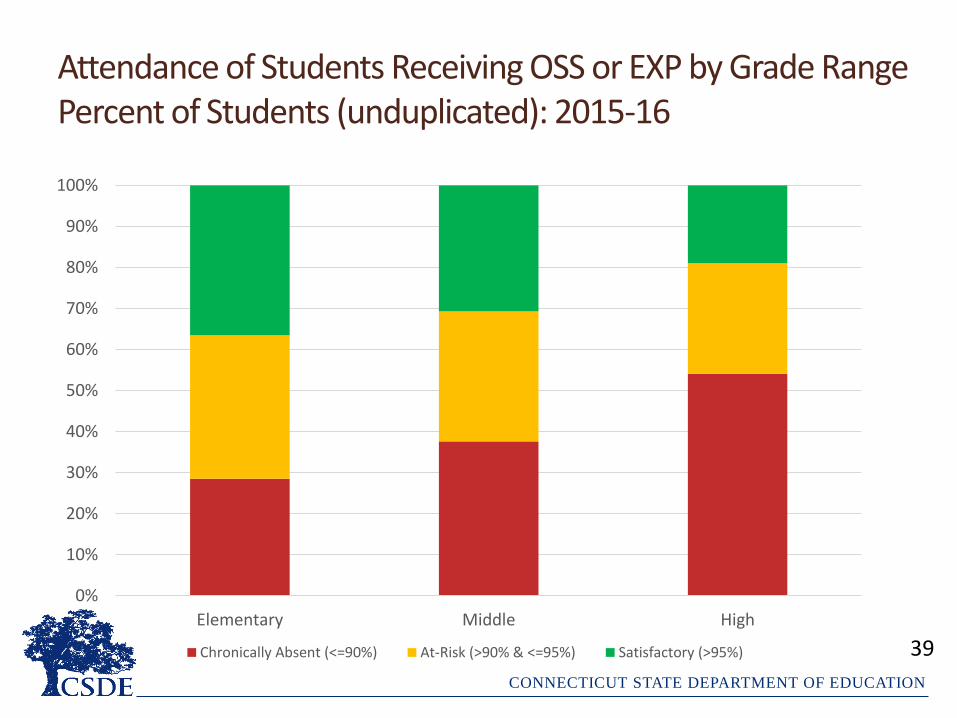
Attendance of Students Receiving OSS or EXP by Grade RangePercent of Students (unduplicated): 2015-16
0%
10%
20%
30%
40%
50%
60%
70%
80%
90%
100%
Elementary Middle High
Chronically Absent (<=90%) At-Risk (>90% & <=95%) Satisfactory (>95%) 39
CONNECTICUT STATE DEPARTMENT OF EDUCATION
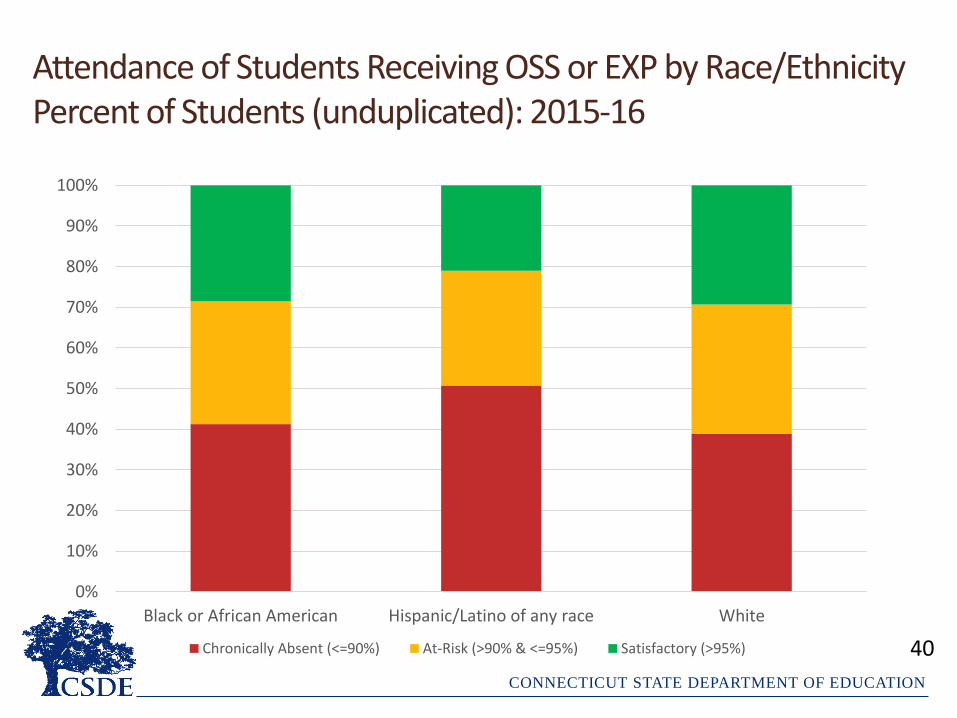
Attendance of Students Receiving OSS or EXP by Race/Ethnicity Percent of Students (unduplicated): 2015-16
0%
10%
20%
30%
40%
50%
60%
70%
80%
90%
100%
Black or African American Hispanic/Latino of any race White
Chronically Absent (<=90%) At-Risk (>90% & <=95%) Satisfactory (>95%) 40

CONNECTICUT STATE DEPARTMENT OF EDUCATION
Attendance of Students Receiving OSS or EXP by District Type Percent of Students (unduplicated): 2015-16
41
0%
10%
20%
30%
40%
50%
60%
70%
80%
90%
100%
Ed-Reform Non Ed-ReformAlliance
All OtherDistricts
RESC PublicCharters
EndowedAcademies
CTTechnical
HighSchools
StateSchool
Districts
Chronically Absent (<=90%) At-Risk (>90% & <=95%) Satisfactory (> 95%)
CONNECTICUT STATE DEPARTMENT OF EDUCATION
Observations
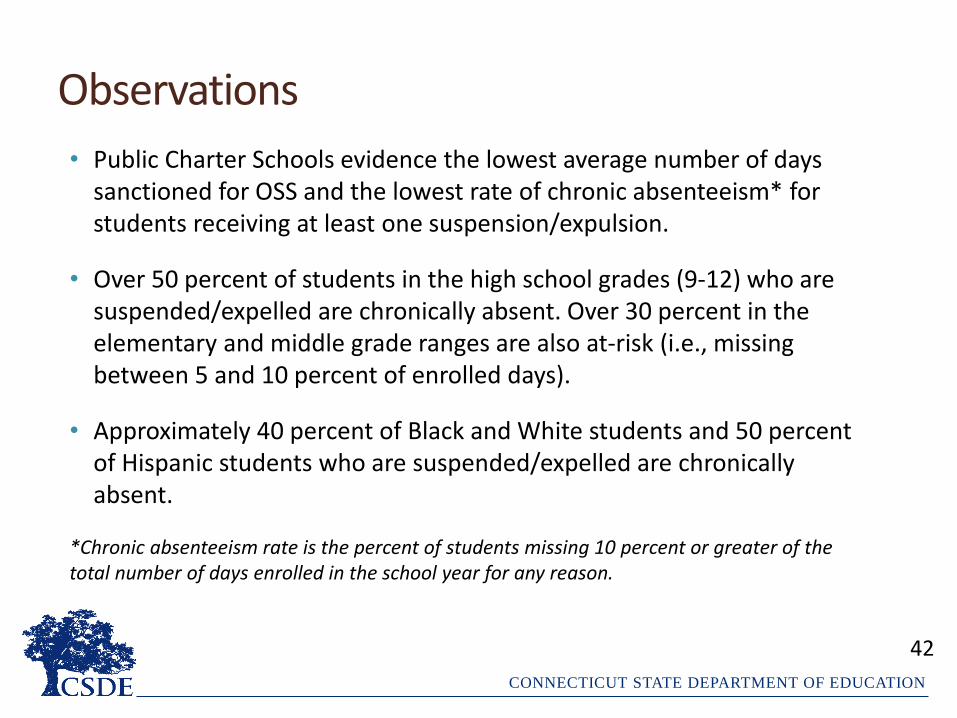
• Public Charter Schools evidence the lowest average number of days sanctioned for OSS and the lowest rate of chronic absenteeism* for students receiving at least one suspension/expulsion.
• Over 50 percent of students in the high school grades (9-12) who are suspended/expelled are chronically absent. Over 30 percent in the elementary and middle grade ranges are also at-risk (i.e., missing between 5 and 10 percent of enrolled days).
• Approximately 40 percent of Black and White students and 50 percent of Hispanic students who are suspended/expelled are chronically absent.
*Chronic absenteeism rate is the percent of students missing 10 percent or greater of the total number of days enrolled in the school year for any reason.
42
CONNECTICUT STATE DEPARTMENT OF EDUCATION
WHAT IS THE RELATIONSHIP TO STUDENT
PERFORMANCE?
43
CONNECTICUT STATE DEPARTMENT OF EDUCATION
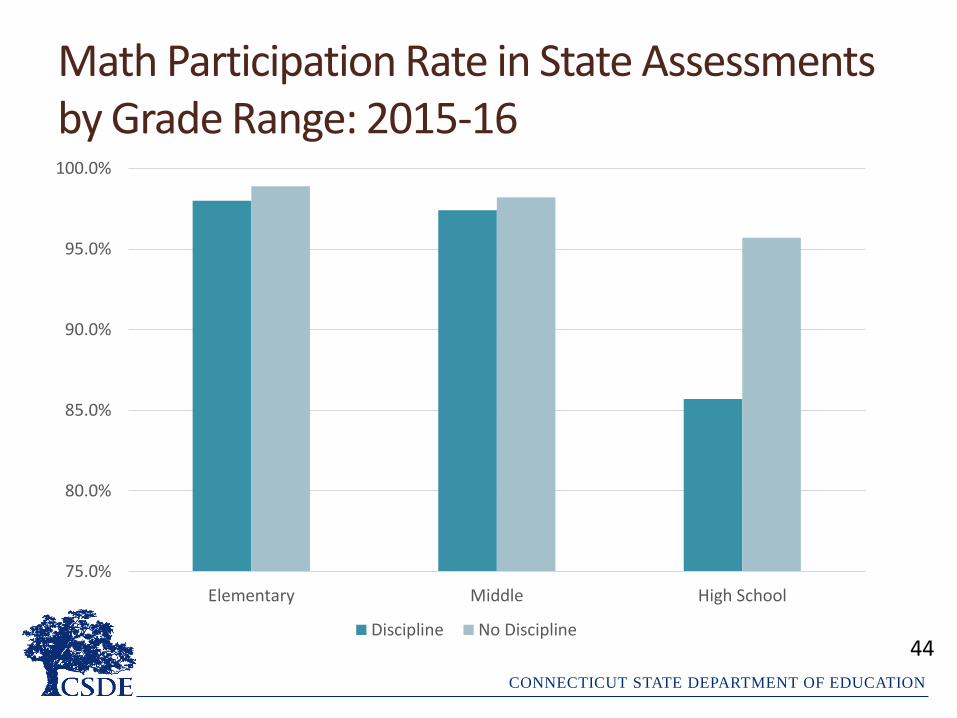
Math Participation Rate in State Assessments by Grade Range: 2015-16
44
75.0%
80.0%
85.0%
90.0%
95.0%
100.0%
Elementary Middle High School
Discipline No Discipline

CONNECTICUT STATE DEPARTMENT OF EDUCATION
ELA Participation Rate in State Assessments by Grade Range: 2015-16
45
75.0%
80.0%
85.0%
90.0%
95.0%
100.0%
Elementary Middle High School
Discipline No Discipline
CONNECTICUT STATE DEPARTMENT OF EDUCATION
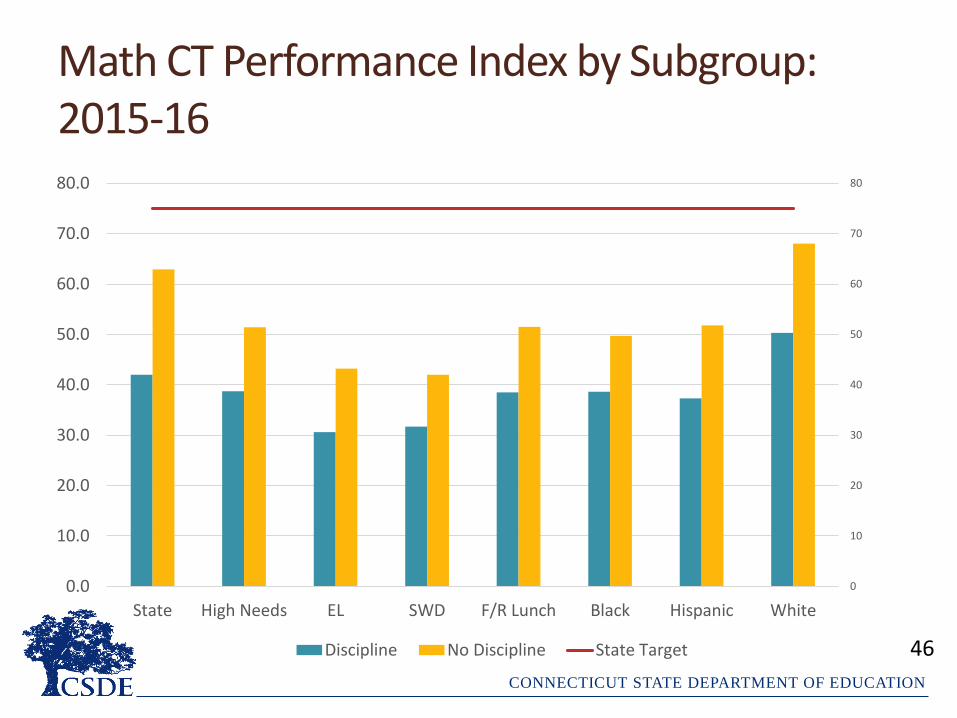
Math CT Performance Index by Subgroup: 2015-16
46
0
10
20
30
40
50
60
70
80
0.0
10.0
20.0
30.0
40.0
50.0
60.0
70.0
80.0
State High Needs EL SWD F/R Lunch Black Hispanic White
Discipline No Discipline State Target
CONNECTICUT STATE DEPARTMENT OF EDUCATION
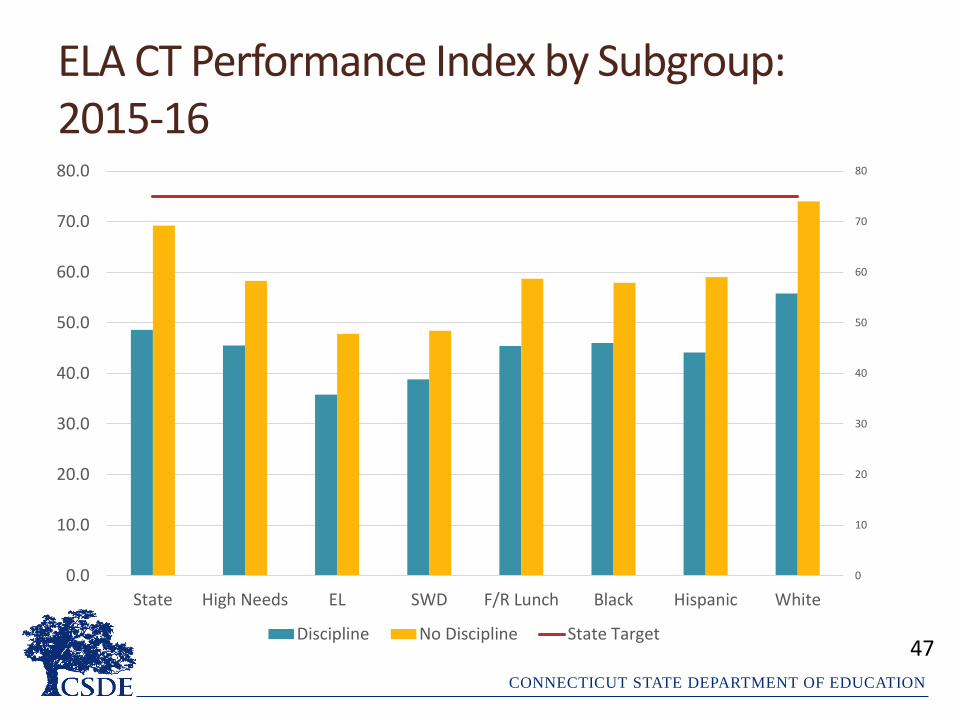
ELA CT Performance Index by Subgroup: 2015-16
47
0
10
20
30
40
50
60
70
80
0.0
10.0
20.0
30.0
40.0
50.0
60.0
70.0
80.0
State High Needs EL SWD F/R Lunch Black Hispanic White
Discipline No Discipline State Target
CONNECTICUT STATE DEPARTMENT OF EDUCATION
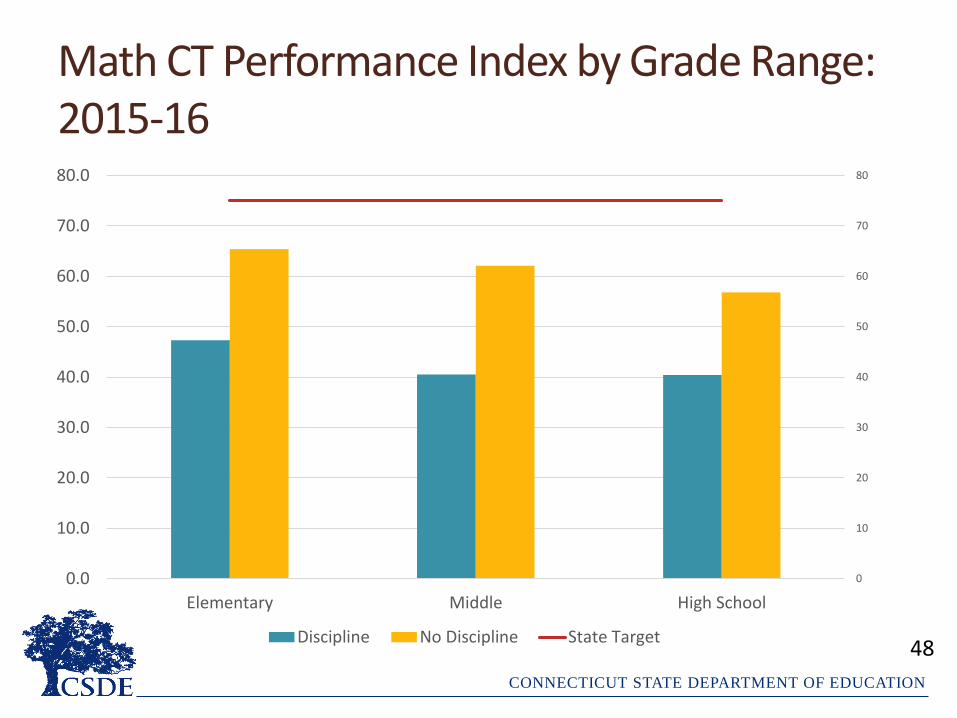
Math CT Performance Index by Grade Range: 2015-16
48
0
10
20
30
40
50
60
70
80
0.0
10.0
20.0
30.0
40.0
50.0
60.0
70.0
80.0
Elementary Middle High School
Discipline No Discipline State Target
CONNECTICUT STATE DEPARTMENT OF EDUCATION
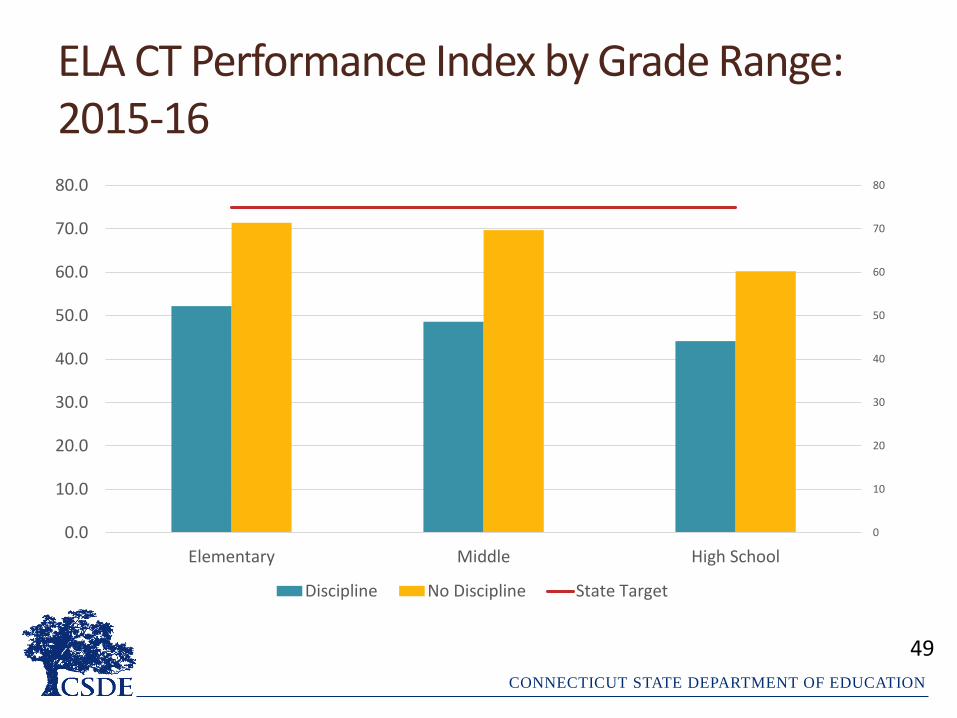
ELA CT Performance Index by Grade Range: 2015-16
0
10
20
30
40
50
60
70
80
0.0
10.0
20.0
30.0
40.0
50.0
60.0
70.0
80.0
Elementary Middle High School
Discipline No Discipline State Target
49
CONNECTICUT STATE DEPARTMENT OF EDUCATION
Observations
• There are substantial differences in participation rates between students receiving at least one “Discipline” sanction and students receiving “No Discipline” in high school.
• There are also substantial differences in academic achievement in both ELA and Mathematics; in general, students receiving at least one “Discipline” sanction achieve substantially lower (approximately 20 index points lower) than their “No Discipline” peers.
50

CONNECTICUT STATE DEPARTMENT OF EDUCATION
Total Number of School-Based Arrests (All Grades)
0
500
1,000
1,500
2,000
2,500
2012-13 2013-14 2014-15 2015-16
51
CONNECTICUT STATE DEPARTMENT OF EDUCATION
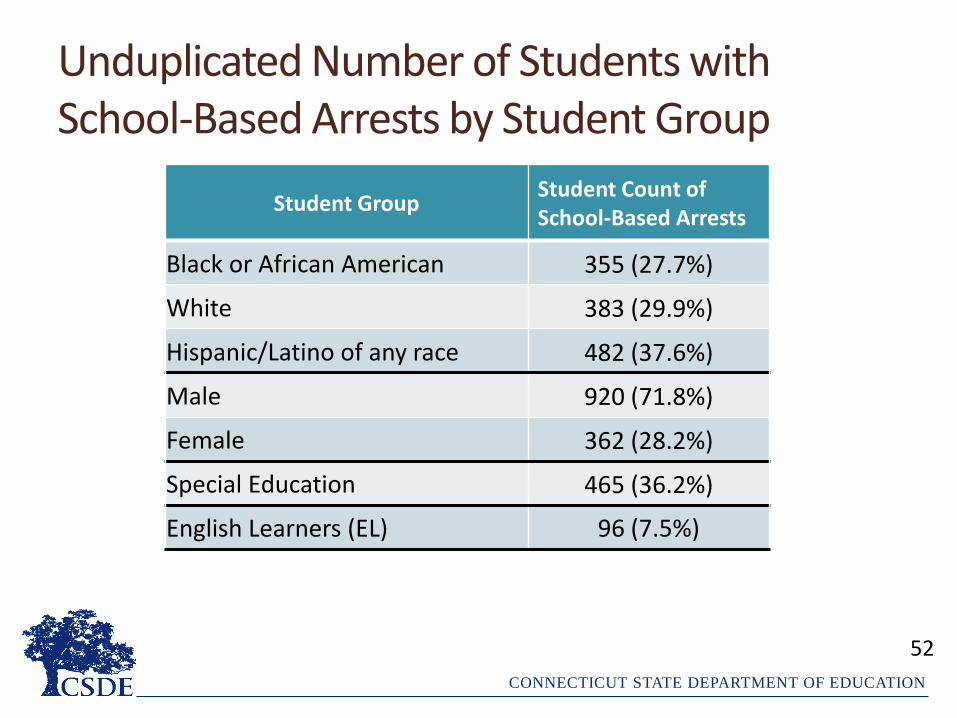
Unduplicated Number of Students with School-Based Arrests by Student Group
52
Student GroupStudent Count of School-Based Arrests
Black or African American 355 (27.7%)
White 383 (29.9%)
Hispanic/Latino of any race 482 (37.6%)
Male 920 (71.8%)
Female 362 (28.2%)
Special Education 465 (36.2%)
English Learners (EL) 96 (7.5%)
CONNECTICUT STATE DEPARTMENT OF EDUCATION
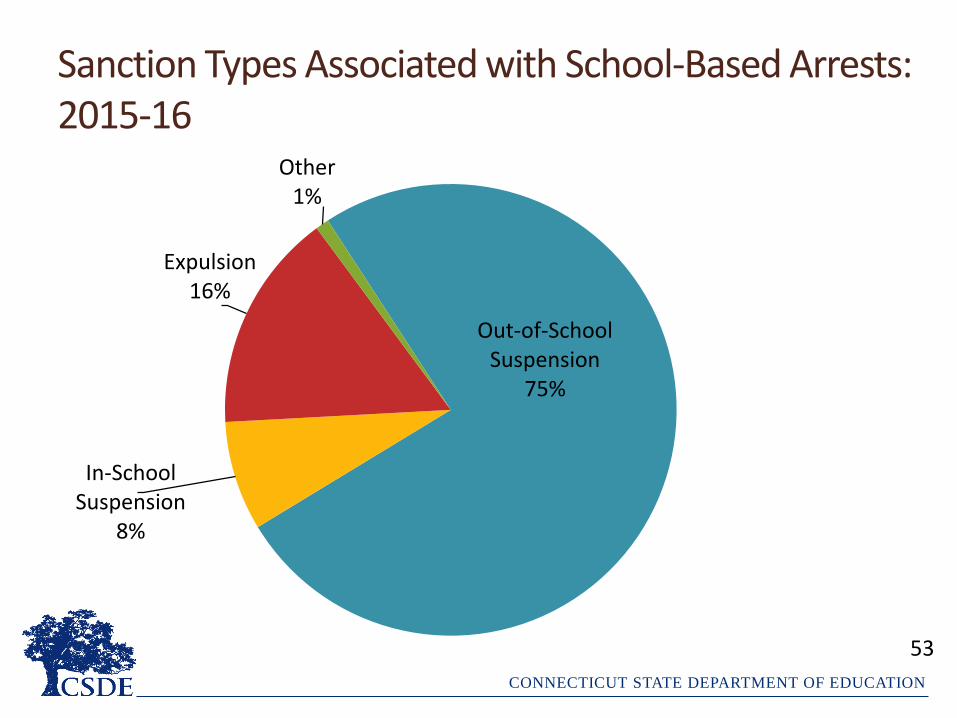
Sanction Types Associated with School-Based Arrests: 2015-16
Out-of-School Suspension
75%
In-School Suspension
8%
Expulsion16%
Other1%
53
CONNECTICUT STATE DEPARTMENT OF EDUCATION
SPOTLIGHT ON THE YOUNGEST CHILDREN(GRADES PK-2)
54
CONNECTICUT STATE DEPARTMENT OF EDUCATION
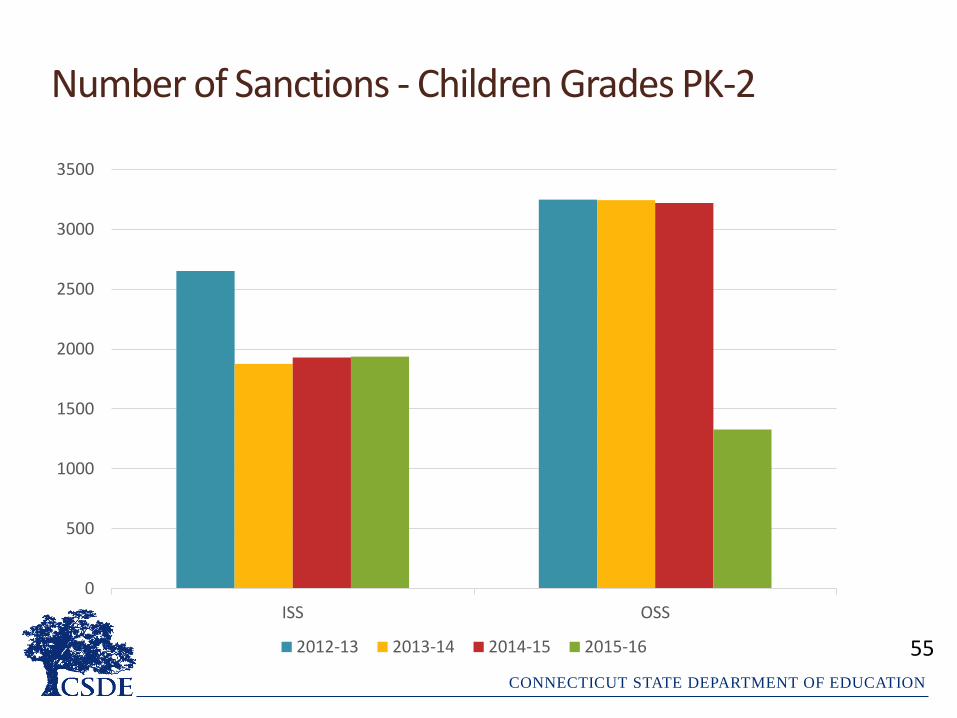
Number of Sanctions - Children Grades PK-2
0
500
1000
1500
2000
2500
3000
3500
ISS OSS
2012-13 2013-14 2014-15 2015-16 55
CONNECTICUT STATE DEPARTMENT OF EDUCATION
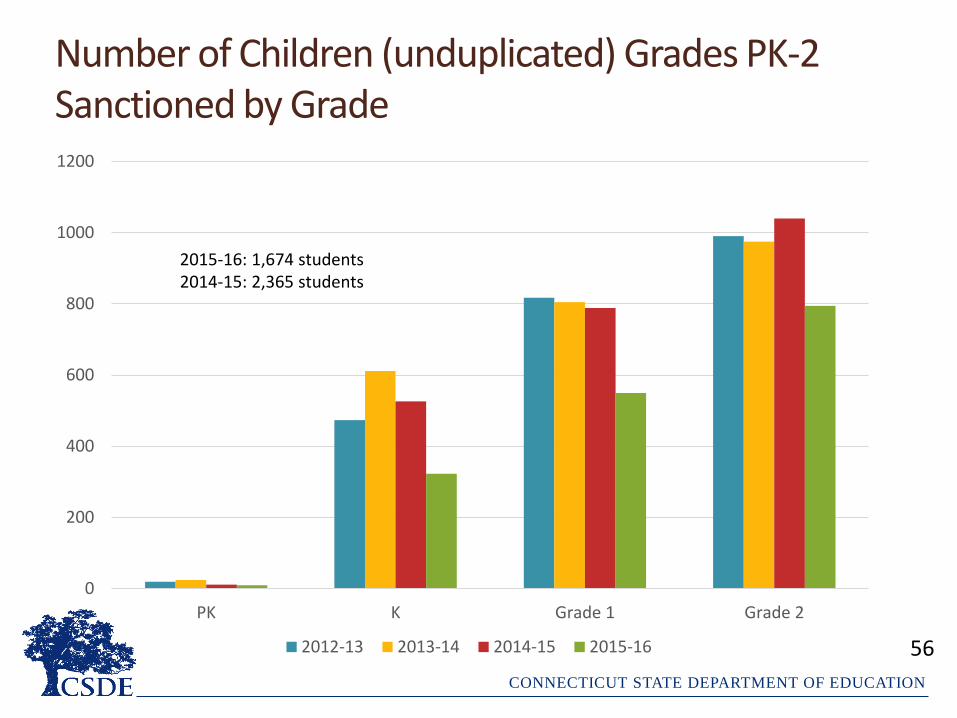
Number of Children (unduplicated) Grades PK-2 Sanctioned by Grade
0
200
400
600
800
1000
1200
PK K Grade 1 Grade 2
2012-13 2013-14 2014-15 2015-16
2015-16: 1,674 students2014-15: 2,365 students
56
CONNECTICUT STATE DEPARTMENT OF EDUCATION
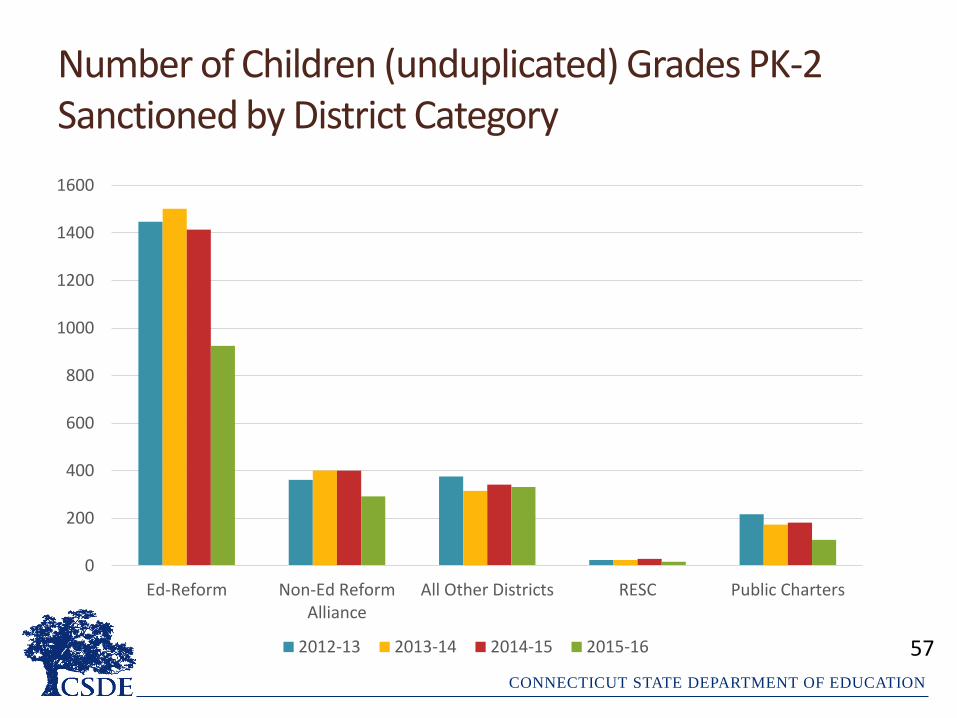
Number of Children (unduplicated) Grades PK-2 Sanctioned by District Category
0
200
400
600
800
1000
1200
1400
1600
Ed-Reform Non-Ed ReformAlliance
All Other Districts RESC Public Charters
2012-13 2013-14 2014-15 2015-16 57

CONNECTICUT STATE DEPARTMENT OF EDUCATION
Number of Children (unduplicated) Grades PK-2 Sanctioned by Race/Ethnicity and Gender
0
100
200
300
400
500
600
700
800
Black White Hispanic
2012-13 Male 2013-14 Male 2014-15 Male2015-16 Male 2012-13 Female 2013-14 Female2014-15 Female 2015-16 Female
58
CONNECTICUT STATE DEPARTMENT OF EDUCATION
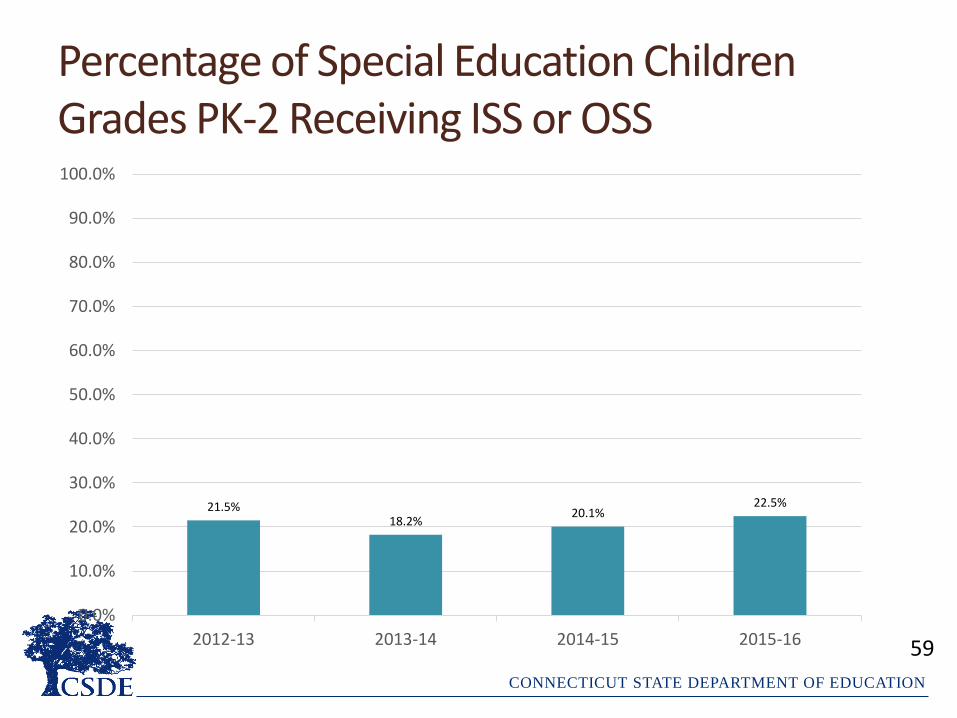
Percentage of Special Education Children Grades PK-2 Receiving ISS or OSS
21.5%18.2%
20.1%22.5%
0.0%
10.0%
20.0%
30.0%
40.0%
50.0%
60.0%
70.0%
80.0%
90.0%
100.0%
2012-13 2013-14 2014-15 2015-16 59
CONNECTICUT STATE DEPARTMENT OF EDUCATION
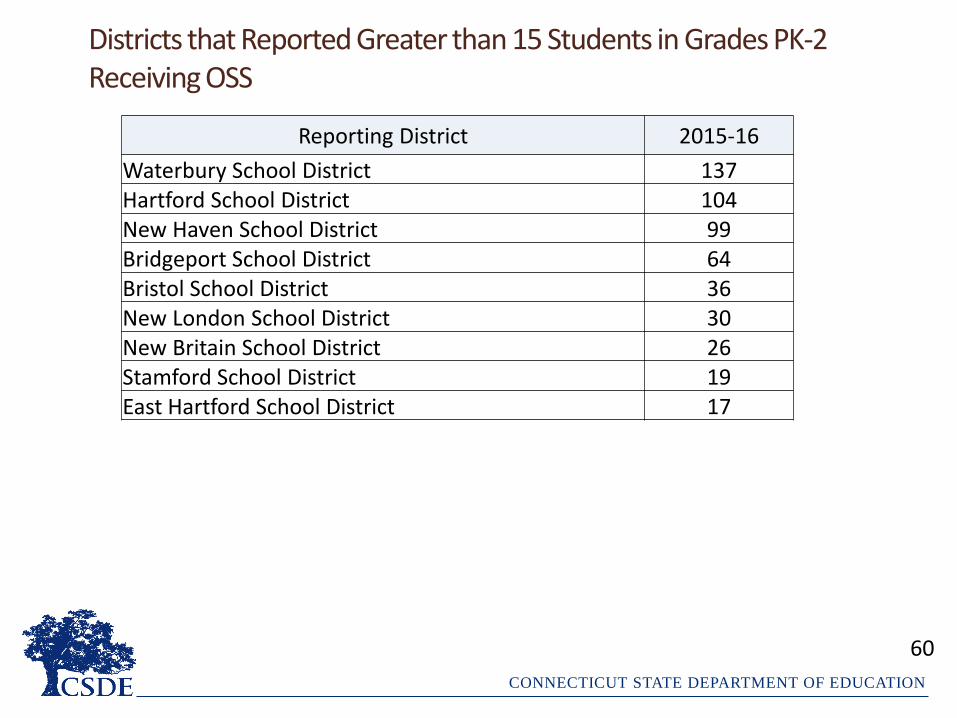
Districts that Reported Greater than 15 Students in Grades PK-2 Receiving OSS
60
Reporting District 2015-16
Waterbury School District 137Hartford School District 104New Haven School District 99Bridgeport School District 64Bristol School District 36New London School District 30New Britain School District 26Stamford School District 19East Hartford School District 17
CONNECTICUT STATE DEPARTMENT OF EDUCATION
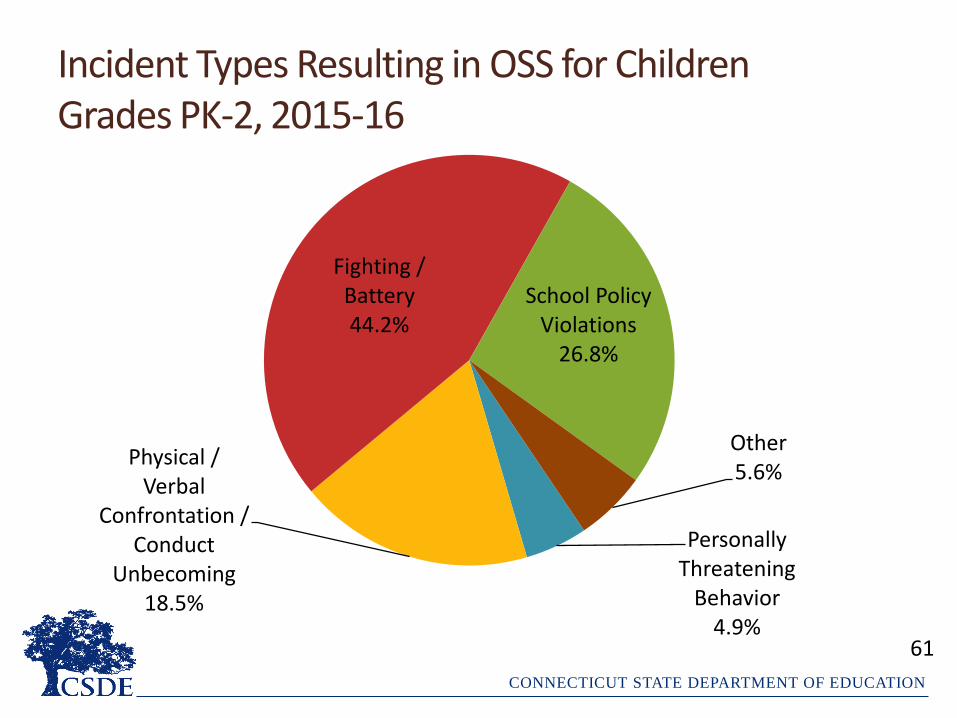
Incident Types Resulting in OSS for Children Grades PK-2, 2015-16
Personally Threatening
Behavior4.9%
Physical / Verbal
Confrontation / Conduct
Unbecoming18.5%
Fighting / Battery44.2%
School Policy Violations
26.8%
Other5.6%
61
CONNECTICUT STATE DEPARTMENT OF EDUCATION
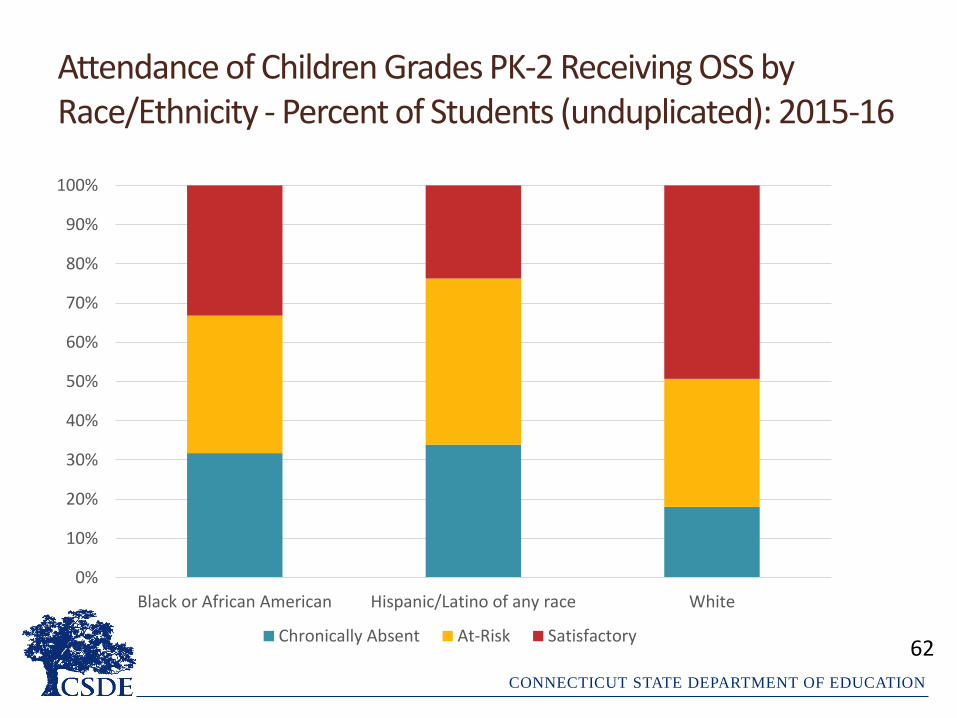
Attendance of Children Grades PK-2 Receiving OSS by Race/Ethnicity - Percent of Students (unduplicated): 2015-16
0%
10%
20%
30%
40%
50%
60%
70%
80%
90%
100%
Black or African American Hispanic/Latino of any race White
Chronically Absent At-Risk Satisfactory62
CONNECTICUT STATE DEPARTMENT OF EDUCATION
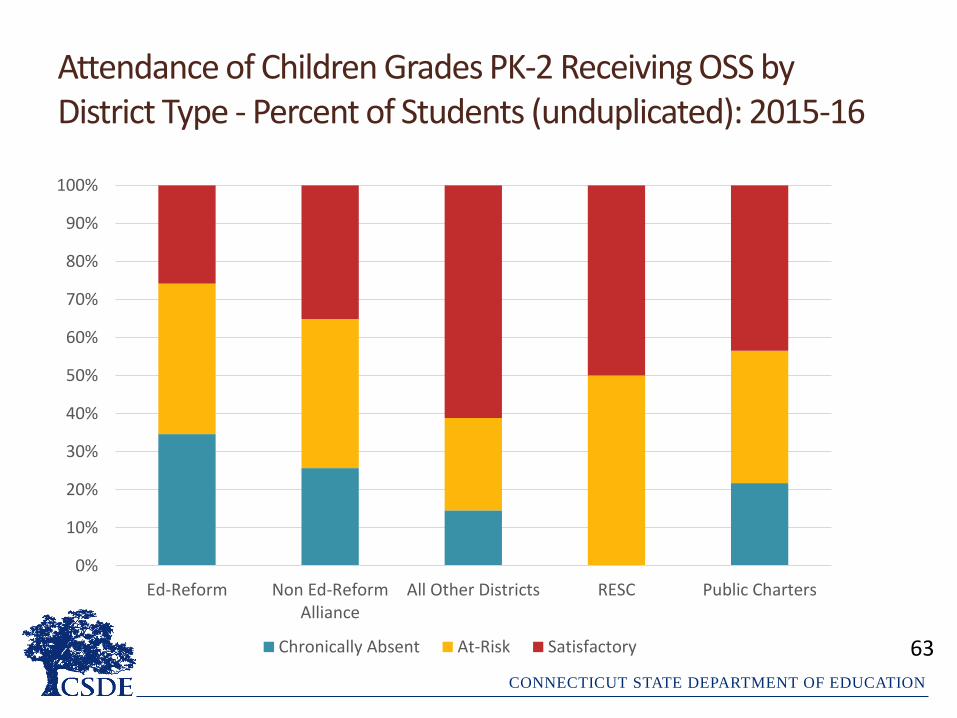
Attendance of Children Grades PK-2 Receiving OSS by District Type - Percent of Students (unduplicated): 2015-16
63
0%
10%
20%
30%
40%
50%
60%
70%
80%
90%
100%
Ed-Reform Non Ed-ReformAlliance
All Other Districts RESC Public Charters
Chronically Absent At-Risk Satisfactory

CONNECTICUT STATE DEPARTMENT OF EDUCATION
Observations
• Pursuant to the passage of Public Act 15-168, the number of students in PK-2 receiving an OSS declined dramatically.
• The total number of students receiving at least one ISS, OSS, or EXP declined substantially from 2,365 students in 2014-15 to 1,674 students in 2015-16.
• Of the 1,674 students who were suspended in 2015-16, 1,198 (71.6%) were Black or Hispanic, 979 (58.5%) were Black or Hispanic boys, and 925 (55.3%) occurred in the 10 Education Reform districts.
• Of the children PK-2 who received at least one ISS or OSS, Black and Hispanic students were more likely to be chronically absent than White students.
64
CONNECTICUT STATE DEPARTMENT OF EDUCATION
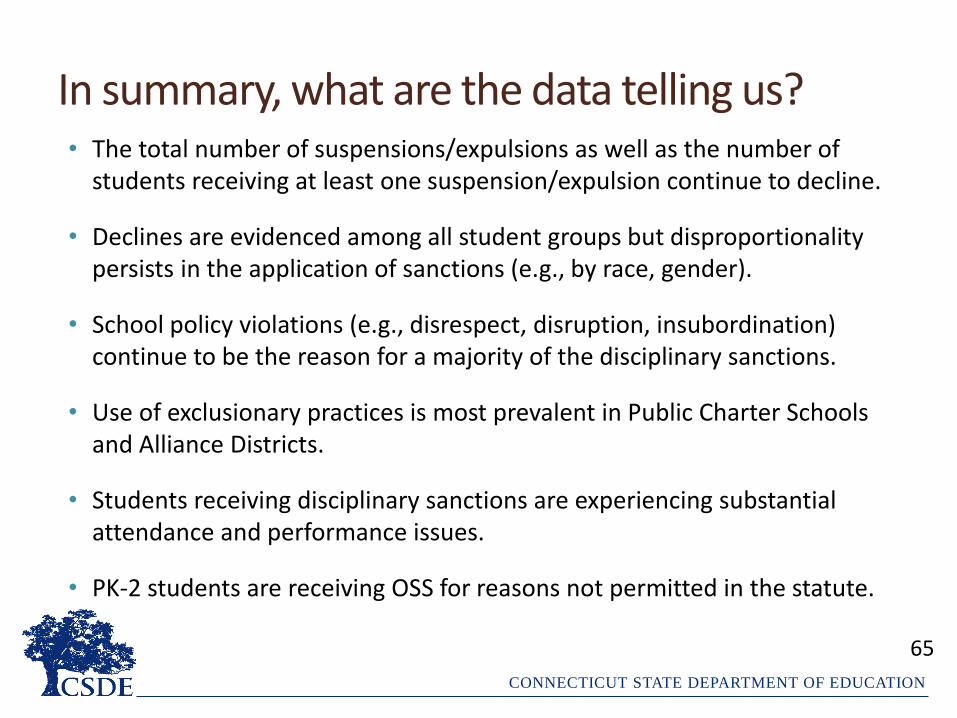
In summary, what are the data telling us?• The total number of suspensions/expulsions as well as the number of
students receiving at least one suspension/expulsion continue to decline.
• Declines are evidenced among all student groups but disproportionality persists in the application of sanctions (e.g., by race, gender).
• School policy violations (e.g., disrespect, disruption, insubordination) continue to be the reason for a majority of the disciplinary sanctions.
• Use of exclusionary practices is most prevalent in Public Charter Schools and Alliance Districts.
• Students receiving disciplinary sanctions are experiencing substantial attendance and performance issues.
• PK-2 students are receiving OSS for reasons not permitted in the statute.
65

CONNECTICUT STATE DEPARTMENT OF EDUCATION
Data Informed Actions
66
Using a systems approach to drive policy and practice
CONNECTICUT STATE DEPARTMENT OF EDUCATIONCONNECTICUT STATE DEPARTMENT OF EDUCATION
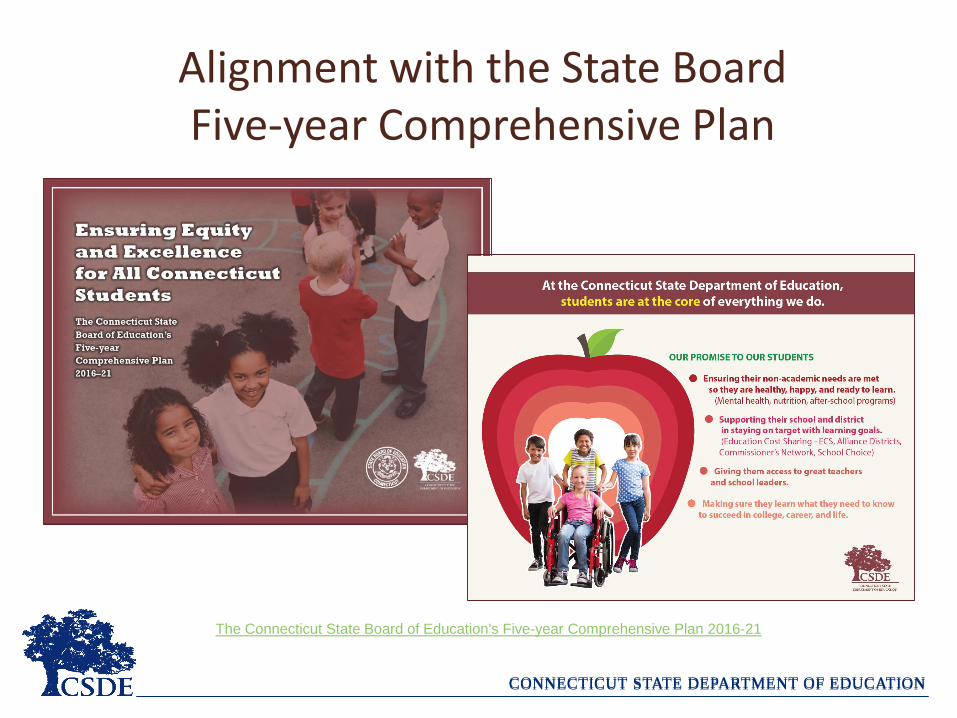
The Connecticut State Board of Education's Five-year Comprehensive Plan 2016-21
Alignment with the State Board Five-year Comprehensive Plan

CONNECTICUT STATE DEPARTMENT OF EDUCATION
68
Ensuring Equity and Excellence for All Connecticut Students
• “Declines are evidenced among all student groups but disproportionality persists in the application of sanctions (e.g., by race, gender)”• Culturally Responsive
Professional Learning
• Trauma Informed Practices and Cross-sector Systems Development
• Community-Based Supports for Behavioral Health
• Juvenile Justice
• Pre-K – Grade 2 Suspensions
• “School policy violations (e.g., disrespect, disruption, insubordination) continue to be the reason for a majority of the disciplinary sanctions.”• Restorative Practices
Professional Learning
• Positive School Climate Development
• Social-Emotional Learning Practices
• School-based Diversion Initiative
• Pre-K – Grade 2 Suspensions
CONNECTICUT STATE DEPARTMENT OF EDUCATION
69
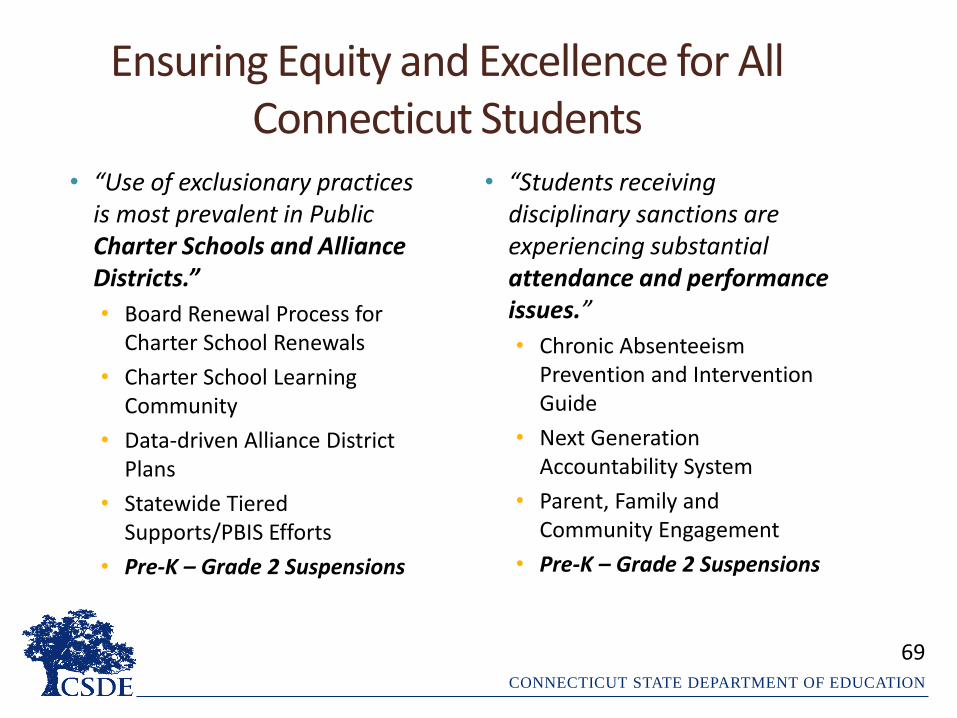
Ensuring Equity and Excellence for All Connecticut Students
• “Use of exclusionary practices is most prevalent in Public Charter Schools and Alliance Districts.”
• Board Renewal Process for Charter School Renewals
• Charter School Learning Community
• Data-driven Alliance District Plans
• Statewide Tiered Supports/PBIS Efforts
• Pre-K – Grade 2 Suspensions
• “Students receiving disciplinary sanctions are experiencing substantial attendance and performance issues.”
• Chronic Absenteeism Prevention and Intervention Guide
• Next Generation Accountability System
• Parent, Family and Community Engagement
• Pre-K – Grade 2 Suspensions
CONNECTICUT STATE DEPARTMENT OF EDUCATION
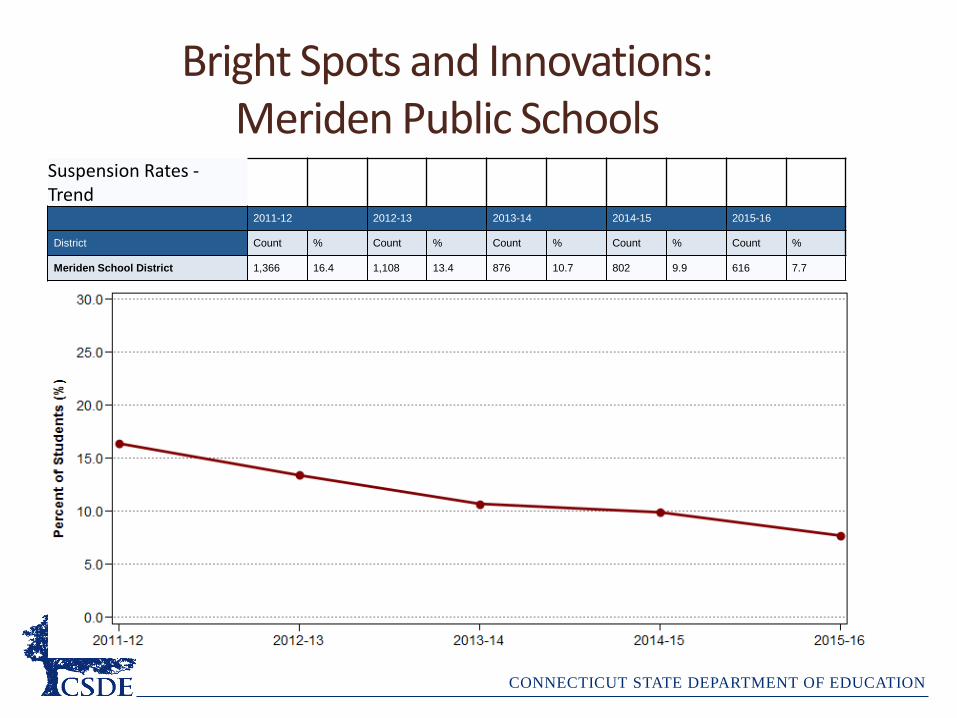
Bright Spots and Innovations:Meriden Public Schools
70
Suspension Rates -Trend
2011-12 2012-13 2013-14 2014-15 2015-16
District Count % Count % Count % Count % Count %
Meriden School District 1,366 16.4 1,108 13.4 876 10.7 802 9.9 616 7.7