Embed Size (px)
Citation preview
10/07/2010
1
Gayle Gayle PrestPrest
Sustainability Director, City of Minneapolis
Oversees City’s Sustainability Initiative
D l t f E i t l P li R l ti Development of Environmental Policy, Regulations, and Performance Measures with special emphasis on Climate Change and Renewable Energy
Previously managed Environmental Regulatory section in Public Works
Environmental policy and Communication Issuesp y
Sustainability – A Look atWhat Minneapolis is Doing
Gayle Prest
Sustainability DirectorCity of Minneapolis
September 2010
22
September 2010
10/07/2010
2
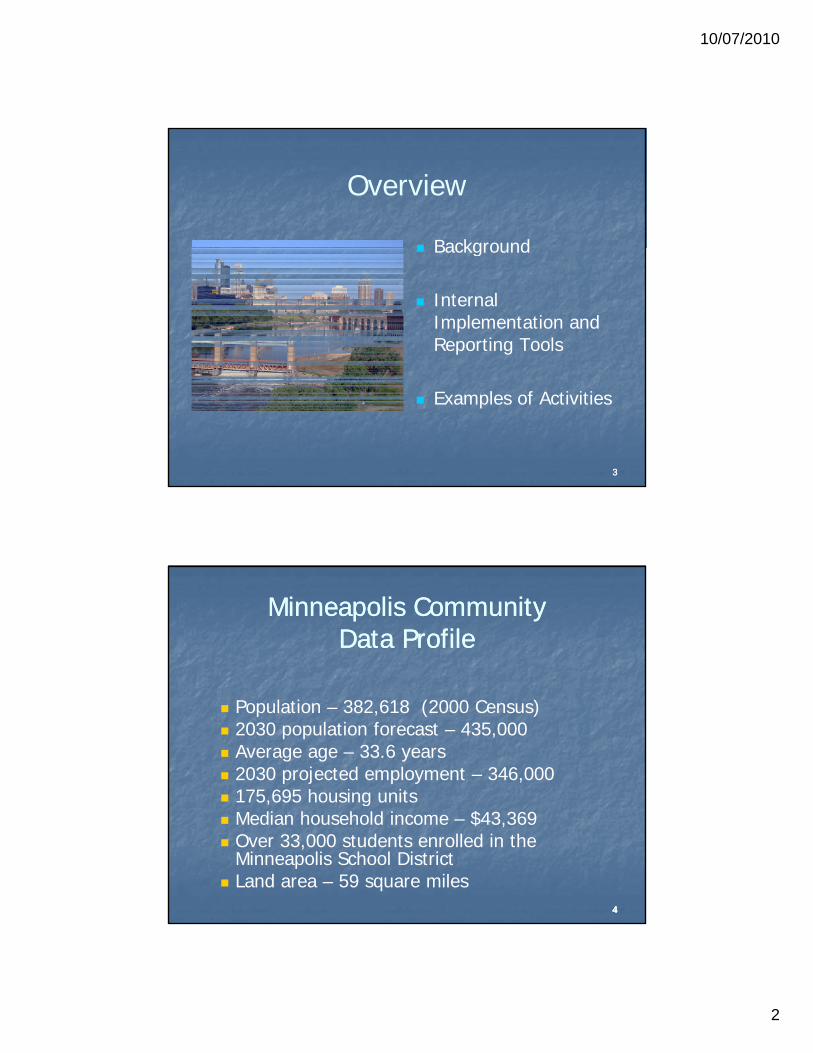
Overview
Background Background
Internal Implementation and Reporting Tools
33
Examples of Activities
Minneapolis Community Minneapolis Community Data ProfileData Profile
Population – 382,618 (2000 Census) 2030 population forecast – 435,000 Average age – 33.6 years 2030 projected employment – 346,000 175,695 housing units
4444
, g Median household income – $43,369 Over 33,000 students enrolled in the
Minneapolis School District Land area – 59 square miles
10/07/2010
3
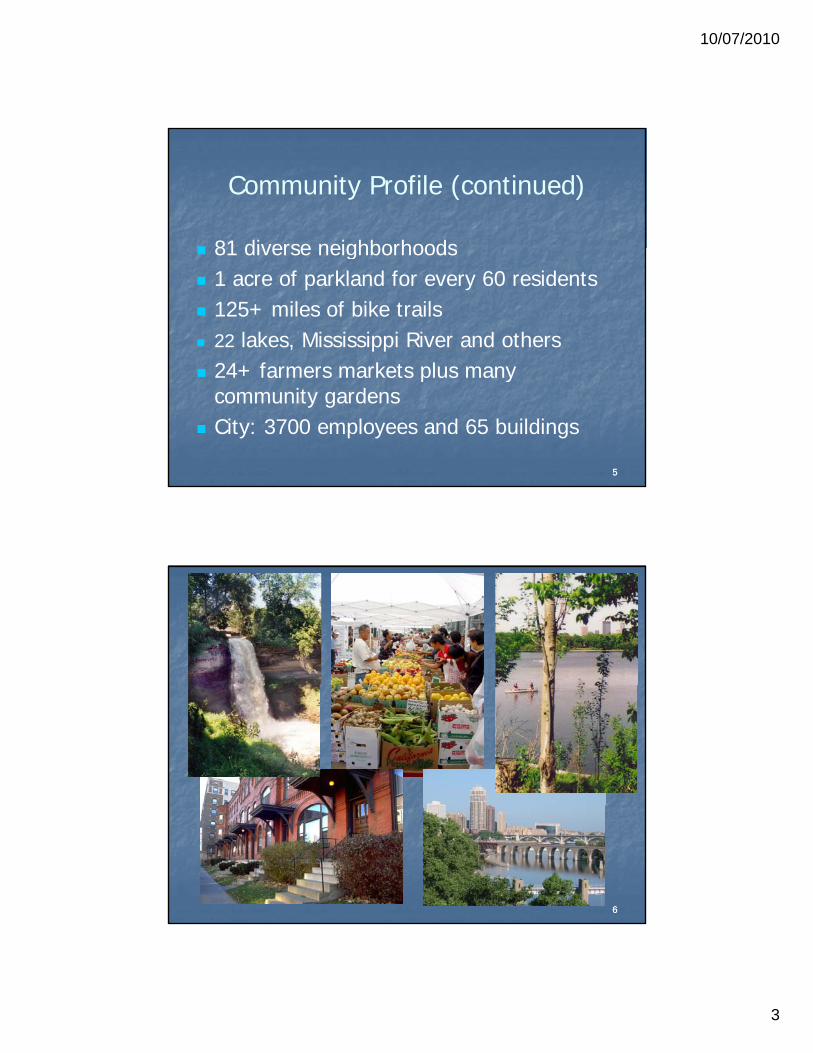
Community Profile (continued)
81 diverse neighborhoods 81 diverse neighborhoods 1 acre of parkland for every 60 residents 125+ miles of bike trails 22 lakes, Mississippi River and others
24+ farmers markets plus many
55
24+ farmers markets plus many community gardens
City: 3700 employees and 65 buildings
66
10/07/2010
4
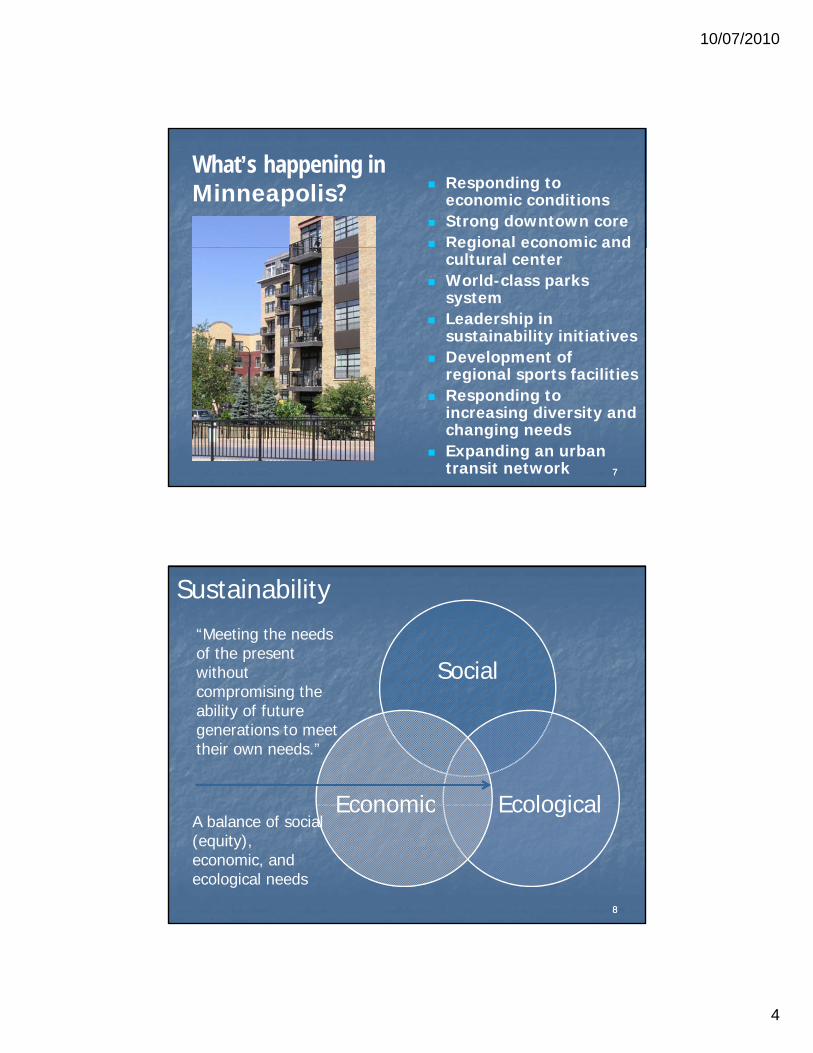
What’s happening in Minneapolis? Responding to
economic conditions Strong downtown core Regional economic and eg o a eco o c a d
cultural center World-class parks
system Leadership in
sustainability initiatives Development of
77
regional sports facilities Responding to
increasing diversity and changing needs
Expanding an urban transit network
Social
“Meeting the needs of the present without
h
Sustainability
EcologicalEconomic
compromising the ability of future generations to meet their own needs.”
88
EcologicalEconomicA balance of social (equity),economic, and ecological needs
10/07/2010
5
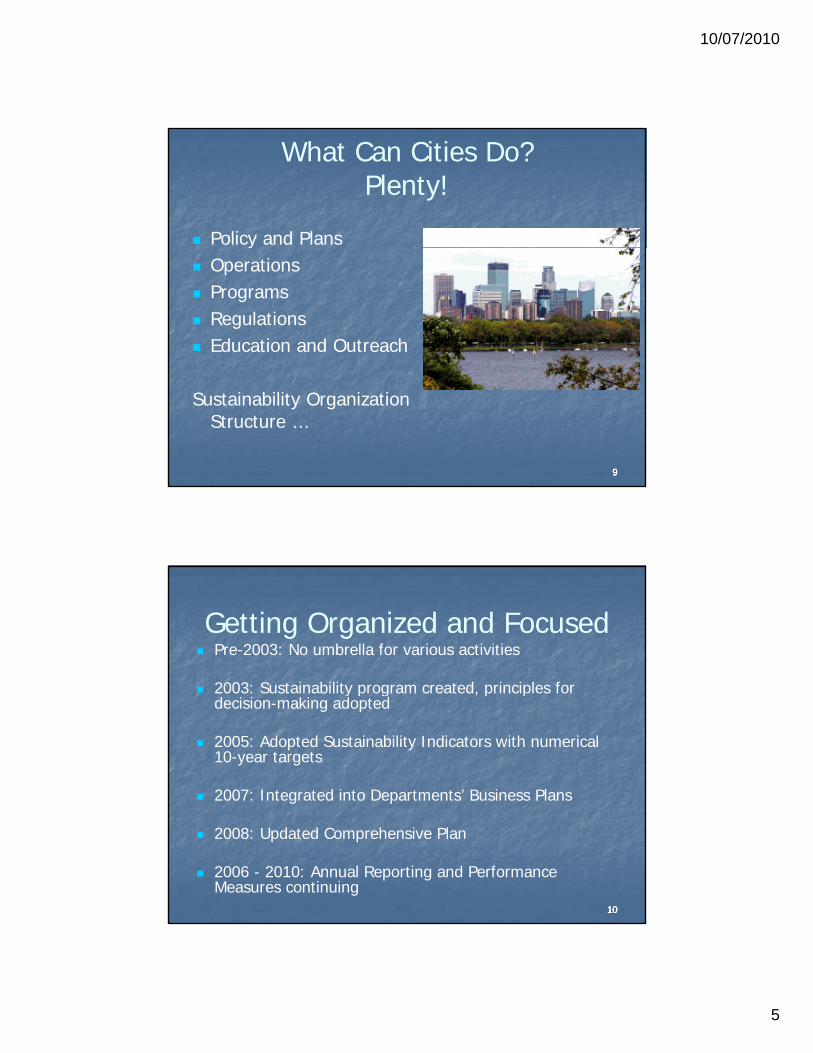
What Can Cities Do?Plenty!
Policy and Plansy Operations Programs Regulations Education and Outreach
9999
Sustainability Organization Structure …
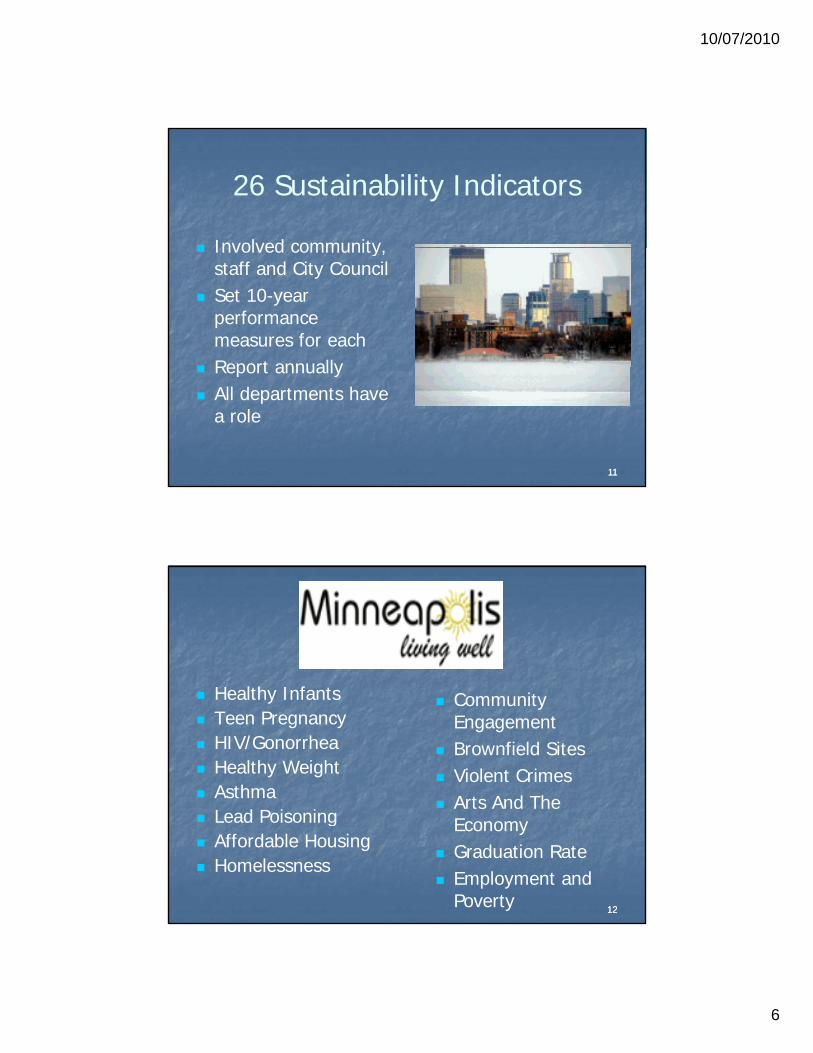
Getting Organized and Focused Pre-2003: No umbrella for various activities
2003: Sustainability program created principles for 2003: Sustainability program created, principles for decision-making adopted
2005: Adopted Sustainability Indicators with numerical 10-year targets
2007: Integrated into Departments’ Business Plans
10101010
2008: Updated Comprehensive Plan
2006 - 2010: Annual Reporting and Performance Measures continuing
10/07/2010
6
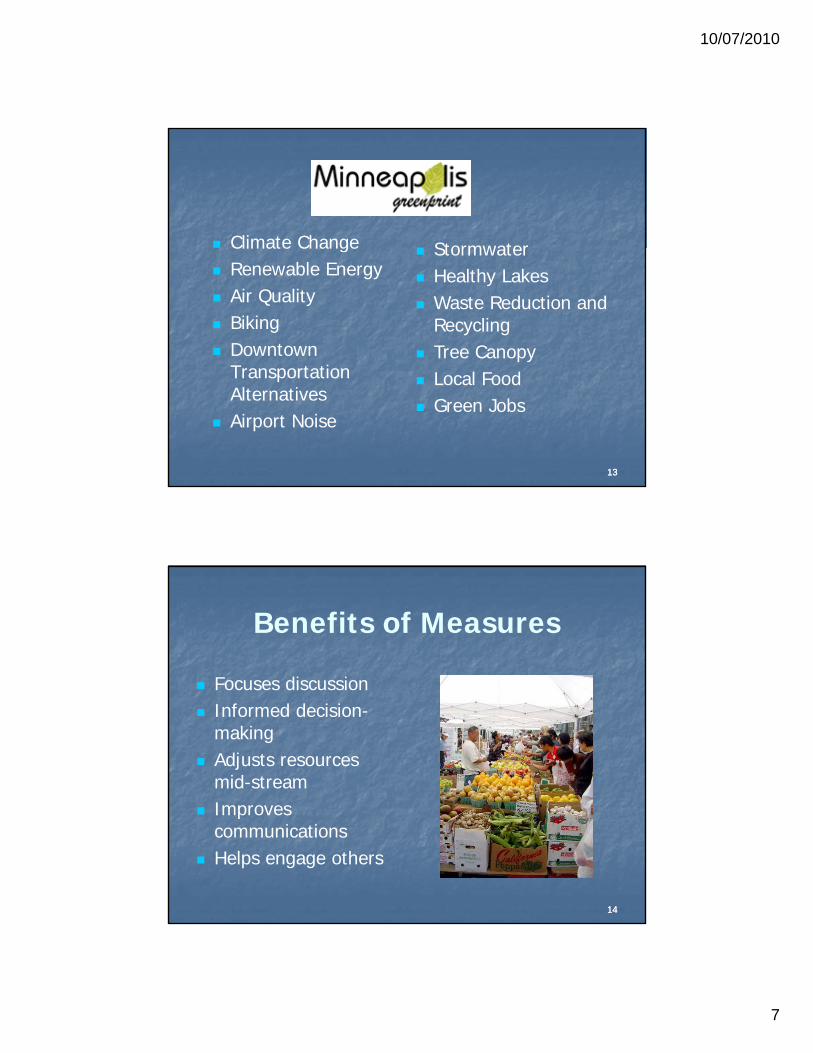
26 Sustainability Indicators
Involved community Involved community, staff and City Council
Set 10-year performance measures for each
Report annually
1111
Report annually All departments have
a role
Healthy Infants Teen Pregnancy HIV/Gonorrhea Healthy Weight Asthma
Community Engagement
Brownfield Sites Violent Crimes Arts And The
1212
Lead Poisoning Affordable Housing Homelessness
Arts And The Economy
Graduation Rate Employment and
Poverty
10/07/2010
7
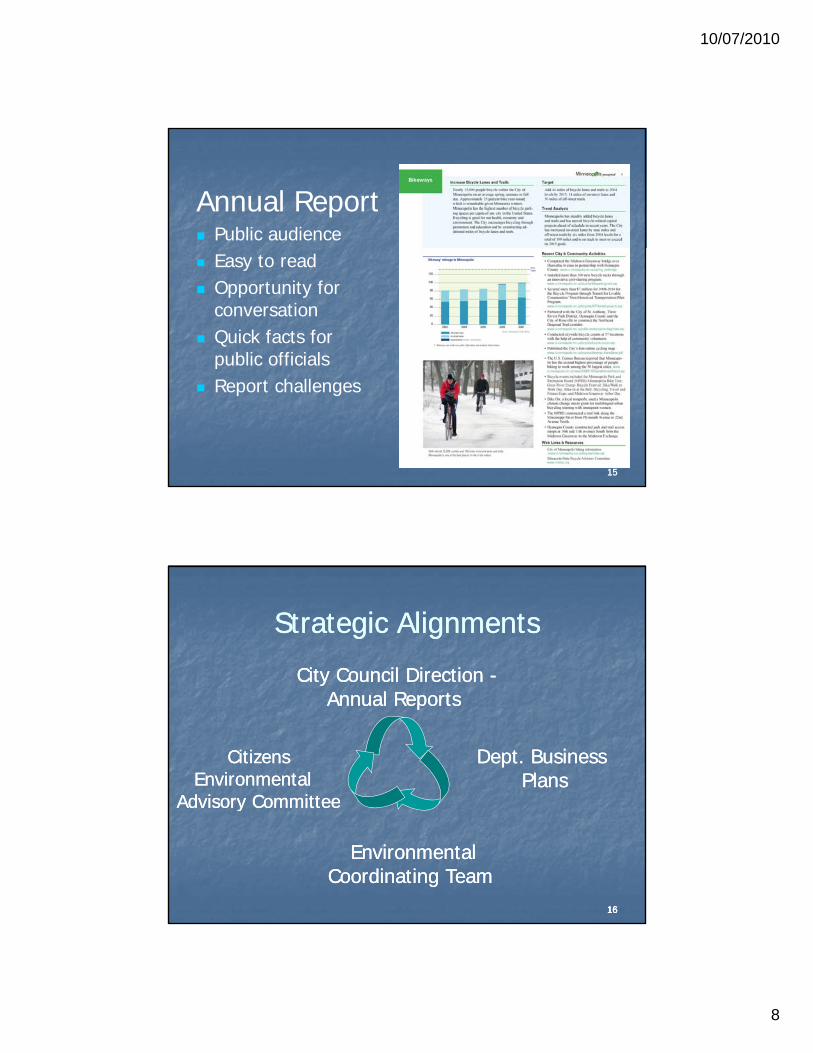
Climate Change Stormwater Climate Change
Renewable Energy Air Quality Biking Downtown
T t ti
Stormwater Healthy Lakes Waste Reduction and
Recycling Tree Canopy
1313
Transportation Alternatives
Airport Noise
Local Food Green Jobs
Benefits of Measures
Focuses discussion Focuses discussion Informed decision-
making Adjusts resources
mid-streamImp o es
1414
Improves communications
Helps engage others
10/07/2010
8
Annual Report Public audience Easy to read Opportunity for
conversation Quick facts for
public officials
1515
p Report challenges
Strategic AlignmentsStrategic Alignments
City Council Direction City Council Direction --yyAnnual ReportsAnnual Reports
CitizensCitizensEnvironmental Environmental
Advisory CommitteeAdvisory Committee
Dept. Business Dept. Business PlansPlans
16161616
Advisory CommitteeAdvisory Committee
Environmental Environmental Coordinating TeamCoordinating Team
10/07/2010
9
Policies and Plans
2008 Update: The Minneapolis Plan for Sustainable Growth
b l Focus on sustainability: environmental, (social) equity, and economic
Strategy for welcoming and accommodating population
1717
and employment growth while sustaining natural environment and creating economic opportunities
Why was the Plan Updated?
To address economic and development changes To address economic and development changes To comply with State law that requires the City
of Minneapolis to update its Comprehensive Plan periodically
To meet regional planning requirements guided by the Metropolitan Council
1818
by the Metropolitan Council To anticipate economic and development
challenges and propose solutions
10/07/2010
10
Primary Objectives for Update
Strengthen and clarify the City’s existing Strengthen and clarify the City s existing policy framework for future planning, zoning and development decisions
Complete a future land use map that reflects the City’s vision and policies
1919
Address within framework of City goalsand sustainability efforts
Key Assumptions Economy to continue at a tempered pace
throughout 2011throughout 2011 The build-out of the regional transit
system will call for better connections to pedestrian, bike and connector facilities.
A continued spotlight on community health sustainability and urban design
2020
health, sustainability and urban design Added emphasis on planning and projects
that reduce the city’s energy footprint and demands on fossil fuels
10/07/2010
11
Plan Update Process Sustainability woven throughout
C ll b ti l d b CPED Collaborative process led by CPED –Planning in close cooperation with: City Planning Commission Public Agencies City Council
2121
City Council Residents Stakeholders
Public participation with residents
Planning Process continued
Public participation with residents, stakeholders and staff included: Community Forums Public Surveys and Results Public Open Houses
2222
City Planning Commission Public Hearings and Public Comment Periods
Multi-media Outreach
10/07/2010
12
Updated Comp Plan Contents Chapters organized in 10 topical areas:
Land Use Transportation p Housing Economic Development Public Services and Facilities Environment Open Space and Parks Heritage Preservation
2323
Arts and Culture Urban Design
Each chapter includes Goals, Context Analysis, Policies, and Implementation Steps
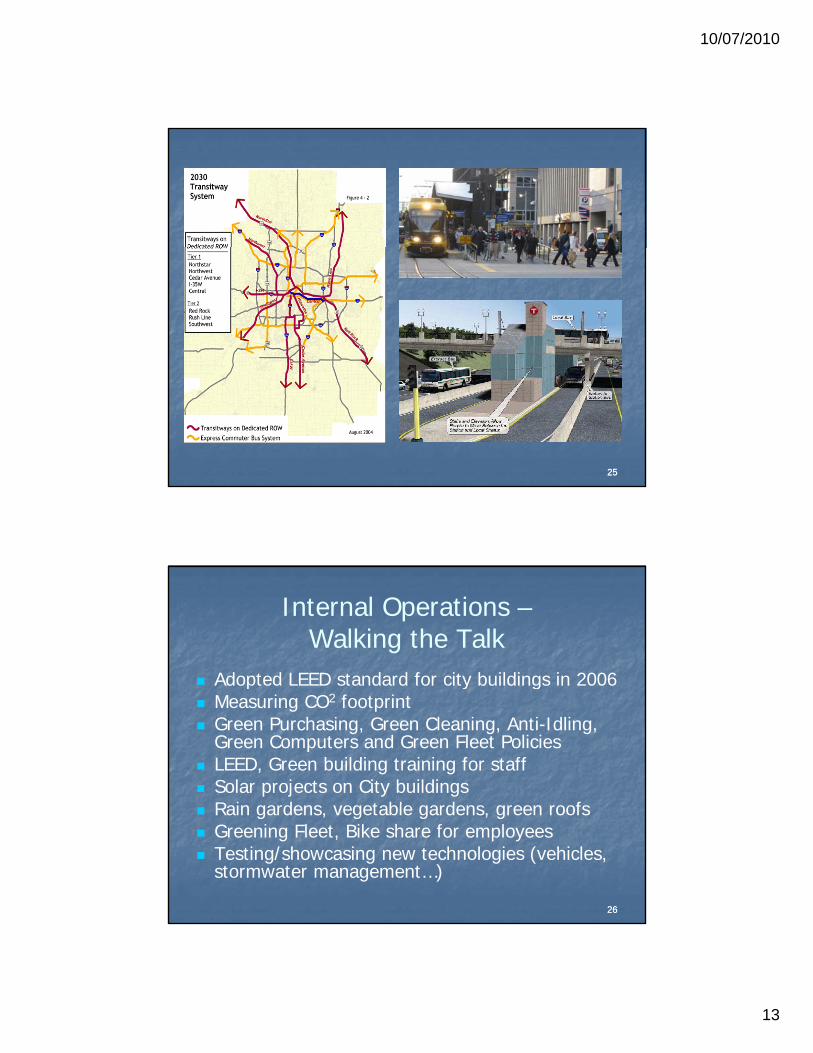
Access Minneapolis: Ten-Year Transportation Action plan
Consistent with Policies in Comp Plan Consistent with Policies in Comp Plan Links land use, transportation through design Promotes multi-modalism, transit-first City-Wide Ten Year Plan Downtown Ten Year Plan
2424
Design Guidelines for Streets and Sidewalks (design elements for public rights of way, ped-bike-tree plans)
10/07/2010
13
2525
Internal Operations –Walking the Talk
Adopted LEED standard for city buildings in 2006Adopted LEED standard for city buildings in 2006 Measuring CO2 footprint Green Purchasing, Green Cleaning, Anti-Idling,
Green Computers and Green Fleet Policies LEED, Green building training for staff Solar projects on City buildings
Rain ga dens egetable ga dens g een oofs
2626
Rain gardens, vegetable gardens, green roofs Greening Fleet, Bike share for employees Testing/showcasing new technologies (vehicles,
stormwater management…)
10/07/2010
14
Programs “Green Communities” criteria in housing RFPs
“Thi G ” I iti ti “Thinc.Green” Initiative – green manufacturing/jobs
Improvements to bike, ped and transit Reduced-price large trees for residents Bike rack cost share program for businesses
Energy efficiency programs for property owners
2727
Energy efficiency programs for property owners “Homegrown Minneapolis” – local foods “Nice Ride MN” – bike sharing initiative
Regulatory Tools Storm water management ordinance; fee and
fee credit program Erosion control ordinance Travel Demand Management Plans Anti-Idling ordinance Higher densities, mixed uses Revisions to parking requirements
Streamlined transparent permitting for solar
2828
Streamlined, transparent permitting for solar Streamlined permitting for mini food stands Wind energy provisions
10/07/2010
15
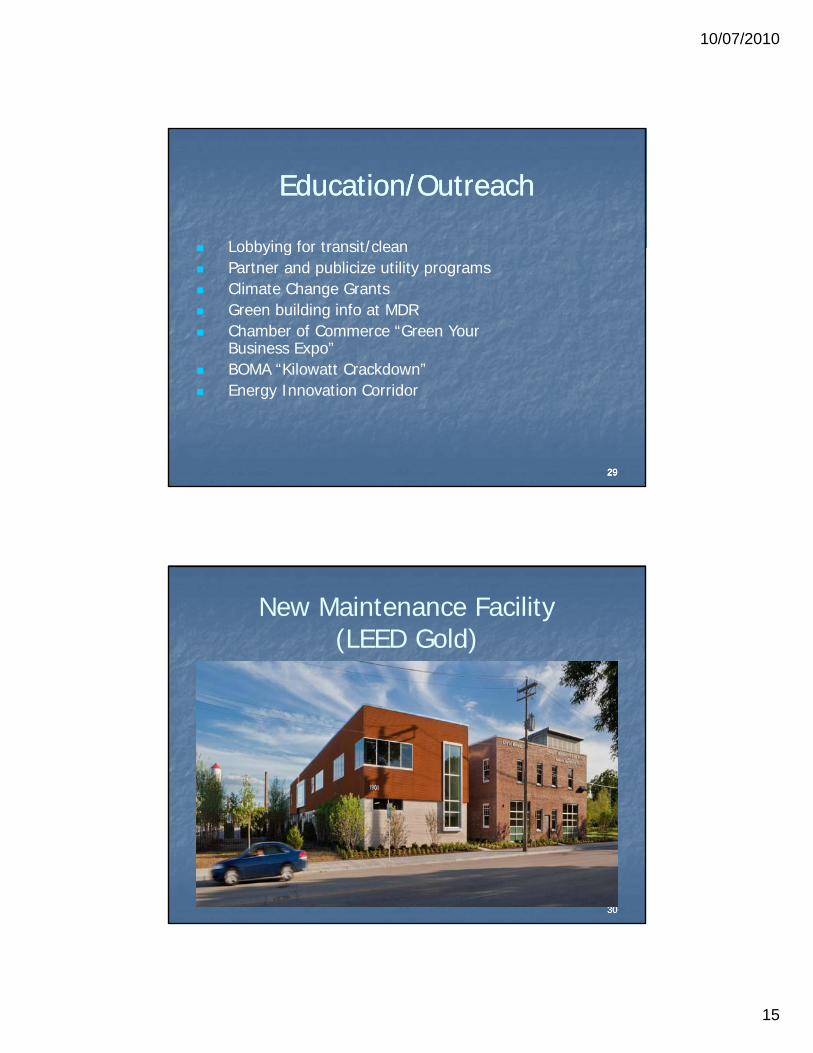
Education/OutreachEducation/Outreach
Lobbying for transit/clean Lobbying for transit/clean Partner and publicize utility programs Climate Change Grants Green building info at MDR Chamber of Commerce “Green Your
Business Expo”BOMA “Kilowatt Crackdown”
29292929
BOMA Kilowatt Crackdown Energy Innovation Corridor
New Maintenance Facility (LEED Gold)
3030
10/07/2010
16
3131
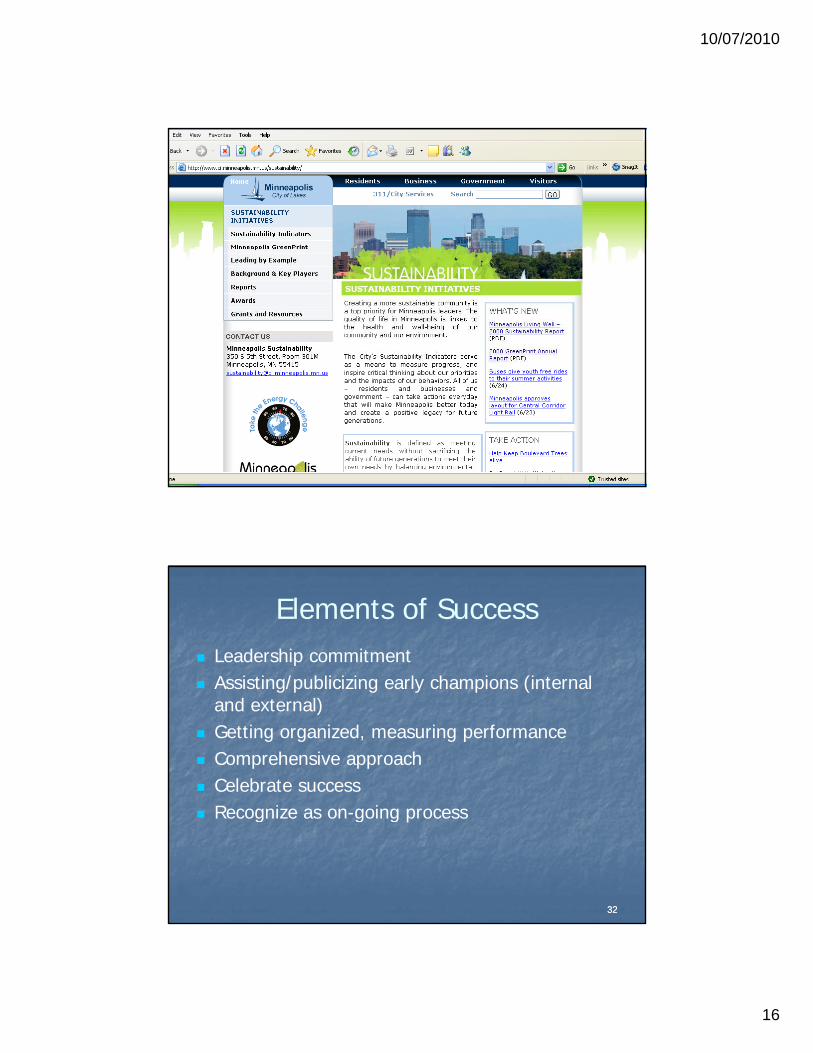
Elements of Success Leadership commitment Assisting/publicizing early champions (internal Assisting/publicizing early champions (internal
and external) Getting organized, measuring performance Comprehensive approach Celebrate success
3232
Recognize as on-going process
10/07/2010
17
Minneapolis SustainabilitySustainability
ci.minneapolis.mn.us/sustainability
3333
Kristi Kristi WamstadWamstad‐‐Evans, LEED APEvans, LEED AP
Sustainability Coordinator, City of Omaha
Administers EECBG projects and Retrofit Ramp‐Up p j p pGrant
Former National Sustainable Solutions Program Coordinator for HDR
10/07/2010
18
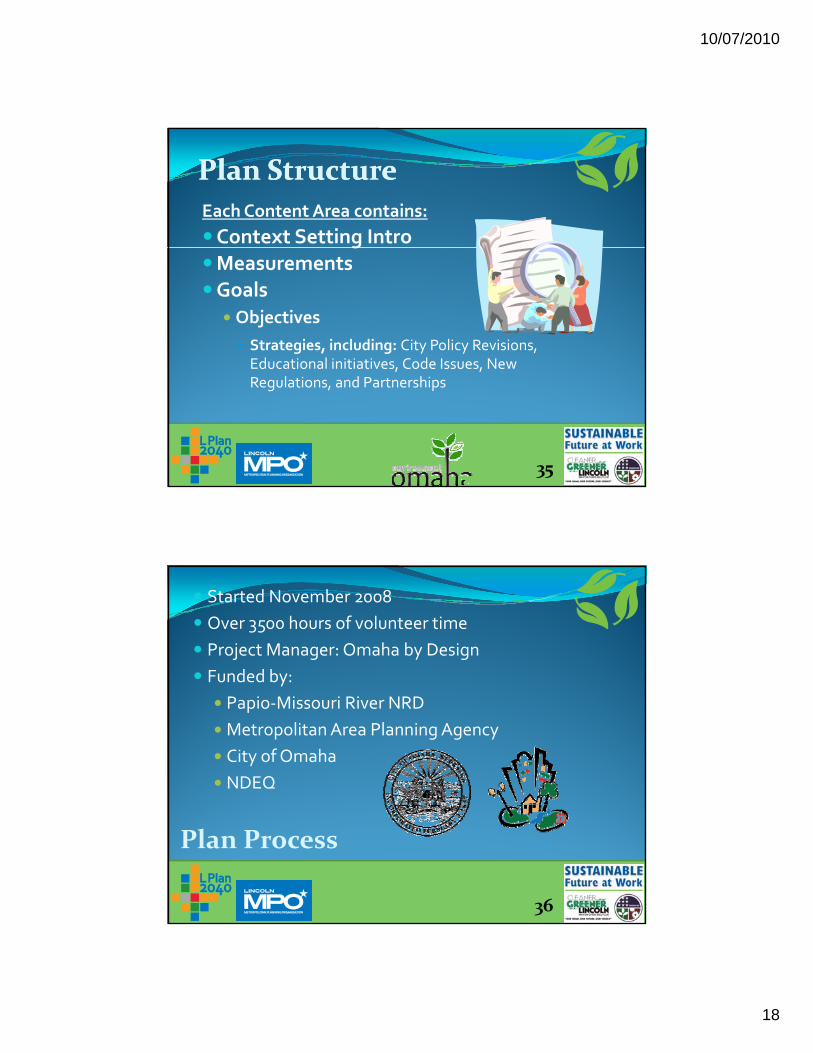
Plan StructurePlan Structure
Each Content Area contains:
Context Setting Introg
MeasurementsGoals Objectives
Strategies, including: City Policy Revisions, Educational initiatives, Code Issues, New Educational initiatives, Code Issues, New Regulations, and Partnerships
35
Started November 2008
Over 3500 hours of volunteer time
Project Manager: Omaha by Design
Funded by:y
Papio‐Missouri River NRD
Metropolitan Area Planning Agency
City of Omaha
NDEQ
Plan Process
36
10/07/2010
19
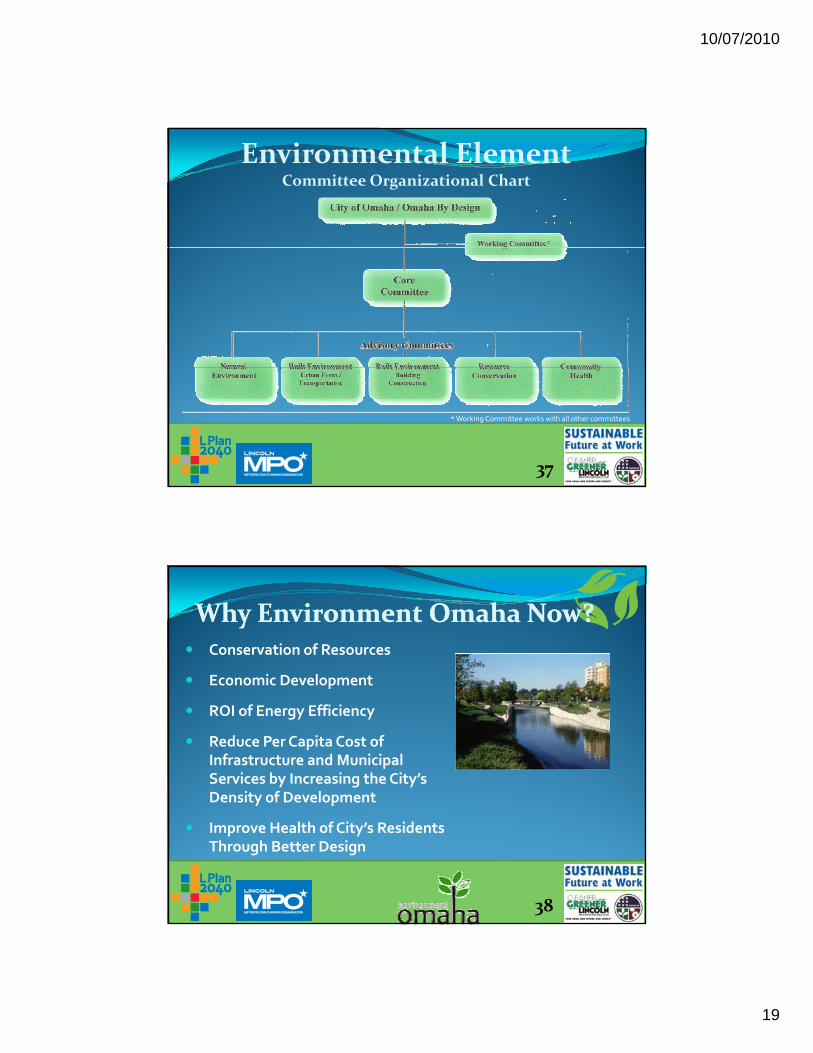
Environmental ElementCommittee Organizational Chart
* Working Committee works with all other committees
37
Why Environment Omaha Now? Why Environment Omaha Now? Conservation of Resources
Economic DevelopmentEconomic Development
ROI of Energy Efficiency
Reduce Per Capita Cost of Infrastructure and Municipal Services by Increasing the City’s Density of Developmenty p
Improve Health of City’s Residents Through Better Design
38
10/07/2010
20
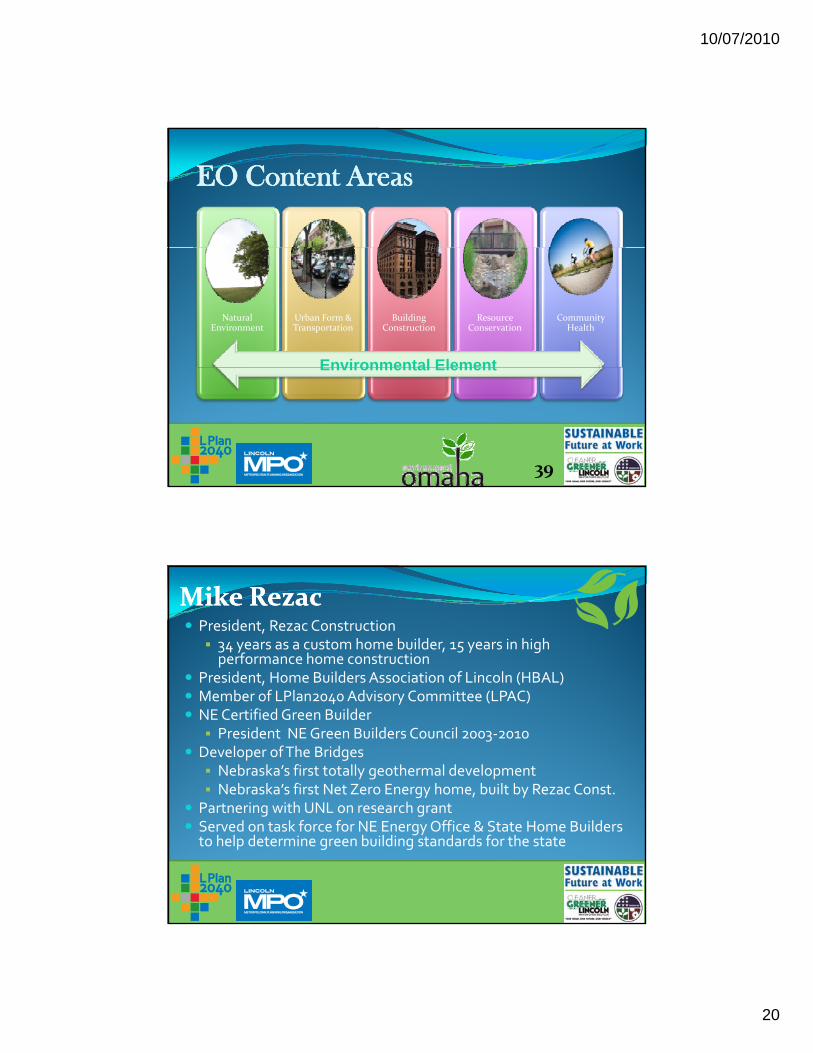
EO Content EO Content AreasAreas
Natural Environment
Urban Form & Transportation
Building Construction
Resource Conservation
Community Health
Environmental ElementEnvironmental Element
39
Mike RezacMike Rezac President, Rezac Construction 34 years as a custom home builder, 15 years in high performance home construction
President, Home Builders Association of Lincoln (HBAL), Member of LPlan2040 Advisory Committee (LPAC) NE Certified Green Builder President NE Green Builders Council 2003‐2010
Developer of The Bridges Nebraska’s first totally geothermal development Nebraska’s first Net Zero Energy home, built by Rezac Const.
P t i ith UNL h t Partnering with UNL on research grant Served on task force for NE Energy Office & State Home Builders to help determine green building standards for the state
10/07/2010
21
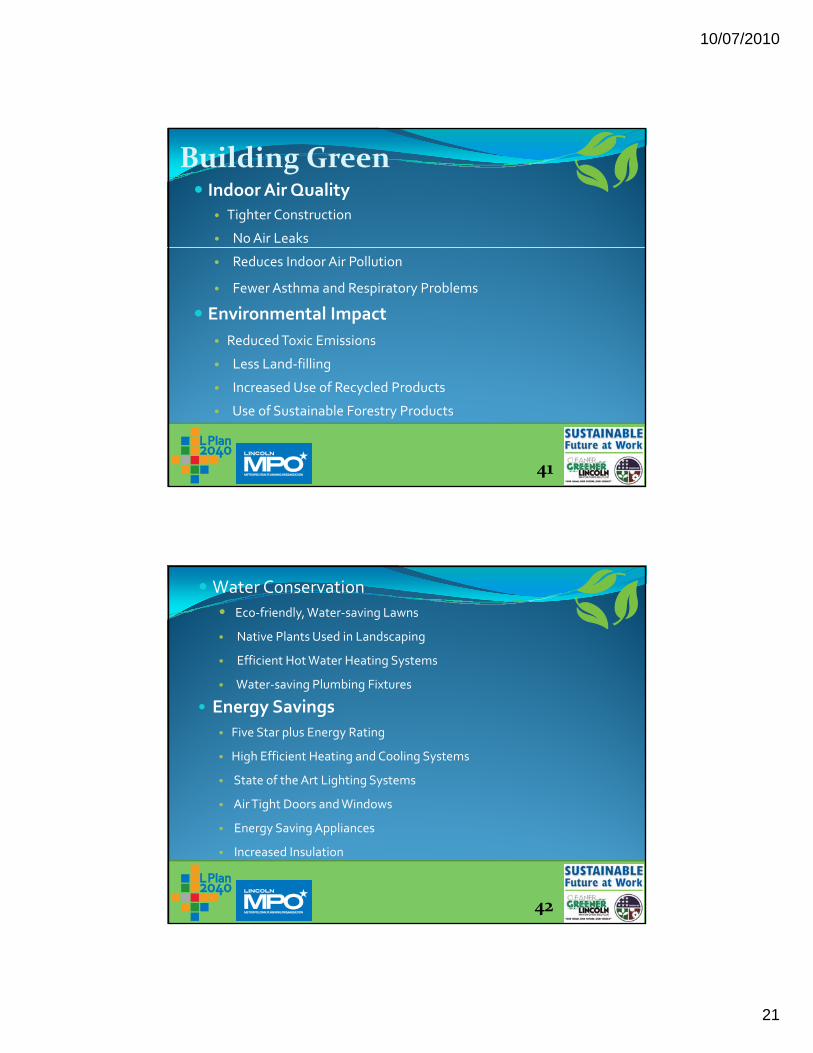
Building Green Indoor Air Quality
• Tighter Construction
• No Air Leaks
• Reduces Indoor Air Pollution
• Fewer Asthma and Respiratory Problems
Environmental Impact
• Reduced Toxic Emissions
• Less Land‐fillingLess Land filling
• Increased Use of Recycled Products
• Use of Sustainable Forestry Products
41
Water Conservation
• Eco‐friendly, Water‐saving Lawns
• Native Plants Used in Landscaping
• Efficient Hot Water Heating Systems
• Water‐saving Plumbing Fixtures• Water‐saving Plumbing Fixtures
• Energy Savings
• Five Star plus Energy Rating
• High Efficient Heating and Cooling Systems
• State of the Art Lighting Systems
• Air Tight Doors and Windows• Air Tight Doors and Windows
• Energy Saving Appliances
• Increased Insulation
42
10/07/2010
22
4343
44

10/07/2010
23
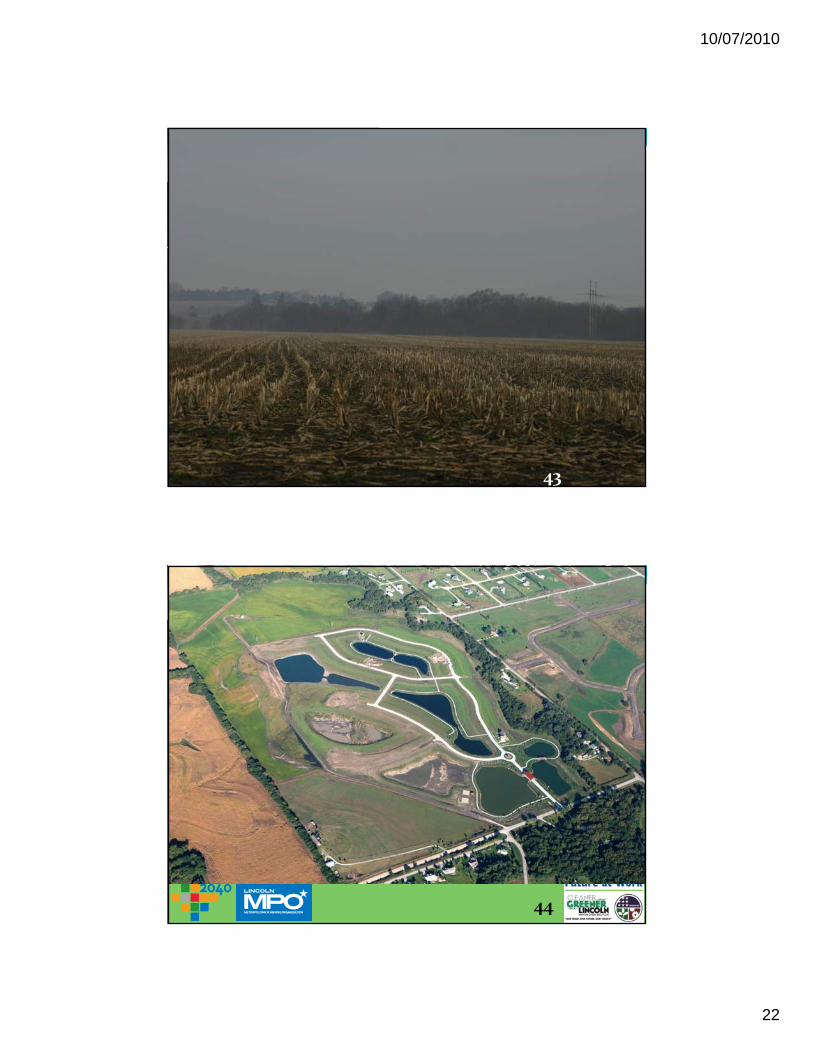
Environmentally‐sensitive Neighborhood
Promotes Conservative Living Promotes Conservative Living
Ponds Retain Rainwater,
Boosting Ground Water Levels
Green Building Construction is Promoted
through Protective Covenants
Geothermal Heating and Cooling System
45
Underwater closed‐loop system
Every lot adjacent to a pond in The Bridges development has loop piping built into the lot, ready to accept a pond loop system.
When a home is built, a stainless steel plate frame heat exchange unit is placed in the pond and a closed‐loop connection runs to the house.
46

10/07/2010
24
Solar Access• Plan rooms around the light. With most lived in spaces on the south
side of the home and less used spaces located on the north side.
• Use few east and west windowsUse few east and west windows.
• Extra attention is given to the use of overhangs and landscaping for shading during the cooling season.
• Careful floor plans can reduce heating and lighting costs. Rooms should be organized so activities taking place in them make the most of natural light.
• Roof overhangs must be carefully designed to block unwanted sun, but not block spring, fall or winter sun that is desirable for heating.
47
4848
10/07/2010
25
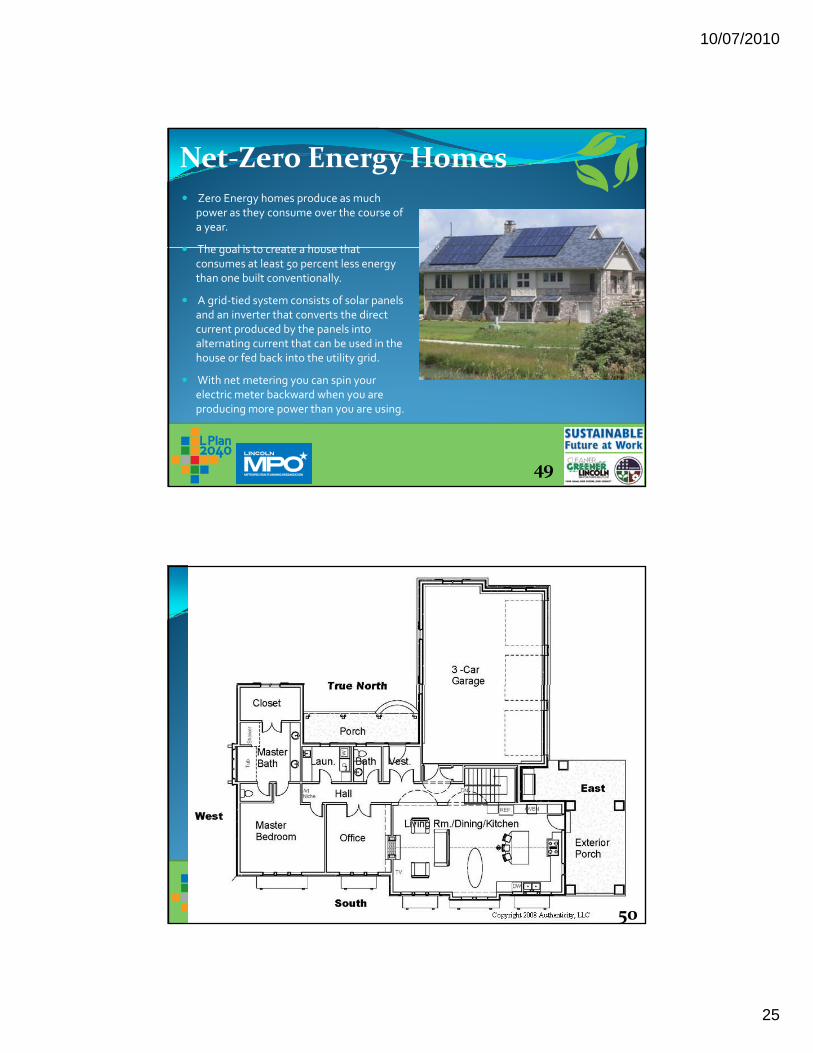
Net‐Zero Energy Homes Zero Energy homes produce as much
power as they consume over the course of a year.
The goal is to create a house that The goal is to create a house that consumes at least 50 percent less energy than one built conventionally.
A grid‐tied system consists of solar panels and an inverter that converts the direct current produced by the panels into alternating current that can be used in the house or fed back into the utility grid.
With net metering you can spin your electric meter backward when you are producing more power than you are using.
49
50 50
10/07/2010
26
Cecil Steward, FAIACecil Steward, FAIA
Dean Emeritus, Professor Emeritus of Architecture and Planning at UNL’s College of Architecture
President and Founder, Joslyn Institute for Sustainable yCommunities
President and Founder, International North/North Network for Urban Sustainability
Member LPlan2040 Advisory Committee (LPAC)
Past President American Institute of Architects (AIA)
Ser ed on boards for Association of Collegiate Schools of Served on boards for Association of Collegiate Schools of Architecture, AIA, and the charter board of the Architectural Research Centers Consortium
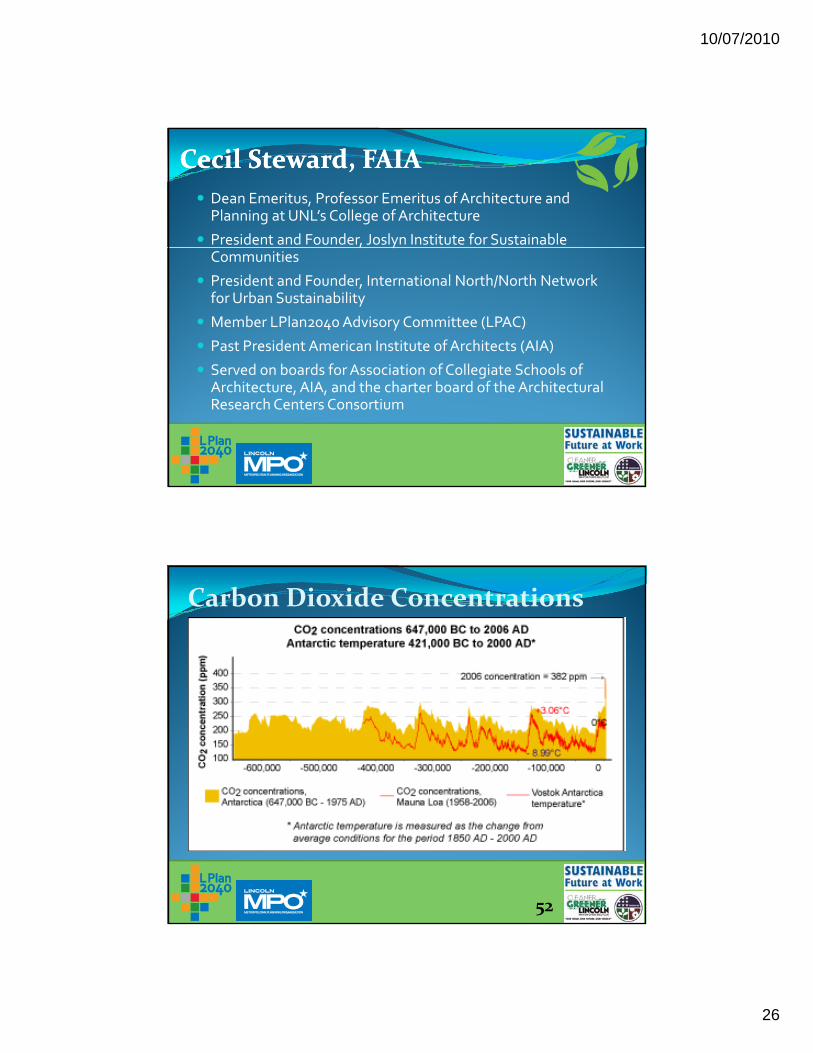
Carbon Dioxide Concentrations
52
10/07/2010
27
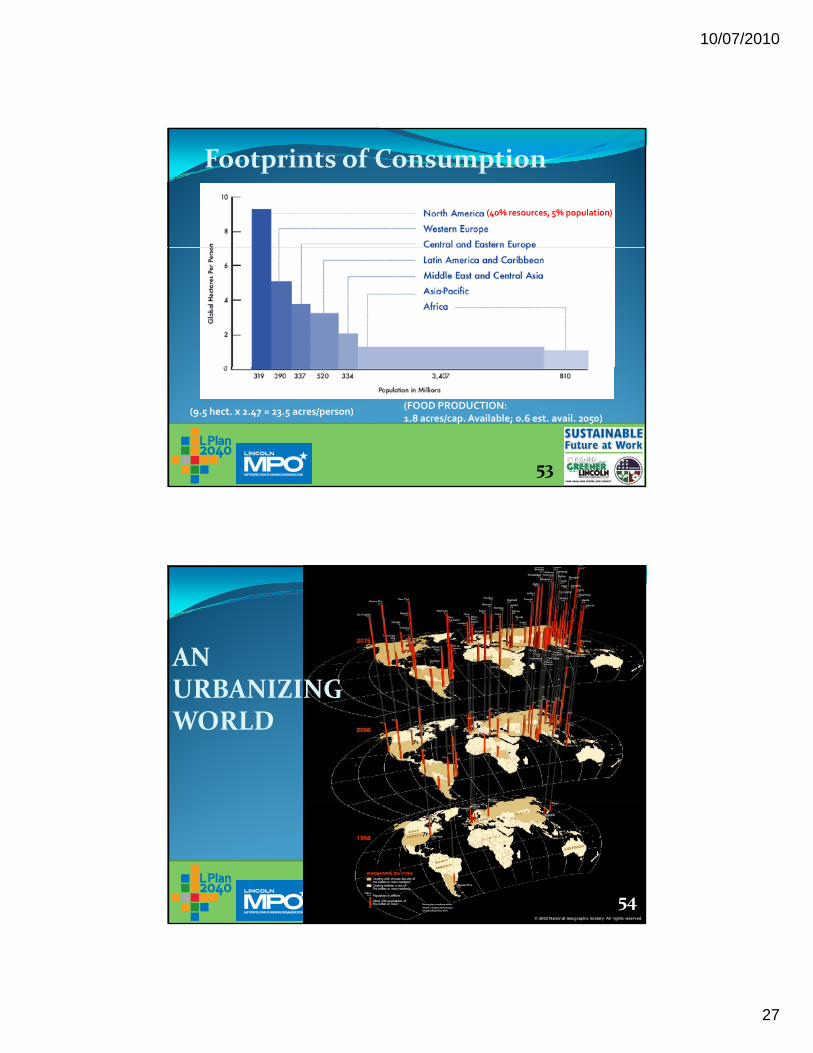
Footprints of Consumption
(40% resources, 5% population)
(9.5 hect. x 2.47 = 23.5 acres/person)(FOOD PRODUCTION:1.8 acres/cap. Available; 0.6 est. avail. 2050)
53
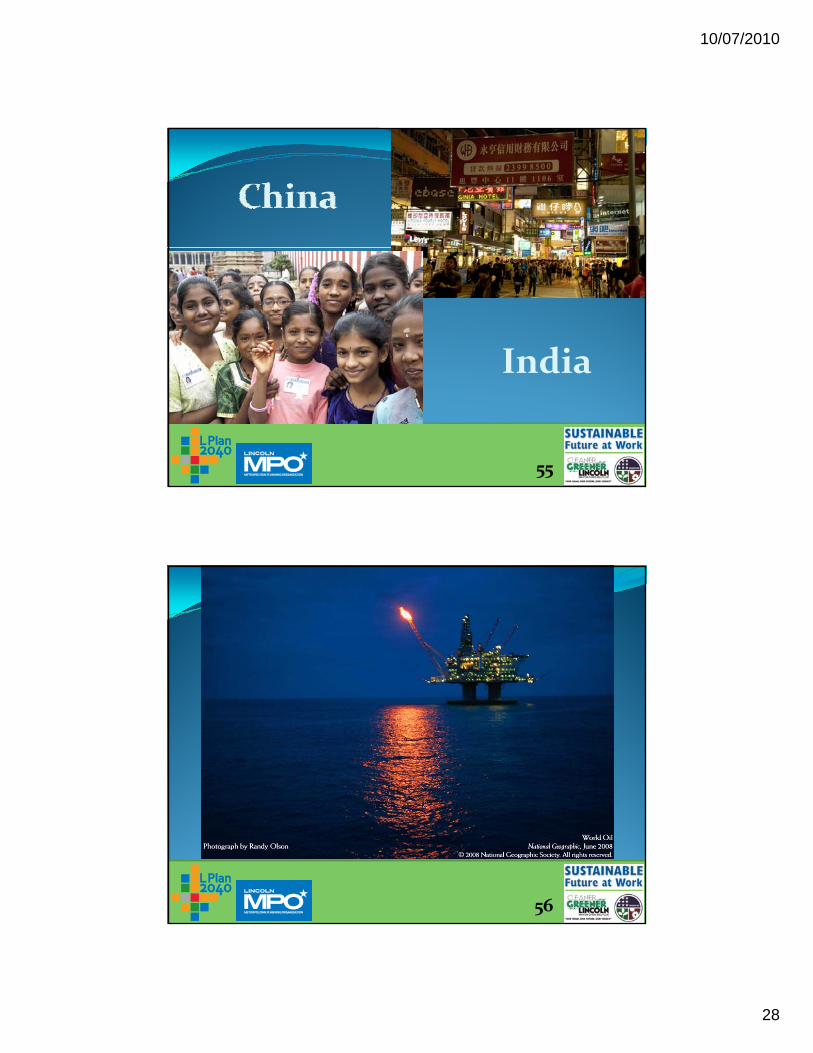
ANURBANIZINGURBANIZINGWORLD
54
10/07/2010
28
IndiaIndia
55
56
10/07/2010
29
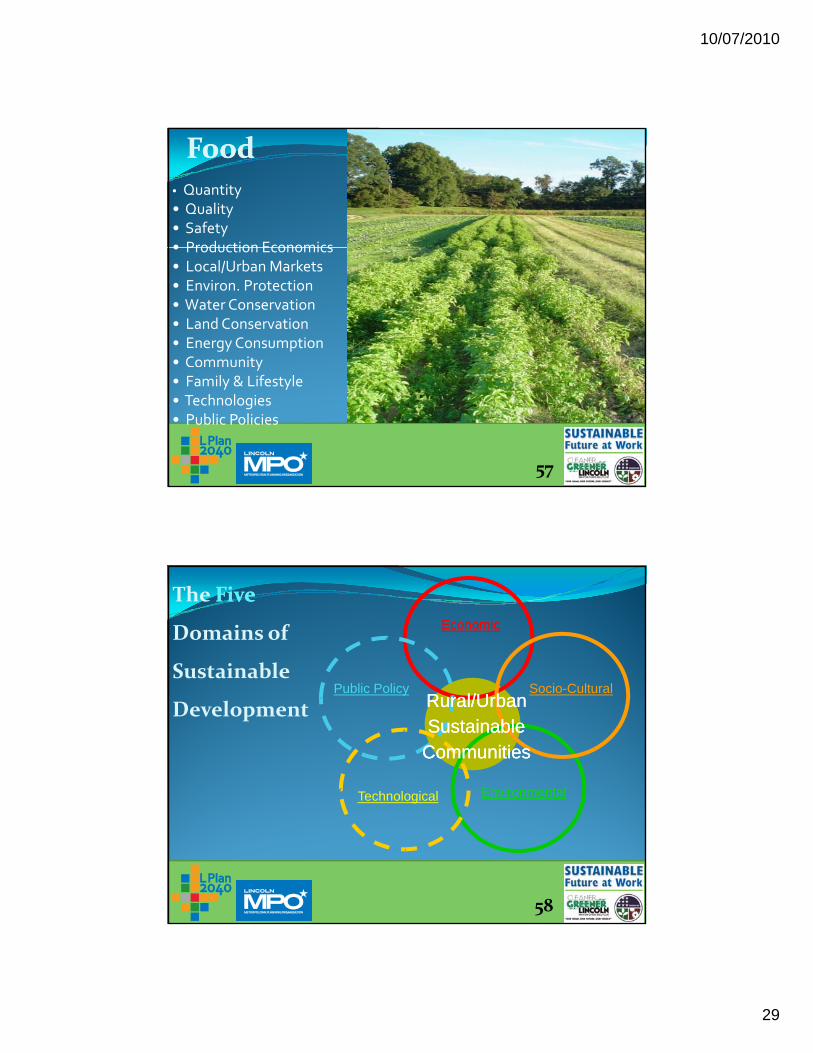
FoodFood
• Quantity• Quality• Safety• Production Economics• Production Economics• Local/Urban Markets• Environ. Protection• Water Conservation• Land Conservation• Energy Consumption• Communityy• Family & Lifestyle• Technologies• Public Policies
57
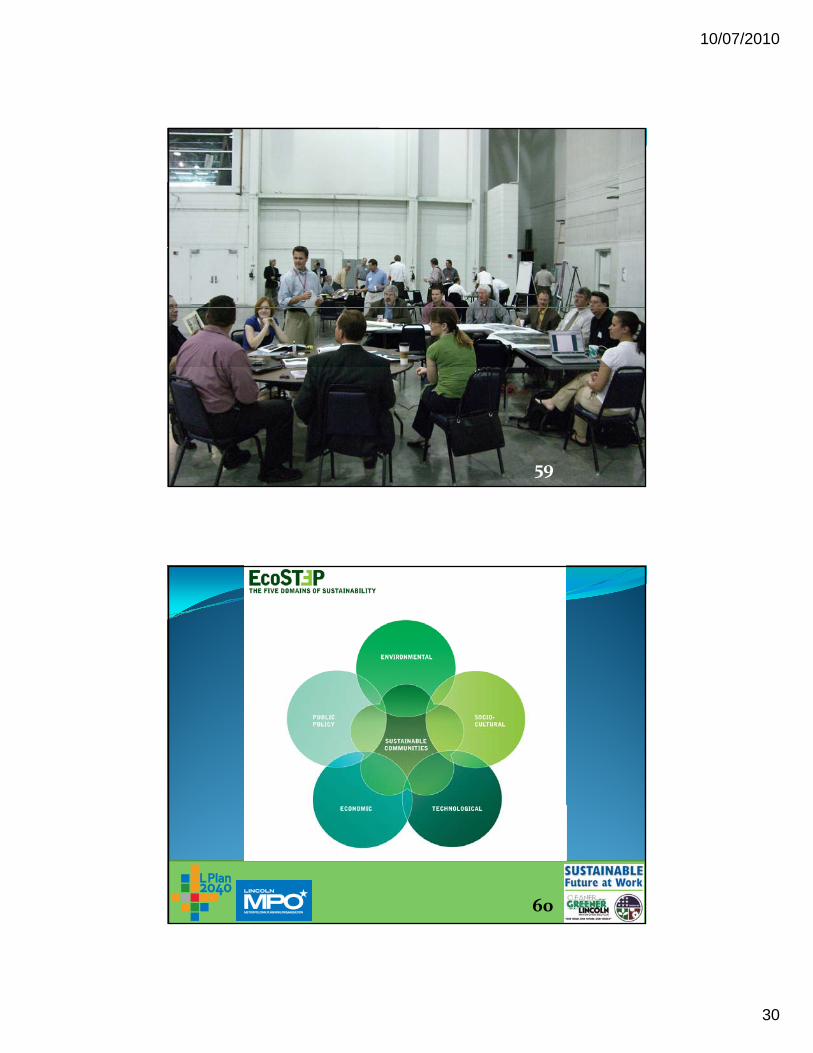
P bli P li S i C lt l
Economic
The FiveFive
Domains of
Sustainable
Environmental
Public Policy
Technological
Socio-CulturalRural/UrbanRural/UrbanSustainable Sustainable
CommunitiesCommunities
Development
58
10/07/2010
30
59
60
10/07/2010
31
“Sustainometrics”
The MetricsThe MetricsOf Sustainability
61
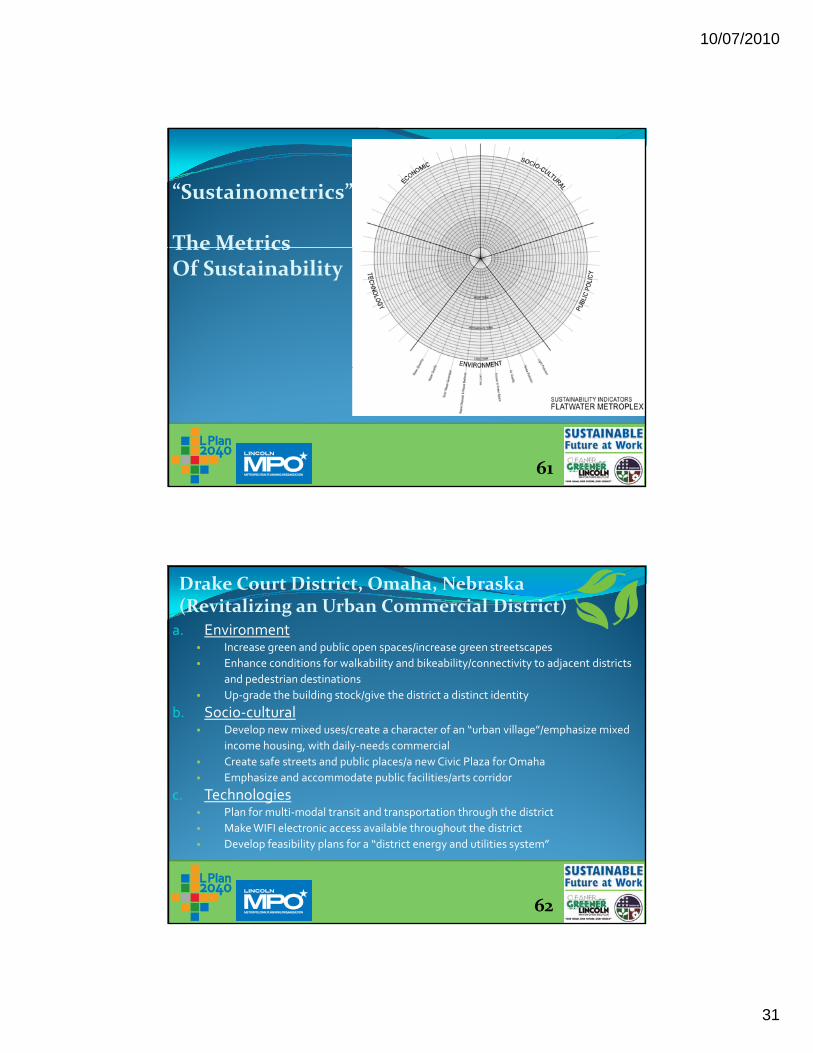
Drake Court District, Omaha, Nebraska(Revitalizing an Urban Commercial District)a. Environment
• Increase green and public open spaces/increase green streetscapes
• Enhance conditions for walkability and bikeability/connectivity to adjacent districts
and pedestrian destinationsp
• Up‐grade the building stock/give the district a distinct identity
b. Socio‐cultural• Develop new mixed uses/create a character of an “urban village”/emphasize mixed
income housing, with daily‐needs commercial
• Create safe streets and public places/a new Civic Plaza for Omaha
• Emphasize and accommodate public facilities/arts corridor
c. Technologies• Plan for multi‐modal transit and transportation through the district
• Make WIFI electronic access available throughout the district
• Develop feasibility plans for a “district energy and utilities system”
62
10/07/2010
32
Drake Court District, Omaha, Nebraska(Revitalizing an Urban Commercial District)
d. Economics
• Create city incentives for the development of infill and new development
• Emphasize the economics of affordable and low‐income housing/paralleled Emphasize the economics of affordable and low income housing/paralleled
with the development of daily‐needs commercial shops and stores
• Give priority to developments with locally‐owned businesses
e. Public Policies
• Omaha Planning Board and City Council to incorporate a new “Sub‐area Plan”
for the district into the City’s Comprehensive Plan
• Develop an overlay plan for the district to be designated a “Green By Design
District”District
• Create a district Citizens’ Development Coalition, with members from property
owners, stakeholders, businesses, institutions, and residences in the district
63
64
10/07/2010
33
65
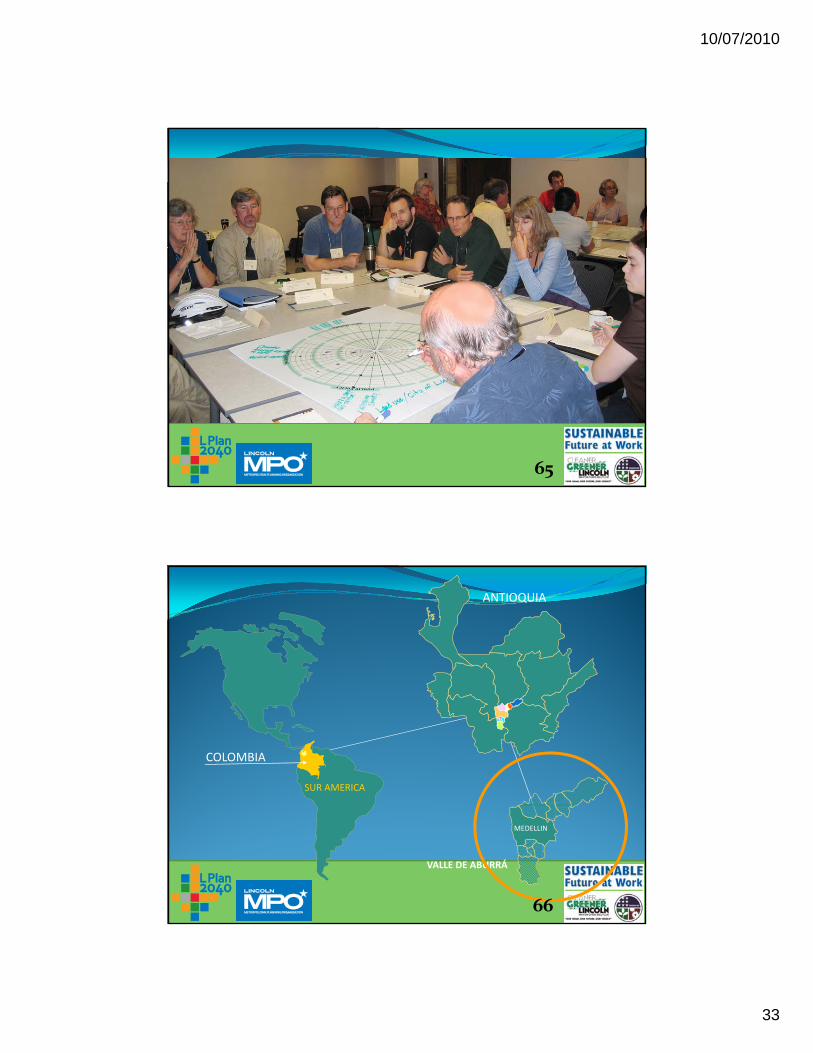
ANTIOQUIA
COLOMBIA
SUR AMERICA
VALLE DE ABURRÁ
MEDELLIN
66
10/07/2010
34
67
68
10/07/2010
35
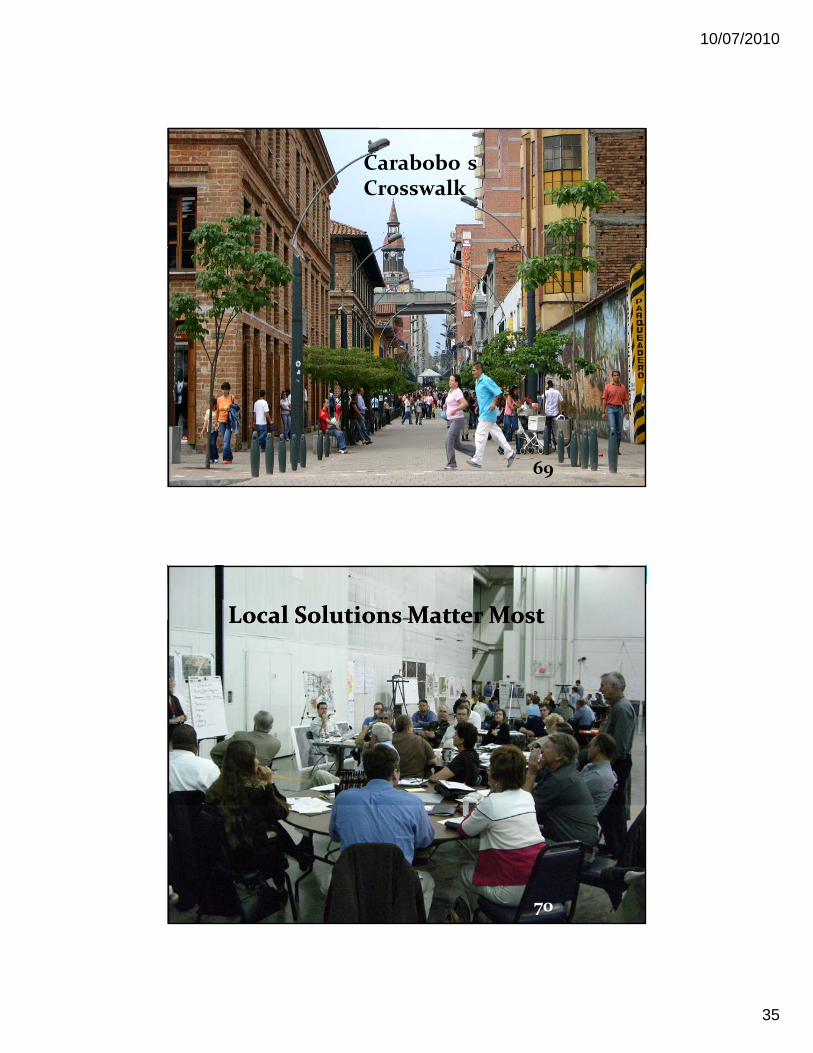
Carabobo s Crosswalk
69
Local Solutions Matter MostLocal Solutions Matter Most
70
10/07/2010
36
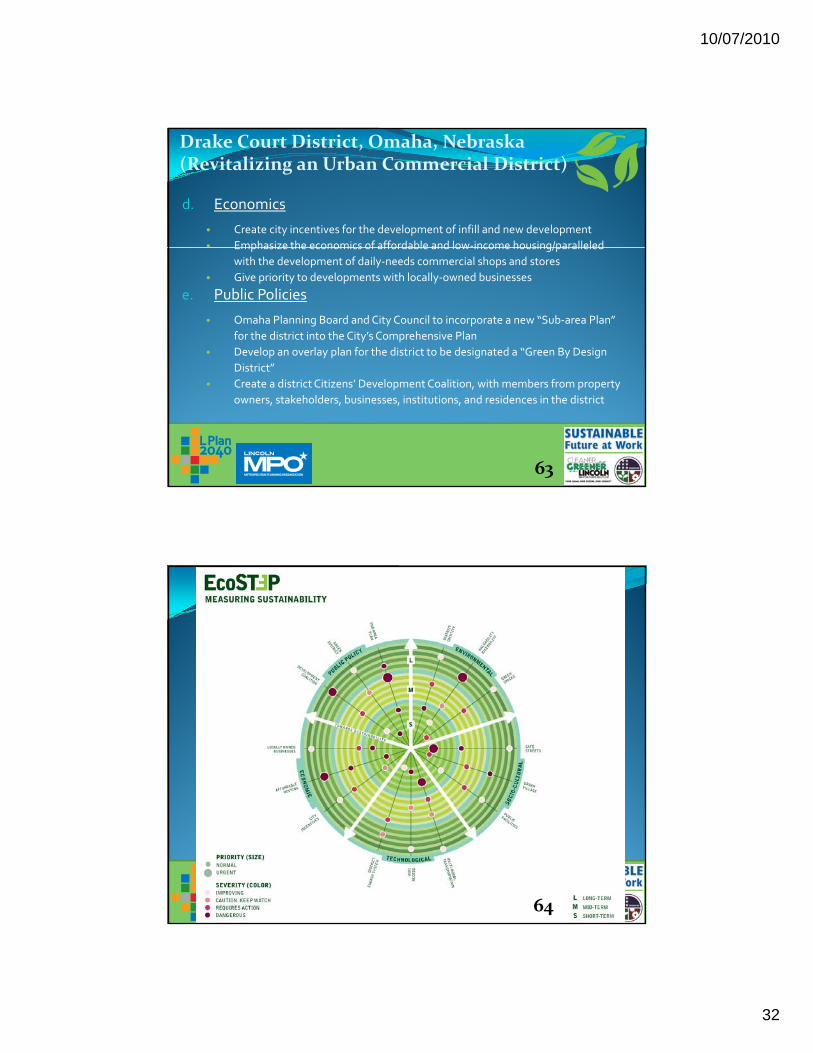
SUSTAINOMETRICS:Measuring Sustainability
A tool for architects,designers, planners, city administrators and facility managers
71
72
10/07/2010
37
www.ecospheres.com
Joslyn Institutefor sustainable communities
73
Michelle Penn, AIAMichelle Penn, AIA
Nebraska Registered Architect
President, Owner, Authenticity, LLC –Architecture and Designg
Designer of two Net Zero Energy homes in Nebraska
Member Lincoln Urban Design Committee
Member American Institute of Architects
18 years of experience in healthcare, commercial and custom residential projects
10/07/2010
38
Scott HolmesScott Holmes
Manager, Environmental Health Division, Lincoln Lancaster County Health Department, since 1991
Air Quality; Waste Management; Water Quality; Emergency R L d U Pl R i Di P tiResponse; Land Use Plan Review; Disease Prevention
Underwriter, Laboratories Environmental and Public Health Council
State of Nebraska Board of Environmental Health Specialists
Special reviewer/advisor to CDC on such topics as
GIS and Environmental Health and Emergency Response
ATSDR’s Hazardous Substance Emergency Events Exposure System
Can we design a safer, healthier Lincoln?
76
10/07/2010
39
What does Land Use Planning, What does Land Use Planning, Sustainability and Health & Safety have in Sustainability and Health & Safety have in common?common?
77
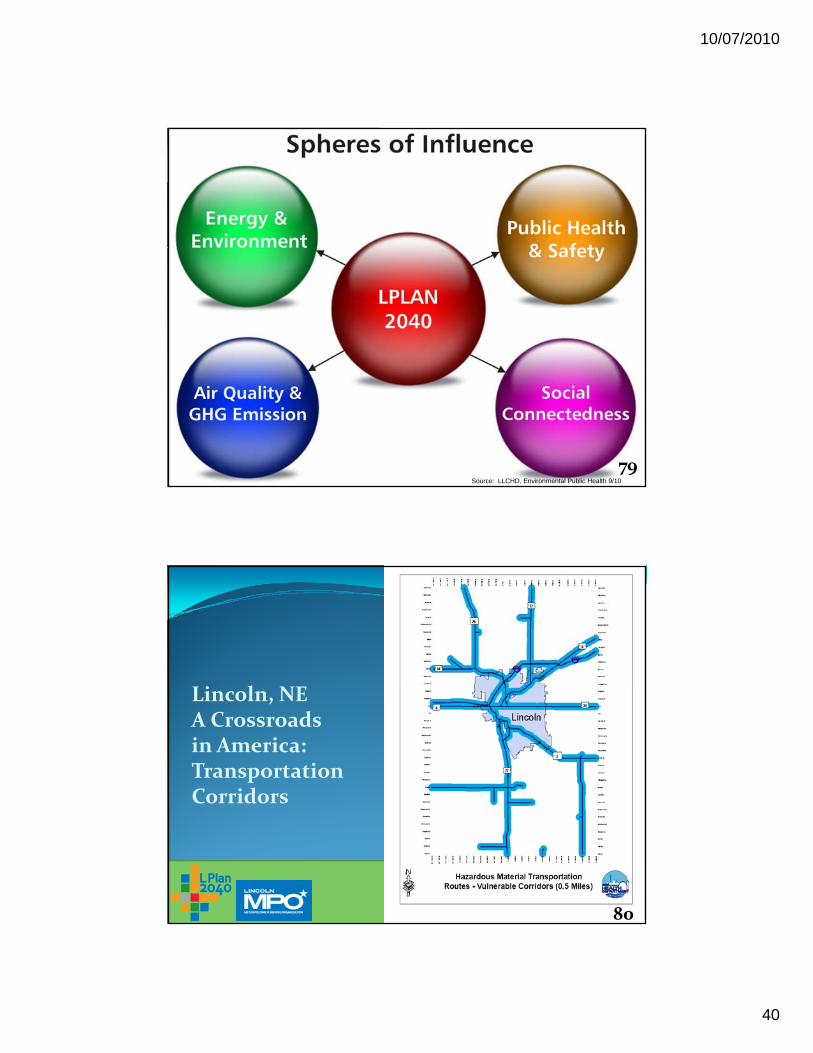
Source: LLCHD, Environmental Public Health 9/10
78
10/07/2010
40
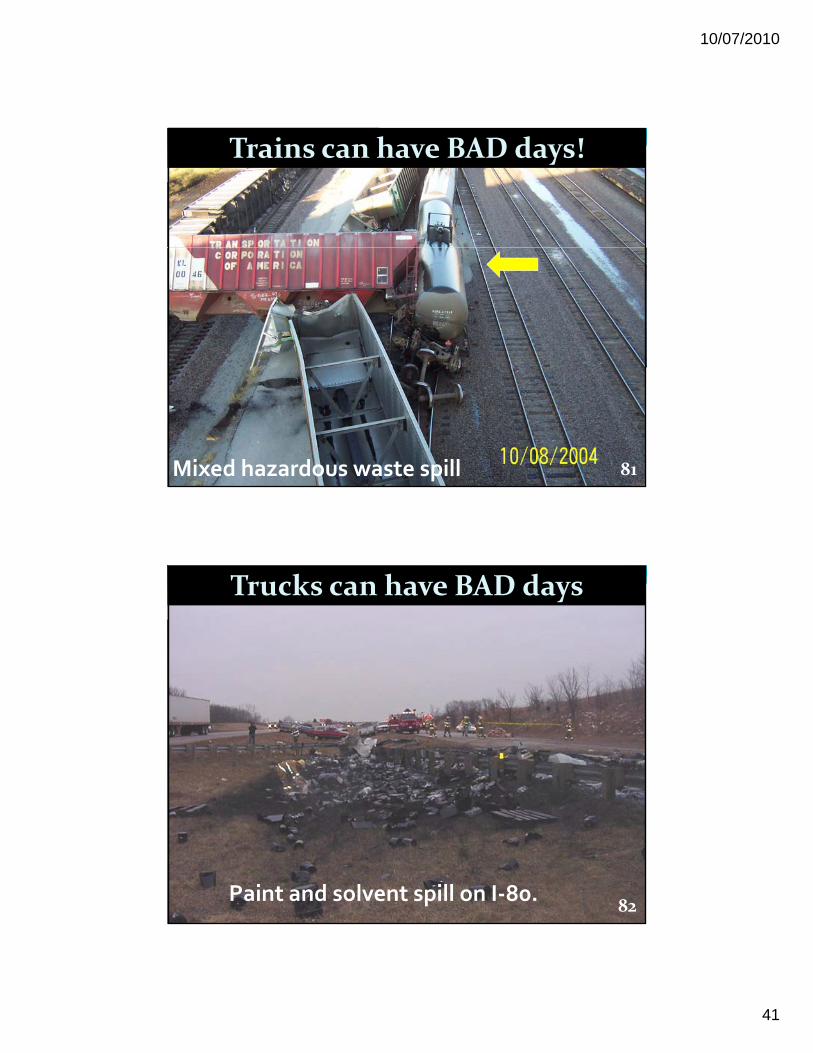
Source: LLCHD, Environmental Public Health 9/10
79
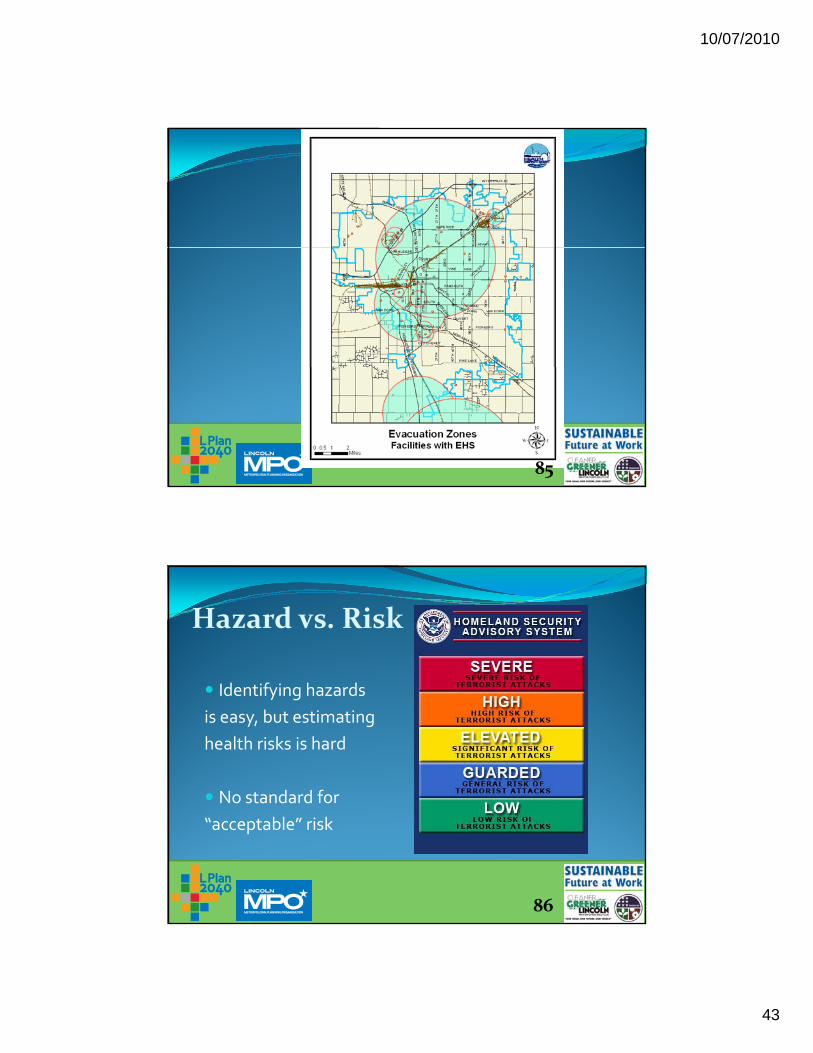
Lincoln, NEA Crossroads in America:Transportation Corridors
80
10/07/2010
41
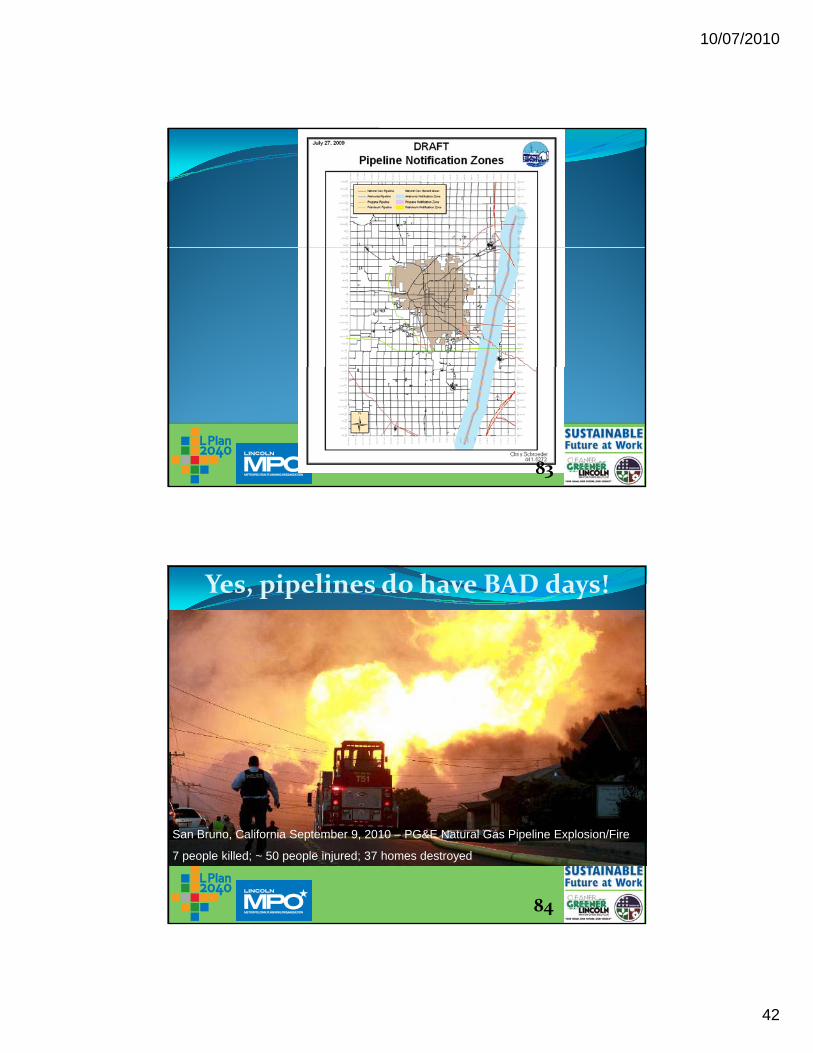
Trains can have BAD days!
Mixed hazardous waste spill 81
Trucks can have BAD days
Paint and solvent spill on I‐80.82
10/07/2010
42
83
Yes, pipelines do have BAD days!
San Bruno, California September 9, 2010 – PG&E Natural Gas Pipeline Explosion/Fire
7 people killed; ~ 50 people injured; 37 homes destroyed
84
10/07/2010
43
85
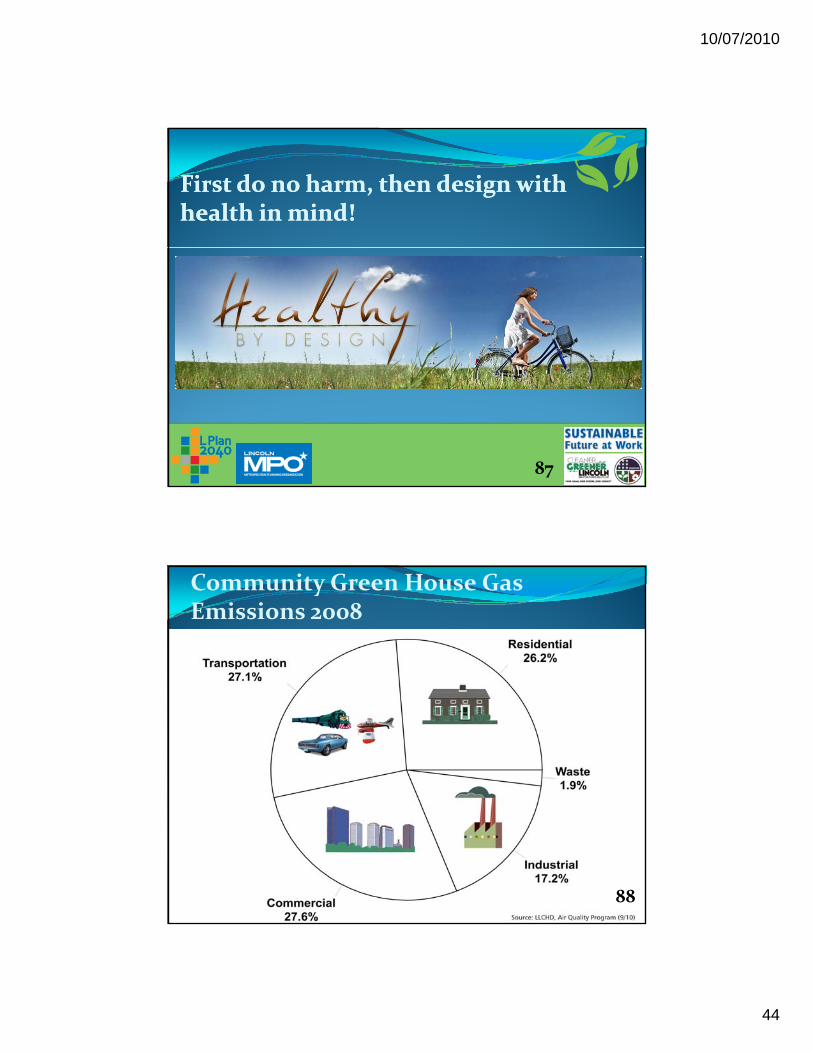
Hazard vs. Risk
Id tif i h d Identifying hazards
is easy, but estimating
health risks is hard
No standard for
“acceptable” risk
86
10/07/2010
44
First do no harm, then design with First do no harm, then design with health in mind!health in mind!
87
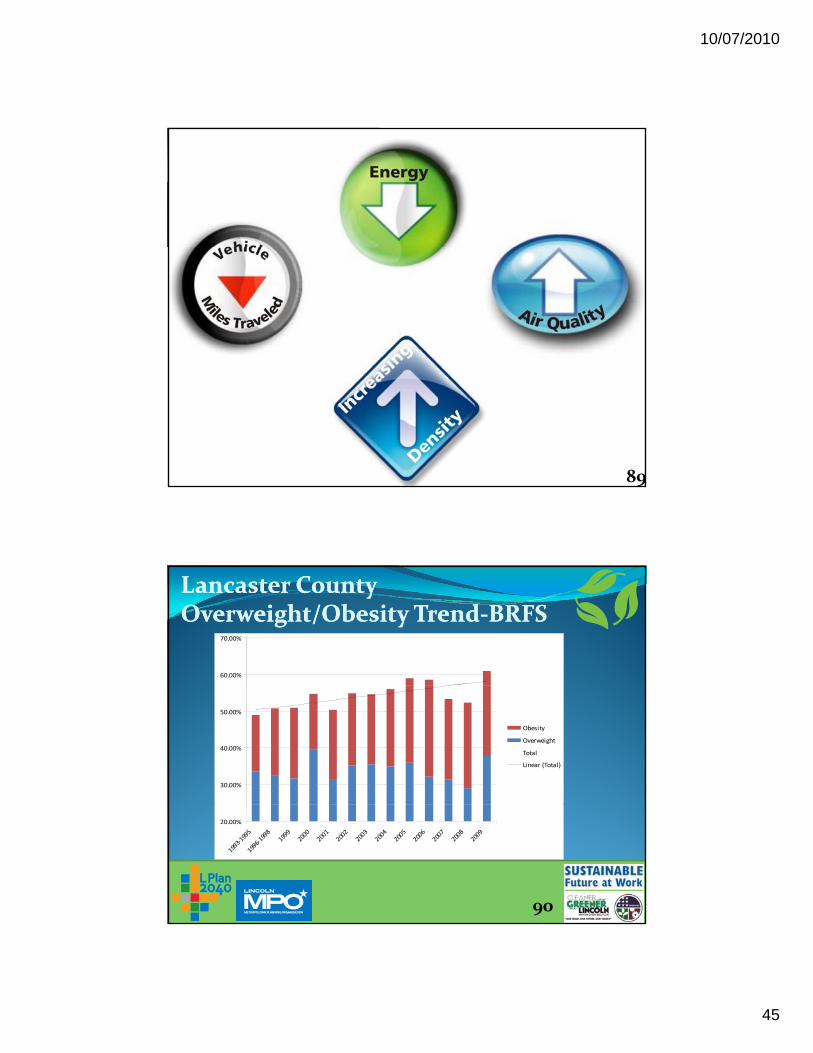
Community Green House Gas Emissions 2008
88
10/07/2010
45
89
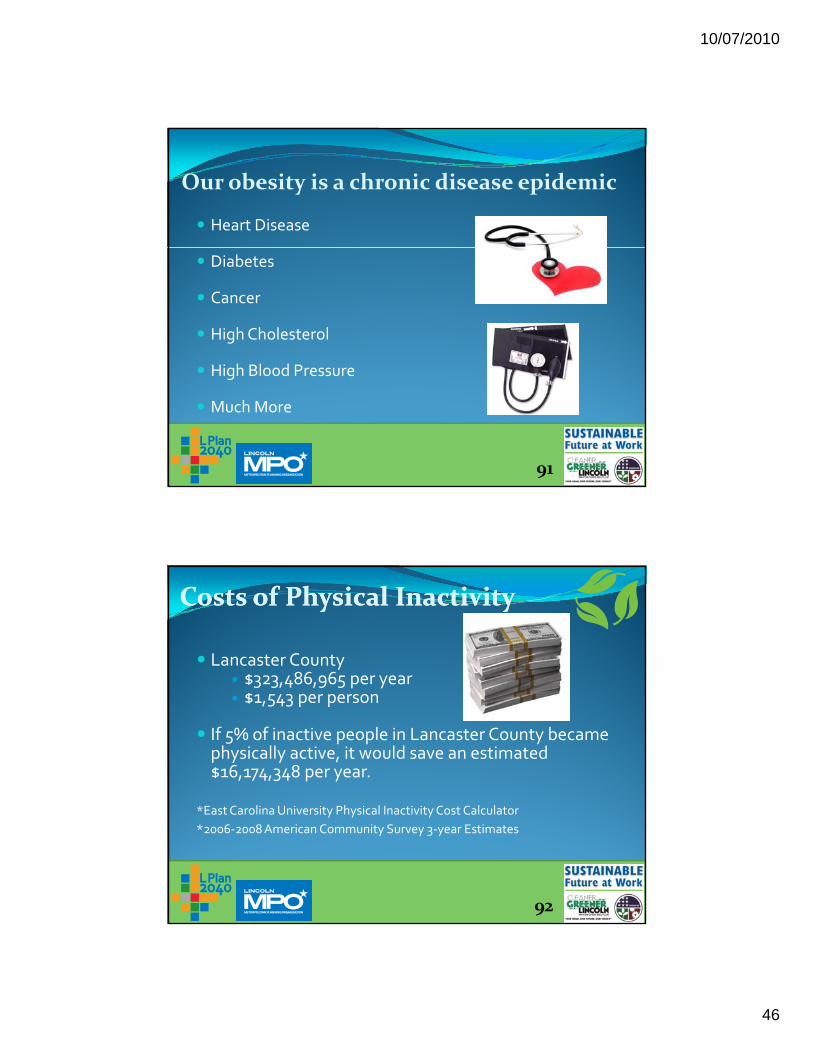
Lancaster County Lancaster County Overweight/Obesity TrendOverweight/Obesity Trend‐‐BRFSBRFS
60.00%
70.00%
30.00%
40.00%
50.00%
Obesity
Overweight
Total
Linear (Total)
20.00%
1993‐1995
1996‐1998
1999
2000
2001
2002
2003
2004
2005
2006
2007
2008
2009
90
10/07/2010
46
Our obesity is a chronic disease epidemic
Heart Disease
Diabetes
Cancer
High Cholesterol
Hi h Bl d P High Blood Pressure
Much More
91
Costs of Physical InactivityCosts of Physical Inactivity
Lancaster County $323,486,965 per year 3 3,4 ,9 5 p y $1,543 per person
If 5% of inactive people in Lancaster County became physically active, it would save an estimated $16,174,348 per year.
*East Carolina University Physical Inactivity Cost Calculator
*2006‐2008 American Community Survey 3‐year Estimates
92
10/07/2010
47
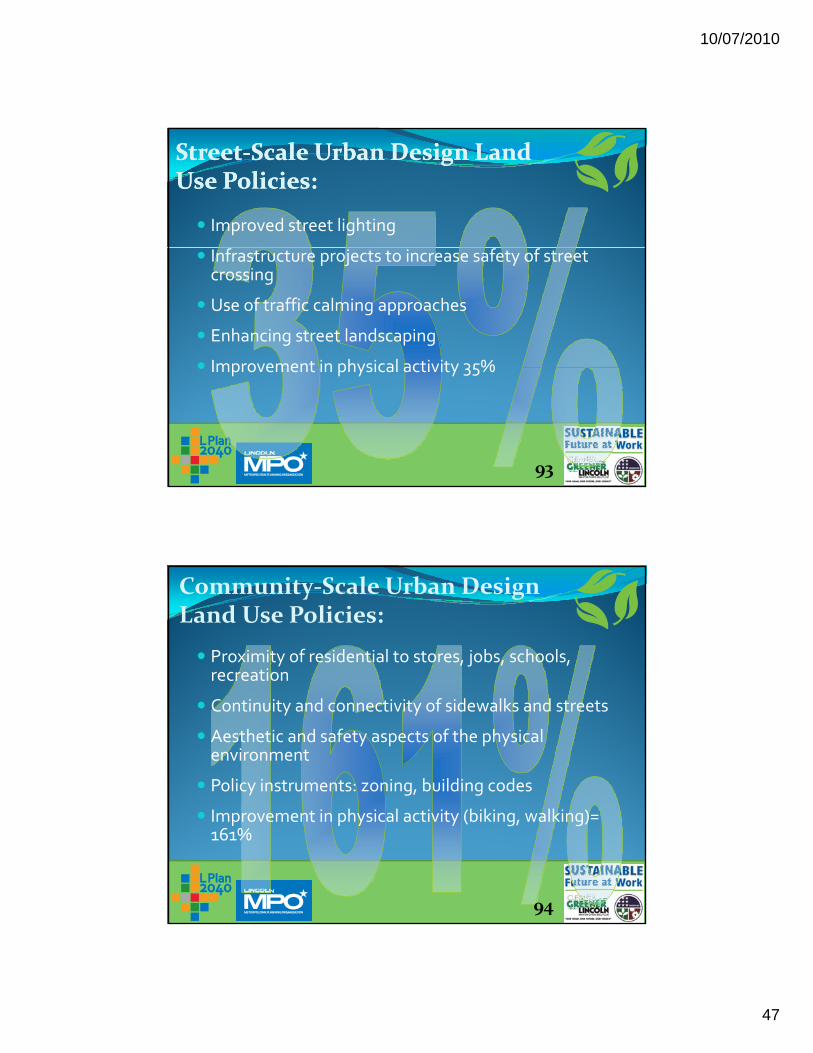
StreetStreet‐‐Scale Urban Design Land Scale Urban Design Land Use Policies:Use Policies:
Improved street lighting
Infrastructure projects to increase safety of street crossing
Use of traffic calming approaches
Enhancing street landscaping
Improvement in physical activity 35% Improvement in physical activity 35%
93
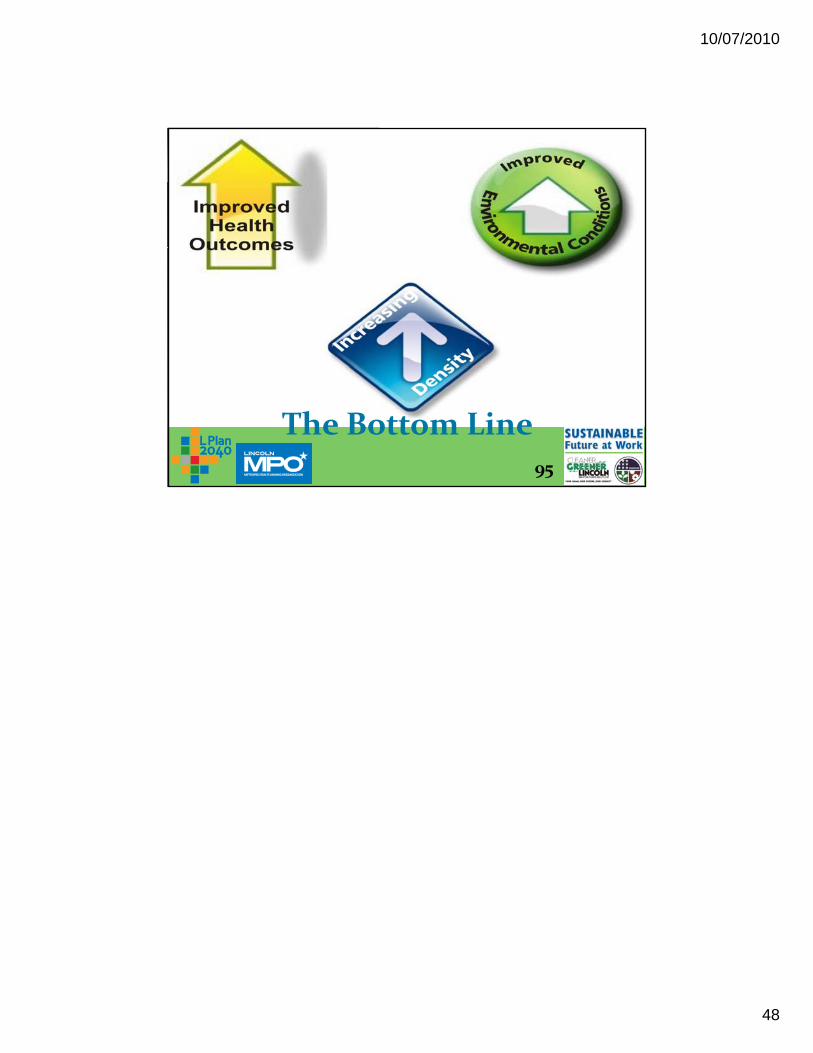
Community‐Scale Urban Design Land Use Policies:
Proximity of residential to stores, jobs, schools, recreation
Continuity and connectivity of sidewalks and streets
Aesthetic and safety aspects of the physical environment
Policy instruments: zoning, building codes
Improvement in physical activity (biking, walking)= 161%
94
10/07/2010
48
The Bottom Line 95


![The Minneapolis journal (Minneapolis, Minn.) 1906-04-16 [p 2]](https://img.pdfslide.net/doc/110x75/61ab1ff1053ee543243f419e/the-minneapolis-journal-minneapolis-minn-1906-04-16-p-2.jpg)