Embed Size (px)
Citation preview

SUSTAINABILITY: AVAILABILITY, DISTRIBUTION
AND CONSUMPTION OF FIREWOOD NEAR
KIDEPO VALLEY NATIONAL PARK Household surveys and forest inventory
Albers, Peggy
2016, August


Keywords; Sustainability, firewood, Uganda
Author: P. Albers
Student number: 911031002
Thesis for the Degree of BACHELOR OF SCIENCE
University of Applied Sciences Van Hall-Larenstein
Course: BSc Forest and Nature Management
Specialisation: Tropical forestry
Facilitating organisation: Ajokis, Community Wildlife Research and Education Centre
Supervisor University: Richard Kraaijvanger
Supervisor Ajokis: Lily Vercruijsse
Velp, August 2016
SUSTAINABILITY: AVAILABILITY, DISTRIBUTION
AND CONSUMPTION OF FIREWOOD NEAR
KIDEPO VALLEY NATIONAL PARK
Household surveys and forest inventory


Preface A final project; the thesis, is obligatory to finish the course BSc Tropical Forestry and Nature
Management at Van Hall-Larenstein University of Applied Sciences. The research for the thesis is
conducted in Uganda and will help contribute to the improvement of the livelihoods of the
communities living in northern Uganda, near Kidepo Valley National Park (NP). This report presents
the motivation for this research, the method of conducting, and the findings of this study.
In Uganda, I worked together with a Community Wildlife Research and Education Centre called
Ajokis located in Karenga. The thesis project is about firewood; mainly Social research is conducted,
to analyse the current firewood availability, distribution and consumption and if the harvest is done
sustainably.
I want to thank Ajokis for assisting me with my research, providing me with a translator and
transport. I want to express my appreciation toward John Loboe who assisted me during my whole
research, being my translator, guide and expert of the region. I also want to show my gratitude
towards Lily Vercruijsse for assisting me in the process of doing research and report writing. I want
to thank Jos Wintermans, Richard Kraaijvanger and Dagmar Riesebos for the help they gave me
during my report writing.
I also want to show my gratitude towards Charlotte van den Berg, for helping me perform my
research and making the time in Uganda real fun.
Peggy Albers
30 August 2016
Abstract Near Kidepo Valley National Park (NP) there is much deforestation happening. Almost all the people
depend on wood, for most, it is the only source of energy, building material and income. Also, the
population size is increasing, and every year previously forested land is converted into agricultural
fields. Through this, the accessibility to the forested areas is increasing, and it is easier to get to the
untouched parts. There is a lack of knowledge, capacity and motivation of the communities to
manage and protect the wood supply. These problems and causes together lead to the biggest
problem in the area; the unsustainable harvest of wood.
This research has the following objective: “By documenting the availability, the consumption and
the distribution of the firewood species used by the communities living near Kidepo Valley NP, a
household survey on firewood use will be conducted in the area. Also, the current location of
woodlots will be inventoried. With this, comparable, defensible and useful data is collected that can
be used to assess if the firewood consumption is sustainable and to find options to improve the
current situation.” Obtaining this information provides a better knowledge of possible solutions and
problems, and options for improving the livelihoods of the communities can be identified. The used
methods are; observation, key informant interviews, focus group meetings, household surveys, a
forest inventory, a potential biomass productivity, and sustainability evaluation. To reach the
objective the research question “Is the firewood consumption of the local communities living near
Kidepo Valley National Park sustainable?” was posed and answered.
The mean annual wood biomass yield increment for Eucalyptus tereticornis is 4.945,14 kg/ha and for
Acacia albida 3.220,77 kg/ha. The total area has a mean annual wood biomass yield increment of
39.561,12 kg for Eucalyptus tereticornis and Acacia albida 25.766,16 kg. In the dry season, most
collect daily and walk up to five hours and five kilometres from their compound to the woodlots from
which they collect. On average one bundle of firewood sustains a household for 2,3 days and weighs
27,2 kg. The mean annual consumption per household is 4.316,5 kg and per capita 501,9 kg. The
entire community of the study area needs 7.528.500 kg of firewood yearly.
This research was able to conclude that the harvest is not done sustainably. The total yield is
estimated at 39.561,12 kg for Eucalyptus tereticornis and at 25.766,16 kg for Acacia albida, which are
both much lower than the total use of 7.528.500 kg. The community members do not want to walk
far, which leads to overharvesting in the areas closer to the compounds, but leaves options for
improvement.
Within a larger area, there is a possibility to sustainably harvest. Another option is to set up plots
closer to the compounds with permanently managed firewood. Working in groups together has
shown to reduce the firewood consumption. There is the possibility of utilising the resources within
the NP.

Abbreviations AWF African Wildlife Foundation
Ba The annual total net biomass production
bc Daily gross photosynthesis rate of standard vegetation canopies on very clear days
Bm The mean annual total biomass increment
bo Daily gross photosynthesis rate of standard vegetation canopies on overcast days
Bw The constraint-free mean annual wood biomass yield increment
CDDF Community driven development fund
Ct The maintenance respiration
Dbh Diameter at breast height
GIS Geographical Information System
Hi Harvest index
LAI Leaf Area Index
LEC Local Environment Committee
LGMSD Local Government management service delivery
LGP Length of Growing Period
NGO Non-Governmental Organisation
NP National Park
NUSAF North Uganda Social Action Fund
OXFAM Oxford Committee for Famine Relief
Pm The rates of maximum photosynthesis
PRA Participatory Rural Appraisal
UBOS Uganda Bureau of Statistics
UWA Uganda Wildlife Authority

List of Figures Figure 1, woman collecting firewood ................................................................................................ 1 Figure 2, a woman at her homestead with some of her grandchildren .............................................. 2
Figure 3, Parish Karenga .................................................................................................................... 6 Figure 4, Soil map .............................................................................................................................. 6
Figure 5, Mean Annual Precipitation in Uganda................................................................................. 7
Figure 6, Election day in the study area ............................................................................................. 9 Figure 7, GIS Classified map of the study area ................................................................................ 22
Figure 8, Total yield and consumption compared ........................................................................... 25 Figure 9, Focus group meeting discussion points ............................................................................ 57
Figure 10, Classified map of the study area ..................................................................................... 59
Figure 11, Transect 1 ....................................................................................................................... 61 Figure 12, Transect 2 ....................................................................................................................... 63
List of Tables Table 1, Population counting ............................................................................................................. 8
Table 2, Overview of the methodology ............................................................................................ 10 Table 3, Socio-demographic characteristics of the respondents ..................................................... 18
Table 4, Firewood species ............................................................................................................... 19 Table 5, Alternatives ........................................................................................................................ 19
Table 6, Availability: Coping with shortage..................................................................................... 19
Table 7, Wet season & Dry season ................................................................................................... 20 Table 8, Location collection ............................................................................................................. 20
Table 9, Time, Distance and Frequency ........................................................................................... 20 Table 10, Who is responsible for the collection ............................................................................... 20
Table 11, Use, Buy and Collect type of fuel ...................................................................................... 21
Table 12, Preferred quality .............................................................................................................. 21 Table 13, Frequency and Reason of fire ........................................................................................... 21
Table 14, Consumption of firewood bundles ................................................................................... 21 Table 15, Weight of firewood bundles ............................................................................................. 24
Table 16, Overview of the location of the study ............................................................................... 44
Table 17, Transect 1 ......................................................................................................................... 60 Table 18, Transect 2 ......................................................................................................................... 62

Table of content Preface
Abstract
Abbreviations
List of Figures
List of Tables
1. Introduction ................................................................................................................................ 1
1.1 Problem .............................................................................................................................. 1
1.2 Objective ............................................................................................................................ 3
1.3 Research questions ............................................................................................................. 3
1.4 Preconditions and pre-limitation ........................................................................................ 3
1.5 Organisation ....................................................................................................................... 4
1.6 Report outline ..................................................................................................................... 4
2. Site description .......................................................................................................................... 5
2.1 Location .............................................................................................................................. 5
2.2 Topography ........................................................................................................................ 5
2.3 Soils .................................................................................................................................... 6
2.4 Climate ............................................................................................................................... 7
2.5 Vegetation .......................................................................................................................... 7
2.6 Inhabitants .......................................................................................................................... 8
2.7 History ................................................................................................................................ 9
3. Methodology ............................................................................................................................ 10
3.1 Interviews ......................................................................................................................... 10
3.1.1 Preparation of the household surveys and key informant interviews ........................... 10
3.1.2 Household surveys ....................................................................................................... 12
3.1.3 Limitations .................................................................................................................... 12
3.2 Forest inventory ............................................................................................................... 13
3.2.1 GIS ................................................................................................................................ 13
3.2.2 Transects ....................................................................................................................... 13
3.2.3 Limitations .................................................................................................................... 14
3.3 Potential biomass productivity and sustainability evaluation ........................................... 14
3.3.1 Mean annual wood biomass yield increment ............................................................... 14
3.3.2 Consumption ................................................................................................................ 15
3.3.3 Evaluating the sustainability ......................................................................................... 15
4. Results ...................................................................................................................................... 16
4.1 Interviews ......................................................................................................................... 16
4.1.1 Observations ................................................................................................................ 16
4.1.2 Key informant interviews .............................................................................................. 16
4.1.3 Household surveys ....................................................................................................... 18
4.2 Forest inventory ............................................................................................................... 22
4.2.1 Image classification map – GIS ..................................................................................... 22
4.2.2 Transects ....................................................................................................................... 23

4.3 Potential biomass productivity and sustainability evaluation ........................................... 23
4.3.1 Mean annual wood biomass yield increment ............................................................... 23
4.3.2 Consumption ................................................................................................................ 24
4.3.3 Evaluation the sustainability ......................................................................................... 25
5. Discussion ................................................................................................................................ 26
5.1 Availability ....................................................................................................................... 26
5.2 Distribution ....................................................................................................................... 27
5.3 Consumption .................................................................................................................... 28
5.4 Evaluation sustainability ................................................................................................... 30
6. Conclusion & Recommendations .............................................................................................. 32
6.1 Communities .................................................................................................................... 32
Stove use .......................................................................................................................... 32
Woodlot management ...................................................................................................... 32
Agroforestry ..................................................................................................................... 33
Group work ...................................................................................................................... 33
National Park .................................................................................................................... 33
Trust .................................................................................................................................. 33
6.2 Further research ............................................................................................................... 33
Bibliography .................................................................................................................................... 35
Appendixes...................................................................................................................................... 39
1. Appendix – Problem tree ..................................................................................................... 41
2. Appendix – Stakeholder analysis ......................................................................................... 42
3. Appendix – Map of the research area .................................................................................. 43
4. Appendix – Visited villages ................................................................................................. 44
5. Appendix – Key informant interviews .................................................................................. 45
6. Appendix – Household Survey ............................................................................................. 46
7. Appendix – Transect form .................................................................................................... 47
8. Appendix – The mean annual wood biomass yield increment ............................................. 48
8.1 Acacia albida ................................................................................................................ 48
8.2 Eucalyptus tereticornis ................................................................................................. 49
9. Appendix – Observations ..................................................................................................... 50
10. Appendix - Key informant answers................................................................................... 51
9.1 Parish chiefs .................................................................................................................. 51
9.2 Pastor David .................................................................................................................. 53
9.3 Cultural Group .............................................................................................................. 54
9.4 Rangers of UWA ............................................................................................................ 55
11. Appendix – Karenga cultural group ................................................................................. 57
12. Appendix – Location household surveys .......................................................................... 58
13. Appendix – Classified map ............................................................................................... 59
14. Appendix – Results; Transects .......................................................................................... 60

1
1. Introduction This chapter functions as an introduction to this report and the research; the problem is described,
after which the objective and research questions are given, to finish this chapter with the outline of
this report.
For many people living on this planet firewood (firewood and charcoal) is the only available and
affordable source of energy, primarily in non-industrialized areas where the demand for firewood
by far exceeds the demand for commercial timber. In many countries firewood accounts for up to
90% of the total fuel used. Almost all the rural households use firewood for cooking, food processing
and heating, but industries also rely on firewood; restaurants, brick burning and brewing. (FAO,
1985) In many cities firewood is still the predominant source of energy, this leads to a concentration
of the demand for firewood and acute firewood scarcity. Urban firewood shortage affects many
people; a study conducted by the Food and Agriculture Organisation of the United Nations (FAO)
revealed that already eighteen African countries, including Uganda, are affected. (FAO, 1985)
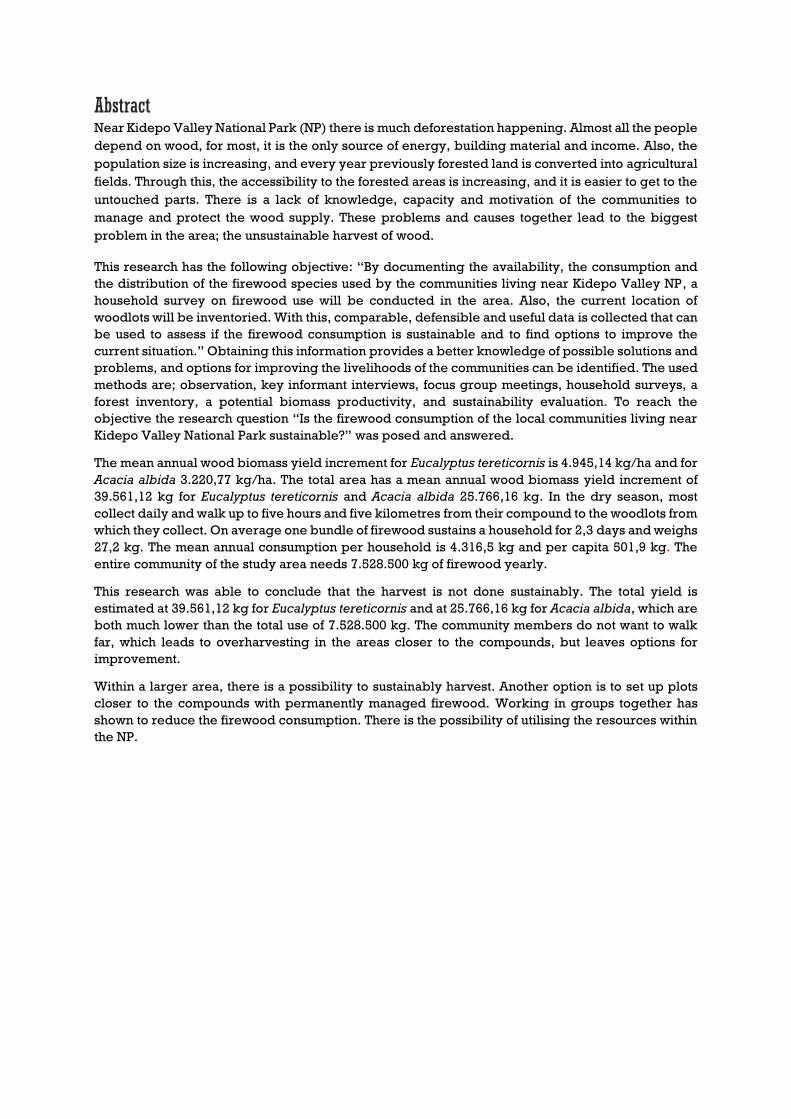
The rural communities living near Kidepo Valley National Park (NP)
and its corridor rely on wood as a source of energy. The corridor is an
area that exists to protect the animals and their migration routes; it
borders the NP and connects multiple parks with each other. The
corridor is not yet indicated, and no one exactly knows where the
boundaries of the corridor are. As mentioned before, firewood is
mostly for domestic use but also for small-scale industries such as
brick making and restaurants. The households collect firewood
bundles, as is shown in Figure 1, these are head loads of cut or
collected wood and vary in size depending on how strong the person
who is collecting is (A. Egeru, Kateregga, & Majaliwa, 2014). If the
available firewood ceased to exist, the households living here would
be subjected to livelihood insecurity. In the past, it was a dangerous
place, with much civil unrest, see Chapter 3.5 History. Nowadays it is
quiet, but there has not been much progress in the development of the
area.
1.1 Problem The biggest problem in the area is the unsustainable harvest of wood. Appendix 1 shows the
problem tree with the problems and causes in the area related to this study. The problem and causes
are identified through what was seen and heard during the first weeks of the research. Also,
literature was consulted to gain a more refined understanding of the problem. Below the underlying
causes and problems are listed:
For many people firewood is the only source of energy, there is a lack of affordable and
available alternative fuel sources. (A. Egeru et al., 2014)
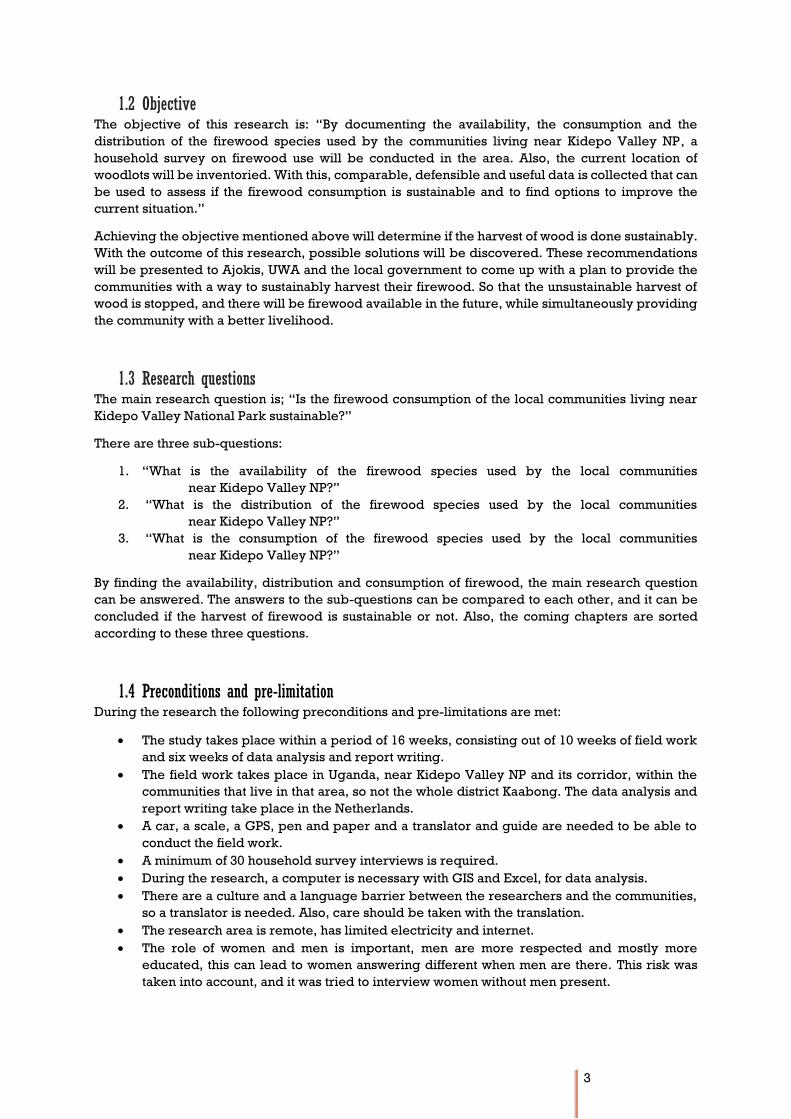
For most community members the only affordable option for building material is
biomaterial. To build the houses wooden poles are needed and to protect their land and
homestead wooden fences are created (see Figure 2).
There are few possibilities to get an income, people rely on wood to obtain an income, by
making bricks and charcoal, both use a lot of firewood.
The knowledge, capacity and motivation of the communities are lacking, they have limited
knowledge on how to manage an area and protect or increase the wood supply.
Further, their understanding of the laws and regulation concerning firewood collection is
not sufficient, and often they do not understand the necessity of protecting the forest.
Figure 1, woman collecting firewood

2
The lack of knowledge is related to the inadequate schooling most people got because there
was unrest and war when they grew up.
The laws and regulations that are in place are limited and widely unknown, and the control
and punishments are limited.
The government does help, but can support more. They have good plans to improve the
livelihood of their citizens but often are lacking real improvement.
There are little options to obtain income and food can be scarce, for this reason, the
communities practice burning. They will set a large piece of land on fire, to be able to catch
an edible rat which is a local delicacy. When the fire is distinguished the landscape will be
clear of vegetation and the holes of the animal can be found. Unfortunately, while burning
the area all the dead wood will be burned as well, this leads to less available firewood and
together with the problem of “more wood is needed” causes the problem of cutting live
trees.
Currently, many people live in the area, and their size is increasing. The current population
of Uganda is estimated at almost 42 million, and although Uganda‘s population growth rate
of 3,2%, is projected to drop to 2,4% by the year 2040, the total population will increase to
61 million in 2040. (Uganda R. o., 2015) This population growth means there are too many
people harvesting firewood without regulating or controlling or other management options
to increase the available wood.
In the study area it is tradition to have
more than one wife and how many
children you have corresponds with your
status, the more children, the higher your
social status, thus there are many large
families (see Figure 2), which means even
more people will have need of the wood
sources. Although, this is changing a
little, in recent years the household sizes
are not as big as before.
The growing population bring another
problem; the conversion of forest, shrub
and bush land into agriculture. Many forested areas will be converted, and there will be a
loss in the available firewood supply.
The accessibility to the forested areas is also increasing, because the roads are improving
and because people move to more remote areas to practice agriculture. The consequence
is even the more remote areas are no longer safe from deforestation.
The communities are not allowed to collect firewood from inside the NP without supervision
because it is not safe, this means there is a limited supply of firewood, and many people are
collecting and cutting close to the villages.
There will be numerous stakeholders that could have an impact or could be affected by this
research. In Appendix 2 – Stakeholder analysis, these stakeholders and their interests, how they are
affected, and their capacity and motivation to bring about change are shown, also, possible actions
to address problems are addressed.
Figure 2, a woman at her homestead with some of her
grandchildren
3
1.2 Objective The objective of this research is: “By documenting the availability, the consumption and the
distribution of the firewood species used by the communities living near Kidepo Valley NP, a
household survey on firewood use will be conducted in the area. Also, the current location of
woodlots will be inventoried. With this, comparable, defensible and useful data is collected that can
be used to assess if the firewood consumption is sustainable and to find options to improve the
current situation.”
Achieving the objective mentioned above will determine if the harvest of wood is done sustainably.
With the outcome of this research, possible solutions will be discovered. These recommendations
will be presented to Ajokis, UWA and the local government to come up with a plan to provide the
communities with a way to sustainably harvest their firewood. So that the unsustainable harvest of
wood is stopped, and there will be firewood available in the future, while simultaneously providing
the community with a better livelihood.
1.3 Research questions The main research question is; “Is the firewood consumption of the local communities living near
Kidepo Valley National Park sustainable?”
There are three sub-questions:
1. “What is the availability of the firewood species used by the local communities
near Kidepo Valley NP?”
2. “What is the distribution of the firewood species used by the local communities
near Kidepo Valley NP?”
3. “What is the consumption of the firewood species used by the local communities
near Kidepo Valley NP?”
By finding the availability, distribution and consumption of firewood, the main research question
can be answered. The answers to the sub-questions can be compared to each other, and it can be
concluded if the harvest of firewood is sustainable or not. Also, the coming chapters are sorted
according to these three questions.
1.4 Preconditions and pre-limitation During the research the following preconditions and pre-limitations are met:
The study takes place within a period of 16 weeks, consisting out of 10 weeks of field work
and six weeks of data analysis and report writing.
The field work takes place in Uganda, near Kidepo Valley NP and its corridor, within the
communities that live in that area, so not the whole district Kaabong. The data analysis and
report writing take place in the Netherlands.
A car, a scale, a GPS, pen and paper and a translator and guide are needed to be able to
conduct the field work.
A minimum of 30 household survey interviews is required.
During the research, a computer is necessary with GIS and Excel, for data analysis.
There are a culture and a language barrier between the researchers and the communities,
so a translator is needed. Also, care should be taken with the translation.
The research area is remote, has limited electricity and internet.
The role of women and men is important, men are more respected and mostly more
educated, this can lead to women answering different when men are there. This risk was
taken into account, and it was tried to interview women without men present.

4
1.5 Organisation The organisation where this research took place is an NGO called Ajokis Community Wildlife
Research and Education Centre, located at Buffalo Base in Karenga in northern Uganda. The
education centre is currently being re-established, after years of local unrest and war. Ajokis
focuses on the conservation of Kidepo Valley NP and its surroundings, by working together with the
local communities on different projects. There is not much known about the surroundings yet,
together with students and volunteers Ajokis wants to perform research to gain more knowledge
about the area. For this thesis, the focus will be on the topic of deforestation and the possibilities
with reforestation.
1.6 Report outline In the current chapter, the research is introduced, the problems and causes thereof are mapped out.
The process of setting an objective and research question is elaborated. The second chapter gives
the site description, with information about the location, topography, soils, climate, vegetation,
inhabitants, history and the organisation. Followed by the methodology in Chapter 3, in which the
used methods are elaborated. The method is followed by Chapter 4: the results sorted per research
question. Chapter 5 shows the conclusions that can be drawn from the research. In Chapter 6 the
results are discussed. The final chapter consists of recommendations, here recommendations and
possible solutions for the biggest problem are given.
This report is written primarily for the Community Wildlife Research and Education Centre Ajokis,
the sub-county Karenga and the Ugandan Wildlife Authority (UWA) so that this report can help
improve the livelihoods of the communities.
5
2. Site description This chapter serves to inform about the study area. First, the location will be shown, then the
topography and climate. Hereafter the inhabitants and their history will be explained, to end with
the organisation where the research took place.
2.1 Location The research took place near Kidepo Valley NP in Northern Uganda, in the communities that live
next to the park and its corridor. On the map in Appendix 3, the location of the research area is
shown, the map shows the NP and the main town in the area; Karenga.
Kidepo Valley NP is a 1.442 square kilometre park founded by the British colonial government in
1958 to protect the wildlife. According to the Kidepo Valley NP website (Uganda K. N., 2015): “the
park is one of Uganda’s prime most remote but spectacular national parks, which harbours scenery
unsurpassed in any other park in East Africa.”
Uganda is divided first into four administrative regions; Western, Central, Eastern and Northern.
Each administrative region has many districts, in total 112 as of August 2014. (UBOS, 2014) The
districts are divided into counties, which are divided into sub-counties and the sub-counties in its
turn into parishes, within these parishes many villages are located. (UBOS, 2014) This division keeps
shifting; for instance, new districts are created by splitting up larger districts. On 6 September 2015,
Redpepper posted an article online (Our Reporter, 2015); it reads “Parliament Creates 23 New
Districts”. The article stated that the creation of 23 new districts has finally been approved. For the
research area this is positive because as of July 1, 2019, Karenga will become a district. (Our
Reporter, 2015) According to the parish chief of Karenga, this brings many advantages to Karenga,
such as more finance.
The study area is located about 700 km from Uganda’s capital; Kampala. The study area is located
in the district Kaabong, in the sub-counties Kamion, Karenga and Kawalokol and within numerous
parishes and villages. An overview of the visited sub-counties, parishes and villages are shown in
Appendix 4 – Visited villages. There is no electricity or tar road reaching this area, but the
community members in the area said the president promised it is coming. Although, the electricity
will be too expensive for most. The road will bring positive results to the area. The tar road will
reach into South-Sudan and will make the area more easy to reach. Some of the small businesses in
the area already have small solar panels to charge their phone batteries, to listen to the radio and
light their shops at night, and will benefit from the electricity. The improved accessibility will also
improve the trade market, and tourism will increase, both leads to the improvement of their well-
being.
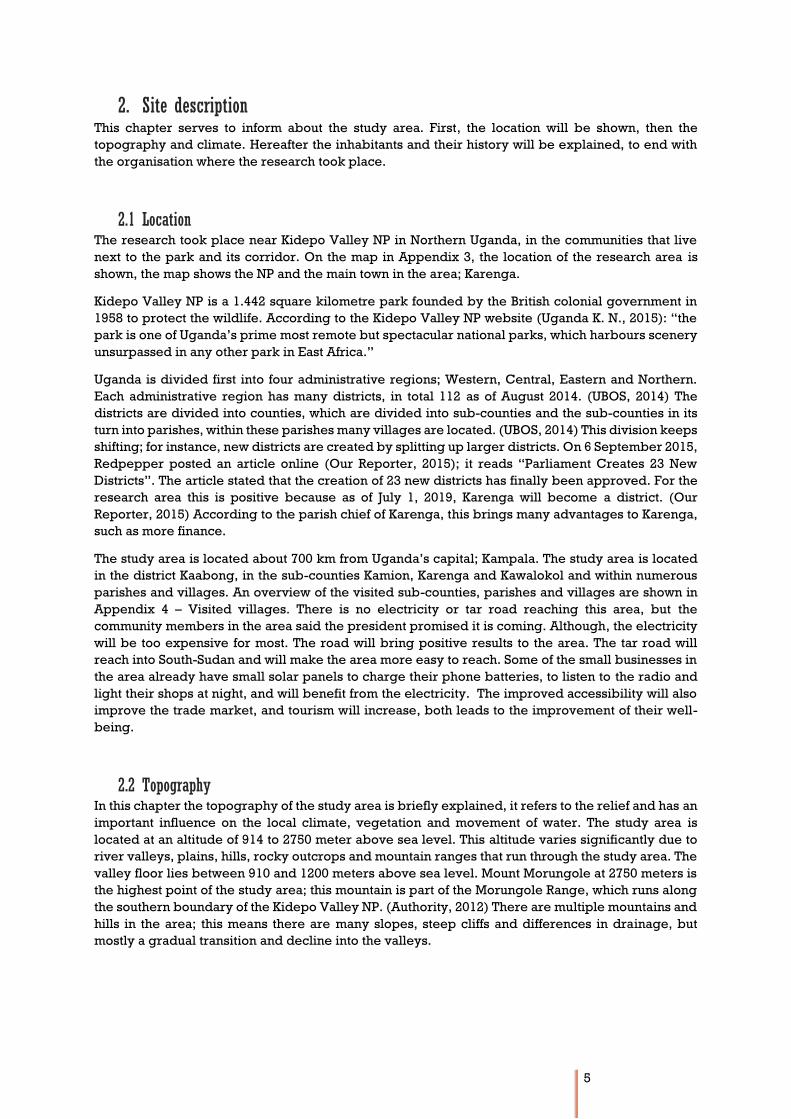
2.2 Topography In this chapter the topography of the study area is briefly explained, it refers to the relief and has an
important influence on the local climate, vegetation and movement of water. The study area is
located at an altitude of 914 to 2750 meter above sea level. This altitude varies significantly due to
river valleys, plains, hills, rocky outcrops and mountain ranges that run through the study area. The
valley floor lies between 910 and 1200 meters above sea level. Mount Morungole at 2750 meters is
the highest point of the study area; this mountain is part of the Morungole Range, which runs along
the southern boundary of the Kidepo Valley NP. (Authority, 2012) There are multiple mountains and
hills in the area; this means there are many slopes, steep cliffs and differences in drainage, but
mostly a gradual transition and decline into the valleys.

6
The NP is located in the lowest part of the
area, at the valley and plains. The corridor
is mostly located on the plains. The
villages are located at the foot of hills and
mountain ranges, as is shown in Figure 3,
but this is changing; the communities are
increasingly living in the lower parts too.
Except for the Ik, who live high in the
mountains of the Morungole Range (see
Chapter 2.6).
2.3 Soils According to the UWA (Authority, 2012), the lower parts of the study area predominantly consists
out of clay soils. In the more northern part, predominantly black chalky clay and sandy clay loam
soils and the south, south-west freer-draining red clays and loams are found. The soil map in Figure
4 was extracted from ISRIC, through the Soil Grids website. (World Reference Base Group, 2014)
The map shows most communities and their agricultural fields are located on Cambisols, Vertisols
and Luvisols. Cambisols are young soils that are likely to develop into Luvisols, because of their
limited age; these soils are only moderately developed. Cambisols are intensively used as
agricultural land and are quite fertile. Luvisols are slightly acid soils with a clay-enriched subsoil
and a high nutrient-holding capacity. Most often these soils have a good water-holding capacity.
The characteristics mentioned above mean these soils are fertile and suitable to practice
agriculture. Vertisols are clay-rich soils; the clay minerals can hold much water. These Vertisols
cause very fertile soils, but with a difficult clay-rich top soil. (Driessen, 2001) The soils mentioned
above are the most important soils in the study area because they are the most common ones and
are dominant in the area.
Figure 4, Soil map
Figure 3, Parish Karenga

7
2.4 Climate The climate zone of the study area is classified as Equatorial Savannah with a dry winter. The climate
in the study area changes from Arid to Semi-Arid. The study area knows two seasons, a wet season
and a dry season. The wet season is from April to October and followed by the dry spell for the rest
of the year. However, the area can be subjected to droughts and more often the wet season is
divided into one short wet season, a short drought and followed again by a short wet season to finish
the year with another dry season. According to the ISRIC soils of Africa book (Jones, A., 2013); the
mean annual temperature is between 20-25°C. However, during the dry season, there are very hot
north-easterly monsoon winds which lead to extreme temperatures (40°C), drought and little green
vegetation. The mean annual precipitation in the study area is between 750 and 1000 mm as shown
in Figure 5. Towards the west the annual precipitation increases, but that is no longer located within
the study area and lies beyond the scope of this research. The study area becomes even arider
towards the east. In the Kidepo Valley NP, the average annual rain is 800 mm (Authority, 2012).
In Kidepo Valley NP the surface water only flows during the wet season and disappears in the dry
season. However, in the Narus Valley, the surface water flow alternates to subterranean flow and
emerges at a few permanent water points throughout the year. (Authority, 2012) In the communities,
the only source of water is through water pumps, which are located at several points throughout the
area.
2.5 Vegetation The vegetation is formed by climate and soil fertility, in this case, the vegetation type is open tree
savannah, except for the mountains and hills, where the vegetation is a mosaic of forest and
savannah woodland. The open tree savannah is dominated by grass with numerous widely spaced
trees. The grass and grass-like plants form a continuous cover, and 5 to 30% are covered by trees
or shrubs. As mentioned in the previous chapter, the study area has a division of wet and dry
seasons. During the dry season, the grasses are dormant, and the blades are all dead and dried out,
also the trees experience water stress. The grasses and dead foliage are very flammable, and fires
are common, either natural or manmade. Because of the frequency of the fires, the tree density stays
low. (Knapp, Alan K., 2001)
Figure 5, Mean Annual Precipitation in Uganda

8
Savannahs are a zone of high biodiversity for both flora and fauna. The savannahs cover over 65%
of Africa; they primarily consist out of grasses scattered with thorny acacia, eucalyptus and baobab
trees. According to a study done in the area by D. Aleper (2008), the study area is dominated by
Acacia sieberiana, especially in young regenerating stages (up to 85% of the woody vegetation).
Acacia sieberiana is a species widely used by the local community for firewood, charcoal, tools and
building material. This report also states other common tree species in the area; Balanites aegyptica
(Desert Date), Acacia gerrardii, Kigelia pinnata (sausage tree) and Combretum.
2.6 Inhabitants The people that live in the area are from three tribes; mainly the Karamajong and a small part are
the Dodoth and Ik, but most of the study area is located in the Karamajong region. The Karamajong
used to be cattle herders and raiders but nowadays they are farmers in combination with herding
cattle. Likewise, the Dodoth live from both agriculture and cattle herding. The Ik, on the other hand,
live on the top of the Mount Morungole. It is a small tribe; they used to live in the lowlands but were
forced out with the creation of Kidepo Valley NP. The Ik practice agriculture on the steep slopes of
the mountain, the tribe, is isolated and hard to reach. (Jones, A., etc., 2013) The Dodoth live farther
away from the NP, and its corridor and they do not collect firewood from there. Therefore they were
not included in this research.
The population density is estimated by Jones (2013) at around 10 to 25 people per square kilometre.
In reality, the population lives in small villages and for the most part, the area is uninhabited. In the
boundary area of the NP and inside the corridor no one lives because that is not allowed and it is
dangerous, as there are many buffalo and elephants there. In Uganda, the population is measured
every four years; the local governments do this. In the case of this study, the local government is the
district Kaabong; the last counting was in 2015. An overview of the outcome of this counting hang
inside the sub-county office of Kawalakol, the relevant numbers are shown in Table 1.
Table 1, Population counting
The overview that hung in the office shows the
different sub-counties and the number of their
inhabitants, in the district Kaabong. As mentioned
before the research took place in a part of this
District, in the sub-counties: Kawalakol, Karenga
and Kamion. The population of the study area is the
sum of these sub-counties, but for the sub-counties
Kawalakol and Kamion, this population size is misleading. In the sub-counties, Kamion only the Ik
themselves were subjected to the research and in the sub-counties, Kawalakol only two villages
neighboured the NP, so only these two were subjected to the research. The same goes for Karenga
sub-county, only the villages that border the NP and corridor are subjected to the research. Taking
this knowledge into account, a calculated guess about the population size of the research area is
made; Kamion almost no one lives in the study area, Karenga about half and Kawalakol also about
half, so about 15.000 people live in the area. A more exact number of the population could not be
determined because it was not possible to obtain that data. None of the county offices and
government officials could give an exact number of the citizens per village or parish.

9
2.7 History The history of Uganda especially the north is full of violence. In 1962 Uganda became independent
from Britain, this conversion went relatively peaceful, but that peace did not last very long. Uganda
has many different religions and ethnic groups, which makes the risk of unrest and conflict very
high.
There were multiple different leaders all of them not very good for their country, the unrest in
Northern Uganda was almost constant from the 1970s until 2008. Especially the Lord Resistance
Army (LRA) Uganda is worth mentioning; it came and devastated the area with widespread
abduction, kidnapping, death and mutilation, since the 1990s. Originally, the Karamajong were
warriors and cattle raiders. Their weapons were spears and bow and arrows, they raided each other
and also other tribes and stole their cattle. The LRA caused that most of these cattle raiders came in
possession of guns, which led to extreme violence in the area. Also, it caused the government to
neglect the area until in 2008 the government had a program to disarm the cattle raiders.
Unfortunately, this was an extremely aggressive program, although it did help. Since that year
peace talks were held and that led to a somewhat more peaceful time and relatively stability in the
north, except for the LRA. Joined effort, from Uganda, DR Congo, South-Sudan and the US, caused
the LRA to back down, and they appealed for a ceasefire in 2009. Sadly, the leader remained elusive,
and the safety in the north was still not secure. (Peace Direct, 2014)
Nowadays, all is relatively quiet in Uganda, but until now there is still much unrest in South-Sudan,
which brings problems to the study area. Museveni has been the president of Uganda since 1986.
Officially he has repeatedly been elected, but there was a lot of corruption and fraud with these
elections. He even changed the law; he had the presidential limits abolished so that he could be
elected for his third term. According to the BBC (BCC, 2016), Museveni is credited with restoring
relative stability and economic prosperity to Uganda after years of civil war and repression, but
there is also a lot of criticism against him. It is expected that peace will last in Uganda, but certain it
is not.
During this year’s elections in February,
Museveni won again and currently he is
doing his fourth term. The situation
around the elections was not quiet,
especially in the capital Kampala there
was much unrest, supporters of the
opposition took to the streets to
demonstrate. The police took action with
tear gas and rubber bullets. In the study
area, the elections went smoothly as is
shown in Figure 6. Museveni’s win was
being celebrated by many, and the
supporters of the opposition were quiet.
Because of the wars and unrest in the
past, there is almost no research done in
northern Uganda. Also, its remote
location causes the government and non-
governmental organisations (NGOs), to
until now have little attention for the area.
Figure 6, Election day in the study area

10
3. Methodology This chapter elaborates on the methods used during this research. To begin with, a short overview
of the methods, their expected results and what those results will contribute to, shown in Table 2.
The used methods will be further elaborated in the following chapters, first the interviews, where
after the forest inventory and then the potential biomass productivity and sustainability evaluation
will be explained.
Table 2, Overview of the methodology
Method Result Contributes to
Interviews (Chapter
3.1)
Observations
Key informant interview
answers
Household survey answers
Answering the sub-questions
of availability, distribution
and consumption
Forest inventory (Chapter
3.2)
- GIS
- Transects
Classified map
Data on location, density and
human disturbance of woodlots
Locate woodlots
Ground truthing the GIS
classified map and offers
management options
Potential biomass
productivity and sustainability
evaluation
(Chapter
3.3)
Yield of two species
Consumption of community
Evaluate sustainability of
consumption
Cross-checking
(Chapter 5 – Discussion)
Most reliable data is selected Ensure the viability of the
results
3.1 Interviews The primary method used during this research is Participatory Rural Appraisal (PRA). PRA consists
of the preparation of the household surveys, key informant interviews and household surveys, which
all use semi-structured interviews.
3.1.1 Preparation of the household surveys and key informant interviews Preparing the household surveys consists of; observing, defining the interview questions, defining
communities and people to be interviewed, interview key informants, testing questions and revising
them, and a focus group meeting. These activities take place during the first two weeks of the field
work, 22 February until 6 March.
Observations
The social research starts with observations, to get a first impression of the situation. Observation is
an important tool for collecting information, information about the health of the communities, of the
food products and in this case of the firewood. (SRM, 2014) Observations are done at the market and
in the communities, at their compounds but also on the streets. Observations are written down in
the field and later summarised in Word.
Defining communities and respondents
The second step is determining which communities and people to interview. Identifying the
communities is done by selecting communities that live close to the park. Preferably this is done
with a map, if there is no map, the guide will help select the communities that border the NP and its
corridor. Within the communities, the respondents are randomly selected, by walking through the
community and choosing some households.

11
Formulating interview questions
After selecting the communities, the interview questions are worded. The literature of previous
research is consulted, and the observations are taken into account, to formulate interview questions
for the household surveys. Also, the key informants are interviewed, further to obtain knowledge
on the subject of firewood and of the overall issues in the area.
Key informant interviews
According to M. N. Marshall (1996): “All key informants are regarded as extraordinary by those
around them and usually, but not invariably, occupy a position of responsibility and influence.” The
‘perfect’ key informant interviewee would have the following characteristics, listed by R.G. Burgess
(2003):
- Role in the community: They have access to the information that is sought for this research.
- Knowledge: They have the knowledge to understand the meaning of the
information.
- Willingness: They should be willing, to be honest, and help with their
knowledge.
- Communicability: They should be able to communicate their knowledge.
- Impartiality: They should be objective and unbiased, any relevant biases should
be known to the interviewer.
The key informant interviews are more like a conversation; background information, information
about the user groups and detailed information about specific subjects are collected. The key
informants and interviewee sit at a table or somewhere on the property, to be able to talk without
being disturbed. The key informant will lead the conversation; the interviewer only sometimes
directs the conversation, if the subject is not relevant for the research. For instance, if the key
informant keeps talking about the diseases in the area, but the researcher wants to know about
firewood and related problems, he will ask about firewood. Everything the key informant says is
noted and later analysed.
In Appendix 5 – Key informant interview, the interview questions that served as assistance during
the interviews is shown. This information is qualitative, and it will be summarised in Word, and the
most important issues will be taken into account for this research. The key informants are; the parish
chiefs, the community members, restaurants, schools, the Karenga cultural group, Pastor David and
the Rangers of UWA.
Defining interview questions for the household surveys
With the qualitative information collected from the key informant interviews, the research objective
and questions are redefined if necessary, and the household interview questions are improved if
needed, to more fit the important issues discovered from the key informant interviews.
Focus group meeting
With this set of improved interview questions, a focus group meeting is held with the Karenga
cultural group, to test the initial findings. The resources and use patterns found during the interviews
are discussed in this group. During this meeting, the interview questions are tested, and if needed
revised and improved, this meeting was held in their office.
Data analysis
According to De Hoyos and Barnes (2012) the process of analysing qualitative data, in this instance
the obtained data from the observations, key informant interviews and focus group meeting consists
of:
1. Data collection and management
2. Organising and preparing the data
3. Coding and describing the data
4. Categorising or grouping the data
5. Interpreting the data

12
Data collection and management is explained above, as well as the organising and preparing of the
data. Step 3 Coding and describing the data; all the collected data is coded, the related topics are
coded with the same code so that in step 4 they can be easily grouped or categorised. (De Hoyos &
Barnes, 2012) These coded groups or categories correspond with the research questions and
related topics.
By doing this analyses before the household surveys are conducted, new questions can arise, the
focus of the surveys can change.(De Hoyos & Barnes, 2012)
According to De Hoyos and Barnes (2012), the following is important for maintaining the quality of
the qualitative data:
- Cross-check codes
- Checking outliners
- Check explanations
- Look for contradictions
- Gain feedback from participants
During the cross-checking, it is checked that if an answer deviates too much from the other answers,
it will be left out of the data analysis. While analysing the data, the explanations of the informants
are checked, as well as if there are contradictions in what they say. If that is the case, the answer will
not be reliable, and thus left out of this research. During the focus group meeting, feedback was
gained from participants, so that the interview questions could be improved if they deemed it
necessary.
3.1.2 Household surveys For the household surveys, the tested and revised interview questions defined during the
preparation and key informant interviews are used. During week 3-8 as many interviews as possible
are held (7 March – 17 April), most through household surveys. The household surveys are semi-
structured interviews to acquire detailed information on firewood. A semi-structured interview is a
formal interview, in which the researcher follows a set of questions, but where there is also room to
stray from these questions. (SRM, 2014)
The used research strategy is household surveys; there are numerous interviews held in person,
with individuals and with families. The interviews were held at their homes, the individual and the
interviewer sat with each other so that they had some privacy and could talk freely. Other times the
whole household was present, and they answered the questions together. The researcher asked the
questions and noted the answers. The questions asked during these interviews are given in
Appendix 6 – Household survey. By acquiring answers to these questions, the research questions
can be answered. (SRM, 2014)
To know how much firewood people use, the interviews used in the household surveys contain
questions about that topic. To be able to say how this influences the woodlots, the bundles they
collect are weighed, for the used method see Chapter 3.3.2.
The data obtained during the household surveys is analysed the same as explained above in
Chapter 3.1.1, according to the methods described by De Hoyos and Barnes (2012). The answers to
the household survey interviews are sorted in coded groups or categories in Excel. The output data
is further analysed; by first putting the data in tables, and then calculate the Standard Deviation. All
data that did not fit within the Standard Deviation is left out because it is not significant. The results
from the household surveys are later cross-checked with the coded data from the observations and
key informant interviews (see Chapter 5 – Discussion), to further prove the validity of the data.
3.1.3 Limitations There are several limitations expected during this part of the research. The first limitation being the
language and culture, with research that is related to human interactions there will always be a

13
barrier, because of the difference in culture and language, there are many risks. (Temple &
Edwards, 2002) The gap in language can lead to misinterpretations and the differences in culture
can lead to the respondents giving misguiding answers and information. Also, the interpreter has
an influence on the situation as well. To keep these risks at a minimum, an interpreter who is a trusted
member of the community will be hired; with knowledge on the topic, a degree from the University,
experience with translating and who originates from the research area was used. Also, the risk of
misinterpretation is minimised by not using the direct translation but by talking in context, using
more words and no direct translations.(Temple & Edwards, 2002)
Other problems with qualitative data according to De Hoyos and Barnes (2012) with which the
researcher need to take care are:
Reliance on first impressions
Tendency to ignore conflicting information
Emphasis on data that confirms
Ignoring the unusual or information hard to gain
Over or underreaction to new data
Co-occurrence interpreted as correlation
Too many data to handle
3.2 Forest inventory This part of the research is to determine the distribution of the shrub and tree species. Also, the
number of dead stumps is measured, to assess the human disturbance in the area. An overview of
where the woodlots are located is obtained. The location of the woodlots is measured using two
different methods; GIS and Transects. The forest inventory does not include measurements of wood
volumes because the location and density of the woodlots are sufficient information to identify
management options.
3.2.1 GIS Image classification is used in GIS to identify forested areas, to identify the location of possible
firewood and the location of deforested areas, this is done in week 11 (2-8 May). This data is shown
on a map of the area that shows the woodlots and the open areas. The image classification is done
with satellite images procured from USGS Global visualisation Viewer, analysing is done with GIS.
The images are loaded into GIS, and a maximum likelihood classification is performed. (ESRI, 2010)
The output is a map that shows the different land uses and thereby the location of the woodlots.
3.2.2 Transects During week 9 and 10 (18 – 28 April), the transects are measured. The transect points are measured
to assist with the Image classification in GIS. Two roads cross through the corridor; these roads
function as the location of the transect points. These transects are used to determine where the
woodlots are located. The exact information that is collected is shown in the Data Form in Appendix
7. The location of the plots along the transect lines will be on both sides of the transect, every 1 or 2
km, 50 meters from the road at a 90 degrees angle, measuring first on the left side and then on the
right side.
A transect is a more or less straight line, determined in advance by the researchers, at this instance
the roads that cross through the corridor. The transect is chosen at this location because this area is
accessible to collectors, would it not be along a road it would be more difficult and even dangerous.
The transects start at the beginning of the corridor and go on for about 10 km. This distance is chosen
because the community members have revealed in the household surveys that they will not walk

14
further than that (see Chapter 4.1,3). The goal of measuring along a transect is to get a good
overview of the current situation of the woodlot. (de Vletter, 2014)
By law it is not allowed to cut inside the corridor and with this transect/plot measuring it is
determined if the law is respected and will reveal possible management options. Also, the data
obtained through measuring the transects will function as a way of ground truthing the with GIS
produced a classified map, by cross-checking the transects data with the classified map. (Hall, 2014)
3.2.3 Limitations The method forest inventory is divided into transects and image classification with GIS. When
measuring a transect or working with an image, it is always a recording from a specific time and
date, while the processes that are recorded are changing, this means that the conclusions that are
drawn from this apply only for a short period.
Also, it is questionable if the woodlots are correctly classified with GIS. This classification can be
difficult that is why the outcome of the image classification is cross-checked with the measured
transect, and if they correspond, this result is most likely correct.
Because the corridor is not yet indicated and no maps could be found, the exact location could not
be determined beforehand. Another difficulty was that there were no maps or other geographical
information of the area available. Information and maps about the area are obtained through local
government.
This study is unable to encompass the entire district of Kaabong; it is only aimed at the communities
that live near Kidepo Valley NP. Also, the study was only focused on the households. Some different
user groups were included in the interviews, but there was too little data to conclude anything
significant from that.
3.3 Potential biomass productivity and sustainability evaluation To evaluate the sustainability of the firewood consumption by the communities living near Kidepo
Valley NP the mean annual wood biomass yield increment is calculated (3.3.1), the consumption by
the communities is also calculated (3.3.2) and these two will be compared(3.3.3).
3.3.1 Mean annual wood biomass yield increment The available amount of firewood is measured, through calculating the mean annual wood biomass
yield increment. The mean annual wood biomass yield increment differs per species, only two
species are chosen for this research; the Acacia albida and the Eucalyptus tereticornis, these species
are chosen because they are commonly used firewood species in East Africa countries (Najma
Dharani, 2011). The Eucalyptus tereticornis grows relatively fast, and the Acacia albida average and
is representative of most of the species that grow in the area. These two were chosen to lessen the
misguiding information, and one represents the most common species, and one a fast growing
species. Also, the Acacia albida is a species that can be used for intercropping and has good fodder
and edible pods (Vandenbeldt, 1992). These species are representative of many of the other used
species, especially the acacia, as there are many acacia species in the area, with similar
characteristics. The acacia species are also the most preferred firewood species. The Eucalyptus
tereticornis was chosen because it is a fast growing tree so good for firewood and the government
in the area supplies free seedlings for the local communities (Najma Dharani, 2011).
A report by the FAO (Kassam, 1991) was used to calculate the mean annual wood biomass yield
increment. Of the report only Chapter 6 - Fuelwood productivity is used. For the calculations
multiple tables are needed, this chapter contains the needed tables. In Appendix 8 the calculations
can be found, the references to tables within the text are towards that report. Chapter 6 – Fuelwood
productivity (Kassam, 1991) contains a formula that needs to be filled in. The latitude, temperature,
15
Length of the Growing Period (LGP), cloudiness, month of growing period, rainfall and Leaf Area
Index (LAI) of the area and species needs to be known. This information is found within the document
and within the book Soils of Africa by Jones (2013). The described steps are used to calculate the
mean annual wood biomass yield increment.
A mistake that can happen with this calculated mean annual wood biomass yield increment is with
the input data. The input data that was used is not necessarily correct for each year. There can be
years with more rain or droughts. Also, the soil fertility is not taken into account. The soil fertility
and moisture can both have an influence on the mean annual wood biomass yield increment. Taking
this into account the concluded yield can serve as a guideline, not as a set number.
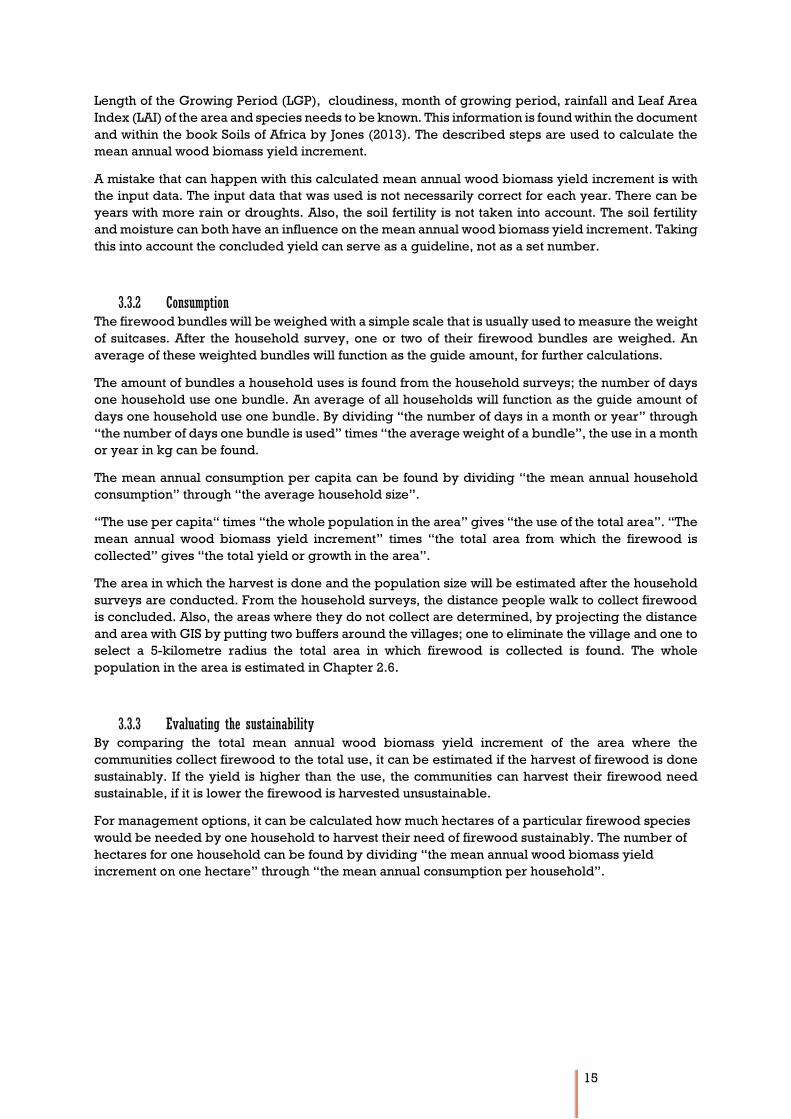
3.3.2 Consumption The firewood bundles will be weighed with a simple scale that is usually used to measure the weight
of suitcases. After the household survey, one or two of their firewood bundles are weighed. An
average of these weighted bundles will function as the guide amount, for further calculations.
The amount of bundles a household uses is found from the household surveys; the number of days
one household use one bundle. An average of all households will function as the guide amount of
days one household use one bundle. By dividing “the number of days in a month or year” through
“the number of days one bundle is used” times “the average weight of a bundle”, the use in a month
or year in kg can be found.
The mean annual consumption per capita can be found by dividing “the mean annual household
consumption” through “the average household size”.
“The use per capita“ times “the whole population in the area” gives “the use of the total area”. “The
mean annual wood biomass yield increment” times “the total area from which the firewood is
collected” gives “the total yield or growth in the area”.
The area in which the harvest is done and the population size will be estimated after the household
surveys are conducted. From the household surveys, the distance people walk to collect firewood
is concluded. Also, the areas where they do not collect are determined, by projecting the distance
and area with GIS by putting two buffers around the villages; one to eliminate the village and one to
select a 5-kilometre radius the total area in which firewood is collected is found. The whole
population in the area is estimated in Chapter 2.6.
3.3.3 Evaluating the sustainability By comparing the total mean annual wood biomass yield increment of the area where the
communities collect firewood to the total use, it can be estimated if the harvest of firewood is done
sustainably. If the yield is higher than the use, the communities can harvest their firewood need
sustainable, if it is lower the firewood is harvested unsustainable.
For management options, it can be calculated how much hectares of a particular firewood species
would be needed by one household to harvest their need of firewood sustainably. The number of
hectares for one household can be found by dividing “the mean annual wood biomass yield
increment on one hectare” through “the mean annual consumption per household”.

16
4. Results This chapter contains the data that is collected during the research period. The chapter is divided
per used method. First, the interview results are shown, where after the results of the forest
inventory, to finish with the potential biomass productivity and sustainability evaluation.
4.1 Interviews This chapter shows the results from the method interviews. First, the observations are given, then
the results of the key informant interviews, where after the results of the household surveys.
4.1.1 Observations A summary of the observations made during the first weeks of the research is given, made through
observing the community, to get a first impression of the situation. The observations are to get a first
impression of the situation. In this chapter only the firewood related observations are noted, the
observations made about other topics can be found in Appendix 9 – Observations. These other
subjects are; management, income, well-being of the communities and overall issues. Below the
results:
Only women and children collect firewood. Sparsely men walk with wood, but this is mostly long
poles for building houses.
From time to time men and women carry bags of charcoal, at the market it is sold daily.
4.1.2 Key informant interviews A summary of the firewood related information discovered from the key informant interviews is
given. With these interviews, an overview of the current situation in the area is found. An overview
of the interview questions is provided in Appendix 5 – Key informant interviews and an overview of
the answers is shown in Appendix 10 – Key informant answers. Three parish chiefs were interviewed
for the research, the leaders of the different parishes; the parish chiefs of Karenga, Loyoro and
Opotopot and Lokori. Pastor David is the pastor of the Catholic Church and knows a lot about the
people and the area. The Karenga cultural group is a group that is voluntary and has many projects
in the area to improve the livelihoods of the people. The Rangers from the NP are there to protect
the park and its boundary areas and the people that live there. This information is qualitative not
quantitative, and therefore a summary of the for this research relevant information is given.
a) Parish chiefs Below a summary of the important findings from the interviews with the parish chiefs:
Only the Sheanut tree (Vitellaria paradoxa) is not allowed to cut.
There are not yet many alternatives to the use of firewood available, but this will improve with
education, more solar powered cooking will be used, and soon there will be electricity
(although this will not be affordable for most).
The parish chiefs and community member do not worry about the availability of firewood in the
future.
Some people use grass or sorghum stock for cooking when there is little firewood available.
Most people collect too much firewood in the dry season to make a fence from it, this fence they
will use in the wet season when the collection is difficult. The dry season is the building season
and the wet season is the planting season.
The law protects shrines, it is not allowed to collect nor cut here and on the hills and mountains
there is no cutting allowed, but the collection of dead wood is allowed.
There are no rules for where you can collect.
Almost everyone, three-quarter of the people uses firewood.
Charcoal is too expensive for most but is produced to make money.

17
Firewood and wood for fences are collected abundantly.
Communities are trained to use a stove and in other more efficient way to use of firewood.
Both cutting and collection are allowed for firewood and building materials.
b) Pastor David Pastor David mentioned the following about the availability, distribution and consumption of
firewood in the area:
There is no real preference; every species is used.
Here in the area, there are no alternative ways of cooking available, but possible alternatives
are; to use paraffin burners, but they are expensive or to cook on solar power, but not everything
can be cooked on solar power. Electricity will not be used for cooking.
The communities are not aware of the problems; they do not think of the future. The wood will
finish as the distance to collect firewood keeps increasing over time.
When there is little firewood available, the communities use sorghum and grass to cook.
During the wet season, the collection is difficult because of the growth of plants, mainly grasses
and bushes. During the dry season, the community members collect every day so that they have
a surplus, from this surplus they make a fence, in the wet season they can use the wood from the
fence.
The collection is done daily and can take up to 6 hours, and people can walk as much as 8 km.
Sub-county Karenga decided that there it is not allowed to collect dead or living wood(cut) on
slopes and mountains. Other than that there are no rules about who collects where.
Almost all people use firewood for cooking; some use charcoal but charcoal is too expensive for
most; usually, people make charcoal to sell.
The firewood is collected by the women and their children.
They collect dead and living wood; they also cut trees.
No specific characteristics are required, they take everything.
Cooking is done mostly once in the evening, only a few cook three times a day.
People cook mostly on an open fire, using three stones to put the pan on, only a few families
have a stove.
People do not preserve wood, they just let it burn, even to heat the house sometimes.
c) Karenga cultural group The Karenga cultural group only discussed the availability, distribution and consumption of
firewood, in Appendix 11 a picture of the topics they wrote down can be found, below the findings
are shown:
Any species is collected, except for some species that are toxic to cattle.
They are worried about the future because already they have to walk farther than before to
collect firewood.
Firewood is used daily; the collection is about 5 km (two-way).
The collection is done from everywhere, except not in Shrines.
Charcoal is not used by many; it is too expensive for most.
Both men and women collect firewood, but mostly women, men only sell it.
Many families use a stove.
People only collect dead wood; they do not cut.
Most families use one bundle a day sometimes two days; it depends on the household size and
size of the bundle. The size of the bundle depends on how much you can carry.

18
d) Rangers from UWA Below the results of the interviews with the Rangers from UWA are given:
The communities are allowed to collect resources from inside the park and its corridor, but only
if they arrange it with UWA. A ranger will escort them to protect them and to tell them where to
take the resource from, but this is rarely done, the Rangers do not know why. The Rangers do
inform the communities about this option.
Illegal cutting and gathering of wood take place inside the park and corridor – evidence of this
illegal cutting was seen by the rangers. While Morene says she does not see much evidence.
Cutting is illegal by law.
Most of the rangers use charcoal for cooking. The different outposts of UWA use charcoal,
firewood and sometimes even gas and they buy it from the local communities.
4.1.3 Household surveys During the household surveys, 43 interviews were held, with women and men from the communities
that live near the NP. An overview of the socio-demographic characteristics of the respondents is
shown in Table 3. Mostly women are interviewed because men say they do not know anything about
firewood because that is the job of the women. The data from the interviews was analysed, all
answers that deviated too much were left out. In this chapter, the results of the household surveys
are elaborated.
Table 3, Socio-demographic characteristics of the respondents
Variable %
Response
(N=43)
Sex
Female 74
Male 26
Age
<30 35
30-40 44
>40 21
Marital status
Married 88
Single 12
Education level
None 44
Primary 33
Secondary 21
University 2
Occupation
Peasantry farming 81
Other; restaurant, brewing,
hospital, student, teacher
19
Parish
Opotopot 7
Lokori 7
Loyoro 26
Karenga 42
Morungole 9
Naseperwai 9
Family size (mother and kids)*
1 - 4 28
5 - 8 53
>8 5
Other: non-responses 14
Household size (People that live
there and is cooked for)**
1-4 9
5-8 35
9-11 30
11-15 14
Other; restaurants 12
*The average family size is 5,4
**Average household size is 8,6

19
Table 4; The most preferred species are the
Acacia species with 52% responses and the
Terminalia with 48%. The species that is the
least preferred is the Fig species with 30%.
The second is the Tamarind with 26%. The
Sheanut tree with 18% and both the Lucky
bean tree, and Mango have 13%.
Table 5; It is apparent from the results that
alternatives to the use of firewood are not
used (97%). They are not available or too
expensive. The community member did know
of some (3%); gas, electricity, solar power
and paraffin.
Table 6; When asked what the community
members do when there is a shortage of
firewood, most (67%) say they go hungry.
33% say they will use an alternative. The
alternatives here are asking friends and
neighbours for help; this help can be support
in firewood or food but also work. They can
work for them for one day and earn money so
that they can buy firewood. Other alternatives
are to use sorghum stock or small sticks, but
they do not give much heat, so cooking takes
longer. Some split logs, one says he uses a
paraffin stove, and one says she would trade
in firewood and charcoal.
Most (88%) of the community members do
worry about the availability of firewood in the
future. They say people will settle inside
corridor, and the trees will finish there too
because they will need to clear the area for
farming. Also, burning is a real problem, and
many people cut trees to make fences and burn
bricks. 12% of the respondents say they do not
worry; they say the trees will regrow.
Most (84%) of the households say they
already notice a difference in the availability
of the firewood. They say most of the
preferred species are finished close by and
they have to move farther away to get them.
Only 16% of the respondents say they do not
notice a difference.
Table 4, Firewood species
Code Answer N %
Preferred
A1 Acacia's 33 52
A2 Terminalia 31 48
Not preferred
A1 Tamarind 26 26
A2 Fig species 30 30
A3 Lucky bean tree 13 13
A4 Sheanut tree 18 18
A5 Mango 13 13
Table 5, Alternatives
Code Answer N %
A1 No 37 97
A2 Not here 1 3
Table 6, Availability: Coping with shortage
Code Answer N %
Coping with shortage
A1 Go hungry 20 67
A2 Alternatives to firewood collection 10 33
Worry for the future
A1 Don't worry 5 12
A2 Yes worry 38 88
Notice a difference
A1 No, there is no difference 6 16
A2 Yes, there is a difference 31 84

20
Table 7; 60% of the respondents will collect
more in the dry season and make a fence or
stockpile. 40% say it is easy to collect in the
dry season. Most (58%) say that the collection
in the wet season is more difficult because the
vegetation is too abundant. 42% say they will
use their fence or stockpile.
Table 8; according to 47% of the respondents,
it is prohibited to collect (dead or alive)
firewood from hills, slopes and mountains.
30% say it is not allowed in and around the
compound but outside everywhere. Only 23%
say it is not allowed to go in or near the NP and
the corridor. Most (67%) say they go to their
gardens to collect firewood, just 33% say the
go in or towards the corridor, plain or bush.
Table 9; Most respondents (72%) spend 4 to 5
hours and (70%) 8 up to 10 km on a two-way
trip of firewood collection, and 62% goes
every day. 28 % will only spend 1 up to 3
hours collecting firewood. 30 % of the
respondent walks 2 up to 4 km, and 38% goes
3 times a week.
Table 10; Most of the respondents (76%) say
women and daughters older than 10 are
responsible for the collection of the firewood.
Sometimes (24%) only one woman is
responsible for the firewood collection per
family. If a woman does not have any children;
or her daughters are not old enough yet. It
also sparsely happens that they work in
groups.
Table 7, Wet season & Dry season
Code Answer N %
Dry
A1 Make a fence or stockpile 29 60
A2 Easy to collect 19 40
Wet
A1 Difficult to collect 38 58
A2 Use fence or stockpile 28 42
Table 8, Location collection
Code Answer N %
Location: Not allowed
A1 In and around compound, outside
everywhere
13 30
A2 On hills, slopes and mountains 20 47
A3 In and near the NP and the corridor 10 23
Location: Allowed
A1 In or towards the corridor, plain or
bush
5 33
A2 In the gardens 10 67
Table 9, Time, Distance and Frequency
Code Answer N %
Time (hours) spend on collecting firewood for a two-
way trip
A1 1 - 3 9 28
A2 4 - 5 23 72
Distance (km) walked for two-way trip
A1 2 - 4 10 30
A2 8 - 10 23 70
Frequency of firewood collection (number of trips in a
week)
A1 7 16 62
A2 3 10 38
Table 10, Who is responsible for the collection
Code Answer N %
A1 Me and my daughters (10+) 25 76
A2 By herself 8 24
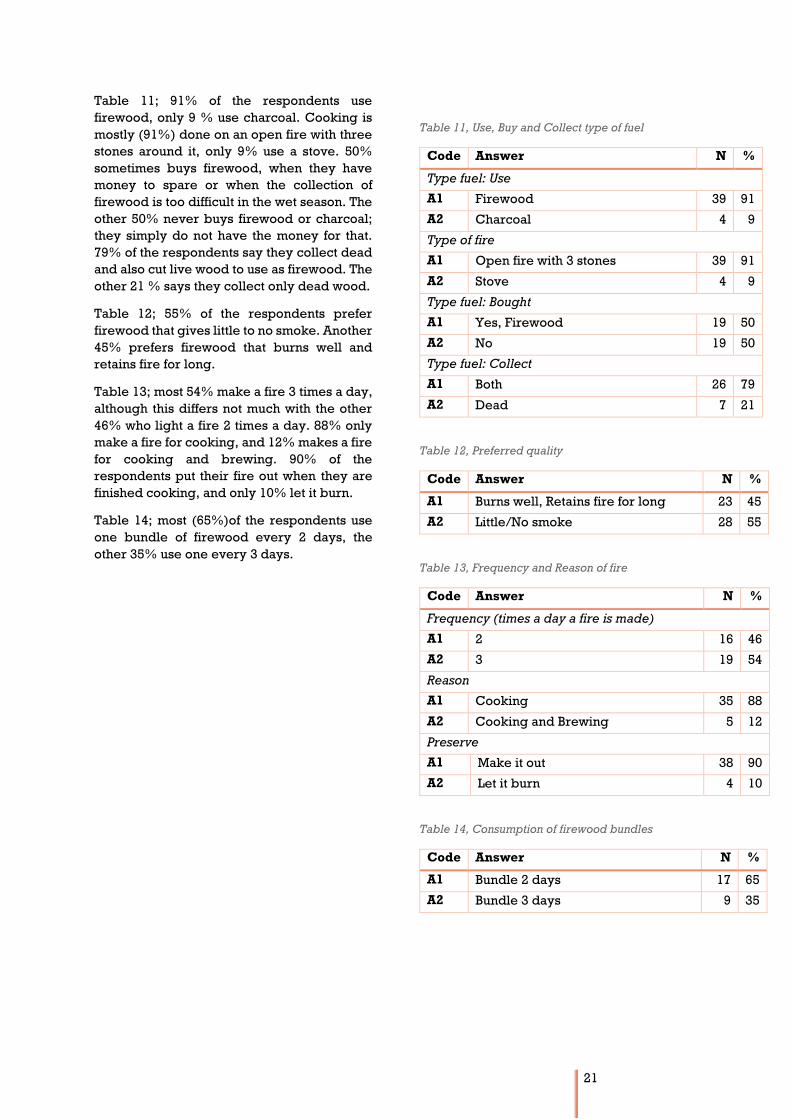
21
Table 11; 91% of the respondents use
firewood, only 9 % use charcoal. Cooking is
mostly (91%) done on an open fire with three
stones around it, only 9% use a stove. 50%
sometimes buys firewood, when they have
money to spare or when the collection of
firewood is too difficult in the wet season. The
other 50% never buys firewood or charcoal;
they simply do not have the money for that.
79% of the respondents say they collect dead
and also cut live wood to use as firewood. The
other 21 % says they collect only dead wood.
Table 12; 55% of the respondents prefer
firewood that gives little to no smoke. Another
45% prefers firewood that burns well and
retains fire for long.
Table 13; most 54% make a fire 3 times a day,
although this differs not much with the other
46% who light a fire 2 times a day. 88% only
make a fire for cooking, and 12% makes a fire
for cooking and brewing. 90% of the
respondents put their fire out when they are
finished cooking, and only 10% let it burn.
Table 14; most (65%)of the respondents use
one bundle of firewood every 2 days, the
other 35% use one every 3 days.
Table 11, Use, Buy and Collect type of fuel
Code Answer N %
Type fuel: Use
A1 Firewood 39 91
A2 Charcoal 4 9
Type of fire
A1 Open fire with 3 stones 39 91
A2 Stove 4 9
Type fuel: Bought
A1 Yes, Firewood 19 50
A2 No 19 50
Type fuel: Collect
A1 Both 26 79
A2 Dead 7 21
Table 12, Preferred quality
Code Answer N %
A1 Burns well, Retains fire for long 23 45
A2 Little/No smoke 28 55
Table 13, Frequency and Reason of fire
Code Answer N %
Frequency (times a day a fire is made)
A1 2 16 46
A2 3 19 54
Reason
A1 Cooking 35 88
A2 Cooking and Brewing 5 12
Preserve
A1 Make it out 38 90
A2 Let it burn 4 10
Table 14, Consumption of firewood bundles
Code Answer N %
A1 Bundle 2 days 17 65
A2 Bundle 3 days 9 35

22
4.2 Forest inventory The forest inventory consists of GIS image classification and transect measurements. First, the image
classification results are given, whereafter the results of the transects.
4.2.1 Image classification map – GIS The map in Figure 11 and Appendix 13 shows the location of the woodlots; these are divided into
dense and open. The map has seven different land uses;
1. Mountain/hills & 2. Hills
Mountain/hill and hills are almost the same; these areas have good growing vegetation, consisting
mostly out of shrubs and trees and some areas with grass.
3. Grassland/agricultural fields
The grassland/agriculture fields are areas where people live and cultivate crops, but also areas that
consist out of only grass, such as the plains inside the NP.
4. Riverbed
The riverbed is an open area with grass, and only a few trees because part of the year this area is
wet.
5. Bare soil
The bare soil is areas with no vegetation.
6. Open woodlots & 7. Dense woodlots
The woodlots are divided into two, but they look very similar, they are both open woodlots with
grass between the trees. The woodlots classified as dense are in reality not dense, but denser than
the open woodlots are.
The map shows that close to the villages and inside the NP there are only grassland and agriculture
fields. A little farther away there are dense woodlots; farther away still, there is a more open forest.
Figure 7, GIS Classified map of the study area

23
4.2.2 Transects The main point of the transects is to ground truth with the GIS image classification identified land
uses. Also, signs of human disturbances are noted during the transect measurements. In a large part
of the study area, burning happens often, some recently (late burning), others up to six months ago
(early burning). Most of these are lit, some happen naturally. Appendix 14 contains two maps and
two tables. The maps show the location of the transect points and the tables show what is measured;
the transect point and plot number, the height, density, number of trees, number of stumps and
other signs of human disturbances. The transect points are displayed consecutive from left to right,
beginning at one.
In Table 17 and Figure 11 in Appendix 14, the results for transect 1 can be found. For transect 1, 14
plots are measured along a transect at seven points, between each point, there is 1 kilometre. At
each point, two plots are measured, one on each side of the road, 50 metres away from the road so
that the road has no influence on the vegetation. Here the results are listed:
- Only at the first two transect points signs of logging are found in the plots.
- The density did not change much along the transect, only at point 6 the density and number
of trees were higher.
- Point 3 north, 4 both north and south and 7 south show early burning and point 5 shows
natural burning.
- Point 1 both north and south, 2 only south and 7 only north show signs of trees being cut for
their leaves.
- Only point 1 and 2 show signs of logging.
In Appendix 14 Table 18 and Figure 12 show the results for transect 2. For transect 2, 22 plots are
measured along a transect at eleven points, with each time 2 kilometre between the points. At each
transect points also two plots are measured the same way. At this transect the difference is not very
noticeable either, below the results are listed:
- Point 2, 6 and 7 have a higher density and number of trees.
- Point 5, 8 and 11 also have a somewhat higher density and a higher number of trees.
- Only at the first transect point signs of logging are found in the plot. All around the south
side of this point, big trees are logged, for brick burning.
- Point 2 shows signs of logging next to the road.
- Early burning is practised at point 1 south, 2 north, 6 south, 7 east and west, 10 north and 11
south and late burning is practised at point 1 north, 2 south, 3 south, 4 south, 5 and 8 both
south and north, 9, 10 and 11 south.
This information is not very detailed because that was not necessary as this information is only to
help with the GIS analysis and shows possibilities for management of woodlots. In the next chapter,
the GIS analysis is elaborated.
4.3 Potential biomass productivity and sustainability evaluation In this chapter the potential biomass productivity and the consumption of firewood will be
calculated, and with that information, a sustainability evaluation is made.
4.3.1 Mean annual wood biomass yield increment The calculations for the mean annual wood biomass yield increment is calculated for species 1 (Sp1)
the Acacia albida and for species 2 (Sp2) the Eucalyptus tereticornis; the calculations are shown in
Appendix 8 – Mean annual wood biomass yield increment. From these calculations it was
discovered that the mean annual wood biomass yield increment on one hectare is:
Sp1: Acacia albida: 3.220,77 kg
Sp2: Eucalyptus tereticornis: 4.945,14 kg

24
The research area is large, but the communities do not walk farther than 5 km from their compounds
to collect firewood, they do not go to the mountains and hills and do not collect close to and inside
the compounds (see Chapter 4.1). Also, most of the land close to the compounds is agricultural fields
with limited trees. This led to a calculated estimated area of about 8.000 hectares. That means the
mean annual wood biomass yield increment for the total area is:
Sp 1: Acacia albida: 8.000 * 3.220,77 = 25.766,16 kilograms
Sp2: Eucalyptus tereticornis: 8.000 * 4.945,14 = 39.561,12 kilograms
4.3.2 Consumption Table 15 shows the weight of all the measured firewood bundles, the average weight of the firewood
bundles is 27,2 kg.
Table 15, Weight of firewood bundles
Firewood bundles weight
(kg)
1 29
2 15
3 23
4 22
5 18
6 25
7 18
8 30
9 26
10 21
11 27
12 16
13 23
14 22
15 25
16 34
17 30
18 32
19 33
20 26
21 25
22 22
23 29
24 30
25 24
26 40
27 29
28 50
29 45
Average 27,2
In Chapter 4.1.3 Table 14, the number of bundles one household uses is shown. An average of this
number functions as the amount to further calculate the consumption of the community. The number
of days times the number of respondents is summed up and divided through the total respondents:
( 17 * 2 + 9 * 3 ) / 26 = 2,3 days
Every 2,3 days a household needs 27,2 kg of wood In a month that is: 31 / 2,3 * 27,2 = 367 kg. The
mean annual consumption per household is: 365 / 2,3 * 27,2 = 4.316,5 kg
It was discovered, a household is not necessarily a family, often the interviewees cooked for more
people than only their family. Therefore the average of the household was calculated (see Chapter
4.1.3, Table 3) and used to calculate the mean annual consumption per capita: 4.316,5 / 8,6
= 501,9 kg
The population is approximately 15.000 (see Chapter 2.6). The mean annual consumption of the
whole community within the study area is: 15.000 * 501,9 = 7.528.500 kg
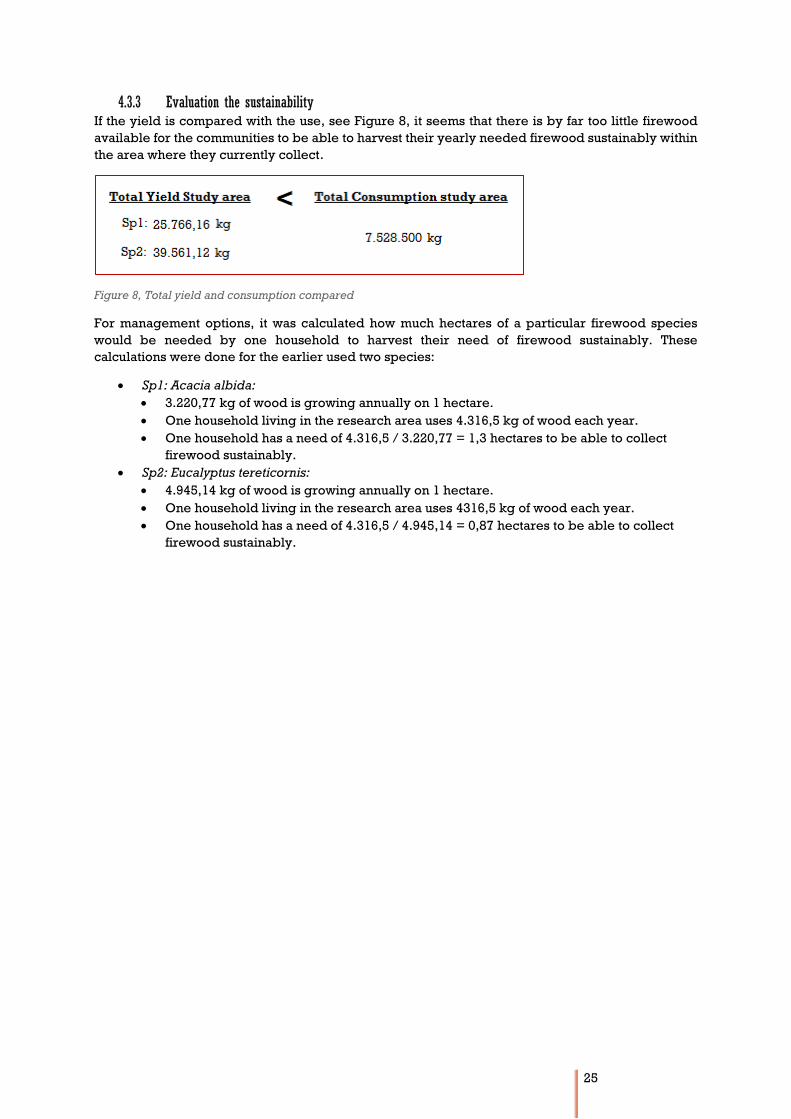
25
4.3.3 Evaluation the sustainability If the yield is compared with the use, see Figure 8, it seems that there is by far too little firewood
available for the communities to be able to harvest their yearly needed firewood sustainably within
the area where they currently collect.
Figure 8, Total yield and consumption compared
For management options, it was calculated how much hectares of a particular firewood species
would be needed by one household to harvest their need of firewood sustainably. These
calculations were done for the earlier used two species:
Sp1: Acacia albida:
3.220,77 kg of wood is growing annually on 1 hectare.
One household living in the research area uses 4.316,5 kg of wood each year.
One household has a need of 4.316,5 / 3.220,77 = 1,3 hectares to be able to collect
firewood sustainably.
Sp2: Eucalyptus tereticornis:
4.945,14 kg of wood is growing annually on 1 hectare.
One household living in the research area uses 4316,5 kg of wood each year.
One household has a need of 4.316,5 / 4.945,14 = 0,87 hectares to be able to collect
firewood sustainably.

26
5. Discussion This chapter serves to cross-check the different information sources, to be able to determine if the
information from the different informants correspond. Also, the results are compared to previous
research. The discussion will be sorted by research question; first, the availability, then the
distribution, where after the consumption, to finish with the sustainability.
5.1 Availability The first sub-question was: “What is the availability of the firewood species used by the local
communities near Kidepo Valley NP?” The availability of firewood consists of the firewood species,
alternatives, availability, the difference between the dry and the wet season, and the mean annual
wood biomass yield increment.
a) Firewood species The household surveys name specific species that are preferred and not preferred, but the key
informant interviews showed that people do not have a preference and collect everything. The
household surveys showed that the communities prefer Acacia species as a source of their firewood.
In a study conducted by Egeru (2013), the same was concluded for the district Soroti, which is
located south of the study area.
The parish chiefs specifically named the Sheanut tree as a species that is not preferred, which
corresponds with the household surveys, where 18% of the respondents mentioned this. However,
more of the interviewees from the household survey mentioned the Fig tree (30%) and the Tamarind
(26%). Also, Karenga cultural group mentioned there is no collection of species toxic for cattle. An
example of a species toxic to livestock is the Sheanut tree.
b) Alternatives In the topic of alternatives, the household surveys and key informant interviews conclude the same;
there is no alternative fuel available instead of firewood. The key informants say the alternatives are
too expensive. Ramos (2012) says, alternatives are there but too costly to use, which is in line with
what the key informants of current research say. A different research (Egeru, 2013) also states that
the alternatives are too expensive. Oxford Committee for Famine Relief (OXFAM) (Magrath, 2008),
states one alternative could be to use paraffin for cooking, but also mentioned the price of paraffin
had shot up. The community referred to the use of a paraffin stove during the current study, but they
also said it was too expensive.
c) Availability Most of the respondents of the household surveys say when there is no wood there is no food.
Although the community members do not know of any alternatives, they do say there are some
alternative options when there is no wood. Most common is the use of sorghum stock; this is what
the community members said and corresponds with what the key informants say. In the report of
Egeru (2014), it was concluded that about 60% of the households complimented firewood with crop
residues of cassava stems, maize stalks and cobs and sorghum stalks.
Most respondents of the key informants and household surveys are worried about the availability of
firewood in the future; they already notice that they have to travel further to collect firewood. Pastor
David agrees although he says the communities do not worry because they do not think far in the
future. The parish chiefs say they are not worried at all, and their community is not either; “There is
always enough firewood and building material available.” That means although the communities
themselves worry the parish chiefs and pastor think the communities do not.
d) Wet and dry season Every respondent says that collection in the wet season is more difficult because of the vegetation,
for that reason, more firewood is collected in the dry season to make a fence or stockpile that can
be used in the wet season. Ramos (2012) also mentioned the collection in the dry season was
preferred because of the abundant vegetation in the wet season.

27
e) Mean annual biomass yield increment From the calculations made in Appendix 8 and Chapter 4.3.1 it was discovered that the mean annual
wood biomass yield increment of Sp1 Acacia albida is 3.220,77 kg per hectare and of Sp2
Eucalyptus tereticornis 4.945,14 kg per hectare. The mean annual wood biomass yield increment for
the total area is:
Sp1 Acacia albida: 25.766,16 kg
Sp2 Eucalyptus tereticornis: 39.561,12 kg
5.2 Distribution The second sub-question was: “What is the distribution of the firewood species used by the local
communities near Kidepo Valley NP?” To answer this questions the location of the collection of
firewood, the collection time, distance and frequency and the location of the woodlots are
determined.
a) Location collection About the location, there were many different answers. All respondents said no collection or cutting
on the hills, slopes or mountains; this is a rule from the sub-county. The key informants mentioned
that firewood collection from shrines is forbidden too, but other than that there are no rules, the
collection is everywhere. Although the household surveys also show no collection in and around the
compound and in an near the NP and its corridor, apart from that everywhere.
Some of the household interview respondents mention specifically going to the corridor to collect.
This corresponds with what the Rangers say; it is allowed to collect but only under the supervision
of a ranger, and this is barely done. However, there are many signs of cutting and gathering inside
the NP and corridor, although one of the Rangers did not see any signs of cutting or gathering in the
corridor.
b) Collection time, distance and frequency Most respondents of the household surveys collect daily and walk for 4 to 5 hours and 8 up to 10 km
to collect firewood. This time and distance corresponds with what Pastor David says; they collect
daily, and it can take up to 6 hours, with people walking as much as 8 km. The Karenga cultural
group also says the collection is daily, but they say it is up to 5 km. According to a firewood research
conducted in central Uganda (Agea, 2010) women in the African Sahel walk up to 10 km or 3 hours
per day to collect firewood, and women in Niger walk for about 4 hours per day. In their study, in
central Uganda, it was concluded they spend 4 to 6 hours and walk for 8 up to 12 km collecting
firewood. That leads to thinking the collection time and distance differ between the community
members and location but most collect 4 to 5 hours and 8 to 10 km and daily. These factors
(collection time, distance and frequency) account only for the dry season; current research took
place during the dry season and it was discovered, the collection of firewood in the wet season is
limited.
c) Location of the woodlots The classified land uses are compared with what was found during the measuring of the transects to
determine if the classification done with GIS is correct.
For transect 1, two points are classified incorrectly, the other five points are correct. Point one is
difficult to see, the point is located on a spot on the map that has both dense and open areas, it is
hard to conclude if this point was classified correct. Point two is classified as dense; this differs from
the results of the transect; there it was identified as having only a density of less than 5%. Point three
is on the border between dense and open; there are even some spots of bare soil around the point.
This point was identified during the transects with a density of less than 5%. So this point is likely
identified correctly. Point four is located at a riverbed, this area is open and has not many trees,
both the classified map and the transects concluded that. Point five is classified as open, also in the
transects, it only has a density as 5%, so this is classified correctly.

28
Point six is also classified as open, although the transects measured a density of 20%. This means
this piece is not classified correctly. Point seven is classified as dense, during the transects, it was
discovered that the density was 10%. Based on the comparison made above; this classification is
likely to be correct.
For the second transect, all transect point corresponds with the land use classified with GIS. Point
one is classified as dense; there were slightly more trees present at this point during the transect,
so this classification is correct. Point two is also classified as dense, during the transects, the same
was discovered, so this is correctly classified. Point three is located on the edge but clearly in the
open area, because there were no trees found in the plots. Point four is classified as open, in an area
between dense woodlots. The transects identified a density of less than 5%; this classification is
correct. Point five has a density of less than 5% according to the transect, during the classification it
was discovered to be located in an open grassland area. This classification is likely to be correct.
Point six is located on the edge of dense and open, but the transects determined the density was
low, so this will be classified as open. Point seven and eight both find themselves on the edge as
well, so the same conclusion can be drawn; they are both dense, due to the transect measurements.
Point nine is located in a river bed, where trees and shrubs are not as abundant as in the rest of the
area, so a low density. Point ten is also correctly classified as open, during the transects a density of
less than five was measured. At point eleven there is a small area with a more dense woodlot, this is
also identified during the transects.
The classified map also shows that the rules of no cutting on the mountains are obeyed because
these areas have many trees and shrubs. That leads to thinking the community members do obey
the rules for the restricted areas, and this seems promising for future management option.
It is logical that the woodlots closer to town are denser, as they will be logged more often and due
to the coppicing characteristics of the trees and shrubs the growth will be abundant, thus denser
than farther away.
d) Limitations A limitation during the measurements of the transects was met; after the measurements had been
taken with transect 1, the community member went to that area to practice agriculture. They
chopped down many trees (at the first two transect points shown on the map in Appendix 14) to
make huts and cleared the fields for planting crops. This only proves that the rules are not clear. The
communities know they are not allowed to collect or cut in that area, but because the corridor is not
yet indicated they are making use of that.
The species within the plots were identified. Unfortunately, during the transect measurements, the
guide who identified the species quit and another guide had to be hired, this caused a change in
some of the identified species’ names and from then on only the local name could be determined
for most. Therefore the data from the different guides could not be used together and also without
the scientific or English name, this information is not useful and therefore not included in the report.
For this reason, only the number of trees and density serve as a means to cross-check with the GIS
image classified map on density. Moreover, no indication of specific species and their occurrence
could be made.
5.3 Consumption The third sub-questions was: “What is the consumption of the firewood species used by the local
communities near Kidepo Valley NP?” This sub-question consist of the type of fuel and fire, who
collects, the quality of the firewood, the frequency, reason of a fire and if firewood is preserved,
and the consumption of firewood.

29
a) Type of fuel and fire All the respondents agree that almost everyone uses only firewood, as charcoal is too expensive for
most. The observations show the same result. The observations and respondents all show charcoal
is mostly made to sell and used by the richer people, as was also concluded by Shackleton (1998).
Egeru (2013) states that 98,8% of the households in central Uganda use firewood for cooking. During
the same research, it was discovered that like in the current research almost all community
members cook on three stones and an open fireplace, with only a few exceptions. According to
Dewees (Dewees, 1989), the influence on the consumption of firewood of wood-conserving stoves
is limited, the stoves are inefficiently used and deteriorate, but can improve the daily lives. On the
contrary, according to Egeru (A. S. Egeru, 2013) stoves will help reduce the amount of firewood
needed to cook. The stoves attain a high efficiency by a complete combustion of fuel and a maximum
heat transfer of the heat of the combustion from the flame to the cooking pot. In the current research
area the use of stoves might improve on the amount of firewood they need for cooking, but next, to
cooking, wood is needed for many more activities, so the impact of the stove will be minimal. In all
sources on firewood use, it is said that women and girls are the ones who are responsible for the
collection of firewood. During the present research, it was discovered that the community members
sometimes buy firewood, which corresponds with the conclusion in the report of Agea (Agea et al.,
2010).
All respondents agree that firewood is sometimes bought, but charcoal is too expensive. Although
most of the interviewees of the household surveys never buy firewood. Agea (2010) states; 92% said
they occasionally buy firewood.
The household surveys showed most people collect and cut both dead and alive wood. The key
informants say it is by law forbidden to cut, but the law enforcement and implementation are too
weak, and there is no real punishment.
b) Who collects From the observations made it was discovered mostly women and children collect firewood, the
responses from the key informants and household surveys are in line with this; the women and girls
or daughters collect the firewood. Also, the household survey results show women and their
daughter are responsible for the firewood collection. Ramos (2012) states that indeed using the
method of collecting firewood in head bundles is only conducted by women, although if firewood is
collected with a wagon or car, it is a men’s job.
c) Quality The most important quality of the firewood is; the fire has no or little smoke. Secondly, the fire has
to burn well and long. Agea (2010) states the respondents during his research prefer the same
quality. None of the key informants during current research mentioned a preference towards any
quality; they say all the species and qualities are taken.
d) Frequency, reason of fire and preserve firewood From the household survey can be concluded that most people make a fire three times a day with a
close second of two times a day. Most of the fires are made for cooking. Pastor David on the contrary
said; cooking is done mostly once a day in the evening. Also, many people brewed their alcohol but
did not dare to tell during the interviews; this is of no further influence on the outcome of the
research because the use is calculated per bundles they use and these bundles are used for the
brewing too. Pastor David said; People do not preserve wood, they just let it burn, even to make the
house warm sometimes, while the household surveys concluded that most people make the fire out
when they have finished cooking.
e) Consumption firewood Only the household surveys gave results on the consumption. Most use a bundle of firewood every
two days, second came a bundle every three days. The average weight of a firewood bundle was
calculated, at 27,2 kg. In a research by Buyinza (2008), one household used 65 kg of firewood is a
week, thus 65 / 7 = 9,3 kg per day. The households use one bundle of firewood every 2,3 days. Thus
in one day they use 27,2 / 2,3 = 11,8 kg. that is 2 kg more than in Buyinza’s (2008) research.

30
The mean annual consumption of the whole community within the study area is calculated at
7.528.500 kg. The total consumption was calculated by first obtaining the mean annual consumption
per household (4.316,5 kg), and the mean annual consumption per capita (501,9 kg). The mean
annual consumption per capita will be compared to other research to assess if its correct. For the
consumption of firewood, numerous studies have been done. A study was done in Uganda (Kalumian
& Kisakye, 2001) reports a mean annual consumption of 485 kg per capita in Nakasongola and
Masindi districts, which is lower than in the current research. Another research by Egeru (A. S.
Egeru, 2013) states; in eastern Uganda, the mean annual consumption is 542,32 kg per capita, which
is slightly higher. The next two studies also have a higher consumption; in a different research also
in Uganda (Buyinza & Teera, 2008) the annual consumption per capita was 629 kg. A study done by
Shackleton (1998) in South Africa concluded a mean annual consumption of 687 kg. As all the
consumptions differ, and the current study’s consumption is one of the lowest but not the lowest, it
is safe to say the consumption is correct.
As mentioned in Chapter 4.3.2 a household size does not correspond to the family size, often the
household was larger. This difference has some explanations;
- Most men have multiple wives; sometimes they live apart, but sometimes they live together.
- As the oldest son, you have to take care of your parents. Therefore a household does
sometimes include parents.
- Also, sometimes more families work together to cook.
- From the household surveys, it was discovered that the community members sometimes
work for food.
f) Limitations At first, the aim was to ask the interviewees how much their bundles of firewood weighed.
Unfortunately, the scale broke and could not be replaced until later. For this reason, the method for
weighing changed. Two days were spent in week 9 (19-20 April), walking through the communities
to weigh as many bundles as possible. This meant the family size of the weighed bundles were no
longer known, so now all measurements were summed up, and an average was calculated, both for
the weighed of the bundles, the number of used bundles and for the family size. (For these
calculations see Chapter 4.3.3g) For that reason, it was impossible to make a good comparison
between the amount of firewood used and the number of people that is cooked for on that fire. It was
tried to find a correlation between the number of bundles used and the household size (number of
individuals that is cooked for), but this did not show a correlation. Also, the bundles each weigh
differently, depending on who collects and how strong that person is, thus with only this information
nothing significant could be concluded.
5.4 Evaluation sustainability The main research question is; “Is the firewood consumption of the local communities living near
Kidepo Valley National Park sustainable?”
a) Sustainability The yield of Sp1: Acacia albida: 3.220,77 kg and Sp2: Eucalyptus tereticornis: 4.945,14 kg are much
less than what the communities within the study area consume; 7.528.500 kg. Therefore, it seems
that there is by far too little firewood available for the communities to be able to harvest their yearly
needed firewood sustainably. Although it was discovered during the interviews that the
communities do not use the total available area, they will not walk farther than 5 km, and collect as
close to their compounds as possible. The same can also be concluded from the forest inventory;
the with GIS classified map matches with what was found during the transects. Thus the classified
map serves as a good indication of the present land use. The classified map in Appendix 13 shows;
the more dense woodlots are indeed about five km from the villages. If the community members
used the full area for the harvesting of firewood, there would be a bigger change of harvesting
sustainable, but as they now use only a part of the area, the harvest is done unsustainable.
31
For Sp1 Acacia albida one household in the study area would need 1,3 hectares to harvest their need
sustainably, and for Sp2 Eucalyptus tereticornis only 0,87 hectares is required. These outcomes seem
promising; there still is enough land that is currently not used and could be used for firewood
management.
b) Limitations During this research, it is assumed that managing an area for the firewood collection, with only
taking into account the mean annual wood biomass yield increment, is possible. According to Abbot
(1999), then the minimum rotation length of a plot of firewood managed on a coppice rotation could
be as short as 5 years. As mentioned before, the mean annual wood biomass yield increment serves
as a guideline; this is not a set number. It is also possible to establish firewood management based
on the annual harvestable deadwood yield. During this research, there was no possibility to estimate
or calculate the annual harvestable deadwood yield. Shackleton (1998) states: the deadwood
production is relatively constant from year to year, and he concluded; the annual production of
Deadwood is strongly related to the standing biomass. Therefore, it appears that an annual rate of
deadwood production of 1.5-2.0% of the standing biomass seems realistic. For this research area
that means first the standing biomass needs to be calculated, but when this number is known,
management options will be discovered. Currently, the management options are based on the mean
annual biomass yield increment.

32
6. Conclusion & Recommendations In this chapter, the research question is answered, and recommendations are given. The main
research question is:
“Is the firewood consumption of the local communities living near Kidepo Valley National Park
sustainable?”
To answer the main research question; No, the firewood consumption of the local communities living
near Kidepo Valley National Park is not sustainable. There is not enough wood in the area where the
collection currently takes place, but there is enough space where if correctly managed, firewood
collection can be sustainable. The future of the communities living near the NP looks promising, if
they work together and better manage and make use of the area.
It can be concluded from the results of this study, that there are many options for improving the
current situation. The communities are worried, they know their wood supply in the future is in
danger of disappearing, and are willing to change. They use their wood supply sparsely, but there
is still room for improvement. See below for the recommended options for improvement on the
current situation.
6.1 Communities There are several recommendations primarily aimed at the communities; they are elaborated
below. The communities will need to be assisted in following these recommendations; there is need
of knowledge (e.g. education) and aid either financial or in the form of products (e.g. stoves,
seedlings).
Stove use The first option is to promote the use of a stove. During the research, it was discovered almost no
one uses a stove. Although as explained before the impact will be limited, it will improve the
livelihood of the women who do the cooking.
Woodlot management What builds forward on this is the management of planted permanent firewood plots close to the
compound. The women would not have to walk for long distances and spend much time on the
firewood collection. The community members prefer to walk only up to 5 km. Also, the woodlots will
be easier to manage closer to home. The animals can be kept out, and the seedlings will be more
protected from the wildfires. Also, the firewood trees can be used to let the cattle graze between
and the leaves can be used as fodder. A species with good coppicing quality and preferably good
fodder is to be planted on the plot. Also, an Acacia species would be best, because that is the species
that is most preferred as firewood. Even fruit trees could be planted on these plots.
The management of permanent plots would also be positive in the wet season. Permanent plots near
their homes mean the collection in the wet season is easier and thus possible, which means they will
not have to collect more in the dry season, and that leaves time for other activities.
If looked at the classified map in Appendix 13, areas with dense woodlots still are numerous. A
possibility will be to use these areas, make plots and rotate them for the harvesting of firewood. As
mentioned before Abbot (1999), recommends a minimum rotation length of 5 years, for a coppice
rotation. So this is a good option to harvest sustainably and by that maintain the wood supply for
many more years to come. For this, to work, it means cooperation within the communities and strict
rules that need to be obeyed.
33
Agroforestry Another option is to promote the practice of agroforestry. According to Jama and Zeila (2005), the
policy framework for the institutionalisation of the concept of agroforestry in Uganda in already in
place. The Government’s Plan for the Modernization of Agriculture (2000), the Forest Policy (2001)
and the National Forest Plan (2002) all are supportive of the promotion and adoption of agroforestry
as a strategy for poverty alleviation. (Jama & Zeila, 2005)
Agroforestry means food crops or pasture lands are intercropped with trees; it is aimed at
increasing the sustainability of the land. It is a means to protect the natural resources and improve
the livelihoods of the communities. There are numerous examples where this system has improved
the livelihoods and environment. (Kassam, Fischer, & Antoine, 1991) In the study area it will have
several impacts:
The land will be used to full capacity while still being sustainable and fertile in the future.
The yield and income will improve.
The trees will hold onto the moisture.
Firewood could be collected from the gardens which mean it will be less labour intensive and
less dangerous.
Group work Different research (Agea et al., 2010) shows that working in groups to collect firewood and cook has
a positive effect on the amount of firewood that is needed. For this reason, it is recommended that
group work will be promoted in the area, share the work and food so that they all benefit. Group
work is currently not done often; some respondents did work together, but most did not.
National Park An additional source of resources is the NP. As mentioned before, the communities are allowed to
collect resources from inside the park and its corridor. As this is rarely done now, they should make
this option more clear to the communities, so that they can benefit more from it.
Trust A final recommendation is to improve the trust and respect between the different people in the
community. During this research it seemed that the Rangers, pastor and Chiefs have a down-looking
view on the community members, they perceive them to be dumber as they are. This lack in trust
needs to change, there should be trust and respect towards both sides, for them to be able to work
together and improve their future.
6.2 Further research This research did identify some problems in the area, which could not be researched at that time or
other additional research that is recommended:
The first would be the influence of the brick burning. To burn bricks much wood is needed,
preferably freshly cut and big, but unfortunately, it is one of the only options for getting
some income.
The same principle goes for the creation of charcoal, another option to get some income.
For the creation of charcoal also freshly cut big trees are needed. A solution to stop both
these unsustainable businesses should be identified.
Burning is a problem as well (see Chapter 1.1). It destroys the vegetation and thereby their
source of firewood. Also, tree planting activities can only start when the burning is under
control. Otherwise, the planted trees are at risk of being destroyed by the fires.

34
Research about alternative sources of income that are not bad for the environment should be done,
or activities to promote and create alternative sources of income should be held. By creating other
options to get an income, the need for brick burning and charcoal making should become less.
Good options in this are to continue and improve on the activities on chilli planting and beekeeping,
as is currently done by NUSAF in cooperation with UWA. However, there needs to be more attention
on the marketing part of these projects; the community has not yet a way to sell their products. If
there are alternative ways to get an income the burning will most likely lessen as well. Because
when there is enough money there is no need to hunt.
Also, additional research is recommended within the identified woodlots. A more detailed forest
inventory can take place, to assess the present wood volume, this will help to make a sustainable
management plan for these woodlots.
There is still room for further research on the topic of firewood collection but especially the
management of it, and thereby gives a starting point for future research.
35
Bibliography Abbot, P. G., & Lowore, J. D. (1999). Characteristics and management potential of some
indigenous firewood species in Malawi. Forest Ecology and Management, 119(1-3), 111–
121. http://doi.org/10.1016/S0378-1127(98)00516-7
Agea, J. G., Kirangwa, D., Waiswa, D., & Okia, C. A. (2010). Household Firewood Consumption and
its Dynamics in Kalisizo Sub-County, Central Uganda. Ethnobotanical Leaflets, 14, 841–855.
Aleper, D., Lye, K. A., & Moe, S. R. (2008). Response of Acacia Sieberiana to Repeated
Experimental Burning. Rangeland Ecology & Management, 61(2), 182–187.
http://doi.org/10.2111/06-179.1
Anthony Egeru, e. a. (2014). Coping with Firewood Scarcity in Soroti District of Eastern Uganda.
Open Journal of Forestry, 70-74.
Authority, U. W. (2012). Kidepo Valley National Park. Retrieved January 10, 2016, from UWA:
http://www.ugandawildlife.org/explore-our-parks/parks-by-name-a-z/kidepo-valley-
national-park
BCC. (2016, January 14). Uganda country profile. Retrieved February 4, 2016, from BBC News:
http://www.bbc.com/news/world-africa-14107906
Bennett, L. (2010). Image Classification toolbar introduced at ArcGIS 10. Retrieved June 2, 2016,
from https://blogs.esri.com/esri/arcgis/2010/08/09/image-classification-toolbar-
introduced-at-arcgis-10/
Burgess, R.G. (2003.). Field research: a sourcebook and manual. London and New York:
Routledge, 1989.
Buyinza, M., & Teera, J. (2008). A System Approach to Fuelwood Status in Uganda 264-275.pdf.
Research Journal of Applied Sciences.
Daniel Aleper, K. A. (2008). Response of Acacia Sieberiana to Repeated Experimental Burning.
Rangeland Ecology & Managment, 182-187.
De Hoyos, M., & Barnes, S.-A. (2012). Analysing Interview Data.
de Vletter, J. (2014). Transects.
Dewees, P. A. (1989). The woodfuel crisis reconsidered: Observations on the dynamics of
abundance and scarcity. World Development, 17(8), 1159–1172.
http://doi.org/10.1016/0305-750X(89)90231-3
Direct, P. (2014). Uganda: Conflict Profile. Retrieved February 4, 2016, from Insight on conflict:
http://www.insightonconflict.org/conflicts/uganda/conflict-profile/
Driessen, P. M. (2001). Lecture notes on the major soils of the world. Wageningen: FAO. Retrieved
from http://www.fao.org/docrep/003/y1899e/y1899e00.htm#toc
Ebanyat, P. (2009). A road to food? Wageningen: Wageningen University.
Egeru, A., Kateregga, E., & Majaliwa, G. J. M. (2014). Coping with Firewood Scarcity in Soroti
District of Eastern Uganda. Open Journal of Forestry, 04(1), 70–74.
http://doi.org/10.4236/ojf.2014.41011
Egeru, A. S. (2013). Rural Households’ Fuelwood Demand Determinants In Dryland Areas of
Eastern Uganda. Energy Sources, Part B: Economics, Planning, and Policy, 9(1), 39–45.
http://doi.org/10.1080/15567241003716688

36
ESRI. (2010). An overview of the Image Classification toolbar. Retrieved from
https://blogs.esri.com/esri/arcgis/2010/08/09/image-classification-toolbar-introduced-at-
arcgis-10/
FAO. (1985). Tree growing by rural people. Food and Agriculture Organization of the United
Nations.
Google. (2016). Retrieved January 16, 2016, from GoogleMaps:
https://www.google.nl/maps/place/Uganda/@3.5695811,34.2486673,179357m/data=!3m1
!1e3!4m2!3m1!1s0x1771a69f6499f945:0x874155ce43014549
Hall, V. (2014). Duurzaam bosbeheer voor dorpsontwikkeling Tropenbos International Suriname.
Jama, B., & Zeila, A. (2005). Agroforestry in the drylands of eastern Africa: a call to action, 38.
Jones, A., etc. (2013). Soil Atlas of Africa. Luxemburg: European Commission, Publiations Office of
the European Union.
Jorgensen, M., & Phillips, L. (2002). Discourse Analysis as Theory and Method. London: SAGE
Publications Ltd.
Kalumian, O. S., & Kisakye, R. (2001). A study on the establishment of a sustainable charcoal
production and licensing system in Masindi and Nakasongola district. Kampala.
Kassam, A. H., Fischer, G., & Antoine, J. (1991). Agro-ecological land resources assessment for
agricultural development planning : a case study of Kenya, resources data base and land
productivity, Technical annex 6, fuelwood productivity. Food and Agriculture Organization
of the United Nations.
Knapp, Alan K. (2001). "Savanna." Plant Sciences. Retrieved June 23, 2016 from Encyclopedia.com:
http://www.encyclopedia.com/doc/1G2-3408000270.html
Magrath, J., Carvalho, S., Nkuba, R. M., Nkubito, a, & Wangoolo, J. (2008). Turning up the Heat:
Climate Change and Poverty in Uganda, -.
Marshall, M. N. (1996). The key Informant Technique. Family Practice, 13(1), 92–97.
Najma Dharani. (2011). Field Guide to Common Trees and Shrubs of East Africa (7th ed.). Struik
Publishers (Pty) Ltd.
Our Reporter. (2015, September 6). Parliament Creates 23 New Districts. Kampala. Retrieved from
http://www.redpepper.co.ug/parliament-creates-23-new-districts/
Peace Direct. (2014). Uganda: Conflict Profile. Retrieved June 5, 2016, from
http://www.insightonconflict.org/conflicts/uganda/conflict-profile/
Ramos, M. A., & Albuquerque, U. P. de. (2012). The domestic use of firewood in rural communities
of the Caatinga: How seasonality interferes with patterns of firewood collection. Biomass and
Bioenergy, 39, 147–158. http://doi.org/10.1016/j.biombioe.2012.01.003
Shackleton, C. M. (1993). Fuelwood harvesting and sustainable utilisation in a communal grazing
land and protected area of the eastern transvaal lowveld. Biological Conservation, 63(3), 247–
254. http://doi.org/10.1016/0006-3207(93)90720-L
Shackleton, C. M. (1998). Annual production of harvestable deadwood in semi-arid savannas,
South Africa. Forest Ecology and Management, 112(1-2), 139–144.
http://doi.org/10.1016/S0378-1127(98)00321-1

37
SRM. (2014). Lesson on Social Research Methods. Velp: Van Hall-Larenstein, by Erica v. Duijl.
Temple, B., & Edwards, R. (2002). Interpreters/translators and cross language research:
Reflexivity and border crossings. International Journal of Qualitative Methods, 1(2), 1–12.
UBOS. (2014). SELECTED SOCIO ECONOMIC INDICATORS Total Census Population, (November).
Retrieved from http://www.ubos.org/onlinefiles/uploads/ubos/NPHC/NPHC 2014
PROVISIONAL RESULTS REPORT.pdf
Uganda, K. N. (2015). Kidepo National Park Uganda. Retrieved 2016, from Kidepo Valley National
Park: http://www.kideponationalparkuganda.com/
Uganda, R. o. (2015). NGO Forum. Kampala: Republic of Uganda.
Vandenbeldt, R. J. (1992). Faidherbia albida International Crops Research Institute for the Semi-
Arid Tropics International Centre for Research in Agroforestry. Niamey, Niger. (In En.
Summaries in En, Fr, Es.) Patancheru, A.P, 502(212), 22–26.
World Reference Base Group. (2014). ISRIC World Soil Information. Retrieved Januari 19, 2016,
from SoilGrids1km: http://soilgrids1km.isric.org/index.html

38

39
Appendixes

40

41
1. Appendix – Problem tree
Unsustainable harvest of firewood
Only source of energy & building
material
Alternatives too expensive
No other possibilities for
income
No alternatives available
Lack of knowledge & Capacity
Bad schooling
No other possibilities for
income
War & Unrest
Cutting of live trees
More wood needed
Less wood available
Burning
No other possibilities for
income
Less land is available
More wood needed
Population size is increasing
Conversion of land into
agricultural land
Population size is increasing
Social status increases with
number of wives and kids
Excess into forest is increased
Government
Little support
Little control and punishments for breaking the law

42
2. Appendix – Stakeholder analysis Stakeholders and their basic
characteristics
Interests and how they are
affected by the problem(s)
Capacity and motivation to bring
about change
Possible actions to address the
stakeholders interests
● Community Wildlife and
Education Centre Ajokis: Centre
to assist and help the communities
towards a better life.
- Increase well-being of the
communities and wildlife.
- Educate the communities.
- They have the capacity to bring
about change.
- They are very motivated to
improve the livelihoods of the
communities.
- Provide training.
- Provide incentive.
- Organise group meetings.
● Uganda Wildlife Authority
(UWA): The rangers that protect the
wildlife, vegetation and people that
live in and around the NPs and the
corridor.
- Enforce the law and protect the NP
and its corridor.
- Protect the communities from
wildlife.
- Educate the communities to
prevent human-wildlife conflicts
and illegal activities.
- They have the capacity, but are
limited; the area is too big, and the
corridor is not yet defined.
- They are motivated.
- Provide training to increase
knowledge of human-wildlife
conflicts.
- Provide incentive to communities to
improve livelihoods. (chilli projects,
beehives)
● Karenga cultural group: A
voluntary dance and drama club,
that works to increase knowledge,
improve the livelihoods and
preserve their culture.
- They aim to improve the
livelihoods of the communities.
- They aim to preserve their culture.
- They teach communities with their
drama.
- They have the capacity to bring
about change.
- They are very motivated and
active in doing so.
- Provide training to increase
knowledge on farming and handicraft
making.
- Provide drama to educate.
● Firewood collectors and users:
all members of the community who
collect firewood to be able to
maintain their livelihood.
- Want to collect firewood for their
subsistence.
- Firewood extraction is done
unsustainable which in the end will
lead to a decreased wood
availability.
- Limited capacity to bring about
change. However, if they work
together, they can put pressure on
the leaders.
- Are motivated because of their
need for resources.
- Create a council or group for the
management and extraction of
firewood, which will also increase
their capacity to bring about change.
- Set up firewood plantations.
- Agroforestry
● Parish Chiefs: The leaders of the
parishes, they have some political
influence and know what is
happening in their parish.
- It is their responsibility to create a
healthy environment for the village.
- Increase well-being of the
community by implementing
certain laws and being involved in
the guidance of the village.
- They have little capacity to bring
about change. They have little
political influence.
- Their motivation is there, but they
lack real capacity to change
anything.
- Contact and work together with
NGOs to provide training regarding
management and sustainability.
- Start projects to request funding
from REDD or PES.
- Improve market availability,
awareness and access for villagers
regarding NTFPs and food products.

43
3. Appendix – Map of the research area

44
4. Appendix – Visited villages
Table 16, Overview of the location of the study
District County Sub-county Parish Village
Kaabong Dodoth East Kamion Morungole Palakan
Dodoth West Karenga Karenga Kamkoi North
Kamkoi South
Kangole Central
Kangole North
Kangole South
Lokodope Ward
Lopotuk
Nalemaru
Wapakiru
Lokori Kachapangole Ward
Lokori Central
Loyoro Geramech
Lorukul
Nakitoit Sriti
New Karenga
North Loyoro
South Loyoro
Opotopot Kalokudo Ward
Lokuyon Ward
Kawalokol Naseperwai Lemukol
Monita
The table above shows first the District in which the research took place then it shows the different
sub-counties and its parishes and villages.

45
5. Appendix – Key informant interviews
This appendix shows the interview questions that served as a guideline through the semi-structured
interviews that were held with the different key informants. The informants were; the Karenga
cultural group, Pastor David, the parish chiefs and three rangers of UWA.
Important issues in the area
Problems in the area
Activities to improve the area; tree planting for example
Government; support enough?
Electricity
About the NP; problems, risks, collection in NP or corridor, etc.
Firewood; availability, distribution and consumption
Rules and regulations
Also, a focus group meeting was held with the Karenga cultural group. The aim of this meeting is to
get an overview of the current situation near Kidepo Valley NP. Important topics will be discussed,
including topics related to this research, thus firewood and charcoal. The topic is written on a piece
of paper, and the member can write their ideas and discuss them.

46
6. Appendix – Household Survey
Interview nr: Date: Village: Waypoint:
Interviewee: F / M Age: Family size:
Cook for:
Family head: F / M
Marital status: Education level: Occupation: Tribe:
1. What type of fuel do you use? Firewood or do you use other types of fuel? Charcoal/gas/bio
2. How do you burn your fuel? Stove or..?
3. How many times a day do you make fire? For what?
4. How many meals do you cook a day and how many time you eat?
5. Do you let it burn after use?
6. Is there any management plan for firewood gathering?
7. Who is allowed to collect where? Are there restricted areas?
8. Do you know of any alternatives to the use of fuel wood?
9. When there is little fuel wood available how do you cope/adapt?
10. Do you buy fuel wood or charcoal? How much money do you spend monthly?
11. Who collects the firewood for the family?
12. How much fuel wood do your family use per day/week | how many bundles?
13. How many times a week do you collect fuel wood? Every day? Alternatively, once a week,
or..?
14. How many hours do you spend collecting fuel wood a day/week?
15. How far do you and are you willing to walk to collect fuel wood?
16. Is this different in different seasons?
17. What species do you prefer/ what species do you use? Species you not used? Why
18. What type of wood do you collect? Living or dead?
19. Is there a change in certain species availability? Alternatively, further away/ decline?
20. Are there specific characteristics/ quality of fuel wood you want? A-J
21. Do you worry about availability in future?
22. Have you ever planted a tree? Do you have an interest in setting up a nursery, for
enrichment planting?
23. Can I weigh a bundle/head load of firewood?
24. Are there any questions you would like to ask us?

47
7. Appendix – Transect form
Team Community Local expert
Transect nr. Waypoint nr. Date Direction(°) Vegetation Type
Distance on transect (m)
N-coord E-coord Circle radiuses: Observation protocol
11,28 m Every 1 km on road, walk 50 m into corridor at a 90° angle from road
Canopy Height (m)
Density Canopy Estimate (%) 0 0-50% 0 50-70% 0 70-80% 0 80-90% 0 90-100%
Firewood species local name (visible from transect point)
Other species local name (visible from transect point)
Number of stumps inside radiuses
Small plot >=10cm dbh
Large plot >=20cm dbh
Soil texture
0 clay 0 sandy 0 loam
0 rocks 0 gravel
Slope (%)
Signs of human disturbance
0 agriculture 0 logging 0 hunting 0 mining
Description:
Remarks

48
8. Appendix – The mean annual wood biomass yield increment Here the annual biomass increment of two commonly used firewood species is calculated, the Acacia
albida and Eucalyptus tereticornis. The document used for these calculations is Chapter 6 - Fuelwood
productivity from a report of the FAO, in the text, a reference to the used tables is made. (Kassam,
1991)
8.1 Acacia albida To be able to calculate mean annual wood biomass yield increment, the tables in the FAO document
are needed to be able to fill in the formula, the following input data is used;
Latitude: 0 Degree North
Temperature: 20-25 °C
LGP: 180-270
Cloudiness: 35%
Months: April – October
Rainfall: 750-1000 mm
LAI: 2
Step 1 – get values needed for formula:
Table 6.1, shows the Acacia albida has a productivity class A II and is a nitrogen fixer.
Table 6.2 shows a rate of maximum photosynthesis (Pm) of 7,5 kg CH2/ha/hr.
Table 6.3 shows a rotation length of 10-12.5 years is required.
Table 6.4 indicates that Acacia albida is an S1 = 0.25
From Table 6.6 the daily gross photosynthesis rate of standard vegetation canopies on very clear
(bc) and overcast (bo) days can be calculated. The average of the months of the growing period is
calculated; bc = 420.57 bo = 223.71
LAI = L = 0.6
Cloudiness = F = 0.35
LGP = N = 270
Step 2 – Filling in the formulas:
Because Pm <20, the second formula is used to calculate the daily rate of gross biomass production
(Bgm): Bgm = F(0,5 + 0,025 * pm) * bo + (1- F) (0,05 * pm) * bc
Bgm = 0.35*(0,5+0,025*7,5)*223,71 + 0,65*(0,05*7,5)*420,57 = 156,34 kg CH2O/ha/day
The maintenance respiration (Ct) = C25 * (0,0044 + 0,0019 * T + 0,0010 * T2)
For N-fixing species such as the Acacia albida C25= 0,0283
Ct= 0.0283*(0,0044 + 0,0019 * 25 + 0,0010 * 252) = 0.01915627
The annual total net biomass production (Ba) = (0,72 * bgm * L) / (1/N + 0,25 * Ct)
Ba = (0.72*156.34*0.6) / (1/270+0.25*0.01915627) = 7.952,51 kg/ha
Step 3 – Converting and finishing up:
The mean annual total biomass increment (Bm) = 0,81Ba
Bm = 0.81*7.952,51 = 6.441,54 kg/ha
The constraint-free mean annual wood biomass yield increment (Bw) = harvest index (Hi) * Bm
Bw = 0.5*6.441,54 = 3.220,77 kg/ha
Here is what was calculated:
The total annual net biomass production: Ba = 7.952,51 kg/ha
The mean annual total biomass increment: Bm = 6.441,54 kg/ha
The mean annual wood biomass yield increment: Bw = 3.220,77 kg/ha

49
8.2 Eucalyptus tereticornis The same input data is used as for the annual increments;
Latitude: 0 Degree North
Temperature: 20-25 °C
LGP: 180-270
Cloudiness: 35%
Months: April – October
Rainfall: 750-1000 mm
LAI: 2
Step 1 – get values needed for formula:
Table 6.1 shows the Eucalyptus tereticornis has a productivity class B II.
Table 6.2 shows the Pm = 15 kg CH2/ha/hr.
Table 6.3 shows a rotation length of 7,5-10 years is required.
Table 6.4 indicates that Eucalyptus tereticornis is an S1 = 0.25
From Table 6.6 bc & bo are determined, they are the same as for the annual increment for the crops;
bc = 420.57 bo = 223.71
LAI = L = 0.6
Cloudiness = F = 0.35
LGP = N = 270
Step 2 – Filling in the formulas:
Because Pm <20, the second formula is used to calculate the Bgm:
Bgm = F(0,5 + 0,025 * pm) * bo + (1- F) (0,05 * pm) * bc
Bgm = 0,35*(0,5+0,025*15)*223,71 + 0,65*(0,05*15)*420,57 = 273,54 kg CH2O/ha/day
Ct= C25 * (0,0044 + 0,0019 * T + 0,0010 * T2)
For N-fixing species such as the Acacia albida C25= 0.0108
Ct= 0,0108*(0,0044 + 0,0019 * 25 + 0,0010 * 252) = 0,00731052
Ba = (0,72 * bgm * L) / (1/N + 0,25 * Ct)
Ba = (0,72*156.34*0,6) / (1/270+0,25*0,00731052) = 12.210,23 kg/ha
Step 3 – Converting and finishing up:
Bm = 0,81Ba Bm = 0.81*12.210,23 = 9.890,29 kg/ha
Bw = Hi * Bm Bw = 0.5* 9.890,29 = 4.945,14 kg/ha
Here is what was calculated:
The total annual net biomass production: Ba = 12.210,23 kg/ha
The mean annual total biomass increment: Bm = 9.890,29 kg/ha
The mean annual wood biomass yield increment: Bw = 4.945,14 kg/ha

50
9. Appendix – Observations During the first two weeks of the field work, 22 February until 6 March, observations were done
about different topics. Below an overview of the observations is given.
Related to the management the following observations were made:
Goats and cows roam freely, at the start of the growing season they will be herded. In the
afternoon the goats and cows are herded towards their home.
There are more goats than cows.
It is often just children that herd the cattle.
Mostly children and women collect water. Men never do.
Large areas of grass and shrub land are burned to get access to a type of rat.
Women, men and children plough and plant the fields.
It is the men that build the fences and houses.
The following observations related to income were made:
Many people bake bricks.
People sell clothes, shoes, food along the road.
There is little option to get income.
There are a few shops, restaurants and bars in the villages.
Related to the well-being of the communities, the following observations were made:
All children wear dirty, broken clothes, most adults as well. Except for Sunday, when they go to
church they wear nice clean clothes.
Many children have bloated bellies. Thus many are malnourished.
There are not many old people.
There are a lot of pregnant women and many small children. Also, the older kids (7 years) take
care of their younger siblings (from 1).
The men here have multiple wives, only one or two.
Within the staff of Buffalo base, there was a guy with malaria, a child on medicine (15 months
old), a mother and another sister who died of malaria.
Water is always available, but they have to walk down to the water pomp. There is a system to
connect households to so that they have a tab at their homestead, but this is often too expensive.
Many people drink the local alcohol, starts in the morning till dark. Also, children are drinking
kwete (alcohol). The kwete they drink instead of eating. To give the adults energy and keep the
children quiet.
Finally, there were observations done about the overall topics in the area:
Harvests have failed. So there is food shortage
Everybody lives in traditional houses, except for a few who have built a western type house.
Men sit around and do nothing other than playing card and drink during the dry season. Only
women are at work. Alternatively, men built the houses. In the wet season, everybody works.
In Karenga, the community has access to a one new looking tractor. This was given by the
government, but most people cannot afford to use it because they need to pay for the gas and driver.
Most people use their strength to plough; some use the oxen.

51
10. Appendix - Key informant answers With these interviews, an overview of the current situation in the area is discovered. The following
people were interviewed; three parish chiefs, Pastor David, the Karenga cultural group and three
Rangers from the NP. An overview of the interview questions is given in Appendix 4 – Key informant
interviews.
9.1 Parish chiefs Three parish chiefs were interviewed for the research. The parish chiefs of Karenga, Loyoro and
Opotopot and Lokori. Below a summary of these interviews is given, the summary only includes
relevant information to be able to answer the sub-question given above. Al these interviews were
done on the 26 of February of 2016. First, the parish chiefs and their parish are given:
- Chief Opio John Johnnic; Loyoro Parish
- Chief Adui Milton; Lokori and Opotopot parish
- chief Lotyang Fidelis Nakoma; Karenga parish
Problems
O. J. Johnnic: “Manmade wildfire is the most important problem. Burning is still common because
the law enforcement and implementation are too weak, and there is no real punishment. Another
problem is deforestation, caused by the production of charcoal (to make money), collection of
firewood and wood for fences.”
A. Milton: “When burning bricks lot of wood needed.”
L. F. Nakoma: “The yield is reduced because of the yearly use, now some soils are poor from over
cultivation, while the soils are very fertile. They have to move to different richer unused soils. Bush
burning, this causes water to evaporate more quickly, and the water table reduces, as well as the
insects and plants are reduced. This problem is seasonal.”
Actions to solve problems
O. J. Johnnic: “Sub-county has a program Local Environment Committee (LEC), funded by the
government. This program operates at the village level, parish level and sub-county level. It was
founded in 2009. They implement rules like no cutting and no collection of wood on slopes; the
improvement can be seen on the hillsides, which is now forested again.”
L. F. Nakoma: “Educate people so that they are better at planning and management then production
will increase, fewer crops will be lost, and the soil will be over cultivated. Also teach people
prevention, tell them Bush burning is bad and provide them with other options of income.”
Programs in tree planting or other activities
O. J. Johnnic: “The LEC has no programs or activities. However, other NGOs have; Northern Uganda
Social Action Fund (NUSAF) for instance provides seedlings to groups of people, for them to grow
trees for their use. The church and other NGOs have similar activities.”
A. Milton: “NUSAF provides organised groups with seedlings, only for organised groups. The AWF,
support chilli planting and help with marketing. It has just started, shows promise, good to generate
income.”
L. F. Nakoma: “The sub-county has tree planting as a priority. They advocate it and try to get ten
trees per household planted each year. Also, tree planting activities are held to protect hillsides.
LEC was funded for this. The parish protects existing trees; this is important because trees reduce
heat, hold water and protect the soil and crops from rain.”

52
Electricity and other government support
O. J. Johnnic: “The government is obligated to provide electricity and good roads. Soon the tar road
and electricity will be in Karenga. Mostly the government does this to promote the NP. If everything
goes according to plan Karenga will become a district in 2019, this will promote the wellbeing of
the area because there will be more finance available. This is also why the tar road and electricity
are coming because that is a criterion to be allowed to become a district.”
A. Milton: “Even when the electricity will reach here it will not be affordable for most people. To
light houses people use candles sometimes, this causes the houses to burn down.”
L. F. Nakoma: “Government support is good; they provide finance and have many activities.
Electricity is promised but I am not sure it will come; same goes for the tar road. There are multiple
governments supported organisations:
● Community Driven Development Fund (CDDF)
● Local Government Management Service Delivery (LGMSD)
● NUSAF, funds tree planting and so far there are five woodlots.
● Wildlife Community Society, support writing an action plan and implementing
activities. They have organised the creation of beehives. However, they are not
able to sell the honey.”
Problems and questions of the community members
O. J. Johnnic: “There are many problems the community members come with, many complaints.
This differs from minor problems to big problems, such as; crop destruction by animals, domestic
violence and other problems in households. When people come with problems a disaster report is
written, this report is given to district office, and they will come to solve the issue if they are able.”
A. Milton: “The people come to ask about government activities like food programs and such. Also,
they ask about when Karenga will become a district so that Lokori and Opotopot will become a sub-
county. When this happens this means an upgrade; the finance will increase, and they will get
benefit from the NP.”
L. F. Nakoma: “Community members will ask about projects organised by NGOs and in case they
are not able to pay the school bill and their kids have to drop out. They will ask for support to pay
the school fee (Primary is free, Secondary costs). FAULWE used to help but not anymore.”
Firewood in the future
O. J. Johnnic: “He does not worry. The people are trained to use a stove. They are educated in other
improvements in cooking. Already, the cutting for fence material has reduced because people feel
safer.”
A. Milton: “The community members do not worry a lot about the future. They do not think about the
future, they live in the moment and are happy with what they have. This means there is no planning
for the future.”
L. F. Nakoma: “Firewood will not finish. People do not cut wood but collect dead wood and on the
agricultural fields they cut small trees but leave the big ones.”
Alternatives to firewood
O. J. Johnnic: “There are not yet many alternatives available but with education, this will improve.
As well as when the electricity will be available. Plus more solar powered cooking will be possible.”
A. Milton: “There is no alternative to firewood, only charcoal but that is too expensive.”
L. F. Nakoma: “Almost everyone uses firewood, like ¾ of the people. The mean reason being, it is
cheaper. Some people use charcoal but not many. Many people make charcoal to sell it, this causes
woodlot to be illegally cut to make the charcoal. Some people build a stove to burn more
effectively.”
Management of firewood

53
O. J. Johnnic: “No collection or cutting at Cultural shrines or on hillsides. Most shrines are on slopes.
Other than this no further management.”
A. Milton: “There are no rules, you can collect dead wood, and you can cut for firewood and building
materials. It is not allowed to cut the Sheanut tree. Most people collect too much firewood in the dry
season to make a fence from it, this fence they will use in wet season.”
L. F. Nakoma: “Law protects shrines; you are not allowed to collect dead wood and live wood. On
hills, cutting is not allowed, but the collection of dead wood is ok.”
Little firewood
O. J. Johnnic: “This is not the case, there is still plenty even for building materials.”
A. Milton: “There is always enough firewood available. However, still, planting should be
promoted.”
L. F. Nakoma: “When there is little firewood some people will use grass or sorghum stock instead
of wood to cook. In the wet season the firewood is scarce, so in the dry season, they build a fence of
dead wood, to use in the wet season. The dry season is the building season and the wet season is
the planting season.”
9.2 Pastor David Pastor David is the pastor of the Catholic Church in Karenga. He was interviewed on the 25th of
February of 2016. Below an overview of this interview;
Almost all people use firewood for cooking, some use charcoal, there is no other option. Usually,
people make charcoal to sell. The firewood is collected by the women and their children. The
collection is done daily and can take up to 6 hours, and people can walk as much as 8 km. During
the wet season, the collection is difficult because of the growth of plants, mainly grass and bushes.
During the dry season, they collect every day so that they have a surplus. From this surplus, they
make a fence so that in the wet season they can use that.
Sub-county Karenga decided that there be no collection of dead or living wood on slopes and
mountains allowed. Collection of dead and alive wood, so they also cut trees, this is a danger to the
environment. Everybody can collect anywhere; there are no real rules about who collects where.
There is no real preference; every species is used and no specific characteristics are required, they
take everything. The distance to collect firewood keeps increasing over time.
Cooking is done mostly once in the evening, the next morning the left over is given to the kids. Few
people can cook three times a day. People cook mostly on an open fire, using three stones to put
the pan on. Only a few have stoves. People do not preserve wood, they just let it burn, even to make
the house warm sometimes. When there is little firewood available, they use sorghum and grass to
cook. There are no alternative ways for cooking available. Only the educated can buy firewood or
charcoal. Charcoal is not often bought; it is expensive.
The church encourages tree planting and has an example in their garden, many eucalyptus trees
they have planted. The problem is the burning; fire destroys the planted trees.
People are not aware of the problems; they do not think of the future.
The president promised a tar road all the way through Karenga to South-Sudan as well as electricity.
The electricity will have to be paid for, with the airtime system, so only educated can afford it. Most
people will not benefit from this. In addition, electricity will not be used for cooking, so it will not
stop deforestation.
Possible alternatives for the use of firewood for cooking are; to use paraffin burners but they are
expensive or to cook on solar power.

54
9.3 Cultural Group On the 22nd and 23rd of February 2016, the Karenga cultural group was interviewed. It was an
interactive group session, with the director Albine and 15 members (2 men, 13 women). The topic
of firewood was written on a paper, and the people were asked to write down what they thought
about it after this these topics were discussed.
The Karenga cultural group is a group that has many projects in the area. They have recently
received funding for their projects. They have received this funding by writing a project proposal,
with the purpose, different objectives, the envisioned results and the different activities. The funding
is mostly for directed at what the funder wants: cultural heritage preservation not for tree planting,
beekeeping, etc.
The Group is voluntary and consists out of member from different parishes. The group also has
members from higher political places, that way the influence of the Cultural Group is extended to
the different parishes. If a member is not able to come or do something, a family member will take
his/her place. The Cultural Group has activities and educates people in the area. Everyone is
welcome; it is voluntary based and for everything, there is someone with knowledge on the topic.
Everything is handled; agriculture, handcraft, planting trees, health, etc. The focus is on nature and
cultural conversation and health. The Group educates people through the use of drama; with plays
with songs and music.
For instance, a play about malaria includes songs about how bad mosquitoes are and how to prevent
the disease, etc. Unfortunately, there is a lack of funding for things like computers, etc. This makes
the management very difficult; it would go easier and faster with these facilities.
About firewood they said: the community is able and willing to plant trees, but they have no time
and money to do it. Another problem is they get seedlings from NGO, when wet season is almost
over, thus of no use. They do work efficiently with wood; leftover building material is used as
firewood.
In Appendix 10, the paper with the topic the group wrote down is shown. They wrote down the
following:
- Firewood is used daily
- Charcoal is for rich people and more destructive for environment
- Firewood collection takes 2,5 km walk further than before
- Any species is collected. Accept some species that are toxic to cattle
- Collect from everywhere, not in spiritual places
- Yearly replanting of trees
After some further questions and a discussion the following information collected:
- Charcoal is expensive
- Collection of firewood and other products is dangerous
- One bundle a day sometimes two days depends on family size
- Both men and women but most women // men sell it
- Size of bundle depends on how much you can carry
- Schools need much fuel wood
- Many families use stoves
- Collection of dead wood only (sometimes dead because of elephants)
- Charcoal is destructive! Large scale and for richer people

55
9.4 Rangers of UWA On the 15th of March 2016 three rangers of the UWA were interviewed, two males and one woman.
A summary of these interviews is given below.
Burning
Burning inside the park is not allowed all interviewed Rangers agree to that, but it does happen.
Martin says: “The neighbouring communities burn inside the park, because then the animals will
come outside the park to graze and then they can trap them. It is difficult to catch them, but they are
able at times, if they get caught we take them to court.”
However, Geoffrey says: “First educate, sensitise them if that does not work than force them by
punishment. Punishment can first be community service for a couple of days but after that, they go
to court.” Morene says: “There is not a fine defined by law, so mostly if we catch someone we give
them community service.”
To prevent burning from happening inside the park there are prevention measurements taken.
Morene says: “By monitoring and having informants in the communities, we educate the
communities and get informed on the situation inside the communities. We also make firebreaks
with machines to prevent the fire from spreading throughout the park.” Also, Martin says: “We have
a prevention measurement called early burning, this means we burn small areas to prevent the
animals from moving outside the park. Also, we have the community conservation department; they
talk to the communities about the dangers and risks of their illegal activities and the change of been
taken to court.”
Collection of firewood inside park
The interviewed Rangers all say that it is allowed to collect resources from inside the park, but only
if they arrange it with UWA. A ranger will escort them to protect them and to tell them where to take
the resource. However, this is rarely done. They all agree illegal cutting and gathering of wood
takes place inside the park; they see the evidence. Again there is no fine, but if they get caught they
first get a warning and after that, if they get caught again they are taken to court. Martin says: “We
patrol the park to prevent this from happening.” Also, to prevent this, Geoffrey says: “Educate and
cooperate with the communities, so that the communities learn to live with the rules and dangers of
the park.”
Collection in corridor
The Rangers agree that it is allowed to collect firewood from inside the corridor, but cutting is illegal
by law. Punishment is the same as above. Martin says: “The corridor is 5 km next to the border and
if someone wants to get something from inside the corridor he or she should contact UWA and a
ranger will come along for safety. For instance, if women want to collect vegetables.” Geoffrey says:
“There is much evidence of illegal cutting inside the corridor.” While Morene says: “I do not see
much evidence of tree cutting here.” The NP, border area, corridor and neighbouring towns are
patrolled, but not regularly inside the corridor because that is far away from the main office.
Patrolling happens by car and mostly by foot, but also aerial surveys are done with a plane.
Collection in corridor towards other parks
Morene says she does not know about the corridor towards the other parks. The men say the rules
and patrols are the same as for the border area corridor. Martin says: “We also monitor the
movement of the animals, via foot and aerial survey. A plane from Kampala comes here for 3 or 4
days, locates animals and makes pictures. The population has increased; there are now so many
animals in the corridor.”

56
Firewood use inside park
Geoffrey and Morene say they use charcoal and buy it from the local communities. Martin says there
are many outposts, and they use charcoal, firewood, and sometimes even gas and they buy it from
the local communities.
Assist in security for the villages around the NP and human-wildlife conflicts
Both in and outside the park UWA handles the human-wildlife conflicts. Geoffrey says: “If there is a
problem with for instance a buffalo near the village, we sent rangers they put down or drive the
animals back to NP. Also, during and before the harvest time rangers are deployed in villages and
at fields, to protect the fields and farmers.” Morene says these Rangers are assisted by scouts who
are trusted by the communities thus get the message across better. Martin says: “Scouts are hired,
they live inside villages and help rangers to make sure communities are safe, and they keep the
animals away. During harvest, they stay in the gardens to keep the animals away. Also if there is an
animal, wounded or too close, they call, and UWA comes to take care of it, either by killing it or
chasing it away.” To keep the animals away, they have different measures, which are thought to the
communities; the easiest being making noise with music. Another option is bees, animals especially
elephants are afraid of bees. UWA buys beehives for communities but unfortunately they are
expensive. Thus they cannot provide everyone. The same goes for chilli, elephants do not like it and
stay away from the plant. UWA instructs the farmers how to use the chilli in the field and how to plant
them; they provide the seeds and help with getting the chilli to the market.”
Tree planting:
Martin says: “20% of UWA’s income through tourism is to be invested into the communities
bordering the park. That is why we have a tree planting project in Loyoro. We buy eucalyptus
seedlings for community members; now they benefit from it.” Geoffrey says they do not do any
activities with tree planting, and Morene does not know.

57
11. Appendix – Karenga cultural group
Figure 9, Focus group meeting discussion points

58
12. Appendix – Location household surveys

59
13. Appendix – Classified map
Figure 10, Classified map of the study area

60
14. Appendix – Results; Transects
Table 17, Transect 1
Transect point
Plot number Direction
Canopy height(m)
Density (%)
Number of stumps
Number of trees
Total trees
Human disturbances
1 1 NNW
4 10 5 5 Logging, Also next to the road
2 ZZO
5 10 7 4 9 Logging, Collecting leaves to eat
2 3 N 2 <5 0 1 -
4 ZW
5 <5 1 5 6 Logging, Collecting leaves to eat
3 5 NNO 5 <5 0 3 Early burning
6 ZW 3 <5 0 4 7 -
4 7 NNO 3 <5 0 2 Early burning
8 Z 2 <5 0 3 5 Early burning
5 9 N 5 <5 0 3 Natural burning
10 ZZW 5 <5 0 2 5 -
6 11 NNW 5 15 0 10 -
12 ZZW 4 15 0 10 20 -
7 13 N
5 10 0 8 Collecting leaves to eat
14 Z 4 <5 0 2 10 Early burning

61
Figure 11, Transect 1

62
Table 18, Transect 2
Transect point
Plot number
Direction Canopy height(m)
Density (%) Number of stumps
Number of trees
Total trees
Human disturbances
1 35 ZZO
5 10 5 3 Early burning, Logging (many in area)
36 NNW 3 <5 0 5 8 Late burning
2 33 ZZO
5 20 0 9 Late burning, Logging next to road
34 NNW
6 20 0 10 19 Early burning, Logging next to road
3 31 Z 0 0 0 0 Late burning
32 NNW 0 0 0 0 0 -
4 29 ZZO 1 0 0 1 Late burning
30 NNW 3 <5 0 3 4 -
5 27 ZO 3 <5 0 8 Late burning
28 NW 4 <5 0 6 14 Late burning
6 25 ZO 3 <5 0 9 Early burning
26 NW 5 <5 0 9 18 Logging
7 23 E 4 30 0 13 Early burning
24 W 5 25 0 9 22 Early burning
8 21 ZO 3 <5 0 2 Late burning
22 NW 4 10 0 9 11 Late burning
9 19 Z 5 10 0 6 Late burning
20 N 0.5 <5 0 1 7 -
10 17 ZZO 5 <5 0 4 Late burning
18 NNW 4 <5 0 3 7 Early burning
11 15 NW 3 <5 0 5 Late burning
16 ZO 4 10 0 8 13 Early burning

63
Figure 12, Transect

64