Embed Size (px)
Citation preview
SUSTAINABILITY, ENERGY, AND ECONOMIC GROWTH
R. U. Ayres, MAY 26, 2009
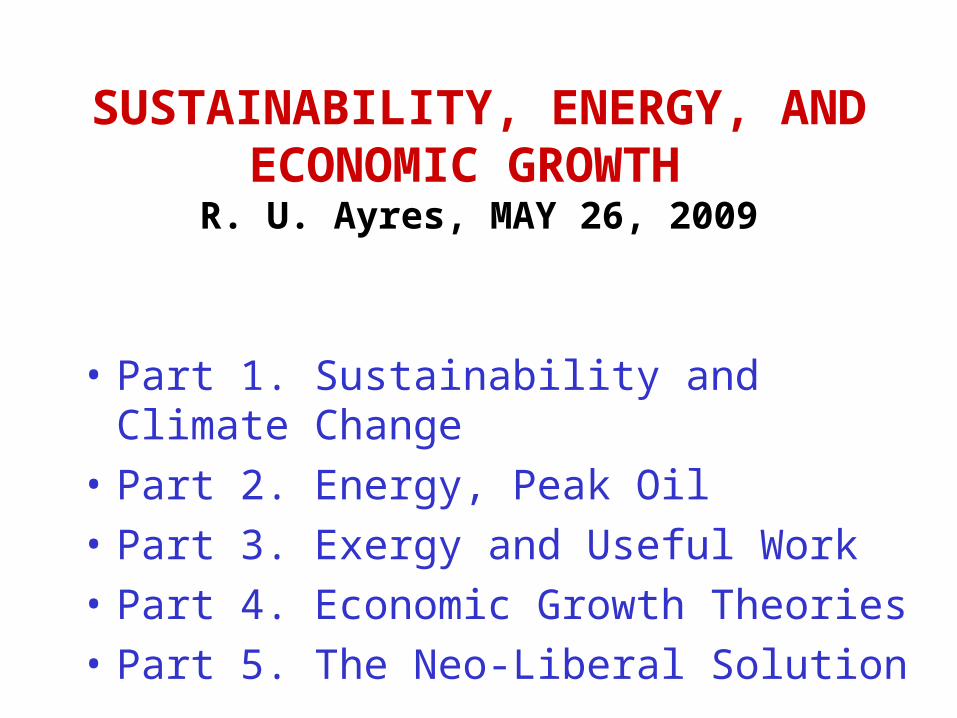
• Part 1. Sustainability and Climate Change
• Part 2. Energy, Peak Oil
• Part 3. Exergy and Useful Work
• Part 4. Economic Growth Theories
• Part 5. The Neo-Liberal Solution
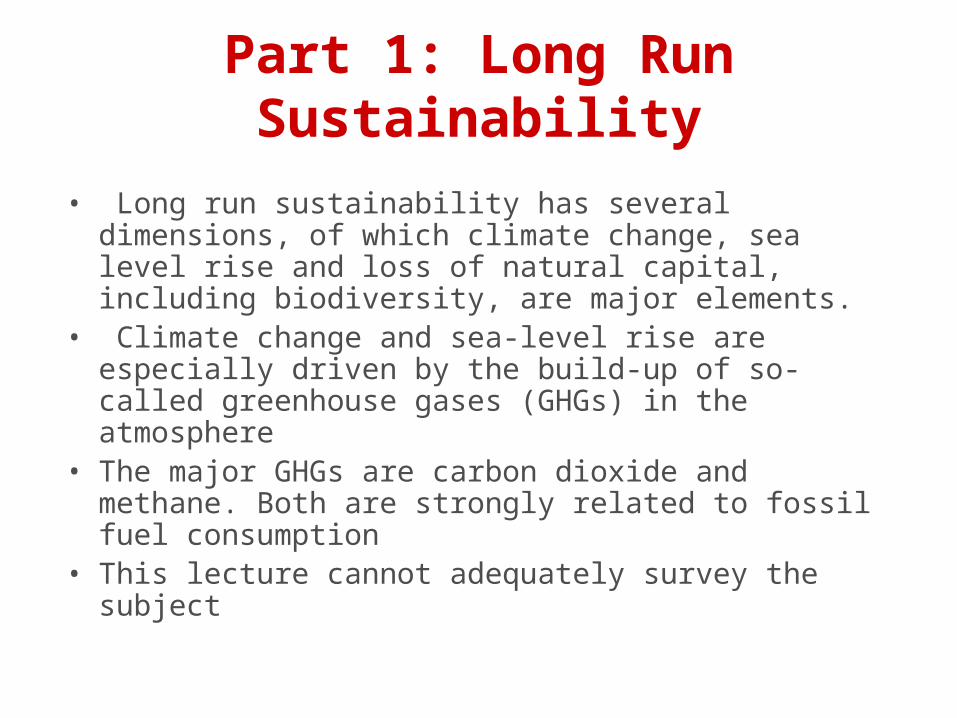
Part 1: Long Run Sustainability
• Long run sustainability has several dimensions, of which climate change, sea level rise and loss of natural capital, including biodiversity, are major elements.
• Climate change and sea-level rise are especially driven by the build-up of so-called greenhouse gases (GHGs) in the atmosphere
• The major GHGs are carbon dioxide and methane. Both are strongly related to fossil fuel consumption
• This lecture cannot adequately survey the subject
-0.6
-0.2
0
0.2
0.4
0.6
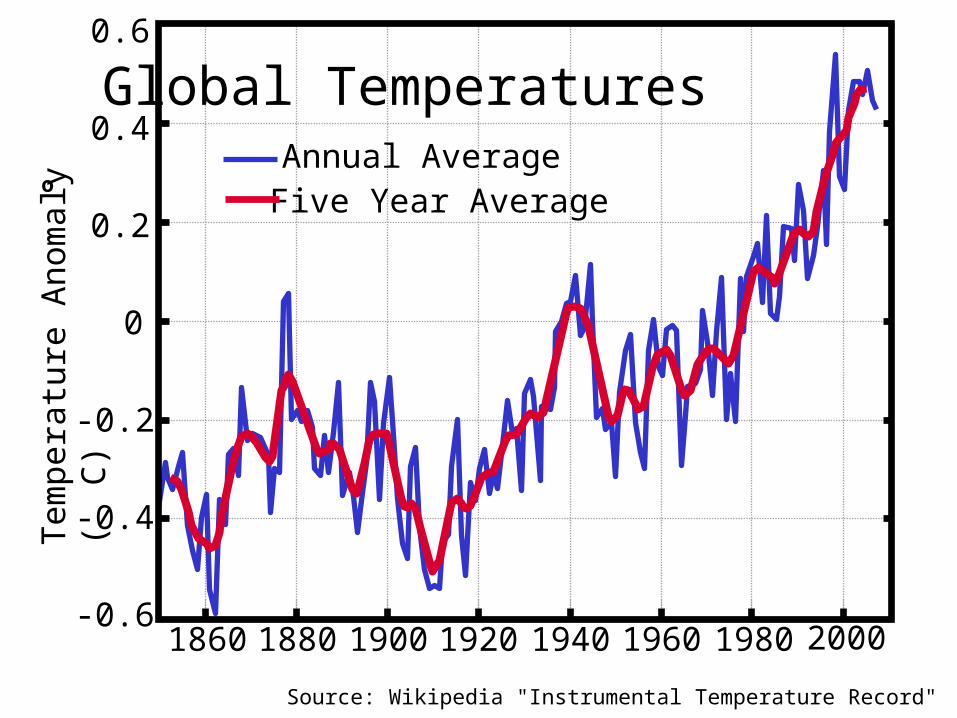
Five Year Average
1860 1880 1900 1920 1940 1960 1980 2000
-0.4
Annual Average
Tem
pera
ture
Ano
mal
y (
C)
Source: Wikipedia "Instrumental Temperature Record"
o
Global Temperatures
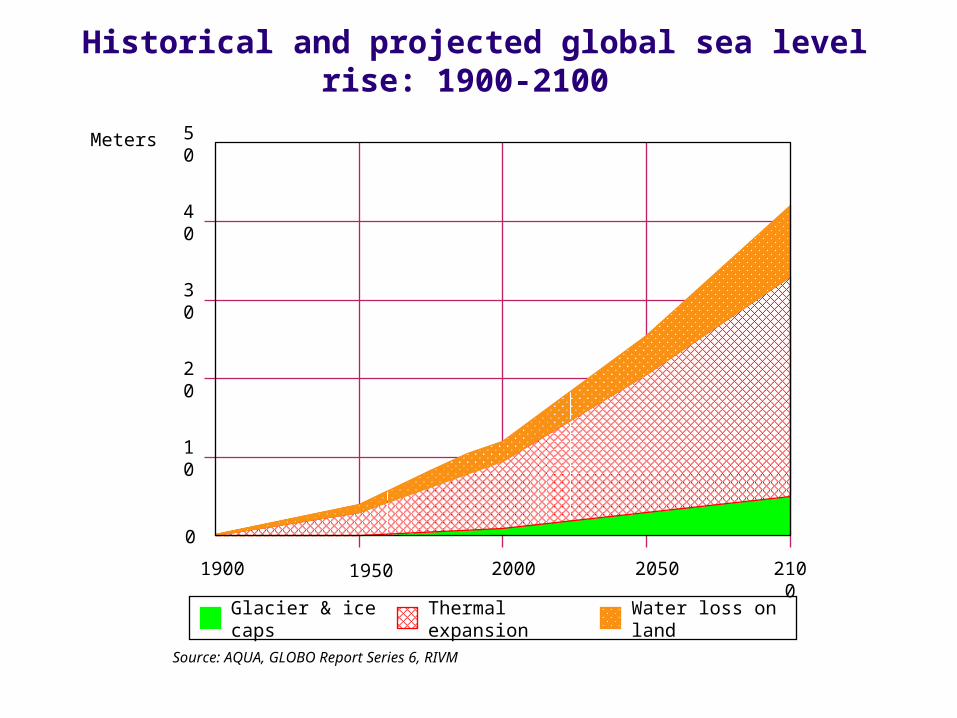
1900
Source: AQUA, GLOBO Report Series 6, RIVM
1950 2000 2050 2100
0
10
20
30
40
50
Meters
Glacier & ice caps
Thermal expansion
Water loss on land
Historical and projected global sea level rise: 1900-2100
Part 2: Energy and Peak Oil
• “Energy” is not the core problem; carbon is. Climate change is mainly due carbon dioxide build-up in the atmosphere and secondarily due to methane releases from agriculture (grazing animals), gas distribution and coal mining. There is a major “feedback” threat from thawing of perma-frost, due to warming itself. However we focus here on the near-term problem of oil and gas supply.
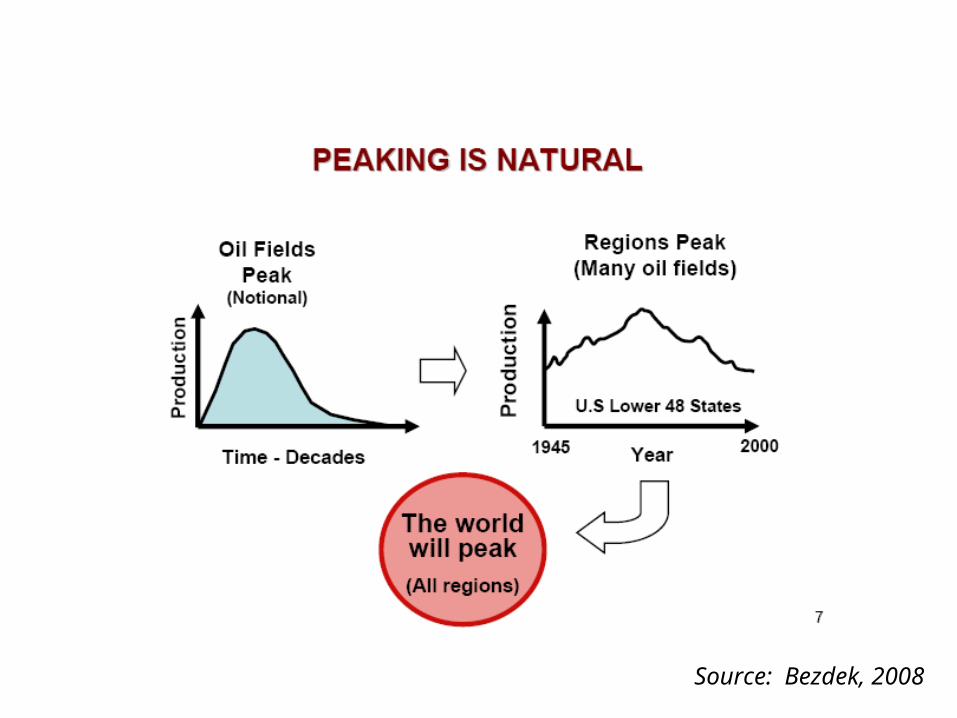
Source: Bezdek, 2008
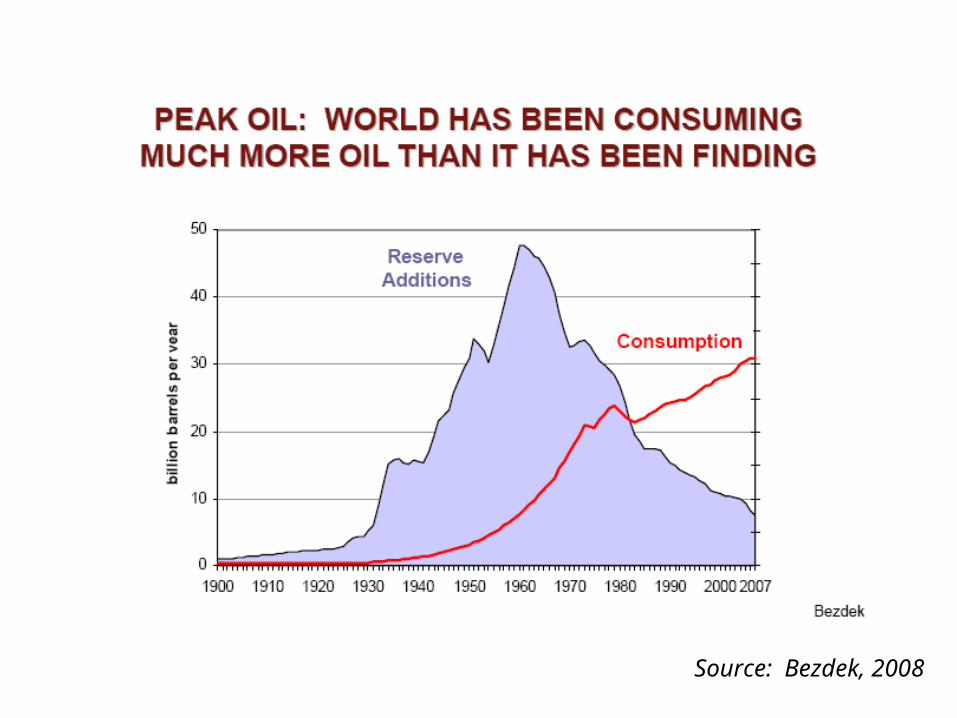
Source: Bezdek, 2008
1965 1970 1975 1980 1985 1990 1995 2000year
-30
-20
-10
0
10
20
30
40
50G
igab
arre
ls a
nn
ual
ly
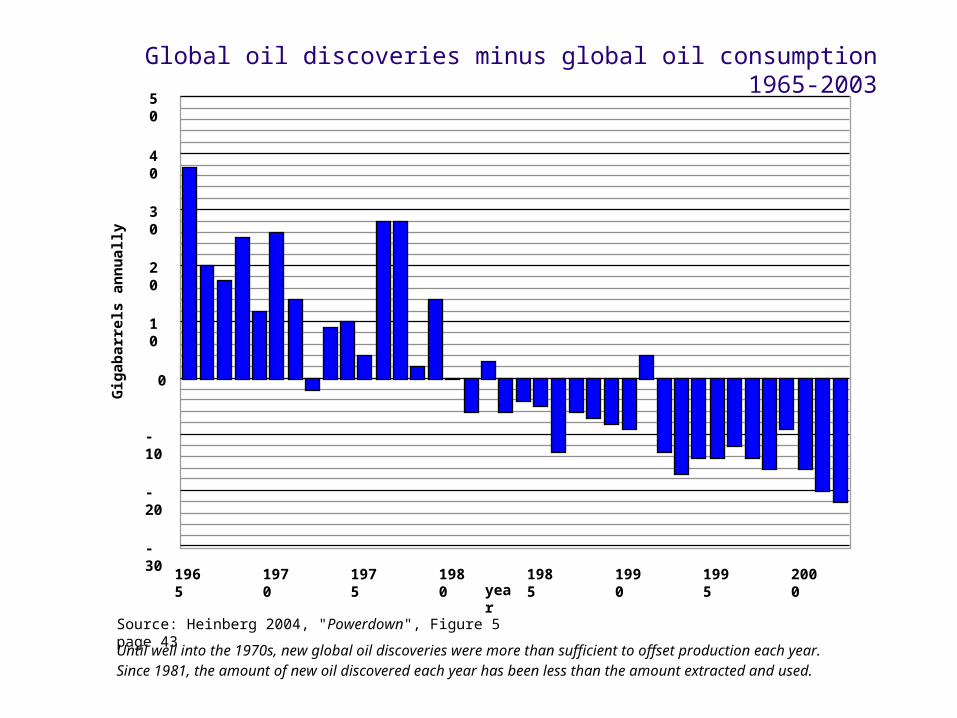
Until well into the 1970s, new global oil discoveries were more than sufficient to offset production each year.Since 1981, the amount of new oil discovered each year has been less than the amount extracted and used.
Source: Heinberg 2004, "Powerdown", Figure 5 page 43
Global oil discoveries minus global oil consumption 1965-2003
1980 1984 1988 1992 1996 2000year
0
200
400
600
800
1000
1200
1400
1600
Bil
lio
n b
arre
ls
proved reserves
proved and probable reserves
2004
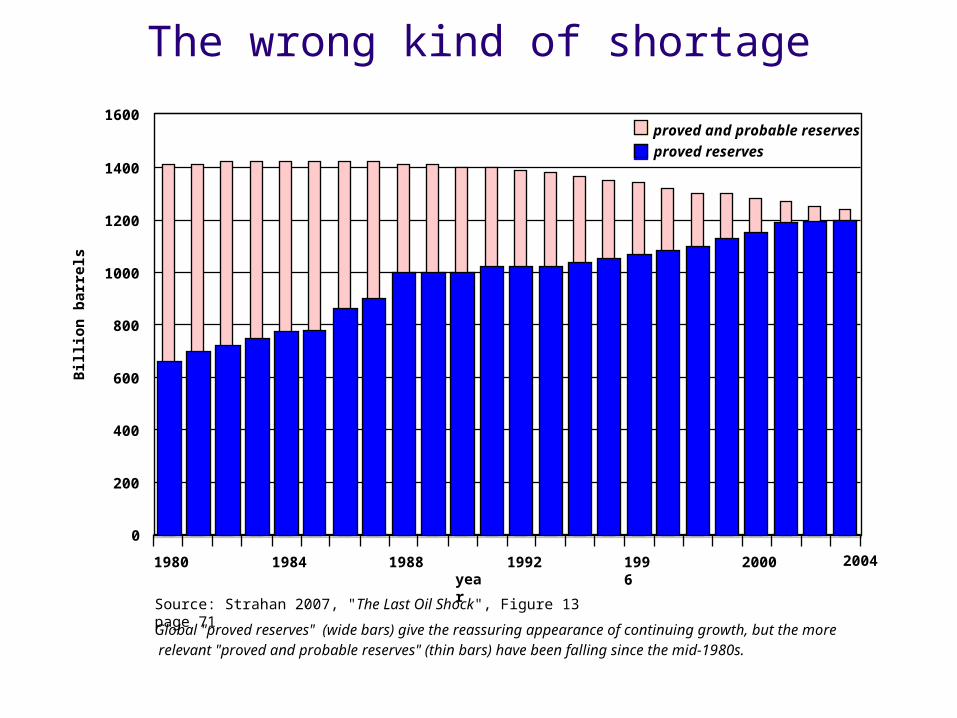
Global "proved reserves" (wide bars) give the reassuring appearance of continuing growth, but the more relevant "proved and probable reserves" (thin bars) have been falling since the mid-1980s.
Source: Strahan 2007, "The Last Oil Shock", Figure 13 page 71
The wrong kind of shortage
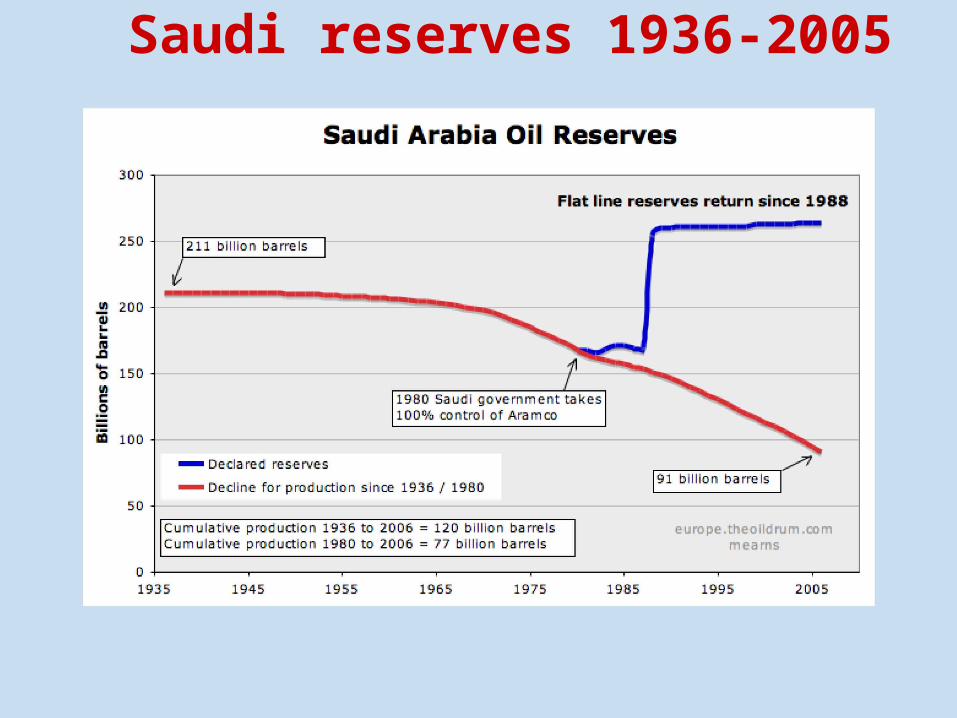
Saudi reserves 1936-2005
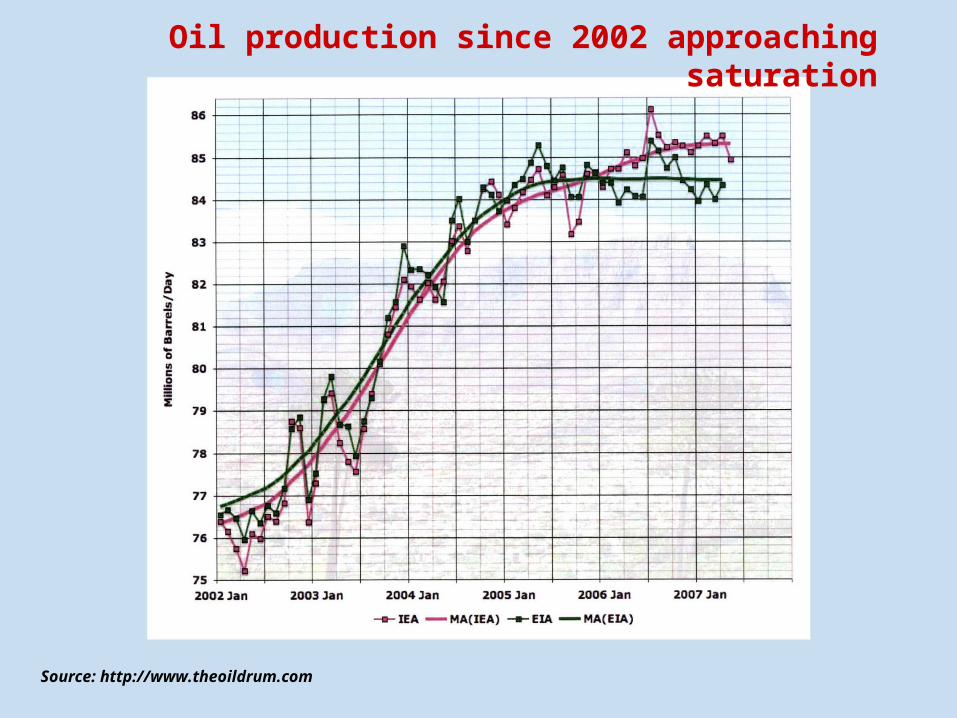
Oil production since 2002 approaching saturation
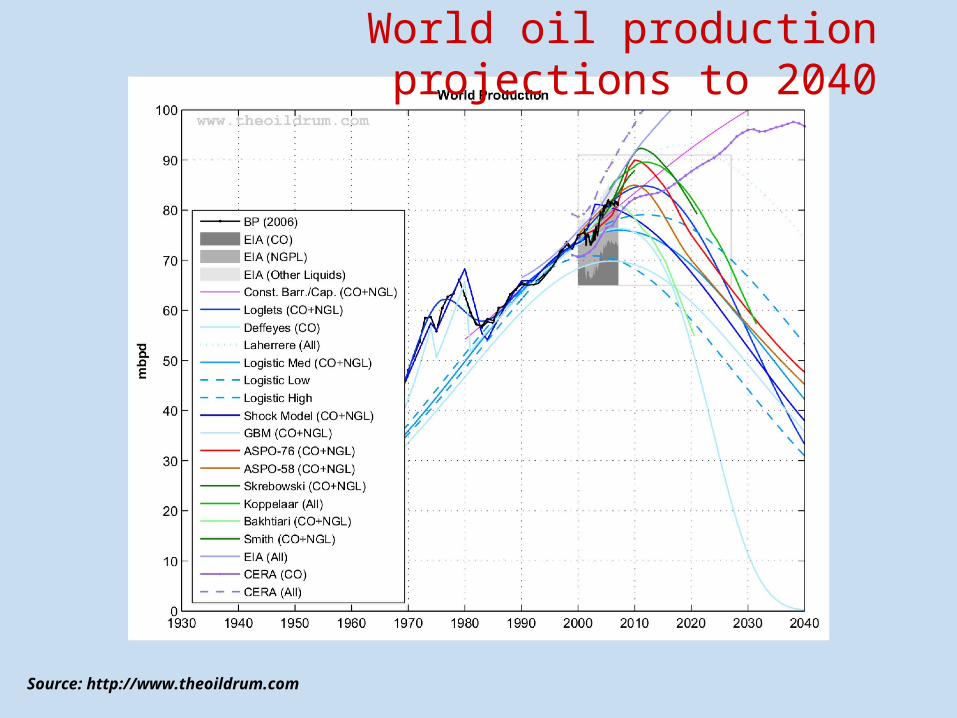
Source: http://www.theoildrum.com
Source: http://www.theoildrum.com
World oil production projections to 2040
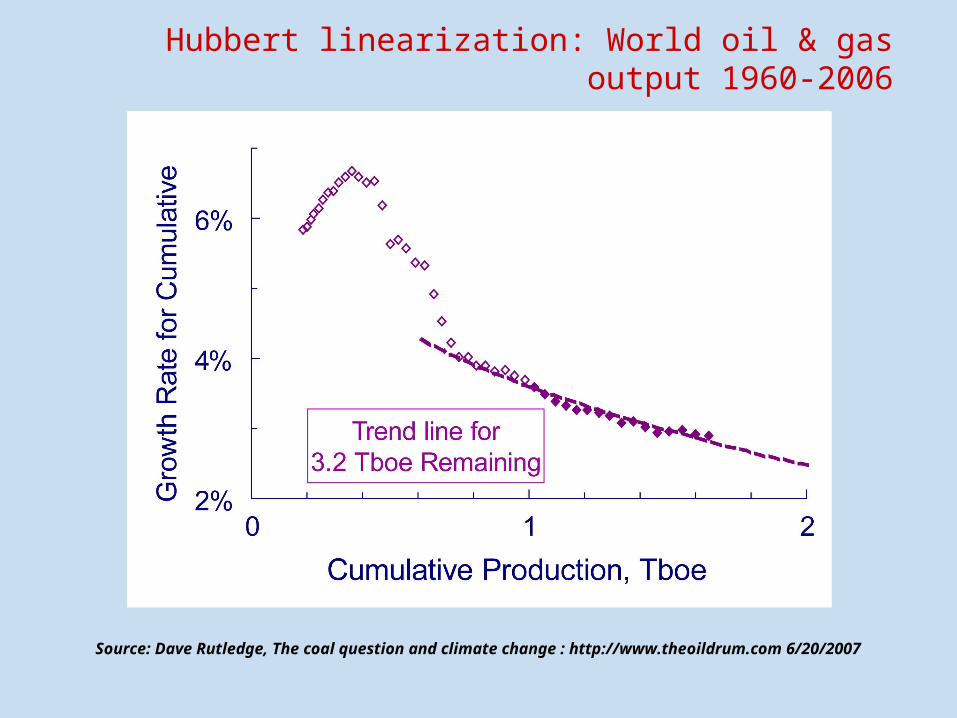
Source: Dave Rutledge, The coal question and climate change : http://www.theoildrum.com 6/20/2007
Hubbert linearization: World oil & gas output 1960-2006
Part 3: Exergy and Useful Work
• Energy is conserved, except in nuclear reactions. The energy input to a process or transformation is always equal to the energy output. This is the First Law of thermodynamics.
• However the output energy is always less available to do useful work than the input. This is the Second Law of thermodynamics, sometimes called the entropy law.
• Energy available to do useful work is exergy.
Exergy and Useful Work, Con’t
• Capital is inert. It must be activated. Most economists regard labor as the activating agent.
• Labor (by humans and/or animals) was once the only source of useful work in the economy.
• But machines (and computers) require another activating agent, namely exergy.
• The economy converts exergy into useful work
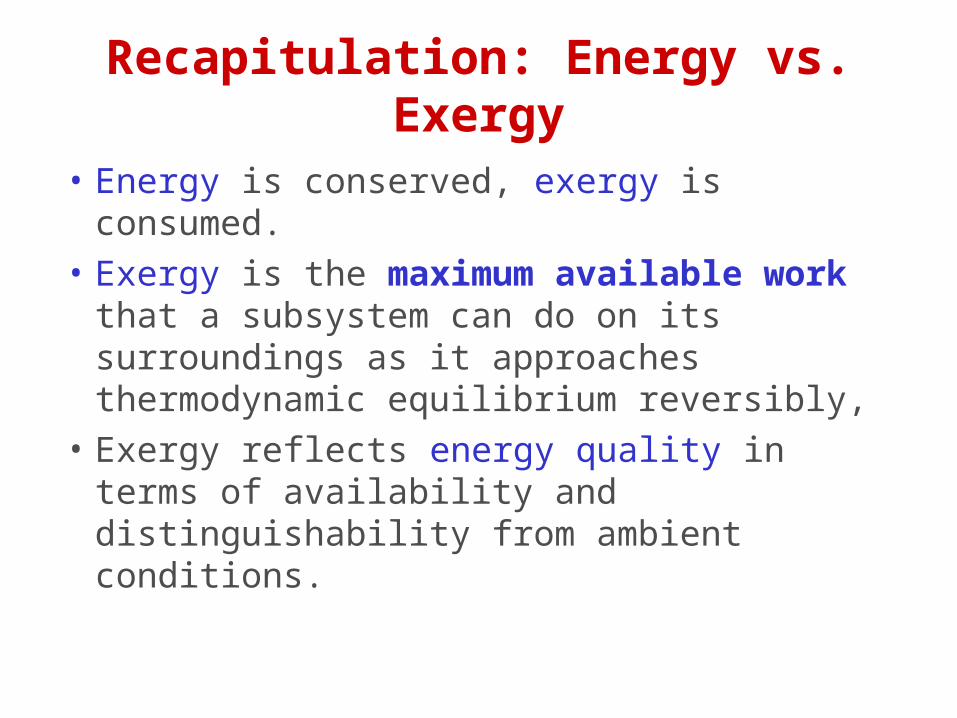
Recapitulation: Energy vs. Exergy
• Energy is conserved, exergy is consumed.• Exergy is the maximum available work
that a subsystem can do on its surroundings as it approaches thermodynamic equilibrium reversibly,
• Exergy reflects energy quality in terms of availability and distinguishability from ambient conditions.
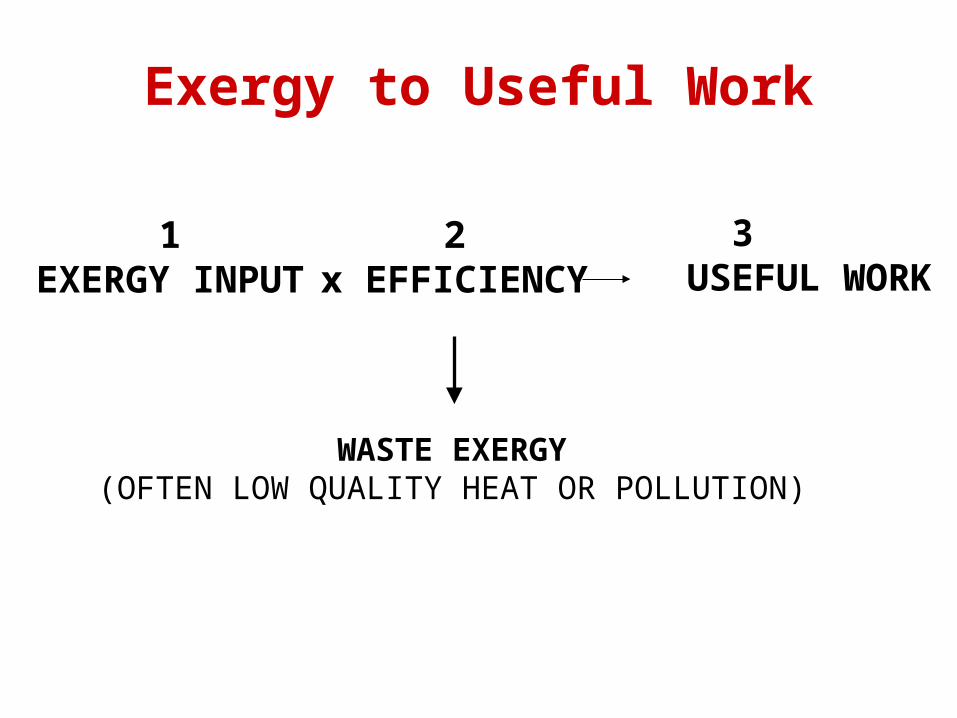
Exergy to Useful Work
WASTE EXERGY(OFTEN LOW QUALITY HEAT OR POLLUTION)
1EXERGY INPUT
2x EFFICIENCY
3 USEFUL WORK
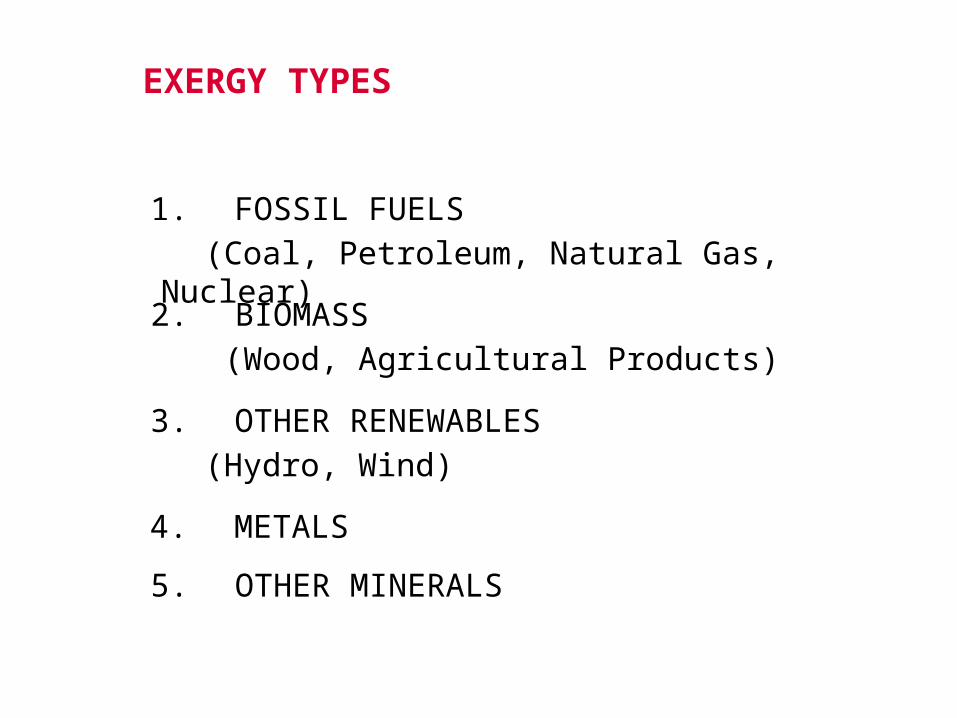
1. FOSSIL FUELS(Coal, Petroleum, Natural Gas, Nuclear)
2. BIOMASS (Wood, Agricultural Products)
3. OTHER RENEWABLES(Hydro, Wind)
4. METALS
5. OTHER MINERALS
EXERGY TYPES
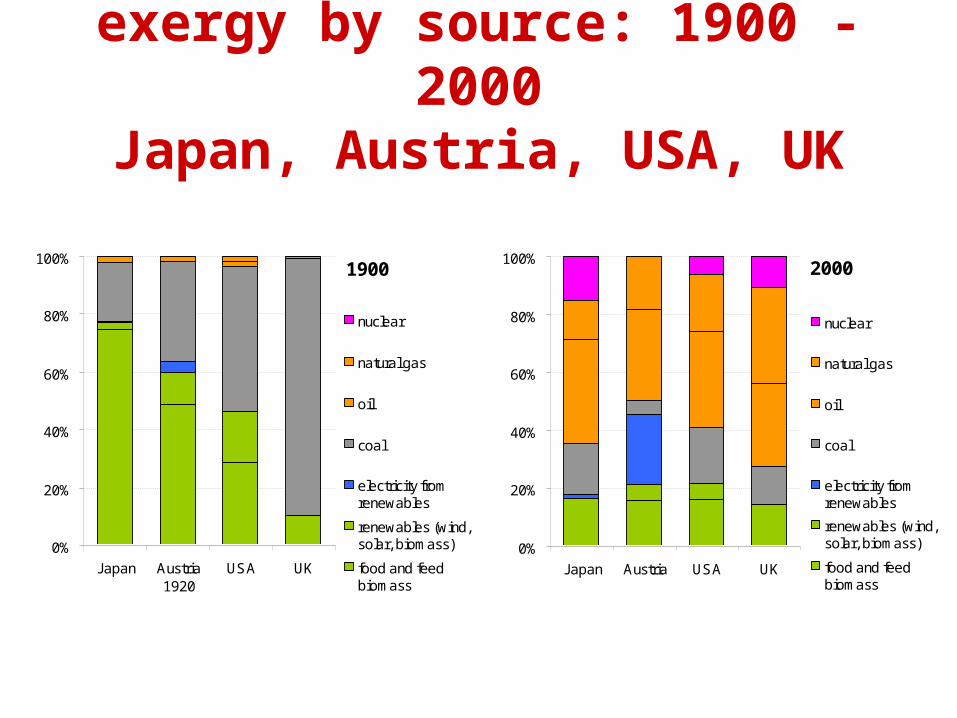
exergy by source: 1900 -2000Japan, Austria, USA, UK
1900
0%
20%
40%
60%
80%
100%
Japan Austria1920
USA UK
nuclear
natural gas
oil
coal
electricity fromrenewables
renewables (wind,solar, biomass)
food and feedbiomass
2000
0%
20%
40%
60%
80%
100%
Japan Austria USA UK
nuclear
natural gas
oil
coal
electricity fromrenewables
renewables (wind,solar, biomass)
food and feedbiomass
1900 1920 1940 1960 1980 2000
0
2
4
6
8
10
12
14
16
18
index
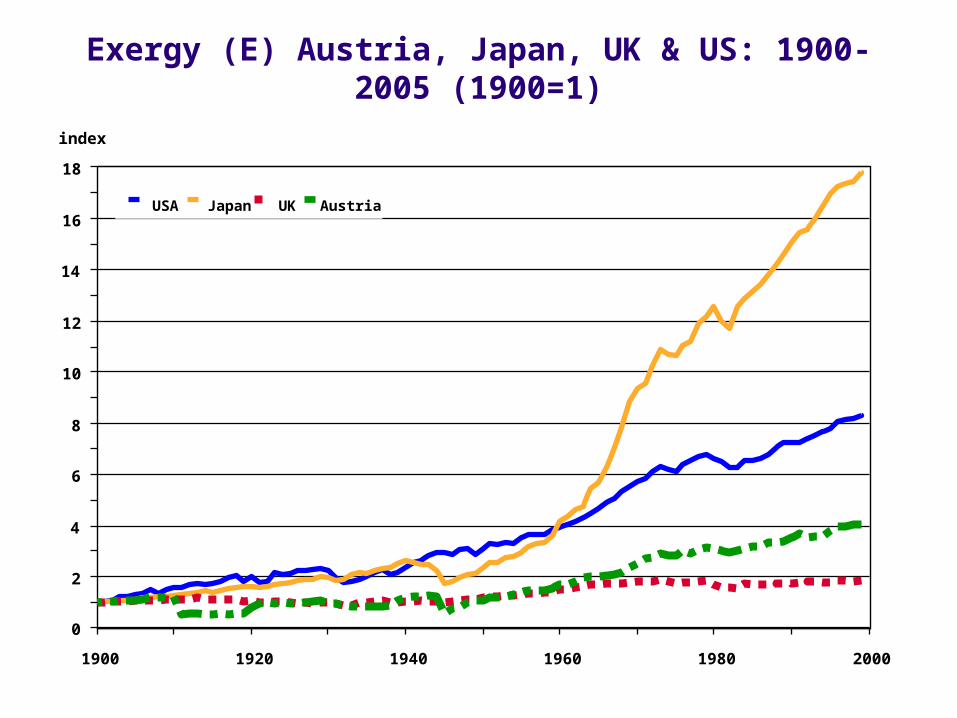
USA Japan UK Austria
Exergy (E) Austria, Japan, UK & US: 1900-2005 (1900=1)
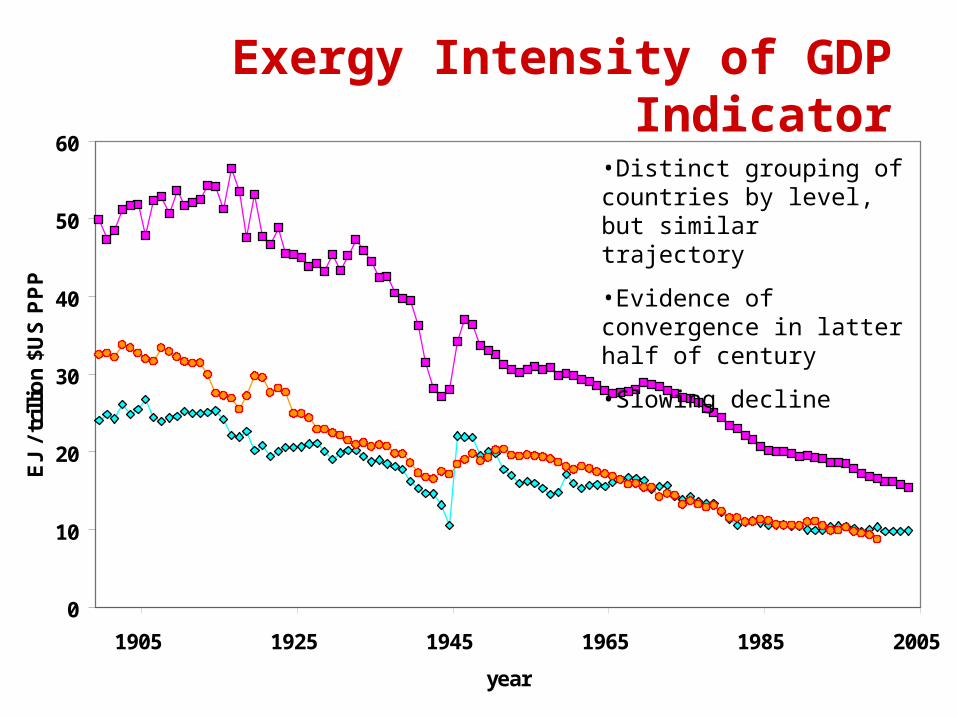
Exergy Intensity of GDP Indicator
0
10
20
30
40
50
60
200519851965194519251905
year
EJ
/ tr
illi
on
$U
S P
PP
US
UK
Japan
•Distinct grouping of countries by level, but similar trajectory
•Evidence of convergence in latter half of century
•Slowing decline
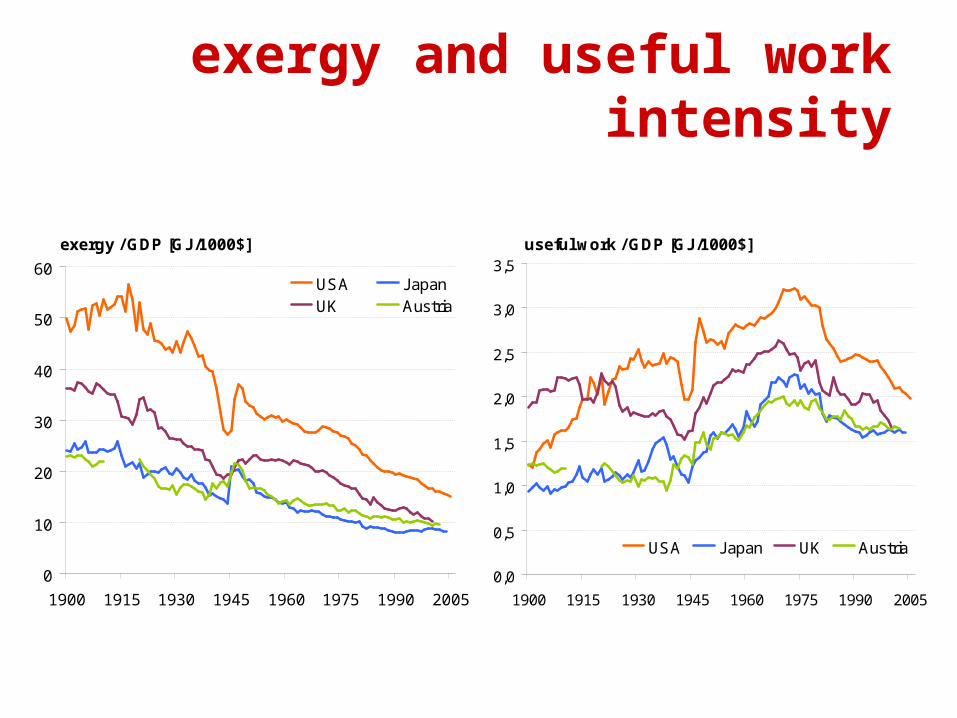
exergy and useful work intensity
exergy / GDP [GJ/1000$]
0
10
20
30
40
50
60
1900 1915 1930 1945 1960 1975 1990 2005
USA JapanUK Austria
useful work / GDP [GJ/1000$]
0,0
0,5
1,0
1,5
2,0
2,5
3,0
3,5
1900 1915 1930 1945 1960 1975 1990 2005
USA Japan UK Austria
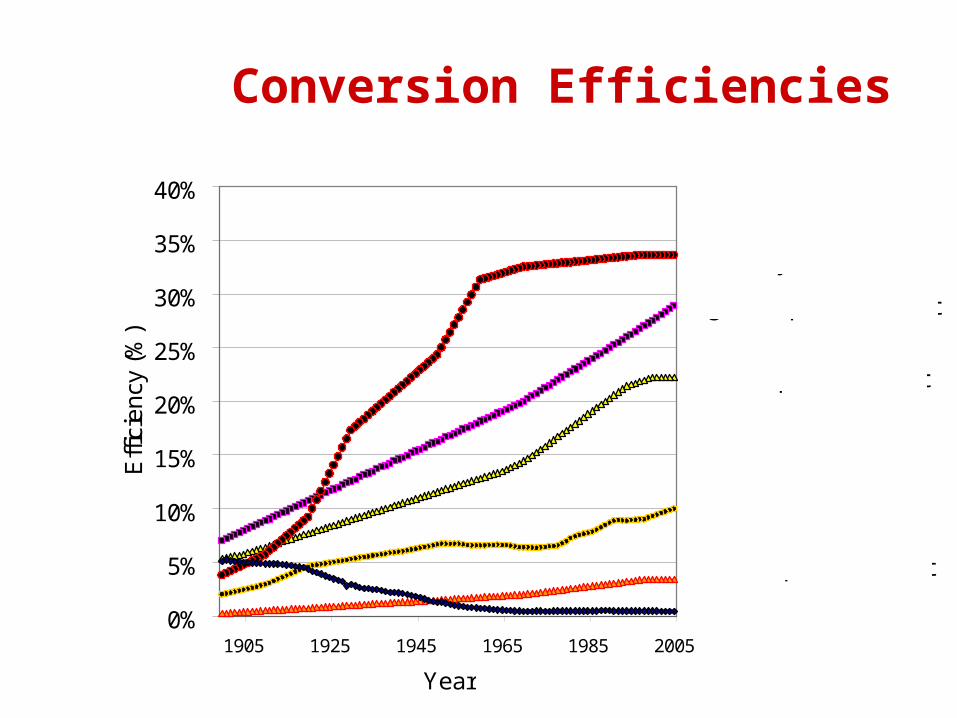
Conversion Efficiencies
0%
5%
10%
15%
20%
25%
30%
35%
40%
200519851965194519251905
Year
Eff
icie
ncy
(%
)
Electricity Generation
High Temperature Heat
Mid Temperature Heat
Mechanical Work
Low Temperature Heat
Muscle Work
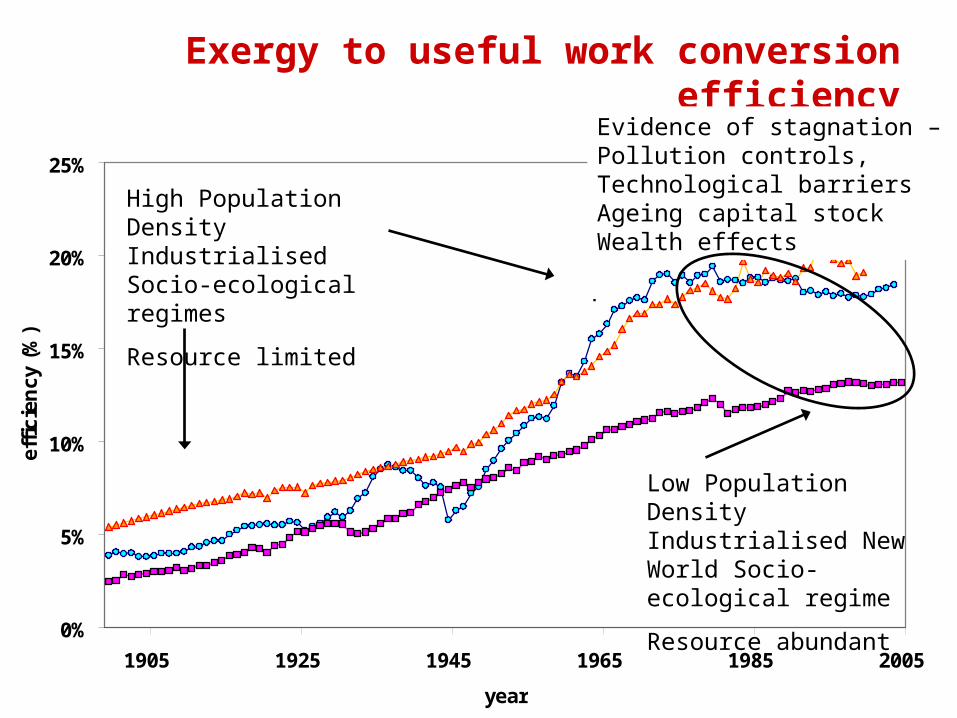
Exergy to useful work conversion efficiency
0%
5%
10%
15%
20%
25%
200519851965194519251905
year
eff
icie
nc
y (
%)
US
Japan
UK
High Population Density Industrialised Socio-ecological regimes
Resource limited
Low Population Density Industrialised New World Socio-ecological regime
Resource abundant
Evidence of stagnation – Pollution controls, Technological barriersAgeing capital stockWealth effects
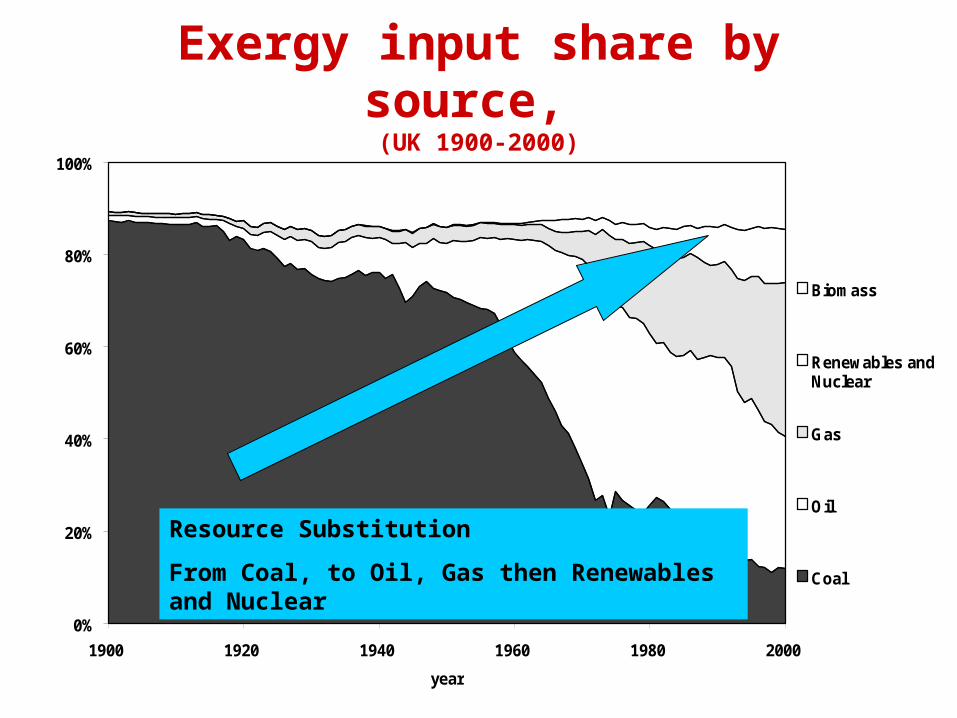
Exergy input share by source, (UK 1900-2000)
0%
20%
40%
60%
80%
100%
1900 1920 1940 1960 1980 2000
year
Biomass
Renewables andNuclear
Gas
Oil
Coal
Resource Substitution
From Coal, to Oil, Gas then Renewables and Nuclear
Useful work types• .
– Electricity– Mechanical drive (mostly transport)– Heat (high, mid and low temperature)– Light– Muscle Work
• N.B.Available work (exergy) and ‘useful’ work are not equal, the latter depends on the exergy efficiency of the conversion process for a given task. Efficiency = useful work / available work.
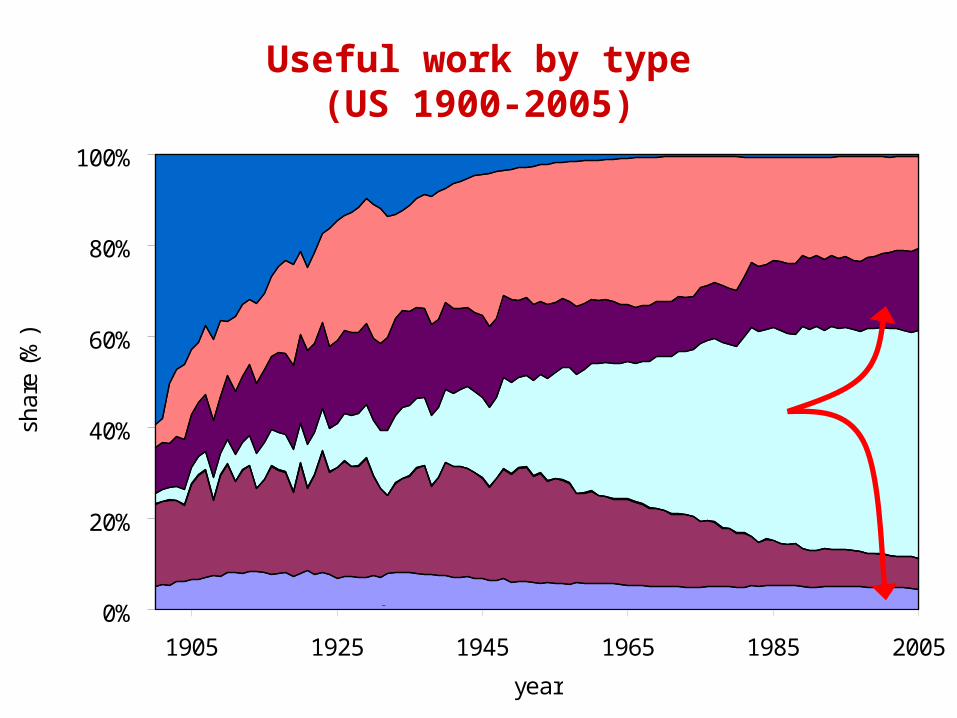
Useful work by type(US 1900-2005)
0%
20%
40%
60%
80%
100%
200519851965194519251905
year
sha
re (
%)
Muscle WorkNon-Fuel
Mechanical Work
Electricity
High Temperature Heat
Low Temperature Heat
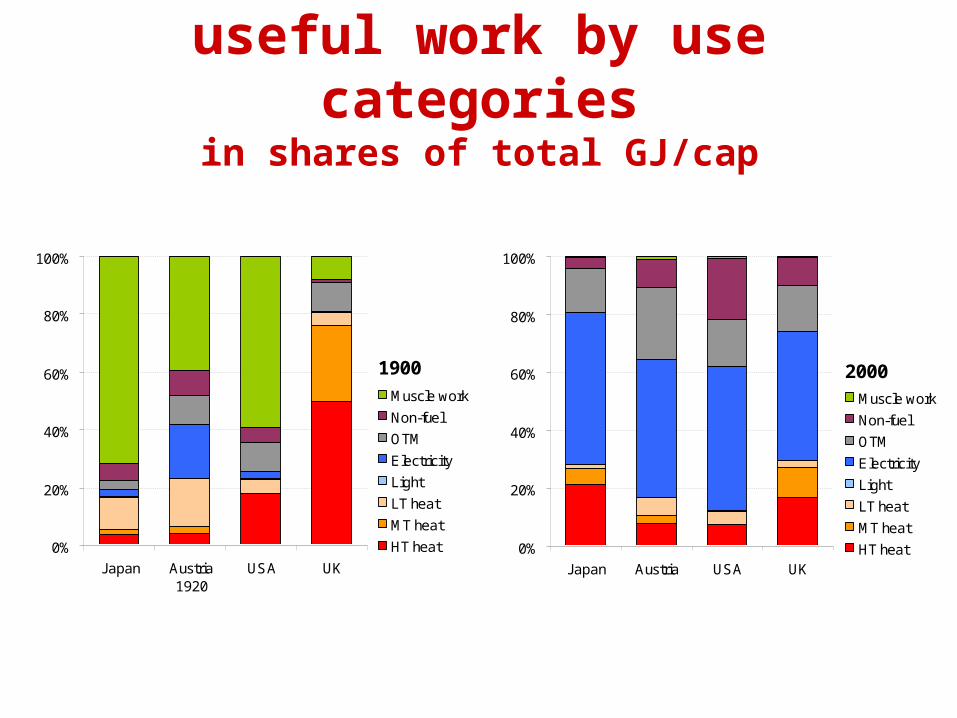
useful work by use categoriesin shares of total GJ/cap
1900
0%
20%
40%
60%
80%
100%
Japan Austria1920
USA UK
Muscle work
Non-fuel
OTM
Electricity
Light
LT heat
MT heat
HT heat
2000
0%
20%
40%
60%
80%
100%
Japan Austria USA UK
Muscle work
Non-fuel
OTM
Electricity
Light
LT heat
MT heat
HT heat
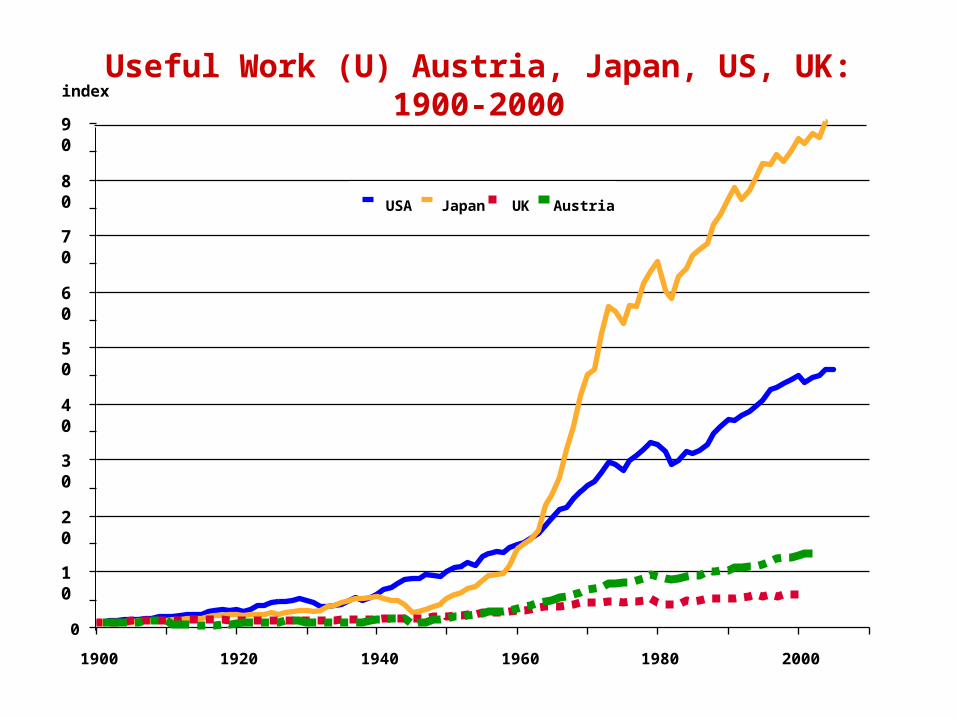
1900 1920 1940 1960 1980 2000
0
index
10
20
30
40
50
60
70
80
90
USA Japan UK Austria
Useful Work (U) Austria, Japan, US, UK:1900-2000
USA
0
5
10
15
20
25
30
35
19
00
19
10
19
20
19
30
19
40
19
50
19
60
19
70
19
80
19
90
20
00
Japan
0
5
10
15
20
25
30
35
19
00
19
10
19
20
19
30
19
40
19
50
19
60
19
70
19
80
19
90
20
00
Austria
0
5
10
15
20
25
30
35
19
00
19
10
19
20
19
30
19
40
19
50
19
60
19
70
19
80
19
90
20
00
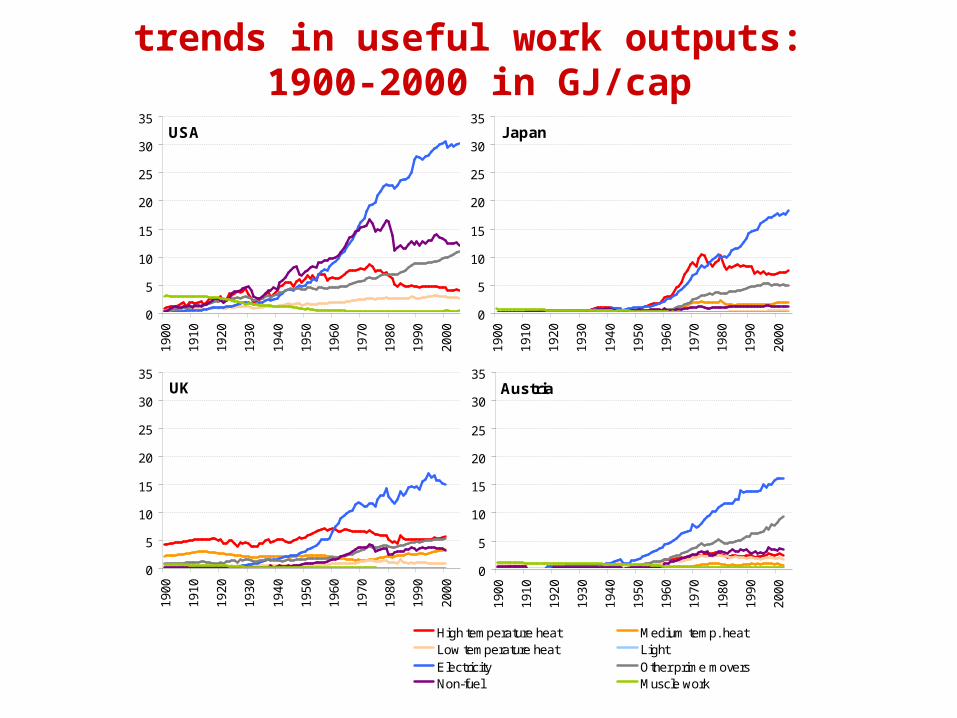
High temperature heat Medium temp. heatLow temperature heat LightElectricity Other prime moversNon-fuel Muscle work
UK
0
5
10
15
20
25
30
35
19
00
19
10
19
20
19
30
19
40
19
50
19
60
19
70
19
80
19
90
20
00
trends in useful work outputs: 1900-2000 in GJ/cap
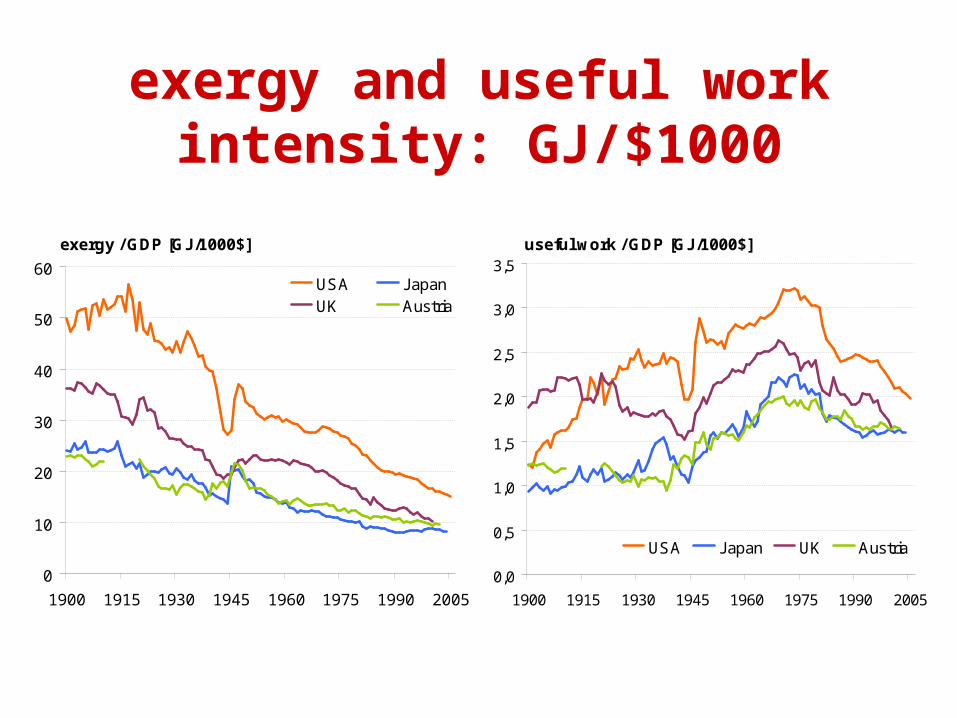
exergy and useful work intensity: GJ/$1000
exergy / GDP [GJ/1000$]
0
10
20
30
40
50
60
1900 1915 1930 1945 1960 1975 1990 2005
USA JapanUK Austria
useful work / GDP [GJ/1000$]
0,0
0,5
1,0
1,5
2,0
2,5
3,0
3,5
1900 1915 1930 1945 1960 1975 1990 2005
USA Japan UK Austria
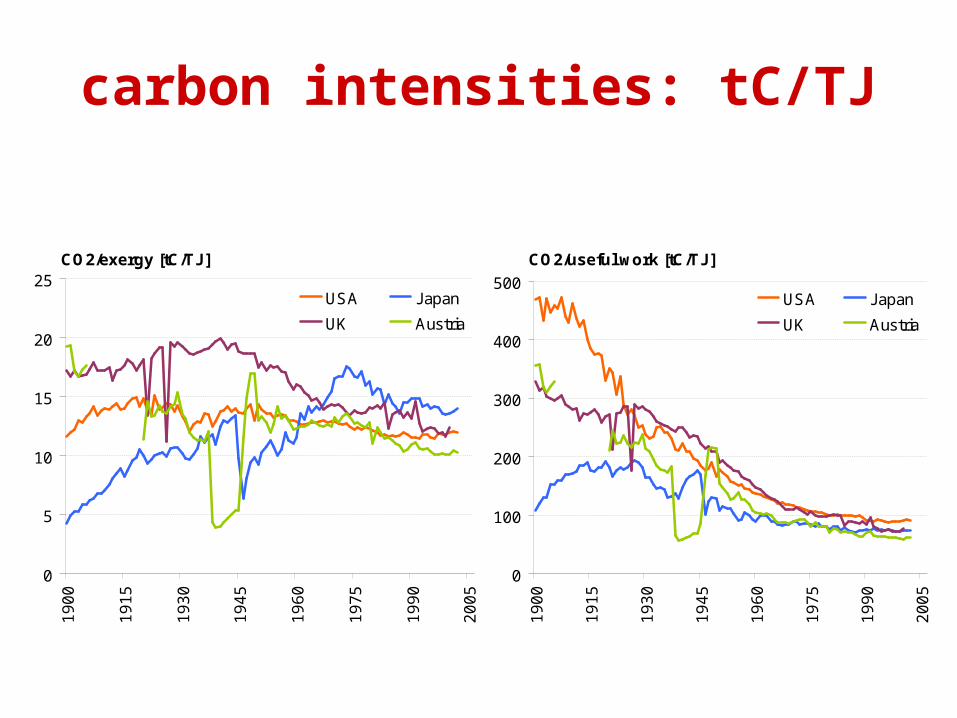
carbon intensities: tC/TJ
CO2/exergy [tC/TJ]
0
5
10
15
20
25
19
00
19
15
19
30
19
45
19
60
19
75
19
90
20
05
USA Japan
UK Austria
CO2/useful work [tC/TJ]
0
100
200
300
400
500
19
00
19
15
19
30
19
45
19
60
19
75
19
90
20
05
USA Japan
UK Austria
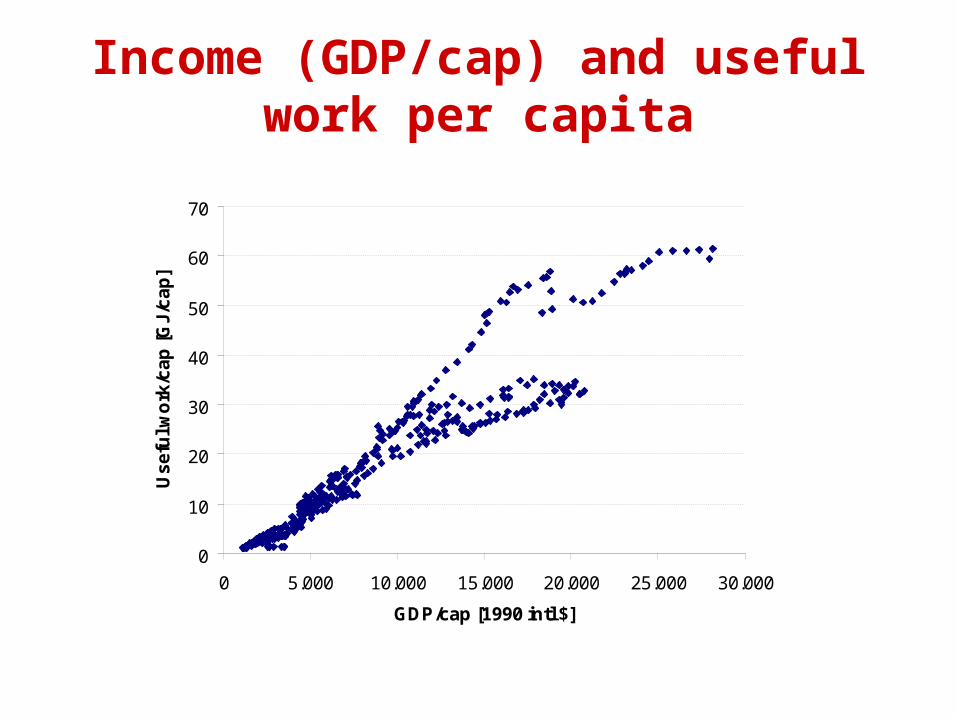
Income (GDP/cap) and useful work per capita
0
10
20
30
40
50
60
70
0 5.000 10.000 15.000 20.000 25.000 30.000
GDP/cap [1990 intl $]
Us
efu
l wo
rk/c
ap
[G
J/c
ap
]
Part 4: Useful Work and Economic Growth
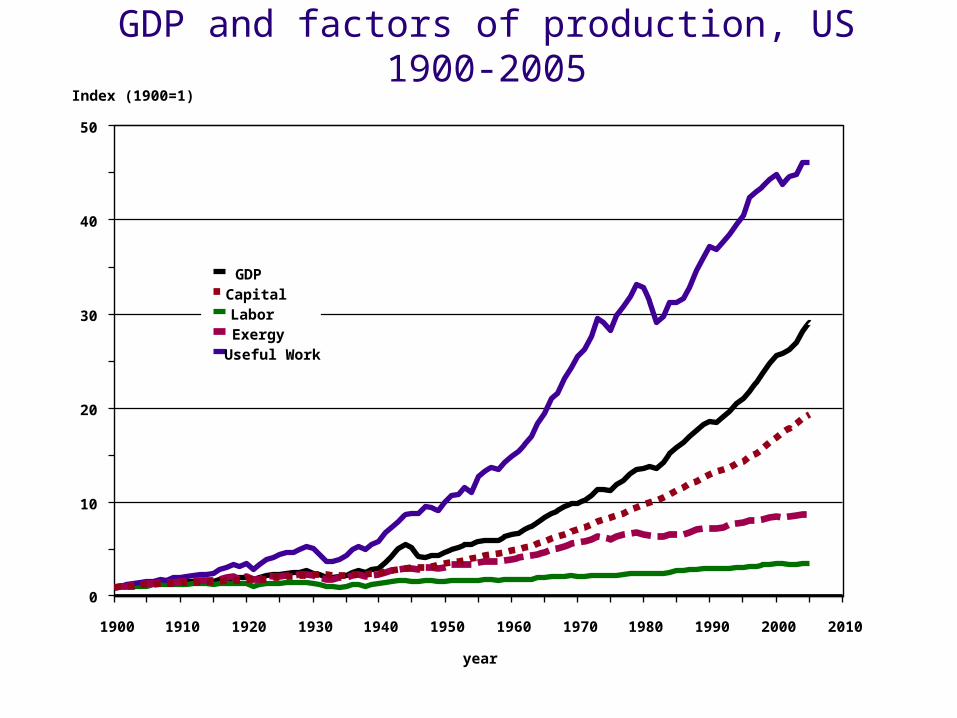
• Since the first industrial revolution, human and animal labor have been increasingly replaced by machines powered by the combustion of fossil fuels. This strongly suggests that exergy or useful work should be factors of prody=uction, along with conventional capital and labor.
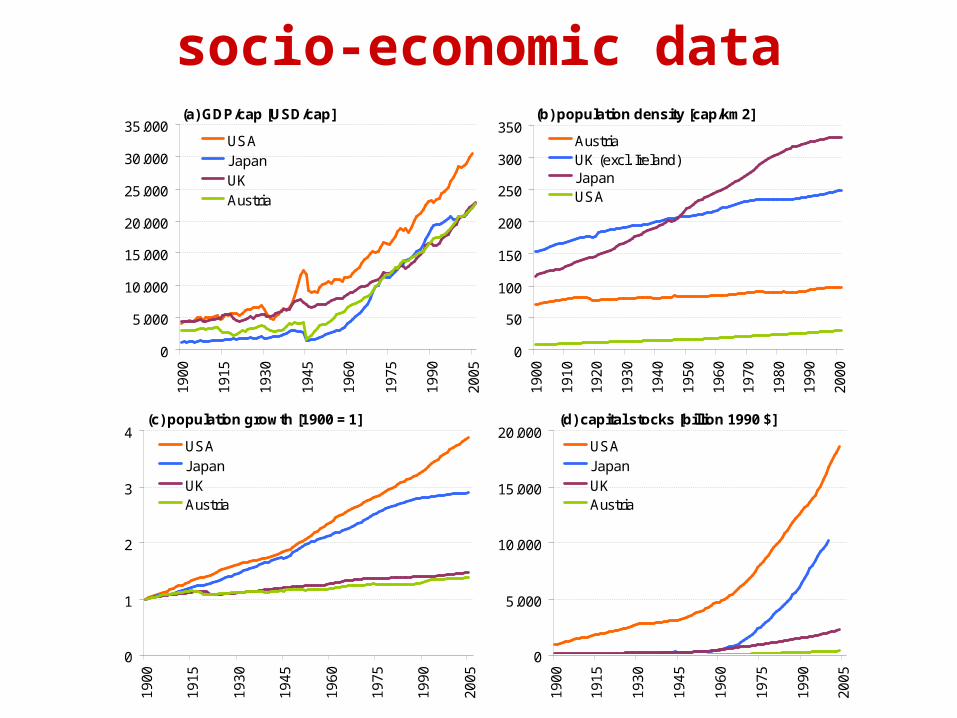
socio-economic data(a) GDP/cap [USD/cap]
0
5.000
10.000
15.000
20.000
25.000
30.000
35.000
19
00
19
15
19
30
19
45
19
60
19
75
19
90
20
05
USAJapanUKAustria
(b) population density [cap/km2]
0
50
100
150
200
250
300
350
19
00
19
10
19
20
19
30
19
40
19
50
19
60
19
70
19
80
19
90
20
00
AustriaUK (excl. Ireland)JapanUSA
(c) population growth [1900 = 1]
0
1
2
3
4
19
00
19
15
19
30
19
45
19
60
19
75
19
90
20
05
USAJapanUKAustria
(d) capital stocks [billion 1990 $]
0
5.000
10.000
15.000
20.000
19
00
19
15
19
30
19
45
19
60
19
75
19
90
20
05
USAJapanUKAustria
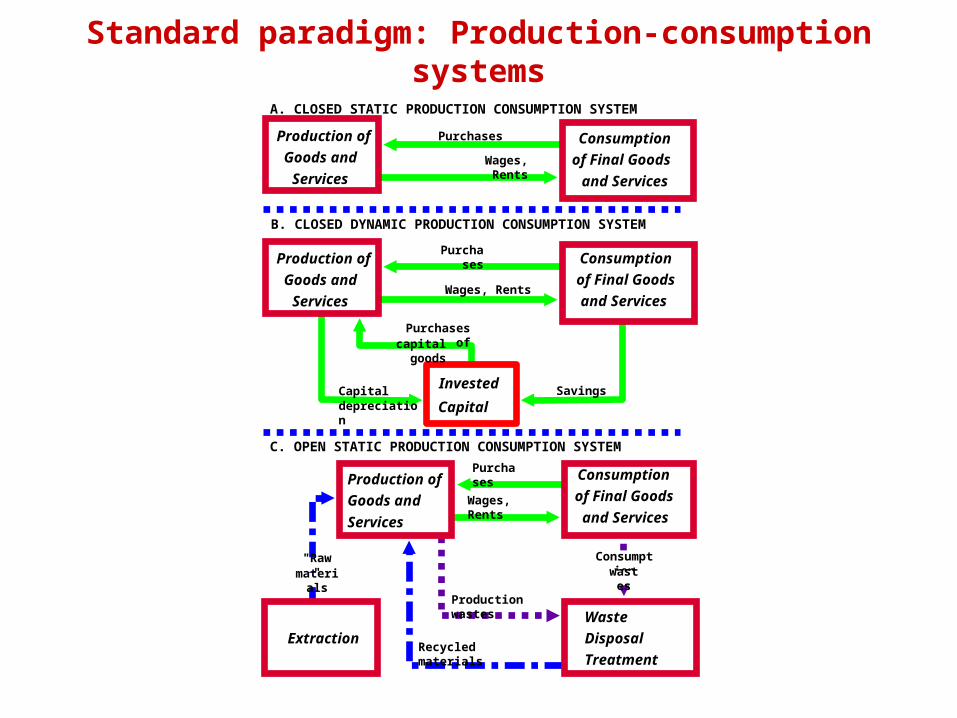
A. CLOSED STATIC PRODUCTION CONSUMPTION SYSTEM
Production ofGoods
andServices
Consumptionof Final
Goodsand Services
Purchases
Wages, Rents
Production ofGoods
andServices
InvestedCapita
l
Purchases
Wages, Rents
Savings
Purchases ofcapital
goods
Capitaldepreciation
Purchases
Wages, Rents
Production ofGoods and
Services
Waste
DisposalTreatment
Extraction
Consumptionwastes
"Raw"materi
alsProduction wastes
Recycled materials
B. CLOSED DYNAMIC PRODUCTION CONSUMPTION SYSTEM
C. OPEN STATIC PRODUCTION CONSUMPTION SYSTEM
Consumptionof Final
Goodsand Services
Consumptionof Final
Goodsand Services
Standard paradigm: Production-consumption systems
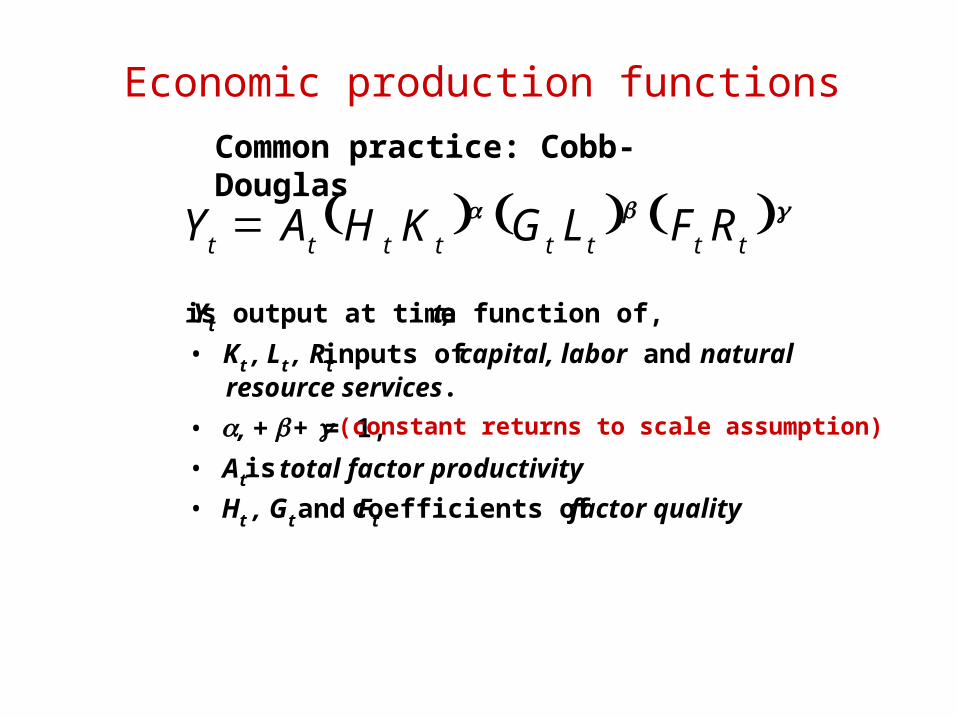
Common practice: Cobb-Douglas
Yt is output at time t, a function of,
• Kt , Lt , Rt inputs of capital, labor and natural resource services.
• , + + = 1, (constant returns to scale assumption)
• At is total factor productivity
• Ht , Gt and Ft coefficients of factor quality
tttttttt RFLGKHAY
Economic production functions
1900 1910 1920 1930 1940 1950 1960 1970 1980 1990 2000 2010
year
0
10
20
30
40
50
Index (1900=1)
GDPCapitalLaborExergy
Useful Work
GDP and factors of production, US 1900-2005
GDP Index (1900=1)
1900 1920 1940 1960 1980 2000year
5
10
15
20
25
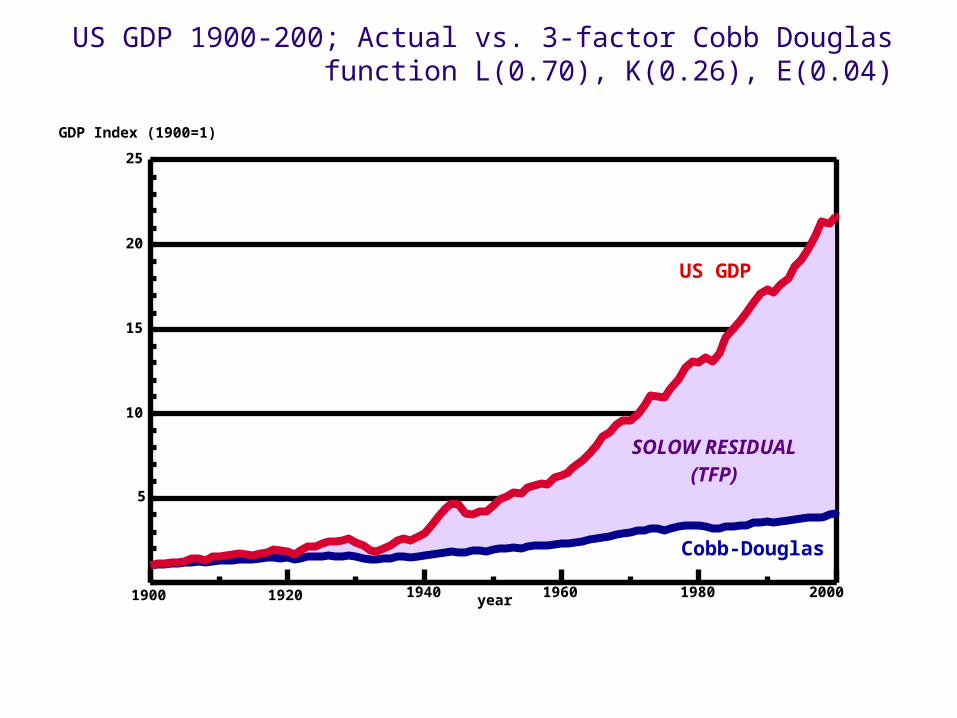
US GDP
Cobb-Douglas
SOLOW RESIDUAL(TFP)
US GDP 1900-200; Actual vs. 3-factor Cobb Douglas function L(0.70), K(0.26), E(0.04)
1900 1910 1920 1930 1940 1950 1960 1970 1980 1990 2000 2010
year
1
1.5
2
2.5
3
3.5
4
4.5
5
5.5
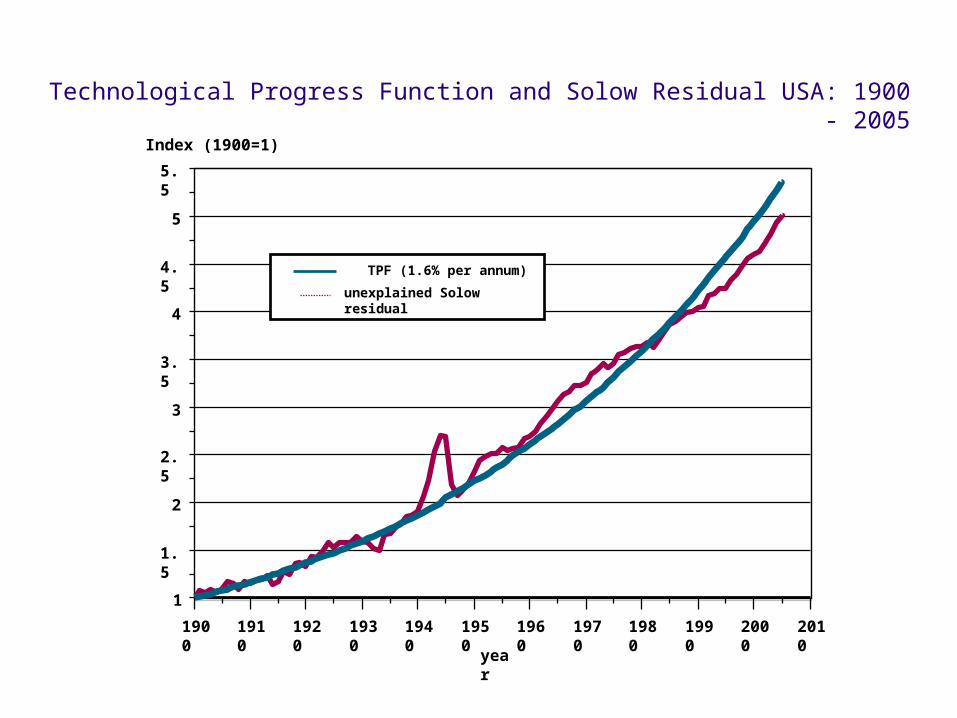
unexplained Solow residual
TPF (1.6% per annum)
Index (1900=1)
Technological Progress Function and Solow Residual USA: 1900 - 2005
Problems with growth theory• Money makes money grow. No link to the
physical economy, only capital and labour are productive.– Energy, materials and wastes are ignored.
• Unable to explain historic growth rates.• Exogenous unexplained technological progress
is assumed, hence growth will continue.• Endogenous growth theory based on ‘Human
knowledge capital’ is unquantifiable – there are no metrics, other than R&D inputs.
The evolutionary paradigm
• The economy is an open multi-sector materials / energy / information processing system in disequilibrium.
• Sequences of value-added stages, beginning with extraction and ending with consumption and disposal of material and energy wastes.
• Spillovers from radical innovation, particularly in the field of energy conversion technology have been among the most potent drivers of growth and structural change.
• Economies of scale, learning by doing, factor substitution positive feedback, declining costs/prices, increased demand and growth.
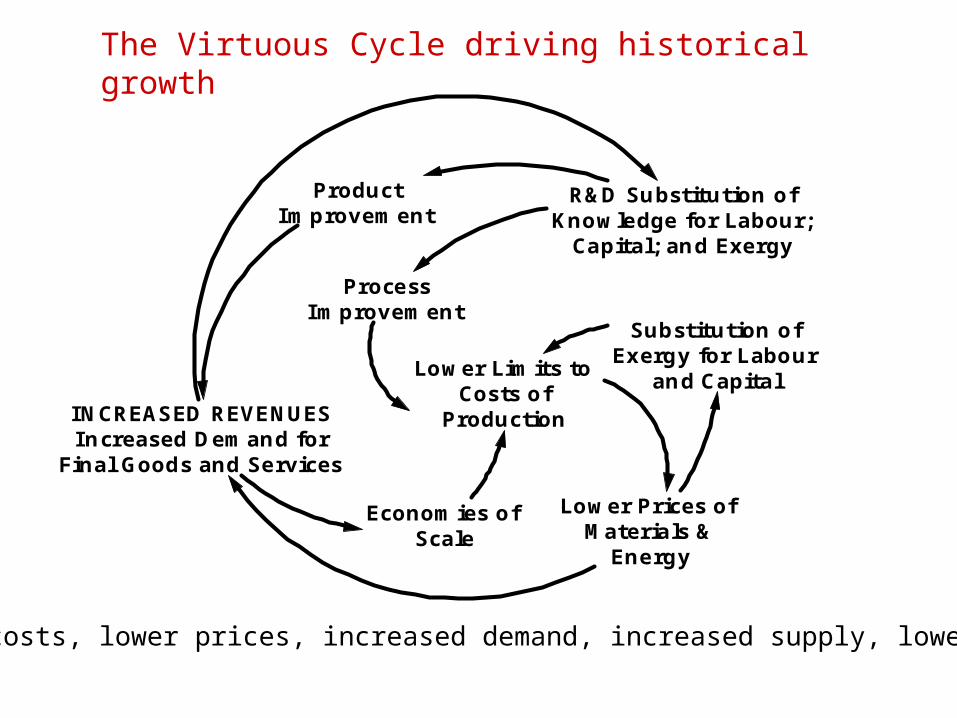
The Virtuous Cycle driving historical growth
Lower Prices ofMaterials &
Energy
INCREASED REVENUESIncreased Demand for
Final Goods and Services
R&D Substitution ofKnowledge for Labour;
Capital; and Exergy
ProductImprovement
Substitution ofExergy for Labour
and Capital
ProcessImprovement
Lower Limits toCosts of
Production
Economies ofScale
Lower costs, lower prices, increased demand, increased supply, lower costs
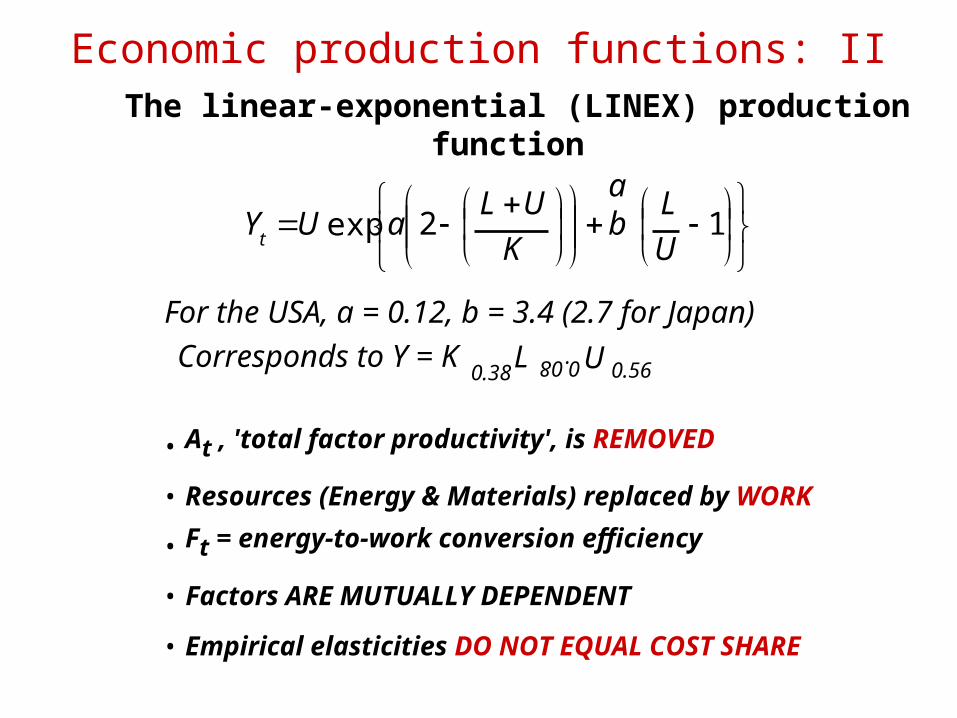
For the USA, a = 0.12, b = 3.4 (2.7 for Japan)
Corresponds to Y = K0.38
L 0.08 U 0.56
• At , 'total factor productivity', is REMOVED
• Resources (Energy & Materials) replaced by WORK
• Ft = energy-to-work conversion efficiency
• Factors ARE MUTUALLY DEPENDENT
• Empirical elasticities DO NOT EQUAL COST SHARE
The linear-exponential (LINEX) production function
12expU
Lab
K
ULaUY
t
Economic production functions: II
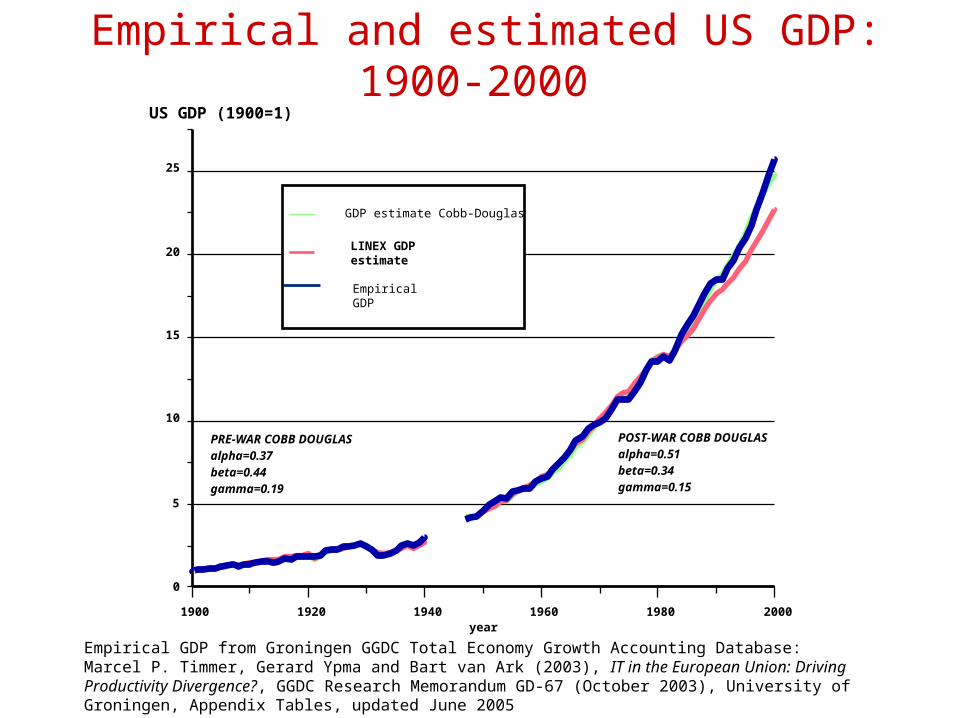
1900 1920 1940 1960 1980 2000year
0
5
10
15
20
25
PRE-WAR COBB DOUGLASalpha=0.37beta=0.44gamma=0.19
POST-WAR COBB DOUGLASalpha=0.51beta=0.34gamma=0.15
LINEX GDP estimate
US GDP (1900=1)
Empirical GDP from Groningen GGDC Total Economy Growth Accounting Database: Marcel P. Timmer, Gerard Ypma and Bart van Ark (2003), IT in the European Union: Driving Productivity Divergence?, GGDC Research Memorandum GD-67 (October 2003), University of Groningen, Appendix Tables, updated June 2005
Empirical and estimated US GDP: 1900-2000
Empirical GDP
GDP estimate Cobb-Douglas
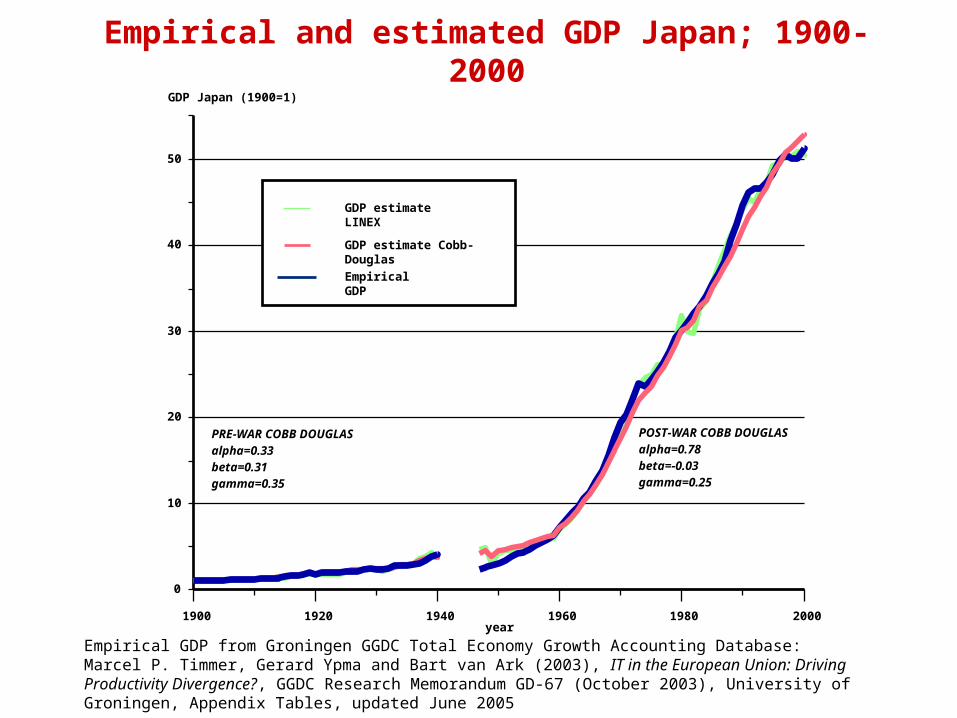
1900 1920 1940 1960 1980 2000year
0
10
20
30
40
50
PRE-WAR COBB DOUGLASalpha=0.33beta=0.31gamma=0.35
POST-WAR COBB DOUGLASalpha=0.78beta=-0.03gamma=0.25
GDP estimate LINEX
GDP estimate Cobb-Douglas
Empirical GDP
GDP Japan (1900=1)
Empirical GDP from Groningen GGDC Total Economy Growth Accounting Database: Marcel P. Timmer, Gerard Ypma and Bart van Ark (2003), IT in the European Union: Driving Productivity Divergence?, GGDC Research Memorandum GD-67 (October 2003), University of Groningen, Appendix Tables, updated June 2005
Empirical and estimated GDP Japan; 1900-2000
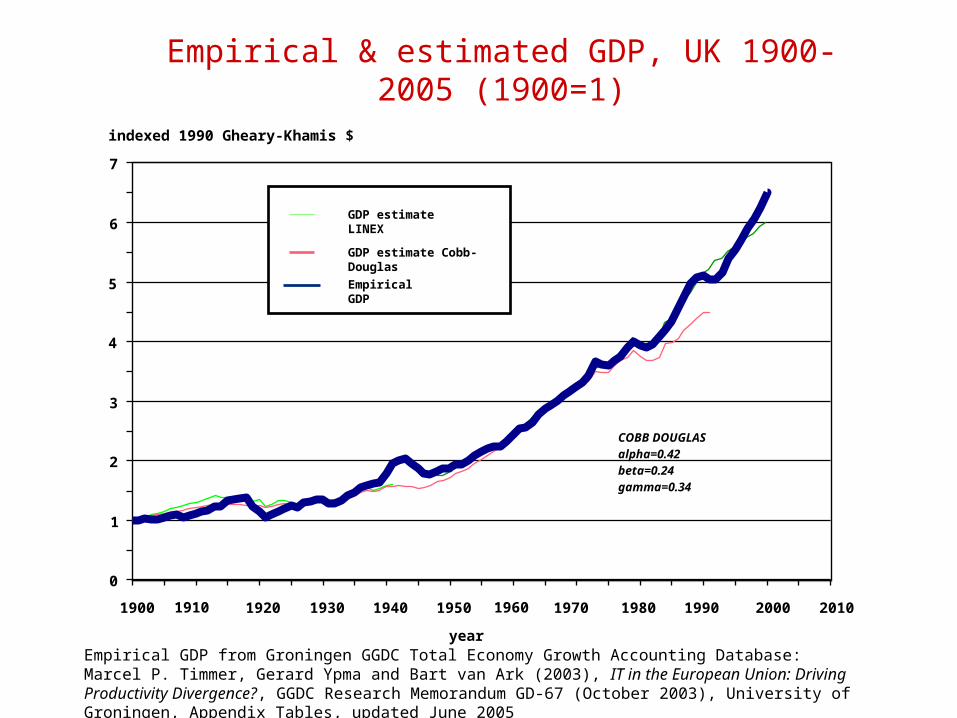
1900 1910 1920 1930 1940 1950 1960 1970 1980 1990 2000 2010
year
0
1
2
3
4
5
6
7
indexed 1990 Gheary-Khamis $
COBB DOUGLASalpha=0.42beta=0.24gamma=0.34
GDP estimate LINEX
GDP estimate Cobb-Douglas
Empirical GDP
Empirical GDP from Groningen GGDC Total Economy Growth Accounting Database: Marcel P. Timmer, Gerard Ypma and Bart van Ark (2003), IT in the European Union: Driving Productivity Divergence?, GGDC Research Memorandum GD-67 (October 2003), University of Groningen, Appendix Tables, updated June 2005
Empirical & estimated GDP, UK 1900-2005 (1900=1)
0
1
2
3
4
5
6
7
indexed 1990 Gheary-Khamis $
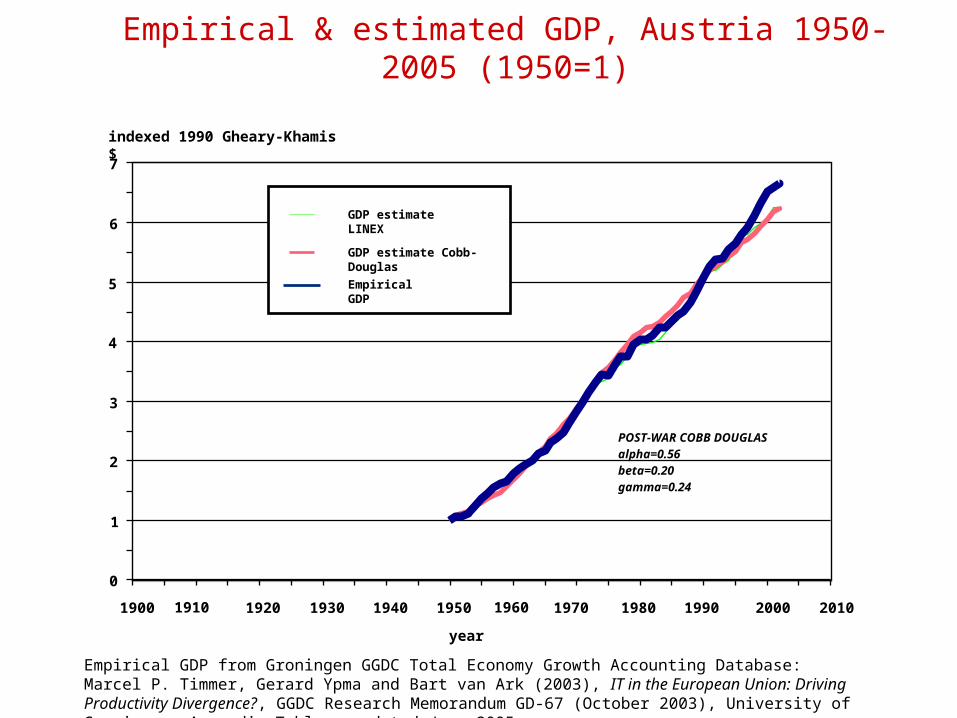
POST-WAR COBB DOUGLASalpha=0.56beta=0.20gamma=0.24
GDP estimate LINEX
GDP estimate Cobb-Douglas
Empirical GDP
Empirical GDP from Groningen GGDC Total Economy Growth Accounting Database: Marcel P. Timmer, Gerard Ypma and Bart van Ark (2003), IT in the European Union: Driving Productivity Divergence?, GGDC Research Memorandum GD-67 (October 2003), University of Groningen, Appendix Tables, updated June 2005
Empirical & estimated GDP, Austria 1950-2005 (1950=1)
1900 1910 1920 1930 1940 1950 1960 1970 1980 1990 2000 2010
year
45
33.75
22.5
11.25
01900 1918 1936 1954 1972 1990 2008 2026 2044
year
empiricallowmidhigh
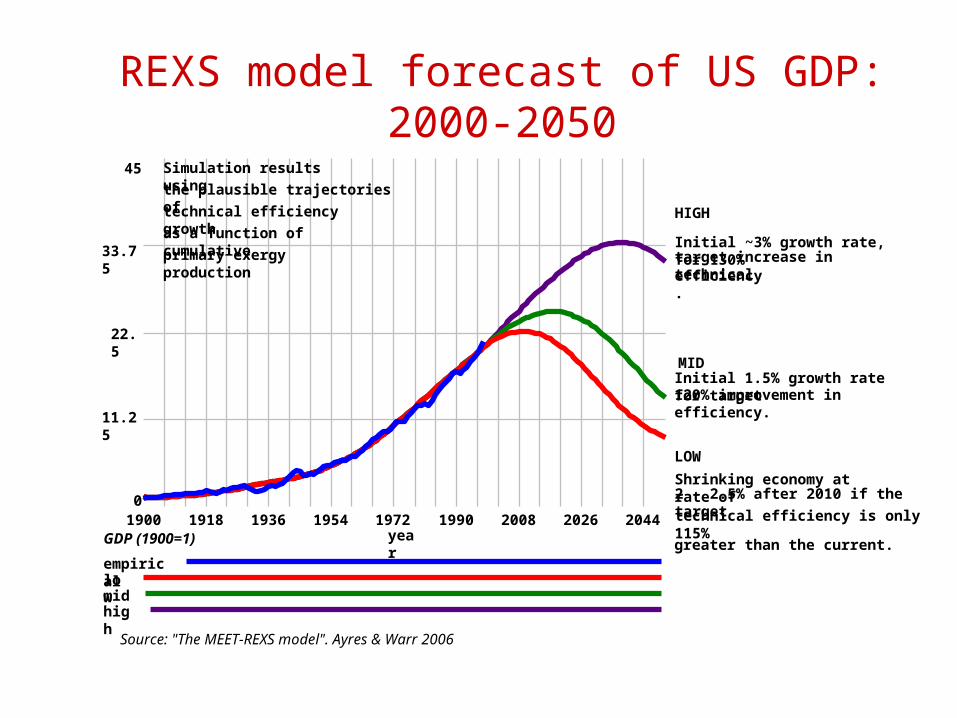
Simulation results using
the plausible trajectories of
technical efficiency growth
as a function of cumulative
primary exergy production
GDP (1900=1)
HIGH
Initial ~3% growth rate, for 130% target increase in technical efficiency.
MIDInitial 1.5% growth rate for target120% improvement in efficiency.
LOW
Shrinking economy at rate of 2 - 2.5% after 2010 if the target
technical efficiency is only 115%
greater than the current.
Source: "The MEET-REXS model". Ayres & Warr 2006
REXS model forecast of US GDP:2000-2050
Part 5: The Neo-liberal solution
• We have shown the strong link between exergy or useful work and output. The problem for the captain of the great ship Titanic is to avoid an economic collapse while simultaneously cutting carbon-emissions drastically by cutting fossil fuel consumption. The only possible approach is to increase energy efficiency a lot, but at little (or even negative) cost. We need a win-win policy.
The neo-liberal solution, continued
• We postulate the existence of large but avoidable inefficiencies in the economy, corresponding to significant departures from the optimal equilibrium growth path that is commonly assumed. These inefficiencies may result from “lock-ins”, regulatory barriers or monopolies that prevent innovation by upstart start-ups. Eliminating inefficiencies can create “double dividends”
Deadweight
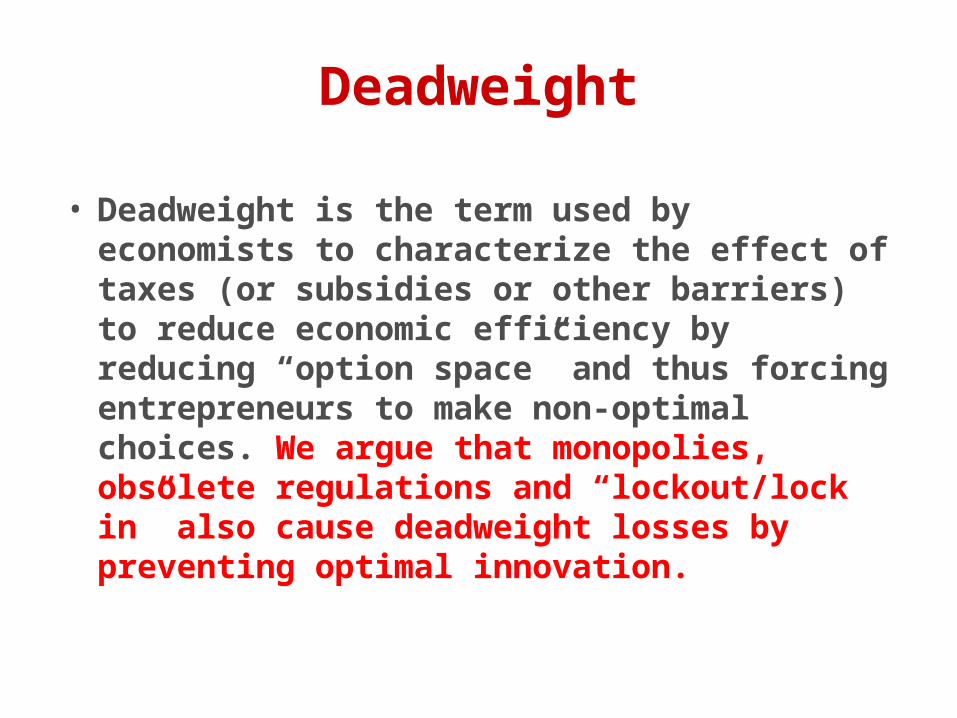
• Deadweight is the term used by economists to characterize the effect of taxes (or subsidies or other barriers) to reduce economic efficiency by reducing “option space” and thus forcing entrepreneurs to make non-optimal choices. We argue that monopolies, obsolete regulations and “lockout/lock in” also cause deadweight losses by preventing optimal innovation.
Disequilibrium = Deadweight loss
• If the economy were really in the standard state of perfect competition, perfect foresight, etc. there would be no inefficiencies and no deadweight losses. In the real world, evidence of double dividend opportunities is evidence of disequilibrium and deadweight losses.
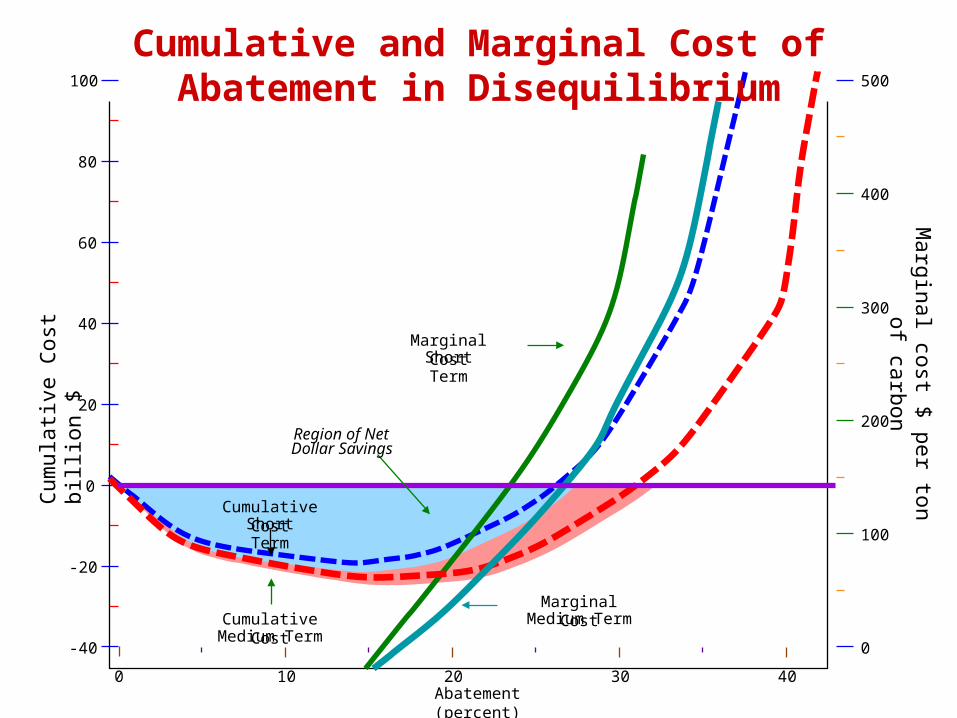
0 10 20 30 40Abatement (percent)
Marginal cost $ per ton of
carbon
Cumulative CostMedium Term
Marginal CostMedium Term
Marginal CostShort Term
-40
-20
0
20
40
60
80
100
0
100
200
300
400
500
Cumulative CostShort Term
Region of NetDollar Savings
Cum
ulat
ive
Cos
t bi
llion
$Cumulative and Marginal Cost of Abatement in
Disequilibrium
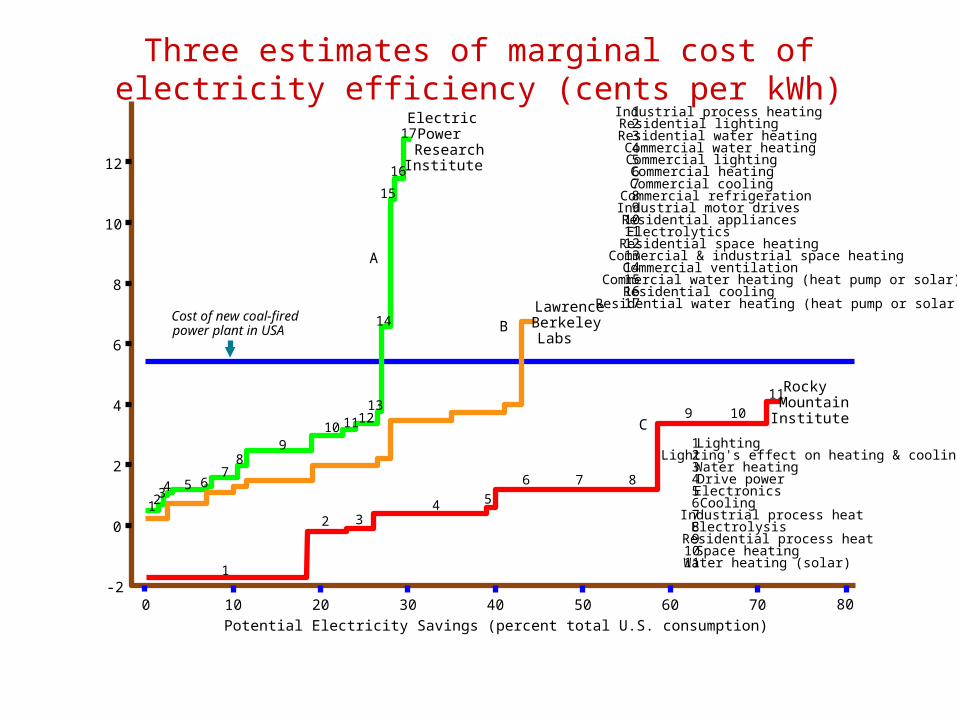
0 10 20 30 40 50 60 70-2
0
2
4
6
8
10
12
Potential Electricity Savings (percent total U.S. consumption)
ElectricPowerResearchInstitute
RockyMountainInstitute
80
Cost of new coal-firedpower plant in USA
17
16
15
14
13121110
98
7654321
11
109
876
5432
11110987654321
Water heating (solar)Space heatingResidential process heatElectrolysisIndustrial process heatCoolingElectronicsDrive powerWater heatingLighting's effect on heating & coolingLighting
1716151413121110987654321
Commercial lightingCommercial water heatingResidential water heatingResidential lightingIndustrial process heating
Residential water heating (heat pump or solar)Residential coolingCommercial water heating (heat pump or solar)Commercial ventilationCommercial & industrial space heatingResidential space heatingElectrolyticsResidential appliancesIndustrial motor drivesCommercial refrigerationCommercial coolingCommercial heating
LawrenceBerkeleyLabs
A
B
C
Three estimates of marginal cost of electricity efficiency (cents per kWh)
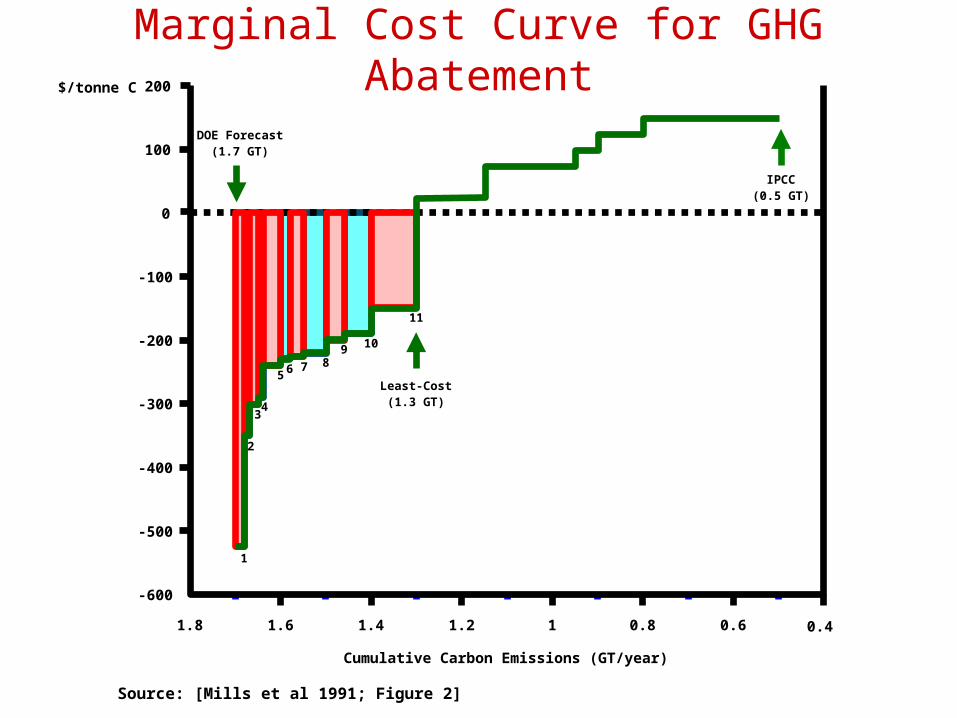
0.40.60.811.21.41.61.8
-600
-500
-400
-300
-200
-100
0
100
200
Cumulative Carbon Emissions (GT/year)
$/tonne C
DOE Forecast(1.7 GT)
IPCC(0.5 GT)
Least-Cost(1.3 GT)
11
1098765
4
1
2
3
Source: [Mills et al 1991; Figure 2]
Marginal Cost Curve for GHG Abatement
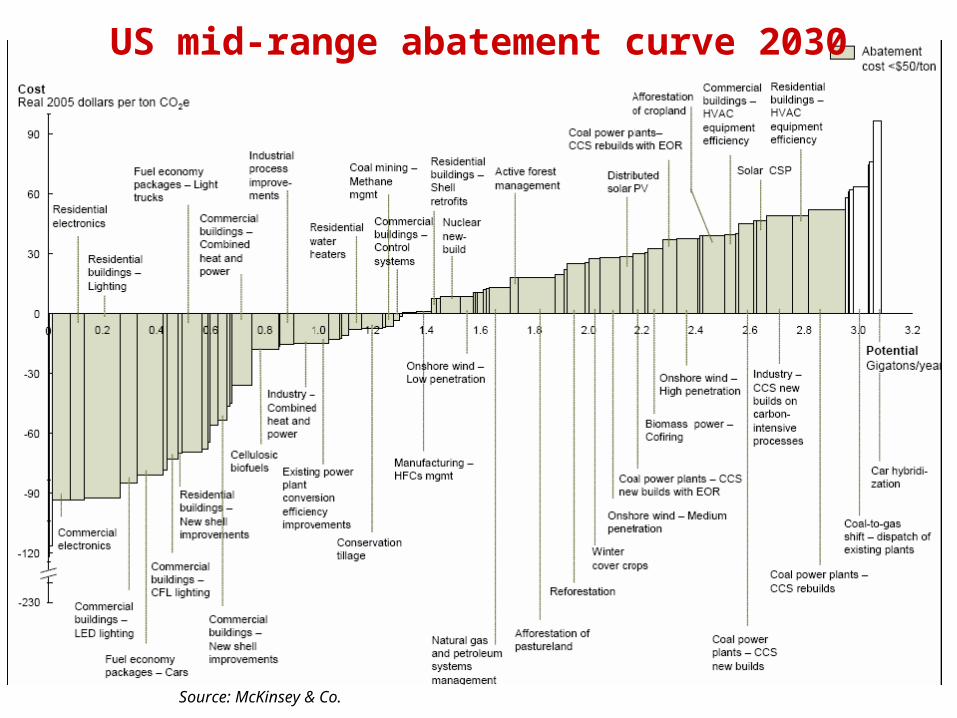
US mid-range abatement curve 2030
Source: McKinsey & Co.
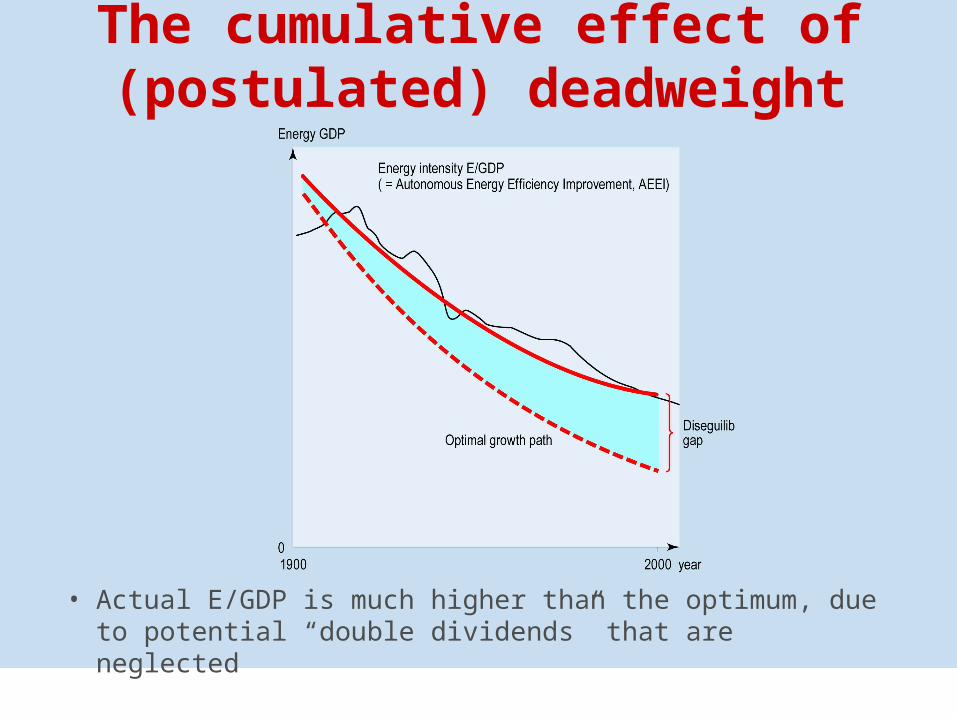
The cumulative effect of (postulated) deadweight
• Actual E/GDP is much higher than the optimum, due to potential “double dividends” that are neglected
Summary of parts 4 & 5
• Neoclassical growth theory does not explain growth
• We model economic growth with useful work as a factor of production. This explains past growth well
• Economic growth need not be a constant percentage of GDP. It can be negative.
• Future sustainable growth in the face of peak oil depends on accelerating energy (exergy) efficiency gains.
• Future efficiency gains may be inexpensive if existing double dividend possibilities are exploited

Thank you