Embed Size (px)
Citation preview
Sustainability of Coastal/Marine Recreation:
Modeling Social Carrying Capacity for Hanauma Bay, Hawaii
March 2005
Sustainability of Coastal/Marine Recreation STEP-UNI
Presented to: University of Hawaii Sea Grant College Program, SOEST
Presented by: Samuel V. Lankford, Ph.D.
Principal Investigator Director, Sustainable Tourism and the Environment Program
Professor, School of Health, Physical Education, & Leisure Services, University of Northern Iowa
Yuka Inui, M.S. Data Analysis and Report Preparation
Graduate Student, Sustainable Tourism and the Environment Program University of Northern Iowa
Amber Whittle, Ph.D.
Data Collection Coordinator & Data Entry University of Hawaii at Manoa
Regina Luna, M.S.
Data Collection University of Hawaii at Manoa
Debbie Tyrone, M.S.
Data Collection University of Hawaii at Manoa

Sustainability of Coastal/Marine Recreation STEP-UNI
ACKNOWLEDGEMENTS
Special thanks to Dr. Amber Whittle for coordinating the data collection and entering the data. Acknowledgement also goes to Ms. Regina Luna and Ms. Debbie Tyrone for their data collection effort. This project would not have been possible without them.
This paper is funded by a grant/cooperative agreement from the National Oceanic and Atmospheric Administration, Project # R/FM-8, which is sponsored by the University of Hawaii Sea Grant College Program, SOEST, under Institutional Grant No. NA86RG0041 and NA16RG2254 from NOAA Office of Sea Grant, Department of Commerce. The views expressed herein are those of the author(s) and do not necessarily reflect the views of NOAA or any of its subagencies. UNIHI-SEAGRANT-OP-02-001.

Sustainability of Coastal/Marine Recreation STEP-UNI
EXECUTIVE SUMMARY
This study examines the consequences crowding in a coastal and marine site from a
social capacity perspective. Social carrying capacity is the number and distribution of visitors
that provide minimal acceptable recreation experiences (Shelby & Heberlein, 1986). What is
acceptable for one person may be viewed differently for another person. These perceptions may
also differ by recreational sites: one may seek solitude at a certain site, and yet the same
individual may accept the presence of other users. The study reports on surveys collected from
Hanauma Bay located on the Island of Oahu, Hawaii. Managers of the Bay face the difficult task
of managing both the physical environment, and the diverse recreation uses within the bay. The
site is already a subject of environmental assessments, however there have been no studies on the
social carrying capacity of the bay. This study intends to provide resource managers with data
that can instigate change in the way they perceive how this marine environment should be
managed based on user perceptions and experiences. It is debatable whether social carrying
capacity modeling is effectively applied in this environment. It is also debatable whether or not
ecological data alone can influence decision making in these environments.
Six hundred and twenty-eight surveys were collected from July 6, 2000 to June 24, 2002
at Hanauma Bay. Two sets of questionnaires with 27 questions each were used to assess visitor
perceptions prior to and after their visit to the bay. The survey included three sets of matched
pre-and-post-test questions about perceived crowding, experience preferences, and benefits
sought. The survey also included demographic information, travel characteristics and
evaluation of the Bays’ resources.
The analysis included descriptive techniques outlining differences in responses among
residents and visitors, and among first time visitors and repeat visitors. It further explored
changes in user perceptions as use level increased. The findings provide insight into user
expectations and experiences, while addressing challenges in determining recommended use
levels of the Bay.
The total sample reported a higher level of expected crowding than their perceived
crowding (post experience score), indicating the sample was aware of crowding in advance.
Particularly, residents were more sensitive to crowding levels. Overall, at use levels of over
3000, more than 40% of the respondents indicated “negative influences from people on the
beach.” When the use level exceeded about 3100, crowding was consistently perceived to be

Sustainability of Coastal/Marine Recreation STEP-UNI
problematic: at the use level of over 3100 to 3800, 100% of the respondents indicated that it was
“crowded” in the Bay. At 3400, more than 55% of the respondents indicated that they
perceived “negative influences from other people snorkeling.” At the use level over 3700,
respondents increasingly reported it was “extremely crowded,” and satisfaction levels dropped.
The results indicate that perceived environmental benefits (i.e., to see abundant marine
life, to view natural sites, and to be adventurous), and expertise in snorkeling are positively
related to the samples’ global rating of satisfaction. However, ratings of satisfaction
significantly lowered due to the increased numbers of people on the beach. In other words,
those who perceived more benefits among the environmental attributes, and more experience
with snorkeling are likely to be more satisfied, whereas those who reported negative influences
from the numbers of people on the beach are likely to be less satisfied
Visitors ratings of perceived environmental benefits (i.e., to see abundant marine life, to
view natural sites, and to be adventurous) are positively related to the ratings of satisfaction.
However, ratings of enjoyment of activities (i.e., sunbathing, snorkeling), and perceived
crowding negatively impacted satisfaction levels.
The findings of the study suggest that perceived crowding may be an indicator of actual
user counts, and that crowding negatively influences satisfaction levels. Limiting use may be
an effective tool to manage the Bay. The Bay is exceeding the social carrying capacity (as
measured in this study) when more than 3,200 (+/- 200 users) people per day use the Bay. The
number of visitors that provide acceptable recreation experiences may be less than 3,200 per day.
Sustainability of Coastal/Marine Recreation STEP-UNI
Table of Contents
Page
I. INTRODUCTION ……………………………………………………………….…
A. Background ……………………………………………………………….……… B. Goals and Objectives …………………………….……………………………….. C. Rationale …………………………………………………………………..……....
Environmental Decision Making …………………………………………….. Carrying Capacity ………………………………………………………….… Indicators and Standards of Quality ………………………………………......
D. Expected Outcomes ………………………………………………………….…… II. RESEARCH METHODS AND APPROACH ……………………………....……...
A. Study Site .……………………………………………………………………....... B. Instrumentation ………………………………………………………....…………C. Subjects …………………………………………………………...….………..…. D. Treatment of Data …………………………………………………..……………..
III. HANAUMA BAY RESULTS AND DISCUSSION………………………….……..
A. User Characteristics …………..…………………………………….......................Gender Distribution Age, Years of Residency in Oahu and Length of Visit to Oahu of the Sample Residency of Visitors Snorkeling Skills and Frequency to Snorkel
B. Knowledge of and Evaluation of Hanauma Bay ……………………………….… Information Sources Used …………………………………………………… Sources of Influence on Decision Making to Visit Hanauma Bay ……………Planned Activity Ranking ……………………………………………………. Previous Visitation …………………………………………………………… Familiarity with Hanauma Bay ………………………………………………. Length of Hours and Money Spent at Hanauma Bay ………………………... User Evaluation of Hanauma Bay …………………………………………….
C. Crowding Perceptions ……………………………………………...……....…….. D. Pre-and-Post Experience Preferences and Benefits Sought and Achieved at
Hanauma Bay …………………………………………………………………….. Pre-and-Post Experience Preferences ………………………………….…….. Sought and Perceived Benefits of the Experience …………………….………
E. Satisfaction with the Experiences at Hanauma Bay ……………………..….…… Overall Satisfaction …………………………………………………………... Satisfaction Determinants …………………………………………………….
1
2236689
1011111214
15
1616171821232324252627282935
404049585861
Sustainability of Coastal/Marine Recreation STEP-UNI
IV. MANAGEMENT IMPLICATIONS AND FUTURE RESEARCH ……………….. V. REFERENCES …………………………………………………………………….. VI. APPENDIX ………………………………………………………………………...
72
75
81

Sustainability of Coastal/Marine Recreation STEP-UNI
Table of Tables and Figures
PageI. INTRODUCTION …………………………………………………………………...
A. Background B. Goals and Objectives C. Rationale
Environmental Decision Making Carrying Capacity Indicators and Standards of Quality Figure 1.1: Social Carrying Capacity Model as Proposed for this Study ..
D. Expected Outcomes II. RESEARCH METHODS AND APPROACH ……………………………………….
A. Study Site B. Instrumentation C. Subjects
Table 2.1: Table 2.2:
Sample Size and Response Rate for Hanauma Bay ……. Residents and Visitor Ratio Comparison of Hanauma Bay Users ………………………………………………….
D. Treatment of Data III. HANAUMA BAY RESULTS AND DISCUSSION …………………………………
A. User Characteristics Table 3.1: Table 3.2: Table 3.3: Table 3.4 Table 3.5
Gender Distribution ……………………………………… Age, Years of Residency in Oahu and Length of Visit to Oahu of the Sample ………………………………………. Residency of Visitors ……………………………………... Comparison of Gender, Age and Residency Distribution Snorkeling Skills and Frequency to Snorkel ....................
B. Knowledge of and Evaluation of Hanauma Bay Table 3.6: Table 3.7: Table 3.8: Table 3.9: Table 3.10: Table 3.11: Table 3.12: Table 3.13: Figure 3.1:
Information Sources Used ……………………………….. Sources of Influence on Decision Making to Visit Hanauma Bay …………………………………………….. Planned Activity Ranking ………………………………... Previous Visitation ……………………………………….. Familiarity of Hanauma Bay ……………………………. Length of Hours Spent at Hanauma Bay ……………….. Money Spent at Hanauma Bay ………………………….. Evaluation of Hanauma Bay …………………………….. Changes in Responses According to Use Level: Did the Number of People Snorkeling Negatively
1
9
10
13
14
15
16
17162022
23
24252627262931

Sustainability of Coastal/Marine Recreation STEP-UNI
Figure 3.2: Figure 3.3: Figure 3.4:
Impact Your Enjoyment of Today's Trip? ……………… Changes in Responses According to Use Level : Did the Number of People On the Beach Negatively Impact Your Enjoyment of Today's Trip? ……………… Changes in Responses According to Use Level: Can Hanauma Bay Accommodate More Visitors than There Were Today? ………………………………………. Changes in Responses According to Use Level: If the Bay was Less Crowded, Would You Spend More Time Here? ………………………………………………..
C. Crowding Perceptions Table 3.14: Table 3.15: Table 3.15.2: Table 3.16 Figure 3.5: Figure 3.5.2:
Descriptive Statistics of Expected Crowding and Perceived Crowding ……………………………………… Pair t-test on Differences between Expected and Perceived Crowding ……………………………………… Paired t-test on Differences between Expected and Perceived Crowding by Residents and Visitors ….…….. Correlations among Total Users, Expected Crowding and Perceived Crowding ………………………………….Changes in Responses According to Use Level: How Crowded Was It Today at Hanauma Bay? (2-Scale)Changes in Responses According to Use Level: How Crowded Was It Today at Hanauma Bay? (4-scale)
D. Pre-and-Post Experience Preferences and Benefits Sought and Achieved at Hanauma Bay ……………………………………………………………………..
Pre-and-Post Experience Preferences Table 3.17: Table 3.18: Table 3.18.2: Table 3.19: Table 3.20: Figure 3.6: Figure 3.7: Figure 3.7.2:
Factor and Descriptive Statistics of Pre Experience and Post Experience Preferences ………..…………………… Paired t-test on the Differences between Pre Experience and Post Experience Preferences ………………………... Paired t-test on the Differences between Pre Experience and Post Experience Preferences by Residents and Visitors ................................................................................. T-test on Resident and Visitor Differences in Experience Preferences ………………………………………………... Correlations among Total User Counts, Perceived Crowding and Post Experience Preferences Factors …... Degree of Perceived Crowding within each Scale of Post Experience Fee & the Number of People (Post Experience Preferences F3) ……………………….. Fluctuation of Perceived Crowding and Post Experience Rating of Pre Experience Preferences Factors According to Use Level ……………………………………………….. Fluctuation of Perceived Crowding and Post Experience Rating of Pre Experience Preferences Factor According to Use Level Fee & Number of People (Preferences
32
33
33
34
36
37
37
36
39
39
42
43
44
45
46
47
46
Sustainability of Coastal/Marine Recreation STEP-UNI
Factor 3) According to Use Level ………………………...Sought and Perceived Benefits of the Experience Table 3.21 : Table 3.22: Table 3.22.2: Table 3.23: Table 3.24: Figure 3.8: Figure 3.9:
Factor Analysis and Descriptive Statistics of Pre Experience and Post Experience Benefits ………………. Paired t-test on Differences between Pre Experience and Post Experience Benefits ………………………………… Paired t-test on Differences between Pre Experience and Post Experience Benefits by Residents and Visitors ...…. T-test on Resident-Visitor Differences in Benefits ………Correlations among Total Users, Perceived Crowding and Post Experience Benefits ……………………………. Degree of Perceived Crowding within each Scale of Post Experience Learning Benefits (Post Benefits F1) ………. Fluctuation of Perceived Crowding and Benefits Received According to Use Level ………………………...
E. Satisfaction with the Experiences and Hanauma Bay Overall Satisfaction Table 3.25 Table 3.26 Figure 3.10 Figure 3.10.2
Descriptive Statistics of Global Satisfaction ……………. Correlations among Total Users, Perceived Crowding and Global Satisfaction …………………………………... Fluctuation of Perceived Crowding and Global Satisfaction According to Actual Use Level …………….. Extrapolated Total Users, Perceived Crowding and Global Satisfaction ………………………………………..
Satisfaction Determinants Table 3.27: Table 3.28: Table 3.29: Figure 3.11: Figure 3.11.2 Figure 3.11.3 Figure 3.11.4 Figure 3.12: Figure 3.12.2: Table 3.30:
Factor Structure and Descriptive Statistics of Satisfaction…………………………………………………T-test on Resident-Visitor Differences with Satisfaction Correlations among Total Users, Perceived Crowding and Satisfaction Factors …………………………………. Degree of Perceived Crowding within each Scale of Satisfaction with Quality and Availability of Facilities (Satisfaction F1) ………………………………………….. Degree of Perceived Crowding within each Scale of Distractions & Encounters (Satisfaction F2) …………... Degree of Perceived Crowding within each Scale of Debris (Satisfaction F3) ………………………………….. Degree of Perceived Crowding within each Scale of Satisfaction with Marine Resources (Satisfaction F4) ….Fluctuation of Perceived Crowding and Satisfaction Determinants According to Use Level …………………... Fluctuation of Perceived Crowding and Satisfaction Determinants (Distractions & Encounters, Debris) According to Use Level …………………........................... Direct Effects of Variables on Satisfaction ………….......
49
50
52
5354
55
56
57
56
59
60
60
6263
64
65
65
66
66
67
6669

Sustainability of Coastal/Marine Recreation STEP-UNI
IV. MANAGEMENT IMPLICATIONS AND FUTURE RESEARCH ………………… Table 4: Summary of Perceived Crowding Ratings ………….......
V. REFERENCES ……………………………………………………………………… VI. APPENDIX …………………………………………………………………………..
Figure 6.1 Figure 6.2 Figure 6.3 Figure 6.4
Changes in Responses According to the Use Level by 500: Did the Number of People Snorkeling Negatively Impact Your Enjoyment of Today's Trip? ……………… Changes in Responses According to the Use Level by 500: Did the Number of People On the Beach Negatively Impact Your Enjoyment of Today's Trip? ……………… Changes in Responses According to the Use Level by 500: Can Hanauma Bay Accommodate More Visitors than There Were Today? ………………………………… Changes in Responces According to the Use Level by 500: If the Bay was Less Crowded, Would You Spend More Time Here? ................................................................
74
75
80
80
80
81
81
82
8283
87
91
95
96
97
97
98
98

Sustainability of Coastal/Marine Recreation STEP-UNI
Table 6.5: Figure 6.7: Figure 6.7.2: Figure 6.8: Table 6.6: Table 6.7: Table 6.7.2: Figure 6.9:
Factor Analysis of Pre Experience and Post Experience Benefits at Hanauma Bay ................................................... Degree of Perceived Crowding within each Scale of Post Experience Leisure & Bonding (Post Experience Benefits F2) .......................................................................... Degree of Perceived Crowding within each Scale of Post Experience Environmental Attributes (Post Experience Benefits F3) .......................................................................... Degree of Perceived Crowding within each Scale of Global Satisfaction .............................................................. Explanation of Satisfaction Determinants Codes for Hanauma Bay....................................................................... Factor Analysis of Satisfaction Determinants at Hanauma Bay I ....................................................................Factor Analysis of Satisfaction Determinants at Hanauma Bay II ..................................................................Degree of Perceived Crowding within each Scale of Weather Conditions (Satisfaction Item) ............................
99
100
100
101
101
102
103
103

Sustainability of Coastal/Marine Recreation - 1 - STEP-UNI
I. INTRODUCTION

Sustainability of Coastal/Marine Recreation - 2 - STEP-UNI
A. Background
Few studies have focused on the social carrying capacity for marine recreation areas.
There is a need to incorporate more social science research into the management decision
making processes for these areas. This study focuses on the social carrying capacity of
Hanauma Bay Marine Park and on the Island of Oahu, Hawaii. Managers of these areas face
the difficult task of managing both the physical environment, and the diverse recreation uses
within the site. Presently, scientific data on the ecology of these marine recreation areas exists,
yet these data are not enough to convince decision makers to adopt policies that support the
recommendations of marine recreation resource managers. This study will provide resource
managers with data that can instigate change in the way they perceive how marine environments
should be managed. It is debatable whether social carrying capacity is effectively applied in
these environments, and whether or not ecological data alone influences decision making in these
environments.
B. Goals and Objectives
A primary goal of this research project is to develop an instrument which can be used to
identify social carrying capacity norms, user issues, and values relative to coastal and marine
recreation impacts in Hawaii. Importantly, this research will be of assistance in increasing the
public's understanding of issues, and identifying ways to participate in the public policy dialogue
relative to managing these resources. Secondly the project identifies areas of concern and
interest that should be communicated to the various agencies and organizations involved with
managing the resource, users and activities at the selected site. The following objectives guided
this research project:
1) To develop and test the properties of a coastal/marine recreation impact attitudinal scale for
future application in Hawaii.
2) To determine if the coastal/marine recreation impact attitudinal scale can be used to work
within a varied mix of ocean recreation settings (bays, beaches, reefs) and user types
(snorkeling, swimming etc.) and how these influence the psychometric properties of the
scale.

Sustainability of Coastal/Marine Recreation - 3 - STEP-UNI
3) To explore the relationship between attitudes toward resource use and its perceived condition,
crowding, norms and satisfaction levels, value of the public good (contingent valuation) and
the indirect/direct management tactics available to manage the resource.
4) To develop a public participation and decision making model that identifies predictors of
potential policy interventions based on values and beliefs.
5) To present the findings in both written and oral presentations for County, State, Federal, and
non-profit representatives.
6) To conduct a workshop on how the findings can be of assistance in the public policy process
in Hawaii and beyond.
7) To demonstrate how the social sciences can provide data that compliments the natural
sciences data to influence public policy and resources.
C. Rationale
An extensive and varied natural resource base has long provided a suite of values for
human society (Stankey, McCool, Clark & Brown, 1999). Within the context of this study,
these include commodity values, such as fisheries; ecological values, such as reef bio-diversity;
and environmental quality values such as water quality. It also includes public use values, such
as ocean recreation and tourism. Scuba, snorkeling, boating, fishing and many other ocean
recreation resources are dependent upon the setting in which they take place. Stankey et al.
(1999) note that we face increasing contentiousness about natural resource management due to
growing demands placed on the resource: more people demanding greater amounts of a wider
range of goods and services. Oceans and marine areas, once valued primarily for their
commodity outputs, are now increasingly valued for a host of other goods and services –
environmental, aesthetic, conservation, recreational – whose production is inconsistent with, or
at least adversely affected by the production of traditional commodity values. Unfortunately,
public policy, planning processes and organizations may not be able to address these multi-uses
and demands. An important consideration for managing these resources is recognizing the need
to monitor and manage the diverse recreational uses of these areas and the resultant impacts.
Importantly, how can decisions be made systematically, logically and defensibly?
Competition for and use of coastal and marine recreation resources and opportunities has
become a major resource management issue within many coastal communities. Specifically,
Sustainability of Coastal/Marine Recreation - 4 - STEP-UNI
both the environmental and social carrying capacity of these areas are being exceeded.
Consequently, local users are being displaced to less desirable areas, and satisfaction levels
among tourists can decrease. Yet, decision-makers are usually limited to only environmental
data available, and are therefore unable to fully utilize scientific data due to the lack of social and
economic valuations.
There is a need to examine and report the consequences of recreation resource use in
coastal and marine environments within the context of carrying capacity. Conflicts among
users (divers vs. boaters vs. surfers etc.) is increasing in many areas, while resource managers are
left without appropriate means to influence public decision making with regard to resource
management. Consequently, there is a need to more fully understand the dynamics of this issue,
to more accurately inform the public policy debate that is occurring, and to link the findings to
public valuation of the resource. In many conflicts, resolution is hampered by the difficulty in
identifying and involving all interested parties, and a misunderstanding about the issues of
mutual concern.
A number of studies have been conducted to examine recreation resource use and
community level planning issues. Studies have found that the most significant predictors of
support for community based tourism was the perceived impact on one's own outdoor
recreational opportunities, and the ability to influence decision making and public
policy ,Lankford & Howard 1994; Rollins, 1997; Lankford, Williams, & Knowle, 1997). Park
(1999) found in Hawaii that ocean recreation impacts were of concern to residents. Lankford et
al. (2000) found crowding, displacement and resentment toward tourists were related to ocean
and marine recreation users in Hawaii. These findings have been verified in cross-cultural
comparative studies (Taiwan, Hawai’i, Canada, Oregon, and Washington) along coastal and
marine recreation areas (Lankford & Tanselli, 1989; Lankford & Howard, 1994; Lankford, Chen,
& Chen 1994; Lankford, Williams, & Knowles, 1997; Rollins, 1997; Park, 1998).
Systematic analysis of coastal and marine recreation impacts can help local decision
makers identify concerns and issues in order for appropriate policies and action to occur.
Unfortunately, apathy, mistrust of public authorities, and the citizen's inability to project their
needs, articulate their interests, and understand scientific data have kept much of the public and
many of these types of issues away from the policy and planning process.

Sustainability of Coastal/Marine Recreation - 5 - STEP-UNI
While the public and policy makers may not understand the range of values in a
community with regard to recreation resources, this lack of understanding of values and attitudes
may hinder public debate about ocean recreation related issues. Secondly, the lack of studies
which examine ocean recreation resource use (attitudinal, value clarification, social carrying
capacity, and contingent valuation of the resource), limits resource managers ability to convey to
decision-makers a range of options. Once decision-makers understand not only the
environmental aspects of a study, but also the attitudinal, value clarification, and contingent
valuation, they can begin to balance the information related to multiple and competing goals for
the resource.
A review of the literature suggests there is a lack of survey instrument that reliably
measures attitudes, crowding, satisfaction etc. with an emphasis on identifying social carrying
capacity issues and indicators in coastal/marine environments (Lankford & Hetzler, 1996).
This proposed study was an attempt at addressing this important need. There is a need to link
ecological data with social carrying capacity and attitudinal data, and contingent valuation
method (CVM) (Peterson, Driver & Gregory, 1988). Specifically, there is a need to develop
frameworks within which we could answer the following questions (Peterson et al., 1988;
Stankey et al., 1999):
1) How do we promote management decisions and actions that are consistent with the
management objectives and scientific data for marine and ocean recreation areas?
2) How do we integrate more fully ocean recreation management and other ocean
resource uses in such a way as to minimize conflict and maximize complementarities?
3) What are the impacts of the effects of multi-uses (fishing, harvesting, sailing,
snorkeling, touristic activities etc.) on the experiences of visitors to these ocean
recreation areas?
4) How do we get decision makers to observe the warning signs of overuse of these
natural resources?
5) How do we ensure that visitors will have a satisfying experience and return or provide
positive word of mouth advertising for tourist based communities?

Sustainability of Coastal/Marine Recreation - 6 - STEP-UNI
Environmental Decision Making
Typically, resource areas like Haunama Bay are managed using rational-comprehensive
models involving goals and objectives; identification of alternative solutions; consequences of
alternatives; implementation measures and later some level of evaluation (Friedmann, 1987).
Such planning has been conducted by “subject matter experts” who are generally isolated from
the socio-political context in order to ensure “objective” decisions (Stankey et al., 2000).
Unfortunately, this “expert driven” model is problematic in ocean and marine recreation resource
management. We often assume that all is needed is a process that develops solid scientific data
that is sound in its technical foundation and objective. However, such plans affect the flow and
allocation of values-be they commodity, aesthetic, scientific, or other forms- to people (Stankey
et al., 2000). Because plans affect values, people and places, it is inherently a political
undertaking. We concern ourselves with the nature of the environmental impact. These
findings generally involve the eventual limiting of use and access, thereby confronting our social
values. An example is that marine biologists suggest that the reef system is nearly defunct due
to overuse in Haunama Bay. The recommendation is to limit access and numbers of visitors.
In essence, we have a political and value judgment whose resolution through technical analysis is
not possible. The missing data or piece of the puzzle is the attitudinal data from users and the
community about which would describe the values held.
Carrying Capacity
Simply defined, carrying capacity can be defined as the amount of visitor use that can be
appropriately accommodated within a park or outdoor recreation area. The concept has proven
useful in wildlife and range management, where it generally refers to the number of animals of
any one species that can be sustained in a given habitat (Manning, 1997). Initial scientific
applications of the concept examined the relationships between visitor use and environmental
conditions. The working hypothesis and early studies suggested that carrying capacity could be
determined by soil compaction, erosion, vegetation destruction and other related variables.
However, Manning (1997) noted it soon became apparent that the social aspects of the visitor
experience was another important dimension to carrying capacity. Wagar (1964) identified that
carrying capacity of recreation areas could be determined in terms of ecology and deterioration,
but the concept had to be augmented by the consideration of human values. Therefore, the
Sustainability of Coastal/Marine Recreation - 7 - STEP-UNI
working hypothesis was that increased visitor use causes social impacts as measured by
crowding and related variables. Consequently, carrying capacity has two broad dimensions,
social impacts and environmental impacts and thresholds. The study site proposed in this study
is already subjects of environmental assessments, however there have been no studies on the
social carrying capacity of these areas. Within a recreational context (recreational carrying
capacity is the level of use an area can withstand while providing sustained quality recreational
experiences [Wagar 1964]), carrying capacity is further defined into the following (Shelby &
Heberlein 1986):
1) Physical capacity is the amount of space available for the activity based on design and use
levels. For example, there a certain number of boaters that can be supported in Hanauma
Bay at a given time.
2) Ecological or biological capacity is the ability of the resource to withstand recreational use
without unacceptable damage to ecological components, such as the water quality, reef
bio-diversity and fish diversity in Haunama Bay.
3) Facility capacity involves additions to the recreation environment intended to support visitor
needs. For example, a boat ramp and parking area may be constructed to access the Bay.
4) Social capacity is the number and distribution of visitors that provide minimal acceptable
recreation experiences. Social carrying capacity is the most difficult to define (Washburne
1982). What is acceptable of one may be viewed differently for another user. For
example, a snorkeler to Haunama Bay might term the visit as unacceptable due to both the
advertising and expectations of being in a pristine marine park. Basically, her/his
expectations were not met, and the place was too crowded. Yet, another snorkeler the same
day did not perceive the Bay to be crowded and was quit pleased due to expectations of only
seeing tropical fish.
The task for resource managers is to manage the recreation resource while considering all
four carrying capacity issues identified above (Symmonds, Hammitt, & Quisenberry 2000).
The descriptive component of social carrying capacity is partly subjective (values, policy
perspectives etc.) in determining how much impact or change in the recreation experience is
acceptable. At what level of perceived crowding and conflict should be allowed before
management intervenes? As a result of these and other questions, normative standards and
methodologies have been examined.

Sustainability of Coastal/Marine Recreation - 8 - STEP-UNI
Indicators and Standards of Quality
A number of researchers (Stankey et al. 1985; Stankey & Manning 1986; Graefe, Kuss,
& Vaske, 1990; Shelby, Stankey, Shindler, 1992) have conducted studies on developing
indicators of quality and standards for social carrying capacity. Essentially, the focus is on
identifying the visitor experience to be provided and monitoring to determine whether or not
acceptable conditions have been maintained. Indicators of quality define specifically the
resource and social conditions to be managed. However, standards of quality define the
minimum acceptable condition of each indicator variable. For example, it may be determined
by this research that the number of users in the Bay is a key measure of satisfaction and solitude
(two known motives for pursuing fishing and boating). Therefore, the number of encounters
with other boaters is a good indicator of quality, furthermore, visitors may report that once they
encounter more than three other boats per day they no longer achieve an acceptable level of
satisfaction and solitude. Thus, the standard of quality for the number of encounters might be
most appropriately set at three (which calls into question the direct and indirect management
tactics used at the site, for example the number of parking slots for boat trailers). Obviously,
this approach requires a baseline and monitoring over time. This approach has proven useful in
backcountry and wilderness areas and is central to resource planning frameworks such as Limits
of Acceptable Change (U.S. Forest Service, Stankey et al., 1985); Visitor Impact Management
(Graefe et al. 1990); and Visitor Experience and Resource Protection (National Park Service,
1993). Much of the work in setting standards has centered around crowding, ecological impacts,
wildlife management, minimum stream flows, and level of facility development (Manning 1997).
However, this approach has not been utilized to any great depth in marine and ocean recreation
settings.
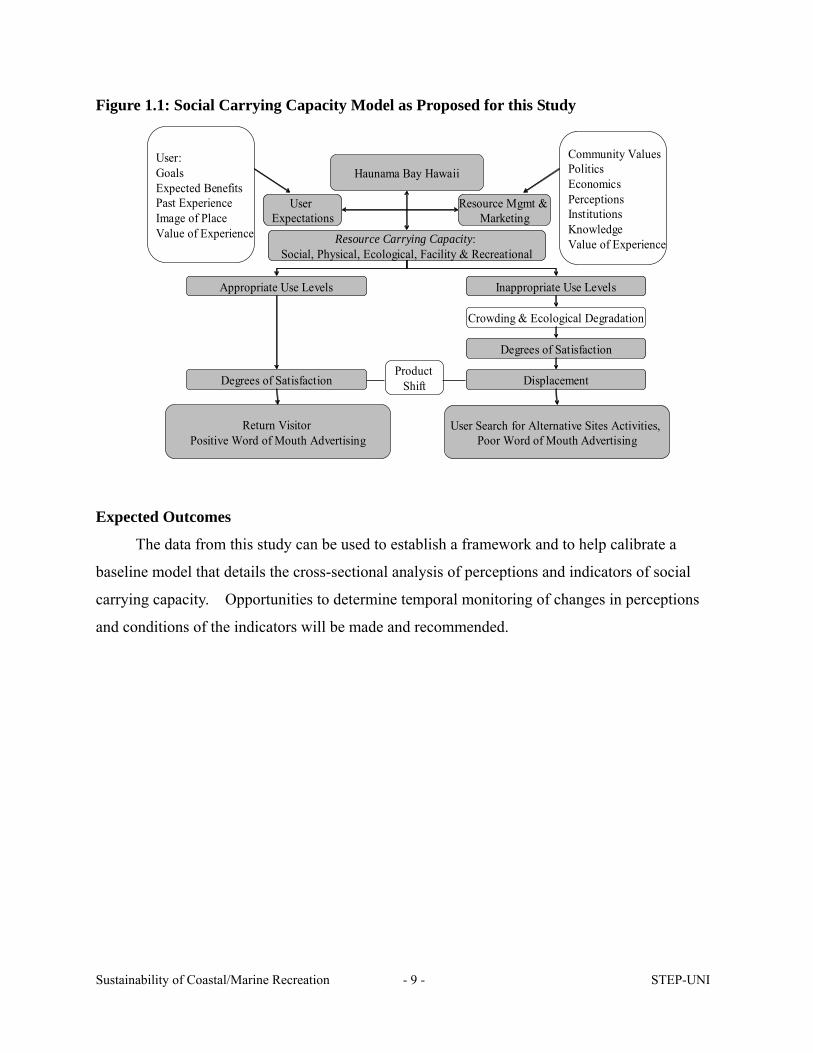
Figure 1 below outlines the basic considerations of this research proposal using social
carrying capacity as a model. Of usefulness here is that if data can show decision makers that
visitors and residents are dissatisfied with the resource and experience, then this will equate to an
economic metric. These data, when provided with the existing ecological scientific data on
water quality, fish diversity and reef condition, should help to sway public and political opinion
on the management of these important aquatic resource management tactics.
Sustainability of Coastal/Marine Recreation - 9 - STEP-UNI
Figure 1.1: Social Carrying Capacity Model as Proposed for this Study
Haunama Bay Hawaii
Resource Carrying Capacity: Social, Physical, Ecological, Facility & Recreational
User:GoalsExpected BenefitsPast ExperienceImage of PlaceValue of Experience
Community ValuesPoliticsEconomicsPerceptionsInstitutionsKnowledgeValue of Experience
Appropriate Use Levels Inappropriate Use Levels
Product Shift
Return Visitor Positive Word of Mouth Advertising
Crowding & Ecological Degradation
Degrees of Satisfaction
Displacement
User Search for Alternative Sites Activities, Poor Word of Mouth Advertising
User Expectations
Resource Mgmt & Marketing
Degrees of Satisfaction
Expected Outcomes
The data from this study can be used to establish a framework and to help calibrate a
baseline model that details the cross-sectional analysis of perceptions and indicators of social
carrying capacity. Opportunities to determine temporal monitoring of changes in perceptions
and conditions of the indicators will be made and recommended.
Sustainability of Coastal/Marine Recreation - 10 - STEP-UNI
II. RESEARCH METHODS AND APPROACH

Sustainability of Coastal/Marine Recreation - 11 - STEP-UNI
A. Study Site
A study site based upon their unique geography, particular resource, recreation use,
conflicts, and crowding were identified on Oahu: Hanauma Bay. Located on the southeast
corner of the island Oahu, Hanauma Bay evolved into a tourist "must see" destination during the
1970s and 1980s. The Bay was designated as the State first Marine Life Conservation District
(MLCD) in 1967 (Hawaii Coral Reef Assessment Monitoring Program [CRAMP], 2003a).
Since then, the number of visitors to Hanauma Bay rapidly increased and in 1988, the annual
visitation count reached at 3 million (CRAMP, 2003b). Overwhelmed by commercial diving
and snorkeling tours, as well as increasing numbers of visitors which peaked around 15,000 per
day, the City and County of Honolulu took action to reduce visitation, improve facilities, ban fish
feeding, and educate users about the bay's resources and appropriate behavior in the water.
Commercial activities are now limited, however, bay users still number about 3,000/day and
continue to impact the bay's natural resources by walking on the inshore reef, feeding fish,
handling organisms, and stirring up silt.
B. Instrumentation
Utilizing the attitudinal scaling techniques similar to those used by Lankford and Howard
(1994), relevant items was tested and confirmed based upon the psychometric properties of the
instrument and subsequent scales developed (see treatment of data below). Items included
statements on the image of the site, preferences, perceived benefits, satisfaction levels, perceived
crowding, perceptions of the environmental condition of the site, and socio-demographics. Two
questionnaires were used to measure the responses using a both a pre and post administration,
and using a matched design (Mitra and Lankford, 1999). A pre-test of the questionnaire and
sampling method were conducted at a site similar to the study site.
Random samples of users over a 12 month period at each site were taken. This survey
period was selected to reflect seasonality of the site. First, random months was chosen, random
days within each month and then random times of each day was chosen. Finally, random
subjects were approached at each site for inclusion in the study.
The survey for Hanauma Bay was comprised of two sets of questionnaires with 27 subjects
including three sets of matched pre-and-post-test questions about perceived crowding, perceived
benefits and preferences. The pre and post-test design was possible because there was only one

Sustainability of Coastal/Marine Recreation - 12 - STEP-UNI
access to the Bay. During the on-site intercept, respondents were asked to fill out a survey that
identified the expected benefits they intended to realize from visiting the site that day, activities
pursued, and questions on the priority and preference of this site/activity as compared to other
Oahu opportunities.
At Hanauma Bay, respondents were intercepted upon their entry to the Bay and were given
a card which provides them with a cold water bottle that can be turned in upon their exit from the
Bay. At that time, a post interview questionnaire was administered, and coded by number, to
the pre-test questionnaire the respondent completed prior to the experience, thereby allowed a
matched design.
Perceived crowding was measured using nine-point Likert-type scales where 1 = not at all
crowded to 9 = extremely crowded. Eleven distinctive setting attributes of the Bay were
marked in the pre-test questionnaires as either “expect to see/do,” “not sure” or “not expected to
see/do” and in the post-test questionnaires as “worse than expected,” “what I expected,” or
“better than expected.” Ten situational evaluation items were measured on five-point scale
indicating 1 = strongly agree to 5 = strongly disagree. The level of user satisfaction was
measured by two types of scales in the post-test questionnaire: global satisfaction was measured
on five-point Likert scale ranging 1 = highly dissatisfied and 5 = highly satisfied, while 14
satisfaction items were measured on three-point scale ranging 1 = added satisfaction, 2 = neutral
and 3 = detracted from satisfaction. In order to avoid confusion due to opposite scale, the scale
of global satisfaction was reversed (i.e., 1 = highly satisfied and 5 = highly dissatisfied) when
they were coded. The survey also included demographic information, travel characteristics and
evaluation of the Bays’ resources.
C. Subjects
The survey was conducted from July 2000 to June 2002 at Hanauma Bay by the
Sustainable Tourism & Environment Program, School of Travel Industry Management at the
University of Hawaii. The user count was made available by Hanauma Bay Education Program.
During the survey period, the number of annual users ranged 1,005,189 (2000, Fiscal Year: July
99 to June 2000), 991,485 (2001, FY) and 854,538 (2002, FY). The monthly user count ranged
from 59,424 to 117,004 and the average daily use was 2,603. The daily user count on the
sample date ranged 1,474 to 4992. Residents’ count during the period ranged from 103 to 2,290,
Sustainability of Coastal/Marine Recreation - 13 - STEP-UNI
and the visitors’ (tourists’) count ranged 1,371 to 4,476.
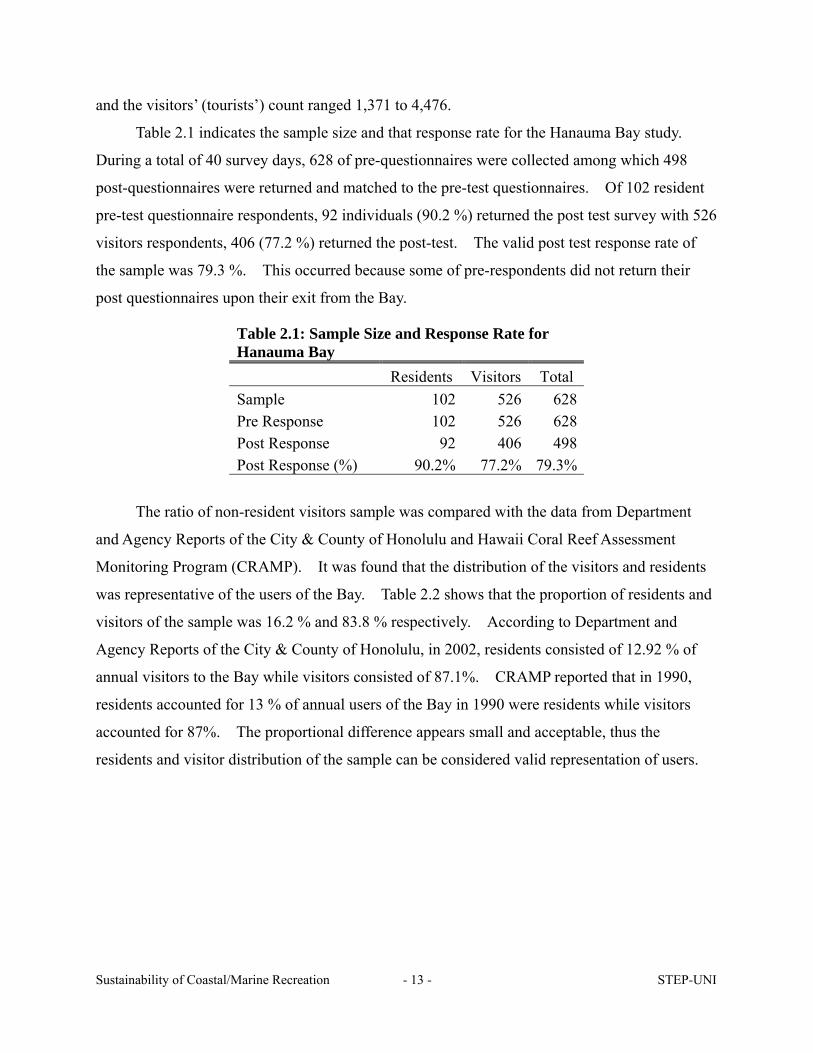
Table 2.1 indicates the sample size and that response rate for the Hanauma Bay study.
During a total of 40 survey days, 628 of pre-questionnaires were collected among which 498
post-questionnaires were returned and matched to the pre-test questionnaires. Of 102 resident
pre-test questionnaire respondents, 92 individuals (90.2 %) returned the post test survey with 526
visitors respondents, 406 (77.2 %) returned the post-test. The valid post test response rate of
the sample was 79.3 %. This occurred because some of pre-respondents did not return their
post questionnaires upon their exit from the Bay.
Table 2.1: Sample Size and Response Rate for Hanauma Bay Residents Visitors Total Sample 102 526 628 Pre Response 102 526 628 Post Response 92 406 498 Post Response (%) 90.2% 77.2% 79.3%
The ratio of non-resident visitors sample was compared with the data from Department
and Agency Reports of the City & County of Honolulu and Hawaii Coral Reef Assessment
Monitoring Program (CRAMP). It was found that the distribution of the visitors and residents
was representative of the users of the Bay. Table 2.2 shows that the proportion of residents and
visitors of the sample was 16.2 % and 83.8 % respectively. According to Department and
Agency Reports of the City & County of Honolulu, in 2002, residents consisted of 12.92 % of
annual visitors to the Bay while visitors consisted of 87.1%. CRAMP reported that in 1990,
residents accounted for 13 % of annual users of the Bay in 1990 were residents while visitors
accounted for 87%. The proportional difference appears small and acceptable, thus the
residents and visitor distribution of the sample can be considered valid representation of users.

Sustainability of Coastal/Marine Recreation - 14 - STEP-UNI
Table 2.2: Residents and Visitor Ratio Comparison of Hanauma Bay Users
Residents Visitors (%) (%)
Sample 16.2 83.8 City & County a 12.9 87.1 CRAMP b 13.0 87.0 a Department and Agency Reports of the City & County of Honolulu (2003) b Hawaii Coral Reef Assessment and Monitoring Program (CRAMP) (1990)
D. Treatment of Data
Scale purification and confirmation began with Cronbach's coefficient alpha for screening
the sample (using corrected item-to-total correlation). For an item to remain in the scale, it
must have an item-to-total correlation of .50 or above (Bearden, Netemeyer, & Teel 1989;
Zaichkowsky 1985). Principal components factorial analysis with oblique rotation was used
because it is believed that the dimensions of the scale will be distinct, but not completely
independent of one another (Bearden et al 1989; Parasuraman, Zeithaml, Berry, 1988; Ruekert &
Churchill, 1984). The minimum coefficient for factor items to remain in the scale will be .30
(Nachmias & Nachmias 1987).

Sustainability of Coastal/Marine Recreation - 15 - STEP-UNI
III. HANAUMA BAY RESULTS AND DISCUSSION

Sustainability of Coastal/Marine Recreation - 16 - STEP-UNI
A. User Characteristics
This section summarizes travel characteristics of Hanauma Bay survey respondents. The
sample was examined in terms of gender and age distribution, residency, and snorkeling skills
and frequencies.
Gender Distribution
Table 3.1 shows the gender distribution of the sample: male comprised of 39.2% of the
sample while female comprised of 57%. Both of the resident and visitor groups had more
females represented (female residents consisted of 57.8% while female visitors consisted of
56.8%). Chi-square value indicates that there is no significant association in gender distribution
between residents and visitors (χ 2 = 0.004, p = 0.952)
Table 3.1: Gender Distribution Total Residents Visitors
N (%) N (%) N (%) χ2 a Prob.
Male 246 39.2 41 40.2 205 39.0 0.004 0.952 Female 358 57.0 59 57.8 299 56.8 No response 24 3.8 2 2.0 22 4.2 Total 628 100.0 102 100.0 526 100.0 a χ2 indicates the Chi-square value, comparing percentages of gender between residents and visitors.
Sustainability of Coastal/Marine Recreation - 17 - STEP-UNI
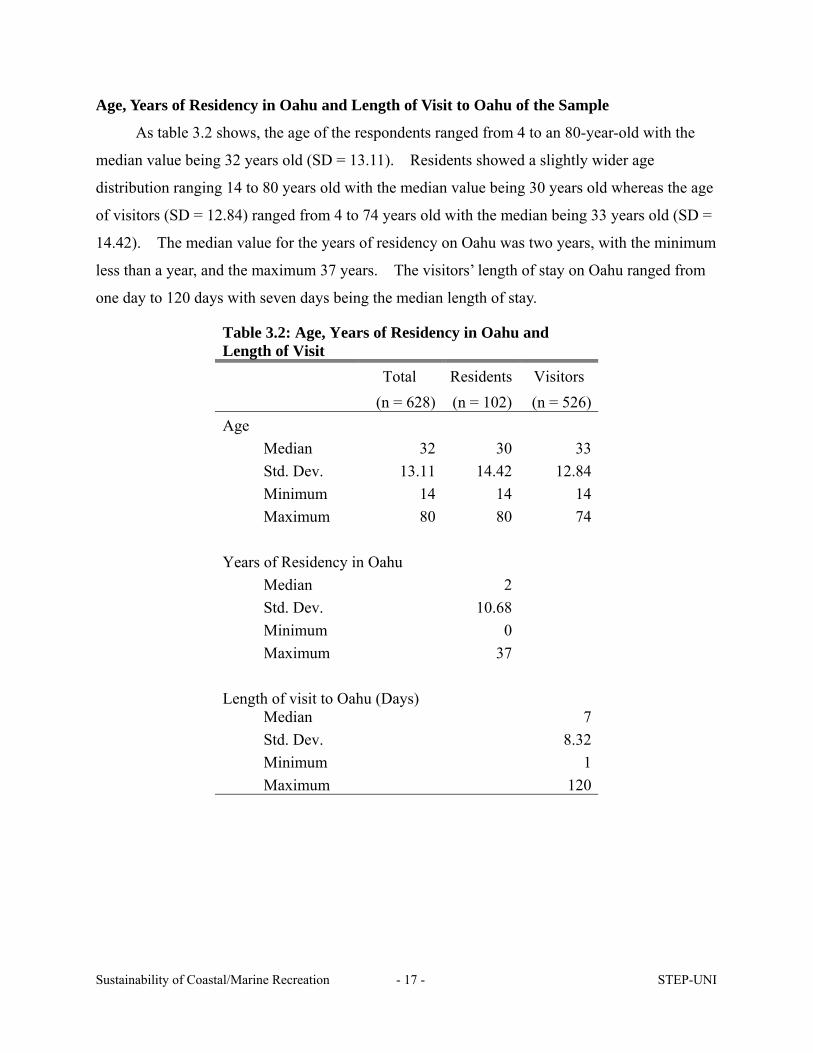
Age, Years of Residency in Oahu and Length of Visit to Oahu of the Sample
As table 3.2 shows, the age of the respondents ranged from 4 to an 80-year-old with the
median value being 32 years old (SD = 13.11). Residents showed a slightly wider age
distribution ranging 14 to 80 years old with the median value being 30 years old whereas the age
of visitors (SD = 12.84) ranged from 4 to 74 years old with the median being 33 years old (SD =
14.42). The median value for the years of residency on Oahu was two years, with the minimum
less than a year, and the maximum 37 years. The visitors’ length of stay on Oahu ranged from
one day to 120 days with seven days being the median length of stay.
Table 3.2: Age, Years of Residency in Oahu and Length of Visit
Total Residents Visitors (n = 628) (n = 102) (n = 526) Age Median 32 30 33 Std. Dev. 13.11 14.42 12.84 Minimum 14 14 14 Maximum 80 80 74 Years of Residency in Oahu Median 2 Std. Dev. 10.68 Minimum 0 Maximum 37 Length of visit to Oahu (Days) Median 7 Std. Dev. 8.32 Minimum 1 Maximum 120

Sustainability of Coastal/Marine Recreation - 18 - STEP-UNI
Residency of Visitors
Table 3.3 shows residency of the sample. More than 80 % of the visitor respondents were
domestic travelers consisting of 38.6 % from the Western U.S., 17.1 % from the Midwest, and
15.6% from the East coast, Canada (6.3 %) and other international countries (4.4 %). Since the
survey was designed only in English, the respondents tended to be from English speaking
regions.
Table 3.3: Residency of Visitors Visitors
State N (%) U.S. West 203 38.6 U.S. Mid West 90 17.1U.S. East 82 15.6 U.S. Mountain 34 6.5 Canada 33 6.3 U.S. South 27 5.1 Other International 23 4.4 No Answer 34 6.5 Total 526 100.0
The distribution of gender, age, and residency of the sample was compared with the U.S.
census data (DBEDT, 2000) and Annual Visitor Research Report (AVRR) from state of Hawaii,
Department of Business, Economic Development, and Tourism (DBEDT, 2002) (Table 3.4).
The sample of residents included 41 % of male and 59 % of female while the census conducted
in 2000 reported more equal distribution (male 49.9% and female 50%). The visitor gender
distribution, on the other hand, appears to be consistent with that of the visitors to Hawaii. The
Annual Visitor Research Report shows the gender distribution of male 46.2% and female 53.8%
while the sample visitors at Hanauma Bay was 40.7 % male and 59.3 % female.
The age of resident respondents is compared with the U.S. census conducted in 2000.
Table 3.4 shows that the age of resident subjects at the Bay is more centered around the 20s
while the census data shows a wider distribution with 35 to 44 years old being a bulge. The
median age was 34 for the sample at the Bay while it was 36.2 for the census. Both of the
visitor sample at the Bay and AVRR show similarities. The visitor sample shows more from 13
to 17 and 18 to 24 years old than the AVRR.
Sustainability of Coastal/Marine Recreation - 19 - STEP-UNI
The residency of the sample appears to be representative of English speaking visitors.
Table 3.4 shows that the sample at Hanauma Bay had the largest proportion of visitors from U.S.
West (45.1%) followed by U.S. East (37.8%), Canada (6.3%) and Europe (2.5%) and all of
which proportion exceeded that of the AVRR. According to the Annual Visitor Research Report,
in 2002, visitors to Hawaii consisted of 38.9% from U.S. West, 24.8% from U.S. East, 23.2%
from Japan, 3.0% from Canada and remaining 10.1% from other nations. The difference in
residency distribution was derived from the survey design conducted only in English: the
respondents tended to be from English speaking regions. Non English speaking visitors
particularly the Japanese visitors require further research. Otherwise, the differences of the
proportional distribution of the English speaking visitors seem to be similar and acceptable.

Sustainability of Coastal/Marine Recreation - 20 - STEP-UNI
Table 3.4: Comparison of Gender, Age, and Residency Distribution Residents (%) Visitors (%)
Sample at HB
U.S. Censusa
Sample at HB AVRRb
Gender Male 41.0 50.2 40.7 46.2 Female 59.0 49.8 59.3 53.8 Age
c <5 0.0 6.5 <13 0.0 12.1
5-9 0.0 7.0 13-17 8.1 5.0 10-14 1.0 6.9 18-24 17.0 10.1 15-19 12.9 6.7 25-40 47.9 30.9 20-24 20.8 6.9 41-59 23.1 28.5 25-34 30.7 14.1 60< 3.9 13.2 35-44 16.8 15.8 45-54 7.9 14.1 55-59 3.0 5.0 60-64 2.0 3.8 65-74 3.0 7.0 75-84 2.0 4.8 85< 0.0 1.4 Median 32.0 36.2 Residency U.S. West d 45.1 38.9 U.S. East d 37.8 24.8 Japan 0.0 23.2 Canada 6.3 3.0 Europe 2.5 1.7 Oceania 1.5 1.7 Other Asia 0.2 1.7 Latin America 0.2 0.2 Others 0.0 4.7 a Source: Census 2000 b Source: Annual Visitor Research Report (2002). State of Hawaii, Department of Business, Economic Development and Tourism (DBEDT) c The median value for sample at Hanauma Bay was 34.0 while 36.2 for U.S. Census data

Sustainability of Coastal/Marine Recreation - 21 - STEP-UNI
d U.S. West includes U.S. west coast and mountain states and the rest are categorized as U.S. East (DBEDT)
Snorkeling Skills and Frequency to Snorkel
Snorkeling appeared to be a major activities selected by the Bay users to see marine life.
Given this site attribute, a rental service for snorkeling is available within the Bay and is the only
facility providing such services. The sample of residents reported higher skills and frequency
of snorkeling than visitors.
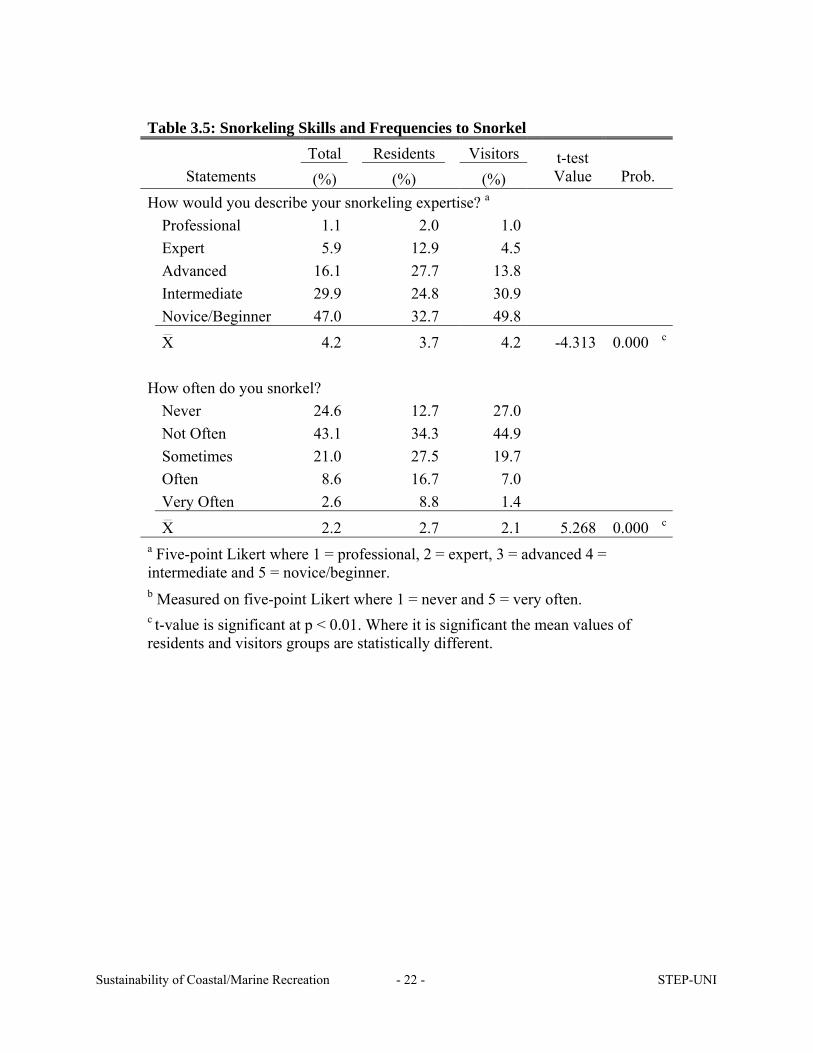
The degree of the snorkeling expertise of the sample was measured on five-point
Likert-type scale where 1 = professional, 2 = expert, 3 = advanced, 4 = intermediate and 5 =
novice / beginner. Table 3.5 indicates the sample’s snorkeling skills and expertise in snorkeling.
Forty seven percent of the sample said they were novice / beginner snorkelers. More visitors
(49.8 %) than residents (32.7 %) reported their skills as novice / beginner. The majority of all
sampled considered their snorkeling skill as being less than intermediate. In fact, the mean
value of the entire sample’s expertise was 4.2 (i.e., novice / beginner - intermediate). The
sample of residents were found to be more experienced in snorkeling with mean value of 3.7 (i.e.,
intermediate – advanced) while visitors’ mean value for experience was 4.2 (i.e., novice /
beginner - intermediate). The mean values of these two groups were statistically different (t = -
4.313, p = .000).
The frequency of snorkeling was measured on a five-point Likert scale with 1 = never and
5 = very often. Nearly half of the total sample reported their frequencies of snorkeling as being
not often (43.1%), followed by never (24.6 %) and sometimes (21 %). The mean value of the
sample total respondents was 2.2 (i.e., not often to sometimes). Residents of the sample
indicated higher frequencies of snorkeling: residents achieved the mean of 2.7 while visitors
achieved 2.1. The mean values of these two groups mean were also significantly different (t =
6.268, p = .000).
Sustainability of Coastal/Marine Recreation - 22 - STEP-UNI
Table 3.5: Snorkeling Skills and Frequencies to Snorkel
Total Residents Visitors Statements (%) (%) (%)
t-test Value Prob.
How would you describe your snorkeling expertise? a Professional 1.1 2.0 1.0 Expert 5.9 12.9 4.5 Advanced 16.1 27.7 13.8 Intermediate 29.9 24.8 30.9 Novice/Beginner 47.0 32.7 49.8 X
__
4.2 3.7 4.2 -4.313 0.000 c
How often do you snorkel? Never 24.6 12.7 27.0 Not Often 43.1 34.3 44.9 Sometimes 21.0 27.5 19.7 Often 8.6 16.7 7.0 Very Often 2.6 8.8 1.4 X
__
2.2 2.7 2.1 5.268 0.000 c
a Five-point Likert where 1 = professional, 2 = expert, 3 = advanced 4 = intermediate and 5 = novice/beginner. b Measured on five-point Likert where 1 = never and 5 = very often. c t-value is significant at p < 0.01. Where it is significant the mean values of residents and visitors groups are statistically different.
Sustainability of Coastal/Marine Recreation - 23 - STEP-UNI
B. Knowledge of and Evaluation of Hanauma Bay
This section summarizes users’ knowledge of and evaluation of the Bay. Knowledge is
examined in terms of information known about the Bay, sources of influence to decide visitation,
planned activity ranking, previous visitation, and familiarity with the Bay. The evaluation
includes hours and money spent at the Bay, and perceptions of the environmental condition of
the site.
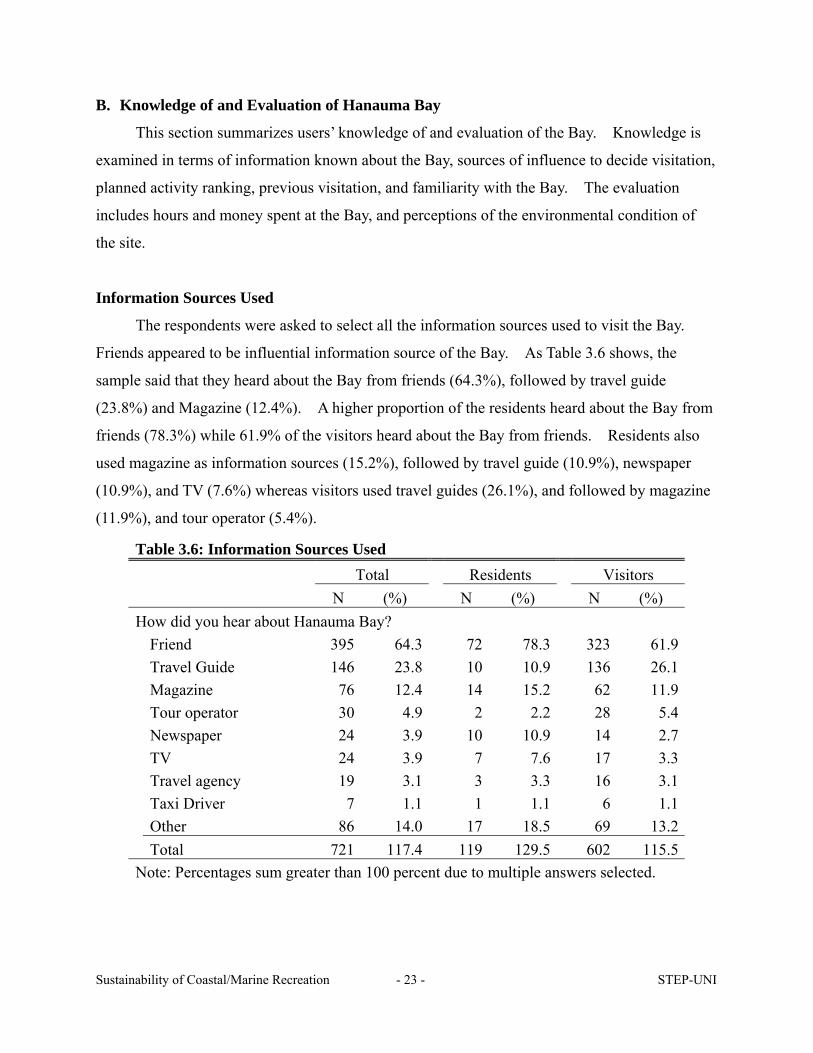
Information Sources Used
The respondents were asked to select all the information sources used to visit the Bay.
Friends appeared to be influential information source of the Bay. As Table 3.6 shows, the
sample said that they heard about the Bay from friends (64.3%), followed by travel guide
(23.8%) and Magazine (12.4%). A higher proportion of the residents heard about the Bay from
friends (78.3%) while 61.9% of the visitors heard about the Bay from friends. Residents also
used magazine as information sources (15.2%), followed by travel guide (10.9%), newspaper
(10.9%), and TV (7.6%) whereas visitors used travel guides (26.1%), and followed by magazine
(11.9%), and tour operator (5.4%).
Table 3.6: Information Sources Used Total Residents Visitors N (%) N (%) N (%)
How did you hear about Hanauma Bay? Friend 395 64.3 72 78.3 323 61.9 Travel Guide 146 23.8 10 10.9 136 26.1 Magazine 76 12.4 14 15.2 62 11.9 Tour operator 30 4.9 2 2.2 28 5.4 Newspaper 24 3.9 10 10.9 14 2.7 TV 24 3.9 7 7.6 17 3.3 Travel agency 19 3.1 3 3.3 16 3.1 Taxi Driver 7 1.1 1 1.1 6 1.1 Other 86 14.0 17 18.5 69 13.2 Total 721 117.4 119 129.5 602 115.5 Note: Percentages sum greater than 100 percent due to multiple answers selected.

Sustainability of Coastal/Marine Recreation - 24 - STEP-UNI
Sources of Influence on Decision Making to Visit Hanauma Bay
Knowledge of the sources of influence on decision making to visit the Bay may be useful
for effective marketing/de-marketing of the Bay. The result indicates that word of mouth
generated through family/friends and recommendation is a primary source of deciding visitation,
and thus, it should be kept in mind that it can be influential method to market/de-market the Bay.
While family/friends and personal reasons seem to have more influence on residents’ decision to
visit the Bay, visitors’ decision seem to be more influenced by recommendation, advertisement,
tour operators and tour packages.
The respondents were asked to indicate all the sources which influence their decision
making to visit the Bay. As shown in Table 3.7., the major sources of influence on decision
making to visit the Bay were: family/friends (53.0%); followed by recommendations (29.7%);
and personal reasons (21.0%). The residents’ proportion was greater than that of visitors on
family/friends (residents = 64.0%, visitors = 50.9%) and personal reasons (residents = 27.0%,
visitors = 19.9%). On the other hand, a larger proportion of the visitors than residents indicated
that the most influential sources to decide their visitation was recommendations from hotels and
others (residents = 23.0%, visitors = 31.0%) advertisement, (residents = 4.0%, visitors = 10.1%)
tour operators (residents = 1.0%, visitors = 2.9%) and tour packages (residents = 1.0%, visitors =
2.7%).
Table 3.7: Sources of Influence on Decision Making to Visit Hanauma Bay Total Residents Visitors
N (%) N (%) N (%) What most influenced your decision to visit Hanauna Bay Family/friends 330 53.0 64 64.0 266 50.9 Recommendation 185 29.7 23 23.0 162 31.0 Personal reasons 131 21.0 27 27.0 104 19.9 Advertisements 57 9.1 4 4.0 53 10.1 Tour operator 16 2.6 1 1.0 15 2.9 Tour package 14 2.2 1 1.0 13 2.5 Other 79 12.7 15 15.0 64 12.2 Total 733 117.6 120 120.0 613 117.3 Note: Percentages sum greater than 100 percent due to multiple answers selected.
Sustainability of Coastal/Marine Recreation - 25 - STEP-UNI
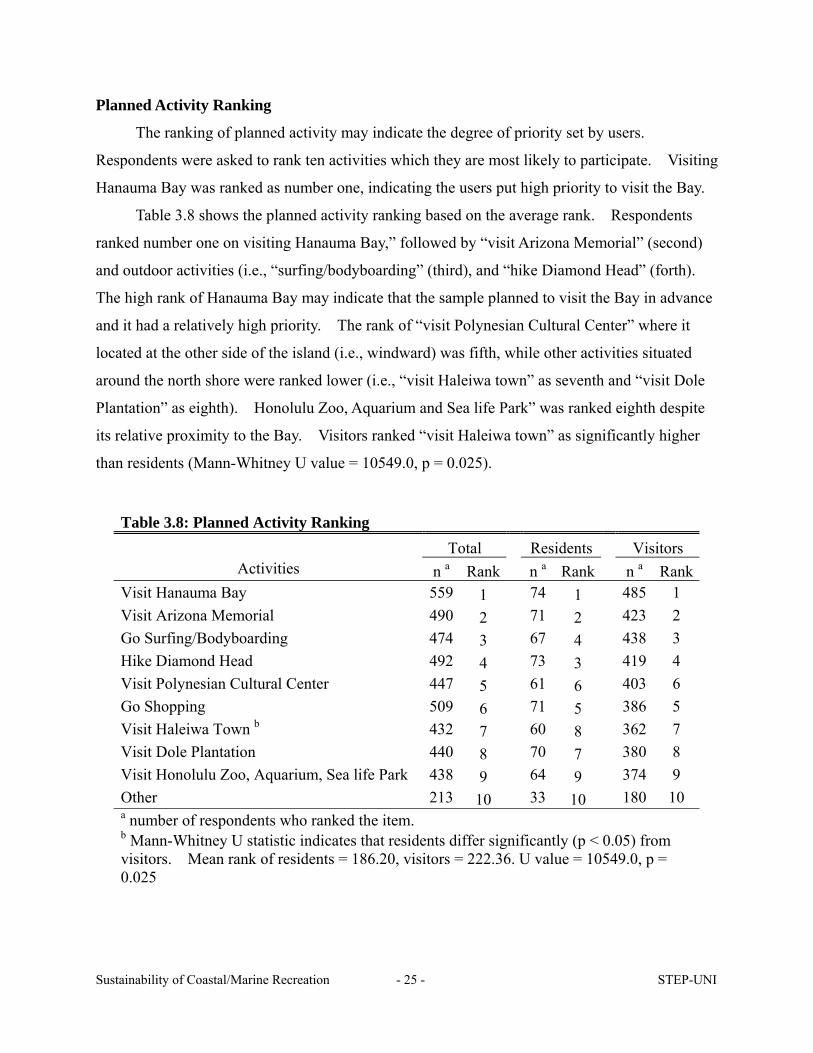
Planned Activity Ranking
The ranking of planned activity may indicate the degree of priority set by users.
Respondents were asked to rank ten activities which they are most likely to participate. Visiting
Hanauma Bay was ranked as number one, indicating the users put high priority to visit the Bay.
Table 3.8 shows the planned activity ranking based on the average rank. Respondents
ranked number one on visiting Hanauma Bay,” followed by “visit Arizona Memorial” (second)
and outdoor activities (i.e., “surfing/bodyboarding” (third), and “hike Diamond Head” (forth).
The high rank of Hanauma Bay may indicate that the sample planned to visit the Bay in advance
and it had a relatively high priority. The rank of “visit Polynesian Cultural Center” where it
located at the other side of the island (i.e., windward) was fifth, while other activities situated
around the north shore were ranked lower (i.e., “visit Haleiwa town” as seventh and “visit Dole
Plantation” as eighth). Honolulu Zoo, Aquarium and Sea life Park” was ranked eighth despite
its relative proximity to the Bay. Visitors ranked “visit Haleiwa town” as significantly higher
than residents (Mann-Whitney U value = 10549.0, p = 0.025).
Table 3.8: Planned Activity Ranking Total Residents Visitors
Activities n a Rank n a Rank n a RankVisit Hanauma Bay 559 1 74 1 485 1 Visit Arizona Memorial 490 2 71 2 423 2 Go Surfing/Bodyboarding 474 3 67 4 438 3 Hike Diamond Head 492 4 73 3 419 4 Visit Polynesian Cultural Center 447 5 61 6 403 6 Go Shopping 509 6 71 5 386 5 Visit Haleiwa Town b 432 7 60 8 362 7 Visit Dole Plantation 440 8 70 7 380 8 Visit Honolulu Zoo, Aquarium, Sea life Park 438 9 64 9 374 9 Other 213 10 33 10 180 10 a number of respondents who ranked the item. b Mann-Whitney U statistic indicates that residents differ significantly (p < 0.05) from visitors. Mean rank of residents = 186.20, visitors = 222.36. U value = 10549.0, p = 0.025

Sustainability of Coastal/Marine Recreation - 26 - STEP-UNI
Previous Visitation
Almost half of the sample has visited the Bay in the past. More residents than visitors
visited the Bay before, and those residents indicated a relatively recent visitation. Table 3.9
shows that 44.6% of the sample was repeat users while 55.4% visited the Bay for the first time.
More residents indicated repeat visit (83.8%), while 37.1% of the visitors were repeaters (χ2 =
73.521, p = 0.000). Considering residents’ close proximity to the bay, it is plausible that more
residents visited the Bay before.
The year of the previous visit ranged from 1970 to 2002. Among the sample indicated
repeat visit, 45.4% said that they visited the Bay in 2000 to 2002, followed by 1990 to 1999
(38.9%), and 1980 to 1990 (12.5%) with the median of 1999. Residents reported more recent
visitation than visitors: 78.9% of the residents visited the Bay in 2000 to 2002 and in 1990 to
1999 (19.3%) with the median of 2001 while 33.3% of the repeat visitors came to the Bay in
2000 to 2002, in 1990 to 1999 (45.9%), and in 1980 to 1989 (12.5%) with the median of 1997.
Visitors’ last year of visit was more widely distributed ranging from 1970 to 2002 while that of
residents’ ranged from 1975 to 2002.
Table 3.9 : Previous Visitation Total Residents Visitors
N (%) N (%) N (%) Have you visited Hanauma Bay before? a Yes 278 44.6 83 83.8 195 37.1 No 346 55.4 16 16.2 330 62.9 What year was your last visit? (Year) 2000 to 2002 98 45.4 45 78.9 53 33.3 1990 to 1999 84 38.9 11 19.3 73 45.9 1980 to 1989 27 12.5 0 0.0 27 17.0 1970 to 1979 7 3.2 1 1.8 6 3.8 n 216 57 159 Median 1999 2001 1997 a Chi-square value is significant at p < 0.01. Where it is significant, residents have lenear association with visitors. χ2 = 73.521, p = 0.000

Sustainability of Coastal/Marine Recreation - 27 - STEP-UNI
Familiarity with Hanauma Bay
Table 3.10 indicates the respondents’ familiarity with the Bay. Respondents were asked
to mark their degree of the familiarity with the Bay on the five-point Likert where one being not
at all familiar to five being extremely familiar. Slightly more than half of the sample indicated
that they were not at all familiar (34.4%) or not very familiar (18.8%), while 23.9% said
somewhat familiar, familiar (17.0%) and extremely familiar (5.6%) with the mean value 2.4 (not
very familiar to somewhat familiar).
Residents reported more familiarity with the Bay: 37.3% said they were familiar, followed
by somewhat familiar (23.7%) and extremely familiar (15.7%) with the mean value of 3.4
(somewhat familiar to familiar). On the other hand, 39.3% of the visitors said that they are not
at all familiar with the Bay, followed by somewhat familiar (23.7%), not very familiar (20.2%),
familiar (13.2%) and extremely familiar (3.6%) with the mean value of 2.2 (not very familiar to
somewhat familiar). Residents were found to be more familiar with the Bay: the mean
difference of two groups was found to be significant (t = 8.939, p = .000).
Table 3.10: Familiarity of Hanauma Bay Total Residents Visitors
(%) (%) (%) How familiar are you with Hanauma Bay? a Not at all familiar 34.4 9.8 39.3 Not very familiar 18.8 11.8 20.2 Somewhat familiar 23.9 25.5 23.7 Familiar 17.0 37.3 13.2 Extremely familiar 5.6 15.7 3.6
X__
b 2.4 3.4 2.2 a Five-point Likert where 1 = not at all familiatr and 5 = extremely familiar. b T-value is significant at p < 0.01. Where it is significant the mean values of residents and visitors groups are statistically different. t = 8.939, p = 0.000

Sustainability of Coastal/Marine Recreation - 28 - STEP-UNI
Length of Hours and Money Spent at Hanauma Bay
Respondents were asked to indicate the number of hours spent at the Bay and amount of
money spent for rentals / purchase. Table 3.11 shows the length of hours spent at Hanauma Bay.
The total sample spent an average of 2.7 hours in the Bay. Residents spent 2.6 hours, while
visitors spent 2.8 hours. There are no significant mean differences between residents and
visitors regarding with the hours spent at the Bay (t = -1.306, p = 0.192).
Table 3.11 : Length of Hours Spent at Hanauma Bay
Total Residents Visitors (n = 498) (n = 92) (n = 406)
Approximately how long was your visit today at Hanauma Bay? X
__
a 2.7 2.6 2.8 Std. Dev. 1.08 1.10 1.07 Minimum 0 1 0 Maximum 8 8 6a t = -1.306, p = 0.192. The mean value of residents is not statistically different than that of visitors.
Of the 498 samples who returned the post questionnaires, 230 individuals (residents: n =
16, visitors: n = 214) indicated rented equipment and 34 subjects (residents: n = 8, visitors: n =
26) purchased equipment for the day experience at the Bay (see Table 3.12). The amount of
money spent for rentals ranged from one to forth five dollars with a median of nine dollars spent
(SD = 8.89). While residents’ spending for rentals ranged from one to eighteen dollars (SD =
5.83, median of 5 dollars), visitors rentals ranged from one to forty five dollars (SD = 9.02,
median of 9 dollars). The total amount of money spent for purchase in equipment ranged from
2 to 300 dollars (median of 4.5 dollars). Residents’ spending on purchases ranged from 2 to
100 dollars (SD = 33.91, median of 2 dollars), while visitors spent 2 to 300 dollars (SD = 57.91,
median of nine dollars).
The total sample appeared to spend several hours at the Bay. Although visitors seem to
spend slightly longer hours than residents, the differences between the two groups are not
significantly different. Visitors spend more money than residents and their range of spending

Sustainability of Coastal/Marine Recreation - 29 - STEP-UNI
was wider than that of residents.
Table 3.12: Money Spent at Hanauma Bay
Total Residents Visitors (n = 498) (n = 92) (n = 406)
Did you rent or purchase any equipment for your visit today? Rent n 230 16 214 Median 9 5 9 Std. Dev. 8.89 5.83 9.02 Minimum 1 1 1 Maximum 45 18 45 Purchase n 34 8 26 Median 4.5 2.0 6.0 Std. Dev. 52.78 33.91 57.90 Minimum 2 2 2 Maximum 300 100 300
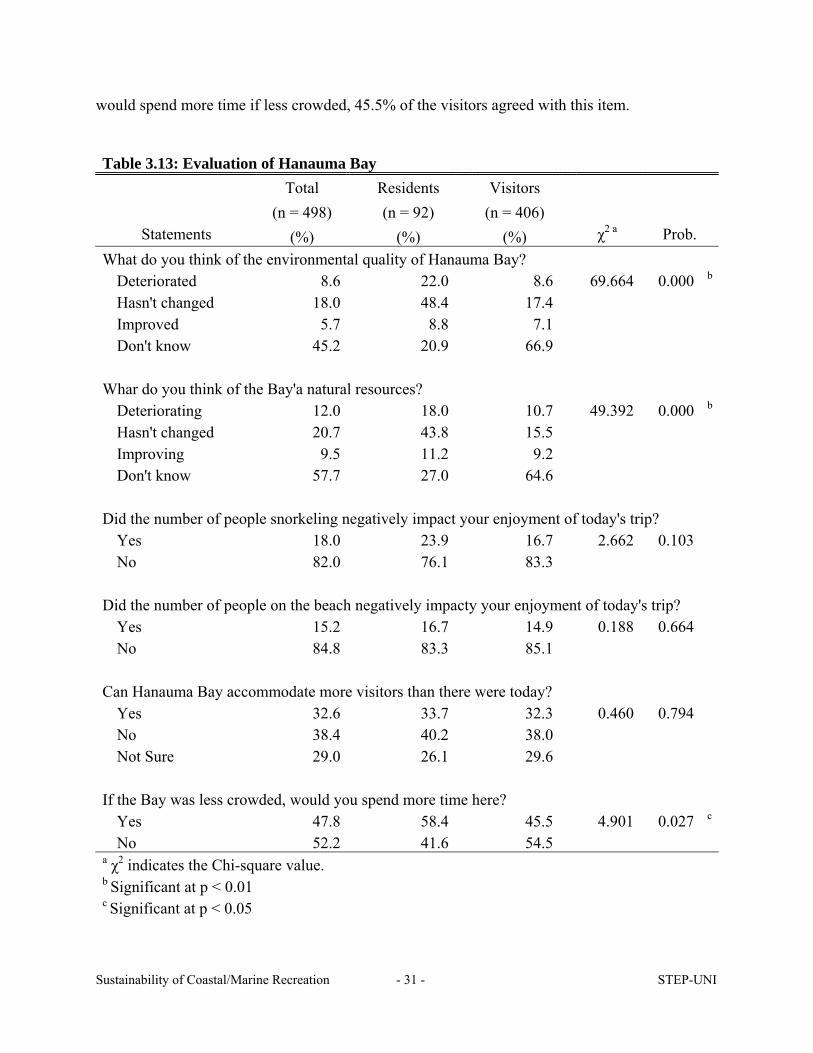
User Evaluation of Hanauma Bay
Table 3.13 lists the overall evaluation of Hanauma Bay according to the users. In the
post-test questionnaire, respondents were asked to evaluate the following items: environmental
quality of the Bay; the quality of natural resources; negative impact from the number of people
snorkeling and the number of people on the beach; capacity of the Bay; and willingness to spend
more time if it was less crowded.
With regard to the environmental quality of the Bay, almost half of the respondents (45.2%)
said “don’t know,” followed by “hasn’t changed” (18.0%), “deteriorated” (8.6%), and
“improved,” (5.7%). Similarly, 57.7% of the sample evaluated the improvement of natural
resources as “don’t know,” followed by “hasn’t changed” (20.7%), “deteriorating” (12.0%), and
“improved” (9.5%). In both items, the proportion of respondents evaluated the
environment/natural resources as deteriorated as opposed to them being improved. The
relatively large proportion of don’t know response is plausible considering more than half of the
visitors which comprised of 84.8% of the sample were fist time visitors. They might not be
Sustainability of Coastal/Marine Recreation - 30 - STEP-UNI
able to evaluate environmental changes over time.
Overall, residents of the sample appeared to be more sensitive to or aware of the
environmental quality and natural resources than visitors (χ2 = 69.664, p = 0.000). Almost half
of the residents (48.4%) indicated the environmental quality has not changed, followed by
deteriorated (22%), don’t know (20.9%) and improved (8.8%). On the other hand, 66.9% of the
visitors said they did not know about the changes in the environment, and among the remaining
visitors 17.4% said it hasn’t changed, 8.6% said improved, and 7.1% said deteriorated.
Residents indicated that the quality of natural resources has not changed (43.8%), followed
by deteriorating (18.0%), don’t know (27.0%) and improving (11.2%). On the other hand,
64.6% of the visitors said they did not know about the changes in the environment, and among
the remaining visitors 15.5% said it hasn’t changed, 10.7% said deteriorating, and 9.2% said
improved. The “don’t know” proportion appeared to be greatly different between residents and
visitors. Given the sample visitors’ relative unfamiliarity with the bay, it is likely that they were
less aware of the changes in the environmental quality of the Bay.
Eighteen percent of the total sample reported negative experience due to the number of
people snorkeling. Likewise, 15.2% of the sample reported negative experiences from the
number of people on the beach. A higher proportion of residents reported negative influence
from number of people snorkeling (23.9%) than visitors (16.7%) and negative influences from
number of people on the beach (16.7%) than visitors (14.9%). Neither of which, however
achieved significant linear association between the two groups.
Although a relatively small proportion of the sample indicated negative influence from the
number of the people snorkeling or at the beach, more concern was expressed regarding the
accommodation capacity of the Bay. For the question regarding the capacity of the Bay, 38.4 %
said that the Bay cannot accommodate more visitors than there were today, while 32.6% said it
can and 29.0% was not sure. There are no significant associations between residents and
visitors. While 33.7 % of the residents agreed the Bay can accommodate more users that
particular day, 40.2% disagreed and 26.1% said not sure, 32.3% of the visitors agreed the Bay
can accommodate more users than the particular day, 38.0% disagreed and 29.6% said not sure.
Interestingly, 47.8% of the sample said that they would spend more time at the bay if it
was less crowded. The sample of residents showed a stronger preference of staying longer if
less crowded than visitors (χ2 = 4.901, p = 0.027). While 58.4% of the residents said they
Sustainability of Coastal/Marine Recreation - 31 - STEP-UNI
would spend more time if less crowded, 45.5% of the visitors agreed with this item.
Table 3.13: Evaluation of Hanauma Bay Total Residents Visitors
(n = 498) (n = 92) (n = 406) Statements (%) (%) (%) χ2 a Prob.
What do you think of the environmental quality of Hanauma Bay? Deteriorated 8.6 22.0 8.6 69.664 0.000 b
Hasn't changed 18.0 48.4 17.4 Improved 5.7 8.8 7.1 Don't know 45.2 20.9 66.9 Whar do you think of the Bay'a natural resources? Deteriorating 12.0 18.0 10.7 49.392 0.000 b
Hasn't changed 20.7 43.8 15.5 Improving 9.5 11.2 9.2 Don't know 57.7 27.0 64.6 Did the number of people snorkeling negatively impact your enjoyment of today's trip? Yes 18.0 23.9 16.7 2.662 0.103 No 82.0 76.1 83.3 Did the number of people on the beach negatively impacty your enjoyment of today's trip? Yes 15.2 16.7 14.9 0.188 0.664 No 84.8 83.3 85.1 Can Hanauma Bay accommodate more visitors than there were today? Yes 32.6 33.7 32.3 0.460 0.794 No 38.4 40.2 38.0 Not Sure 29.0 26.1 29.6 If the Bay was less crowded, would you spend more time here? Yes 47.8 58.4 45.5 4.901 0.027 c
No 52.2 41.6 54.5 a χ2 indicates the Chi-square value. b Significant at p < 0.01 c Significant at p < 0.05

Sustainability of Coastal/Marine Recreation - 32 - STEP-UNI
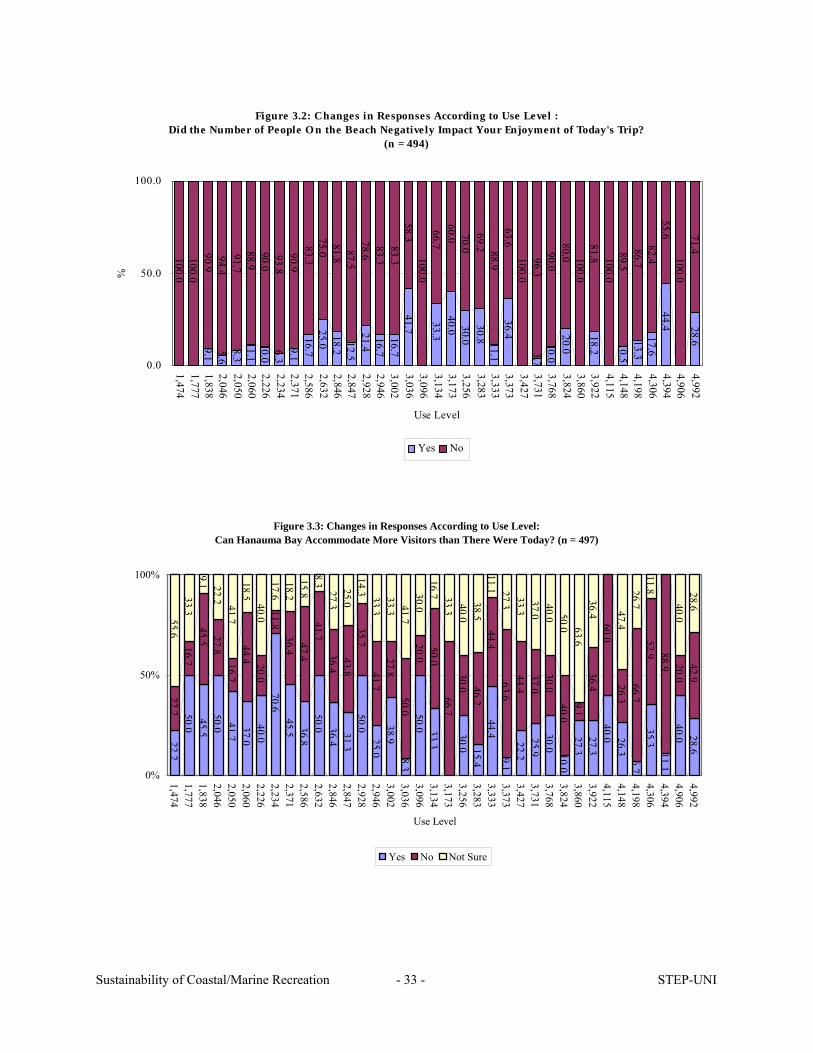
Figures 3.1 to 3.4 display graphic percentage of changes in responses according to the use
level. Appendix Figures 6.1 to 6.4 display the graphic percentage of these findings according to
the use level by 500. The survey asked to indicate whether or not the number of people
snorkeling negatively influenced users’ enjoyment. Figure 3 shows that the sample reported
more negative influence from the number of snorkelers as the use level increased, particularly at
the use level of over 3400 (r = -.189, p < .01) (see Tables 6.1, 6.1.2, & 6.1.3 in Appendix for
item-to-item correlation). The survey also asked whether or not the number of people on the
beach negatively influenced users’ enjoyment of the day. Figure 3.2 indicates that percentage
of “yes” rose greatly around the use level of over 3000 (r = -073, p > .05). For the question
about the capacity of the Bay, respondents appear to indicate that the Bay cannot accommodate
more user as with the increase of the use level (Figure 3.3). More respondents said that they
would spend more time there if less crowded as the use level rose (r = -120, p < .01) (Figure 3.4).
Figure 3.1: Changes in Responses According to Use Level:Did the Number of People Snorkeling Negatively Impact Your Enjoyment of Today's Trip? (n = 494)
9.1 5.625.0 11.1
20.0 11.8 9.121.1 16.7 9.1
12.521.4 16.7 11.1 8.3
9.120.0
30.0 23.1
36.455.6
11.110.0
40.0 27.360.0
15.835.7 29.4
55.610.0
50.0
100.0100.0
90.994.4
75.0 88.980.0 88.2
90.978.9 83.3 90.9
87.578.6 83.3 88.9
91.7 100.090.9
80.070.0 76.9
100.063.6
44.488.990.0
60.0100.0
72.740.0
84.264.3 70.6
44.490.0
50.0
0
50
100
1,4741,7771,8382,0462,0502,0602,2262,2342,3712,5862,6322,8462,8472,9282,9463,0023,0363,0963,1343,1733,2563,2833,3333,3733,4273,7313,7683,8243,8603,9224,1154,1484,1984,3064,3944,9064,992
Use Level
%
Yes No
Sustainability of Coastal/Marine Recreation - 33 - STEP-UNI
Figure 3.2: Changes in Responses According to Use Level :Did the Number of People O n the Beach Negatively Impact Your Enjoyment of Today's Trip?
(n = 494)
9.1 5.68.3
11.110.0
6.39.1
16.725.0
18.212.5
21.416.716.7
41.7 33.340.0 30.0
30.8 11.136.4
3.710.0
20.0
18.2 10.513.3
17.644.4 28.6
100.0100.0
90.994.491.7
88.990.093.890.9
83.375.0
81.887.5
78.683.383.3
58.3100.0
66.760.0 70.0
69.2 88.963.6
100.096.3
90.080.0 100.081.8 100.0
89.586.7
82.455.6
100.071.4
0.0
50.0
100.0
1,4741,7771,8382,0462,0502,0602,2262,2342,3712,5862,6322,8462,8472,9282,9463,0023,0363,0963,1343,1733,2563,2833,3333,3733,4273,7313,7683,8243,8603,9224,1154,1484,1984,3064,3944,9064,992
Use Level
%
Yes No
Figure 3.3: Changes in Responses According to Use Level:Can Hanauma Bay Accommodate More Visitors than There Were Today? (n = 497)
22.250.045.5
50.0 41.737.0
40.070.6
45.5 36.850.0 36.4
31.350.0
25.038.9
8.350.0 33.3
30.0 15.444.4
9.122.2
25.930.0 10.027.327.3
40.0 26.36.7
35.311.1
40.0 28.6
22.216.7
45.5 27.816.7
44.4 20.011.8
36.447.4
41.736.443.8
35.741.7
27.850.0
20.050.0
66.730.0 46.2
44.463.6
44.437.030.0
40.09.1
36.460.0
26.366.7
52.9 88.9 20.042.9
55.633.3
9.1 22.2 41.718.5
40.017.618.215.8
8.327.325.0
14.3 33.333.3 41.7
30.016.7 33.3 40.0
38.511.1 27.3
33.337.040.0 50.0 63.6
36.4 47.426.7
11.8
40.028.6
0%
50%
100%
1,4741,7771,8382,0462,0502,0602,2262,2342,3712,5862,6322,8462,8472,9282,9463,0023,0363,0963,1343,1733,2563,2833,3333,3733,4273,7313,7683,8243,8603,9224,1154,1484,1984,3064,3944,9064,992
Use Level
Yes No Not Sure

Sustainability of Coastal/Marine Recreation - 34 - STEP-UNI
Figure 3.4: Changes in Responses According to Use Level:If the Bay was Less Crowded, Would You Spend More Time Here? (n = 485)
44.416.7
63.623.5
41.740.7
50.021.4
50.057.958.3
81.843.8
57.133.3
50.050.0
20.045.5
60.055.6
30.850.0
63.6 44.440.7 22.240.0
63.672.7
40.057.9
66.7 47.188.9
50.064.3
55.683.3
36.476.5
58.359.3
50.078.6
50.042.141.7
18.256.3
42.966.7
50.050.0
80.054.5
40.044.4
69.250.0
36.4 55.659.3 77.860.0
36.427.3
60.042.1
33.3 52.911.1
50.035.7
0.0
50.0
100.0
1,4741,7771,8382,0462,0502,0602,2262,2342,3712,5862,6322,8462,8472,9282,9463,0023,0363,0963,1343,1733,2563,2833,3333,3733,4273,7313,7683,8243,8603,9224,1154,1484,1984,3064,3944,9064,992
Use Level
%
Yes No
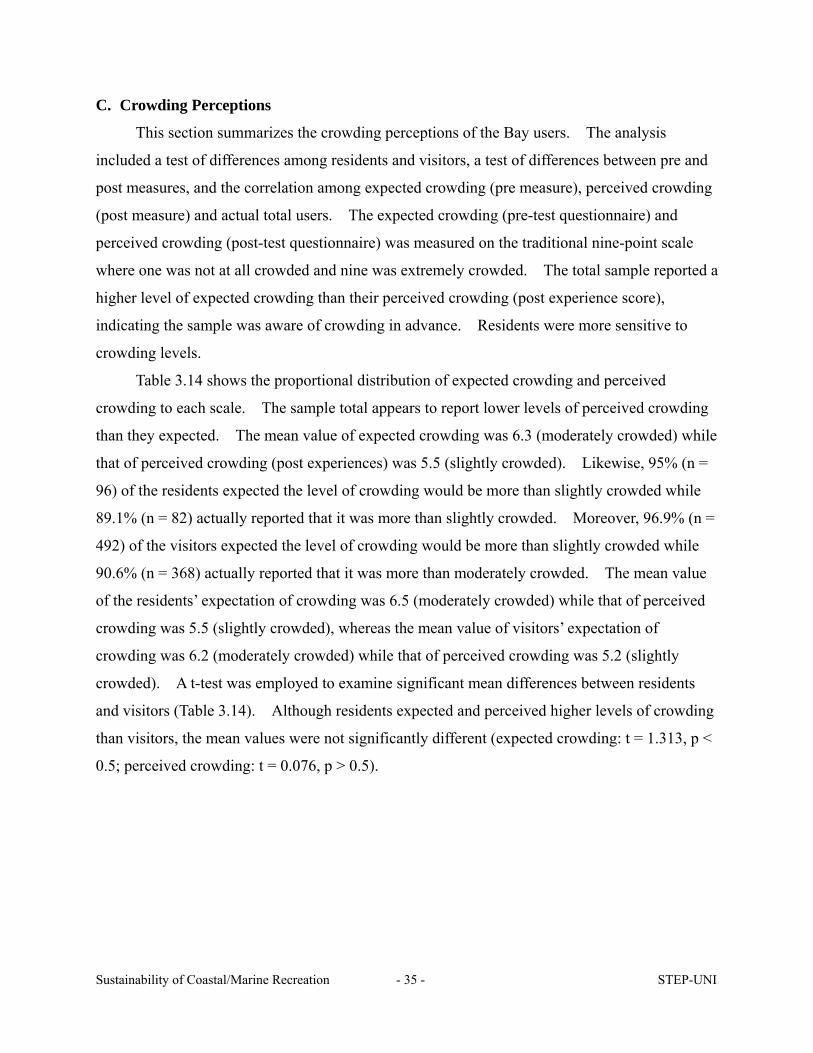
Sustainability of Coastal/Marine Recreation - 35 - STEP-UNI
C. Crowding Perceptions
This section summarizes the crowding perceptions of the Bay users. The analysis
included a test of differences among residents and visitors, a test of differences between pre and
post measures, and the correlation among expected crowding (pre measure), perceived crowding
(post measure) and actual total users. The expected crowding (pre-test questionnaire) and
perceived crowding (post-test questionnaire) was measured on the traditional nine-point scale
where one was not at all crowded and nine was extremely crowded. The total sample reported a
higher level of expected crowding than their perceived crowding (post experience score),
indicating the sample was aware of crowding in advance. Residents were more sensitive to
crowding levels.
Table 3.14 shows the proportional distribution of expected crowding and perceived
crowding to each scale. The sample total appears to report lower levels of perceived crowding
than they expected. The mean value of expected crowding was 6.3 (moderately crowded) while
that of perceived crowding (post experiences) was 5.5 (slightly crowded). Likewise, 95% (n =
96) of the residents expected the level of crowding would be more than slightly crowded while
89.1% (n = 82) actually reported that it was more than slightly crowded. Moreover, 96.9% (n =
492) of the visitors expected the level of crowding would be more than slightly crowded while
90.6% (n = 368) actually reported that it was more than moderately crowded. The mean value
of the residents’ expectation of crowding was 6.5 (moderately crowded) while that of perceived
crowding was 5.5 (slightly crowded), whereas the mean value of visitors’ expectation of
crowding was 6.2 (moderately crowded) while that of perceived crowding was 5.2 (slightly
crowded). A t-test was employed to examine significant mean differences between residents
and visitors (Table 3.14). Although residents expected and perceived higher levels of crowding
than visitors, the mean values were not significantly different (expected crowding: t = 1.313, p <
0.5; perceived crowding: t = 0.076, p > 0.5).
Sustainability of Coastal/Marine Recreation - 36 - STEP-UNI
Table 3.14: Descriptive Statistic of Expected Crowding and Perceived Crowding
Total Residents Visitors Statement a N (%) N (%) N (%)
Pre-test: How crowded do you think it will be today at Hanauma Bay? b Not at all crowded 7 1.1 1 1.0 6 1.2 14 2.3 4 4.0 10 2.0 Slightly crowded 77 12.6 9 8.9 68 13.4 17 2.8 3 3.0 14 2.8 53 8.7 7 6.9 46 9.1 Moderately crowded 128 21.0 16 15.8 112 22.0 128 21.0 26 25.7 102 20.1 94 15.4 16 15.8 78 15.4 Extremely crowded 91 14.9 19 18.8 72 14.2 Post-test: How crowded was it today at Hanauma Bay? c Not at all crowded 24 4.8 5 5.4 19 4.7 24 4.8 5 5.4 19 4.7 Slightly crowded 60 12.0 10 10.9 50 12.3 32 6.4 5 5.4 27 6.7 53 10.6 9 9.8 44 10.8 Moderately crowded 129 25.9 27 29.3 102 25.1 118 23.7 15 16.3 103 25.4 47 9.4 15 16.3 32 7.9 Extremely crowded 11 2.2 1 1.1 10 2.5 a Nine-point Likert where 1 = not at all crowded and 9 = extremely crowded. b Total X
__
= 6.3; residents X__
= 6.5; visitors X__
= 6.2. The mean value of residents is not statistically different than that of visitors. t = 1.313, p = 0.193. c Total X
__
= 5.5; residents X__
= 5.5; visitors X__
= 5.2. The mean value of residents is not statistically different than that of visitors. t = 0.076, p = 0.940.
A paired-t test was conducted to test mean differences between pre and post-test
perceptions of crowding. As Table 3.15 shows, the sample expected a higher level of crowding
than they perceived (t = 6.519, p = 0.000). Table 3.15.2 indicates the paired-t test of pre and
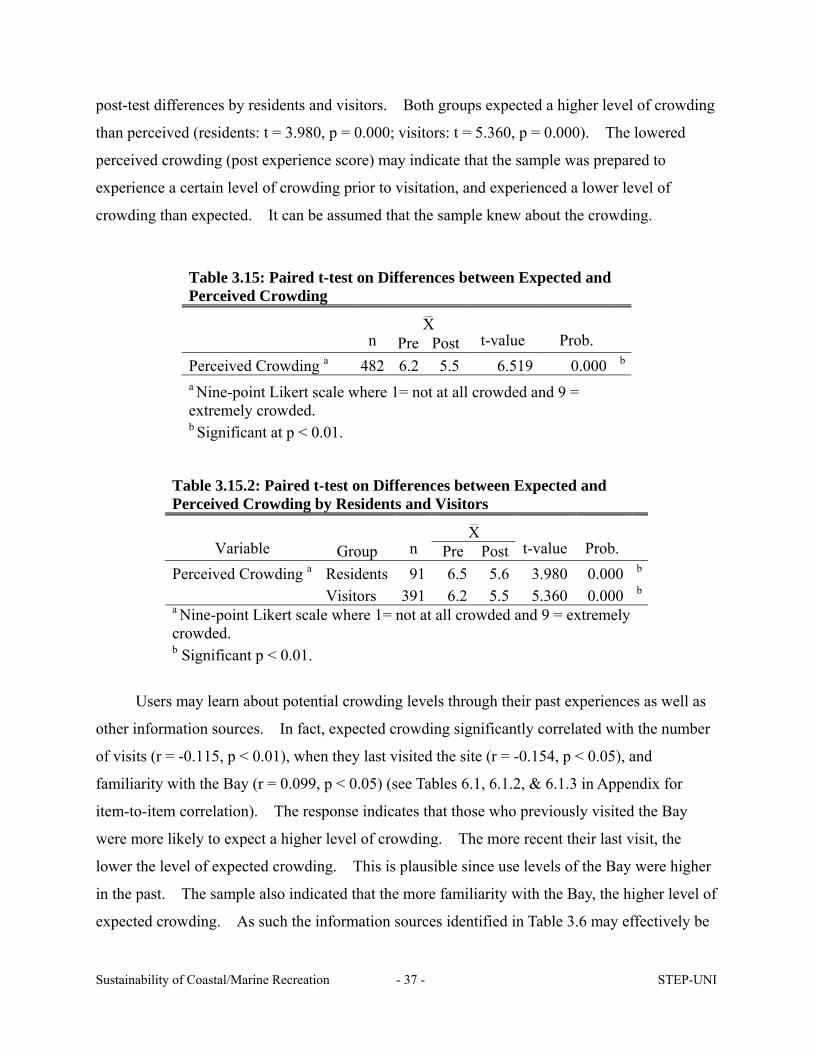
Sustainability of Coastal/Marine Recreation - 37 - STEP-UNI
post-test differences by residents and visitors. Both groups expected a higher level of crowding
than perceived (residents: t = 3.980, p = 0.000; visitors: t = 5.360, p = 0.000). The lowered
perceived crowding (post experience score) may indicate that the sample was prepared to
experience a certain level of crowding prior to visitation, and experienced a lower level of
crowding than expected. It can be assumed that the sample knew about the crowding.
Table 3.15: Paired t-test on Differences between Expected and Perceived Crowding
X__
n Pre Post t-value Prob.
Perceived Crowding a 482 6.2 5.5 6.519 0.000 b a Nine-point Likert scale where 1= not at all crowded and 9 = extremely crowded. b Significant at p < 0.01.
Table 3.15.2: Paired t-test on Differences between Expected and Perceived Crowding by Residents and Visitors
X__
Variable Group n Pre Post t-value Prob.
Perceived Crowding a Residents 91 6.5 5.6 3.980 0.000 b Visitors 391 6.2 5.5 5.360 0.000 b a Nine-point Likert scale where 1= not at all crowded and 9 = extremely crowded. b Significant p < 0.01.
Users may learn about potential crowding levels through their past experiences as well as
other information sources. In fact, expected crowding significantly correlated with the number
of visits (r = -0.115, p < 0.01), when they last visited the site (r = -0.154, p < 0.05), and
familiarity with the Bay (r = 0.099, p < 0.05) (see Tables 6.1, 6.1.2, & 6.1.3 in Appendix for
item-to-item correlation). The response indicates that those who previously visited the Bay
were more likely to expect a higher level of crowding. The more recent their last visit, the
lower the level of expected crowding. This is plausible since use levels of the Bay were higher
in the past. The sample also indicated that the more familiarity with the Bay, the higher level of
expected crowding. As such the information sources identified in Table 3.6 may effectively be

Sustainability of Coastal/Marine Recreation - 38 - STEP-UNI
utilized to inform users of the potential level of crowding.
Moreover, Pearson correlation coefficients were employed to further identify associations
among those who expected crowding (pre experience questionnaire), those who perceived
crowding (post experience questionnaire) and total actual users. Table 3.16 shows that
perceived crowding is significantly but weakly correlated with expectation of crowding (r =
0.362, p = 0.000) and total users (r = 0.359, p = 0.000). Although the sample reported lower
levels of perceived crowding than expected crowding, those who rated crowding high in the
pre-test appeared to have rated high in the post-test. The result also indicates that the higher the
daily user count, the more crowding was perceived. The correlation of the above items
appeared to be higher for residents.
Table 3.16: Correlations among Total User Count, Expected Crowding and Perceived Crowding
Total Residents Visitors n r p n r p n r p
Variables Perceived Crowding a Expectation of Crowding a 609 0.362 0.000 b 101 0.467 0.000 b 508 0.336 0.000 b
Total Users 498 0.359 0.000 b 92 0.464 0.000 b 406 0.339 0.000 b
a Nine-point Likert scale where 1= not at all crowded and 9 = extremely crowded. b p < 0.01.
Figure 3.5 shows changes in perceived level of crowding according to use level. The X
axis indicates total number of users on the survey day in ascending order. Perceived crowding
was measured on a nine-point scale where 1 = not at all crowded, 3 = slightly crowded, 6 =
moderately crowded, and 9 = extremely crowded, and it was labeled scale points 1 and 2 as not
being crowded (a positive evaluation), and 3 through 9 as being crowded (a negative evaluation)
(Shelby, B., Vaske, J., & Heberlein, T. A., 1989). Appendix Figures 6.5 to 6.5.2 display the
graphic percentage of these findings according to the total user count by 500. When use level
exceeded 3100, crowding was consistently perceived. Figure 3.5.2 shows the detailed response
of perceived crowding. Respondents increasingly indicated it was extremely crowded at the use
level above 3700 visitors. Fluctuation of the percentage may have been derived from the
variability of user perceptions.

Sustainability of Coastal/Marine Recreation - 39 - STEP-UNI
Figure 3.5: Changes in Responses According to Use Level:How Crowded Was It Today at Hanauma Bay? (2-Scale)
77.850.0
72.7100.0 83.3
96.3 90.029.4
100.094.7 83.390.9
100.0100.0100.0 88.9100.0
80.0100.0100.0100.0100.0100.0100.0100.0100.0100.0100.0 81.8100.0100.0 89.5100.0
94.188.9
100.0100.0
22.250.0
27.3
16.73.7 10.0
70.6
5.3 16.79.1
11.1 20.0
18.2
10.5
5.9 11.1
0%
10%
20%
30%
40%
50%
60%
70%
80%
90%
100%
1474177718382046205020602226223423712586263228462847292829463002303630963134317332563283333333733427373137683824386039224115414841984306439449064992
Total User Count
Crowded Not Being Crowded
Perceived Crowding was measured on the nine-point Likert where 1 = not at all crowded, 3 = slightly crowded, 6 = moderately crowded, and 9 =extremely crowded and coded as less than 3 = not being crowded and 3 and above = crowded.
Figure 3.5.2: Changes in Responses According to Use Level:How Crowded Was It Today at Hanauma Bay? (4-scale)
3.7
8.3 3.7
10.0 5.3
11.822.2 10.0 7.1
44.48.3
36.444.4
8.344.450.0
11.863.663.2 33.363.6
87.585.7
66.744.4
83.330.0
66.786.7
90.053.8
77.881.8
77.8 59.370.0
80.054.5
72.780.068.4
93.376.5
66.750.0
78.6
33.341.7
36.455.6
75.048.1 40.0
17.636.4 31.6
41.727.3
12.514.3
33.344.4
16.750.0
33.313.3
10.046.2
22.218.2
22.237.0
30.010.0
27.327.3
20.015.8
6.75.9
40.014.322.2
50.027.3
16.73.7 10.0
70.6
5.3 16.79.1
11.1 20.0
18.2
10.5
5.9 11.1
0%
20%
40%
60%
80%
100%
1474177718382046205020602226223423712586263228462847292829463002303630963134317332563283333333733427373137683824386039224115414841984306439449064992
Extremely Crowded Moderately Crowded Slightly Crowded Not at all Crowded
Perceived Crowding was measured on the nine-point Likert where 1 = not at all crowded, 3 = slightly crowded, 6 = moderately crowded,and 9 = extremely crowded.
Sustainability of Coastal/Marine Recreation - 40 - STEP-UNI
D. Pre-and-Post Experience Preferences and Benefits Sought and Achieved at Hanauma
Bay
This section summarizes perceived preferences and benefits prior to and after the
recreational experiences at the Bay. The analyses include factor analysis, brief description of
the proportional distribution, tests of differences residents and visitors, a test of differences
between pre and post tests, and a test of correlations to determine which preferences / benefits
factor is associated with total number of users and perceived crowding.
Pre-and-Post Experience Preferences
Eleven experience preferences were measured on a three-point scale (Table 3.17).
Experiences are defined as the types of natural resources, facilities, and activities that the visitor
expected to see and they do while at the Bay. The pre-test questionnaires was coded on a scale
with: 1 = “not expected to see/do,” 2 = “not sure,” and 3 = “expect to see/do.” The coding in
the post-test questionnaires was 1 = “worse than expected,” 2 = “what I expected,” and 3 =
“better than expected.” The total sample expressed relatively high levels of expectations, and
the expectations were generally met. Residents expressed higher levels of expectations and a
lower level of expectations being met. Although the results indicated user expectations were
generally met, the Bay may need to focus their management efforts to exceed user expectations
in order to achieve repeat users. For example, the results showed that as the use level increases,
the Physical Facilities (i.e., clean facilities and adequate parking) was increasingly considered as
worse than expected. The frequent use of the facility may make facilities less clean and parking
harder to secure. The sample also felt that the entrance fee and the number of people at the Bay
was more than they expected as the total users at the Bay increased.
Pre-test items were first factor analyzed (principle components with Oblique rotation) and
post-test items were categorized based on the identified factors. Items were categorized into
four factors comprised of Natural Resources & Snorkeling (five items), Physical Facilities (two
items), Fee & Number of People (two items), and Activities (two items) (see Table 6.2 in
Appendix for the items categorized in each factor).
Table 3.17 indicates standardized Alpha and the distributions of each item. Standardized
Alpha of the factors ranged from 0.33 to 0.77. The pre and post-test “natural resources &
snorkeling” and post-test “activities” exceeded 0.60 while other factors expressed some

Sustainability of Coastal/Marine Recreation - 41 - STEP-UNI
instability and inconsistency of the item sets (see Appendix Table 6.3 for the correlated item-total
correlation and Cronbach Alpha Coefficients for pre experience and post experience preferences).
In the pre-test, the majority of the sample said that they expected most of these experience
preferences.
Paired t-tests were used to examine the mean differences between the matched pre
experience and post experience items. Pre experience test items were coded on: 1 = not
expected to see/do, 2 = not sure, and 3 = expect to see. Post experience test items were coded
on: 1 = worse than I expected, 2 = what I expected, and 3 = better than I expected.
As listed in Table 3.18, all the experience preference factors achieved significant pre and
post differences (p = 0.000). In the post-test, the mean values of all the items was significantly
lower than the pre-test, indicating the sample’s expectations were relatively poorly met
Table 3.18.2 presents the paired t-test on the differences between pre and post experience
preferences by residents and visitors. All the factors of experience preferences were
significantly different. Both visitors and residents groups indicated more positive expectations
than actual experiences.
In general, residents expressed higher expectations of the site and rated experiences lower
than visitors (Table 3.19). Particularly, residents had significantly higher expectations than
visitors to see abundant marine life (t = 2.263, p < 0.05) and to see lots of people (t = 2.183, p <
0.05). The fact that residents indicated more familiarity of the Bay in the previous section may
also support this outcome (see Table 3.10). In the post-test, beautiful scenery (t = -2.153, p <
0.01) physical facilities (t = -1.966, p < 0.01), and cleanliness of facilities (t = -3.067, p < 0.01)
achieved significant mean differences between residents and visitors. Residents reported lower
levels of expectations met than visitors with regard to seeing beautiful scenery, availability of
physical facilities, and seeing clean facilities.
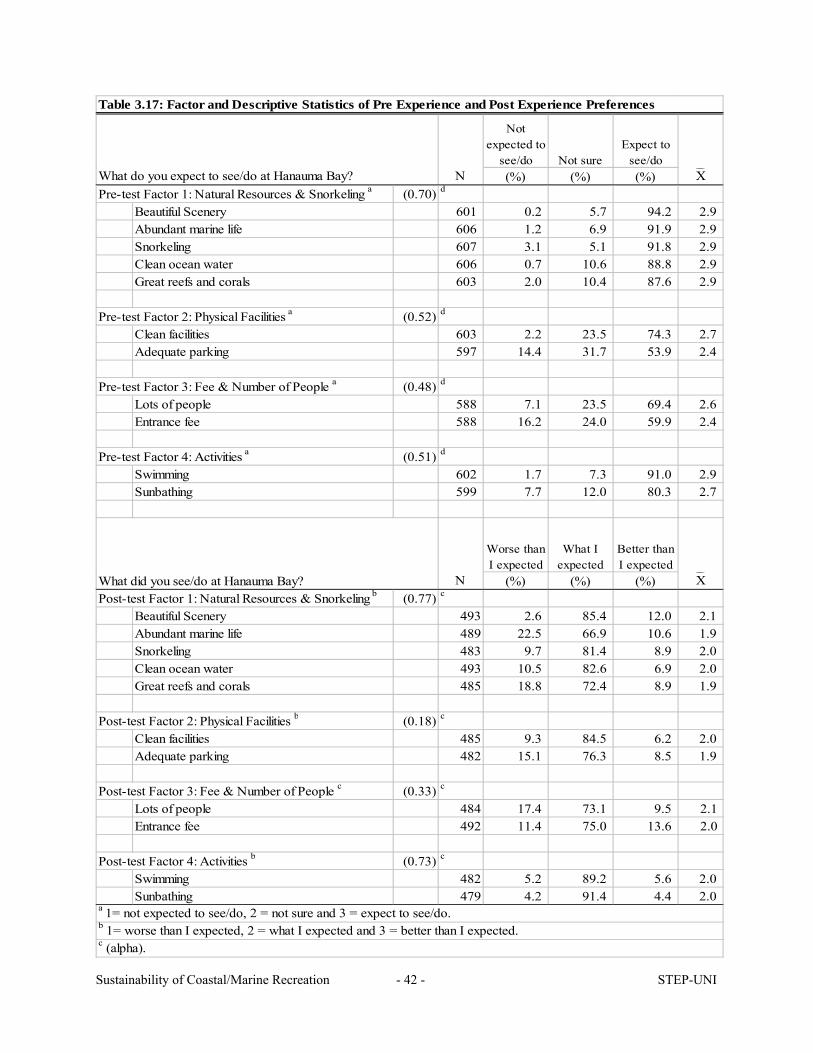
Sustainability of Coastal/Marine Recreation - 42 - STEP-UNI
Notexpected to
see/do Not sureExpect to
see/do(%) (%) (%)
Pre-test Factor 1: Natural Resources & Snorkeling a (0.70) d
Beautiful Scenery 601 0.2 5.7 94.2 2.9Abundant marine life 606 1.2 6.9 91.9 2.9Snorkeling 607 3.1 5.1 91.8 2.9Clean ocean water 606 0.7 10.6 88.8 2.9Great reefs and corals 603 2.0 10.4 87.6 2.9
Pre-test Factor 2: Physical Facilities a (0.52) d
Clean facilities 603 2.2 23.5 74.3 2.7Adequate parking 597 14.4 31.7 53.9 2.4
Pre-test Factor 3: Fee & Number of People a (0.48) d
Lots of people 588 7.1 23.5 69.4 2.6Entrance fee 588 16.2 24.0 59.9 2.4
Pre-test Factor 4: Activities a (0.51) d
Swimming 602 1.7 7.3 91.0 2.9Sunbathing 599 7.7 12.0 80.3 2.7
Worse thanI expected
What Iexpected
Better thanI expected
(%) (%) (%)Post-test Factor 1: Natural Resources & Snorkeling b (0.77) c
Beautiful Scenery 493 2.6 85.4 12.0 2.1Abundant marine life 489 22.5 66.9 10.6 1.9Snorkeling 483 9.7 81.4 8.9 2.0Clean ocean water 493 10.5 82.6 6.9 2.0Great reefs and corals 485 18.8 72.4 8.9 1.9
Post-test Factor 2: Physical Facilities b (0.18) c
Clean facilities 485 9.3 84.5 6.2 2.0Adequate parking 482 15.1 76.3 8.5 1.9
Post-test Factor 3: Fee & Number of People c (0.33) c
e Lots of people 484 17.4 73.1 9.5 2.1g Entrance fee 492 11.4 75.0 13.6 2.0
Post-test Factor 4: Activities b (0.73) c
Swimming 482 5.2 89.2 5.6 2.0Sunbathing 479 4.2 91.4 4.4 2.0
c (alpha).
b 1= worse than I expected, 2 = what I expected and 3 = better than I expected.
a 1= not expected to see/do, 2 = not sure and 3 = expect to see/do.
Table 3.17: Factor and Descriptive Statistics of Pre Experience and Post Experience Preferences
N X____
N X____
What do you expect to see/do at Hanauma Bay?
What did you see/do at Hanauma Bay?

Sustainability of Coastal/Marine Recreation - 43 - STEP-UNI
Table 3.18: Paired t-test on Differences between Pre Experience and Post Experience Preferences
X_____
Variable n Pre a Post b t-value Prob.
Factor 1: Natural Resources & Snorkeling c 446 14.5 9.8 47.284 0.000 e
Abundant marine life 475 2.9 1.9 35.071 0.000 e
Great reefs and corals 470 2.8 1.9 30.656 0.000 e
Beautiful Scenery 472 2.9 2.1 42.420 0.000 e
Clean ocean water 475 2.9 2.0 35.888 0.000 e
Snorkeling 469 2.9 2.0 34.125 0.000 e
Factor 2: Physical Facilities d 448 5.1 3.9 21.258 0.000 e
Clean facilities 467 2.7 2.0 25.148 0.000 e
Adequate parking 461 2.4 1.9 11.899 0.000 e
Factor 3: Fee & Number of People d 453 5.1 4.1 19.402 0.000 e
Entrance fee 466 2.5 2.0 13.941 0.000 e
Lots of people 460 2.6 2.1 15.804 0.000 e
Factor 4: Activities d 455 5.6 4.0 34.553 0.000 e
Swimming 465 2.9 2.0 38.274 0.000 e
Sunbathing 460 2.7 2.0 23.504 0.000 e
a 1= not expected to see/do, 2 = not sure and 3 = expect to see/do. b 1= worse than I expected, 2 = what I expected and 3 = better than I expected. c Due to five collapsed variables, mean value 1 to 5 = not expected to see/worse than expected, 6 to 10 = not sure/what I expected and 11 to 15 = expect to see/better than I expected. d Due to two collapsed variables, mean value 1 & 2 = not expected to see/worse than I expected, 3 & 4 = not sure/what I expected and 5 & 6 = expect to see/better than I expected. e p < 0.01.
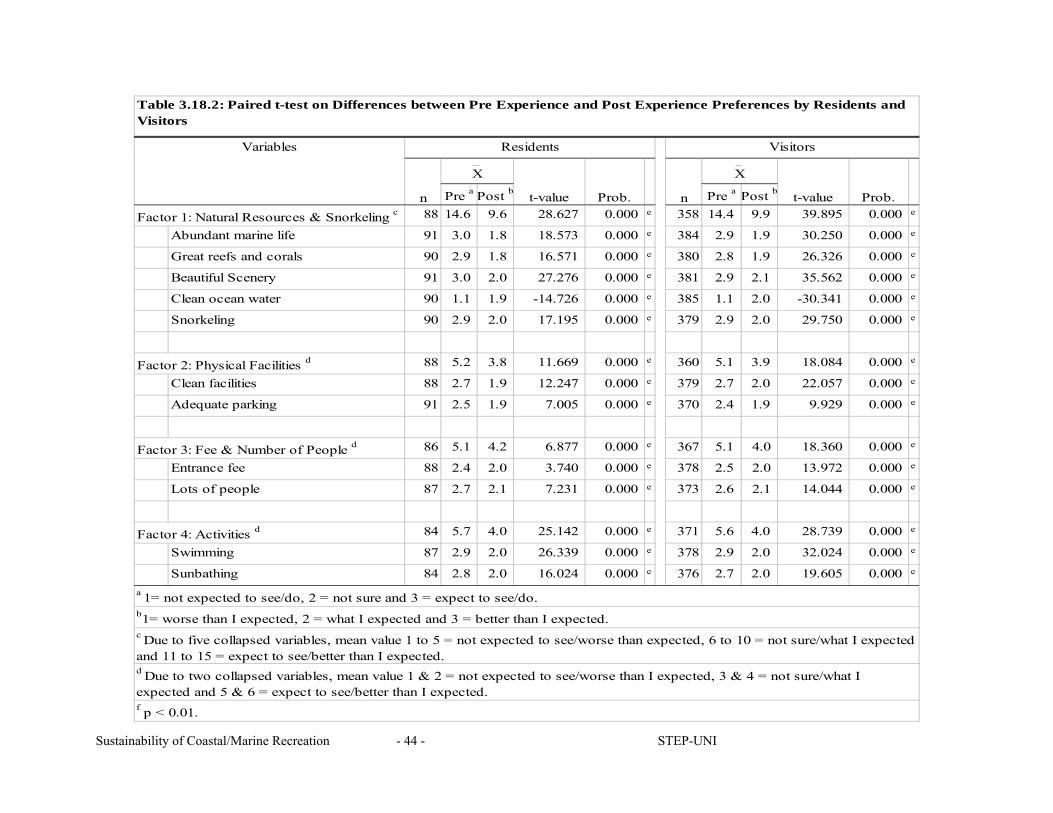
Sustainability of Coastal/Marine Recreation - 44 - STEP-UNI
Pre a Post b Pre a Post b
88 14.6 9.6 28.627 0.000 e 358 14.4 9.9 39.895 0.000 e
Abundant marine life 91 3.0 1.8 18.573 0.000 e 384 2.9 1.9 30.250 0.000 e
Great reefs and corals 90 2.9 1.8 16.571 0.000 e 380 2.8 1.9 26.326 0.000 e
Beautiful Scenery 91 3.0 2.0 27.276 0.000 e 381 2.9 2.1 35.562 0.000 e
Clean ocean water 90 1.1 1.9 -14.726 0.000 e 385 1.1 2.0 -30.341 0.000 e
Snorkeling 90 2.9 2.0 17.195 0.000 e 379 2.9 2.0 29.750 0.000 e
88 5.2 3.8 11.669 0.000 e 360 5.1 3.9 18.084 0.000 e
Clean facilities 88 2.7 1.9 12.247 0.000 e 379 2.7 2.0 22.057 0.000 e
Adequate parking 91 2.5 1.9 7.005 0.000 e 370 2.4 1.9 9.929 0.000 e
86 5.1 4.2 6.877 0.000 e 367 5.1 4.0 18.360 0.000 e
Entrance fee 88 2.4 2.0 3.740 0.000 e 378 2.5 2.0 13.972 0.000 e
Lots of people 87 2.7 2.1 7.231 0.000 e 373 2.6 2.1 14.044 0.000 e
84 5.7 4.0 25.142 0.000 e 371 5.6 4.0 28.739 0.000 e
Swimming 87 2.9 2.0 26.339 0.000 e 378 2.9 2.0 32.024 0.000 e
Sunbathing 84 2.8 2.0 16.024 0.000 e 376 2.7 2.0 19.605 0.000 e
f p < 0.01.
d Due to two collapsed variables, mean value 1 & 2 = not expected to see/worse than I expected, 3 & 4 = not sure/what Iexpected and 5 & 6 = expect to see/better than I expected.
c Due to five collapsed variables, mean value 1 to 5 = not expected to see/worse than expected, 6 to 10 = not sure/what I expectedand 11 to 15 = expect to see/better than I expected.
b1= worse than I expected, 2 = what I expected and 3 = better than I expected.
Table 3.18.2: Paired t-test on Differences between Pre Experience and Post Experience Preferences by Residents andVisitors
Variables Residents Visitors
X____
t-valueFactor 1: Natural Resources & Snorkeling c
Prob.
a 1= not expected to see/do, 2 = not sure and 3 = expect to see/do.
Factor 4: Activities d
Factor 3: Fee & Number of People d
Factor 2: Physical Facilities d
n n
X____
t-value Prob.

Sustainability of Coastal/Marine Recreation - 45 - STEP-UNI
n X_____
a n X_____
a n X_____
b n X_____
b
Factor 1: Natural Resources & Snorkeling c 100 14.6 486 14.4 1.392 0.164 90 9.6 383 9.9 -1.728 0.085Abundant marine life 102 3.0 504 2.9 2.263 0.025 f 91 1.8 398 1.9 -1.073 0.284Great reefs and corals 101 2.9 502 2.9 0.424 0.672 91 1.8 394 1.9 -1.350 0.178Beautiful Scenery 101 3.0 500 2.9 1.772 0.078 92 2.0 401 2.1 -2.153 0.033 f
Clean ocean water 101 1.1 505 1.1 -1.095 0.275 91 1.9 402 2.0 -1.866 0.063Snorkeling 102 2.9 505 2.9 0.428 0.669 90 2.0 393 2.0 -0.439 0.661
Factor 2: Physical Facilities d 100 5.3 492 5.1 1.448 0.148 90 3.8 383 3.9 -1.966 0.050 f
Clean facilities 100 2.7 503 2.7 0.412 0.681 90 1.9 395 2.0 -3.067 0.002 e
Adequate parking 101 2.5 496 2.4 1.515 0.130 92 1.9 390 1.9 -0.214 0.830
Factor 3: Fee & Number of People d 98 5.1 482 5.0 0.357 0.721 89 4.2 394 4.0 1.524 0.128Entrance fee 98 2.4 490 2.5 -1.052 0.295 91 2.0 401 2.0 1.429 0.155Lots of people 99 2.7 489 2.6 2.183 0.031 f 89 2.1 395 2.1 1.147 0.252
Factor 4: Activities d 99 5.7 496 5.6 1.764 0.080 87 4.0 389 4.0 -1.077 0.282Swimming 101 2.9 501 2.9 1.753 0.081 88 2.0 394 2.0 -1.368 0.172Sunbathing 99 2.8 500 2.7 1.219 0.225 87 2.0 392 2.0 -0.112 0.911
Visitors
Table 3.19: T-test on Resident and Visitor Differences in Experience Preferences
Residents Visitors t-valueVariable Pre-test Post-test
b 1= worse than I expected, 2 = what I expected and 3 = better than I expected.
t-value Prob. Prob.
a 1= not expected to see/do, 2 = not sure and 3 = expect to see/do.
Residents
f p < 0.05.
e p < 0.01.
d Due to two collapsed variables, mean value 1 & 2 = not expected to see/worse than I expected, 3 & 4 = not sure/what I expected and 5 & 6 = expect tosee/better than I expected.
c Due to five collapsed variables, mean value 1 to 5 = not expected to see/worse than expected, 6 to 10 = not sure/what I expected and 11 to 15 = expect tosee/better than I expected.

Sustainability of Coastal/Marine Recreation - 46 - STEP-UNI
Pearson correlation coefficients were employed to identify which factors of post
experiences (post-test) can be associated with use levels and perceived crowding. As Table
3.20 shows, total user count significantly but weakly correlated with post-experience physical
facilities (r = -0.112, p < 0.05) and post-experience fee & number of people (r = -0.188, p =
0.000). The results indicated that the higher the use level (number of actual users), lower
ratings for physical facilities (i.e., clean facilities and adequate parking) was indicated (see Table
6.2 in Appendix for the items categorized in each factor).
Table 3.20: Correlations among Total User Counts, Perceived Crowding and Post Experience Preferences Factors
Total Residents Visitors Variables n r p n r p n r p
Post Experience Preferences F1: Natural Resources & Snorkeling b Total User Counts 473 -0.025 0.590 90 0.047 0.659 383 -0.035 0.498 Perceived Crowding a 473 -0.072 0.118 90 0.099 0.354 383 -0.103 0.045 d
Post Experience Preferences F2: Physical Facilities b Total User Counts 473 -0.112 0.015 d 90 -0.063 0.554 383 -0.121 0.018 d
Perceived Crowding a 473 0.001 0.979 90 -0.006 0.953 383 0.004 0.932 Post-test Preferences F3: Fee & Number of People b
Total User Counts 483 -0.188 0.000 c 89 -0.234 0.028 d 394 -0.184 0.000 c
Perceived Crowding a 483 -0.316 0.000 c 89 -0.259 0.014 d 394 -0.331 0.000 c
Post Experience Preferences F4: Activities b Total User Counts 476 -0.044 0.336 87 -0.156 0.148 389 -0.037 0.471 Perceived Crowding a 476 -0.036 0.435 87 -0.049 0.653 389 -0.036 0.477 a Nine-point Likert scale where 1= not at all crowded and 9 = extremely crowded. b 1 = worse than expected, 2 = what I expected and 3 = better than expected. c p < 0.01. d p < 0.05.
Both residents’ and visitors’ post-experience fee and number of people showed a
significant correlation with the total user count (residents: r = -0.234, p < 0.05; visitors: r =
-0.184, p = 0.000) and with perceived crowding (residents: r = -0.259, p < 0.05; visitors: r =
-0.331, p = 0.000) (Table 3.20). Visitors rated seeing natural resources and snorkeling
experiences lower as they perceived more crowding (r = -103, p < 0.05). The visitors’ rating for
physical facilities (i.e., facilities and parking) was also lowered as the total use level increased (r
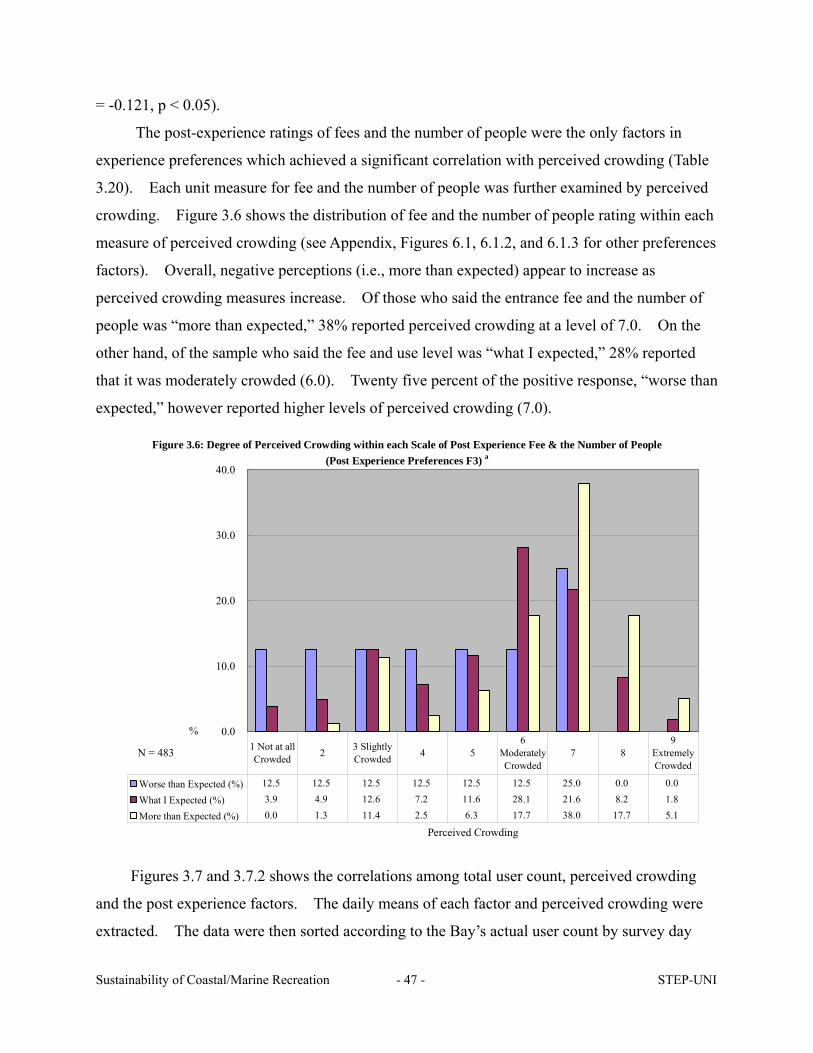
Sustainability of Coastal/Marine Recreation - 47 - STEP-UNI
= -0.121, p < 0.05).
The post-experience ratings of fees and the number of people were the only factors in
experience preferences which achieved a significant correlation with perceived crowding (Table
3.20). Each unit measure for fee and the number of people was further examined by perceived
crowding. Figure 3.6 shows the distribution of fee and the number of people rating within each
measure of perceived crowding (see Appendix, Figures 6.1, 6.1.2, and 6.1.3 for other preferences
factors). Overall, negative perceptions (i.e., more than expected) appear to increase as
perceived crowding measures increase. Of those who said the entrance fee and the number of
people was “more than expected,” 38% reported perceived crowding at a level of 7.0. On the
other hand, of the sample who said the fee and use level was “what I expected,” 28% reported
that it was moderately crowded (6.0). Twenty five percent of the positive response, “worse than
expected,” however reported higher levels of perceived crowding (7.0).
0.0
10.0
20.0
30.0
40.0
Perceived Crowding
%
Worse than Expected (%) 12.5 12.5 12.5 12.5 12.5 12.5 25.0 0.0 0.0
What I Expected (%) 3.9 4.9 12.6 7.2 11.6 28.1 21.6 8.2 1.8
More than Expected (%) 0.0 1.3 11.4 2.5 6.3 17.7 38.0 17.7 5.1
1 Not at allCrowded 2 3 Slightly
Crowded 4 56
ModeratelyCrowded
7 89
ExtremelyCrowded
Figure 3.6: Degree of Perceived Crowding within each Scale of Post Experience Fee & the Number of People(Post Experience Preferences F3) a
N = 483
Figures 3.7 and 3.7.2 shows the correlations among total user count, perceived crowding
and the post experience factors. The daily means of each factor and perceived crowding were
extracted. The data were then sorted according to the Bay’s actual user count by survey day
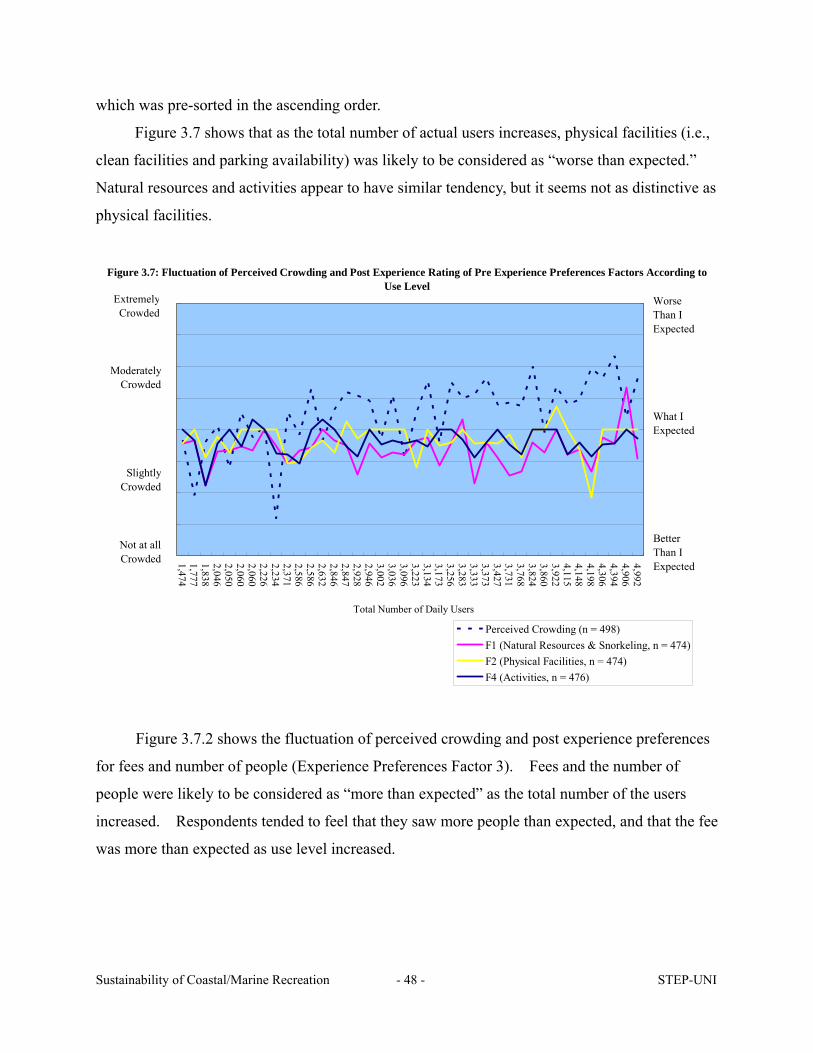
Sustainability of Coastal/Marine Recreation - 48 - STEP-UNI
which was pre-sorted in the ascending order.
Figure 3.7 shows that as the total number of actual users increases, physical facilities (i.e.,
clean facilities and parking availability) was likely to be considered as “worse than expected.”
Natural resources and activities appear to have similar tendency, but it seems not as distinctive as
physical facilities.
1,4741,7771,8382,0462,0502,0602,0602,2262,2342,3712,5862,5862,6322,8462,8472,9282,9463,0023,0363,0963,2233,1343,1733,2563,2833,3333,3733,4273,7313,7683,8243,8603,9224,1154,1484,1984,3064,3944,9064,992
Total Number of Daily Users
Perceived Crowding (n = 498)F1 (Natural Resources & Snorkeling, n = 474)F2 (Physical Facilities, n = 474)F4 (Activities, n = 476)
Figure 3.7: Fluctuation of Perceived Crowding and Post Experience Rating of Pre Experience Preferences Factors According toUse Level
WorseThan IExpected
What IExpected
BetterThan IExpected
Not at allCrowded
SlightlyCrowded
ModeratelyCrowded
ExtremelyCrowded
Figure 3.7.2 shows the fluctuation of perceived crowding and post experience preferences
for fees and number of people (Experience Preferences Factor 3). Fees and the number of
people were likely to be considered as “more than expected” as the total number of the users
increased. Respondents tended to feel that they saw more people than expected, and that the fee
was more than expected as use level increased.

Sustainability of Coastal/Marine Recreation - 49 - STEP-UNI
1,4741,7771,8382,0462,0502,0602,0602,2262,2342,3712,5862,5862,6322,8462,8472,9282,9463,0023,0363,0963,2233,1343,1733,2563,2833,3333,3733,4273,7313,7683,8243,8603,9224,1154,1484,1984,3064,3944,9064,992
Total Number of Daily Users
Perceived Crowding (n = 498)
F3 (Fee & Number of People, n = 484)
Figure 3.7.2: Fluctuation of Perceived Crowding and Post Experience Rating of Pre Experience Preferences Factor According to Use LevelFee & Number of People (Preferences Factor 3) According to Use Level
WorseThan IExpected
What IExpected
BetterThan IExpected
Not at allCrowded
SlightlyCrowded
ModeratelyCrowded
ExtremelyCrowded
Sought and Perceived Benefits of the Experience
Similar to experience preferences, users of the Bay were allowed to indicate which type of
personal benefits they sought while at the Bay. These statements were asked in the
pre-experience (pre-test) questions and again in the post-experience (post-test) questions (See
Table 3.21).
The benefits were measured on a five-point Likert scale where 1 = strongly agree and 5 =
strongly disagree. In the pre-test questionnaire, respondents were asked to indicate their level
of agreement with ten items that they intended to experience, while in the post-test questionnaire,
indicated was their level of agreement with the matched ten items that they experienced. Factor
analysis was conducted and reliability analysis was used to evaluate the stability and consistency
of each factor. Pre-test items were first factor analyzed and post-test items were grouped based
on the identified factors. Items were categorized into three factors comprised of learning
benefits (three items), leisure and bonding benefits (four items), and environmental benefits
(three items) (see Table 6.4 in Appendix for the items categorized in each factor).
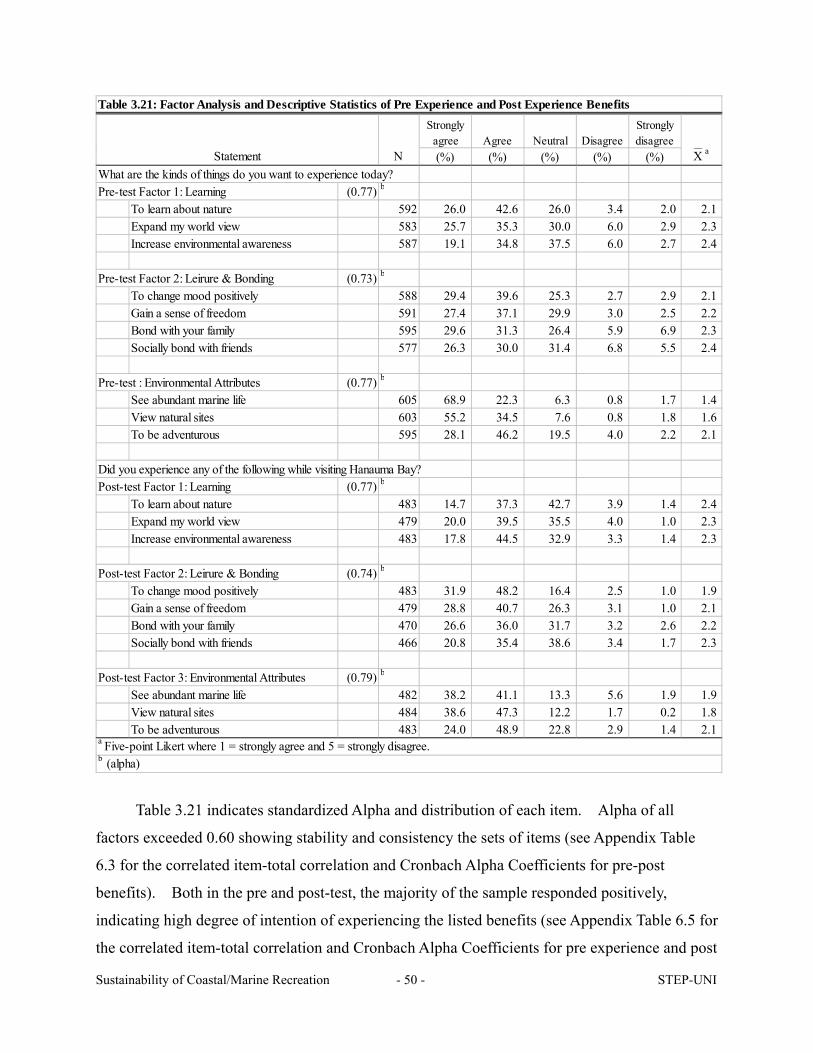
Sustainability of Coastal/Marine Recreation - 50 - STEP-UNI
Stronglyagree Agree Neutral Disagree
Stronglydisagree
(%) (%) (%) (%) (%)What are the kinds of things do you want to experience today?Pre-test Factor 1: Learning (0.77) b
To learn about nature 592 26.0 42.6 26.0 3.4 2.0 2.1Expand my world view 583 25.7 35.3 30.0 6.0 2.9 2.3Increase environmental awareness 587 19.1 34.8 37.5 6.0 2.7 2.4
Pre-test Factor 2: Leirure & Bonding (0.73) b
To change mood positively 588 29.4 39.6 25.3 2.7 2.9 2.1Gain a sense of freedom 591 27.4 37.1 29.9 3.0 2.5 2.2Bond with your family 595 29.6 31.3 26.4 5.9 6.9 2.3Socially bond with friends 577 26.3 30.0 31.4 6.8 5.5 2.4
Pre-test : Environmental Attributes (0.77) b
See abundant marine life 605 68.9 22.3 6.3 0.8 1.7 1.4View natural sites 603 55.2 34.5 7.6 0.8 1.8 1.6To be adventurous 595 28.1 46.2 19.5 4.0 2.2 2.1
Did you experience any of the following while visiting Hanauma Bay?Post-test Factor 1: Learning (0.77) b
To learn about nature 483 14.7 37.3 42.7 3.9 1.4 2.4Expand my world view 479 20.0 39.5 35.5 4.0 1.0 2.3Increase environmental awareness 483 17.8 44.5 32.9 3.3 1.4 2.3
Post-test Factor 2: Leirure & Bonding (0.74) b
To change mood positively 483 31.9 48.2 16.4 2.5 1.0 1.9Gain a sense of freedom 479 28.8 40.7 26.3 3.1 1.0 2.1Bond with your family 470 26.6 36.0 31.7 3.2 2.6 2.2Socially bond with friends 466 20.8 35.4 38.6 3.4 1.7 2.3
Post-test Factor 3: Environmental Attributes (0.79) b
See abundant marine life 482 38.2 41.1 13.3 5.6 1.9 1.9View natural sites 484 38.6 47.3 12.2 1.7 0.2 1.8To be adventurous 483 24.0 48.9 22.8 2.9 1.4 2.1
Table 3.21: Factor Analysis and Descriptive Statistics of Pre Experience and Post Experience Benefits
b (alpha)
a Five-point Likert where 1 = strongly agree and 5 = strongly disagree.
Statement X_____
aN
Table 3.21 indicates standardized Alpha and distribution of each item. Alpha of all
factors exceeded 0.60 showing stability and consistency the sets of items (see Appendix Table
6.3 for the correlated item-total correlation and Cronbach Alpha Coefficients for pre-post
benefits). Both in the pre and post-test, the majority of the sample responded positively,
indicating high degree of intention of experiencing the listed benefits (see Appendix Table 6.5 for
the correlated item-total correlation and Cronbach Alpha Coefficients for pre experience and post

Sustainability of Coastal/Marine Recreation - 51 - STEP-UNI
experience benefits).
In the pre-test questionnaire environmental attributes appeared to be most supported by the
sample: 68.9% of the sample strongly agreed with their intention to see abundant marine life and
55.2% of the sample strongly agreed with viewing natural site (Table 3.21). The mean values
of these items fell under agree to strongly agree with 1.4 and 1.6 respectively. The degree of
agreement however changed before and after the use of the Bay. The respondents perceived
better leisure and bonding benefits while they experienced less learning and environmental
benefits than they planned. In the post test questionnaire, only 38.2% of the sample strongly
agreed with the perceived benefits by seeing abundant marine life and 38.6% of the sample
strongly agreed with viewing natural resources. The mean values of these items still fell under
agree to strongly agree with 1.9 and 1.8 respectively.
Paired t-test was generated to examine the mean differences between the matched pre and
post-test items. There were significant pre-post differences: learning benefits (t = -2.156, p = <
0.05); leisure and bonding benefits (t = 2.587, p < 0.05) and environmental benefits (t = -6.461, p
= 0.000) whereas all the mean values stayed within agree to strongly agree (see Table 3.22).
The mean values of learning benefits and environmental benefits increased (Mean = 6.7 to 6.9,
Mean = 5.0 to 5.8 respectively), indicating less of a benefit attainment.
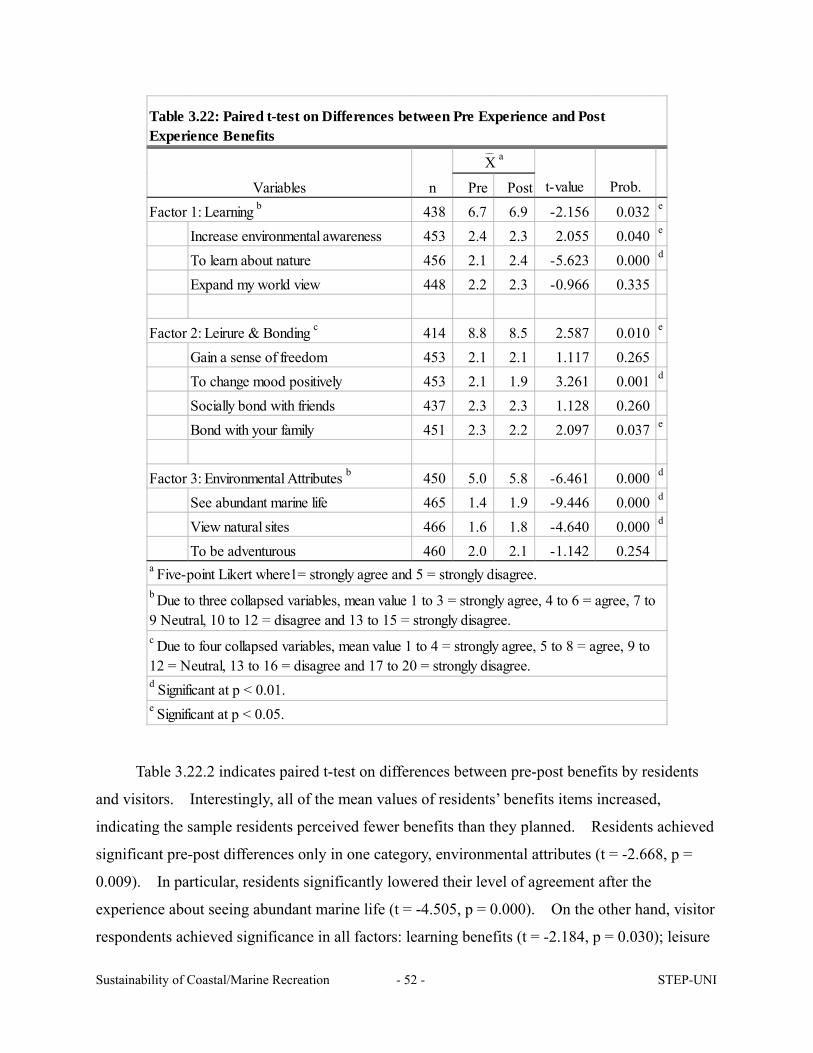
Sustainability of Coastal/Marine Recreation - 52 - STEP-UNI
Pre PostFactor 1: Learning b 438 6.7 6.9 -2.156 0.032 e
Increase environmental awareness 453 2.4 2.3 2.055 0.040 e
To learn about nature 456 2.1 2.4 -5.623 0.000 d
Expand my world view 448 2.2 2.3 -0.966 0.335
Factor 2: Leirure & Bonding c 414 8.8 8.5 2.587 0.010 e
Gain a sense of freedom 453 2.1 2.1 1.117 0.265To change mood positively 453 2.1 1.9 3.261 0.001 d
Socially bond with friends 437 2.3 2.3 1.128 0.260Bond with your family 451 2.3 2.2 2.097 0.037 e
Factor 3: Environmental Attributes b 450 5.0 5.8 -6.461 0.000 d
See abundant marine life 465 1.4 1.9 -9.446 0.000 d
View natural sites 466 1.6 1.8 -4.640 0.000 d
To be adventurous 460 2.0 2.1 -1.142 0.254
e Significant at p < 0.05.
d Significant at p < 0.01.
c Due to four collapsed variables, mean value 1 to 4 = strongly agree, 5 to 8 = agree, 9 to12 = Neutral, 13 to 16 = disagree and 17 to 20 = strongly disagree.
b Due to three collapsed variables, mean value 1 to 3 = strongly agree, 4 to 6 = agree, 7 to9 Neutral, 10 to 12 = disagree and 13 to 15 = strongly disagree.
nVariables Prob.X____
a
t-value
Table 3.22: Paired t-test on Differences between Pre Experience and PostExperience Benefits
a Five-point Likert where1= strongly agree and 5 = strongly disagree.
Table 3.22.2 indicates paired t-test on differences between pre-post benefits by residents
and visitors. Interestingly, all of the mean values of residents’ benefits items increased,
indicating the sample residents perceived fewer benefits than they planned. Residents achieved
significant pre-post differences only in one category, environmental attributes (t = -2.668, p =
0.009). In particular, residents significantly lowered their level of agreement after the
experience about seeing abundant marine life (t = -4.505, p = 0.000). On the other hand, visitor
respondents achieved significance in all factors: learning benefits (t = -2.184, p = 0.030); leisure

Sustainability of Coastal/Marine Recreation - 53 - STEP-UNI
and bonding benefits (t = 3.090, p = 0.002) and environmental attributes (t = -5.879, p = 0.000).
Visitors reported better leisure and bonding benefits than they planned: they perceived more
benefits than they planed in terms of changing mood positively (p = 0.000) and boding with their
family (p = 0.012). The visitor respondents reported significantly less learning benefits
particularly to learn about nature (t = -5.434, p = 0.000), and less perceived benefits regarding
environmental attributes including to see abundant marine life (t = -8.531, p = 0.000) and to view
natural sites (t = -4.381, p = 0.000).
Pre Post Pre PostFactor 1: Learning b 85 7.0 7.1 -0.470 0.639 353 6.7 6.9 -2.184 0.030 e
Increase environmental awareness 88 2.4 2.3 1.149 0.254 365 2.3 2.2 1.732 0.084To learn about nature 88 2.2 2.4 -1.621 0.109 368 2.1 2.4 -5.434 0.000 d
Expand my world view 85 2.3 2.4 -0.553 0.582 363 2.2 2.2 -0.800 0.424
Factor 2: Leirure & Bonding c 74 8.3 8.5 -0.571 0.570 340 9.0 8.5 3.090 0.002 d
Gain a sense of freedom 87 2.0 2.0 -0.523 0.602 366 2.1 2.1 1.395 0.164To change mood positively 85 2.0 2.0 -0.108 0.914 368 2.1 1.9 3.704 0.000 d
Socially bond with friends 84 2.0 2.1 -1.101 0.274 353 2.4 2.3 1.799 0.073Bond with your family 83 2.3 2.3 -0.210 0.834 368 2.3 2.1 2.522 0.012 e
Factor 3: Environmental Attributes b 87 5.3 5.9 -2.668 0.009 d 363 5.0 5.7 -5.879 0.000 d
See abundant marine life 88 1.5 2.0 -4.505 0.000 d 377 1.4 1.9 -8.351 0.000 d
View natural sites 87 1.7 1.9 -1.562 0.122 379 1.5 1.7 -4.382 0.000 d
To be adventurous 89 2.1 2.1 -0.112 0.911 371 2.0 2.1 -1.208 0.228
Residents Visitors
n
X____
a
Table 3.22.2: Paired t-test on Differences between Pre Experience and Post Experience Benefits by Residents and Visitors
X____
a
t-value Prob. n t-value Prob.Variables
e p < 0.05.
d p < 0.01.
a Five-point Likert where1= strongly agree and 5 = strongly disagree.
c Due to four collapsed variables, mean value 1 to 4 = strongly agree, 5 to 8 = agree, 9 to 12 = Neutral, 13 to 16 = disagree and 17 to 20= strongly disagree.
b Due to three collapsed variables, mean value 1 to 3 = strongly agree, 4 to 6 = agree, 7 to 9 Neutral, 10 to 12 = disagree and 13 to 15 =strongly disagree.
Moreover, t-test was conducted to identify visitor-resident perceptive differences in
benefits (Table 3.23). Residents sought more benefits of leisure and bonding than visitors (t =
-2.213, p < 0.05) particularly social bond with friends (t = -3.892, p < 0.01). The sample
residents also perceived significantly higher benefits of social bonding (t = -2.841, p < 0.01).

Sustainability of Coastal/Marine Recreation - 54 - STEP-UNI
n X____
a n X____
a n X____
a n X____
a
Factor 1: Learning b 97 7.0 474 6.8 0.807 0.420 87 7.1 388 6.9 0.830 0.407Increase environmental awareness 100 2.4 487 2.4 0.289 0.773 89 2.3 394 2.2 0.809 0.419To learn about nature 100 2.2 492 2.1 0.503 0.615 90 2.4 393 2.4 -0.160 0.873Expand my world view 97 2.4 486 2.2 1.080 0.280 88 2.4 391 2.2 1.742 0.082
Factor 2: Leirure & Bonding c 92 8.3 470 9.1 -2.213 0.027 e 80 8.5 368 8.6 -0.059 0.953Gain a sense of freedom 99 2.0 492 2.2 -1.521 0.129 89 2.1 390 2.1 0.116 0.907To change mood positively 98 2.0 490 2.1 -1.375 0.170 89 2.0 394 1.9 0.664 0.507Socially bond with friends 99 2.0 478 2.4 -3.892 0.000 d 87 2.1 379 2.4 -2.841 0.005 d
Bond with your family 98 2.3 497 2.3 -0.159 0.874 84 2.3 386 2.2 1.329 0.187
Factor 3: Environmental Attributes b 100 5.4 488 5.1 1.521 0.129 88 5.9 389 5.8 0.700 0.484See abundant marine life 101 1.6 504 1.4 1.606 0.109 89 2.0 393 1.9 0.766 0.444View natural sites 100 1.7 503 1.6 1.543 0.123 88 1.9 396 1.8 1.090 0.276To be adventurous 101 2.1 494 2.0 0.705 0.481 90 2.1 393 2.1 -0.002 0.999
Variables Prob.t-valueProb.t-valueVisitors Residents Visitors
c Due to four collapsed variables, mean value 1 to 4 = strongly agree, 5 to 8 = agree, 9 to 12 = Neutral, 13 to 16 = disagree and 17 to 20 = stronglydisagree.
e Significant at p < 0.05.
d Significant at p < 0.01.
a Five-point Likert where1= strongly agree and 5 = strongly disagree.b Due to three collapsed variables, mean value 1 to 3 = strongly agree, 4 to 6 = agree, 7 to 9 Neutral, 10 to 12 = disagree and 13 to 15 = stronglydisagree.
Table 3.23: T-test on Resident and Visitor Differences in BenefitsPost-testPre-test
Residents
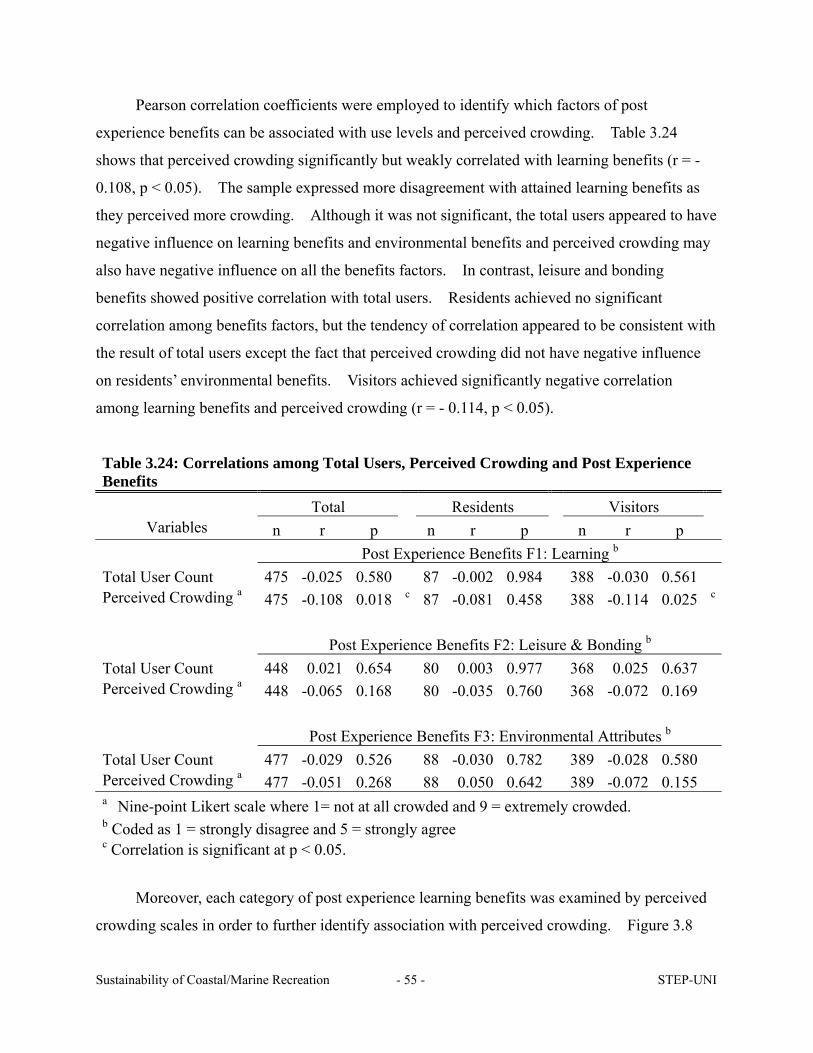
Sustainability of Coastal/Marine Recreation - 55 - STEP-UNI
Pearson correlation coefficients were employed to identify which factors of post
experience benefits can be associated with use levels and perceived crowding. Table 3.24
shows that perceived crowding significantly but weakly correlated with learning benefits (r = -
0.108, p < 0.05). The sample expressed more disagreement with attained learning benefits as
they perceived more crowding. Although it was not significant, the total users appeared to have
negative influence on learning benefits and environmental benefits and perceived crowding may
also have negative influence on all the benefits factors. In contrast, leisure and bonding
benefits showed positive correlation with total users. Residents achieved no significant
correlation among benefits factors, but the tendency of correlation appeared to be consistent with
the result of total users except the fact that perceived crowding did not have negative influence
on residents’ environmental benefits. Visitors achieved significantly negative correlation
among learning benefits and perceived crowding (r = - 0.114, p < 0.05).
Table 3.24: Correlations among Total Users, Perceived Crowding and Post Experience Benefits
Total Residents Visitors Variables n r p n r p n r p
Post Experience Benefits F1: Learning b Total User Count 475 -0.025 0.580 87 -0.002 0.984 388 -0.030 0.561 Perceived Crowding a 475 -0.108 0.018 c 87 -0.081 0.458 388 -0.114 0.025 c
Post Experience Benefits F2: Leisure & Bonding b Total User Count 448 0.021 0.654 80 0.003 0.977 368 0.025 0.637 Perceived Crowding a 448 -0.065 0.168 80 -0.035 0.760 368 -0.072 0.169 Post Experience Benefits F3: Environmental Attributes b Total User Count 477 -0.029 0.526 88 -0.030 0.782 389 -0.028 0.580 Perceived Crowding a 477 -0.051 0.268 88 0.050 0.642 389 -0.072 0.155 a Nine-point Likert scale where 1= not at all crowded and 9 = extremely crowded. b Coded as 1 = strongly disagree and 5 = strongly agree c Correlation is significant at p < 0.05.
Moreover, each category of post experience learning benefits was examined by perceived
crowding scales in order to further identify association with perceived crowding. Figure 3.8

Sustainability of Coastal/Marine Recreation - 56 - STEP-UNI
shows proportional distributions of perceived learning benefits within each scale of perceived
crowding (see Appendix, Figure 6.7and 6.7.2 for other benefits factors). A large percentage of
the sample said it was more than moderately crowded particularly, 60% of the sample who
strongly disagreed with perceived learning benefits reported higher level of perceived crowding
(7.0).
0.0
10.0
20.0
30.0
40.0
50.0
60.0
70.0
Perceived Crowding
%
Strongly Agree (%) 7.1 7.1 7.1 4.8 9.5 28.6 28.6 4.8 2.4
Agree (%) 5.0 6.3 18.2 5.7 12.6 23.9 21.4 6.9 0.0
Neutral (%) 2.9 2.9 8.3 7.1 10.4 28.3 25.0 12.1 2.9
Disagree (%) 0.0 0.0 17.2 10.3 13.8 24.1 17.2 10.3 6.9
Strongly Disagree (%) 0.0 0.0 0.0 0.0 0.0 20.0 60.0 20.0 0.0
1 Not at allCrowded 2 3 Slightly
Crowded 4 56
ModeratelyCrowded
7 89
ExtremelyCrowded
N = 475
Figure 3.8: Degree of Perceived Crowding within each Scale of Post Experience Learning Benefits(Post Experience Benefits F1)a
a Increase environmental awareness, to learn about nature, and expand my world view.
Figure 3.9 shows fluctuation of perceived crowding and benefits according to the user
counts. The daily means of each factor and perceived crowding were extracted, and the data
were sorted according to the Bay’s user count of the survey day. In several survey days, the
daily mean values of learning benefits reached neutral while perceived crowding reached
moderately crowded. When the total user reached 4,115, the daily mean of learning benefits
exceeded neutral, representing disagreement with the item whereas with a 4,394 daily user count,
the daily mean of perceived crowding exceeded reached 7.3 (Moderately-extremely crowded).
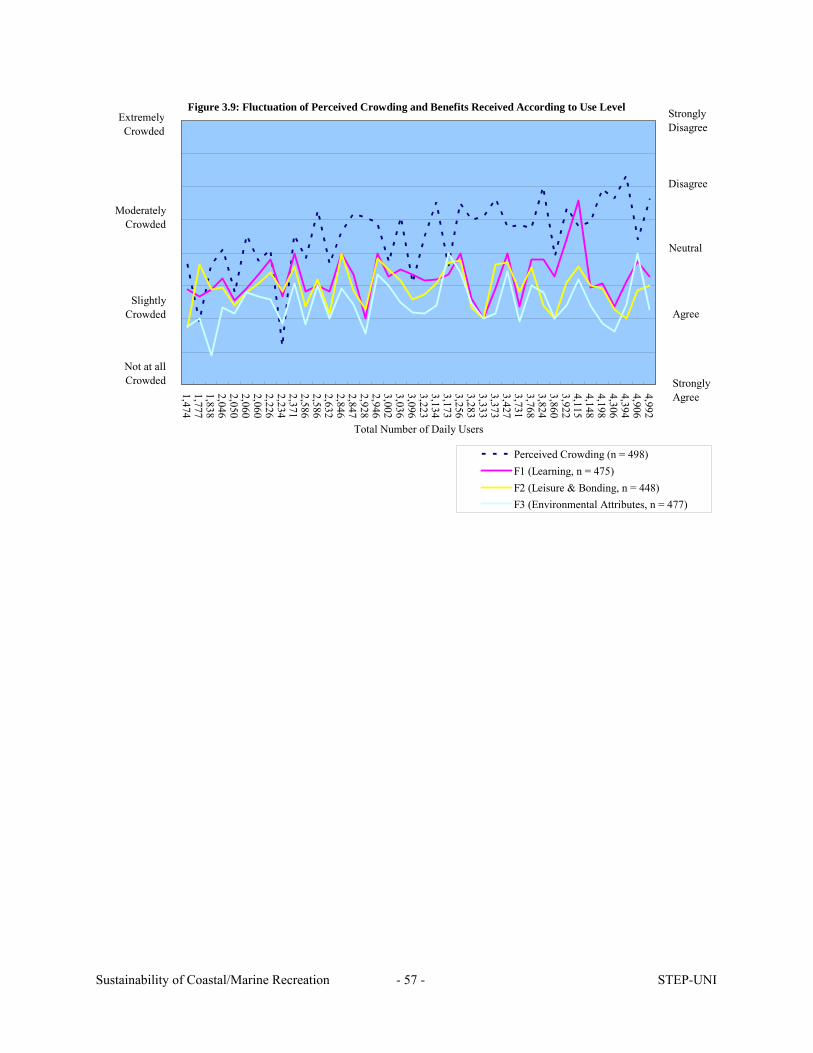
Sustainability of Coastal/Marine Recreation - 57 - STEP-UNI
1,4741,7771,8382,0462,0502,0602,0602,2262,2342,3712,5862,5862,6322,8462,8472,9282,9463,0023,0363,0963,2233,1343,1733,2563,2833,3333,3733,4273,7313,7683,8243,8603,9224,1154,1484,1984,3064,3944,9064,992
Total Number of Daily Users
Perceived Crowding (n = 498)F1 (Learning, n = 475)F2 (Leisure & Bonding, n = 448)F3 (Environmental Attributes, n = 477)
Not at allCrowded
SlightlyCrowded
ModeratelyCrowded
ExtremelyCrowded
Agree
Neutral
Disagree
StronglyDisagree
Figure 3.9: Fluctuation of Perceived Crowding and Benefits Received According to Use Level
StronglyAgree

Sustainability of Coastal/Marine Recreation - 58 - STEP-UNI
E. Satisfaction with the Experiences at Hanauma Bay
This section presents the findings specific to satisfaction while at the Bay. The analyses
includes a brief description of the proportional distributions and factor analysis, a test of
differences among residents and visitors, and a test of correlations to determine which
satisfaction factors or items are associated with total number of users and perceived crowding.
User satisfaction was measured by two types of scales in the post-test questionnaire.
Global Satisfaction was measured on a five-point Likert type scale where one was highly
dissatisfied and five was highly satisfied. In addition, 14 satisfaction items were measured on a
three-point scale with 1 = added satisfaction, 2 = neutral and 3 = detracted from satisfaction.
Overall Satisfaction
The majority of Hanauma Bay users appear to be satisfied with their visit to the Bay. It
was comprised of 42.2% highly satisfied, followed by moderately satisfied (29.1%) and
satisfied (19.2%) with the mean value of 2.0. Only 9.5% of the sample (n = 47) rated their
visit as moderately dissatisfied to dissatisfied. Visitors appear to be slightly more satisfied
than residents. While 44.4% of the visitors said that they were highly satisfied (Mean = 2.0),
32.6% of the residents responded likewise (Mean = 2.1). The mean value of residents and
visitors do not statistically differ. The first time visitors indicated significantly higher mean
rating of global satisfaction than repeat visitors (t = -2.204, p = 0.05, first time visitors mean =
4.1, repeat visitors mean = 3.9). The first time visitors were more satisfied than repeat
visitors.
Table 3.25: Descriptive Statistics of Global Satisfaction Total Residents b Visitors b
Statement N (%) N (%) N (%) How satisfied are you with your visit to Hanauma Bay? a Highly Satisfied 209 42.2 30 32.6 179 44.4 Moderately Satisfied 144 29.1 33 35.9 111 27.5 Satisfied 95 19.2 20 21.7 75 18.6 Moderately Dissatisfied 33 6.7 5 5.4 28 6.9 Highly Dissatisfied 14 2.8 4 4.3 10 2.5 a Coded as 1 = highly dissatisfied to 5 = highly satisfied. Total X
__
= 4.0. b The mean value of residents is not statistically different than that of visitors. t = -1.646, p = 0.100. Residents X
__
= 3.9; visitors X__
= 4.0.

Sustainability of Coastal/Marine Recreation - 59 - STEP-UNI
As table 3.26 indicates, there is a weak correlation between perceived crowding and
satisfaction. This result accords with that of previous studies of the relationship between
encounters and overall quality of recreation experience. Many empirical studies tested the
hypothesis that crowding or encounters are negatively correlated with experience quality or
overall satisfaction and identified generally weak relationships between them (Stewart and Cole,
2001; Musa, 2002; Manning, 2003). Stewart and Cole (2001) note the decline in experience
quality that results from feeling crowded may be small when compared with the benefits that
accrue from being able to engage in a recreational activity whenever on so desires. Whisman &
Hollenhorst (1998) suggests that satisfaction in a recreation experience is a multidimensional
concept comprised of multiple sources of satisfaction including psychological outcomes,
behavior-type variables, and setting attributes (see Figure 6.8 in Appendix for proportional
distributions of global satisfaction within each scale of perceived crowding).
Table 3.26: Correlations among Total Users, Perceived Crowding and Global Satisfaction Total Residents Visitors
n r p n r p n r p Variables Global Satisfaction a
Total Users 498 -0.070 0.117 92 -0.076 0.474 406 -0.068 0.170 Perceived Crowding b 498 0.047 0.298 92 0.152 0.148 406 0.021 0.675 a Coded ranging as 1 = highly dissatisfied to 5 = highly satisfied. b Nine-point Likert scale where 1= not at all crowded and 9 = extremely crowded.
The following Figures (Figures 3.10& 3.10.2) present the global satisfaction and the
effects of crowding. The figure confirms a significant correlation among use level and
perceived crowding (r = 0.359, p = 000). Essentially, as the total count of users rise, overall
satisfaction declines. Table 3.11.extrapolates that perceived crowding be higher as actual use
level increases.
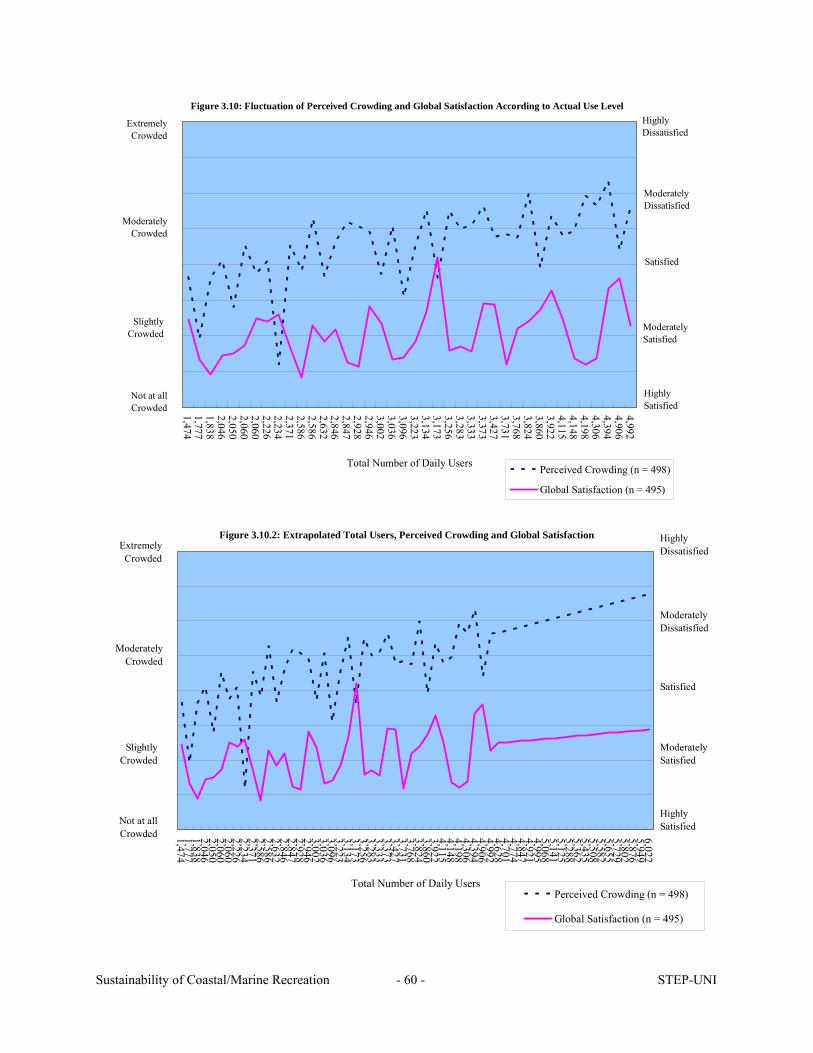
Sustainability of Coastal/Marine Recreation - 60 - STEP-UNI
1,4741,7771,8382,0462,0502,0602,0602,2262,2342,3712,5862,5862,6322,8462,8472,9282,9463,0023,0363,0963,2233,1343,1733,2563,2833,3333,3733,4273,7313,7683,8243,8603,9224,1154,1484,1984,3064,3944,9064,992
Total Number of Daily Users Perceived Crowding (n = 498)
Global Satisfaction (n = 495)
HighlyDissatisfied
Not at allCrowded
SlightlyCrowded
ModeratelyCrowded
ExtremelyCrowded
Figure 3.10: Fluctuation of Perceived Crowding and Global Satisfaction According to Actual Use Level
HighlySatisfied
ModeratelyDissatisfied
ModeratelySatisfied
Satisfied
1,4741,7771,8382,0462,0502,0602,0602,2262,2342,3712,5862,5862,6322,8462,8472,9282,9463,0023,0363,0963,2233,1343,1733,2563,2833,3333,3733,4273,7313,7683,8243,8603,9224,1154,1484,1984,3064,3944,9064,9924,6284,7014,7744,8474,9214,9955,0685,1415,1255,2885,3625,4355,5085,5825,6555,7295,8025,8765,9496,022
Total Number of Daily UsersPerceived Crowding (n = 498)
Global Satisfaction (n = 495)
HighlySatisfied
HighlyDissatisfied
ModeratelyDissatisfied
ModeratelySatisfied
Satisfied
Not at allCrowded
SlightlyCrowded
ModeratelyCrowded
ExtremelyCrowded
Figure 3.10.2: Extrapolated Total Users, Perceived Crowding and Global Satisfaction

Sustainability of Coastal/Marine Recreation - 61 - STEP-UNI
Satisfaction Determinants
Fourteen satisfaction determinants were measured on a three-point scale (Table 3.27).
The respondents evaluated their experiences regarding each item on a 3-point scale ranging from
added satisfaction, neutral, and detracted from satisfaction. The total sample expressed a
relatively positive degree of satisfaction with visitors expressing a higher level of satisfaction.
However, the results suggest several variables which may add more satisfaction. For example,
the results showed that as the use level increases, destruction and encounters have negative
impacts on satisfaction. Satisfaction determinants were first factor analyzed (principle
components with Oblique rotation). Items were categorized into four factors comprised of
quality and availability of facilities (five items), distractions & encounters (four items), debris
(two items), and marine resources (two items) (see Table 6.6 in Appendix for the items
categorized in each factor).
Table 3.27 indicates standardized Alpha and the distributions of each item. Standardized
Alpha of the factors ranged from 0.62 to 0.83. One item, weather condition was treated
individually for more stable internal consistency (see Appendix Tables 6.7 and 6.7.2 for the
correlated item-total correlation and Cronbach Alpha Coefficients for satisfaction determinants).
Quality and availability of facilities, marine resources, and weather conditions received positive
(above neutral) levels of satisfaction, while distractions and encounters, and debris were rated
below the neutral value.
Generally, (Table 3.27) as user daily totals increased, ratings for detractions due to human
encounters (in the form of being bumped into and sheer number of people) and debris in water
were reported as problems (Table 3.27). Repeat visitors (44.6% of the sample) indicated
significantly higher mean ratings of detractions than first time visitors in five items: clarity of
water (t = 3.627, p < 0.01); debris on shore (t = 2.460, p < 0.05); seeing marine life (t = 2.450, p
< 0.05), debris in water (t = 2.307, p < 0.05); bird feeding by other people (t = 2.058, p < 0.05);
and cleanliness of park (t = 1.982, p < 0.05).

Sustainability of Coastal/Marine Recreation - 62 - STEP-UNI
Addedsatisfaction No effect
Detractedfrom
satisfaction
(%) (%) (%)Factor 1: Quality and Availability of Facilities (0.62) b
Clean bathroom facilities 478 29.1 69.5 1.5 1.7Adequate parking 481 45.9 42.0 12.1 1.7Cleanliness of park 487 63.0 31.8 5.1 1.4 c
Education center 475 29.1 69.5 1.5 1.7Hike up/down crater 482 28.6 59.5 11.8 1.8
Factor 2: Distractions & Encounters (0.72) b
Being bumped while snorkeling 455 5.7 69.9 24.4 2.2Smoking by other people 463 9.1 69.1 21.8 2.1Bird feeding by other people 449 5.8 73.7 20.5 2.1 d
Number of people 462 8.9 63.6 27.5 2.2
Factor 3: Debris (0.83) b
Debris on shore 470 17.0 73.4 9.6 1.9 e
Debris in water 471 17.2 68.4 14.4 2.0 f
Factor 4: Marine Resources (0.62) b
Clarity of water 488 57.6 23.8 18.6 1.6 g
Marine life 477 75.5 18.2 6.3 1.3 h
Weather conditions 485 63.5 25.4 11.1 1.5a 1= added satisfaction, 2 = no effect and 3 = detracted from satisfaction
c The mean value of first time visitors is statistically different than that of repeat visitors. t = 1.982, p = 0.048. First
time visitors X____
= 1.4, repeat visitors X____
= 1.5.
Table 3.27: Factor Structure and Descriptive Statistics of Satisfaction
N X_____
aPlease rate the following items to your satisfaction today.
b (standardized item χ )
h The mean value of first time visitors is statistically different than that of repeat visitors. t = 2.450, p = 0.015. First
time visitors X____
= 1.3, repeat visitors X____
= 1.4.
d The mean value of first time visitors is statistically different than that of repeat visitors. t = 2.058, p = 0.040. First
time visitors X____
= 2.1, repeat visitors X____
= 2.2.e The mean value of first time visitors is statistically different than that of repeat visitors. t = 2.460, p = 0.014. First
time visitors X____
= 1.9, repeat visitors X____
= 2.0.f The mean value of first time visitors is statistically different than that of repeat visitors. t = 2.307, p = 0.022. First
time visitors X____
= 1.92, repeat visitors X____
= 2.04.g The mean value of first time visitors is statistically different than that of repeat visitors. t = 3.627, p = 0.000. First
time visitors X = 1.5, repeat visitors X = 1.8.

Sustainability of Coastal/Marine Recreation - 63 - STEP-UNI
Table 3.28 indicates that resident satisfaction levels are impacted by the number of users.
n X_____
a n X_____
a
Factor 1: Quality and Availability of Facilities c 79 8.5 371 8.3 0.666 0.506Clean bathroom facilities 88 1.8 390 1.6 1.748 0.081Adequate parking 88 1.6 393 1.7 -0.376 0.707Cleanliness of park 90 1.5 397 1.4 1.411 0.159Education center 85 1.8 390 1.7 1.110 0.268Hike up/down crater 90 1.8 392 1.8 -0.357 0.722
Factor 2: Distractions & Encounters c 80 8.9 356 8.6 1.313 0.190Being bumped while snorkeling 85 2.2 370 2.2 -0.205 0.838Smoking by other people 84 2.2 379 2.1 2.078 0.038 f
Bird feeding by other people 85 2.3 364 2.1 2.465 0.015 f
Number of people 89 2.2 373 2.2 -0.322 0.748
Factor 3: Debris d 86 4.2 383 3.8 3.249 0.001 e
Debris on shore 86 2.1 384 1.9 2.681 0.008 e
Debris in water 86 2.2 385 1.9 3.295 0.001 e
Factor 4: Marine Resources c 88 4.7 383 4.3 2.278 0.023Clarity of water 91 1.8 397 1.6 2.909 0.004 e
Marine life 88 1.4 389 1.3 0.988 0.323
Weather conditions c 91 1.5 394 1.5 1.126 0.261
f Significant at p < 0.05.
e Significant at p < 0.01.
a 1= added satisfaction, 2 = neutral and 3 = ditracted from satisfaction.
Table 3.28: T-test on Resident-Visitor Differences with Satisfaction
Prob.
b Due to five collapsed variables, mean value 1to5 = added satisfaction, 6to10 = neutral and 11to15c Due to three collapsed variables, mean value 1to3 = added satisfaction, 4to6 = neutral and 7to9d Due to two collapsed variables mean value 1to2 = added satisfaction, 3to4 = neutral and 5to6
Variables
Residents Visitors
t-value
Pearson correlation coefficients were employed to identify which factors of satisfaction
measures are associated with actual use levels and perceived crowding. Specifically, (Table
3.29) one can see that the satisfaction measures (quality and availability of facilities, distractions
and encounters, debris, marine resources, and weather conditions) significantly correlate with the
actual user count and / or perceived crowding scale. Visitors seem to be more affected by the
total user number and perceived crowding.
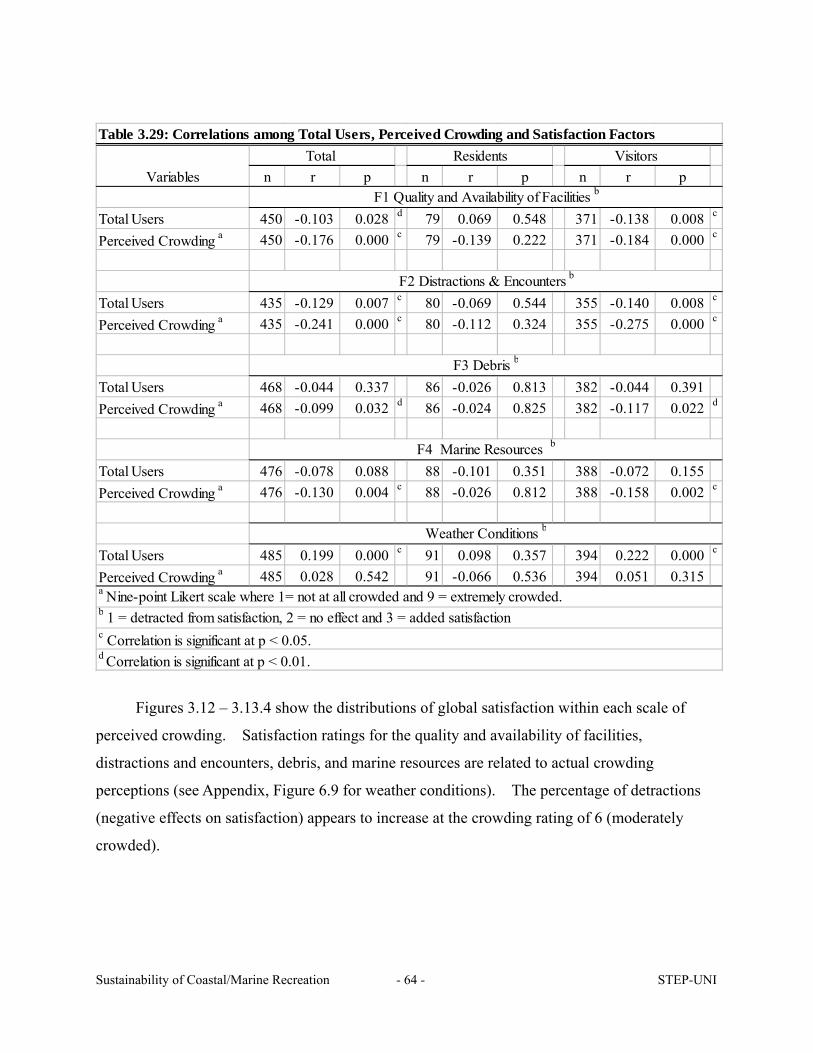
Sustainability of Coastal/Marine Recreation - 64 - STEP-UNI
n r p n r p n r p
Total Users 450 -0.103 0.028 d 79 0.069 0.548 371 -0.138 0.008 c
Perceived Crowding a 450 -0.176 0.000 c 79 -0.139 0.222 371 -0.184 0.000 c
Total Users 435 -0.129 0.007 c 80 -0.069 0.544 355 -0.140 0.008 c
Perceived Crowding a 435 -0.241 0.000 c 80 -0.112 0.324 355 -0.275 0.000 c
Total Users 468 -0.044 0.337 86 -0.026 0.813 382 -0.044 0.391Perceived Crowding a 468 -0.099 0.032 d 86 -0.024 0.825 382 -0.117 0.022 d
Total Users 476 -0.078 0.088 88 -0.101 0.351 388 -0.072 0.155Perceived Crowding a 476 -0.130 0.004 c 88 -0.026 0.812 388 -0.158 0.002 c
Total Users 485 0.199 0.000 c 91 0.098 0.357 394 0.222 0.000 c
Perceived Crowding a 485 0.028 0.542 91 -0.066 0.536 394 0.051 0.315
F1 Quality and Availability of Facilities b
F2 Distractions & Encounters b
F3 Debris b
F4 Marine Resources b
Table 3.29: Correlations among Total Users, Perceived Crowding and Satisfaction Factors
d Correlation is significant at p < 0.01.
c Correlation is significant at p < 0.05.
b 1 = detracted from satisfaction, 2 = no effect and 3 = added satisfaction
a Nine-point Likert scale where 1= not at all crowded and 9 = extremely crowded.
Weather Conditions b
VariablesTotal Residents Visitors
Figures 3.12 – 3.13.4 show the distributions of global satisfaction within each scale of
perceived crowding. Satisfaction ratings for the quality and availability of facilities,
distractions and encounters, debris, and marine resources are related to actual crowding
perceptions (see Appendix, Figure 6.9 for weather conditions). The percentage of detractions
(negative effects on satisfaction) appears to increase at the crowding rating of 6 (moderately
crowded).

Sustainability of Coastal/Marine Recreation - 65 - STEP-UNI
0.0
10.0
20.0
30.0
40.0
Perceived Crowding
%
Added Satisfaction (%) 8.6 11.4 22.9 5.7 0.0 25.7 17.1 5.7 2.9
No Effect (%) 3.6 4.5 11.5 5.6 12.0 25.5 26.1 9.0 2.2
Detracted from Satisfaction (%) 0.0 0.0 12.1 8.6 10.3 36.2 15.5 13.8 3.4
1 Not at allCrowded 2 3 Slightly
Crowded 4 56
ModeratelyCrowded
7 89
ExtremelyCrowded
Figure 3.11: Degree of Perceived Crowding within each Scale of Satisfaction with Quality and Availability of Facilities(Satisfaction F1)a
N = 450
a Clean bathroom facilities, adequate parking, cleanliness of park, education center, and hike up/down crater.
0.0
10.0
20.0
30.0
40.0
50.0
Perceived Crowding
%
Added Satisfaction (%) 0.0 7.7 38.5 15.4 0.0 7.7 15.4 7.7 7.7
No Effect (%) 5.0 6.9 13.3 9.2 13.8 27.1 17.9 4.6 2.3
Detracted from Satisfaction (%) 1.5 2.0 8.3 4.4 9.3 27.0 30.9 14.2 2.5
1 Not at allCrowded 2 3 Slightly
Crowded 4 56
ModeratelyCrowded
7 8 9 ExtremelyCrowded
Figure 3.11.2: Degree of Perceived Crowding within each Scale of Distractions & Encounters (Satisfaction F2)a
N = 435
a Being bumped while snorkeling, smoking by other people, bird feeding by other people, and number of people.

Sustainability of Coastal/Marine Recreation - 66 - STEP-UNI
0.0
10.0
20.0
30.0
40.0
Perceived Crowding
%
Added Satisfaction (%) 4.3 1.4 15.9 15.9 8.7 21.7 21.7 8.7 1.4
No Effect (%) 3.7 4.7 12.5 5.0 12.5 26.8 24.9 7.5 2.5
Detracted from Satisfaction (%) 1.3 3.8 6.4 3.8 9.0 29.5 24.4 19.2 2.6
1 Not at allCrowded 2 3 Slightly
Crowded 4 56
ModeratelyCrowded
7 8 9 ExtremelyCrowded
Figure 3.11.3: Degree of Perceived Crowding within each Scale of Debris (Satisfaction F3)a
N = 468
a Debris on shore and debris in water.
0.0
10.0
20.0
30.0
40.0
50.0
Perceived Crowding
%
Added Satisfaction (%) 3.2 3.2 8.8 6.4 12.8 26.4 25.6 9.6 4.0
No Effect (%) 4.2 4.8 14.5 7.0 10.3 26.7 21.8 9.1 1.5
Detracted from Satisfaction (%) 0.0 9.5 0.0 0.0 14.3 14.3 42.9 14.3 4.8
1 Not at allCrowded 2 3 Slightly
Crowded 4 56
ModeratelyCrowded
7 8 9 ExtremelyCrowded
Figure 3.11.4: Degree of Perceived Crowding within each Scale of Satisfaction with Marine Resources (Satisfaction F4)a
N = 471
a Clarity of water and marine life.

Sustainability of Coastal/Marine Recreation - 67 - STEP-UNI
The following Figures (3.12 & 3.12.2) present factors of satisfaction measurements and
the effects of crowding. Figure 3.12 shows that as the total number of actual users increases,
quality and availability of facilities and marine resources were likely to be considered as negative
elements of satisfaction. In addition, Figure 3.13.2 confirms debris (on the shore and in the
water) was increasingly considered as a detraction.
1,4741,7771,8382,0462,0502,0602,0602,2262,2342,3712,5862,5862,6322,8462,8472,9282,9463,0023,0363,0963,2233,1343,1733,2563,2833,3333,3733,4273,7313,7683,8243,8603,9224,1154,1484,1984,3064,3944,9064,992
Total Number of Daily UsersPerceived Crowding (n = 498)F1 (Quality & Availability of Facilities, n = 453)F4 (Marine Resources, n = 467)Weather Conditions (n = 485)
Not at allCrowded
SlightlyCrowded
ModeratelyCrowded
ExtremelyCrowded
AddedSatisfaction
Neutral
DetractedfromSatisfaction
Figure 3.12: Fluctuation of Perceived Crowding and Satisfaction Determinants According to Use Level

Sustainability of Coastal/Marine Recreation - 68 - STEP-UNI
1,4741,7771,8382,0462,0502,0602,0602,2262,2342,3712,5862,5862,6322,8462,8472,9282,9463,0023,0363,0963,2233,1343,1733,2563,2833,3333,3733,4273,7313,7683,8243,8603,9224,1154,1484,3064,3944,9064,992
Total Number of Daily Users
Perceived Crowding (n = 498)F2 (Distractions & Encounters, n = 436)F3 (Debris, n = 469)
Not at allCrowded
SlightlyCrowded
ModeratelyCrowded
ExtremelyCrowded
AddedSatisfaction
Neutral
DetractedfromSatisfaction
Figure 3.12.2:Fluctuation of Perceived Crowding and Satisfaction Determinants According to Use Level
Furthermore, a multiple linear regression was calculated to predict global satisfaction. A
significant regression equation was found with an R2 of 0.365 (Table 3.30). Significant
predictors were: post experience benefits of environmental attributes (β = 0.527, p < .01); followed
by number of people on the beach (β = 0.191, p < .05); and expertise in snorkeling (β = -0.180, p
< .05). The result indicates that perceived environmental benefits (i.e., to see abundant marine
life, to view natural sites, and to be adventurous) are positively related to the samples’ global
rating of satisfaction while, expertise in snorkeling, and negative effects due to the number of
people on the beach negative effects on global satisfaction. In other words, users who perceived
more benefits related to environmental attributes were more likely to be more satisfied, whereas
those who are more experienced in snorkeling or reported negative influences from people on the
beach were likely to be less satisfied.
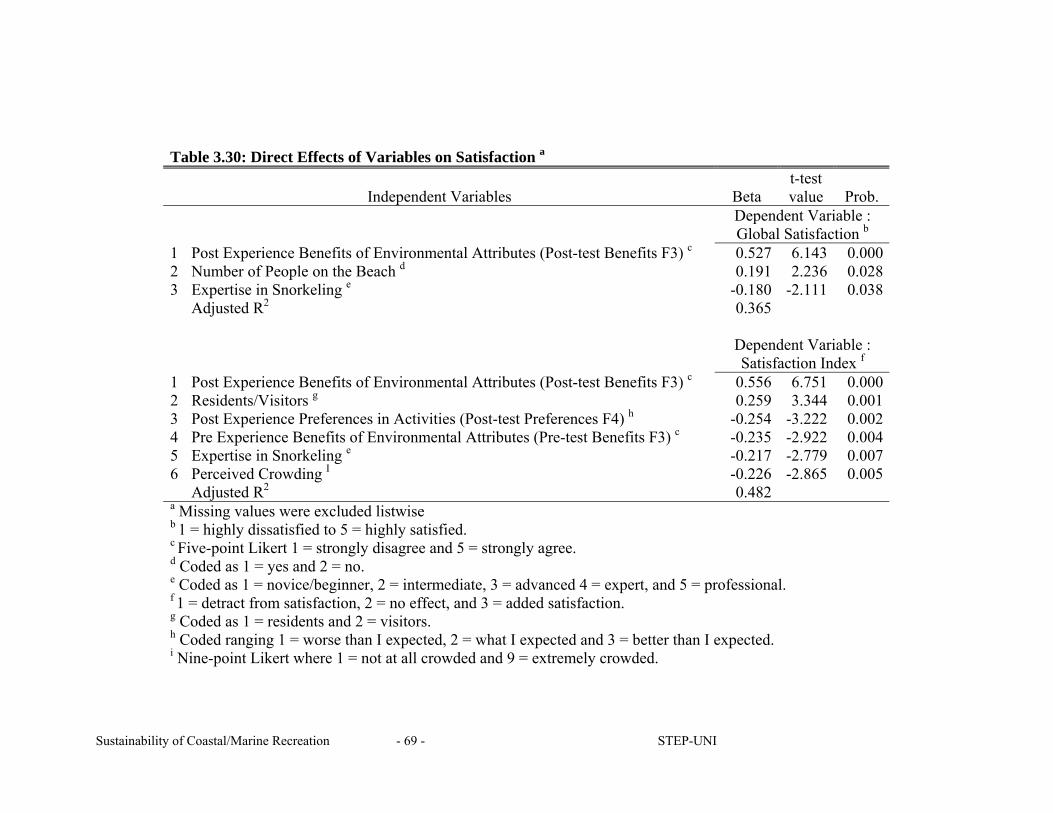
Sustainability of Coastal/Marine Recreation - 69 - STEP-UNI
Table 3.30: Direct Effects of Variables on Satisfaction a
Independent Variables Beta t-test value Prob.
Dependent Variable : Global Satisfaction b
1 Post Experience Benefits of Environmental Attributes (Post-test Benefits F3) c 0.527 6.143 0.000 2 Number of People on the Beach d 0.191 2.236 0.028 3 Expertise in Snorkeling e -0.180 -2.111 0.038 Adjusted R2 0.365
Dependent Variable : Satisfaction Index f
1 Post Experience Benefits of Environmental Attributes (Post-test Benefits F3) c 0.556 6.751 0.000 2 Residents/Visitors g 0.259 3.344 0.001 3 Post Experience Preferences in Activities (Post-test Preferences F4) h -0.254 -3.222 0.002 4 Pre Experience Benefits of Environmental Attributes (Pre-test Benefits F3) c -0.235 -2.922 0.004 5 Expertise in Snorkeling e -0.217 -2.779 0.007 6 Perceived Crowding I -0.226 -2.865 0.005 Adjusted R2 0.482 a Missing values were excluded listwise b 1 = highly dissatisfied to 5 = highly satisfied. c Five-point Likert 1 = strongly disagree and 5 = strongly agree. d Coded as 1 = yes and 2 = no. e Coded as 1 = novice/beginner, 2 = intermediate, 3 = advanced 4 = expert, and 5 = professional. f 1 = detract from satisfaction, 2 = no effect, and 3 = added satisfaction. g Coded as 1 = residents and 2 = visitors. h Coded ranging 1 = worse than I expected, 2 = what I expected and 3 = better than I expected. i Nine-point Likert where 1 = not at all crowded and 9 = extremely crowded.

Sustainability of Coastal/Marine Recreation - 70 - STEP-UNI
An index to measure satisfaction was created by summing ratings of three-scale global
satisfaction and satisfaction items. Global satisfaction (5-point scale) was converted into a
3-point scale ranging from: 1 = moderately to highly satisfied; 2 = neutral; and 3 = moderately to
highly dissatisfied. This is similar to other studies that summed the mean of statements that
individually measured satisfaction (e.g., Schomaker & Knopf, 1982; Vaske, Graefe, & Fedler,
1986; Graefe, & Fedler, 1986; Whisman & Hollenhorst, 1998).
A significant regression equation was found with an R2 of 0.482 (Table 3.30). The higher
R2 appears to support a perspective that overall user satisfaction, as measured as an index, may
be a multidimensional concept (e.g., Vaske et al., 1986; Graefe & Fedler, 1986; Graefe & Drogin,
1989; Herrick & McDonald ,1992; Wishman & Hollenhorst, 1998). Significant predictors of
the satisfaction index were post experience benefits of environmental attributes (β = 0.556, p
< .01), followed by residents / visitors meaning visitors were more satisfied (β = 0.259, p < .05),
post experience preferences in activities (β = -0.254, p < .01), pre experience benefits of
environmental attributes (β = -0.2354, p < .01), expertise in snorkeling (β = -0.217, p < .01), and
perceived crowding (β = -0.226, p < .01).

Sustainability of Coastal/Marine Recreation - 71 - STEP-UNI
IV. MANAGEMENT IMPLICATIONS AND FUTURE RESEARCH

Sustainability of Coastal/Marine Recreation - 72 - STEP-UNI
In interpreting the survey, there are several limitations to be noted. Many empirical
studies suggested the use of a five-point Likert scale to measure overall user satisfaction of the
recreational site rather than employing single measures of satisfaction. In this study, however,
it was measured using a recoded three point scale for global satisfaction (i.e., 1 and 2 = satisfied,
3 = neutral and 4 and 5 = dissatisfied). Originally, the global satisfaction was measured on
single scale of five-point Likert where 1 = highly dissatisfied and 5 = highly satisfied and also 14
satisfaction items were measured on a three scale where 1 = added satisfaction, 2 = neutral and 3
= detract from satisfaction. This may have led to more generalized results, and a reduction in
the variance of the measures. Moreover, the respondents were English speakers. Further
research is recommended for the non-English users. This may provide both insight into their
satisfaction levels and perceptions, but may also provide a unique opportunity to examine
cultural and ethnic variations. .
The total sample reported a higher level of expected crowding (pre-test scores) than their
perceived crowding (post experience score) scores indicated. This suggests the sample was
aware of the crowded conditions in advance. Residents were more sensitive to crowding levels.
As Table 4 shows, at the actual use level of over 3000, more than 40% of the respondents
indicated “negative influences from people on the beach.” When the use levels exceeded about
3100, conditions were consistently perceived as crowded. At the use level of over 3100 to 3800,
100% of the respondents indicated that it was “crowded.” At 3400 users, more than 55% of the
respondents indicated that they perceived “negative influences from other people snorkeling.”
At the use level over 3700, respondents increasingly reported it was “extremely crowded.”

Sustainability of Coastal/Marine Recreation - 73 - STEP-UNI
Table 4: Summary of Perceived Crowding Ratings Use Level
4,000 3,900 3,800 3,700 Extremely Crowded 3,600 3,500 3,400 3,300
Negative Influence from other People Snorkeling (More than 55%)
3,200 3,100 Crowded 3,000 Negative Influence from People on the Beach (More than 40%)
The results also indicate that perceived environmental benefits (i.e., to see abundant
marine life, to view natural sites, and to be adventurous), expertise in snorkeling are positively
related to the global ratings of satisfaction. The number of people on the beach negatively
impacted satisfaction levels for these attributes.
Moreover, perceived environmental benefits (i.e., to see abundant marine life, to view
natural sites, and to be adventurous) positively influenced ratings of satisfaction. Visitors to the
islands are likely to be more satisfied than the resident population. The findings of the study
suggest that perceived crowding may be an indicator of actual use levels (r = .359, p = .000), and
the crowding negatively influences satisfaction levels with in the Bay. Hence, limiting use may
be an effective tool to manage the Bay. The Bay is exceeding the social carrying capacity (as
measured in this study) when more than 3,200 (+/- 200 users) people per day use the Bay. The
number of visitors that provide acceptable recreation experiences may be less than 3,200.
Sustainability of Coastal/Marine Recreation - 74 - STEP-UNI
V. REFERENCES
Sustainability of Coastal/Marine Recreation - 75 - STEP-UNI
Bearden, R., Netemeyer, R.G., & Teel, J. E. (1989). Measurement of Consumer Susceptibility to Interpersonal Influence. Journal of Consumer Research, 15 (4), pp. 473-481.
Department and Agency Reports of the City & County of Honolulu. (n.d.). Hanauma Bay Nature Preserve. Honolulu, HI. Retrieved July 25, from http://www.co.honolulu.hi.us/csd/budget/r_dpr.pdf
Department of Business, Economic Development and Tourism (DBEDT) (2002). Annual Visitor Research Report. Honolulu, HI. Retrieved February 29, 2004 from http://www.hawaii.gov/dbedt/02vrr/index.html
Department of Business, Economic Development and Tourism (DBEDT) (2000). Hawaii Census. Honolulu, HI. Retrieved October 15, 2003 from http://www.state.hi.us/dbedt/census2k/labor_2000_ct.pdf
Friedmann, J. (1987). Planning in the public domain: From knowledge to action. Princeton, NJ: Princeton University Press.
Graefe, A. R., & Drogin, E. B. (1989). Factors Affecting Boating Satisfaction at Raystown Lake. In T. A. More, M. P. Donnelly, A. R. Graefe, & J. J. Vaske (Eds.), Proceedings of the 1989 Northerneastern Recreation Research Symposium. General Technical Report NE-132. USDA Forest Service.
Graefe, A. R., & Fedler, A. J. (1986). Situational and Subjective Determinants of Satisfaction in Marine Recreational Fishing. Leisure Sciences, 8, 3, 275-295.
Graefe, A.R., Kuss, F.R., & Vaske, J.J. (1990). Visitor impact management: The planning framework. Washington, D.C. National Parks and Conservation Association.
Hanauma Bay Education Program (HAEP) (2003). HBEP Beach Desk Tour Data. Honolulu, HI. Hawaii Coral Reef Assessment and Monitoring Program (CRAMP) (n.d.). Historical Timeline of
Hanauma Bay. Honolulu, HI. Retrieved July 21, 2003, from http://cramp.wcc.hawaii.edu/Study_Sites/Oahu/Hanauma_Bay/Time_Line.asp
Hawaii Coral Reef Assessment and Monitoring Program (CRAMP) (n.d.). Hanauma Bay Site. Honolulu, HI. Retrieved July 21, 2003, from http://cramp.wcc.hawaii.edu/Study_Sites/Oahu/Hanauma_Bay/
Hawaii Coral Reef Assessment and Monitoring Program (CRAMP) (n.d.). Use of Hanauma Bay. Honolulu, HI. Retrieved July 21, 2003, from http://cramp.wcc.hawaii.edu/Study_Sites/Oahu/Hanauma_Bay/Visitors.asp
Herrick, T. A. & McDonald (1992). Factors Affecting Overall Satisfaction with a River Recreation Experience. Environmental Management, 16(2), 243-247.
Lankford, S. & Hetzler, R. (1996). Crowding, Satisfaction and Ocean Recreation. Proceedings of the World Leisure & Recreation Association Congress, Cardiff, Wales. June.
Lankford, S. & Tanselli, L. (1990). A study of resident attitudes toward tourism. Prepared for Bend Area. Chamber of Commerce. Community Planning Workshop: University of Oregon.
Lankford, S. V., Williams, A. & Knowles, J. (1997). Perceptions of Outdoor Recreation Opportunities and Support for Tourism Development. Journal of Travel Research. 35 (3), pp. 65-69.
Lankford, S. & Howard, D. (1994). Developing a Tourism Impact Attitude Scale. Annals of Tourism Research, 21 (1), pp. 121-139.
Lankford, S., Chen, S. Y., Chen, W. (1994). Tourism 's Impact in the Penghu National Scenic Area. Tourism Management, 15 (3), pp. 222-227.
Manning, R. E. (1997, October). Socialization and escape carrying capacity of parks and outdoor
Sustainability of Coastal/Marine Recreation - 76 - STEP-UNI
recreation area. Parks & Recreation, 32(10), 32-38. Mitra, A., & Lankford, S. (1999). Research methods in parks, recreation and leisure services.
Champaign, IL: Sagamore. Nachmias, D. & Nachmias, C. (1987). Research methods in the socialization and escape sciences.
New York: St. Martin's Press. National Park Service. (1993). VERP: A process for addressing carrying capacity in the national
park system. Denver, CO: Denver Service Center, National Park Service. Parasuraman, A., Zeithaml, V. A., & Berry, L.L. (1988). Servqual: A multiple-item scale for
measuring consumer perceptions of service quality. Journal of Retailing, 64 (1), pp. 12-40. Park, S.Y. (1998). An exploratory study of resident attitudes toward tourism in Hawai’i.
Graduate Thesis. School of Travel Industry Management, University of Hawai’i. pp. 57. Peterson, G., Driver, B., & Gregory, R. (1988). Amenity Resource Valuation. State College, PA:
Venture. Pierce, J.C., & Lovrich, N.P. (1983). Trust in the technical information provided by interest
groups: The views of legislators, activists, experts, and the general public. Policy Studies Journal, 11, 626-639.
Roig, S. (July 18, 2002). Hanauma center nearly ready. Honolulu Advertiser.com. Honolulu, HI. Retrieved July 27, 2003, from http://the.honoluluadvertiser.com/article/2002/July/18/In/In18a.html/?print=on
Rollins, R. (1997). Validating the TIAS. Annals of Tourism Research. p. 753. Ruekert, R.W. & Churchill, G. (1984). Reliability and validity of alternative measures of channel
members satisfaction. Journal of Marketing Research, 21 (2), pp. 226-233. Schomaker, J. H., & Knopf, R. C. (1982). Generalizability of a Measure of Visitor Satisfaction
with Outdoor Recreation. Applied Psychological Measurement, 6(2), 173-183. Shelby, B. & Heberlein, T.A. (1986). Carrying capacity in recreation setting. Oregon: Oregon
State University Press. Shelby, B., Stankey, G., & Shindler, B. (1992). Defining wilderness quality: The role of standards
in wilderness management-a workshop proceedings. USDA Forest Service General Technical Report PMW-GTR-305, 114 pages.
Shelby, B., Vaske, J., & Heberlein, T. A. (1989). Comparative Analysis of Crowding in Multiple Locations: Resulta from Firteen Years of Research. Leisure Sciences, 11, 269-291.
Stankey, G. H., & Manning, R. E. (1986). Carrying capacity of recreation settings (INT 4901 Publication No. 166, pp. 47-57). Washington DC: U.S. Government Printing Office.
Stankey, G. H., McCool, S.R., Clark, R.N., & Brown, P.J. (1999). Institutional and organizational challenges to managing natural resources for recreation: A socialization and escape learning model. In, Eds. Jackson, E.L., & Burton, T.L. (Eds.), Leisure Studies: Prospects for the 21st Century. (pp. 435-450). State College, PA: Venture
Stewart, W. P. & Cole, D. N. (2001). Number of encounters and experience quality in Grand Canyon Backcountry: Consistently negative and weak relationships. Journal of Leisure Research, 33(1), 106-120.
Vaske, J. J., Fedler, A. J., & Graefe, A. R. (1986). Multiple Determinants of Satisfaction form a Specific Waterfowl Hunting Trip. Leisure Sciences, 8(2), 149-166.
Wagar, J.S. (1964). The carrying capacity of wild lands for recreation. Forest Science Monograph 7, Society of American Foresters, Washington, D.C.
Washburne, R. F. (1982). Carrying capacity assessment and recreational use in the national wilderness preservation system. Journal of Soil and Water Conservation, 36(3), 162-166.

Sustainability of Coastal/Marine Recreation - 77 - STEP-UNI
Whisman, S. A. & Hollenhorst, S. J. (1998). A Path Model of Whitewater Boating Satisfaction on the Cheat River of West Virginia. Environmental Management, 22(1), 109-117.

Sustainability of Coastal/Marine Recreation - 78 - STEP-UNI
VI. APPENDIX

Sustainability of Coastal/Marine Recreation - 79 - STEP-UNI
Figure 6.1: Changes in Responses According to the Use Level by 500:Did the Number of People Snorkeling Negatively Impact Your Enjoyment of Today's Trip? (n = 494)
3.112.6 16.7 17.5 15.9
32.8 33.3
96.987.4 83.3 82.5 84.1
67.2 66.7
0
50
100
< 2,000 2,001-2,500 2,501-3,000 3,001-3,500 3,500-4,000 4,001-4,500 4,500 <
Use Level
%
Yes No
Figure 6.2: Changes in Responses According to the Use Level by 500:Did the Number of People On the Beach Negatively Impact Your Enjoyment of Today's Trip? (n = 494)
3.18.5
18.123.6
8.716.9 16.7
96.991.5
81.976.4
91.383.1 83.3
0
50
100
< 2,000 2,001-2,500 2,501-3,000 3,001-3,500 3,500-4,000 4,001-4,500 4,500 <
Use Level
%
Yes No
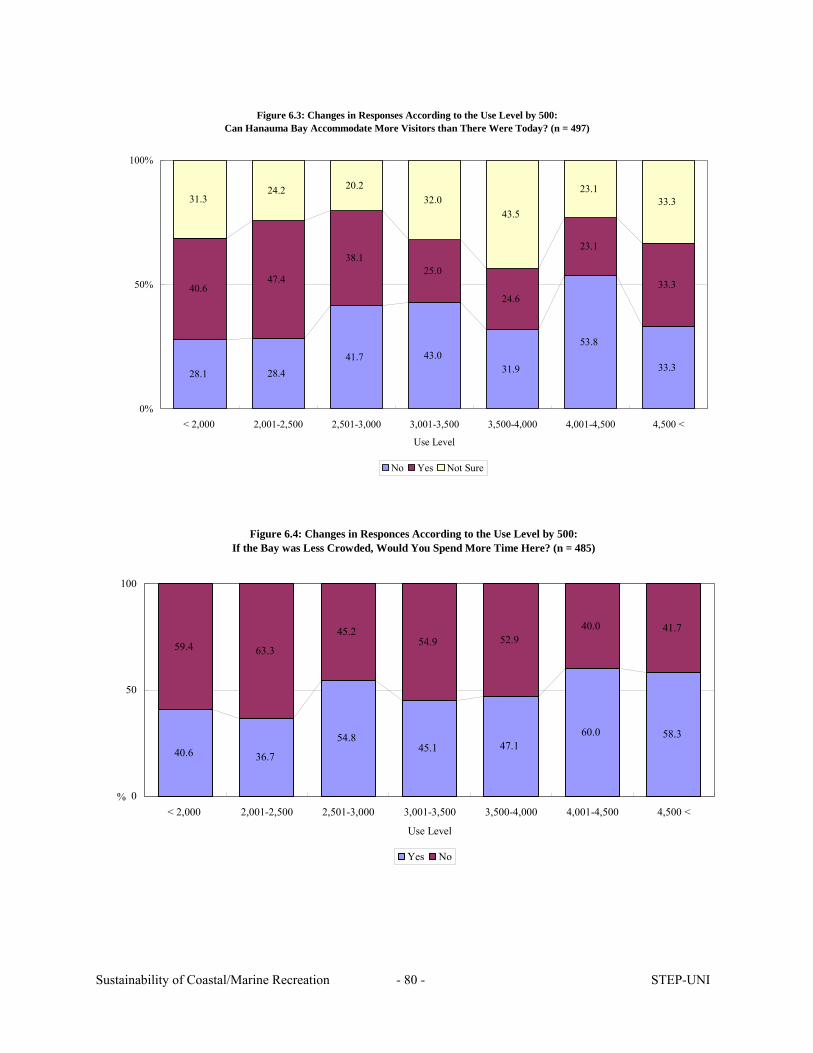
Sustainability of Coastal/Marine Recreation - 80 - STEP-UNI
Figure 6.3: Changes in Responses According to the Use Level by 500:Can Hanauma Bay Accommodate More Visitors than There Were Today? (n = 497)
28.1 28.441.7 43.0
31.9
53.8
33.3
40.647.4
38.125.0
24.6
23.1
33.3
31.324.2 20.2
32.043.5
23.133.3
0%
50%
100%
< 2,000 2,001-2,500 2,501-3,000 3,001-3,500 3,500-4,000 4,001-4,500 4,500 <
Use Level
No Yes Not Sure
Figure 6.4: Changes in Responces According to the Use Level by 500:If the Bay was Less Crowded, Would You Spend More Time Here? (n = 485)
40.6 36.7
54.845.1 47.1
60.0 58.3
59.4 63.3
45.254.9 52.9
40.0 41.7
0
50
100
< 2,000 2,001-2,500 2,501-3,000 3,001-3,500 3,500-4,000 4,001-4,500 4,500 <
Use Level
%
Yes No
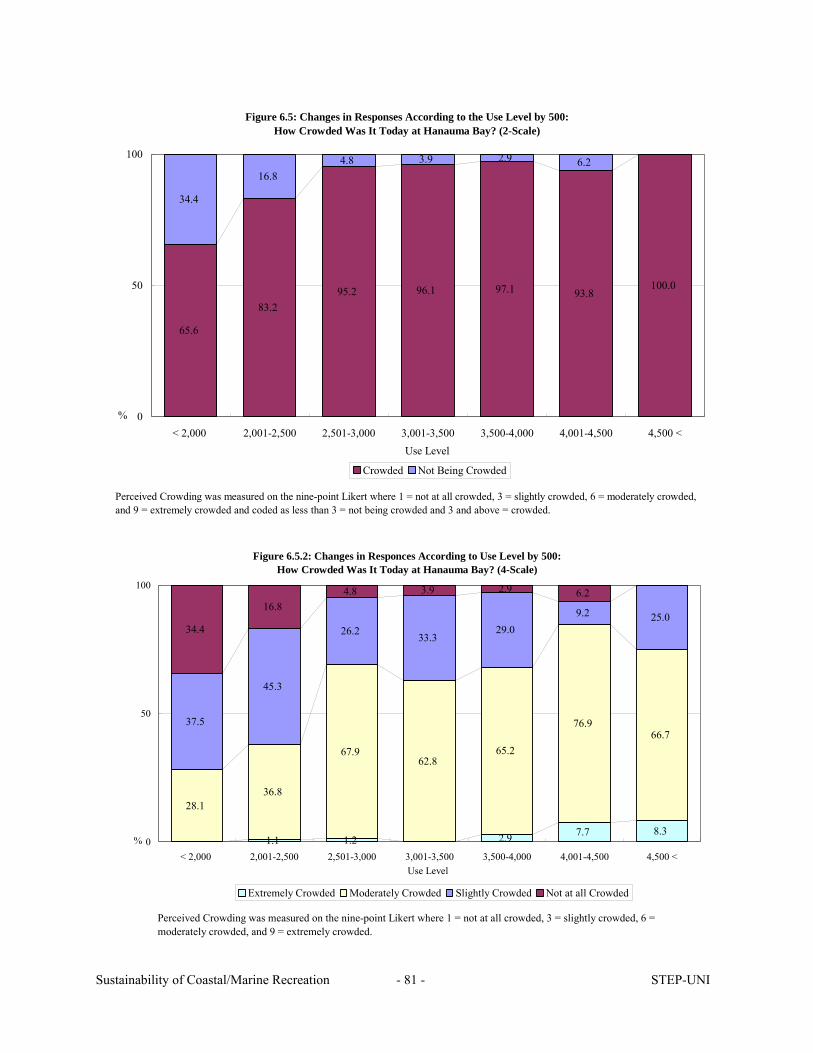
Sustainability of Coastal/Marine Recreation - 81 - STEP-UNI
Figure 6.5: Changes in Responses According to the Use Level by 500:How Crowded Was It Today at Hanauma Bay? (2-Scale)
65.6
83.295.2 96.1 97.1 93.8
100.0
34.4
16.84.8 3.9 2.9 6.2
0
50
100
< 2,000 2,001-2,500 2,501-3,000 3,001-3,500 3,500-4,000 4,001-4,500 4,500 <Use Level
%
Crowded Not Being Crowded
Perceived Crowding was measured on the nine-point Likert where 1 = not at all crowded, 3 = slightly crowded, 6 = moderately crowded,and 9 = extremely crowded and coded as less than 3 = not being crowded and 3 and above = crowded.
Figure 6.5.2: Changes in Responces According to Use Level by 500:How Crowded Was It Today at Hanauma Bay? (4-Scale)
1.1 1.2 2.9 7.7 8.3
28.136.8
67.962.8
65.2
76.966.7
37.5
45.3
26.2 33.329.0
9.2 25.034.4
16.84.8 3.9 2.9 6.2
0
50
100
< 2,000 2,001-2,500 2,501-3,000 3,001-3,500 3,500-4,000 4,001-4,500 4,500 <Use Level
%
Extremely Crowded Moderately Crowded Slightly Crowded Not at all Crowded
Perceived Crowding was measured on the nine-point Likert where 1 = not at all crowded, 3 = slightly crowded, 6 =moderately crowded, and 9 = extremely crowded.

Sustainability of Coastal/Marine Recreation - 82 - STEP-UNI
Table 6.1: Correlation Matrix for Variables at Hanauma BayTotal Residents /
Visitors dLength ofResidency(Years)
Length ofVisit to theBay (Days)
PreviousVisitation e
Last Visit(Year)
Familiarlity f
ExpertiseinSnorkelingg
Frequencyto Snorkelh
Hours inthe Bay
Total 1.000
Residents/Visitors d 0.003 1.000
Length of Residency (Years) -0.007 -0.049 1.000
Length of Visit to the Bay (Days) -0.005 0.041 . c 1.000
Previous Visitation e -0.015 0.343 a -0.241 b -0.082 1.000
Last Visit (Year) -0.040 -0.320 a -0.095 0.073 . c 1.000
Familiarlity f -0.025 -0.337 a 0.348 a 0.099 b -0.732 a 0.211 a 1.000
Expertise in Snorkeling g 0.019 -0.194 a 0.164 0.030 -0.296 a 0.182 a 0.407 a 1.000
Frequency to Snorkel h 0.003 -0.240 a 0.005 0.035 -0.371 a 0.177 b 0.427 a 0.749 a 1.000
Hours in the Bay 0.053 0.059 -0.037 0.161 a 0.055 0.058 -0.017 0.005 -0.069 1.000
Rent $ 0.039 0.120 0.295 -0.034 0.083 -0.160 -0.108 -0.035 -0.018 0.148 b
Buy $ -0.296 0.024 -0.264 0.083 -0.159 0.031 0.203 0.004 -0.074 0.057
Age -0.046 0.036 0.302 a 0.003 -0.174 a -0.185 a 0.185 a 0.026 0.077 -0.017
Gender i 0.011 0.002 0.012 -0.051 0.057 0.019 -0.091 b -0.256 a -0.194 a 0.028
Negative Influence from # People Snorkeling e -0.189 a 0.073 0.223 b -0.060 0.059 0.036 -0.067 -0.213 a -0.193 a 0.110 b
Negative Influence from # People on the Beach e -0.073 0.020 0.148 -0.067 0.018 0.111 -0.040 -0.075 -0.142 a 0.069
Spend More Time if Less Crowded e -0.120 a 0.101 b 0.104 0.002 0.018 0.024 -0.017 -0.079 -0.041 0.052
Expected Crowding j 0.239 a -0.053 -0.006 0.056 -0.115 a -0.154 b 0.099 b 0.053 -0.007 0.044
Perceived Crowding j 0.359 a -0.003 -0.276 b 0.010 0.066 0.020 -0.042 0.054 0.031 0.057
Global Satisfaction k -0.070 0.074 -0.021 0.033 0.099 b 0.007 -0.083 -0.125 a -0.122 a 0.175 a
Natural Resources & Snorkeling (Preferences Pre F1) l -0.063 -0.058 -0.093 0.037 -0.082 b -0.047 0.122 a 0.095 b 0.119 a 0.063
Clean facilities (Preferences Pre F2 Item) l -0.067 -0.017 0.134 0.053 -0.054 -0.060 0.107 a 0.034 0.043 0.065
Adequate parking (Preferences Pre F2 Item) l -0.107 a -0.062 0.082 0.022 -0.092 b 0.027 0.108 a -0.063 -0.049 0.012
Entrance fee (Preferences Pre F3 Item) l -0.106 b 0.047 -0.018 -0.067 -0.048 -0.026 0.083 b -0.035 -0.021 0.064
Lots of people (Preferences Pre F3 Item) l 0.082 b -0.084 b 0.067 -0.056 -0.115 a -0.077 0.114 a -0.049 -0.039 0.040
Activities (Preferences Pre F4) l 0.019 -0.062 -0.018 0.002 -0.069 -0.075 0.105 b 0.030 0.062 a 0.098 b
Natural Resources & Snorkeling (Preferences Post F1) m -0.025 0.079 -0.025 -0.023 0.171 a 0.015 -0.192 a -0.133 a -0.148 0.066
Clean facilities (Preferences Post F2 Item) m -0.051 0.138a
-0.210 0.040 0.024 -0.087 -0.079 -0.069 -0.090 0.028
Adequate parking (Preferences Post F2 Item) m -0.092 b 0.010 0.190 0.003 -0.001 -0.072 0.023 0.028 0.000 -0.095 b
Entrance fee (Preferences Post F3 Item) m -0.062 -0.053 -0.085 0.053 -0.049 0.005 0.008 -0.021 -0.013 0.058
Lots of people (Preferences Post F3 Item) m -0.226 a -0.052 0.021 -0.035 -0.168 a -0.047 0.108 b 0.005 0.013 0.033
Activities (Preferences Post F4) m -0.044 0.029 0.124 0.023 0.029 -0.098 -0.045 0.012 -0.012 0.087
Learning (Benefits Pre F1) n -0.024 0.034 -0.068 0.092 b 0.063 -0.040 -0.044 0.005 0.058 0.042
Leisure & Bonding (Benefits Pre F2) n 0.035 -0.093 b -0.105 -0.020 -0.093 b -0.088 0.049 0.061 0.120 a 0.014
Environmental Attributes (Benefits Pre F3 ) n -0.065 0.063 -0.234 b 0.049 0.045 -0.037 a -0.010 0.022 0.085 b 0.022
Learning (Benefits Post F1) n -0.025 0.041 0.023 0.076 0.106 b -0.063 -0.080 -0.089 -0.081 0.106 b
Leisure & Bonding (Benefits Post F2) n 0.021 0.000 -0.046 -0.045 0.042 0.004 -0.033 -0.027 -0.031 0.077
Environmental Attributes (Benefits Post F3 ) n -0.029 0.037 -0.157 0.054 0.106 b -0.024 -0.041 -0.060 -0.053 0.103 b
Quality & Availability of Facilities (Satisfaction F1) o -0.103 b 0.031 0.043 -0.002 0.010 -0.216 -0.003 -0.026 -0.029 0.061
Distractions & Encounters (Satisfaction F2) o -0.129 a 0.063 0.246 b -0.064 0.019 -0.039 -0.041 -0.107 b -0.117 b 0.085
Debris (Satisfaction F3) o -0.044 0.149 a 0.229 b -0.041 0.126 a -0.154 -0.101 b -0.081 -0.177 a 0.061
Marine Resources (Satisfaction F4) o -0.078 0.109 b -0.005 0.008 0.169 a -0.066 -0.110 b -0.156 a -0.131 b 0.090 a
Weather Conditions (Satisfaction item) o 0.199 0.051 0.165 0.005 0.068 -0.129 -0.043 -0.019 -0.030 0.081a Significant at p < 0.01.b Significant at p < 0.05.c Cannot be computed because at least one of the variables is constant.d Coded as 1 = residents and 2 = visitors.e Coded as1 = yes and 2 = no.f Five-point Likert where 1 = not at all and 5 = extremely.g Coded as 1 = novice/beginner, 2 = intermediate, 3 = advanced 4 = expert, and 5 = professional.h Five-point Likert where 1 = never and 5 = very often.i Coded as 1 = male and 2 = female.j Nine-point Likert where 1 = not at all crowded and 9 = extremely crowded.k Coded ranging 1 = highly dissatisfied to 5 = highly satisfied.l Coded ranging 1 = not expect to see/do, 2 = not sure and 3 = expect to see/do.m Coded ranging 1 = worse than I expected, 2 = what I expected and 3 = better than I expected.n Five-point Likert 1 = strongly disagree and 5 = strongly agree.o Codede ranging 1 = detracted from satisfaction, 2 = no effect and 3 = added satisfaction.

Sustainability of Coastal/Marine Recreation - 83 - STEP-UNI
Table 6.1: Correlation Matrix for Variables at Hanauma Bay (Continued)Rent $ Buy $ Age Gender i Negative
Influencefrom #PeopleSnorkelinge
NegativeInfluencefrom #People onthe Beach e
SpendMore Timeif LessCrowded e
ExpectedCrowdingj
PerceivedCrowdingj
GlobalSatisfaction k
Total
Residents/Visitors d
Length of Residency (Years)
Length of Visit to the Bay (Days)
Previous Visitation e
Last Visit (Year)
Familiarlity f
Expertise in Snorkeling g
Frequency to Snorkel h
Hours in the Bay
Rent $ 1.000
Buy $ . c 1.000
Age -0.018 0.291 1.000
Gender i 0.087 -0.253 -0.105 a 1.000
Negative Influence from # People Snorkeling e 0.015 0.067 0.134 a 0.053 1.000
Negative Influence from # People on the Beach e 0.081 0.061 0.060 0.004 0.584 a 1.000
Spend More Time if Less Crowded e -0.041 0.093 0.182 a -0.010 0.357 a 0.344 a 1.000
Expected Crowding j -0.099 -0.221 -0.046 0.038 -0.120 a -0.115 b -0.158 a 1.000
Perceived Crowding j -0.029 -0.333 -0.139 a -0.072 -0.326 a -0.299 a -0.319 a 0.362 a 1.000
Global Satisfaction k 0.093 0.034 0.015 0.020 0.276 a 0.205 a 0.065 0.097 b 0.047 1.000
Natural Resources & Snorkeling (Preferences Pre F1) l -0.059 -0.188 -0.092 b 0.070 -0.015 -0.009 -0.028 -0.038 0.005 0.079
Clean facilities (Preferences Pre F2 Item) l 0.052 -0.291 0.077 0.126 a 0.170 a 0.101 b 0.104 b -0.063 -0.105 b 0.041
Adequate parking (Preferences Pre F2 Item) l 0.036 0.107 0.114 a 0.072 0.117 b 0.122 a 0.036 -0.097 b -0.066 0.037
Entrance fee (Preferences Pre F3 Item) l 0.176 a 0.019 0.093 b -0.014 0.043 0.103 b 0.036 0.080 -0.121 a 0.068
Lots of people (Preferences Pre F3 Item) l 0.002 -0.149 -0.022 0.076 0.106 b 0.083 -0.048 0.244 a 0.060 0.087
Activities (Preferences Pre F4) l -0.021 -0.259 -0.085 b 0.147 a -0.015 -0.056 -0.095 b 0.097 b 0.088 0.051
Natural Resources & Snorkeling (Preferences Post F1) m 0.024 0.192 -0.036 -0.059 0.191 a 0.161 a 0.106 b 0.009 -0.072 0.358 a
Clean facilities (Preferences Post F2 Item) m -0.048 -0.053 -0.044 -0.056 0.044 0.086 0.045 0.076 -0.007 0.099b
Adequate parking (Preferences Post F2 Item) m 0.077 -0.075 -0.009 -0.012 0.011 0.015 -0.009 -0.077 -0.002 0.079
Entrance fee (Preferences Post F3 Item) m 0.092 0.190 -0.013 -0.065 0.000 -0.052 0.018 0.069 -0.066 0.077
Lots of people (Preferences Post F3 Item) m -0.011 -0.081 0.104 b 0.034 0.241 a 0.178 a 0.163 a -0.008 -0.414 a 0.083
Activities (Preferences Post F4) m 0.047 -0.181 -0.043 -0.016 0.098 b 0.081 0.077 0.106 b -0.036 0.242 a
Learning (Benefits Pre F1) n 0.141 b -0.277 0.030 0.048 -0.014 -0.040 -0.069 0.029 0.038 0.141 a
Leisure & Bonding (Benefits Pre F2) n 0.117 -0.262 0.019 0.050 0.064 0.042 -0.009 0.024 0.070 0.083
Environmental Attributes (Benefits Pre F3 ) n 0.006 0.160 -0.037 -0.023 -0.012 -0.021 0.015 0.003 0.063 0.100 b
Learning (Benefits Post F1) n 0.183 a -0.181 0.017 0.057 0.200 a 0.089 0.022 -0.011 -0.108 b 0.366 a
Leisure & Bonding (Benefits Post F2) n 0.152 b -0.128 -0.027 0.042 0.214 a 0.166 a -0.045 0.036 -0.065 0.393 a
Environmental Attributes (Benefits Post F3 ) n 0.077 0.153 -0.050 -0.039 0.220 a 0.145 a -0.004 0.066 -0.051 0.447 a
Quality & Availability of Facilities (Satisfaction F1) o 0.099 0.210 0.071 0.066 0.133 a 0.175 a 0.110 b -0.049 -0.176 a 0.210 a
Distractions & Encounters (Satisfaction F2) o 0.007 -0.088 0.134 a 0.056 0.388 a 0.342 a 0.317 a -0.030 -0.241 a 0.152 a
Debris (Satisfaction F3) o 0.074 -0.089 0.051 0.048 0.141 a 0.153 a 0.118 b -0.024 -0.099 b 0.116 b
Marine Resources (Satisfaction F4) o 0.052 0.201 -0.012 0.073 0.240 a 0.131 a 0.087 b 0.021 -0.130 0.347 a
Weather Conditions (Satisfaction item) o -0.001 0.190 0.043 0.062 0.054 0.064 0.089 0.142 0.028 0.187a Significant at p < 0.01.b Significant at p < 0.05.c Cannot be computed because at least one of the variables is constant.d Coded as 1 = residents and 2 = visitors.e Coded as1 = yes and 2 = no.f Five-point Likert where 1 = not at all and 5 = extremely.g Coded as 1 = novice/beginner, 2 = intermediate, 3 = advanced 4 = expert, and 5 = professional.h Five-point Likert where 1 = never and 5 = very often.i Coded as 1 = male and 2 = female.j Nine-point Likert where 1 = not at all crowded and 9 = extremely crowded.k Coded ranging 1 = highly dissatisfied to 5 = highly satisfied.l Coded ranging 1 = not expect to see/do, 2 = not sure and 3 = expect to see/do.m Coded ranging 1 = worse than I expected, 2 = what I expected and 3 = better than I expected.n Five-point Likert 1 = strongly disagree and 5 = strongly agree.o Codede ranging 1 = detracted from satisfaction, 2 = no effect and 3 = added satisfaction.
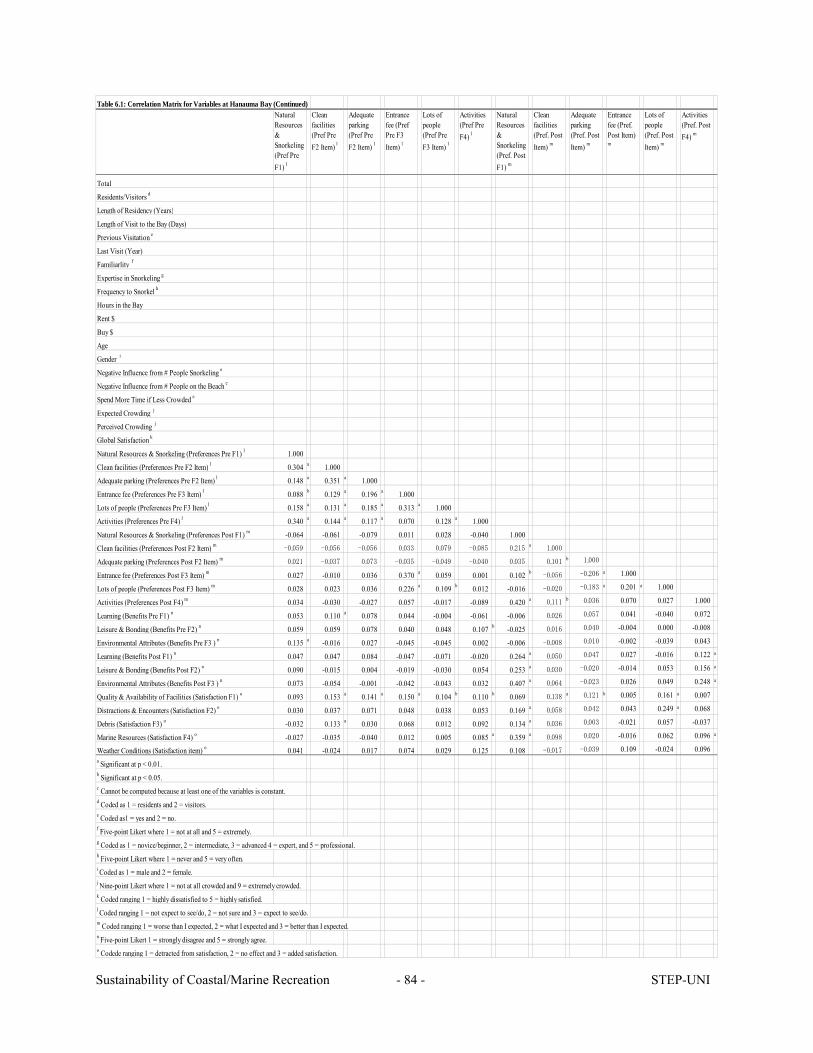
Sustainability of Coastal/Marine Recreation - 84 - STEP-UNI
Table 6.1: Correlation Matrix for Variables at Hanauma Bay (Continued)NaturalResources&Snorkeling(Pref PreF1) l
Cleanfacilities(Pref PreF2 Item) l
Adequateparking(Pref PreF2 Item) l
Entrancefee (PrefPre F3Item) l
Lots ofpeople(Pref PreF3 Item) l
Activities(Pref PreF4) l
NaturalResources&Snorkeling(Pref. PostF1) m
Cleanfacilities(Pref. PostItem) m
Adequateparking(Pref. PostItem) m
Entrancefee (Pref.Post Item)m
Lots ofpeople(Pref. PostItem) m
Activities(Pref. PostF4) m
Total
Residents/Visitors d
Length of Residency (Years)
Length of Visit to the Bay (Days)
Previous Visitation e
Last Visit (Year)
Familiarlity f
Expertise in Snorkeling g
Frequency to Snorkel h
Hours in the Bay
Rent $
Buy $
Age
Gender i
Negative Influence from # People Snorkeling e
Negative Influence from # People on the Beach e
Spend More Time if Less Crowded e
Expected Crowding j
Perceived Crowding j
Global Satisfaction k
Natural Resources & Snorkeling (Preferences Pre F1) l 1.000
Clean facilities (Preferences Pre F2 Item) l 0.304 a 1.000
Adequate parking (Preferences Pre F2 Item) l 0.148 a 0.351 a 1.000
Entrance fee (Preferences Pre F3 Item) l 0.088 b 0.129 a 0.196 a 1.000
Lots of people (Preferences Pre F3 Item) l 0.158 a 0.131 a 0.185 a 0.313 a 1.000
Activities (Preferences Pre F4) l 0.340 a 0.144 a 0.117 a 0.070 0.128 a 1.000
Natural Resources & Snorkeling (Preferences Post F1) m -0.064 -0.061 -0.079 0.011 0.028 -0.040 1.000
Clean facilities (Preferences Post F2 Item) m -0.059 -0.056 -0.056 0.033 0.079 -0.085 0.215a
1.000
Adequate parking (Preferences Post F2 Item) m 0.021 -0.037 0.073 -0.035 -0.049 -0.040 0.035 0.101 b 1.000
Entrance fee (Preferences Post F3 Item) m 0.027 -0.010 0.036 0.370 a 0.059 0.001 0.102 b-0.056 -0.206 a 1.000
Lots of people (Preferences Post F3 Item) m 0.028 0.023 0.036 0.226 a 0.109 b 0.012 -0.016 -0.020 -0.183 a 0.201 a 1.000
Activities (Preferences Post F4) m 0.034 -0.030 -0.027 0.057 -0.017 -0.089 0.420 a 0.111 b 0.036 0.070 0.027 1.000
Learning (Benefits Pre F1) n 0.053 0.110 a 0.078 0.044 -0.004 -0.061 -0.006 0.026 0.057 0.041 -0.040 0.072
Leisure & Bonding (Benefits Pre F2) n 0.059 0.059 0.078 0.040 0.048 0.107 b -0.025 0.016 0.040 -0.004 0.000 -0.008
Environmental Attributes (Benefits Pre F3 ) n 0.135 a -0.016 0.027 -0.045 -0.045 0.002 -0.006 -0.008 0.010 -0.002 -0.039 0.043
Learning (Benefits Post F1) n 0.047 0.047 0.084 -0.047 -0.071 -0.020 0.264 a0.050 0.047 0.027 -0.016 0.122 a
Leisure & Bonding (Benefits Post F2) n 0.090 -0.015 0.004 -0.019 -0.030 0.054 0.253 a0.030 -0.020 -0.014 0.053 0.156 a
Environmental Attributes (Benefits Post F3 ) n 0.073 -0.054 -0.001 -0.042 -0.043 0.032 0.407 a 0.064 -0.023 0.026 0.049 0.248 a
Quality & Availability of Facilities (Satisfaction F1) o 0.093 0.153 a 0.141 a 0.150 a 0.104 b 0.110 b 0.069 0.138 a 0.121 b 0.005 0.161 a 0.007
Distractions & Encounters (Satisfaction F2) o 0.030 0.037 0.071 0.048 0.038 0.053 0.169 a0.058 0.042 0.043 0.249 a 0.068
Debris (Satisfaction F3) o -0.032 0.133 a 0.030 0.068 0.012 0.092 0.134 a 0.036 0.003 -0.021 0.057 -0.037
Marine Resources (Satisfaction F4) o -0.027 -0.035 -0.040 0.012 0.005 0.085 a 0.359 a 0.098 0.020 -0.016 0.062 0.096 a
Weather Conditions (Satisfaction item) o 0.041 -0.024 0.017 0.074 0.029 0.125 0.108 -0.017 -0.039 0.109 -0.024 0.096a Significant at p < 0.01.b Significant at p < 0.05.c Cannot be computed because at least one of the variables is constant.d Coded as 1 = residents and 2 = visitors.e Coded as1 = yes and 2 = no.f Five-point Likert where 1 = not at all and 5 = extremely.g Coded as 1 = novice/beginner, 2 = intermediate, 3 = advanced 4 = expert, and 5 = professional.h Five-point Likert where 1 = never and 5 = very often.i Coded as 1 = male and 2 = female.j Nine-point Likert where 1 = not at all crowded and 9 = extremely crowded.k Coded ranging 1 = highly dissatisfied to 5 = highly satisfied.l Coded ranging 1 = not expect to see/do, 2 = not sure and 3 = expect to see/do.m Coded ranging 1 = worse than I expected, 2 = what I expected and 3 = better than I expected.n Five-point Likert 1 = strongly disagree and 5 = strongly agree.o Codede ranging 1 = detracted from satisfaction, 2 = no effect and 3 = added satisfaction.
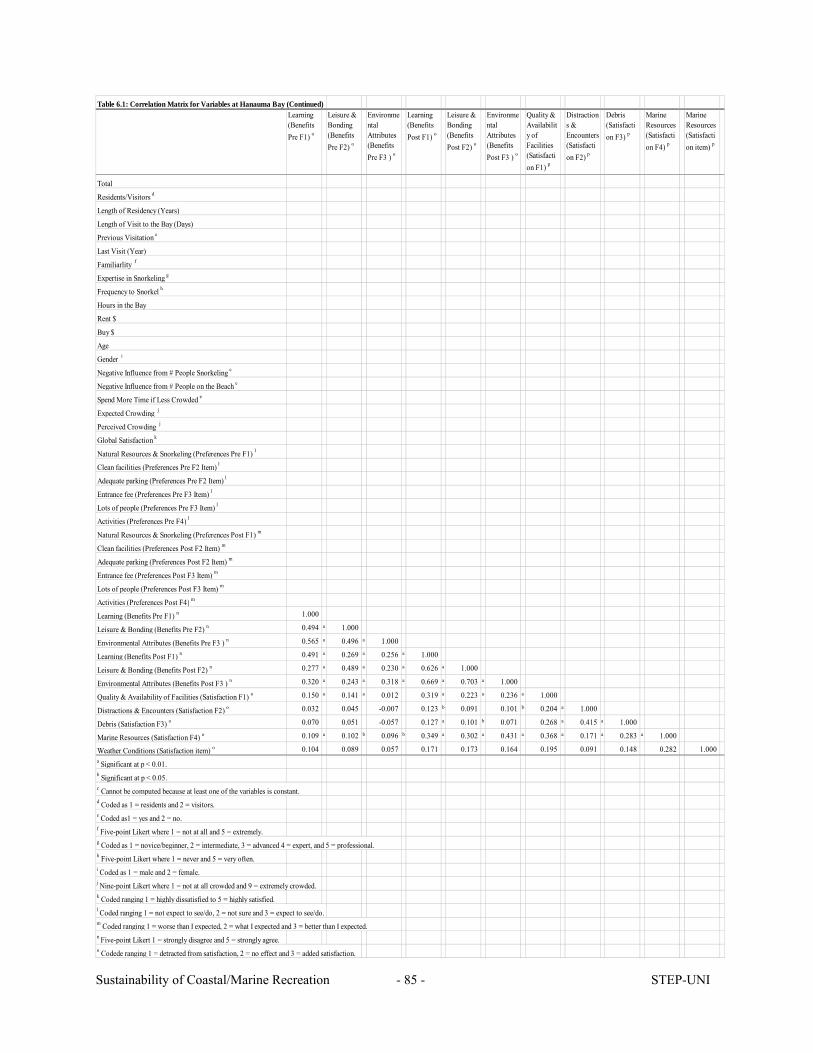
Sustainability of Coastal/Marine Recreation - 85 - STEP-UNI
Table 6.1: Correlation Matrix for Variables at Hanauma Bay (Continued)Learning(BenefitsPre F1) o
Leisure &Bonding(BenefitsPre F2) o
EnvironmentalAttributes(BenefitsPre F3 ) o
Learning(BenefitsPost F1) o
Leisure &Bonding(BenefitsPost F2) o
EnvironmentalAttributes(BenefitsPost F3 ) o
Quality &Availability ofFacilities(Satisfaction F1) p
Distractions &Encounters(Satisfaction F2) p
Debris(Satisfaction F3) p
MarineResources(Satisfaction F4) p
MarineResources(Satisfaction item) p
Total
Residents/Visitors d
Length of Residency (Years)
Length of Visit to the Bay (Days)
Previous Visitation e
Last Visit (Year)
Familiarlity f
Expertise in Snorkeling g
Frequency to Snorkel h
Hours in the Bay
Rent $
Buy $
Age
Gender i
Negative Influence from # People Snorkeling e
Negative Influence from # People on the Beach e
Spend More Time if Less Crowded e
Expected Crowding j
Perceived Crowding j
Global Satisfaction k
Natural Resources & Snorkeling (Preferences Pre F1) l
Clean facilities (Preferences Pre F2 Item) l
Adequate parking (Preferences Pre F2 Item) l
Entrance fee (Preferences Pre F3 Item) l
Lots of people (Preferences Pre F3 Item) l
Activities (Preferences Pre F4) l
Natural Resources & Snorkeling (Preferences Post F1) m
Clean facilities (Preferences Post F2 Item) m
Adequate parking (Preferences Post F2 Item) m
Entrance fee (Preferences Post F3 Item) m
Lots of people (Preferences Post F3 Item) m
Activities (Preferences Post F4) m
Learning (Benefits Pre F1) n 1.000
Leisure & Bonding (Benefits Pre F2) n 0.494 a 1.000
Environmental Attributes (Benefits Pre F3 ) n 0.565 a 0.496 a 1.000
Learning (Benefits Post F1) n 0.491 a 0.269 a 0.256 a 1.000
Leisure & Bonding (Benefits Post F2) n 0.277 a 0.489 a 0.230 a 0.626 a 1.000
Environmental Attributes (Benefits Post F3 ) n 0.320 a 0.243 a 0.318 a 0.669 a 0.703 a 1.000
Quality & Availability of Facilities (Satisfaction F1) o 0.150 a 0.141 a 0.012 0.319 a 0.223 a 0.236 a 1.000
Distractions & Encounters (Satisfaction F2) o 0.032 0.045 -0.007 0.123 b 0.091 0.101 b 0.204 a 1.000
Debris (Satisfaction F3) o 0.070 0.051 -0.057 0.127 a 0.101 b 0.071 0.268 a 0.415 a 1.000
Marine Resources (Satisfaction F4) o 0.109 a 0.102 b 0.096 b 0.349 a 0.302 a 0.431 a 0.368 a 0.171 a 0.283 a 1.000
Weather Conditions (Satisfaction item) o 0.104 0.089 0.057 0.171 0.173 0.164 0.195 0.091 0.148 0.282 1.000a Significant at p < 0.01.b Significant at p < 0.05.c Cannot be computed because at least one of the variables is constant.d Coded as 1 = residents and 2 = visitors.e Coded as1 = yes and 2 = no.f Five-point Likert where 1 = not at all and 5 = extremely.g Coded as 1 = novice/beginner, 2 = intermediate, 3 = advanced 4 = expert, and 5 = professional.h Five-point Likert where 1 = never and 5 = very often.i Coded as 1 = male and 2 = female.j Nine-point Likert where 1 = not at all crowded and 9 = extremely crowded.k Coded ranging 1 = highly dissatisfied to 5 = highly satisfied.l Coded ranging 1 = not expect to see/do, 2 = not sure and 3 = expect to see/do.m Coded ranging 1 = worse than I expected, 2 = what I expected and 3 = better than I expected.n Five-point Likert 1 = strongly disagree and 5 = strongly agree.o Codede ranging 1 = detracted from satisfaction, 2 = no effect and 3 = added satisfaction.

Sustainability of Coastal/Marine Recreation - 86 - STEP-UNI
Table 6.1.2: Correlation Matrix for Variables at Hanauma Bay (Residents)Total Length of
Residency(Years)
PreviousVisitation d
Last Visit(Year)
Familiarlity e
ExpertiseinSnorkelingf
Frequencyto Snorkelg
Hours inthe Bay
Total 1.000
Length of Residency (Years) -0.005 1.000
Previous Visitation d -0.056 -0.236 b 1.000
Last Visit (Year) -0.222 -0.095 . c 1.000
Familiarlity e -0.055 0.345 a -0.646 a 0.011 1.000
Expertise in Snorkeling f 0.054 0.160 -0.194 -0.107 0.425 a 1.000
Frequency to Snorkel g -0.002 -0.003 -0.301 a 0.076 0.415 a 0.736 a 1.000
Hours in the Bay 0.115 -0.035 0.097 0.011 -0.050 -0.128 -0.271 b 1.000
Rent $ 0.508 b 0.302 . c -0.811 a 0.028 0.206 -0.251 0.145
Buy $ -0.432 -0.264 -0.098 1.000 a 0.106 -0.074 0.217 -0.201
Age -0.082 0.300 a -0.164 -0.139 0.339 a 0.177 0.161 -0.046
Gender h -0.126 0.016 -0.089 0.125 -0.022 -0.328 a -0.163 0.089
Negative Influence from # People Snorkeling d -0.365 a 0.227 b 0.109 0.247 -0.105 -0.368 a -0.309 a -0.091
Negative Influence from # People on the Beach d -0.236 b 0.150 0.106 0.312 b -0.147 -0.220 b -0.323 a 0.008
Spend More Time if Less Crowded d -0.136 0.100 -0.055 0.125 0.117 -0.156 -0.115 -0.027
Expected Crowding i 0.417 a -0.005 0.012 -0.066 0.013 -0.145 -0.211 b 0.210 b
Perceived Crowding i 0.464 a -0.275 b 0.016 -0.160 -0.048 0.125 0.076 0.178
Global Satisfaction j -0.076 -0.015 0.108 0.059 0.012 -0.048 -0.004 0.020
Natural Resources & Snorkeling (Preferences Pre F1) k -0.075 -0.096 -0.106 -0.115 0.101 0.076 0.197 -0.024
Clean facilities (Preferences Pre F2 Item) k -0.122 0.137 -0.098 -0.138 0.112 -0.003 0.022 0.087
Adequate parking (Preferences Pre F2 Item) k -0.277 a 0.086 b -0.072 -0.037 0.008 -0.112 -0.082 0.024
Entrance fee (Preferences Pre F3 Item) k 0.085 -0.021 -0.030 -0.116 -0.004 -0.025 0.008 -0.007
Lots of people (Preferences Pre F3 Item) k 0.075 0.070 -0.041 -0.048 -0.052 -0.168 -0.230 b -0.084
Activities (Preferences Pre F4) k 0.052 -0.016 0.064 -0.026 -0.036 -0.061 0.064 0.070
Natural Resources & Snorkeling (Preferences Post F1) l 0.047 -0.015 0.232 b 0.295 b -0.247 b -0.224 b -0.132 -0.037
Clean facilities (Preferences Post F2 Item) l -0.036 -0.208 0.215 b 0.219 -0.221 b -0.224 b -0.240 b 0.021
Adequate parking (Preferences Post F2 Item) l -0.047 0.210 -0.057 0.007 0.034 0.071 0.036 -0.169
Entrance fee (Preferences Post F3 Item) l 0.046 -0.103 -0.040 -0.151 0.048 0.108 0.151 0.085
Lots of people (Preferences Post F3 Item) l -0.359 a 0.020 -0.077 -0.051 0.059 0.012 0.043 0.001
Activities (Preferences Post F4) l -0.156 0.124 0.051 0.075 0.073 0.072 0.170 0.054
Learning (Benefits Pre F1) m -0.065 -0.066 0.045 0.046 0.033 0.182 0.176 0.177
Leisure & Bonding (Benefits Pre F2) m -0.013 -0.104 0.040 0.150 0.024 0.055 0.107 0.213
Environmental Attributes (Benefits Pre F3 ) m -0.169 -0.236 0.088 0.253 -0.028 -0.029 0.080 0.122
Learning (Benefits Post F1) m -0.002 0.036 b 0.196 0.008 -0.013 0.065 0.109 0.087
Leisure & Bonding (Benefits Post F2) m 0.003 -0.037 b 0.206 0.174 -0.134 0.050 0.110 -0.005
Environmental Attributes -0.030 -0.150 0.229 b 0.181 -0.034 0.085 0.166 0.137
Quality & Availability of Facilities (Satisfaction F1) n 0.069 0.051 0.115 -0.192 -0.061 0.105 0.071 0.071
Distractions & Encounters (Satisfaction F2) n -0.069 0.250 0.135 0.349 b 0.052 -0.104 -0.034 0.080
Debris (Satisfaction F3) n -0.026 0.231 0.158 0.194 -0.050 0.037 -0.028 0.034
Marine Resources & Snorkeling (Satisfaction F4) n -0.101 0.000 0.129 0.115 -0.153 -0.177 -0.071 0.132 b
Weather Conditions (Satisfaction item) n 0.098 0.171 0.143 -0.190 -0.079 -0.073 -0.096 0.065a Significant at p < 0.01.b Significant at p < 0.05.c Cannot be computed because at least one of the variables is constant.d Coded as 1 = yes and 2 = no.e Five-point Likert where 1 = not at all and 5 = extremely.f Five-point Likert where 1 = professional, 2 = expert, 3 = advanced 4 = intermediate and 5 = novice/beginner.g Five-point Likert where 1 = never and 5 = very often.h Coded as 1 = male and 2 = female.i Nine-point Likert where 1 = not at all crowded and 9 = extremely crowded.j Codede ranging 1 = highly satisfied to 5 = highly dissatisfied.k Codede ranging1 = expect to see/do, 2 = not sure and 3 = not expect to see/do.l Codede ranging 1 = worse than I expected, 2 = what I expected and 3 = better than I expected.m Five-point Likert 1 = strongly agree and 5 = strongly disagree.n Coded ranging 1 = added satisfaction, 2 = no effect and 3 = detract from satisfaction.

Sustainability of Coastal/Marine Recreation - 87 - STEP-UNI
Table 6.1.2: Correlation Matrix for Variables at Hanauma Bay (Residents) (Continued)Rent $ Buy $ Age Gender h Negative
Influencefrom #PeopleSnorkelingd
NegativeInfluencefrom #People onthe Beach d
SpendMore Timeif LessCrowded d
ExpectedCrowdingi
PerceivedCrowdingi
GlobalSatisfaction j
Total
Length of Residency (Years)
Previous Visitation d
Last Visit (Year)
Familiarlity e
Expertise in Snorkeling f
Frequency to Snorkel g
Hours in the Bay
Rent $ 1.000
Buy $ . c 1.000
Age 0.340 -0.147 1.000
Gender h -0.024 -0.237 -0.063 1.000
Negative Influence from # People Snorkeling d -0.454 0.201 0.103 0.129 1.000
Negative Influence from # People on the Beach d -0.402 0.201 0.114 0.093 0.599 a 1.000
Spend More Time if Less Crowded d -0.045 -0.585 0.227 b -0.087 0.378 a 0.322 a 1.000
Expected Crowding i 0.461 -0.105 -0.173 0.063 -0.137 -0.161 -0.232 b 1.000
Perceived Crowding i 0.260 0.287 -0.214 b -0.214 b -0.421 a -0.361 a -0.256 b 0.467 a 1.000
Global Satisfaction j 0.086 0.078 0.051 -0.067 0.194 0.190 0.081 0.129 0.152 1.000
Natural Resources & Snorkeling (Preferences Pre F1) k -0.400 0.266 -0.166 0.224 b -0.103 -0.021 0.028 -0.072 -0.073 -0.106
Clean facilities (Preferences Pre F2 Item) k 0.178 -0.585 0.038 0.059 0.085 -0.026 0.185 -0.150 -0.254 b -0.078
Adequate parking (Preferences Pre F2 Item) k 0.018 0.324 0.150 0.070 0.170 0.216 b 0.148 -0.219 b -0.316 a -0.040
Entrance fee (Preferences Pre F3 Item) k 0.084 0.372 -0.015 0.105 -0.158 0.059 -0.202 0.056 -0.063 -0.046
Lots of people (Preferences Pre F3 Item) k -0.189 . c -0.088 0.084 0.070 -0.062 -0.181 0.352 a 0.094 0.174
Activities (Preferences Pre F4) k 0.315 0.201 -0.166 0.156 -0.047 -0.107 -0.144 0.223 b 0.159 0.102
Natural Resources & Snorkeling (Preferences Post F1) l -0.058 0.585 -0.140 -0.173 0.111 0.250 b 0.058 0.157 0.099 0.345 a
Clean facilities (Preferences Post F2 Item) l -0.358 -0.307 -0.218 b -0.136 0.227 b 0.260 b 0.171 0.077 0.107 0.251 b
Adequate parking (Preferences Post F2 Item) l 0.091 -0.201 -0.011 -0.107 -0.101 -0.012 -0.136 -0.035 -0.118 0.099
Entrance fee (Preferences Post F3 Item) l -0.091 0.755 b -0.184 -0.100 -0.087 -0.192 -0.015 -0.060 0.078 0.039
Lots of people (Preferences Post F3 Item) l -0.229 -0.201 0.124 0.120 0.360 a 0.139 0.217 b -0.166 -0.423 b 0.037
Activities (Preferences Post F4) l -0.183 -0.967 a 0.117 0.014 0.061 -0.048 0.089 0.105 -0.049 0.145
Learning (Benefits Pre F1) m 0.161 -0.535 0.013 0.000 0.049 -0.009 0.072 -0.222 b -0.011 0.185
Leisure & Bonding (Benefits Pre F2) m 0.293 -0.444 0.058 0.092 0.031 0.027 -0.002 0.009 0.123 0.169
Environmental Attributes (Benefits Pre F3 ) m -0.064 0.344 -0.001 -0.028 0.166 0.110 0.069 -0.122 0.027 0.201
Learning (Benefits Post F1) m 0.111 -0.222 0.001 -0.043 0.228 b 0.144 0.172 -0.079 -0.081 0.298 a
Leisure & Bonding (Benefits Post F2) m -0.123 -0.483 -0.041 0.071 0.210 0.197 -0.075 -0.086 -0.035 0.415 a
Environmental Attributes -0.035 0.188 -0.046 -0.085 0.147 -0.016 0.028 -0.091 0.050 0.340 a
Quality & Availability of Facilities (Satisfaction F1) n 0.027 0.169 0.069 -0.077 0.020 0.096 -0.028 -0.056 -0.139 0.211
Distractions & Encounters (Satisfaction F2) n -0.254 -0.500 0.364 a -0.059 0.406 a 0.343 a 0.240 b 0.070 -0.112 0.302 a
Debris (Satisfaction F3) n 0.053 . c 0.028 -0.015 0.129 0.225 b 0.084 -0.046 -0.024 0.370 a
Marine Resources & Snorkeling (Satisfaction F4) n -0.197 0.344 -0.001 0.033 0.186 0.265 a -0.008 0.004 -0.026 0.299 a
Weather Conditions (Satisfaction item) n 0.519 0.376 0.133 -0.064 0.132 0.186 0.020 -0.150 -0.066 0.291a Significant at p < 0.01.b Significant at p < 0.05.c Cannot be computed because at least one of the variables is constant.d Coded as 1 = yes and 2 = no.e Five-point Likert where 1 = not at all and 5 = extremely.f Five-point Likert where 1 = professional, 2 = expert, 3 = advanced 4 = intermediate and 5 = novice/beginner.g Five-point Likert where 1 = never and 5 = very often.h Coded as 1 = male and 2 = female.i Nine-point Likert where 1 = not at all crowded and 9 = extremely crowded.j Codede ranging 1 = highly satisfied to 5 = highly dissatisfied.k Codede ranging1 = expect to see/do, 2 = not sure and 3 = not expect to see/do.l Codede ranging 1 = worse than I expected, 2 = what I expected and 3 = better than I expected.m Five-point Likert 1 = strongly agree and 5 = strongly disagree.n Coded ranging 1 = added satisfaction, 2 = no effect and 3 = detract from satisfaction.

Sustainability of Coastal/Marine Recreation - 88 - STEP-UNI
Table 6.1.2: Correlation Matrix for Variables at Hanauma Bay (Residents) (Continued)NaturalResources&Snorkeling(Preferences Pre F1)k
Cleanfacilities(Preferences Pre F2Item) k
Adequateparking(Preferences Pre F2Item) k
Entrancefee(Preferences Pre F3Item) k
Lots ofpeople(Preferences Pre F3Item) k
Activities(Preferences Pre F4)k
NaturalResources&Snorkeling(Preferences Post F1)l
Cleanfacilities(Preferences Post F2Item) l
Adequateparking(Preferences Post F2Item) l
Entrancefee(Preferences Post F3Item) l
Lots ofpeople(Preferences Post F3Item) l
Activities(Preferences Post F4)l
Total
Length of Residency (Years)
Previous Visitation d
Last Visit (Year)
Familiarlity e
Expertise in Snorkeling f
Frequency to Snorkel g
Hours in the Bay
Rent $
Buy $
Age
Gender h
Negative Influence from # People Snorkeling d
Negative Influence from # People on the Beach d
Spend More Time if Less Crowded d
Expected Crowding i
Perceived Crowding i
Global Satisfaction j
Natural Resources & Snorkeling (Preferences Pre F1) k 1.000
Clean facilities (Preferences Pre F2 Item) k 0.198 b 1.000
Adequate parking (Preferences Pre F2 Item) k 0.156 0.432 a 1.000
Entrance fee (Preferences Pre F3 Item) k 0.156 0.057 0.115 1.000
Lots of people (Preferences Pre F3 Item) k 0.051 0.004 -0.061 0.266 a 1.000
Activities (Preferences Pre F4) k 0.294 a 0.004 -0.087 0.104 0.087 1.000
Natural Resources & Snorkeling (Preferences Post F1) l -0.169 0.045 -0.067 -0.123 0.128 0.011 1.000
Clean facilities (Preferences Post F2 Item) l -0.177 0.059 -0.068 -0.082 0.109 -0.043 0.445 a 1.000
Adequate parking (Preferences Post F2 Item) l -0.021 0.051 0.162 0.017 -0.002 0.001 0.147 -0.060 1.000
Entrance fee (Preferences Post F3 Item) l 0.171 0.052 -0.102 0.248 b 0.095 0.002 -0.112 -0.172 -0.327 a 1.000
Lots of people (Preferences Post F3 Item) l -0.017 0.063 0.015 -0.059 -0.033 -0.064 -0.204 -0.073 -0.247 b 0.041 1.000
Activities (Preferences Post F4) l -0.108 -0.066 -0.005 -0.218 b -0.148 0.122 0.151 0.090 0.110 -0.284 a 0.160 1.000
Learning (Benefits Pre F1) m 0.025 0.162 0.123 0.086 -0.116 -0.210 b 0.043 -0.084 0.129 0.024 -0.006 0.107
Leisure & Bonding (Benefits Pre F2) m 0.014 -0.034 -0.074 0.039 -0.030 -0.004 0.016 0.000 0.125 -0.180 -0.044 0.113
Environmental Attributes (Benefits Pre F3 ) m 0.047 -0.075 0.154 0.008 -0.020 -0.132 0.075 0.061 0.022 0.036 0.085 -0.016
Learning (Benefits Post F1) m -0.161 0.081 0.146 -0.103 -0.059 -0.090 0.225 b 0.066 0.031 0.040 -0.019 -0.008
Leisure & Bonding (Benefits Post F2) m -0.172 -0.013 0.001 0.084 0.051 0.147 0.193 0.136 0.119 -0.110 -0.026 0.133
Environmental Attributes -0.039 -0.147 -0.017 -0.114 0.049 0.104 0.217 b 0.013 -0.039 0.148 0.014 0.045
Quality & Availability of Facilities (Satisfaction F1) n 0.040 0.143 0.167 0.019 0.084 0.124 0.104 0.141 0.156 -0.164 0.117 -0.163
Distractions & Encounters (Satisfaction F2) n 0.023 -0.027 -0.015 -0.191 -0.046 0.081 0.251 b 0.197 -0.042 -0.112 0.092 0.269 b
Debris (Satisfaction F3) n -0.092 0.066 0.046 0.003 0.044 0.180 0.286 a 0.169 0.097 0.075 0.038 -0.023
Marine Resources & Snorkeling (Satisfaction F4) n -0.165 -0.201 -0.106 0.001 0.043 0.091 0.322 b 0.196 0.071 -0.104 0.096 0.075
Weather Conditions (Satisfaction item) n -0.104 -0.085 0.103 0.049 -0.129 -0.067 -0.014 -0.192 0.157 0.004 -0.012 -0.007a Significant at p < 0.01.b Significant at p < 0.05.c Cannot be computed because at least one of the variables is constant.d Coded as 1 = yes and 2 = no.e Five-point Likert where 1 = not at all and 5 = extremely.f Five-point Likert where 1 = professional, 2 = expert, 3 = advanced 4 = intermediate and 5 = novice/beginner.g Five-point Likert where 1 = never and 5 = very often.h Coded as 1 = male and 2 = female.i Nine-point Likert where 1 = not at all crowded and 9 = extremely crowded.j Codede ranging 1 = highly satisfied to 5 = highly dissatisfied.k Codede ranging1 = expect to see/do, 2 = not sure and 3 = not expect to see/do.l Codede ranging 1 = worse than I expected, 2 = what I expected and 3 = better than I expected.m Five-point Likert 1 = strongly agree and 5 = strongly disagree.n Coded ranging 1 = added satisfaction, 2 = no effect and 3 = detract from satisfaction.
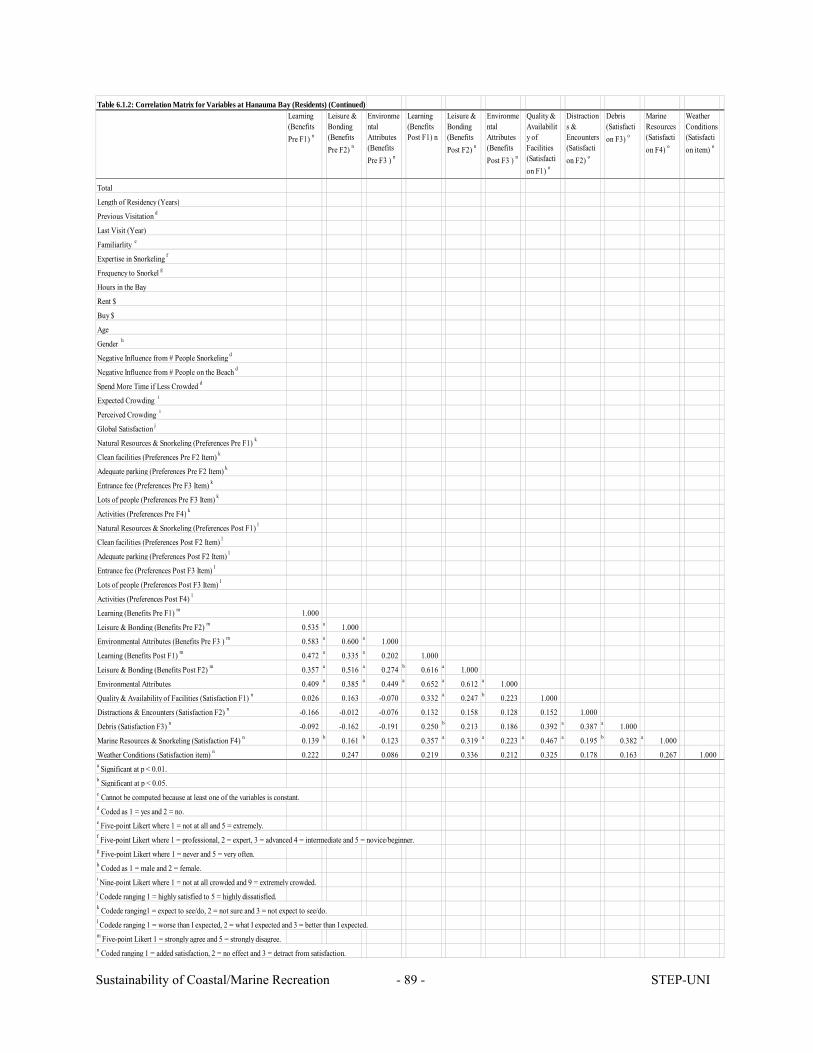
Sustainability of Coastal/Marine Recreation - 89 - STEP-UNI
Table 6.1.2: Correlation Matrix for Variables at Hanauma Bay (Residents) (Continued)Learning(BenefitsPre F1) n
Leisure &Bonding(BenefitsPre F2) n
EnvironmentalAttributes(BenefitsPre F3 ) n
Learning(BenefitsPost F1) n
Leisure &Bonding(BenefitsPost F2) n
EnvironmentalAttributes(BenefitsPost F3 ) n
Quality &Availability ofFacilities(Satisfaction F1) o
Distractions &Encounters(Satisfaction F2) o
Debris(Satisfaction F3) o
MarineResources(Satisfaction F4) o
WeatherConditions(Satisfaction item) o
Total
Length of Residency (Years)
Previous Visitation d
Last Visit (Year)
Familiarlity e
Expertise in Snorkeling f
Frequency to Snorkel g
Hours in the Bay
Rent $
Buy $
Age
Gender h
Negative Influence from # People Snorkeling d
Negative Influence from # People on the Beach d
Spend More Time if Less Crowded d
Expected Crowding i
Perceived Crowding i
Global Satisfaction j
Natural Resources & Snorkeling (Preferences Pre F1) k
Clean facilities (Preferences Pre F2 Item) k
Adequate parking (Preferences Pre F2 Item) k
Entrance fee (Preferences Pre F3 Item) k
Lots of people (Preferences Pre F3 Item) k
Activities (Preferences Pre F4) k
Natural Resources & Snorkeling (Preferences Post F1) l
Clean facilities (Preferences Post F2 Item) l
Adequate parking (Preferences Post F2 Item) l
Entrance fee (Preferences Post F3 Item) l
Lots of people (Preferences Post F3 Item) l
Activities (Preferences Post F4) l
Learning (Benefits Pre F1) m 1.000
Leisure & Bonding (Benefits Pre F2) m 0.535 a 1.000
Environmental Attributes (Benefits Pre F3 ) m 0.583 a 0.600 a 1.000
Learning (Benefits Post F1) m 0.472 a 0.335 a 0.202 1.000
Leisure & Bonding (Benefits Post F2) m 0.357 a 0.516 a 0.274 b 0.616 a 1.000
Environmental Attributes 0.409 a 0.385 a 0.449 a 0.652 a 0.612 a 1.000
Quality & Availability of Facilities (Satisfaction F1) n 0.026 0.163 -0.070 0.332 a 0.247 b 0.223 1.000
Distractions & Encounters (Satisfaction F2) n -0.166 -0.012 -0.076 0.132 0.158 0.128 0.152 1.000
Debris (Satisfaction F3) n -0.092 -0.162 -0.191 0.250 b 0.213 0.186 0.392 a 0.387 a 1.000
Marine Resources & Snorkeling (Satisfaction F4) n 0.139 b 0.161 b 0.123 0.357 a 0.319 a 0.223 a 0.467 a 0.195 b 0.382 a 1.000
Weather Conditions (Satisfaction item) n 0.222 0.247 0.086 0.219 0.336 0.212 0.325 0.178 0.163 0.267 1.000a Significant at p < 0.01.b Significant at p < 0.05.c Cannot be computed because at least one of the variables is constant.d Coded as 1 = yes and 2 = no.e Five-point Likert where 1 = not at all and 5 = extremely.f Five-point Likert where 1 = professional, 2 = expert, 3 = advanced 4 = intermediate and 5 = novice/beginner.g Five-point Likert where 1 = never and 5 = very often.h Coded as 1 = male and 2 = female.i Nine-point Likert where 1 = not at all crowded and 9 = extremely crowded.j Codede ranging 1 = highly satisfied to 5 = highly dissatisfied.k Codede ranging1 = expect to see/do, 2 = not sure and 3 = not expect to see/do.l Codede ranging 1 = worse than I expected, 2 = what I expected and 3 = better than I expected.m Five-point Likert 1 = strongly agree and 5 = strongly disagree.n Coded ranging 1 = added satisfaction, 2 = no effect and 3 = detract from satisfaction.
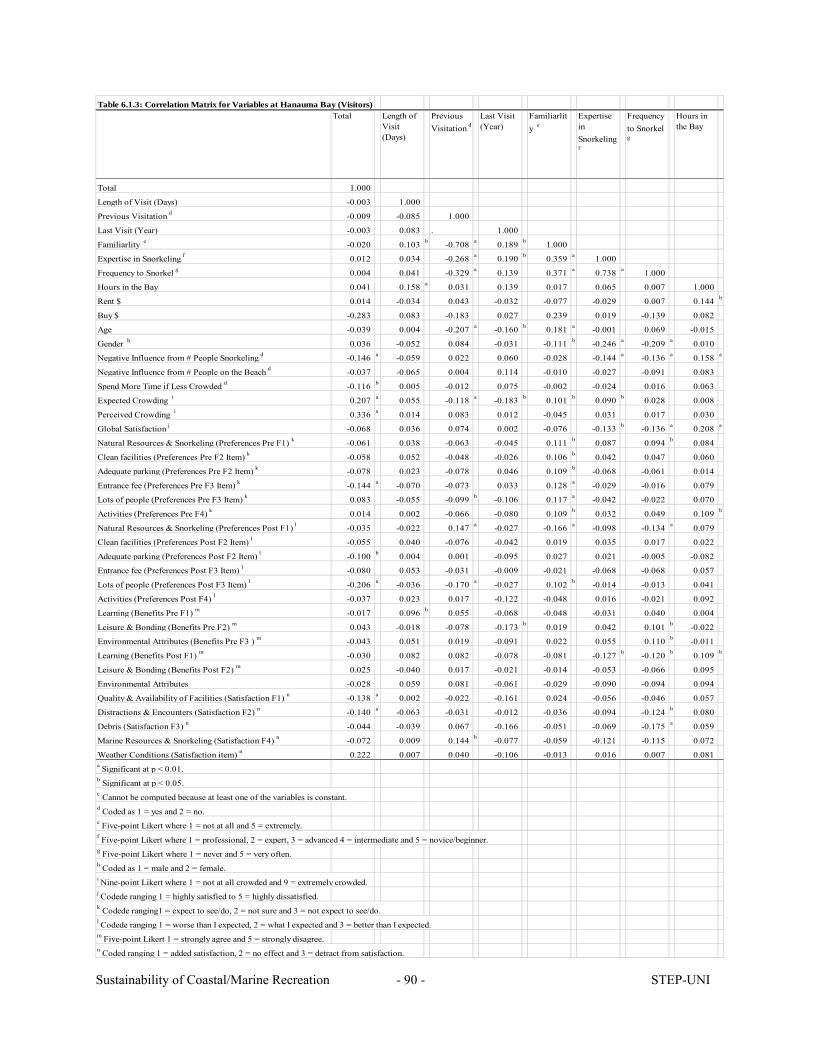
Sustainability of Coastal/Marine Recreation - 90 - STEP-UNI
Table 6.1.3: Correlation Matrix for Variables at Hanauma Bay (Visitors)Total Length of
Visit(Days)
PreviousVisitation d
Last Visit(Year)
Familiarlity e
ExpertiseinSnorkelingf
Frequencyto Snorkelg
Hours inthe Bay
Total 1.000
Length of Visit (Days) -0.003 1.000
Previous Visitation d -0.009 -0.085 1.000
Last Visit (Year) -0.003 0.083 . 1.000
Familiarlity e -0.020 0.103 b -0.708 a 0.189 b 1.000
Expertise in Snorkeling f 0.012 0.034 -0.268 a 0.190 b 0.359 a 1.000
Frequency to Snorkel g 0.004 0.041 -0.329 a 0.139 0.371 a 0.738 a 1.000
Hours in the Bay 0.041 0.158 a 0.031 0.139 0.017 0.065 0.007 1.000
Rent $ 0.014 -0.034 0.043 -0.032 -0.077 -0.029 0.007 0.144 b
Buy $ -0.283 0.083 -0.183 0.027 0.239 0.019 -0.139 0.082
Age -0.039 0.004 -0.207 a -0.160 b 0.181 a -0.001 0.069 -0.015
Gender h 0.036 -0.052 0.084 -0.031 -0.111 b -0.246 a -0.209 a 0.010
Negative Influence from # People Snorkeling d -0.146 a -0.059 0.022 0.060 -0.028 -0.144 a -0.136 a 0.158 a
Negative Influence from # People on the Beach d -0.037 -0.065 0.004 0.114 -0.010 -0.027 -0.091 0.083
Spend More Time if Less Crowded d -0.116 b 0.005 -0.012 0.075 -0.002 -0.024 0.016 0.063
Expected Crowding i 0.207 a 0.055 -0.118 a -0.183 b 0.101 b 0.090 b 0.028 0.008
Perceived Crowding i 0.336 a 0.014 0.083 0.012 -0.045 0.031 0.017 0.030
Global Satisfaction j -0.068 0.036 0.074 0.002 -0.076 -0.133 b -0.136 a 0.208 a
Natural Resources & Snorkeling (Preferences Pre F1) k -0.061 0.038 -0.063 -0.045 0.111 b 0.087 0.094 b 0.084
Clean facilities (Preferences Pre F2 Item) k -0.058 0.052 -0.048 -0.026 0.106 b 0.042 0.047 0.060
Adequate parking (Preferences Pre F2 Item) k -0.078 0.023 -0.078 0.046 0.109 b -0.068 -0.061 0.014
Entrance fee (Preferences Pre F3 Item) k -0.144 a -0.070 -0.073 0.033 0.128 a -0.029 -0.016 0.079
Lots of people (Preferences Pre F3 Item) k 0.083 -0.055 -0.099 b -0.106 0.117 a -0.042 -0.022 0.070
Activities (Preferences Pre F4) k 0.014 0.002 -0.066 -0.080 0.109 b 0.032 0.049 0.109 b
Natural Resources & Snorkeling (Preferences Post F1) l -0.035 -0.022 0.147 a -0.027 -0.166 a -0.098 -0.134 a 0.079
Clean facilities (Preferences Post F2 Item) l -0.055 0.040 -0.076 -0.042 0.019 0.035 0.017 0.022
Adequate parking (Preferences Post F2 Item) l -0.100 b 0.004 0.001 -0.095 0.027 0.021 -0.005 -0.082
Entrance fee (Preferences Post F3 Item) l -0.080 0.053 -0.031 -0.009 -0.021 -0.068 -0.068 0.057
Lots of people (Preferences Post F3 Item) l -0.206 a -0.036 -0.170 a -0.027 0.102 b -0.014 -0.013 0.041
Activities (Preferences Post F4) l -0.037 0.023 0.017 -0.122 -0.048 0.016 -0.021 0.092
Learning (Benefits Pre F1) m -0.017 0.096 b 0.055 -0.068 -0.048 -0.031 0.040 0.004
Leisure & Bonding (Benefits Pre F2) m 0.043 -0.018 -0.078 -0.173 b 0.019 0.042 0.101 b -0.022
Environmental Attributes (Benefits Pre F3 ) m -0.043 0.051 0.019 -0.091 0.022 0.055 0.110 b -0.011
Learning (Benefits Post F1) m -0.030 0.082 0.082 -0.078 -0.081 -0.127 b -0.120 b 0.109 b
Leisure & Bonding (Benefits Post F2) m 0.025 -0.040 0.017 -0.021 -0.014 -0.053 -0.066 0.095
Environmental Attributes -0.028 0.059 0.081 -0.061 -0.029 -0.090 -0.094 0.094
Quality & Availability of Facilities (Satisfaction F1) n -0.138 a 0.002 -0.022 -0.161 0.024 -0.056 -0.046 0.057
Distractions & Encounters (Satisfaction F2) n -0.140 a -0.063 -0.031 -0.012 -0.036 -0.094 -0.124 b 0.080
Debris (Satisfaction F3) n -0.044 -0.039 0.067 -0.166 -0.051 -0.069 -0.175 a 0.059
Marine Resources & Snorkeling (Satisfaction F4) n -0.072 0.009 0.144 b -0.077 -0.059 -0.121 -0.115 0.072
Weather Conditions (Satisfaction item) n 0.222 0.007 0.040 -0.106 -0.013 0.016 0.007 0.081a Significant at p < 0.01.b Significant at p < 0.05.c Cannot be computed because at least one of the variables is constant.d Coded as 1 = yes and 2 = no.e Five-point Likert where 1 = not at all and 5 = extremely.f Five-point Likert where 1 = professional, 2 = expert, 3 = advanced 4 = intermediate and 5 = novice/beginner.g Five-point Likert where 1 = never and 5 = very often.h Coded as 1 = male and 2 = female.i Nine-point Likert where 1 = not at all crowded and 9 = extremely crowded.j Codede ranging 1 = highly satisfied to 5 = highly dissatisfied.k Codede ranging1 = expect to see/do, 2 = not sure and 3 = not expect to see/do.l Codede ranging 1 = worse than I expected, 2 = what I expected and 3 = better than I expected.m Five-point Likert 1 = strongly agree and 5 = strongly disagree.n Coded ranging 1 = added satisfaction, 2 = no effect and 3 = detract from satisfaction.
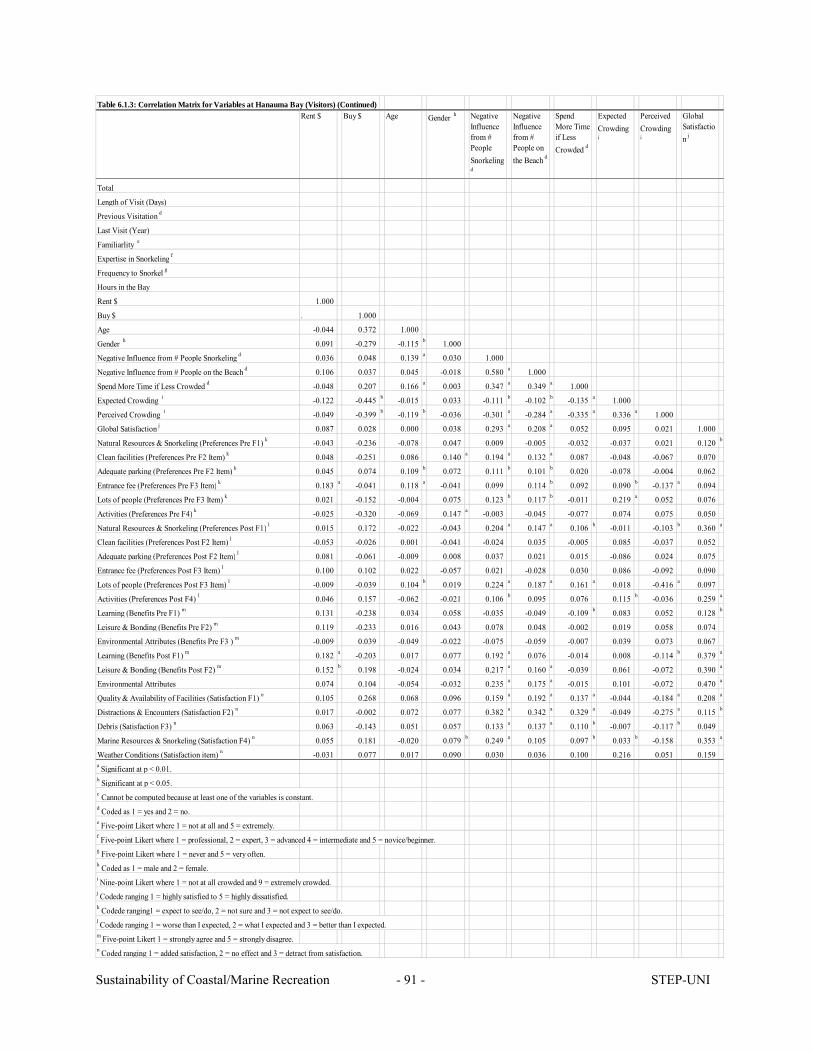
Sustainability of Coastal/Marine Recreation - 91 - STEP-UNI
Table 6.1.3: Correlation Matrix for Variables at Hanauma Bay (Visitors) (Continued)Rent $ Buy $ Age Gender h Negative
Influencefrom #PeopleSnorkelingd
NegativeInfluencefrom #People onthe Beach d
SpendMore Timeif LessCrowded d
ExpectedCrowdingi
PerceivedCrowdingi
GlobalSatisfaction j
Total
Length of Visit (Days)
Previous Visitation d
Last Visit (Year)
Familiarlity e
Expertise in Snorkeling f
Frequency to Snorkel g
Hours in the Bay
Rent $ 1.000
Buy $ . 1.000
Age -0.044 0.372 1.000
Gender h 0.091 -0.279 -0.115 b 1.000
Negative Influence from # People Snorkeling d 0.036 0.048 0.139 a 0.030 1.000
Negative Influence from # People on the Beach d 0.106 0.037 0.045 -0.018 0.580 a 1.000
Spend More Time if Less Crowded d -0.048 0.207 0.166 a 0.003 0.347 a 0.349 a 1.000
Expected Crowding i -0.122 -0.445 b -0.015 0.033 -0.111 b -0.102 b -0.135 a 1.000
Perceived Crowding i -0.049 -0.399 b -0.119 b -0.036 -0.301 a -0.284 a -0.335 a 0.336 a 1.000
Global Satisfaction j 0.087 0.028 0.000 0.038 0.293 a 0.208 a 0.052 0.095 0.021 1.000
Natural Resources & Snorkeling (Preferences Pre F1) k -0.043 -0.236 -0.078 0.047 0.009 -0.005 -0.032 -0.037 0.021 0.120 b
Clean facilities (Preferences Pre F2 Item) k 0.048 -0.251 0.086 0.140 a 0.194 a 0.132 a 0.087 -0.048 -0.067 0.070
Adequate parking (Preferences Pre F2 Item) k 0.045 0.074 0.109 b 0.072 0.111 b 0.101 b 0.020 -0.078 -0.004 0.062
Entrance fee (Preferences Pre F3 Item) k 0.183 a -0.041 0.118 a -0.041 0.099 0.114 b 0.092 0.090 b -0.137 a 0.094
Lots of people (Preferences Pre F3 Item) k 0.021 -0.152 -0.004 0.075 0.123 b 0.117 b -0.011 0.219 a 0.052 0.076
Activities (Preferences Pre F4) k -0.025 -0.320 -0.069 0.147 a -0.003 -0.045 -0.077 0.074 0.075 0.050
Natural Resources & Snorkeling (Preferences Post F1) l 0.015 0.172 -0.022 -0.043 0.204 a 0.147 a 0.106 b -0.011 -0.103 b 0.360 a
Clean facilities (Preferences Post F2 Item) l -0.053 -0.026 0.001 -0.041 -0.024 0.035 -0.005 0.085 -0.037 0.052
Adequate parking (Preferences Post F2 Item) l 0.081 -0.061 -0.009 0.008 0.037 0.021 0.015 -0.086 0.024 0.075
Entrance fee (Preferences Post F3 Item) l 0.100 0.102 0.022 -0.057 0.021 -0.028 0.030 0.086 -0.092 0.090
Lots of people (Preferences Post F3 Item) l -0.009 -0.039 0.104 b 0.019 0.224 a 0.187 a 0.161 a 0.018 -0.416 a 0.097
Activities (Preferences Post F4) l 0.046 0.157 -0.062 -0.021 0.106 b 0.095 0.076 0.115 b -0.036 0.259 a
Learning (Benefits Pre F1) m 0.131 -0.238 0.034 0.058 -0.035 -0.049 -0.109 b 0.083 0.052 0.128 b
Leisure & Bonding (Benefits Pre F2) m 0.119 -0.233 0.016 0.043 0.078 0.048 -0.002 0.019 0.058 0.074
Environmental Attributes (Benefits Pre F3 ) m -0.009 0.039 -0.049 -0.022 -0.075 -0.059 -0.007 0.039 0.073 0.067
Learning (Benefits Post F1) m 0.182 a -0.203 0.017 0.077 0.192 a 0.076 -0.014 0.008 -0.114 b 0.379 a
Leisure & Bonding (Benefits Post F2) m 0.152 b 0.198 -0.024 0.034 0.217 a 0.160 a -0.039 0.061 -0.072 0.390 a
Environmental Attributes 0.074 0.104 -0.054 -0.032 0.235 a 0.175 a -0.015 0.101 -0.072 0.470 a
Quality & Availability of Facilities (Satisfaction F1) n 0.105 0.268 0.068 0.096 0.159 a 0.192 a 0.137 a -0.044 -0.184 a 0.208 a
Distractions & Encounters (Satisfaction F2) n 0.017 -0.002 0.072 0.077 0.382 a 0.342 a 0.329 a -0.049 -0.275 a 0.115 b
Debris (Satisfaction F3) n 0.063 -0.143 0.051 0.057 0.133 a 0.137 a 0.110 b -0.007 -0.117 b 0.049
Marine Resources & Snorkeling (Satisfaction F4) n 0.055 0.181 -0.020 0.079 b 0.249 a 0.105 0.097 b 0.033 b -0.158 0.353 a
Weather Conditions (Satisfaction item) n -0.031 0.077 0.017 0.090 0.030 0.036 0.100 0.216 0.051 0.159a Significant at p < 0.01.b Significant at p < 0.05.c Cannot be computed because at least one of the variables is constant.d Coded as 1 = yes and 2 = no.e Five-point Likert where 1 = not at all and 5 = extremely.f Five-point Likert where 1 = professional, 2 = expert, 3 = advanced 4 = intermediate and 5 = novice/beginner.g Five-point Likert where 1 = never and 5 = very often.h Coded as 1 = male and 2 = female.i Nine-point Likert where 1 = not at all crowded and 9 = extremely crowded.j Codede ranging 1 = highly satisfied to 5 = highly dissatisfied.k Codede ranging1 = expect to see/do, 2 = not sure and 3 = not expect to see/do.l Codede ranging 1 = worse than I expected, 2 = what I expected and 3 = better than I expected.m Five-point Likert 1 = strongly agree and 5 = strongly disagree.n Coded ranging 1 = added satisfaction, 2 = no effect and 3 = detract from satisfaction.

Sustainability of Coastal/Marine Recreation - 92 - STEP-UNI
Table 6.1.3: Correlation Matrix for Variables at Hanauma Bay (Visitors) (Continued)NaturalResources&Snorkeling(Preferences Pre F1)k
Cleanfacilities(Preferences Pre F2Item) k
Adequateparking(Preferences Pre F2Item) k
Entrancefee(Preferences Pre F3Item) k
Lots ofpeople(Preferences Pre F3Item) k
Activities(Preferences Pre F4)k
NaturalResources&Snorkeling(Preferences Post F1)l
Cleanfacilities(Preferences Post F2Item) l
Adequateparking(Preferences Post F2Item) l
Entrancefee(Preferences Post F3Item) l
Lots ofpeople(Preferences Post F3Item) l
Activities(Preferences Post F4)l
Total
Length of Visit (Days)
Previous Visitation d
Last Visit (Year)
Familiarlity e
Expertise in Snorkeling f
Frequency to Snorkel g
Hours in the Bay
Rent $
Buy $
Age
Gender h
Negative Influence from # People Snorkeling d
Negative Influence from # People on the Beach d
Spend More Time if Less Crowded d
Expected Crowding i
Perceived Crowding i
Global Satisfaction j
Natural Resources & Snorkeling (Preferences Pre F1) k 1.000
Clean facilities (Preferences Pre F2 Item) k 0.320 a 1.000
Adequate parking (Preferences Pre F2 Item) k 0.143 a 0.335 a 1.000
Entrance fee (Preferences Pre F3 Item) k 0.079 0.146 a 0.219 a 1.000
Lots of people (Preferences Pre F3 Item) k 0.169 a 0.152 a 0.224 a 0.331 a 1.000
Activities (Preferences Pre F4) k 0.344 a 0.164 a 0.145 a 0.068 0.127 a 1.000
Natural Resources & Snorkeling (Preferences Post F1) l -0.046 -0.080 -0.076 0.032 0.018 -0.042 1.000
Clean facilities (Preferences Post F2 Item) l -0.023 -0.093 -0.043 0.060 0.083 -0.085 0.165 a 1.000
Adequate parking (Preferences Post F2 Item) l 0.029 -0.056 0.055 -0.050 -0.058 -0.045 0.017 0.141 a 1.000
Entrance fee (Preferences Post F3 Item) l 0.004 -0.020 0.056 0.405 a 0.050 -0.004 0.134 a -0.027 -0.188 a 1.000
Lots of people (Preferences Post F3 Item) l 0.031 0.016 0.036 0.290 a 0.131 b 0.018 0.015 0.001 -0.172 a 0.219 a 1.000
Activities (Preferences Post F4) l 0.046 -0.029 -0.028 0.084 -0.004 -0.100 0.437 a 0.118 b 0.032 0.092 0.021 1.000
Learning (Benefits Pre F1) m 0.061 0.100 b 0.071 0.033 0.021 -0.033 -0.018 0.053 0.041 0.048 -0.044 0.072
Leisure & Bonding (Benefits Pre F2) m 0.060 0.072 0.100 b 0.047 0.050 0.113 b -0.024 0.031 0.026 0.018 0.002 -0.013
Environmental Attributes (Benefits Pre F3 ) m 0.159 a -0.001 0.002 -0.064 -0.041 0.035 -0.029 -0.043 0.006 -0.005 -0.063 0.050
Learning (Benefits Post F1) m 0.087 0.039 0.074 -0.038 -0.068 -0.004 0.269 a 0.040 0.049 0.028 -0.014 0.134 a
Leisure & Bonding (Benefits Post F2) m 0.134 b -0.016 0.005 -0.046 -0.045 0.042 0.264 a 0.007 -0.045 -0.001 0.066 0.164 a
Environmental Attributes 0.093 -0.036 0.006 -0.031 -0.053 0.025 0.432 0.072 -0.021 0.013 0.057 0.266 a
Quality & Availability of Facilities (Satisfaction F1) n 0.107 b 0.155 a 0.138 a 0.181 a 0.112 b 0.112 b 0.062 0.134 b 0.115 b 0.033 0.172 a 0.017
Distractions & Encounters (Satisfaction F2) n 0.035 0.050 0.095 0.106 0.061 0.054 0.153 a 0.011 0.059 0.071 0.281 a 0.052
Debris (Satisfaction F3) n -0.011 0.148 a 0.040 0.079 0.018 0.088 0.099 -0.026 -0.019 -0.030 0.071 -0.045
Marine Resources & Snorkeling (Satisfaction F4) n 0.007 0.004 -0.016 0.007 0.006 0.096 a 0.365 a 0.056 0.011 0.001 0.062 0.099 b
Weather Conditions (Satisfaction item) n 0.073 -0.010 0.002 0.076 0.069 0.166 0.125 0.021 -0.080 0.129 -0.022 0.107a Significant at p < 0.01.b Significant at p < 0.05.c Cannot be computed because at least one of the variables is constant.d Coded as 1 = yes and 2 = no.e Five-point Likert where 1 = not at all and 5 = extremely.f Five-point Likert where 1 = professional, 2 = expert, 3 = advanced 4 = intermediate and 5 = novice/beginner.g Five-point Likert where 1 = never and 5 = very often.h Coded as 1 = male and 2 = female.i Nine-point Likert where 1 = not at all crowded and 9 = extremely crowded.j Codede ranging 1 = highly satisfied to 5 = highly dissatisfied.k Codede ranging1 = expect to see/do, 2 = not sure and 3 = not expect to see/do.l Codede ranging 1 = worse than I expected, 2 = what I expected and 3 = better than I expected.m Five-point Likert 1 = strongly agree and 5 = strongly disagree.n Coded ranging 1 = added satisfaction, 2 = no effect and 3 = detract from satisfaction.

Sustainability of Coastal/Marine Recreation - 93 - STEP-UNI
Table 6.1.3: Correlation Matrix for Variables at Hanauma Bay (Visitors) (Continued)Educational Benefits(BenefitsPre F1) n
Leisure &Bonding(BenefitsPre F2) n
EnvironmentalAttributes(BenefitsPre F3 ) n
Educational Benefits(BenefitsPost F1) n
Leisure &Bonding(BenefitsPost F2) n
EnvironmentalAttributes(BenefitsPost F3 ) n
Quality &Availability ofFacilities(Satisfaction F1) o
Distractions &Encounters(Satisfaction F2) o
Debris(Satisfaction F3) o
MarineResources(Satisfaction F4) o
WeatherConditions(Satisfaction item) o
Total
Length of Visit (Days)
Previous Visitation d
Last Visit (Year)
Familiarlity e
Expertise in Snorkeling f
Frequency to Snorkel g
Hours in the Bay
Rent $
Buy $
Age
Gender h
Negative Influence from # People Snorkeling d
Negative Influence from # People on the Beach d
Spend More Time if Less Crowded d
Expected Crowding i
Perceived Crowding i
Global Satisfaction j
Natural Resources & Snorkeling (Preferences Pre F1) k
Clean facilities (Preferences Pre F2 Item) k
Adequate parking (Preferences Pre F2 Item) k
Entrance fee (Preferences Pre F3 Item) k
Lots of people (Preferences Pre F3 Item) k
Activities (Preferences Pre F4) k
Natural Resources & Snorkeling (Preferences Post F1) l
Clean facilities (Preferences Post F2 Item) l
Adequate parking (Preferences Post F2 Item) l
Entrance fee (Preferences Post F3 Item) l
Lots of people (Preferences Post F3 Item) l
Activities (Preferences Post F4) l
Learning (Benefits Pre F1) m 1.000
Leisure & Bonding (Benefits Pre F2) m 0.492 a 1.000
Environmental Attributes (Benefits Pre F3 ) m 0.560 a 0.488 a 1.000
Learning (Benefits Post F1) m 0.496 a 0.259 a 0.271 a 1.000
Leisure & Bonding (Benefits Post F2) m 0.258 a 0.486 a 0.220 a 0.628 a 1.000
Environmental Attributes 0.300 a 0.222 a 0.286 a 0.672 a 0.720 a 1.000
Quality & Availability of Facilities (Satisfaction F1) n 0.183 0.141 a 0.034 0.316 a 0.219 a 0.239 a 1.000
Distractions & Encounters (Satisfaction F2) n 0.079 0.062 0.007 0.117 b 0.077 0.092 0.212 a 1.000
Debris (Satisfaction F3) n 0.105 b 0.109 b -0.030 0.097 0.081 0.046 0.238 a 0.417 a 1.000
Marine Resources & Snorkeling (Satisfaction F4) n 0.098 b 0.101 0.082 0.345 a 0.303 a 0.471 a 0.344 a 0.159 a 0.246 a 1.000
Weather Conditions (Satisfaction item) n 0.070 0.063 0.046 0.158 0.139 0.153 0.164 0.067 0.139 0.282 1.000a Significant at p < 0.01.b Significant at p < 0.05.c Cannot be computed because at least one of the variables is constant.d Coded as 1 = yes and 2 = no.e Five-point Likert where 1 = not at all and 5 = extremely.f Five-point Likert where 1 = professional, 2 = expert, 3 = advanced 4 = intermediate and 5 = novice/beginner.g Five-point Likert where 1 = never and 5 = very often.h Coded as 1 = male and 2 = female.i Nine-point Likert where 1 = not at all crowded and 9 = extremely crowded.j Codede ranging 1 = highly satisfied to 5 = highly dissatisfied.k Codede ranging1 = expect to see/do, 2 = not sure and 3 = not expect to see/do.l Codede ranging 1 = worse than I expected, 2 = what I expected and 3 = better than I expected.m Five-point Likert 1 = strongly agree and 5 = strongly disagree.n Coded ranging 1 = added satisfaction, 2 = no effect and 3 = detract from satisfaction.

Sustainability of Coastal/Marine Recreation - 94 - STEP-UNI
Table 6.2: Explanation of Preferences Variables Codes for Hanauma Bay Factors and Variables Pre-test Post-test
Preferences a Factor 1: Natural Resources & Snorkeling O O Abundant marine life O O Great reefs and corals O O Beautiful scenery O O Clean ocean water O O Snorkeling O O Factor 2: Physical Facilities O O Clean facilities O O Adequate parking O O Factor 3: Fee & Number of People O O Entrance fee O O Lots of people O O Factor 4: Activities O O Swimming O O Sunbathing O O a Pre-test: "What do you expect to see/do at Hanauma Bay?" Marked on a three-point scale where expect to see/do, not sure, and not expected to see/do. Post-test: "What have you seen based on your experiences at Hanauma Bay?" Marked on a three-point scale where: worse than I expected, what I expected, and better than I expected.

Sustainability of Coastal/Marine Recreation - 95 - STEP-UNI
M aStd.Dev.
Correlateditem-totalcorrelation
α if itemdeleted
Standardizeditem χ M b
Std.Dev.
Correlateditem-totalcorrelation
α if itemdeleted
Standardizeditem χ
Factor 1: Natural Resources & Snorkeling c
b Abundant marine life 2.9 0.33 0.59 0.56 1.9 0.55 0.66 0.68a Great reefs and corals 2.9 0.41 0.42 0.63 1.9 0.52 0.55 0.72h Beautiful Scenery 2.9 0.24 0.48 0.62 2.1 0.38 0.52 0.73d Clean ocean water 2.9 0.35 0.41 0.63 2.0 0.42 0.40 0.77i Snorkeling 2.9 0.41 0.33 0.68 2.0 0.43 0.60 0.71
χ (standardized item χ ) 0.68 (0.70) 0.77 (0.77)
Factor 2: Physical Facilities d
c Clean facilities 2.7 0.50 0.35 . 2.0 0.39 0.10 .f Adequate parking 2.4 0.72 0.35 . 1.9 0.48 0.10 .
χ (standardized item χ ) 0.49 (0.52) 0.18 (0.18)
Factor 3: Fee & Number of People e
g Entrance fee 2.4 0.76 0.31 . 2.0 0.50 0.20 .e Lots of people 2.6 0.62 0.31 . 2.1 0.51 0.20 .
χ (standardized item χ ) 0.47 (0.48) 0.33 (0.33)
Factor 4: Activities f
j Swimming 2.9 0.36 0.34 . 2.0 0.33 0.58 .k Sunbathing 2.7 0.60 0.34 . 2.0 0.29 0.58 .
χ (standardized item χ ) 0.46 (0.51) 0.73 (0.73)
Table 6.3: Factor Analysis of Pre Experience and Post Experience Preferences at Hanauma Bay
f Pre-test: n = 595; Post-test n = 484
e Pre-test: n = 580; Post-test n = 483
d Pre-test: n = 592; Post-test n = 473
c Pre-test: n = 586; Post-test n = 473
Statement
Pre Post
b Items were coded on 1 = worse than expected, 2 = what I expected, and 3 = better than expected.
a Items were coded on 1= not expected to see/do, 2 = not sure and 3 = expect to see/do.

Sustainability of Coastal/Marine Recreation - 96 - STEP-UNI
0.0
10.0
20.0
30.0
40.0
50.0
60.0
70.0
Perceived Crowding
%
Worse than Expected (%) 0.0 0.0 0.0 0.0 0.0 33.3 0.0 66.7 0.0
What I Expected (%) 4.4 4.9 11.4 5.7 11.7 26.0 23.9 9.6 2.3
Better than Expected (%) 1.2 3.5 15.3 9.4 8.2 28.2 23.5 8.2 2.4
1 Not at allCrowded 2 3 Slightly
Crowded 4 56
ModeratelyCrowded
7 89
ExtremelyCrowded
Figure 6.6: Degree of Perceived Crowding within each Scale of Post Experience Natural Resources & Snorkeling at Hanauma Bay(Post Experience Preferences F1) a
N = 473
a Abundant marine life, great reefs and corals, beautiful scenery, clean ocean water, and snorkeling.
0.0
10.0
20.0
30.0
40.0
50.0
Perceived Crowding
%
Worse than Expected (%) 0.0 7.7 23.1 0.0 0.0 23.1 46.2 0.0 0.0
What I Expected (%) 5.1 4.6 12.3 6.3 10.9 26.4 22.8 9.4 2.2
Better than Expected (%) 0.0 2.1 12.8 6.4 10.6 23.4 34.0 8.5 2.1
1 Not at allCrowded 2 3 Slightly
Crowded 4 56
ModeratelyCrowded
7 89
ExtremelyCrowded
Figure 6.6.2: Degree of Perceived Crowding within each Scale of Post-test Physical Facilities Hanauma Bay(Post Experience Preferences F2)a
N = 473
a Clean facilities and adequate parking.

Sustainability of Coastal/Marine Recreation - 97 - STEP-UNI
0.0
10.0
20.0
30.0
40.0
50.0
60.0
Perceived Crowding
%
Worse than Expected (%) 0.0 0.0 0.0 0.0 25.0 0.0 50.0 0.0 25.0
What I Expected (%) 4.3 4.5 12.1 5.9 11.1 25.8 25.1 8.8 2.4
Better than Expected (%) 4.0 4.0 12.0 10.0 8.0 26.0 20.0 16.0 0.0
1 Not at allCrowded 2 3 Slightly
Crowded 4 56
ModeratelyCrowded
7 89
ExtremelyCrowded
Figure 6.6.3: Degree of Perceived Crowding within each Scale of Post-test Activities at Hanauma Bay(Post Experience Preferences F4)a
N = 476
a Swimming and sunbathing.
Table 6.4: Explanation of Benefits Variables Codes for Hanauma Bay
Pre-test Post-test
Factor 1: Learning O OIncrease environmental awareness O OTo learn about nature O OExpand my world view O O
Factor 2: Leisure & Bonding O OGain a sense of freedom O OTo change mood positively O OSocially bond with friends O OBond with your family O O
Factor 3: Environmental Attributes & Adventure Experiences O OSee abundant marine life O OView natural sites O OTo be adventurous O O
Benefits a
a Pre-test: "What kind of things do you want to experience today?" Post-test: "Did you experience any of thefollowing while visiting Hanauma Bay?" Marked on a five-point Likert scale where 1 = strongly agree to 5 =strongly disagree.
Factors and Variables
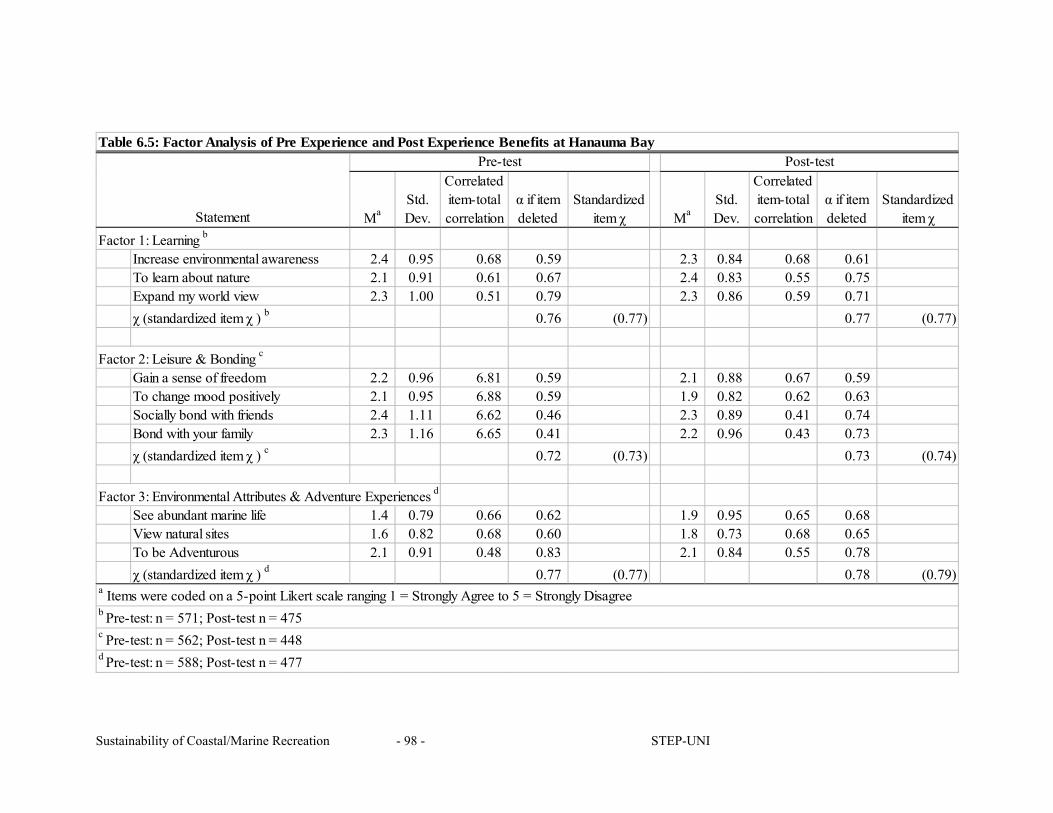
Sustainability of Coastal/Marine Recreation - 98 - STEP-UNI
MaStd.Dev.
Correlateditem-totalcorrelation
α if itemdeleted
Standardizeditem χ Ma
Std.Dev.
Correlateditem-totalcorrelation
α if itemdeleted
Standardizeditem χ
Factor 1: Learning b
c Increase environmental awareness 2.4 0.95 0.68 0.59 2.3 0.84 0.68 0.61a To learn about nature 2.1 0.91 0.61 0.67 2.4 0.83 0.55 0.75h Expand my world view 2.3 1.00 0.51 0.79 2.3 0.86 0.59 0.71
χ (standardized item χ ) b 0.76 (0.77) 0.77 (0.77)
Factor 2: Leisure & Bonding c
e Gain a sense of freedom 2.2 0.96 6.81 0.59 2.1 0.88 0.67 0.59d To change mood positively 2.1 0.95 6.88 0.59 1.9 0.82 0.62 0.63g Socially bond with friends 2.4 1.11 6.62 0.46 2.3 0.89 0.41 0.74f Bond with your family 2.3 1.16 6.65 0.41 2.2 0.96 0.43 0.73
χ (standardized item χ ) c 0.72 (0.73) 0.73 (0.74)
Factor 3: Environmental Attributes & Adventure Experiences d
j See abundant marine life 1.4 0.79 0.66 0.62 1.9 0.95 0.65 0.68i View natural sites 1.6 0.82 0.68 0.60 1.8 0.73 0.68 0.65b To be Adventurous 2.1 0.91 0.48 0.83 2.1 0.84 0.55 0.78
χ (standardized item χ ) d 0.77 (0.77) 0.78 (0.79)
b Pre-test: n = 571; Post-test n = 475c Pre-test: n = 562; Post-test n = 448d Pre-test: n = 588; Post-test n = 477
Table 6.5: Factor Analysis of Pre Experience and Post Experience Benefits at Hanauma Bay
Statement
Pre-test Post-test
a Items were coded on a 5-point Likert scale ranging 1 = Strongly Agree to 5 = Strongly Disagree

Sustainability of Coastal/Marine Recreation - 99 - STEP-UNI
0.0
10.0
20.0
30.0
40.0
50.0
60.0
Perceived Crowding
%
Strongly Agree (%) 4.4 6.7 6.7 2.2 11.1 35.6 22.2 8.9 2.2
Agree (%) 3.9 4.4 16.1 7.8 12.2 26.7 18.9 8.3 1.7
Neutral (%) 3.0 4.0 9.5 7.0 10.0 26.0 27.0 10.5 3.0
Disagree (%) 0.0 0.0 14.3 0.0 14.3 14.3 33.3 19.0 4.8
Strongly Disagree (%) 0.0 0.0 50.0 0.0 0.0 0.0 50.0 0.0 0.0
1 Not at allCrowded 2 3 Slightly
Crowded 4 56
ModeratelyCrowded
7 8 9 ExtremelyCrowded
Figure 6.7: Degree of Perceived Crowding within each Scale of Post Experience Leisure & Bonding(Post Experience Benefits F2) a
N = 448
a Gain a sense of freedom, to change mood positively, socially bond with friends, and bond with your family.
0.0
10.0
20.0
30.0
40.0
50.0
60.0
Perceived Crowding
%
Strongly Agree (%) 7.1 7.1 9.4 4.7 10.6 30.6 18.8 10.6 1.2
Agree (%) 3.3 3.7 11.6 8.3 13.3 26.1 24.1 7.9 1.7
Neutral (%) 3.8 4.5 12.8 5.3 8.3 24.1 25.6 11.3 4.5
Disagree (%) 0.0 0.0 28.6 0.0 7.1 14.3 35.7 14.3 0.0
Strongly Disagree (%) 0.0 0.0 25.0 0.0 0.0 0.0 50.0 25.0 0.0
1 Not at allCrowded 2 3 Slightly
Crowded 4 56
ModeratelyCrowded
7 89
ExtremelyCrowded
Figure 6.7.2: Degree of Perceived Crowding within each Scale of Post Experience Environmental Attributes(Post Experience Benefits F3) a
N = 477
a See abundant marine life, view natural sites, and to be adventurous.
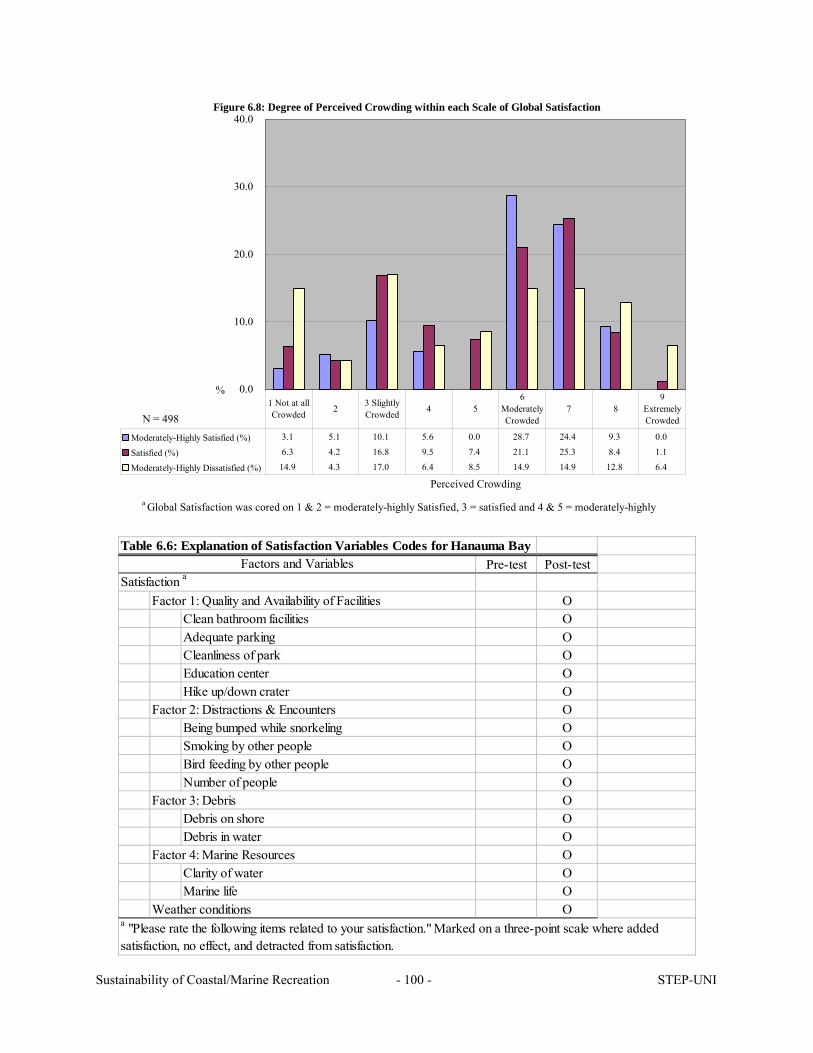
Sustainability of Coastal/Marine Recreation - 100 - STEP-UNI
0.0
10.0
20.0
30.0
40.0
Perceived Crowding
%
Moderately-Highly Satisfied (%) 3.1 5.1 10.1 5.6 0.0 28.7 24.4 9.3 0.0
Satisfied (%) 6.3 4.2 16.8 9.5 7.4 21.1 25.3 8.4 1.1
Moderately-Highly Dissatisfied (%) 14.9 4.3 17.0 6.4 8.5 14.9 14.9 12.8 6.4
1 Not at allCrowded 2 3 Slightly
Crowded 4 56
ModeratelyCrowded
7 89
ExtremelyCrowdedN = 498
a Global Satisfaction was cored on 1 & 2 = moderately-highly Satisfied, 3 = satisfied and 4 & 5 = moderately-highlydi i fi d
Figure 6.8: Degree of Perceived Crowding within each Scale of Global Satisfaction
Table 6.6: Explanation of Satisfaction Variables Codes for Hanauma Bay
Pre-test Post-test
Factor 1: Quality and Availability of Facilities OClean bathroom facilities OAdequate parking OCleanliness of park OEducation center OHike up/down crater O
Factor 2: Distractions & Encounters OBeing bumped while snorkeling OSmoking by other people OBird feeding by other people ONumber of people O
Factor 3: Debris ODebris on shore ODebris in water O
Factor 4: Marine Resources OClarity of water OMarine life O
Weather conditions Oa "Please rate the following items related to your satisfaction." Marked on a three-point scale where addedsatisfaction, no effect, and detracted from satisfaction.
Factors and VariablesSatisfaction a
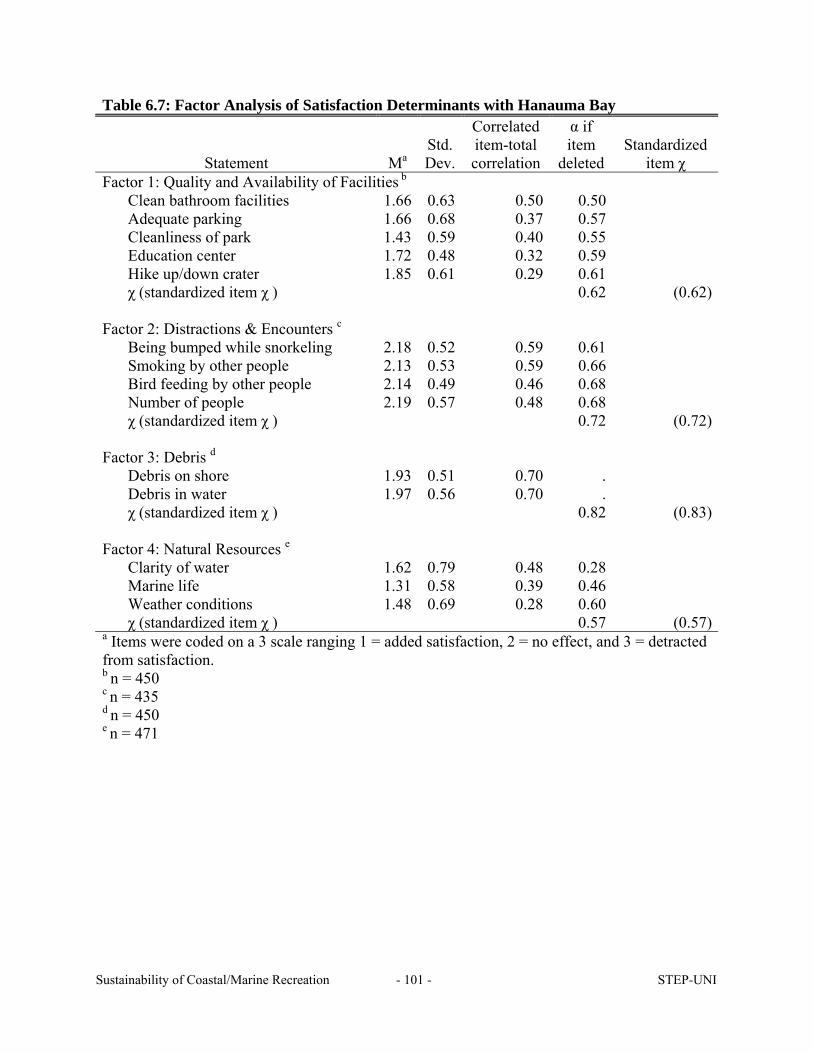
Sustainability of Coastal/Marine Recreation - 101 - STEP-UNI
Table 6.7: Factor Analysis of Satisfaction Determinants with Hanauma Bay
Statement Ma Std. Dev.
Correlated item-total correlation
α if item
deleted Standardized
item χ Factor 1: Quality and Availability of Facilities b Clean bathroom facilities 1.66 0.63 0.50 0.50 Adequate parking 1.66 0.68 0.37 0.57 Cleanliness of park 1.43 0.59 0.40 0.55 Education center 1.72 0.48 0.32 0.59 Hike up/down crater 1.85 0.61 0.29 0.61 χ (standardized item χ ) 0.62 (0.62) Factor 2: Distractions & Encounters c m Being bumped while snorkeling 2.18 0.52 0.59 0.61 k Smoking by other people 2.13 0.53 0.59 0.66 l Bird feeding by other people 2.14 0.49 0.46 0.68 n Number of people 2.19 0.57 0.48 0.68 χ (standardized item χ ) 0.72 (0.72) Factor 3: Debris d h Debris on shore 1.93 0.51 0.70 . g Debris in water 1.97 0.56 0.70 . χ (standardized item χ ) 0.82 (0.83) Factor 4: Natural Resources e Clarity of water 1.62 0.79 0.48 0.28 Marine life 1.31 0.58 0.39 0.46 Weather conditions 1.48 0.69 0.28 0.60 χ (standardized item χ ) 0.57 (0.57)a Items were coded on a 3 scale ranging 1 = added satisfaction, 2 = no effect, and 3 = detracted from satisfaction. b n = 450 c n = 435 d n = 450 e n = 471

Sustainability of Coastal/Marine Recreation - 102 - STEP-UNI
Table 6.7.2: Factor Analysis of Satisfaction Determinants Variables with Hanauma Bay
Statement Ma Std. Dev.
Correlated item-total correlation
α if item deleted
Standardized item χ
Factor 4: Marine Resources Clarity of water 1.62 0.79 0.45 . Marine life 1.31 0.58 0.45 . χ (standardized item χ ) b 0.60 (0.62)a Items were coded on a 3 scale ranging 1 = added satisfaction, 2 = no effect, and 3 = detracted from satisfaction. b n = 476
0.0
10.0
20.0
30.0
Perceived Crowding
%
Added Satisfaction (%) 4.5 4.9 13.0 5.5 9.4 26.9 24.0 10.1 1.6
No Effect (%) 3.3 3.3 14.6 8.1 14.6 24.4 20.3 7.3 4.1
Detracted from Satisfaction (%) 9.3 5.6 3.7 9.3 11.1 24.1 24.1 11.1 1.9
1 Not at allCrowded 2 3 Slightly
Crowded 4 56
ModeratelyCrowded
7 8 9 ExtremelyCrowded
Figure 6.9: Degree of Perceived Crowding within each Scale of Weather Conditions (Satisfaction Item)a
N = 471