Embed Size (px)
Citation preview
Jovi C. Dacanay
University of Asia and the Pacific
Sustainability of the Sardine Fishery
in Zamboanga:
A Bioeconomic Approach
Outline of the Report
Problem
Theoretical Framework
Empirical Method
Background Information
Results
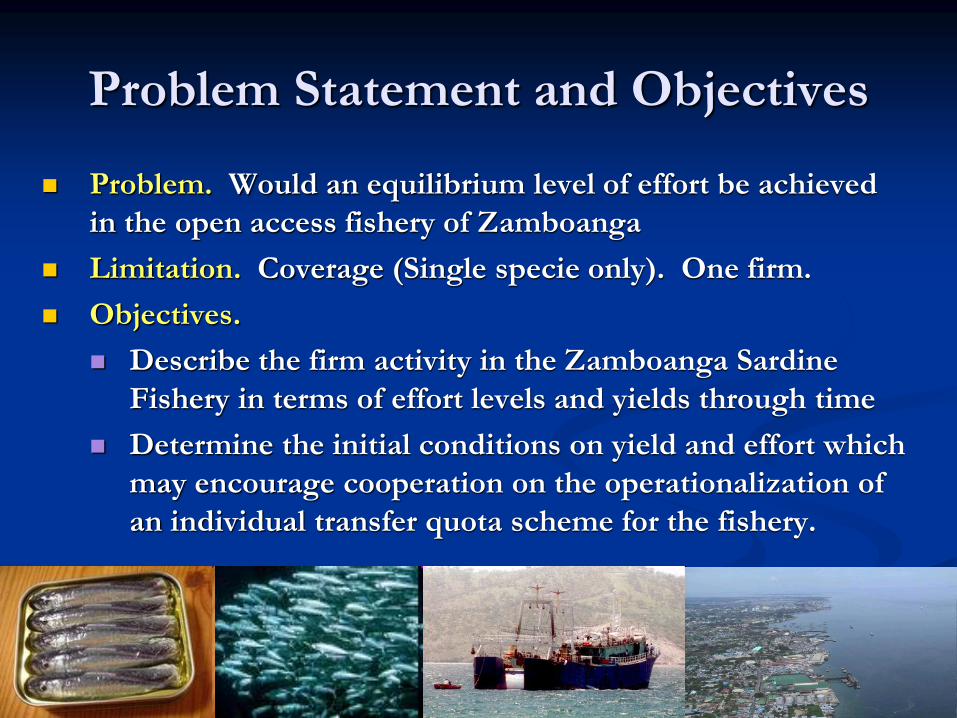
Problem Statement and Objectives
Problem. Would an equilibrium level of effort be achieved
in the open access fishery of Zamboanga
Limitation. Coverage (Single specie only). One firm.
Objectives.
Describe the firm activity in the Zamboanga Sardine
Fishery in terms of effort levels and yields through time
Determine the initial conditions on yield and effort which
may encourage cooperation on the operationalization of
an individual transfer quota scheme for the fishery.
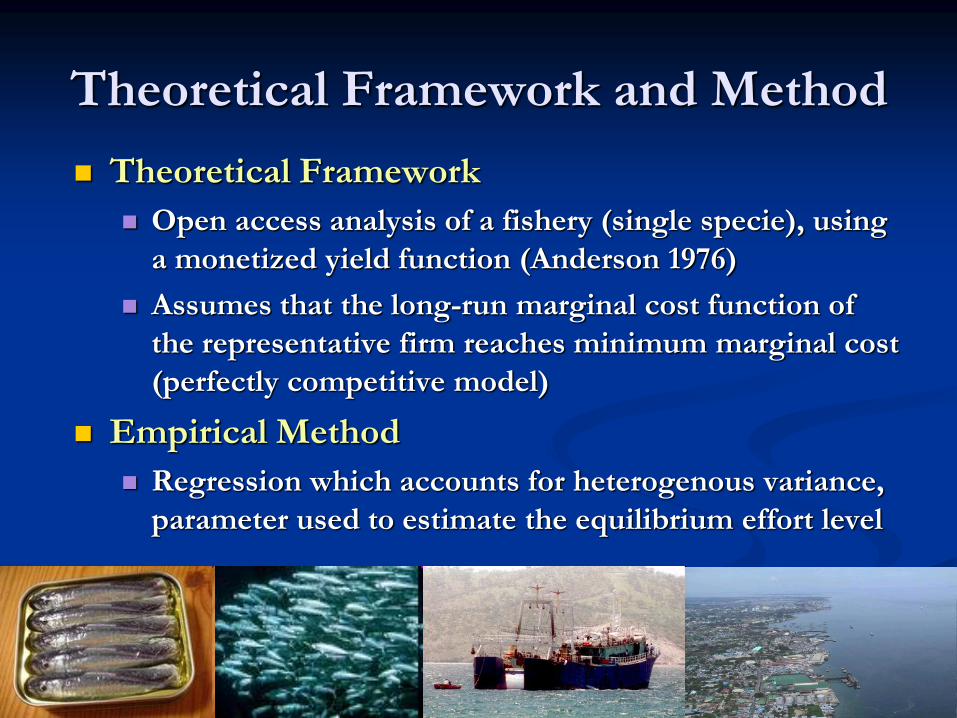
Theoretical Framework and Method
Theoretical Framework
Open access analysis of a fishery (single specie), using
a monetized yield function (Anderson 1976)
Assumes that the long-run marginal cost function of
the representative firm reaches minimum marginal cost
(perfectly competitive model)
Empirical Method
Regression which accounts for heterogenous variance,
parameter used to estimate the equilibrium effort level

Background
Information
Will a 1.9 million metric ton maximum
sustainable yield for the Fishery in RP sustain
a commercially profitable sardine industry in
Zamboanga?
Consequence: Roughly 128,250 (45%) metric
ton annual yield for all Deep Sea Coastal
Sardine Fishing Firms
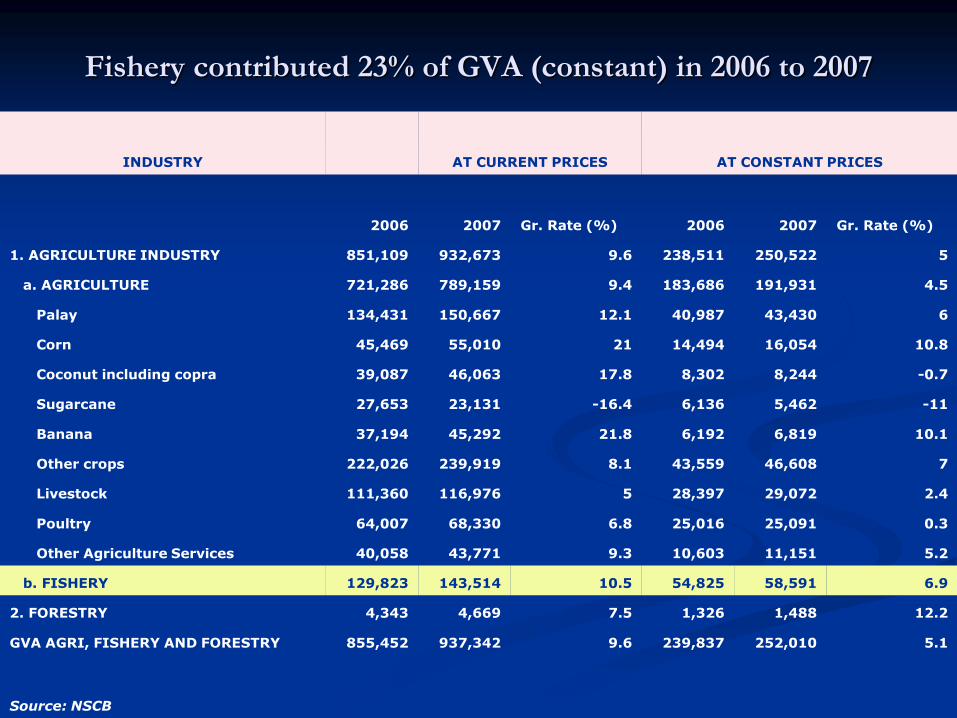
Fishery contributed 23% of GVA (constant) in 2006 to 2007
INDUSTRY AT CURRENT PRICES AT CONSTANT PRICES
2006 2007 Gr. Rate (%) 2006 2007 Gr. Rate (%)
1. AGRICULTURE INDUSTRY 851,109 932,673 9.6 238,511 250,522 5
a. AGRICULTURE 721,286 789,159 9.4 183,686 191,931 4.5
Palay 134,431 150,667 12.1 40,987 43,430 6
Corn 45,469 55,010 21 14,494 16,054 10.8
Coconut including copra 39,087 46,063 17.8 8,302 8,244 -0.7
Sugarcane 27,653 23,131 -16.4 6,136 5,462 -11
Banana 37,194 45,292 21.8 6,192 6,819 10.1
Other crops 222,026 239,919 8.1 43,559 46,608 7
Livestock 111,360 116,976 5 28,397 29,072 2.4
Poultry 64,007 68,330 6.8 25,016 25,091 0.3
Other Agriculture Services 40,058 43,771 9.3 10,603 11,151 5.2
b. FISHERY 129,823 143,514 10.5 54,825 58,591 6.9
2. FORESTRY 4,343 4,669 7.5 1,326 1,488 12.2
GVA AGRI, FISHERY AND FORESTRY 855,452 937,342 9.6 239,837 252,010 5.1
Source: NSCB
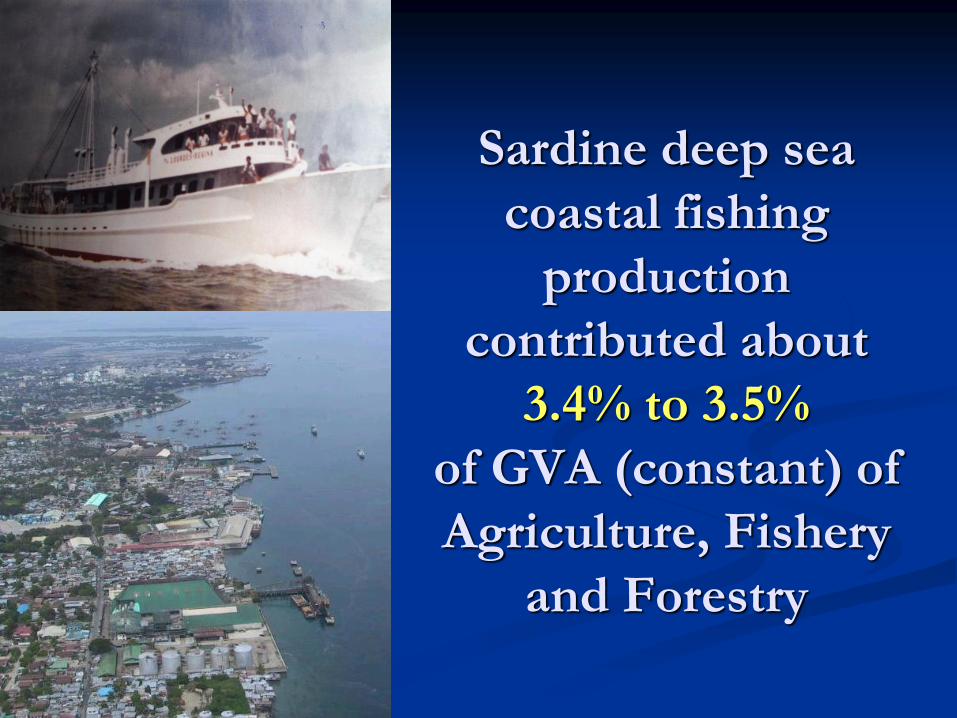
Sardine deep sea
coastal fishing
production
contributed about
3.4% to 3.5%
of GVA (constant) of
Agriculture, Fishery
and Forestry
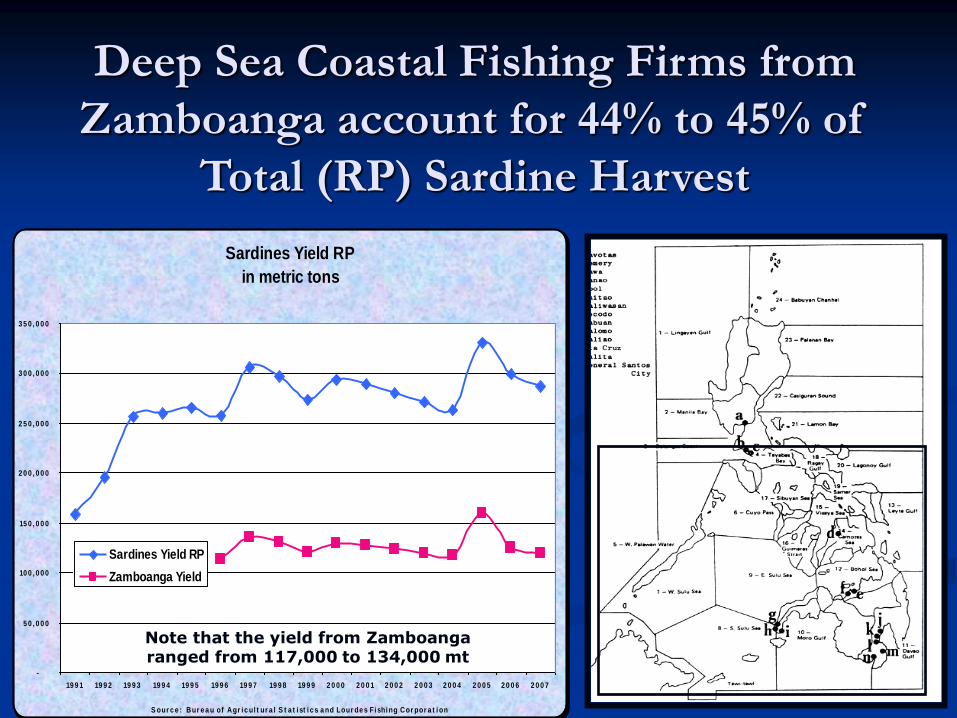
Sardines Yield RP
in metric tons
-
5 0 , 0 0 0
10 0 , 0 0 0
15 0 , 0 0 0
2 0 0 , 0 0 0
2 5 0 , 0 0 0
3 0 0 , 0 0 0
3 5 0 , 0 0 0
19 9 1 19 9 2 19 9 3 19 9 4 19 9 5 19 9 6 19 9 7 19 9 8 19 9 9 2 0 0 0 2 0 0 1 2 0 0 2 2 0 0 3 2 0 0 4 2 0 0 5 2 0 0 6 2 0 0 7
S our c e : Bur e a u of Agr i c ul t ur a l S t a t i st i c s a nd Lour de s Fi shi ng Cor por a t i on
Sardines Yield RP
Zamboanga Yield
Deep Sea Coastal Fishing Firms from
Zamboanga account for 44% to 45% of
Total (RP) Sardine Harvest
Note that the yield from Zamboanga ranged from 117,000 to 134,000 mt
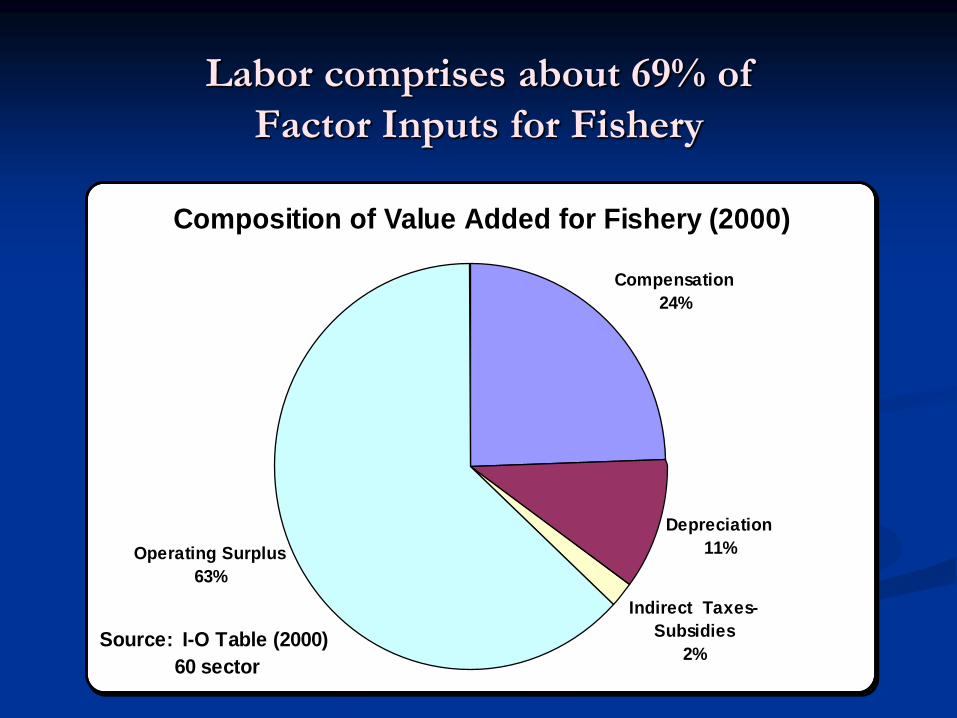
Labor comprises about 69% of
Factor Inputs for Fishery
Composition of Value Added for Fishery (2000)
Compensation
24%
Depreciation
11%
Indirect Taxes-
Subsidies
2%
Operating Surplus
63%
Source: I-O Table (2000)
60 sector
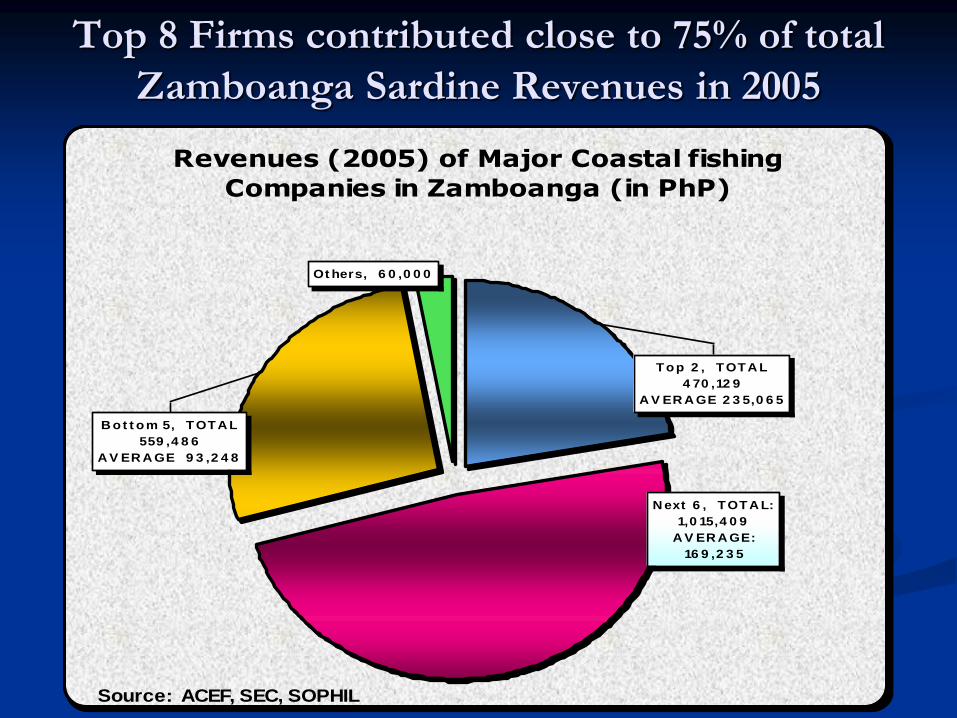
Top 8 Firms contributed close to 75% of total
Zamboanga Sardine Revenues in 2005
Revenues (2005) of Major Coastal fishing
Companies in Zamboanga (in PhP)
N ext 6 , TOTA L:
1,0 15,4 0 9
A V ER A GE:
16 9 ,2 3 5
Top 2 , TOTA L
4 70 ,12 9
A V ER A GE 2 3 5,0 6 5
B ot t om 5, TOTA L
559 ,4 8 6
A V ER A GE 9 3 ,2 4 8
Ot hers, 6 0 ,0 0 0
Source: ACEF, SEC, SOPHIL
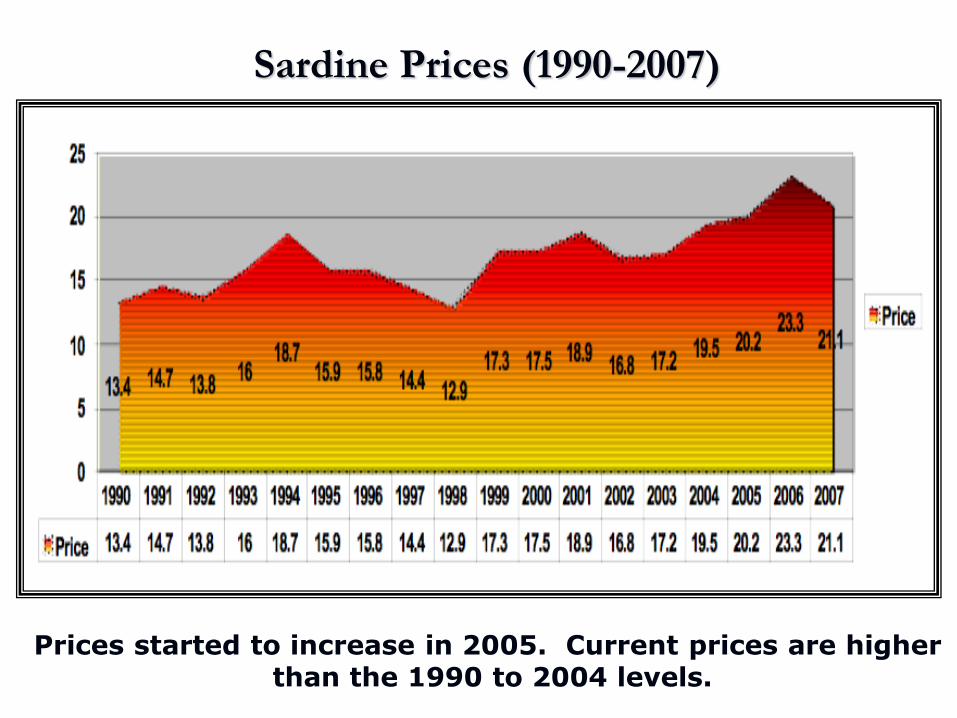
Sardine Prices (1990-2007)
Prices started to increase in 2005. Current prices are higher than the 1990 to 2004 levels.
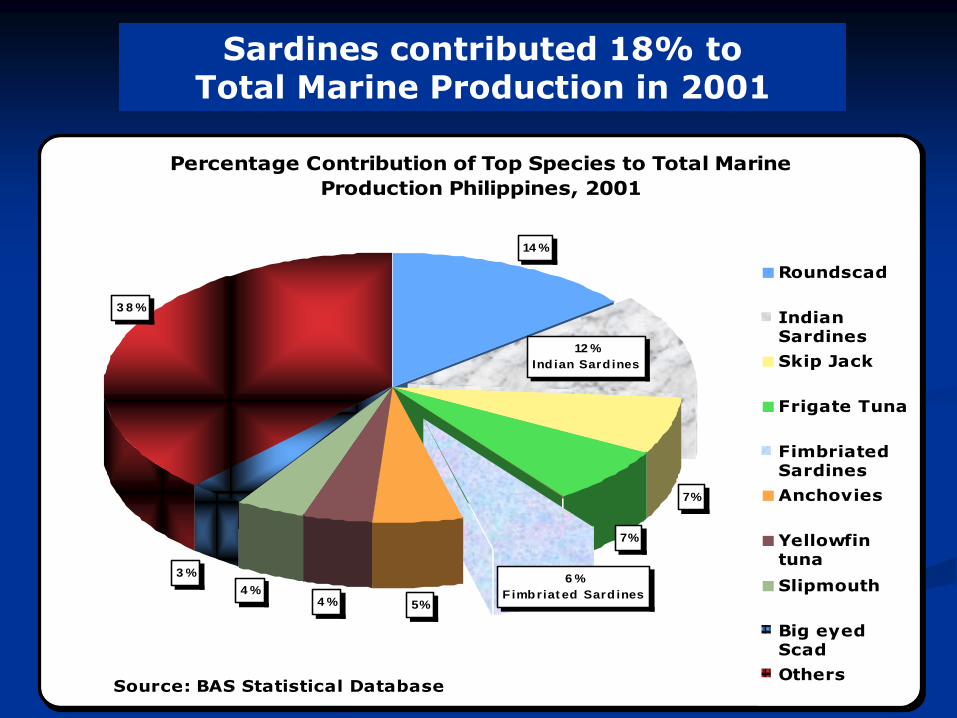
Percentage Contribution of Top Species to Total Marine
Production Philippines, 2001
14 %
7%
5%4 %4 %
3 8 %
3 %
12 %
Ind ian Sard ines
6 %
F imbriat ed Sard ines
7%
Roundscad
IndianSardines
Skip Jack
Frigate Tuna
FimbriatedSardines
Anchovies
Yellowfintuna
Slipmouth
Big eyedScad
OthersSource: BAS Statistical Database
Sardines contributed 18% to Total Marine Production in 2001
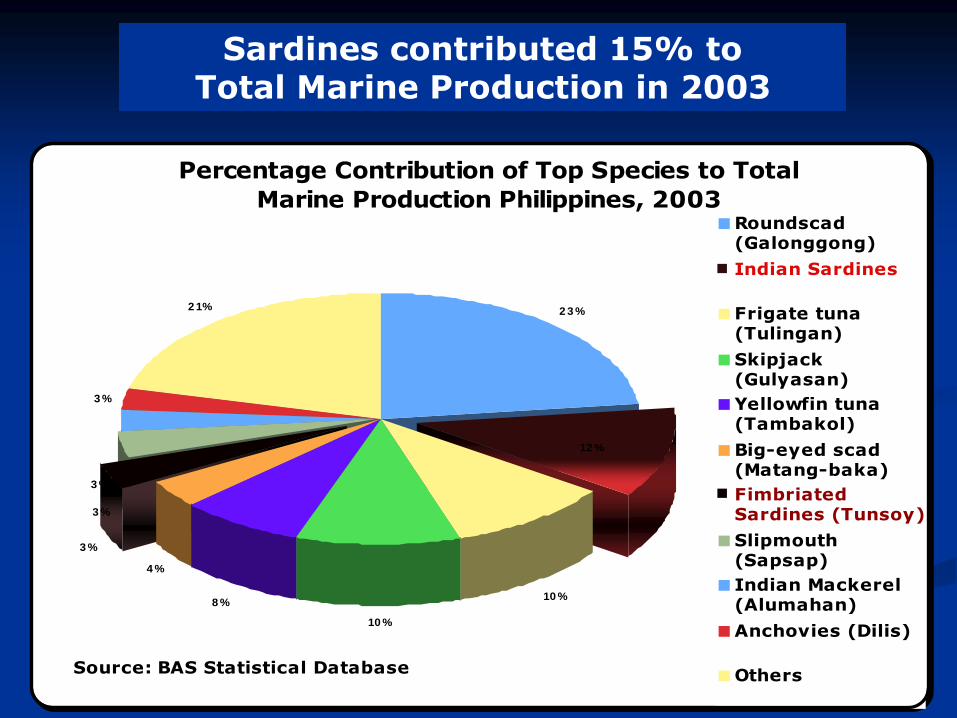
Percentage Contribution of Top Species to Total
Marine Production Philippines, 2003
2 3 %
10 %
10 %
8 %
4 %
3 %
3 %
3 %
3 %
2 1%
12 %
Roundscad(Galonggong)
Indian Sardines
Frigate tuna(Tulingan)
Skipjack(Gulyasan)
Yellowfin tuna(Tambakol)
Big-eyed scad(Matang-baka)
FimbriatedSardines (Tunsoy)
Slipmouth(Sapsap)
Indian Mackerel(Alumahan)
Anchovies (Dilis)
OthersSource: BAS Statistical Database
Sardines contributed 15% to Total Marine Production in 2003
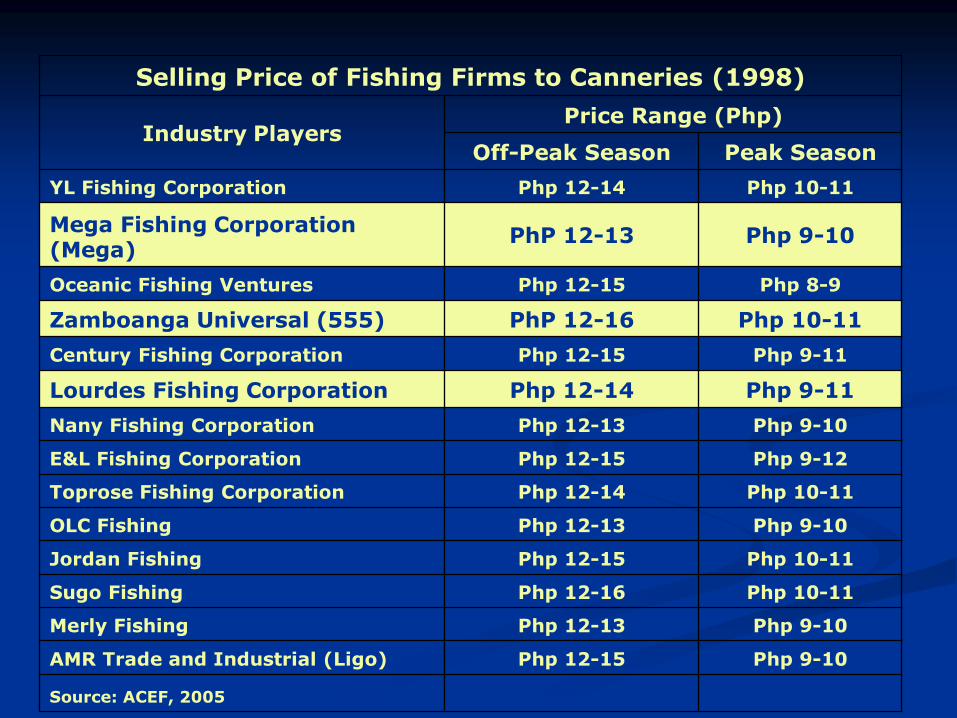
Selling Price of Fishing Firms to Canneries (1998)
Industry Players Price Range (Php)
Off-Peak Season Peak Season
YL Fishing Corporation Php 12-14 Php 10-11
Mega Fishing Corporation (Mega)
PhP 12-13 Php 9-10
Oceanic Fishing Ventures Php 12-15 Php 8-9
Zamboanga Universal (555) PhP 12-16 Php 10-11
Century Fishing Corporation Php 12-15 Php 9-11
Lourdes Fishing Corporation Php 12-14 Php 9-11
Nany Fishing Corporation Php 12-13 Php 9-10
E&L Fishing Corporation Php 12-15 Php 9-12
Toprose Fishing Corporation Php 12-14 Php 10-11
OLC Fishing Php 12-13 Php 9-10
Jordan Fishing Php 12-15 Php 10-11
Sugo Fishing Php 12-16 Php 10-11
Merly Fishing Php 12-13 Php 9-10
AMR Trade and Industrial (Ligo) Php 12-15 Php 9-10
Source: ACEF, 2005
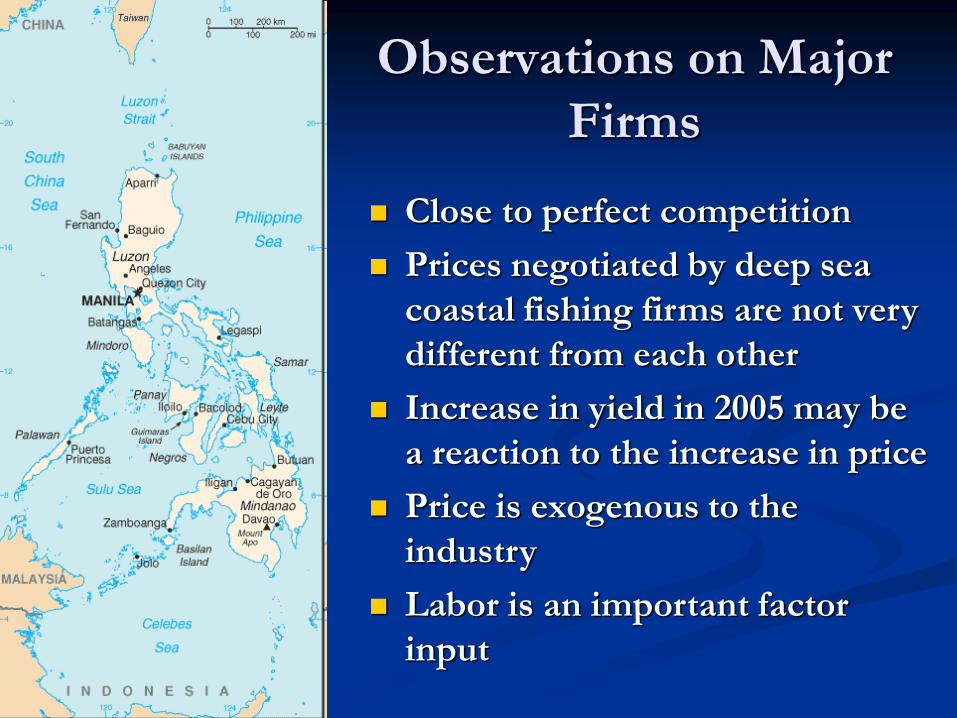
Observations on Major
Firms
Close to perfect competition
Prices negotiated by deep sea
coastal fishing firms are not very
different from each other
Increase in yield in 2005 may be
a reaction to the increase in price
Price is exogenous to the
industry
Labor is an important factor
input

Absence of a dominant
firm(s), exogenous price,
close to random distribution
of economic activity –
Marshallian demand and
supply situation
Make use of a representative
firm for the analysis of effort
Equilibrium level may be
reached in terms of effort
productivity
Consequences of these Observations
to the Model
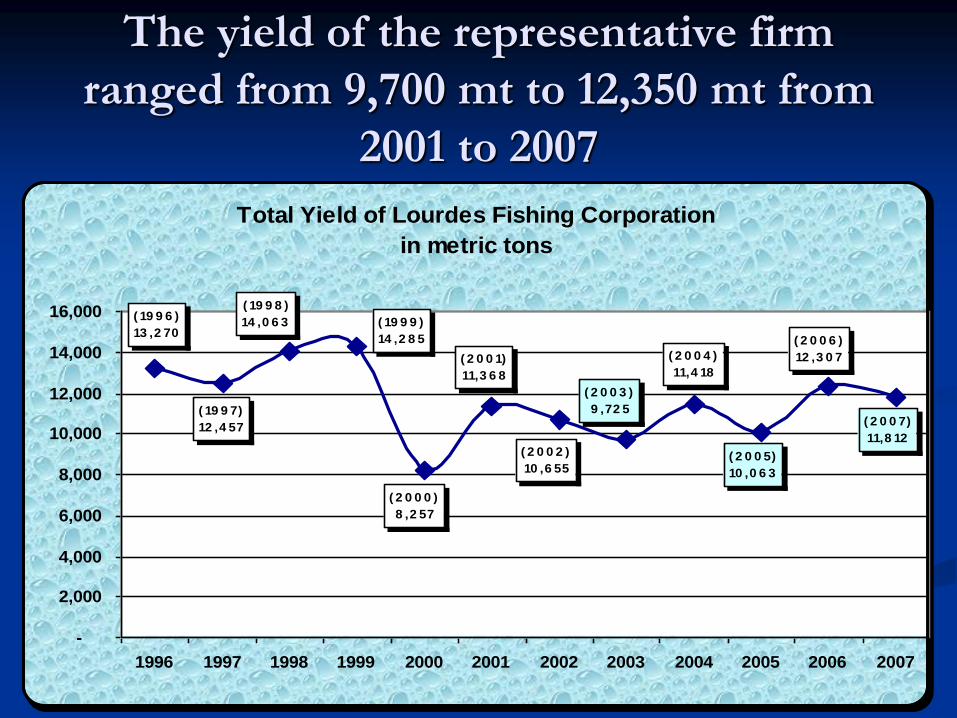
The yield of the representative firm
ranged from 9,700 mt to 12,350 mt from
2001 to 2007
Total Yield of Lourdes Fishing Corporation
in metric tons
( 19 9 7)
12 ,4 57
( 19 9 8 )
14 ,0 6 3
( 2 0 0 0 )
8 ,2 57
( 2 0 0 1)
11,3 6 8
( 2 0 0 2 )
10 ,6 55
( 2 0 0 3 )
9 ,72 5
( 2 0 0 4 )
11,4 18
( 2 0 0 5)
10 ,0 6 3
( 2 0 0 6 )
12 ,3 0 7
( 2 0 0 7)
11,8 12
( 19 9 6 )
13 ,2 70 ( 19 9 9 )
14 ,2 8 5
-
2,000
4,000
6,000
8,000
10,000
12,000
14,000
16,000
1996 1997 1998 1999 2000 2001 2002 2003 2004 2005 2006 2007
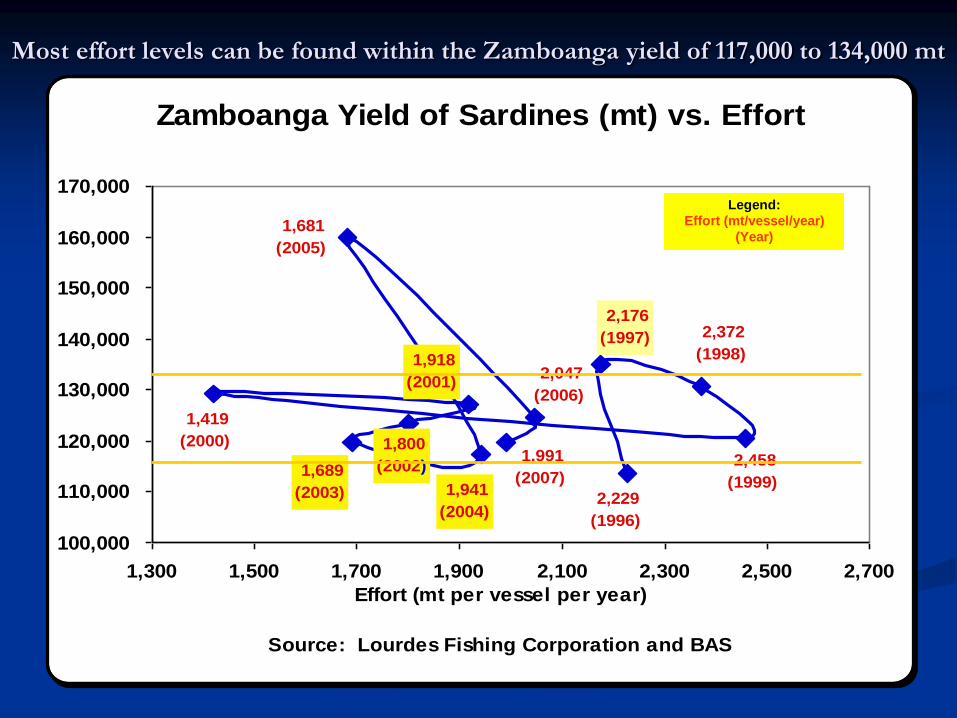
Zamboanga Yield of Sardines (mt) vs. Effort
2,458
(1999)
2,372
(1998)
2,176
(1997)
1,941
(2004)
1,991
(2007)
2,047
(2006)
1,918
(2001)
1,800
(2002) 1,689
(2003)
1,681
(2005)
1,419
(2000)
2,229
(1996)
100,000
110,000
120,000
130,000
140,000
150,000
160,000
170,000
1,300 1,500 1,700 1,900 2,100 2,300 2,500 2,700
Effort (mt per vessel per year)
Source: Lourdes Fishing Corporation and BAS
Legend:
Effort (mt/vessel/year)
(Year)
Most effort levels can be found within the Zamboanga yield of 117,000 to 134,000 mt
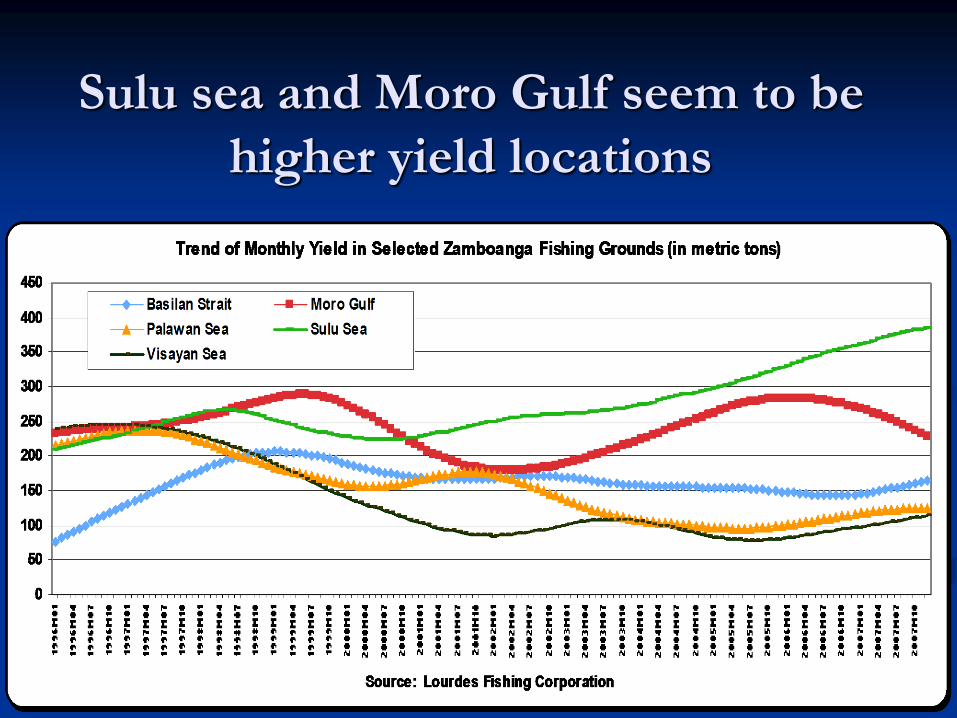
Sulu sea and Moro Gulf seem to be
higher yield locations
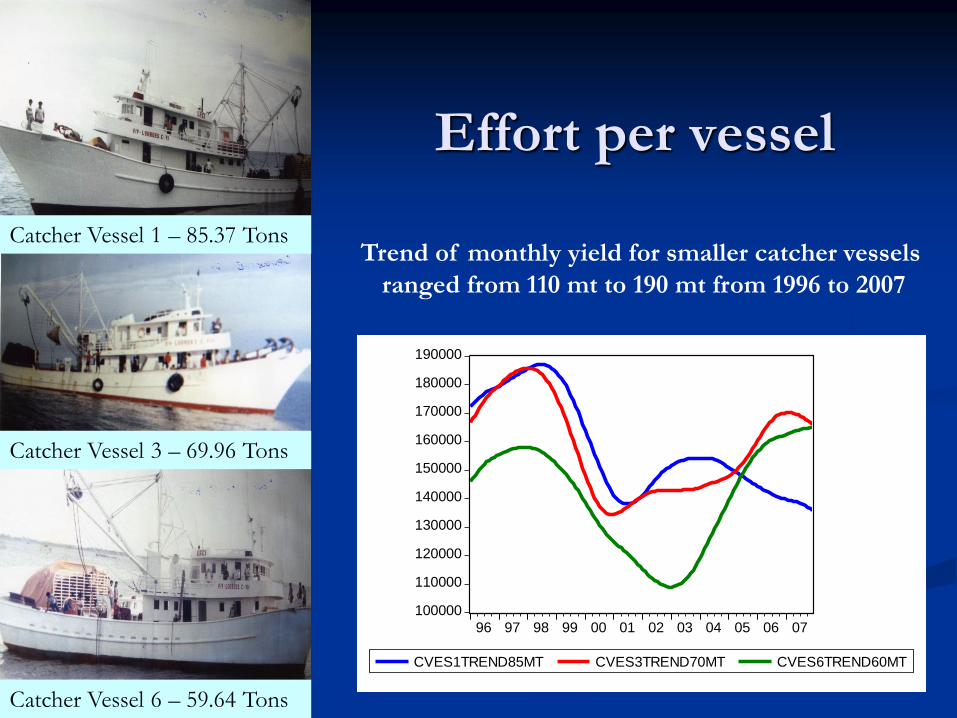
Effort per vessel
Catcher Vessel 6 – 59.64 Tons
Catcher Vessel 1 – 85.37 Tons
Catcher Vessel 3 – 69.96 Tons
100000
110000
120000
130000
140000
150000
160000
170000
180000
190000
96 97 98 99 00 01 02 03 04 05 06 07
CVES1TREND85MT CVES3TREND70MT CVES6TREND60MT
Trend of monthly yield for smaller catcher vessels
ranged from 110 mt to 190 mt from 1996 to 2007
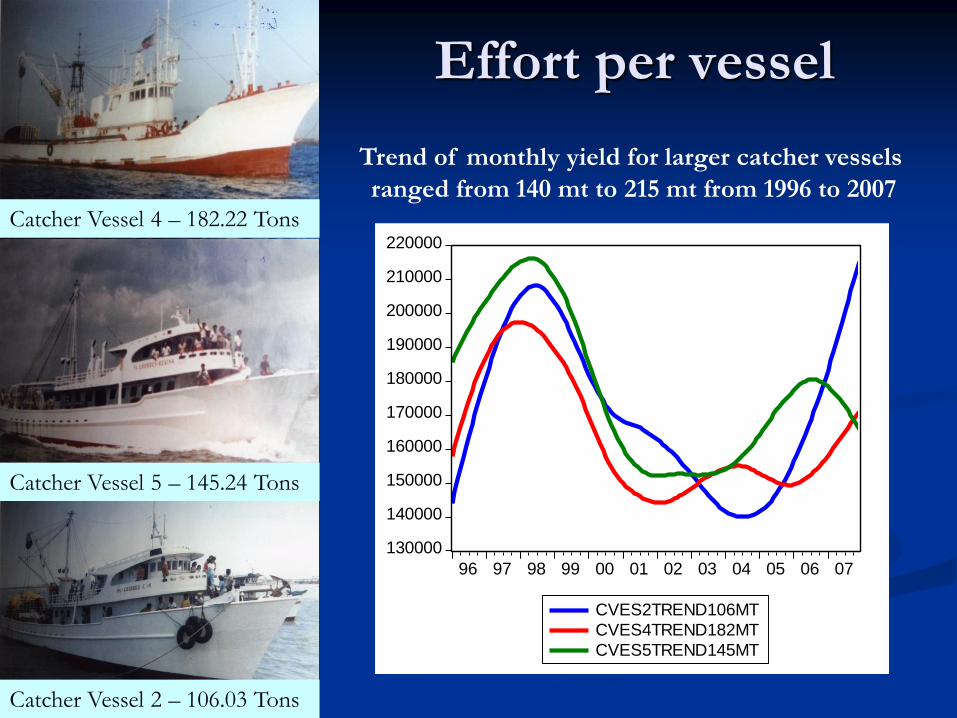
Effort per vessel
Catcher Vessel 2 – 106.03 Tons
Catcher Vessel 4 – 182.22 Tons
Catcher Vessel 5 – 145.24 Tons
130000
140000
150000
160000
170000
180000
190000
200000
210000
220000
96 97 98 99 00 01 02 03 04 05 06 07
CVES2TREND106MT
CVES4TREND182MT
CVES5TREND145MT
Trend of monthly yield for larger catcher vessels
ranged from 140 mt to 215 mt from 1996 to 2007
Results
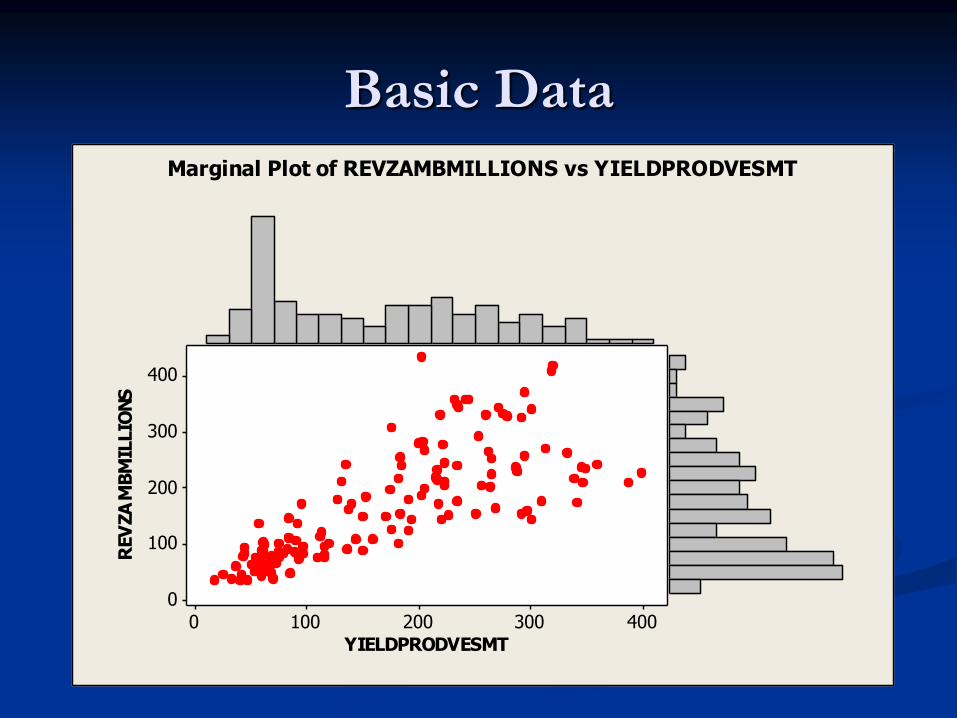
Basic Data
YIELDPRODVESMT
REV
ZA
MB
MIL
LIO
NS
4003002001000
400
300
200
100
0
Marginal Plot of REVZAMBMILLIONS vs YIELDPRODVESMT
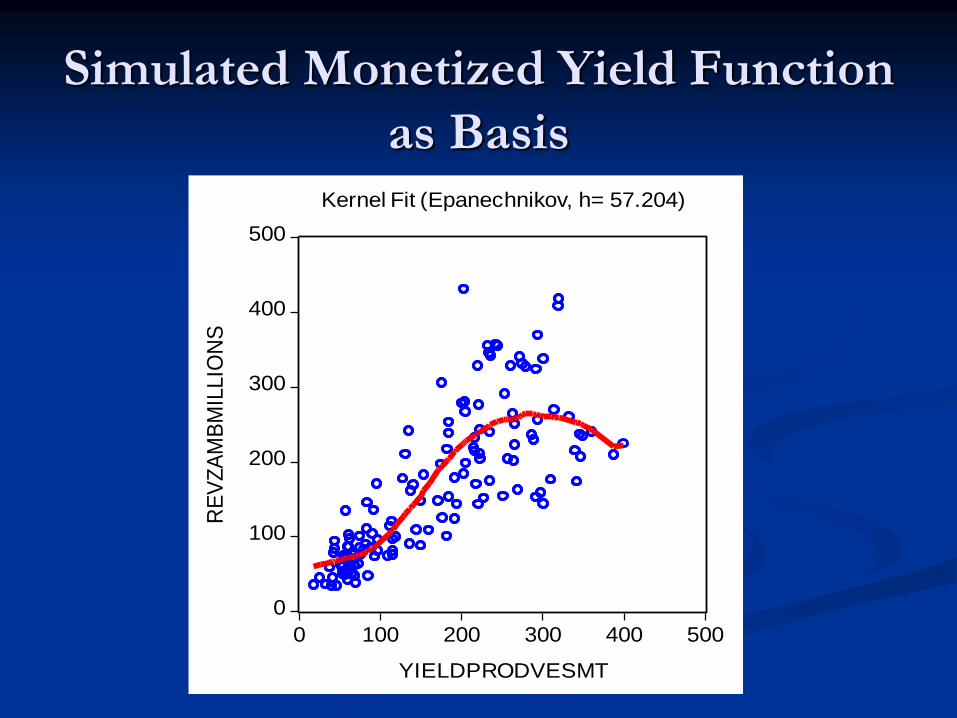
Simulated Monetized Yield Function
as Basis
0
100
200
300
400
500
0 100 200 300 400 500
YIELDPRODVESMT
RE
VZ
AM
BM
ILLIO
NS
Kernel Fit (Epanechnikov, h= 57.204)
Results
Effort per vessel capacity in mt
Y-D
ata
4003002001000
400
300
200
100
0
Variable
Zamboanga Revenues
Estimated Revenues
Simulated Revenues
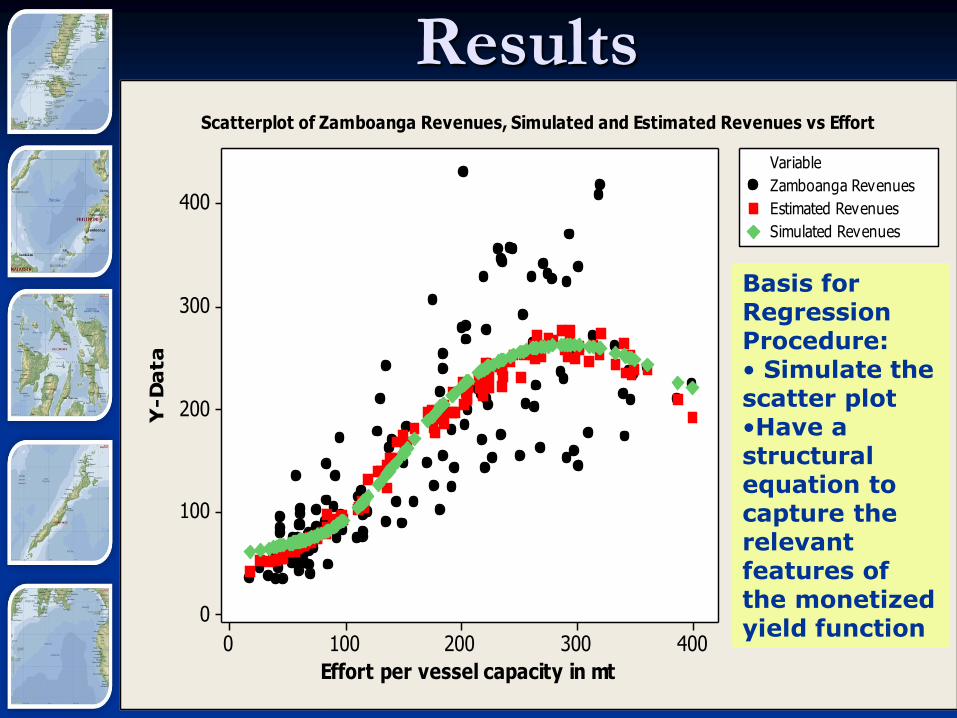
Scatterplot of Zamboanga Revenues, Simulated and Estimated Revenues vs Effort
Basis for Regression Procedure: • Simulate the scatter plot •Have a structural equation to capture the relevant features of the monetized yield function
Effort per vessel capacity in mt
Y-D
ata
4003002001000
500
400
300
200
100
0
Variable
Profits with ITQ
Zamboanga Revenues
Estimated Revenues
Estimated Cost
Estimated Profits
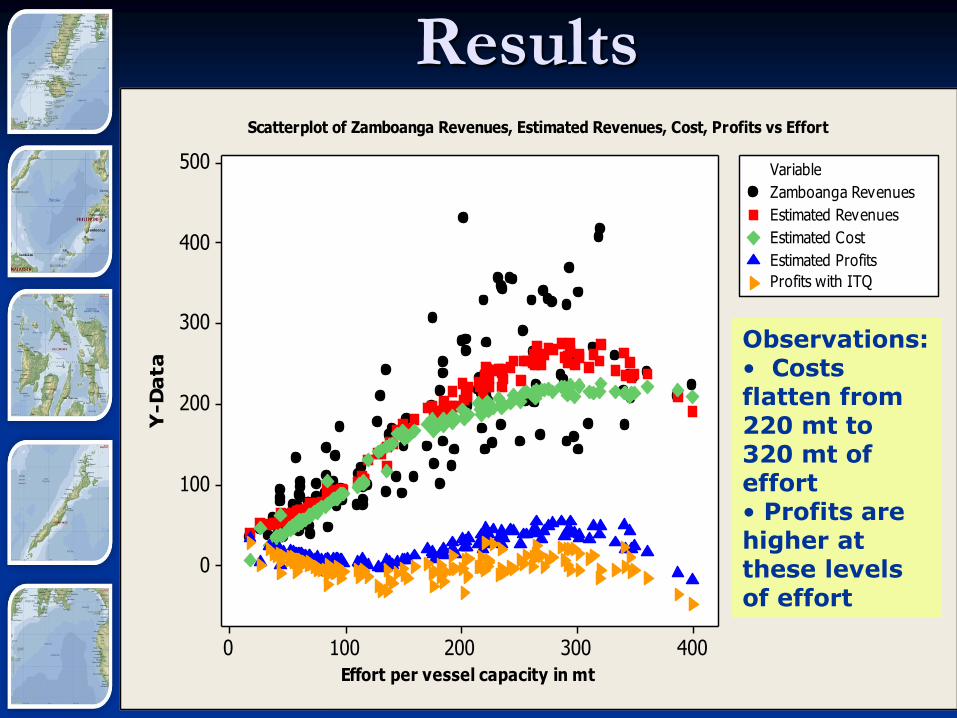
Scatterplot of Zamboanga Revenues, Estimated Revenues, Cost, Profits vs Effort
Observations: • Costs flatten from 220 mt to 320 mt of effort • Profits are higher at these levels of effort
Results
Regression Equation
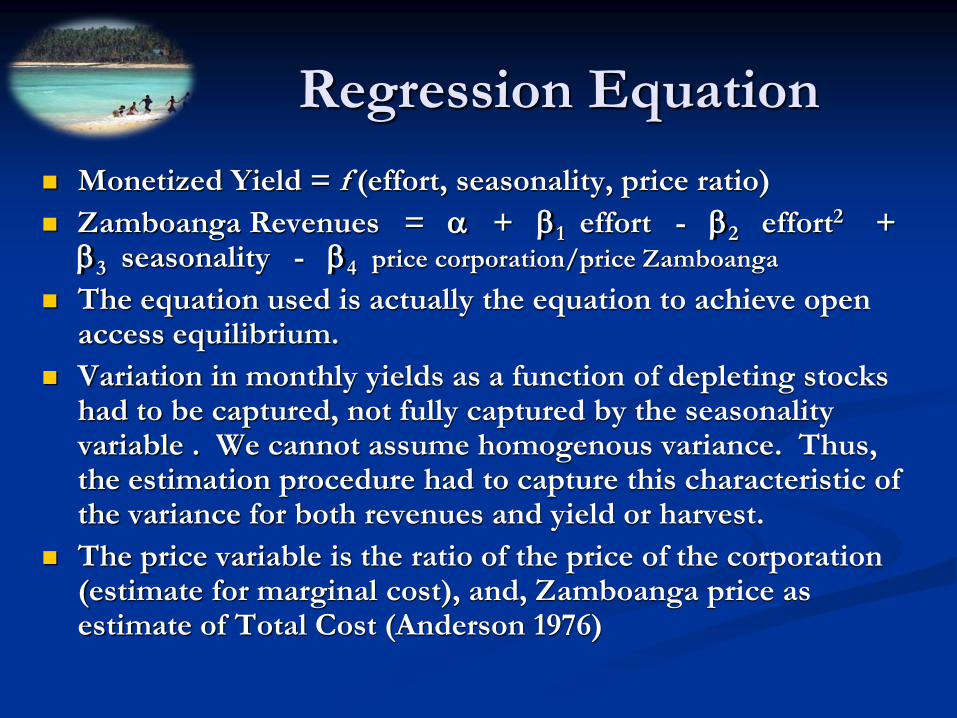
Monetized Yield = f (effort, seasonality, price ratio)
Zamboanga Revenues = + 1 effort - 2 effort2 +
3 seasonality - 4 price corporation/price Zamboanga
The equation used is actually the equation to achieve open access equilibrium.
Variation in monthly yields as a function of depleting stocks had to be captured, not fully captured by the seasonality variable . We cannot assume homogenous variance. Thus, the estimation procedure had to capture this characteristic of the variance for both revenues and yield or harvest.
The price variable is the ratio of the price of the corporation (estimate for marginal cost), and, Zamboanga price as estimate of Total Cost (Anderson 1976)
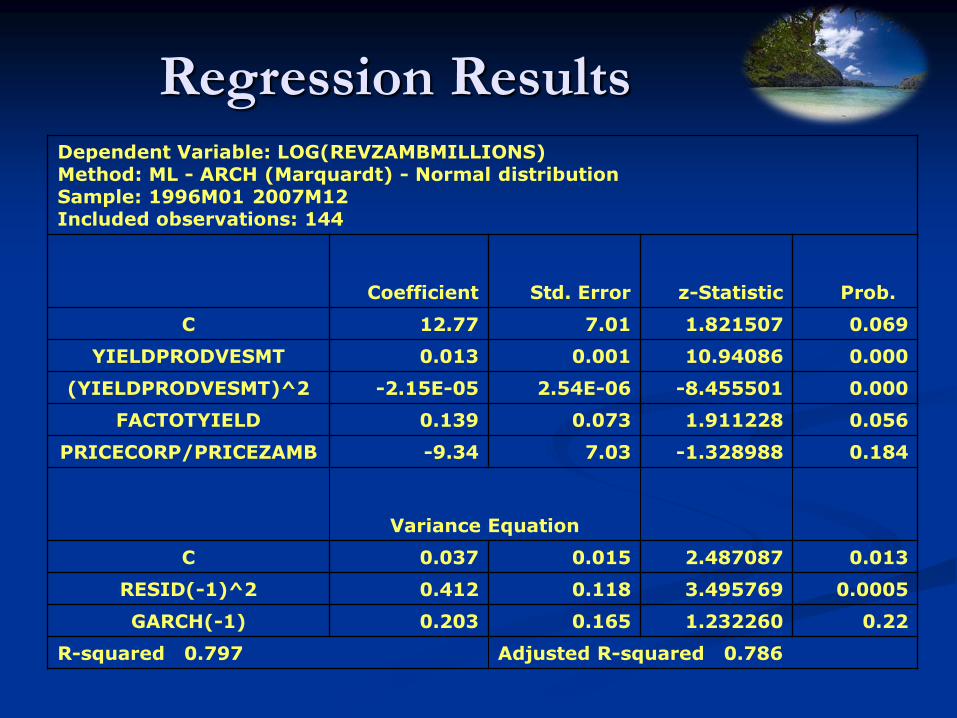
Regression Results Dependent Variable: LOG(REVZAMBMILLIONS)
Method: ML - ARCH (Marquardt) - Normal distribution
Sample: 1996M01 2007M12
Included observations: 144
Coefficient Std. Error z-Statistic Prob.
C 12.77 7.01 1.821507 0.069
YIELDPRODVESMT 0.013 0.001 10.94086 0.000
(YIELDPRODVESMT)^2 -2.15E-05 2.54E-06 -8.455501 0.000
FACTOTYIELD 0.139 0.073 1.911228 0.056
PRICECORP/PRICEZAMB -9.34 7.03 -1.328988 0.184
Variance Equation
C 0.037 0.015 2.487087 0.013
RESID(-1)^2 0.412 0.118 3.495769 0.0005
GARCH(-1) 0.203 0.165 1.232260 0.22
R-squared 0.797 Adjusted R-squared 0.786
Regression Results
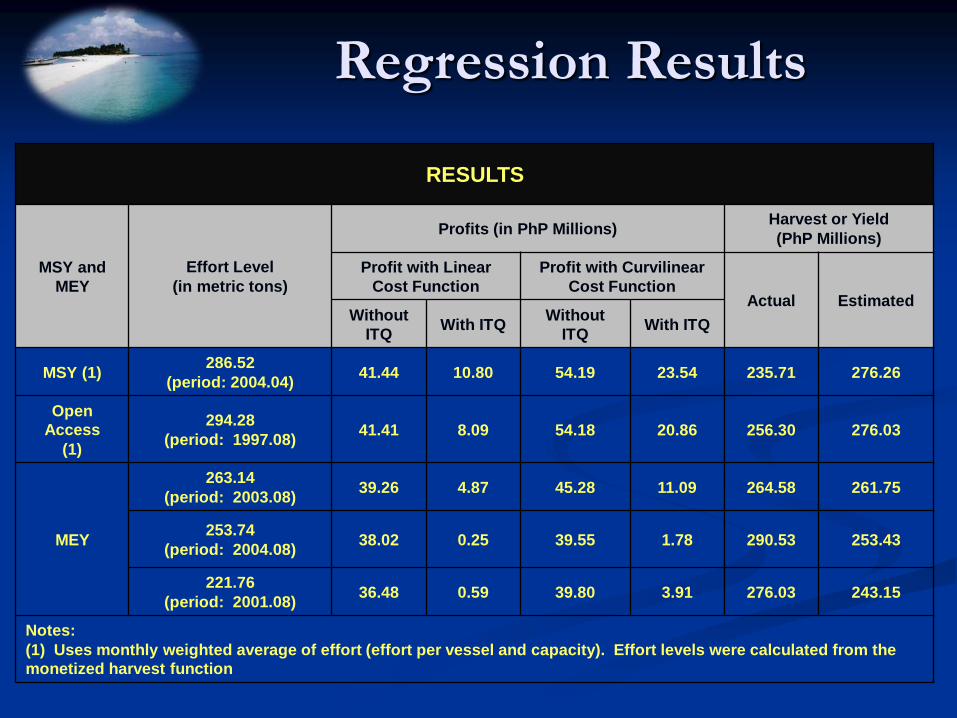
RESULTS
MSY and
MEY
Effort Level
(in metric tons)
Profits (in PhP Millions) Harvest or Yield
(PhP Millions)
Profit with Linear
Cost Function
Profit with Curvilinear
Cost Function Actual Estimated
Without
ITQ With ITQ
Without
ITQ With ITQ
MSY (1) 286.52
(period: 2004.04) 41.44 10.80 54.19 23.54 235.71 276.26
Open
Access
(1)
294.28
(period: 1997.08) 41.41 8.09 54.18 20.86 256.30 276.03
MEY
263.14
(period: 2003.08) 39.26 4.87 45.28 11.09 264.58 261.75
253.74
(period: 2004.08) 38.02 0.25 39.55 1.78 290.53 253.43
221.76
(period: 2001.08) 36.48 0.59 39.80 3.91 276.03 243.15
Notes:
(1) Uses monthly weighted average of effort (effort per vessel and capacity). Effort levels were calculated from the
monetized harvest function
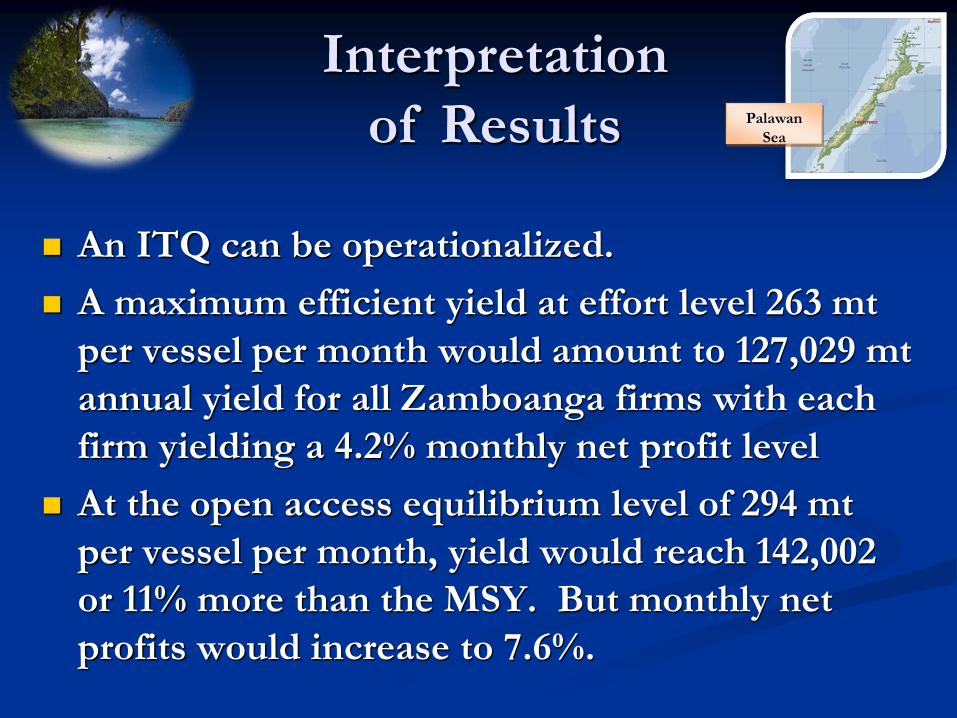
An ITQ can be operationalized.
A maximum efficient yield at effort level 263 mt
per vessel per month would amount to 127,029 mt
annual yield for all Zamboanga firms with each
firm yielding a 4.2% monthly net profit level
At the open access equilibrium level of 294 mt
per vessel per month, yield would reach 142,002
or 11% more than the MSY. But monthly net
profits would increase to 7.6%.
Palawan
Sea
Interpretation
of Results
Moro Gulf
Conclusion
The results call for a need to review productivity per vessel so as to increase yield without necessarily increasing cost
Capital equipment investment or an improvement in yield practices, i.e. incorporate seasonality
Use of a sonar
Freezing facility near port, owned by Mega Fishing
References
Anderson, Lee G. (1995) “Privatizing Open Access Fisheries: Individual Transferrable Quotas.” Chapter 20. Handbook of Environment and Natural Resources
Anderson, Lee G. (1976) “The Relationship of Firm and Fishery in Common Property Fisheries.” Land Economics. Vol 52. No. 2 (May 1976). Pp. 179-191
Conrad, Jon M. (1995) “Bioeconomic Models of the Fishery.” Chapter 18. Handbook of Environment and Natural Resources
USAID (2004). “In Turbulent Seas.”
DA and BFAR (2005). “Comprehensive National Fisheries Industry Development Plan.”