Embed Size (px)
Citation preview
No portion of this document may be reproduced, scanned into an electronic system, distributed, publicly displayed or used as the basis of derivative works without attributing Bloomberg Finance L.P. and the Business Council for Sustainable Energy. For more information on terms of use, please contact [email protected]. Copyright and Disclaimer notice on the last page applies throughout. Developed in partnership with the Business Council for Sustainable Energy.
2018
Sustainable Energyin AmericaFactbook
GET THE FACTS
www.bcse.org
1 © Bloomberg Finance LP 2018. Developed in partnership with The Business Council for Sustainable Energy.
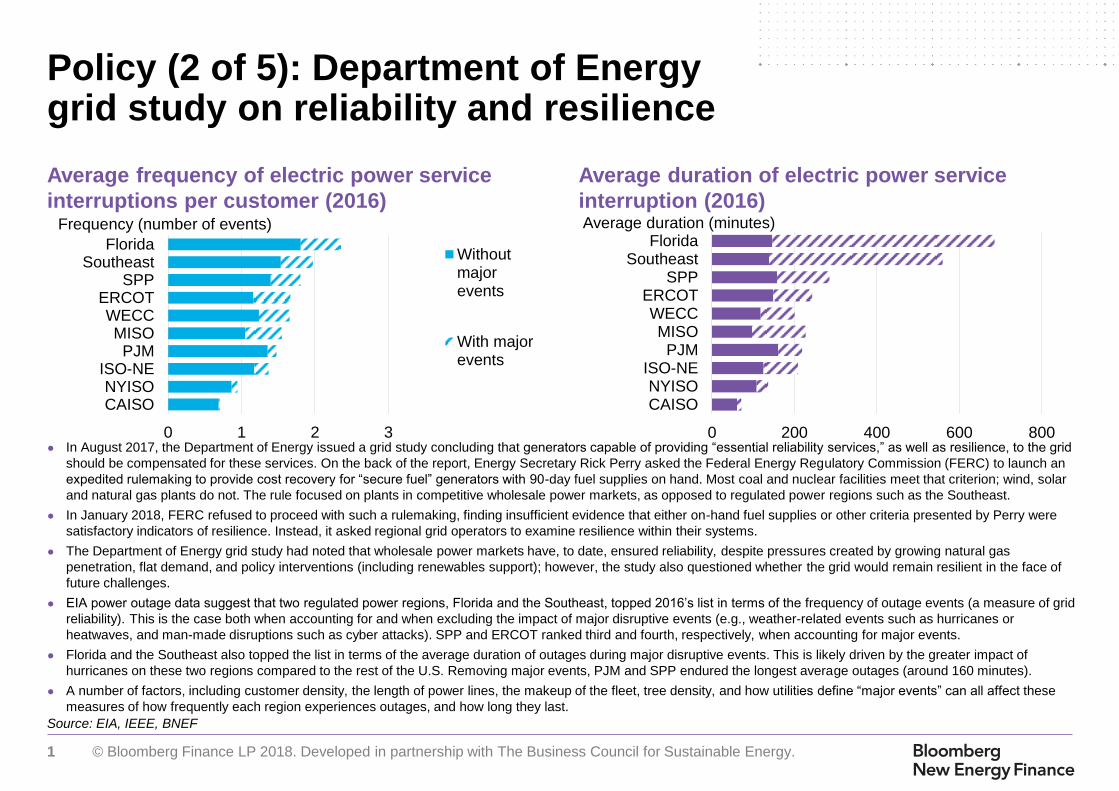
Source: EIA, IEEE, BNEF
Average frequency of electric power service
interruptions per customer (2016)
Average duration of electric power service
interruption (2016)
0 1 2 3
CAISONYISO
ISO-NEPJM
MISOWECC
ERCOTSPP
SoutheastFlorida
Frequency (number of events)
Withoutmajorevents
With majorevents
0 200 400 600 800
CAISONYISO
ISO-NEPJM
MISOWECC
ERCOTSPP
SoutheastFlorida
Average duration (minutes)
Policy (2 of 5): Department of Energy grid study on reliability and resilience
● In August 2017, the Department of Energy issued a grid study concluding that generators capable of providing “essential reliability services,” as well as resilience, to the grid
should be compensated for these services. On the back of the report, Energy Secretary Rick Perry asked the Federal Energy Regulatory Commission (FERC) to launch an
expedited rulemaking to provide cost recovery for “secure fuel” generators with 90-day fuel supplies on hand. Most coal and nuclear facilities meet that criterion; wind, solar
and natural gas plants do not. The rule focused on plants in competitive wholesale power markets, as opposed to regulated power regions such as the Southeast.
● In January 2018, FERC refused to proceed with such a rulemaking, finding insufficient evidence that either on-hand fuel supplies or other criteria presented by Perry were
satisfactory indicators of resilience. Instead, it asked regional grid operators to examine resilience within their systems.
● The Department of Energy grid study had noted that wholesale power markets have, to date, ensured reliability, despite pressures created by growing natural gas
penetration, flat demand, and policy interventions (including renewables support); however, the study also questioned whether the grid would remain resilient in the face of
future challenges.
● EIA power outage data suggest that two regulated power regions, Florida and the Southeast, topped 2016’s list in terms of the frequency of outage events (a measure of grid
reliability). This is the case both when accounting for and when excluding the impact of major disruptive events (e.g., weather-related events such as hurricanes or
heatwaves, and man-made disruptions such as cyber attacks). SPP and ERCOT ranked third and fourth, respectively, when accounting for major events.
● Florida and the Southeast also topped the list in terms of the average duration of outages during major disruptive events. This is likely driven by the greater impact of
hurricanes on these two regions compared to the rest of the U.S. Removing major events, PJM and SPP endured the longest average outages (around 160 minutes).
● A number of factors, including customer density, the length of power lines, the makeup of the fleet, tree density, and how utilities define “major events” can all affect these
measures of how frequently each region experiences outages, and how long they last.

2 © Bloomberg Finance LP 2018. Developed in partnership with The Business Council for Sustainable Energy.
Source: Edison Electric Institute (updated September 2017)
Finance: U.S. transmission investment by investor-owned utilities and independent transmission developers
● Investor-owned utilities and independent transmission developers spent an estimated $20.8 billion on electric transmission in 2016, a new high.
This is up 3% from 2015.
● Based on company reports, investor presentations and a survey conducted by the Edison Electric Institute (EEI), transmission investment is
likely to grow 10% in 2017 to $22.9 billion. Current capex plans suggest that investment will peak at $23.9bn in 2018; however, because 2018-
2019 budgets are not yet finalized, these numbers may be revised upwards.
● The upswing in transmission investment is motivated by a number of factors, all of which concern the utility’s fundamental aim of providing
reliable, affordable, and safe power. These include a need to replace and upgrade aging power lines, resiliency planning in response to
potential threats (both natural and man-made), the integration of renewable resources, and congestion reduction.
Actual Planned
22.923.9
22.621.6
12.0
15.1
17.2
19.7 20.2 20.8
2011 2012 2013 2014 2015 2016 2017e 2018e 2019e 2020e
$bn (nominal)
3 © Bloomberg Finance LP 2018. Developed in partnership with The Business Council for Sustainable Energy.
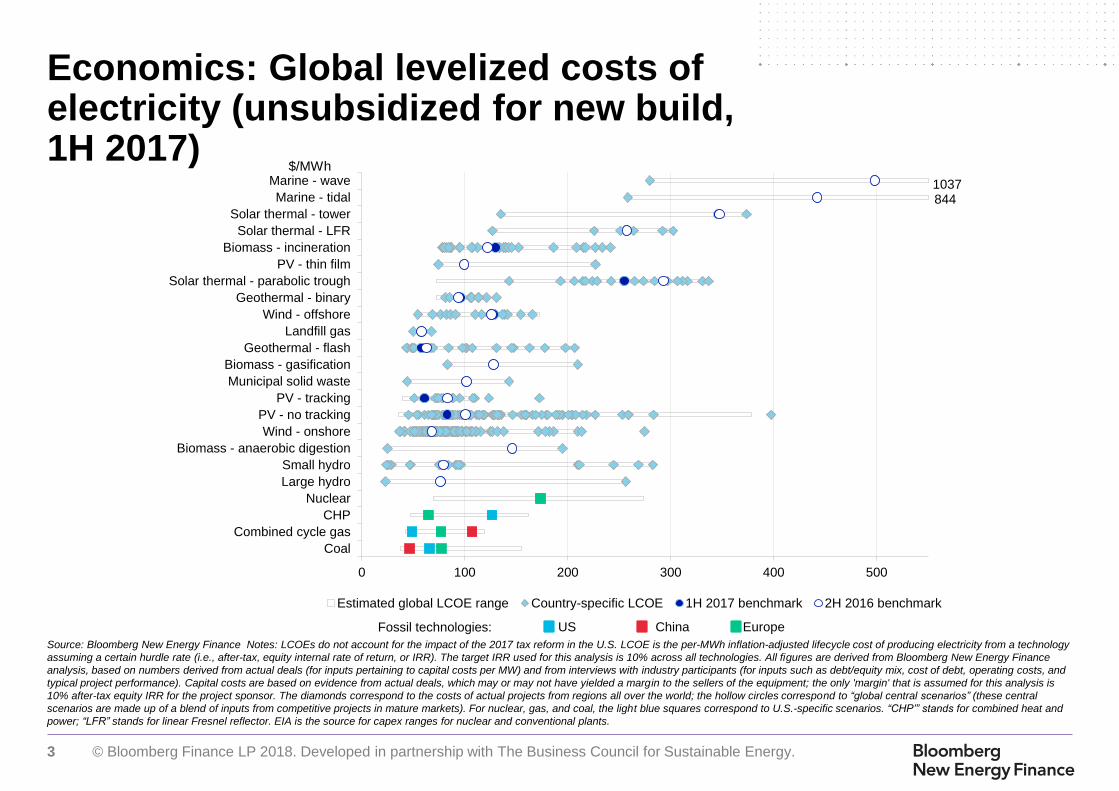
Source: Bloomberg New Energy Finance Notes: LCOEs do not account for the impact of the 2017 tax reform in the U.S. LCOE is the per-MWh inflation-adjusted lifecycle cost of producing electricity from a technology
assuming a certain hurdle rate (i.e., after-tax, equity internal rate of return, or IRR). The target IRR used for this analysis is 10% across all technologies. All figures are derived from Bloomberg New Energy Finance
analysis, based on numbers derived from actual deals (for inputs pertaining to capital costs per MW) and from interviews with industry participants (for inputs such as debt/equity mix, cost of debt, operating costs, and
typical project performance). Capital costs are based on evidence from actual deals, which may or may not have yielded a margin to the sellers of the equipment; the only 'margin' that is assumed for this analysis is
10% after-tax equity IRR for the project sponsor. The diamonds correspond to the costs of actual projects from regions all over the world; the hollow circles correspond to “global central scenarios” (these central
scenarios are made up of a blend of inputs from competitive projects in mature markets). For nuclear, gas, and coal, the light blue squares correspond to U.S.-specific scenarios. “CHP’” stands for combined heat and
power; “LFR” stands for linear Fresnel reflector. EIA is the source for capex ranges for nuclear and conventional plants.
0 100 200 300 400 500
Coal
Combined cycle gas
CHP
Nuclear
Large hydro
Small hydro
Biomass - anaerobic digestion
Wind - onshore
PV - no tracking
PV - tracking
Municipal solid waste
Biomass - gasification
Geothermal - flash
Landfill gas
Wind - offshore
Geothermal - binary
Solar thermal - parabolic trough
PV - thin film
Biomass - incineration
Solar thermal - LFR
Solar thermal - tower
Marine - tidal
Marine - wave
Estimated global LCOE range Country-specific LCOE 1H 2017 benchmark 2H 2016 benchmark
8441037
US China EuropeFossil technologies:
Economics: Global levelized costs of electricity (unsubsidized for new build, 1H 2017)
$/MWh

4 © Bloomberg Finance LP 2018. Developed in partnership with The Business Council for Sustainable Energy.
Source: Bloomberg New Energy Finance Note: LCOEs do not account for the impact of the tax reform in the U.S. “CCGT” stands for combined cycle gas turbine. See
previous slide for further notes regarding methodology.
Economics: U.S. levelized costs of electricity (unsubsidized for new build, 1H 2017)
● New solar PV plants can now undercut new coal build on a levelized cost of energy (LCOE) basis in the U.S. The
benchmark LCOE for a solar system with tracking was estimated at $54/MWh for 1H 2017, whereas coal came in at
$66/MWh. Capex reductions drove a $17/MWh drop in the levelized cost estimate for solar with tracking since 2H 2016.
● Meanwhile, growing renewable energy penetration and coal-to-gas switching continue to limit the average capacity factor
expected for new coal-fired power plants, helping to limit any levelized cost reductions.
● Combined-cycle gas remains one of the cheapest sources of new generation in the U.S., with benchmark projects
achieving levelized costs of $49/MWh.
● New onshore wind projects constructed in areas with strong wind resources can achieve LCOEs as low as $33/MWh,
beating out even cheap natural gas build.
0 40 80 120 160 200 240
Natural gas - CCGT
Wind - onshore
Solar PV - tracking
Coal
Solar PV - no tracking
Nuclear
Solar thermal - trough
$/MWh
LCOE range
1H 2017 benchmark
2H 2016 benchmark

5 © Bloomberg Finance LP 2018. Developed in partnership with The Business Council for Sustainable Energy.
Source: Bloomberg New Energy Finance Note: Charts show offsite PPAs only
Renewable capacity contracted by corporations,
by technology
Largest corporate offtakers, 2017
Finance: Corporate procurement of clean energy in the U.S.
● Corporate PPA volumes rose to 2.9GW in 2017, up from the 2.4GW signed in 2016. Sustainability continues to drive activity in the U.S.,
although many large corporations have met their medial targets domestically and are now looking to sign deals internationally.
● Power prices continue to remain low across the U.S., and are further depressed during hours of high wind in markets like ERCOT and SPP,
and when solar generates in CAISO. This has left many PPAs underwater, and corporations are now targeting wholesale markets with lower
existing renewable penetration, like MISO and PJM.
● Apple contracted 0.56GW of U.S. clean energy in 2017, more than any other corporation. It signed the largest PPA ever in the U.S. between a
corporation and a utility – a 235MW PV plant with NV Energy under the utility’s GreenEnergy Rider. Google signed PPAs for 0.54GW, en route
to offsetting 100% of its global electricity demand. Kimberly-Clark, T-Mobile, General Mills and Cummins all signed their first PPAs in 2017.
● Green tariff programs made up 19% of corporate procurement activity in 2017, as companies are increasingly looking to source clean energy
within the same service territory as their load. These programs are offered by utilities in 12 states, with one more state pending.
0.10.3
0.1 0.2 0.1
0.6
1.5
3.2
2.4
2.9
0
3
6
9
12
0
1
2
3
4
2008 9 10 11 12 13 14 15 16 17
Annual (GW)
Solar Wind Other Cumulative
Cumulative (GW)
356
35
45
200
536
245
200
200
160
152
62
100
100
Apple Inc
Google Inc
Kimberly-Clark
Facebook Inc
General Motors Co
T-Mobile USA
Anheuser-Busch InBev NV
Bay Area Rapid Transit
General Mills
Target Corp
MW
Solar Wind

6 © Bloomberg Finance LP 2018. Developed in partnership with The Business Council for Sustainable Energy.
Source: American Gas Association, U.S. Department of Transportation
U.S. existing natural gas distribution pipelines U.S. natural gas distribution mainline material
Deployment: U.S. natural gas pipeline installations and materials
● Service and distribution pipelines that bring gas from transmission lines to end-users continue to develop incrementally,
with growth averaging 1% per year over the past decade.
● Plastic is the material of choice for replacement and expansion efforts as U.S. pipelines are upgraded with more modern
materials. Companies are removing older networks, which are made from cast iron and unprotected steel, and replacing
them with newer plastic / protected steel pipes that are less susceptible to leaks. At the same time, more miles of pipeline
are being added to connect underserved and previously unserved customers.
0.0
0.5
1.0
1.5
2.0
2.5
199
0
199
5
200
0
200
5
201
0
201
5
Miles (Millions)
Services Mains
0.0
0.5
1.0
1.5
2.0
2.5
199
0
199
5
200
0
200
5
201
0
201
5
Miles (Millions)
Other Plastic Protected Steel Cast Iron & Unprotected Steel

7 © Bloomberg Finance LP 2018. Developed in partnership with The Business Council for Sustainable Energy.
Source: Bloomberg New Energy Finance, American Gas Association, EIA Notes: EIA data used here include both first-mile takeaway capacity and other pipeline additions that
do not impact takeaway capacity. 2017 transmission capacity addition is a BNEF estimate and not EIA historical data. Expenditure values reflect figures reported to the AGA by
different types of companies across the supply chain, including transmission companies, investor-owned local distribution companies, and municipal gas utilities. “General’”
includes miscellaneous expenditures such as construction of administrative buildings. Totals may not sum due to rounding.
U.S. transmission pipeline capacity additions U.S. midstream gas construction expenditures
Deployment: U.S. midstream infrastructure capacity and investment
● Pipeline companies completed 6Bcfd of pipeline capacity in 2016, just slightly below the 7.6Bcfd planned. A number of delays pushed the
online date of many substantial projects from 2015-2016 into 2017-2018.
● The next few years are scheduled to see major increases in pipeline capacity growth. 33Bcfd of capacity was scheduled to be completed in
2017, though just under half of this is estimated to have been complete by year’s end.
● Takeaway capacity from the Appalachian Basin expanded by 4.1Bcfd in 2017, but only 0.04Bcfd (1%) of this brings gas into New England
(through the Atlantic Bridge Expansion project on the Algonquin pipeline). As a result, natural gas delivery into New England remains
constrained.
● Midstream expenditures increased 19% year-on-year in 2016. Distribution accounted for nearly half of the increased spending, rising to its
highest level yet at $13.4bn, a 16% increase over 2015 levels. There was also a small but noticeable increase in production and storage
expenditure, which more than doubled in 2016.
6 5 47 5 7 5 7 8
5 56
77
8 1012
1311 1
22
2 2
2
3
1412 11
1715
17 17
21
25
0
5
10
15
20
25
30
2008 2009 2010 2011 2012 2013 2014 2015 2016
General
Productionand storage
Undergroundstorage
Distribution
Transmission
$bn (nominal)
3 6 7 49 9 11 9 6 8 10
15
45
2217 19
5 6 7 9 614
199
6
199
7
199
8
199
9
200
0
200
1
200
2
2003
2004
200
5
200
6
200
7
200
8
200
9
201
0
201
1
201
2
201
3
201
4
2015
2016
201
7
Bcfd

8 © Bloomberg Finance LP 2018. Developed in partnership with The Business Council for Sustainable Energy.
Source: Bloomberg New Energy Finance, Department of Energy. Note: All curtailment percentages shown in the figure represent both forced and economic curtailment. PJM's
2012 curtailment estimate is for June through December only. Department of Energy sourced data from ERCOT, MISO, CAISO, NYISO, PJM, ISO-NE, SPP.
Deployment: U.S. wind curtailment
● Curtailment can occur due to transmission constraints, inflexibilities in the grid and environmental or generation restrictions.
● This was a significant problem in ERCOT (Texas) from 2008-2013, but the build-out and upgrade of the Competitive Renewable Energy
Zone (CREZ) transmission lines and increased efficiency in ERCOT’s wholesale electricity market lessened this concern. Curtailment in this
region fell to only 0.5% in 2014, down from a peak of 17% in 2009. It stayed just under 1% for 2015, but ticked back up to 2% for 2016.
● In both 2015 and 2016, PJM experienced the lowest curtailment of any region, at 0.2%. MISO and New England continued to experience
curtailment rates of over 4%, the highest out of all the regions sampled. However, MISO’s wind curtailment dropped 21% from 2015 to 2016,
as transmission build began to alleviate congestion; most of MISO’s MVP transmission projects should be online by 2019. New England’s
curtailment levels in 2016 jumped 78% from 2015, an issue that needs to be addressed for Massachusetts to reach its 50% Renewable
Portfolio Standard. CAISO, NYISO, and SPP fall in the middle, experiencing 0.5%, 0.6% and 1.61% of curtailment, respectively.
● Total U.S. curtailment has shrunk since 2009. However, time-varying influences also played a role: in 2015, for example, the western and
interior U.S. experienced below-normal wind speeds, reducing generation and therefore the need to curtail in constrained regions.
Curtailment rate
0%
4%
8%
12%
16%
20%
ERCOT MISO NYISO PJM ISO-NE SPP CAISO TOTALSAMPLED
2007
2008
2009
2010
2011
2012
2013
2014
2015
2016
9 © Bloomberg Finance LP 2018. Developed in partnership with The Business Council for Sustainable Energy.
0
5
10
15
20
25
Jan 2
01
0
Jan 2
01
1
Jan 2
01
2
Jan 2
01
3
Jan 2
01
4
Jan 2
01
5
Jan 2
01
6
Jan 2
01
7
Jan 2
01
8
Gigawatts
Solar PV
Houston Wind
Coastal Wind
South Wind
North Wind
West Wind
Panhandle Wind
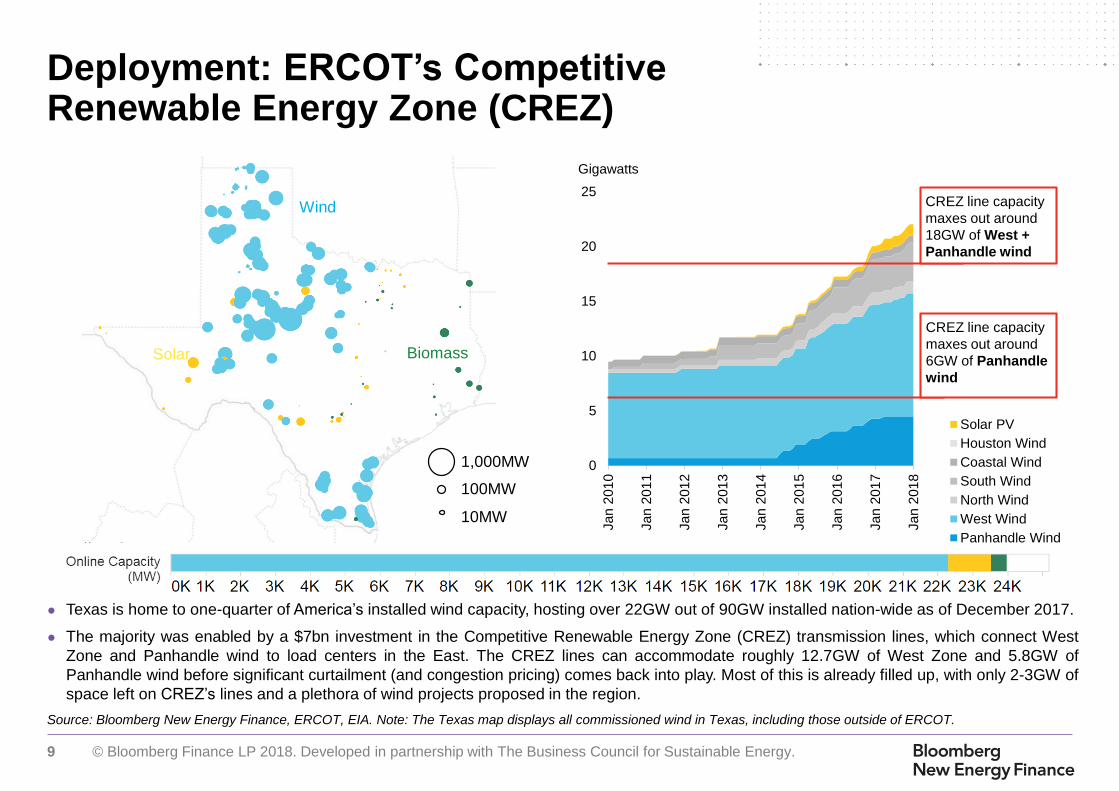
Source: Bloomberg New Energy Finance, ERCOT, EIA. Note: The Texas map displays all commissioned wind in Texas, including those outside of ERCOT.
● Texas is home to one-quarter of America’s installed wind capacity, hosting over 22GW out of 90GW installed nation-wide as of December 2017.
● The majority was enabled by a $7bn investment in the Competitive Renewable Energy Zone (CREZ) transmission lines, which connect West
Zone and Panhandle wind to load centers in the East. The CREZ lines can accommodate roughly 12.7GW of West Zone and 5.8GW of
Panhandle wind before significant curtailment (and congestion pricing) comes back into play. Most of this is already filled up, with only 2-3GW of
space left on CREZ’s lines and a plethora of wind projects proposed in the region.
Deployment: ERCOT’s Competitive Renewable Energy Zone (CREZ)
CREZ line capacity
maxes out around
6GW of Panhandle
wind
CREZ line capacity
maxes out around
18GW of West +
Panhandle wind
Wind
Solar Biomass
1,000MW
100MW
10MW

10 © Bloomberg Finance LP 2018. Developed in partnership with The Business Council for Sustainable Energy.
Source: Midwest ISO; MISO MTER14 MVP Triennial Review, September 2014.
Notes: Projects are as follows: (1) Big Stone–Brookings, (2) Brookings, SD–SE Twin
Cities, (3) Lakefield Jct.–Winnebago–Winco–Burt Area & Sheldon–Burt Area–
Webster, (4) Winco–Lime Creek–Emery–Black Hawk– Hazleton, (5) LaCrosse–N.
Madison–Cardinal & Dubuque Co– Spring Green–Cardinal, (6) Ellendale–Big Stone,
(7) Adair–Ottumwa, (8) Adair–Palmyra Tap, (9) Palmyra Tap–Quincy–Meredosia–
Ipava & Meredosia–Pawnee, (10) Pawnee–Pana, (11) Pana–Mt. Zion–Kansas–Sugar
Creek, (12) Reynolds–Burr Oak–Hiple, (13) Michigan Thumb Loop Expansion, (14)
Reynolds–Greentown, (15) Pleasant Prairie–Zion Energy Center, (16) Fargo-
Galesburg–Oak Grove, (17) Sidney–Rising.
● The American Wind Energy Association (AWEA) estimates that
transmission proposals across the U.S. could potentially enable 52GW
of wind capacity between 2017 and 2024. This does not include
transmission associated with AEP’s Wind Catcher Energy Connection.
● AWEA’s estimate includes the 14GW-enabling1 Multi Value Project
(MVP) transmission portfolio currently underway by the Midwest
Independent System Operator (MISO). There are 17 projects within
MVP: Five of these are already complete, 11 are expected to come
online by 2019, and one by 2023. This expanded MISO transmission
capacity is expected to fill up quickly—thirty gigawatts of wind and
15GW of solar are already in the MISO interconnection queue as of
December 2017.
● Finally, five high-voltage DC transmission projects by Clean Line
Energy Partners represent 16GW of potential wind capacity.
– These projects have seen a myriad of challenges, including the
Missouri Public Service Commission’s denial of the Grain Belt
Express application.
– NextEra Energy Resources acquired Clean Line’s Plains & Eastern
project assets in Oklahoma, after the project struggled to sign on the
Tennessee Valley Authority as an offtaker.
● Many of the proposed transmission projects have yet to begin
construction and much of this will not be built. Generally, transmission
build within a specific state or region receives full approval faster than
those that cross multiple jurisdictions. Furthermore, utility-owned
transmission projects have typically seen more success than private
lines. The Transwest Express line, which expects to commission by
2021, has been under development since 2005 – meaning if the asset
comes online, it will have taken 16 years to develop.
Deployment: Transmission build-out in MISO and Mountain West
MISO Multi Value Project transmission portfolio
11 © Bloomberg Finance LP 2018. Developed in partnership with The Business Council for Sustainable Energy.
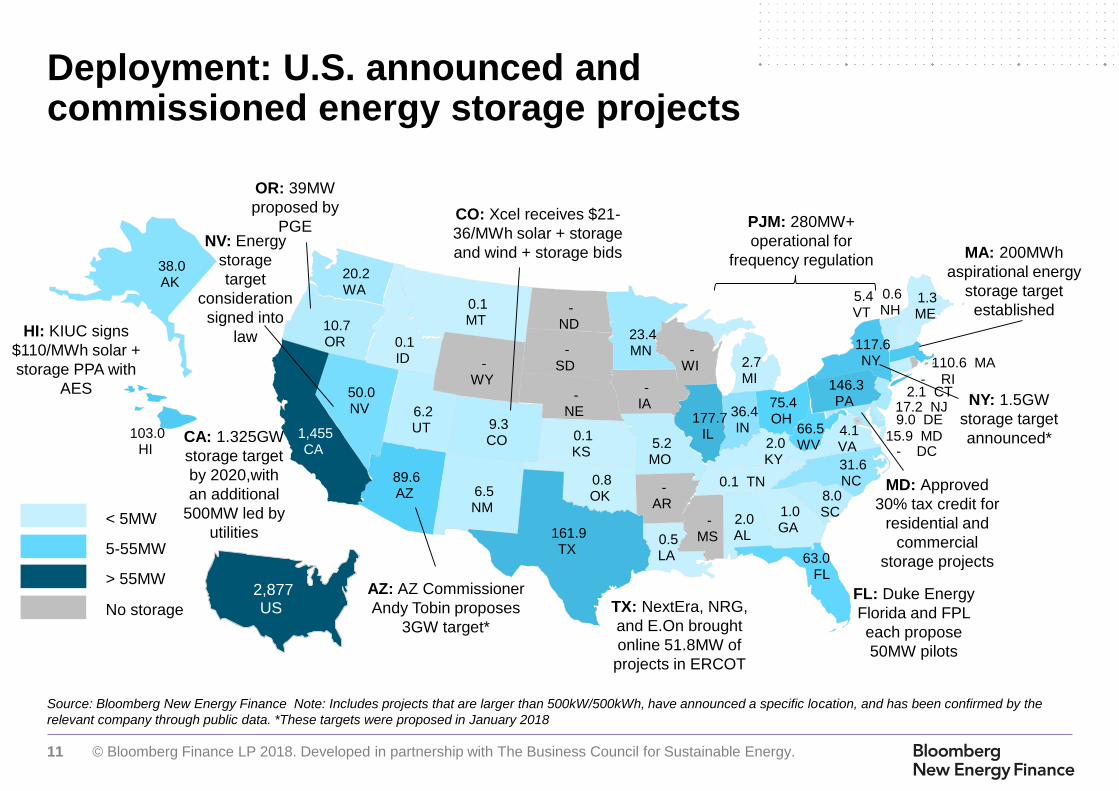
Source: Bloomberg New Energy Finance Note: Includes projects that are larger than 500kW/500kWh, have announced a specific location, and has been confirmed by the
relevant company through public data. *These targets were proposed in January 2018
Deployment: U.S. announced and commissioned energy storage projects
< 5MW
5-55MW
> 55MW
No storage
NY: 1.5GW
storage target
announced*CA: 1.325GW
storage target
by 2020,with
an additional
500MW led by
utilities
PJM: 280MW+
operational for
frequency regulation
OR: 39MW
proposed by
PGE
FL: Duke Energy
Florida and FPL
each propose
50MW pilots
TX: NextEra, NRG,
and E.On brought
online 51.8MW of
projects in ERCOT
AZ: AZ Commissioner
Andy Tobin proposes
3GW target*
CO: Xcel receives $21-
36/MWh solar + storage
and wind + storage bidsNV: Energy
storage
target
consideration
signed into
law
MD: Approved
30% tax credit for
residential and
commercial
storage projects
MA: 200MWh
aspirational energy
storage target
established
HI: KIUC signs
$110/MWh solar +
storage PPA with
AES
2.0 AL
38.0 AK
89.6 AZ -
AR
1,455 CA
9.3 CO
2.1 CT
- DC
9.0 DE
63.0 FL
1.0 GA
103.0 HI
0.1 ID
177.7 IL
36.4 IN
-IA
0.1 KS
2.0 KY
0.5 LA
1.3 ME
15.9 MD
110.6 MA2.7 MI
23.4 MN
-MS
5.2 MO
0.1 MT
-NE
50.0 NV
0.6 NH
17.2 NJ
6.5 NM
117.6 NY
31.6 NC
-ND
75.4 OH
0.8 OK
10.7 OR
146.3 PA
- RI
8.0 SC
-SD
0.1 TN
161.9 TX
6.2 UT
5.4 VT
4.1 VA
20.2 WA
66.5 WV
-WI-
WY
2,877 US

12 © Bloomberg Finance LP 2018. Developed in partnership with The Business Council for Sustainable Energy.
165
86
91106
82
49
204221
251
0
200
400
600
800
1000
1200
0
50
100
150
200
250
300
2011 2012 2013 2014 2015 2016 2017
Annual MW Cumulative MW (line)
Source: Bloomberg New Energy Finance Notes: *2017 includes expected but unconfirmed capacity as of January 31, 2018. Unconfirmed capacity is marked in white. Does
not include pumped hydropower, underground compressed air energy storage, or flooded lead-acid batteries. Minimum project size for inclusion in this analysis is 500kW or
500kWh. Cumulative capacity subtracts capacity that was decommissioned. Installations by state includes only confirmed capacity.
Commissioned capacity Installations by state (top 10 states)
Deployment: U.S. non-hydropower commissioned energy storage capacity
● Annual energy storage installations have increased since 2014, and is expected to do so again in 2017. Build ramped up in 2015 from projects
seeking to participate in the PJM frequency regulation market – those represent most of the capacity in Illinois, West Virginia, Ohio and
Pennsylvania.
● While PJM states are still, in aggregate, the biggest energy storage market in terms of commissioned capacity in the U.S., California is the
largest single state market. The majority of the commissioned capacity there was built between late 2016 and early 2017 as an emergency
response to the gas supply shortages expected from the Aliso Canyon gas storage facility leak-mitigation efforts.
● Beyond California and PJM, many smaller projects have commissioned in other states such as Hawaii, Texas, Indiana and New York.
● Falling lithium-ion battery pack prices have helped to lower costs for new stationary storage applications (see here).
*
230
119
81
75
67
64
55
40
36
26
California
Illinois
Texas
Hawaii
West Virginia
Pennsylvania
Ohio
Alaska
Arizona
Indiana
MW

13 © Bloomberg Finance LP 2018. Developed in partnership with The Business Council for Sustainable Energy.
● In 2016, growth in utility spending on energy efficiency level off at $7.6bn, only 1% higher than the previous year. This reflects the slowdown in
new states introducing EERS policies and the maturing of many states schemes.
● While investment growth eased at the national level, the picture was more dynamic at the state level. Utilities in Washington increased
spending by $34m (+11%), and there were also notable increases in Indiana (+$34m, +33%), North Carolina (+$31m, +21%) and Kentucky
(+$30m, +38%).
● However, these gains were offset by falling investment in California (-$57m, -3%) and Maryland (-$90m, -44%). The decrease in Maryland
stems in part from a general decline in investment by the state's utilities. The drop-off in California is relatively minor when compared against
the increase from $1.57bn to $1.71bn between 2014 and 2015.
Source: CEE, ACEEE, Bloomberg New Energy Finance. Note that data for 2010-14 was sourced from CEE, and for 2006-2009 and 2015-16 from the ACEEE.
Financing: U.S. utility energy efficiency spending
1.6
2.22.6
3.0
3.9
4.7 4.8 5.0
5.66.2 6.3
0.3
0.30.6
0.8
0.8
1.0 1.1 1.2
1.31.4 1.3
1.9
2.5
3.23.8
4.7
5.76.0 6.1
6.9
7.6 7.6
0
1
2
3
4
5
6
7
8
9
10
2006 2007 2008 2009 2010 2011 2012 2013 2014 2015 2016
Natural gas
Electricity
+34%
+25%
+18%
+26%
+20%+4%
+3% +13%
+12% +1%$bn
14 © Bloomberg Finance LP 2018. Developed in partnership with The Business Council for Sustainable Energy.
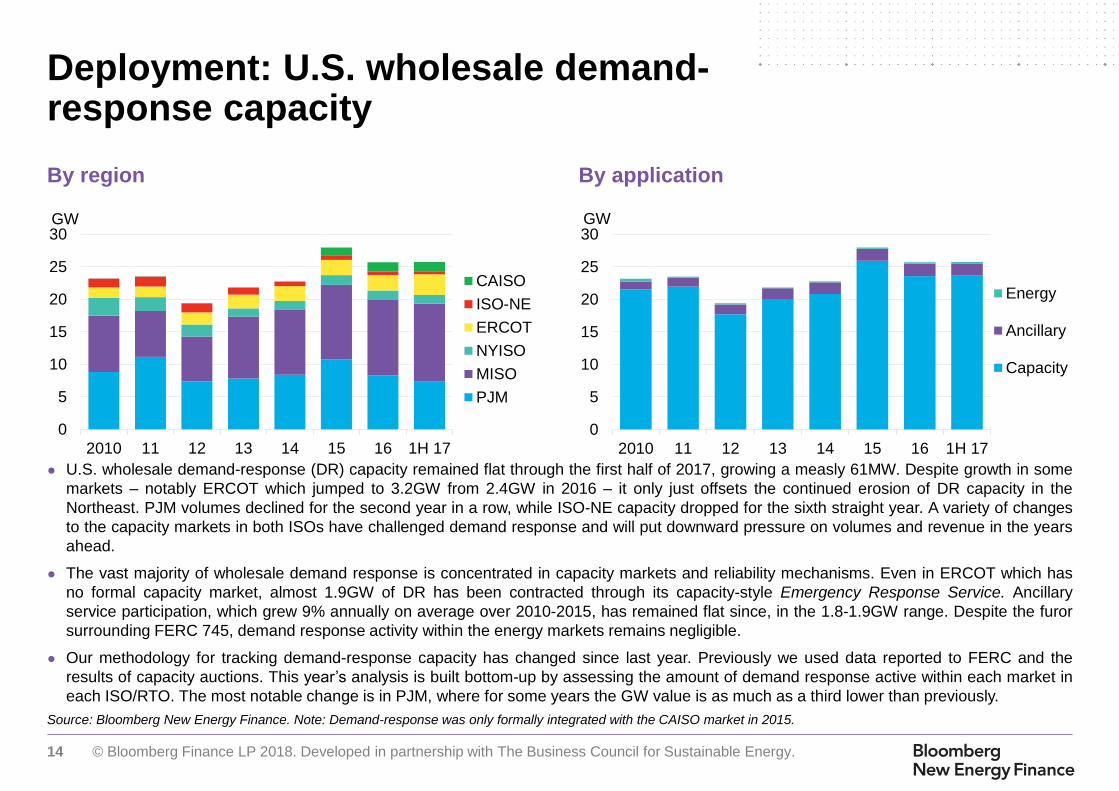
Source: Bloomberg New Energy Finance. Note: Demand-response was only formally integrated with the CAISO market in 2015.
By region By application
Deployment: U.S. wholesale demand-response capacity
● U.S. wholesale demand-response (DR) capacity remained flat through the first half of 2017, growing a measly 61MW. Despite growth in some
markets – notably ERCOT which jumped to 3.2GW from 2.4GW in 2016 – it only just offsets the continued erosion of DR capacity in the
Northeast. PJM volumes declined for the second year in a row, while ISO-NE capacity dropped for the sixth straight year. A variety of changes
to the capacity markets in both ISOs have challenged demand response and will put downward pressure on volumes and revenue in the years
ahead.
● The vast majority of wholesale demand response is concentrated in capacity markets and reliability mechanisms. Even in ERCOT which has
no formal capacity market, almost 1.9GW of DR has been contracted through its capacity-style Emergency Response Service. Ancillary
service participation, which grew 9% annually on average over 2010-2015, has remained flat since, in the 1.8-1.9GW range. Despite the furor
surrounding FERC 745, demand response activity within the energy markets remains negligible.
● Our methodology for tracking demand-response capacity has changed since last year. Previously we used data reported to FERC and the
results of capacity auctions. This year’s analysis is built bottom-up by assessing the amount of demand response active within each market in
each ISO/RTO. The most notable change is in PJM, where for some years the GW value is as much as a third lower than previously.
0
5
10
15
20
25
30
2010 11 12 13 14 15 16 1H 17
Th
ou
sa
nd
s
GW
CAISO
ISO-NE
ERCOT
NYISO
MISO
PJM
0
5
10
15
20
25
30
2010 11 12 13 14 15 16 1H 17
GW
Energy
Ancillary
Capacity

15 © Bloomberg Finance LP 2018. Developed in partnership with The Business Council for Sustainable Energy.
Source: Bloomberg New Energy Finance, EIA. Note: there is a 10-month lag in official smart meter statistics, as a result 2017 figures include BNEF estimates.
U.S. smart meter deployments Top 10 states by penetration
Deployment: U.S. smart electricity meter deployments
● Smart meter installations hit a peak in 2010 and 2011, supported by stimulus funding awarded in 2009. Many of the largest U.S. utilities took
advantage of the Smart Grid Investment Grant to roll out smart meters across their territories. As grant funding dried up, deployments slowed,
hitting a trough in 2014. Smart metering activity has since increased to a fairly constant six million meters per year.
● Today almost 51% of U.S. electricity customers have a smart meter, but there is enormous regional variation. The top 10 states all have
penetration of greater than 79%. In contrast only one in five or fewer customers have smart meters in the bottom 10 states. Over 2016-17,
Illinois and Michigan were the most active smart metering markets, deploying 2.4 and 1.1 million meters, respectively.
● The greatest cost saving for utilities from smart metering is replacing the need for manual meter reads. But a renewed focus on grid
modernization and growing interest in dynamic retail tariffs is leading state regulators and utilities that have shied away from the technology to
reassess the benefits of deployment. Hold-out states, such as New York and Rhode Island (where smart meters currently number in the
hundreds), have both committed to extensive smart meter rollouts over the next five to ten years.
0
10
20
30
40
50
60
70
80
0
2
4
6
8
10
12
14
16
2007 08 09 10 11 12 13 14 15 16 17
Annual Cumulative
Annual (millions) Cumulative (millions)
0% 20% 40% 60% 80% 100%
Arizona
Delaware
Vermont
California
Michigan
Oklahoma
Nevada
Georgia
Maine
D.C.
Smart meter penetration

16 © Bloomberg Finance LP 2018. Developed in partnership with The Business Council for Sustainable Energy.
Source: Alternative Fuels Data Center, Bloomberg New Energy Finance Notes: Does not include residential electric charging infrastructure.
Deployment: U.S. public electric vehicle charging outlets
● There are currently 47,117 public and workplace charging outlets in the U.S., including 6,270 fast charging outlets. The
number of charging sites in the country grew 18% in 2017 compared to 2016.
● Over 81% of public charging outlets in the U.S. are Level 2 J1772 (delivering around 7.2kW). This is largely a reflection of
the EV fleet in the country, where 45% of electric vehicles come equipped with J1772 outlets. (The majority of EV charging
takes place at home, usually with Level 1 or Level 2 J1772 outlets.) Another 13% of the charging outlets is split between
different rapid charging standards – CHAdeMO (30%), CCS (23%) and Tesla Supercharger (45%). Some 6% of public
charging outlets are Level 1.
● The Volkswagen Group, under the terms of a legal settlement with the State of California and the U.S. Environmental
Protection Agency (EPA), created a subsidiary called Electrify America that will spend a total of $0.8 billion over ten years
to deploy charging infrastructure within California and $1.2 billion over a decade outside California.
430 465 8143,410
12,000
19,460
26,077
31,003
40,075
47,117
2008 2009 2010 2011 2012 2013 2014 2015 2016 2017
Units
17 © Bloomberg Finance LP 2018. Developed in partnership with The Business Council for Sustainable Energy.
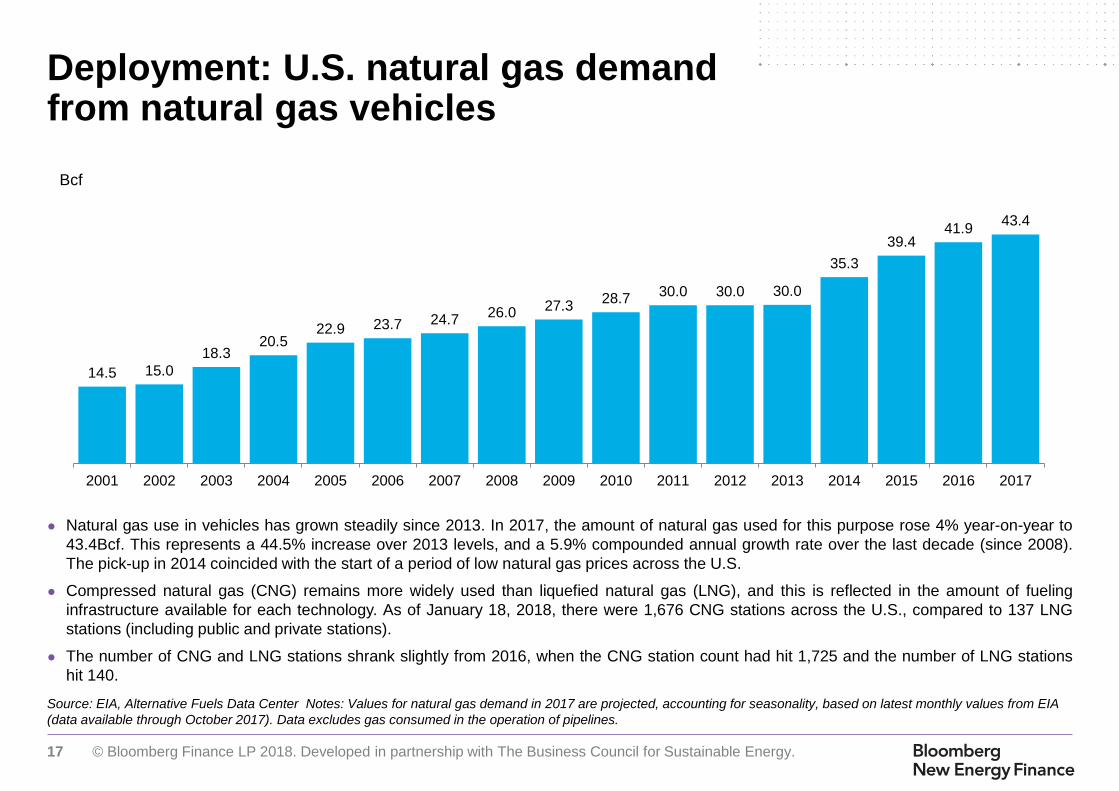
Source: EIA, Alternative Fuels Data Center Notes: Values for natural gas demand in 2017 are projected, accounting for seasonality, based on latest monthly values from EIA
(data available through October 2017). Data excludes gas consumed in the operation of pipelines.
Deployment: U.S. natural gas demand from natural gas vehicles
● Natural gas use in vehicles has grown steadily since 2013. In 2017, the amount of natural gas used for this purpose rose 4% year-on-year to
43.4Bcf. This represents a 44.5% increase over 2013 levels, and a 5.9% compounded annual growth rate over the last decade (since 2008).
The pick-up in 2014 coincided with the start of a period of low natural gas prices across the U.S.
● Compressed natural gas (CNG) remains more widely used than liquefied natural gas (LNG), and this is reflected in the amount of fueling
infrastructure available for each technology. As of January 18, 2018, there were 1,676 CNG stations across the U.S., compared to 137 LNG
stations (including public and private stations).
● The number of CNG and LNG stations shrank slightly from 2016, when the CNG station count had hit 1,725 and the number of LNG stations
hit 140.
14.5 15.0
18.320.5
22.9 23.7 24.726.0 27.3
28.730.0 30.0 30.0
35.3
39.441.9
43.4
2001 2002 2003 2004 2005 2006 2007 2008 2009 2010 2011 2012 2013 2014 2015 2016 2017
Bcf