Embed Size (px)
Citation preview
Sustainable Industrial
Development?
Learning from the BRICS
Jomo Kwame Sundaram
Assistant Director-General
Food and Agriculture Organization
of the United Nations
Vienna, 20 November 2012
Outline
• BRICS pattern, model to emulate?
• Any lessons from BRICS?
• Do developing countries need
industrial policy?
• Implications of global economic
slowdown and other crises for
industrialization efforts?
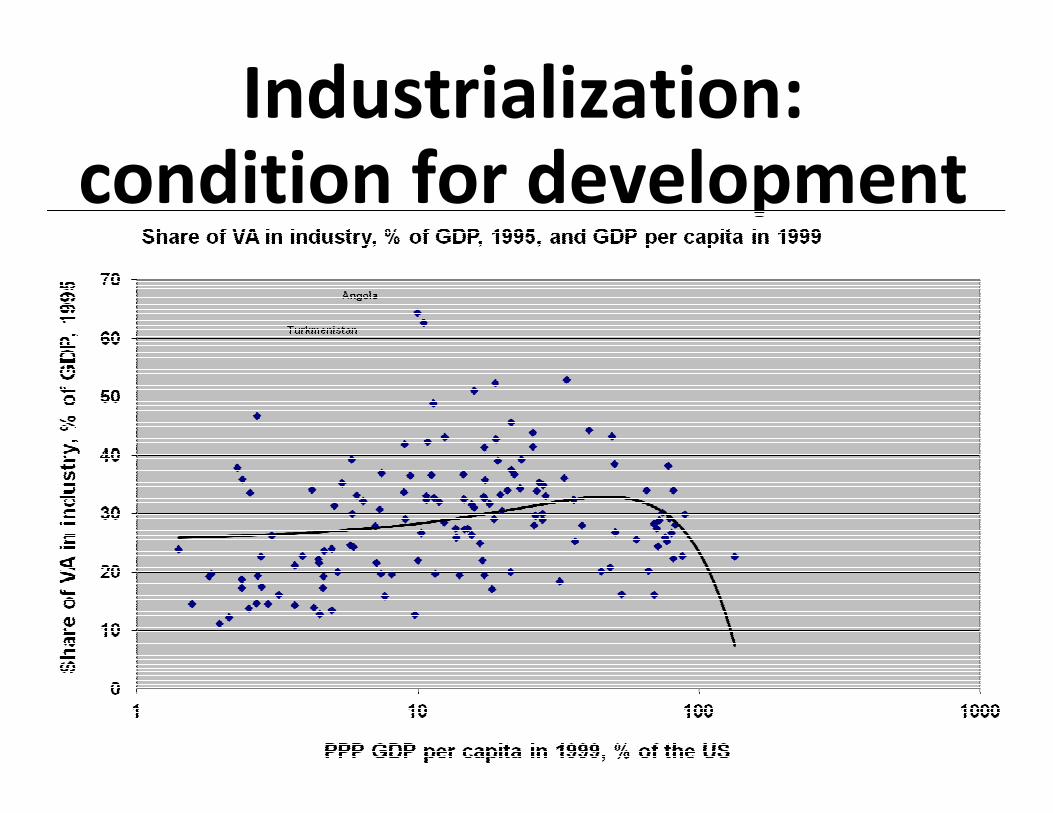
Industrialization: condition for development
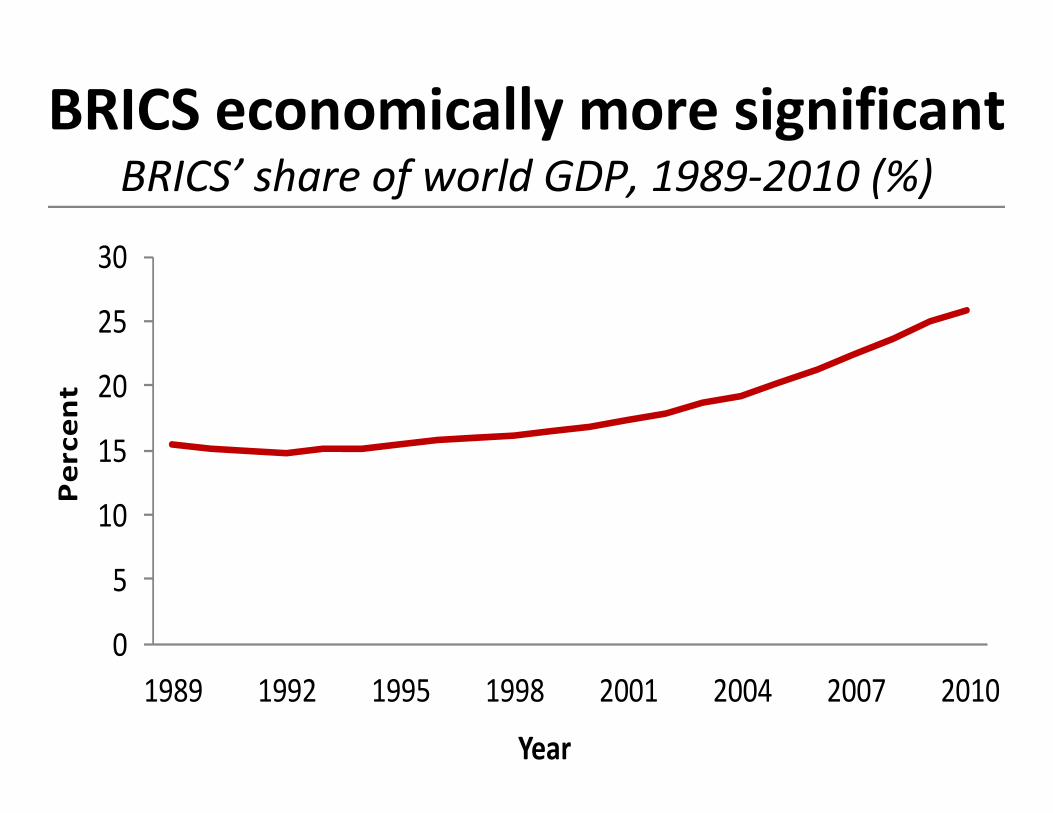
BRICS economically more significantBRICS’ share of world GDP, 1989-2010 (%)
0
5
10
15
20
25
30
1989 1992 1995 1998 2001 2004 2007 2010
Pe
rce
nt
Year
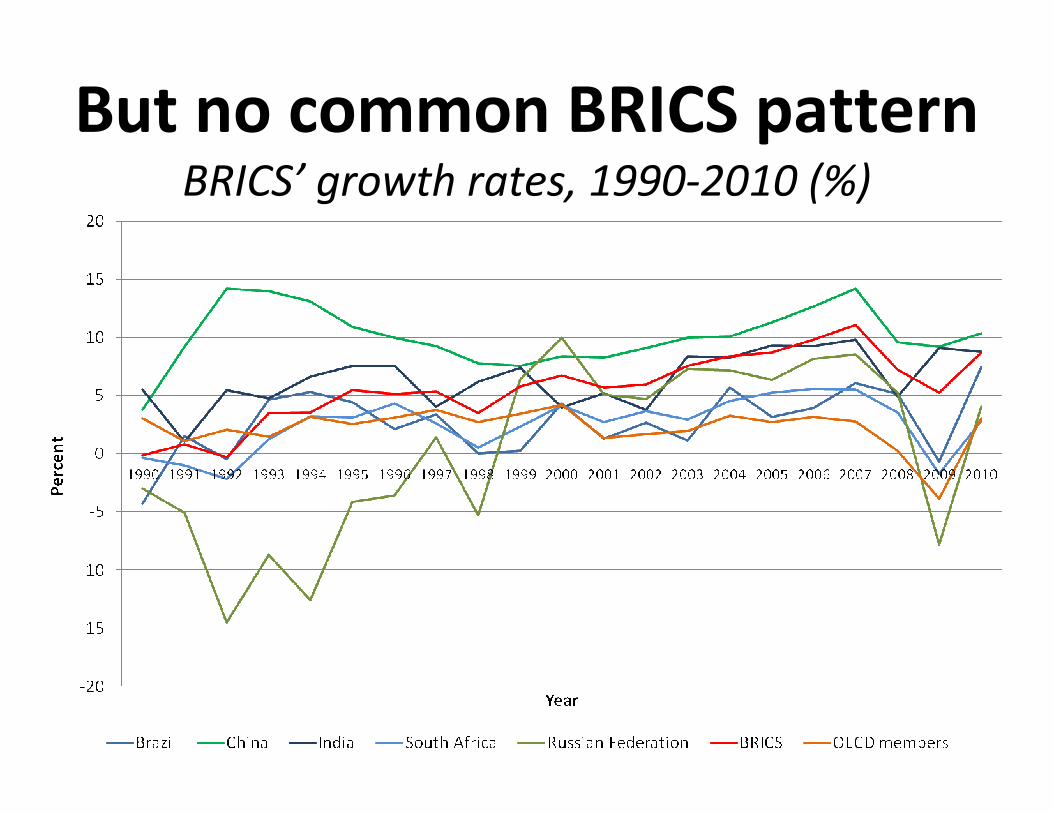
But no common BRICS patternBRICS’ growth rates, 1990-2010 (%)
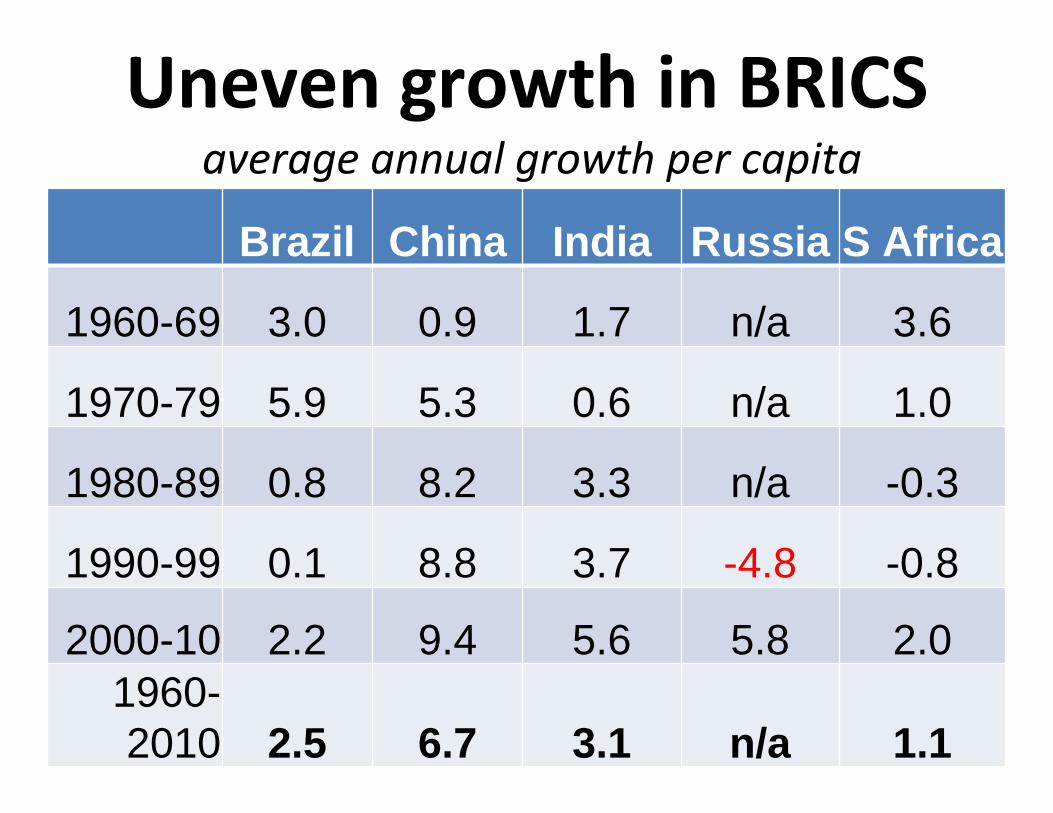
Uneven growth in BRICS average annual growth per capita
Brazil China India Russia S Africa
1960-69 3.0 0.9 1.7 n/a 3.6
1970-79 5.9 5.3 0.6 n/a 1.0
1980-89 0.8 8.2 3.3 n/a -0.3
1990-99 0.1 8.8 3.7 -4.8 -0.8
2000-10 2.2 9.4 5.6 5.8 2.01960-2010 2.5 6.7 3.1 n/a 1.1
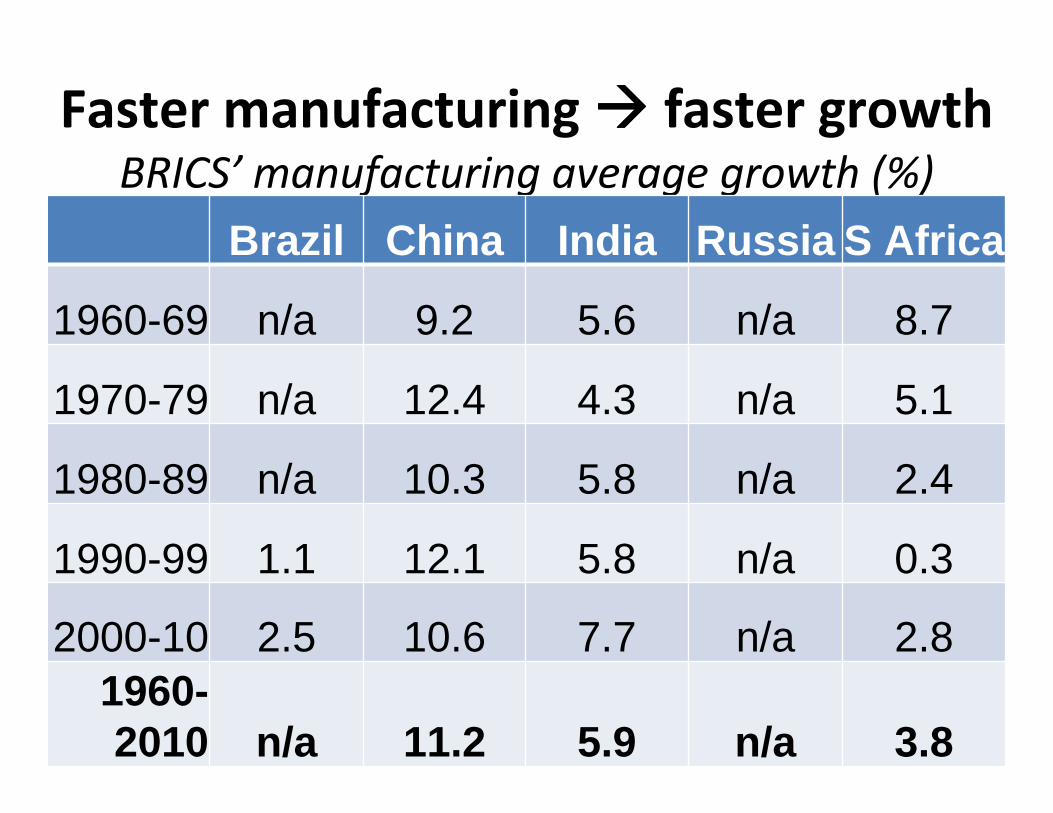
Faster manufacturing ���� faster growth BRICS’ manufacturing average growth (%)
Brazil China India Russia S Africa
1960-69 n/a 9.2 5.6 n/a 8.7
1970-79 n/a 12.4 4.3 n/a 5.1
1980-89 n/a 10.3 5.8 n/a 2.4
1990-99 1.1 12.1 5.8 n/a 0.3
2000-10 2.5 10.6 7.7 n/a 2.81960-2010 n/a 11.2 5.9 n/a 3.8
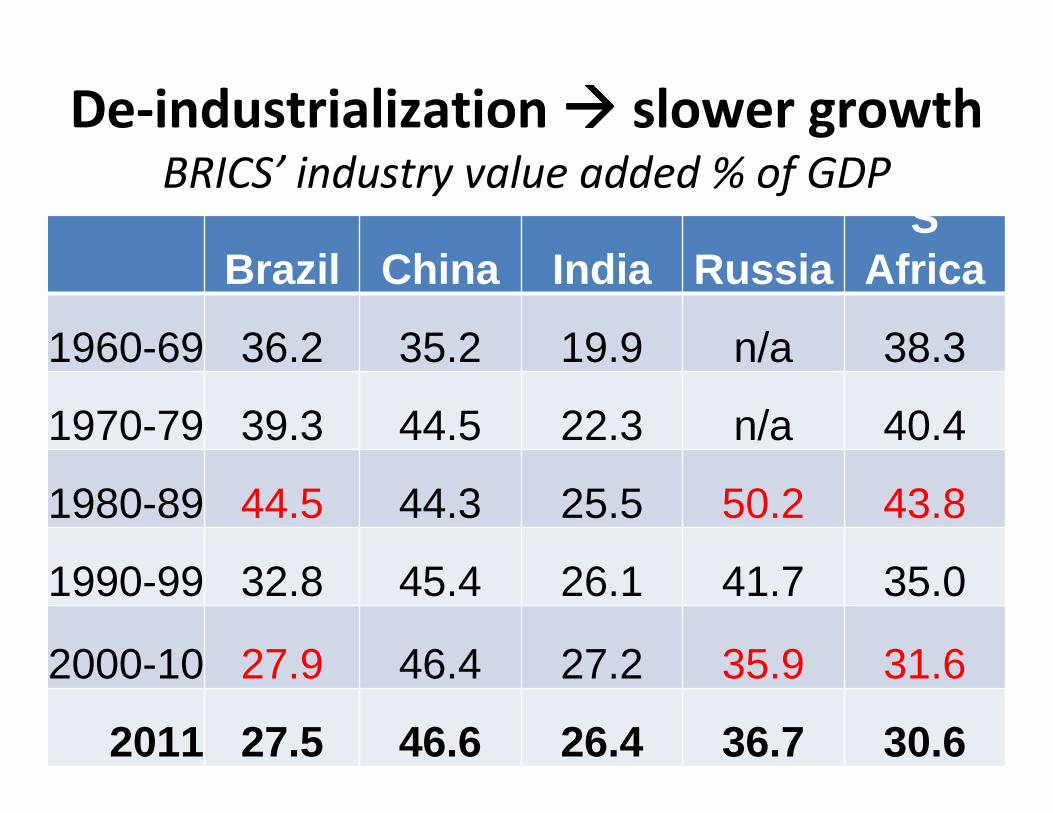
De-industrialization ���� slower growthBRICS’ industry value added % of GDP
Brazil China India RussiaS
Africa
1960-69 36.2 35.2 19.9 n/a 38.3
1970-79 39.3 44.5 22.3 n/a 40.4
1980-89 44.5 44.3 25.5 50.2 43.8
1990-99 32.8 45.4 26.1 41.7 35.0
2000-10 27.9 46.4 27.2 35.9 31.6
2011 27.5 46.6 26.4 36.7 30.6
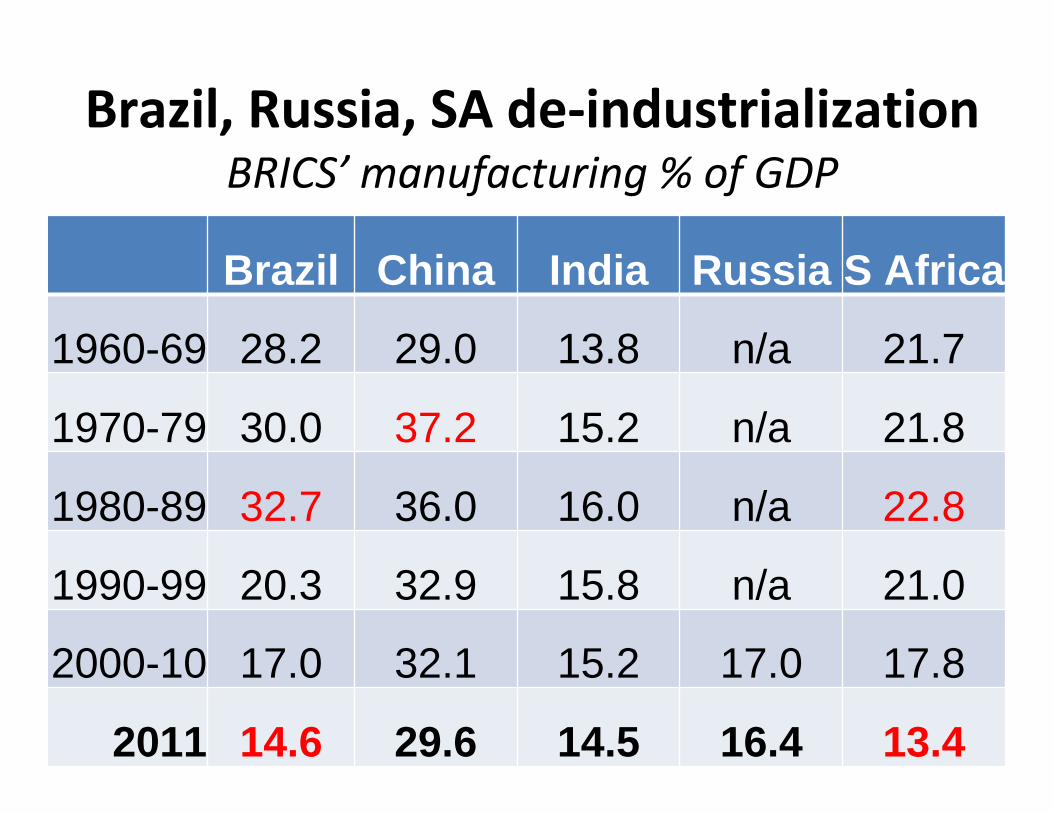
Brazil, Russia, SA de-industrialization BRICS’ manufacturing % of GDP
Brazil China India Russia S Africa
1960-69 28.2 29.0 13.8 n/a 21.7
1970-79 30.0 37.2 15.2 n/a 21.8
1980-89 32.7 36.0 16.0 n/a 22.8
1990-99 20.3 32.9 15.8 n/a 21.0
2000-10 17.0 32.1 15.2 17.0 17.8
2011 14.6 29.6 14.5 16.4 13.4
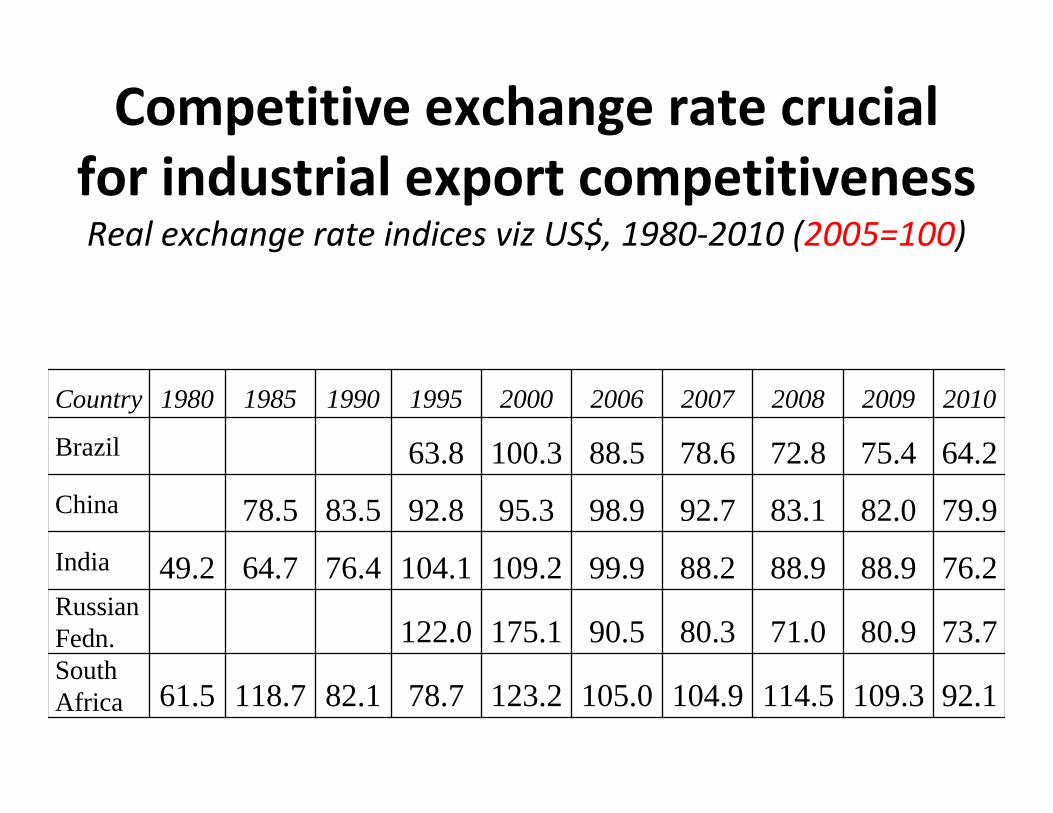
Competitive exchange rate crucial
for industrial export competitivenessReal exchange rate indices viz US$, 1980-2010 (2005=100)
Country 1980 1985 1990 1995 2000 2006 2007 2008 2009 2010
Brazil 63.8 100.3 88.5 78.6 72.8 75.4 64.2
China 78.5 83.5 92.8 95.3 98.9 92.7 83.1 82.0 79.9
India 49.2 64.7 76.4 104.1 109.2 99.9 88.2 88.9 88.9 76.2Russian Fedn. 122.0 175.1 90.5 80.3 71.0 80.9 73.7South Africa 61.5 118.7 82.1 78.7 123.2 105.0 104.9 114.5 109.3 92.1
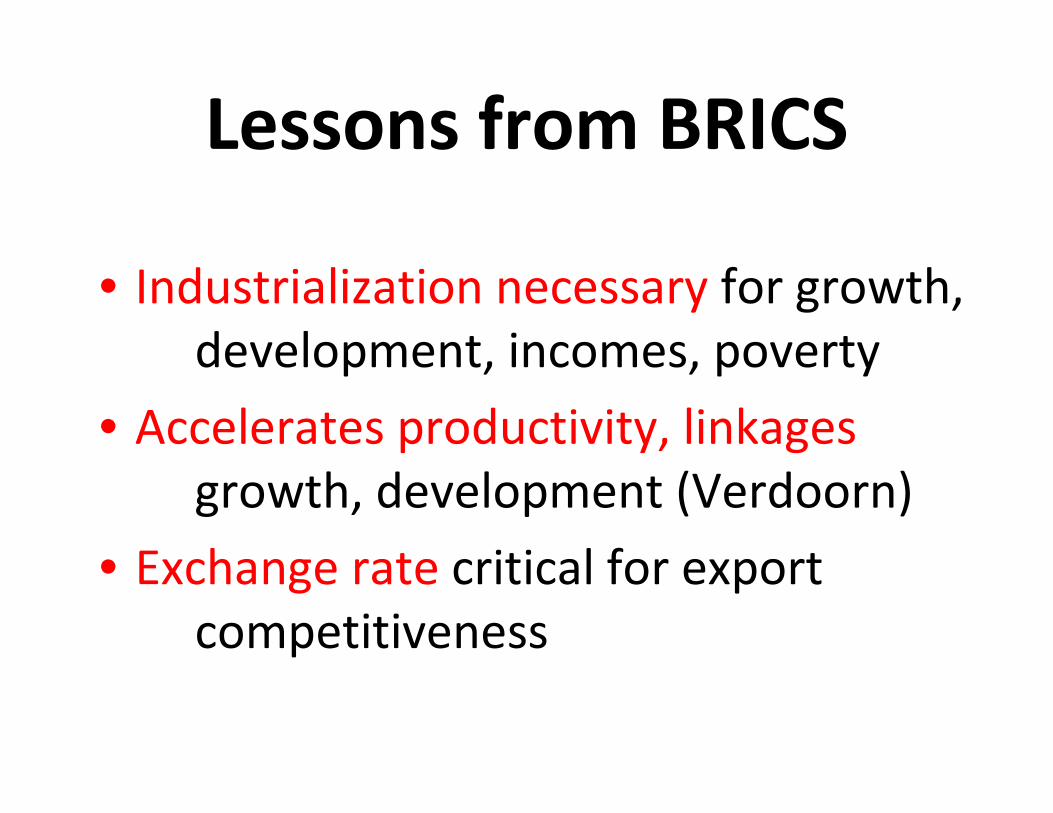
Lessons from BRICS
• Industrialization necessary for growth,
development, incomes, poverty
• Accelerates productivity, linkages
growth, development (Verdoorn)
• Exchange rate critical for export
competitiveness
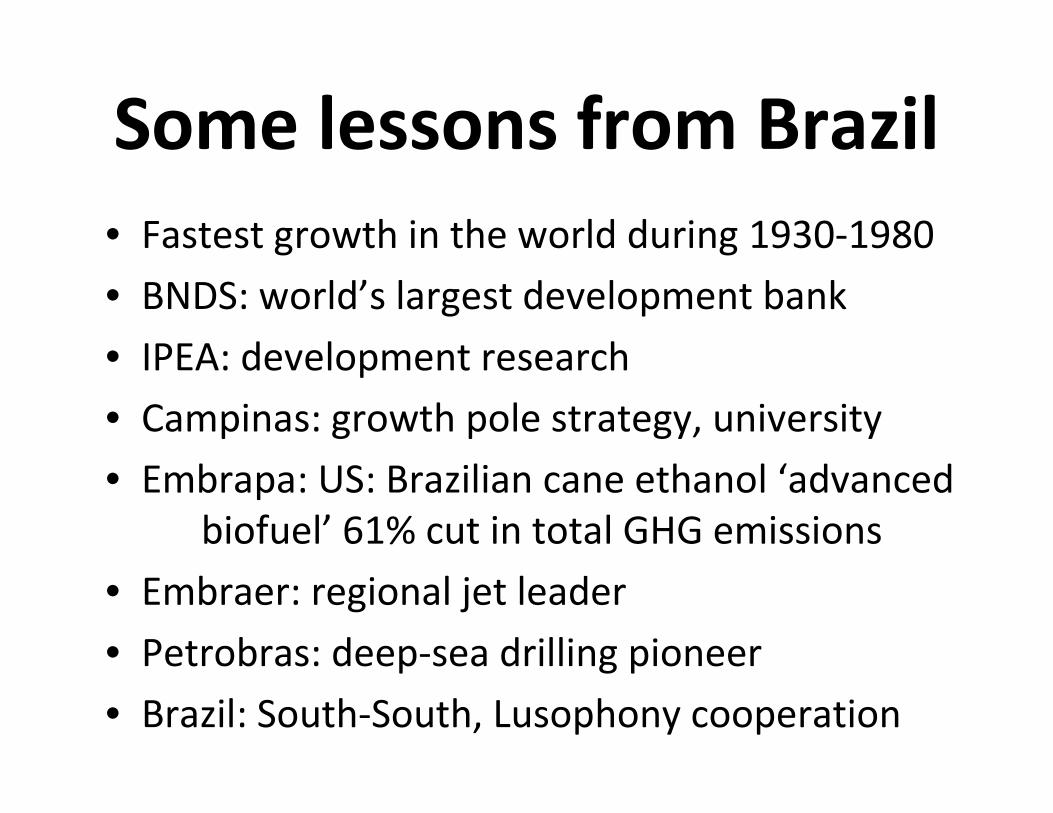
Some lessons from Brazil
• Fastest growth in the world during 1930-1980
• BNDS: world’s largest development bank
• IPEA: development research
• Campinas: growth pole strategy, university
• Embrapa: US: Brazilian cane ethanol ‘advanced
biofuel’ 61% cut in total GHG emissions
• Embraer: regional jet leader
• Petrobras: deep-sea drilling pioneer
• Brazil: South-South, Lusophony cooperation
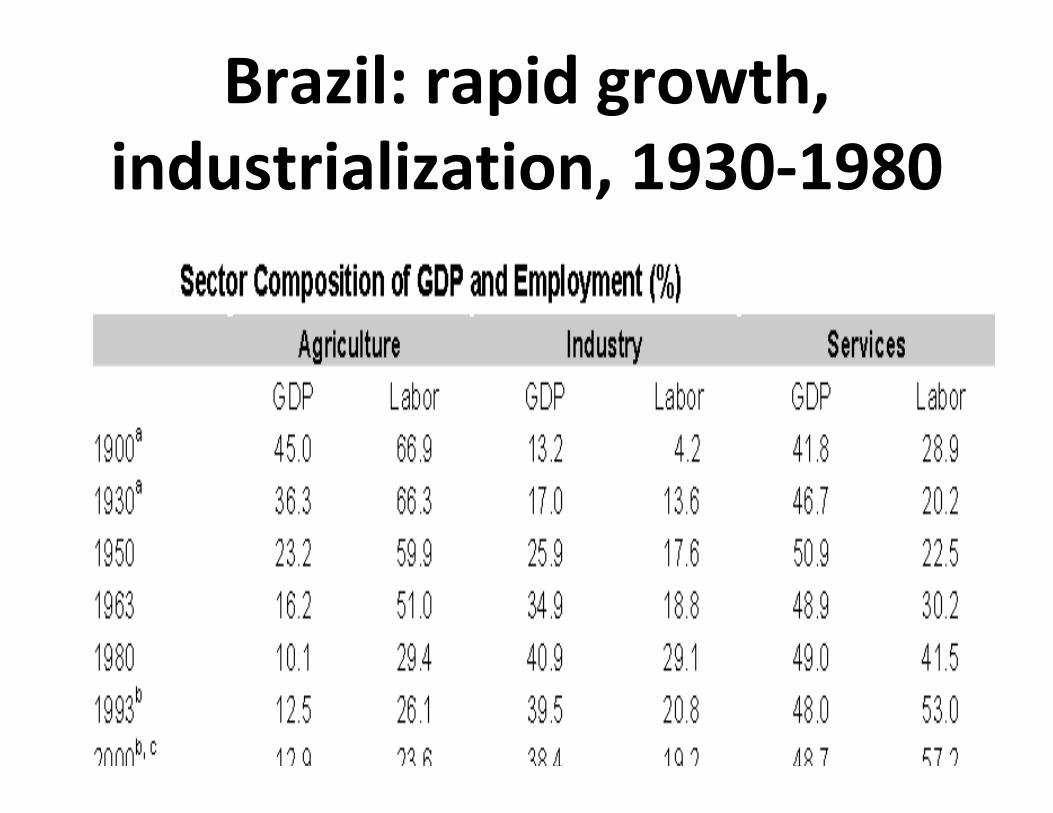
Brazil: rapid growth,
industrialization, 1930-1980
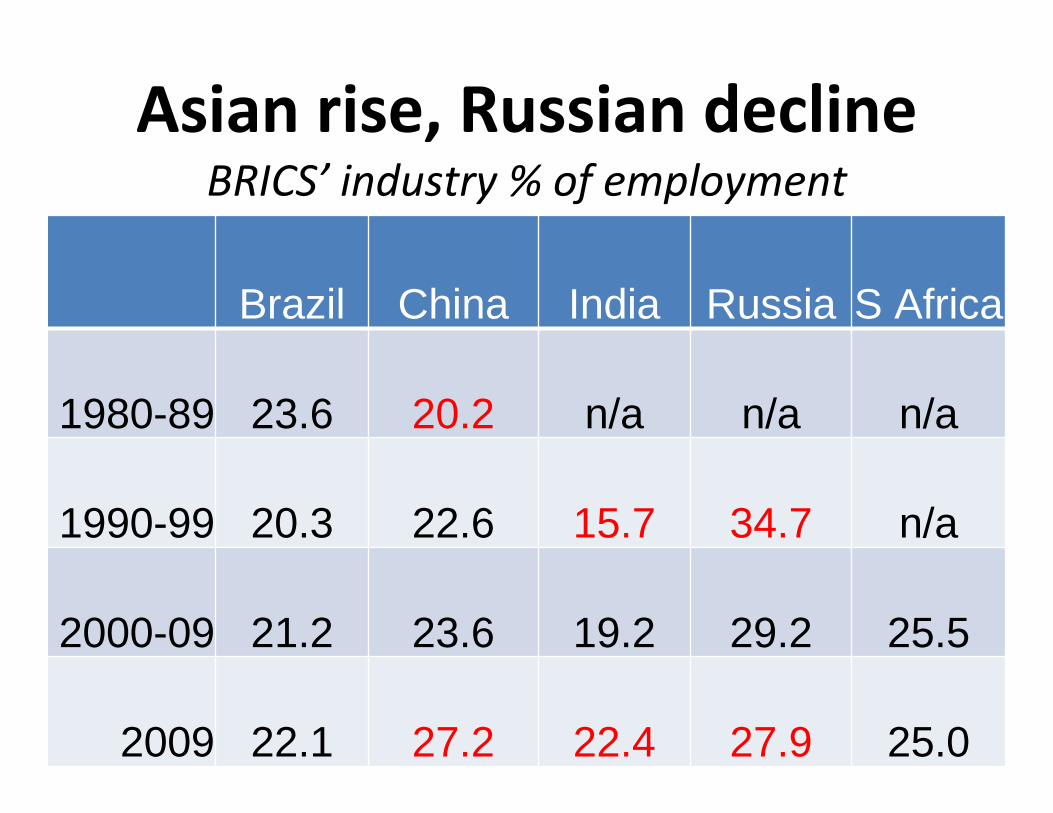
Asian rise, Russian declineBRICS’ industry % of employment
Brazil China India Russia S Africa
1980-89 23.6 20.2 n/a n/a n/a
1990-99 20.3 22.6 15.7 34.7 n/a
2000-09 21.2 23.6 19.2 29.2 25.5
2009 22.1 27.2 22.4 27.9 25.0
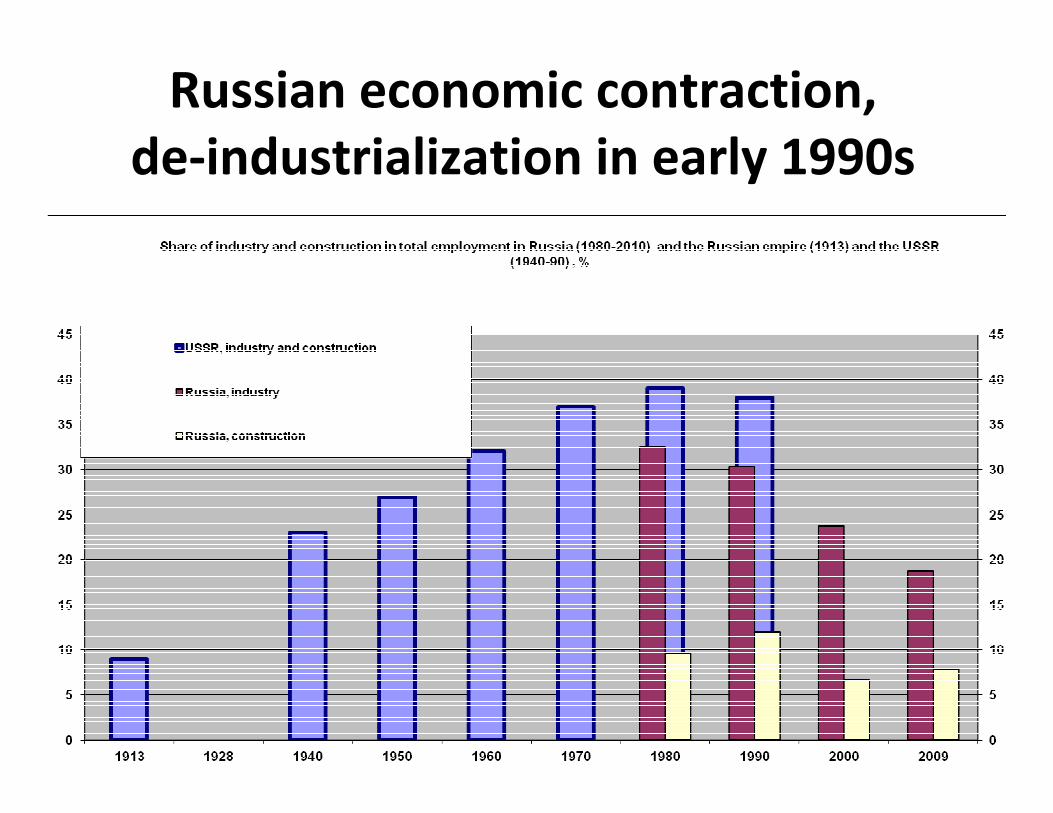
Russian economic contraction,
de-industrialization in early 1990s
Some lessons from Russia
• Rapid industrialization, growth, 1930s-1960s
despite wars
• University technical education
• Aero-space program
• Military industries: MIGs, Tupolev,
Kalashnikov
• Gazprom
• Rusnano: the ‘conversion’ of Anatoly Chubais
• Science/technology programs’ mixed records
Some lessons from India
• University technology education: world
standard -- Indian Institute of Technology
• Popular science movements
• Dissemination of grassroots innovation
• Tata: pioneer of ‘Fordism’
• Hindustan Machine Tools
• India’s ‘white revolution’: cooperative
pasteurization – phyto-sanitary standards
(Verghese Kurien)
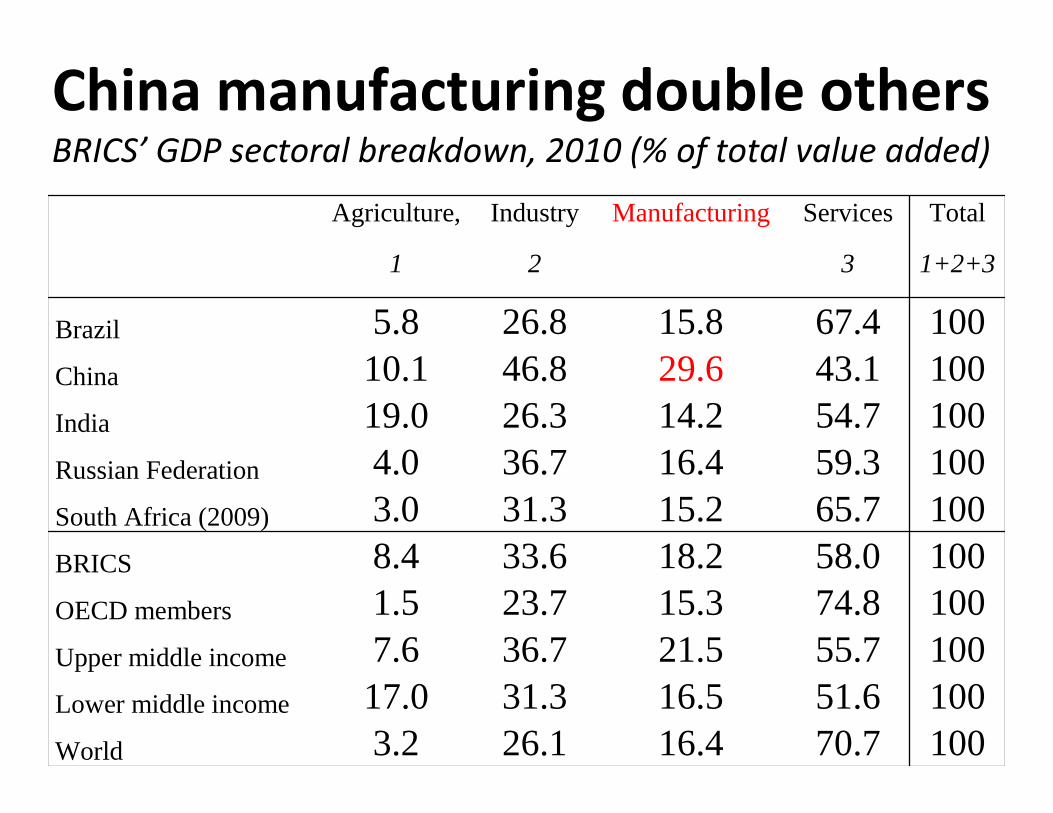
China manufacturing double othersBRICS’ GDP sectoral breakdown, 2010 (% of total value added)
Agriculture, Industry Manufacturing Services Total
1 2 3 1+2+3
Brazil 5.8 26.8 15.8 67.4 100China 10.1 46.8 29.6 43.1 100India 19.0 26.3 14.2 54.7 100Russian Federation 4.0 36.7 16.4 59.3 100South Africa (2009) 3.0 31.3 15.2 65.7 100BRICS 8.4 33.6 18.2 58.0 100OECD members 1.5 23.7 15.3 74.8 100Upper middle income 7.6 36.7 21.5 55.7 100Lower middle income 17.0 31.3 16.5 51.6 100World 3.2 26.1 16.4 70.7 100
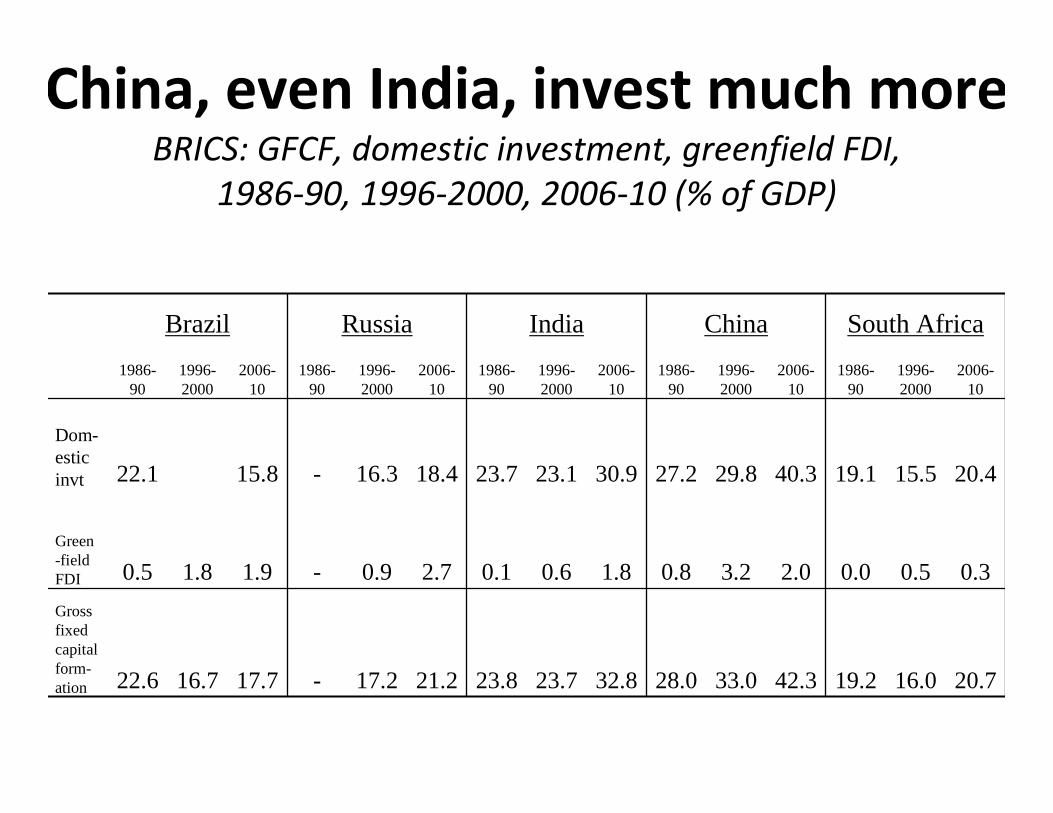
China, even India, invest much moreBRICS: GFCF, domestic investment, greenfield FDI,
1986-90, 1996-2000, 2006-10 (% of GDP)
Brazil Russia India China South Africa
1986-90
1996-2000
2006-10
1986-90
1996-2000
2006-10
1986-90
1996-2000
2006-10
1986-90
1996-2000
2006-10
1986-90
1996-2000
2006-10
Dom-estic invt 22.1 15.8 - 16.3 18.4 23.7 23.1 30.9 27.2 29.8 40.3 19.1 15.5 20.4
Green-field FDI 0.5 1.8 1.9 - 0.9 2.7 0.1 0.6 1.8 0.8 3.2 2.0 0.0 0.5 0.3
Gross fixed capitalform-ation 22.6 16.7 17.7 - 17.2 21.2 23.8 23.7 32.8 28.0 33.0 42.3 19.2 16.0 20.7
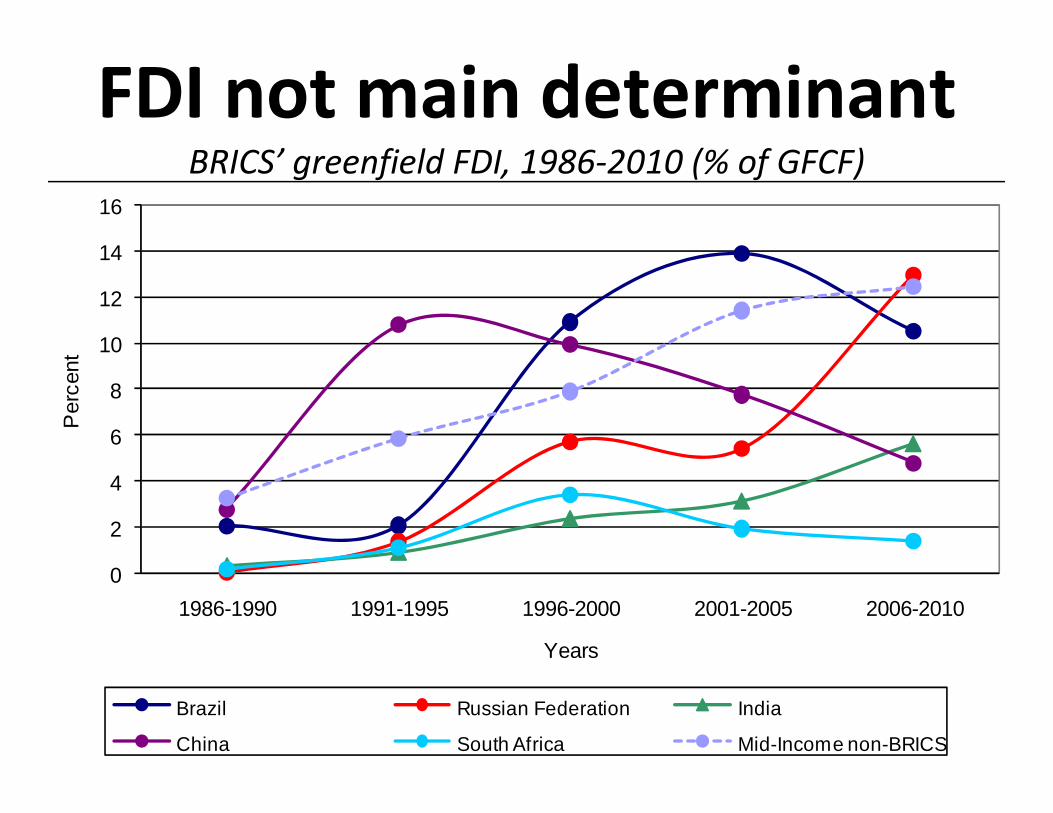
FDI not main determinantBRICS’ greenfield FDI, 1986-2010 (% of GFCF)
0
2
4
6
8
10
12
14
16
1986-1990 1991-1995 1996-2000 2001-2005 2006-2010
Per
cent
Years
Brazil Russian Federation India
China South Africa Mid-Income non-BRICS
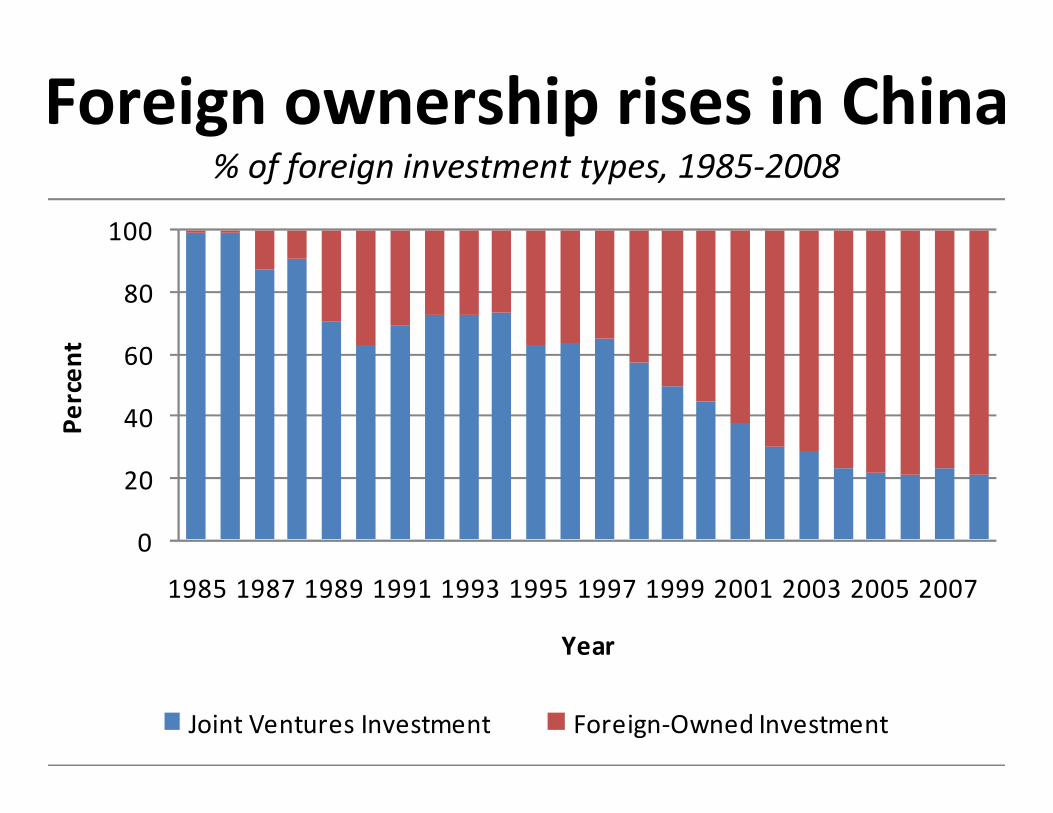
Foreign ownership rises in China % of foreign investment types, 1985-2008
0
20
40
60
80
100
1985 1987 1989 1991 1993 1995 1997 1999 2001 2003 2005 2007
Pe
rce
nt
Year
Joint Ventures Investment Foreign-Owned Investment
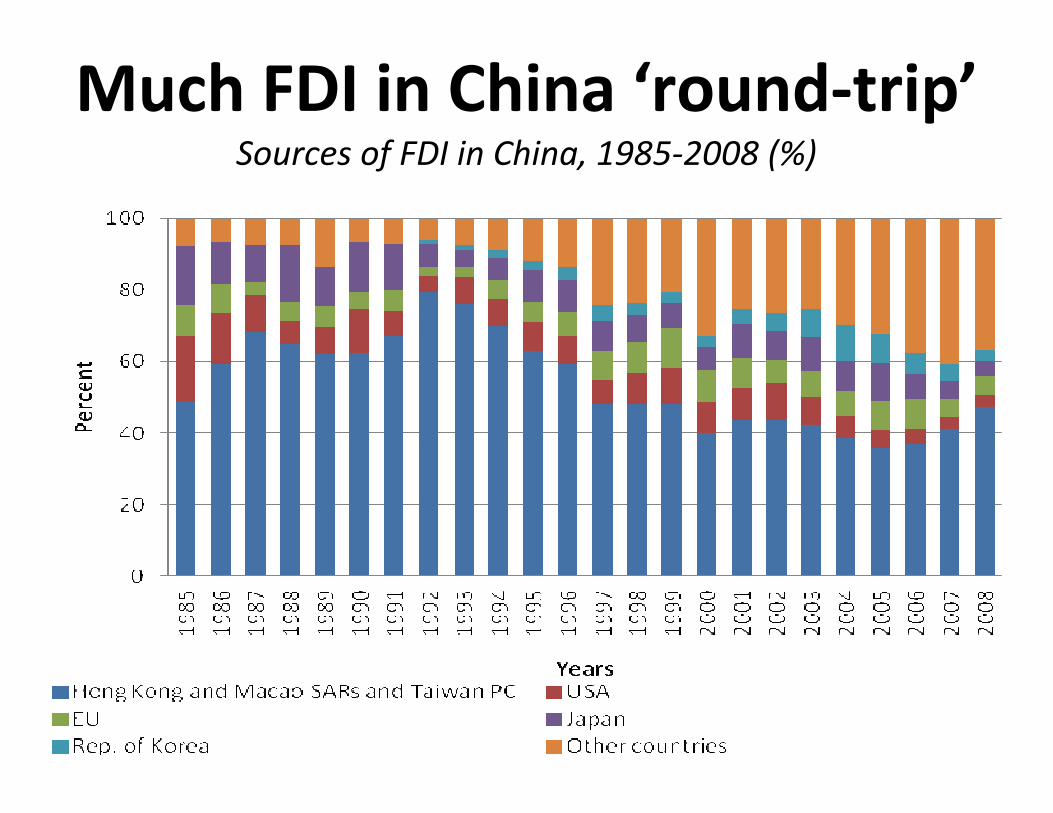
Much FDI in China ‘round-trip’Sources of FDI in China, 1985-2008 (%)
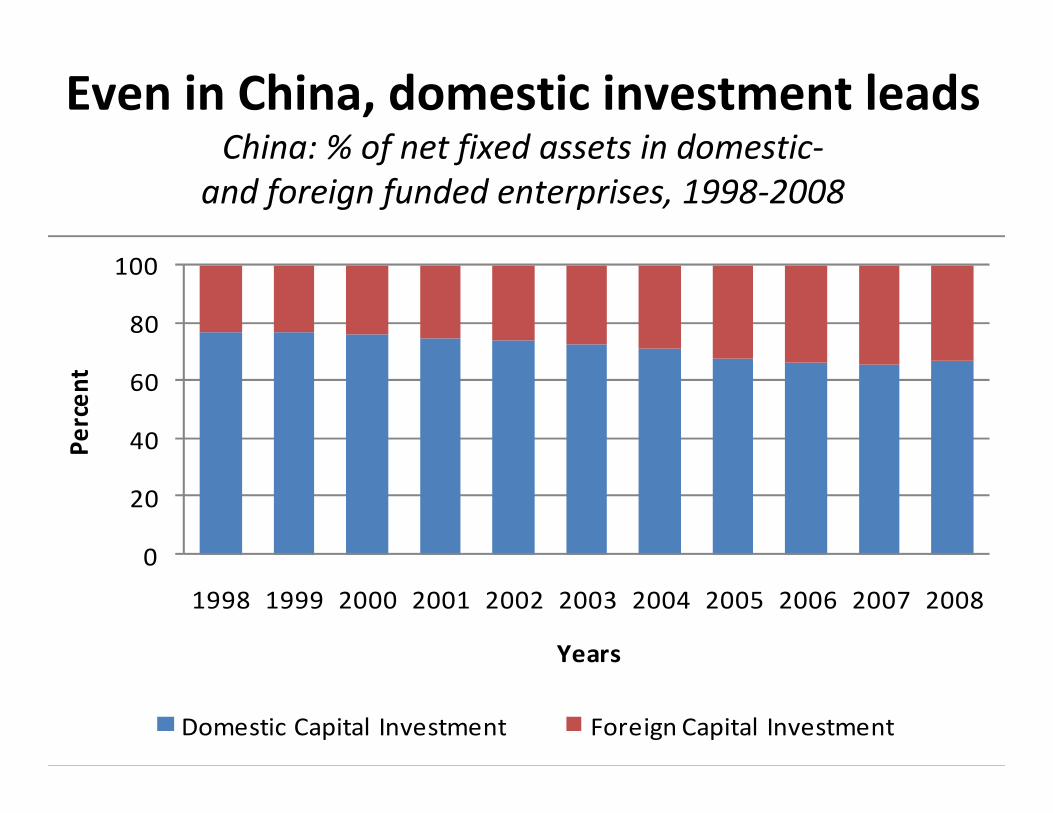
Even in China, domestic investment leadsChina: % of net fixed assets in domestic-
and foreign funded enterprises, 1998-2008
0
20
40
60
80
100
1998 1999 2000 2001 2002 2003 2004 2005 2006 2007 2008
Pe
rce
nt
Years
Domestic Capital Investment Foreign Capital Investment
Some lessons from China
• Heavier reliance on FDI
• Chinese overtakes US: steel, cars, beer, cotton,
coal, tobacco, hi-tech products, including
solar cells, wind turbines, ‘organic’ plastic,
new pharmaceutical drugs,
• China Development Bank
• Major South-South investor
• Bao Steel: most efficient steel producer (SOE)
• Manufacturing exports slowdown hurts SE Asia
coal,
Some lessons from S Africa
• Industrial Development Corporation (IDC): SA
industrialization -- apartheid era sanctions
• Southern African Development Bank (SADB)
transformed role
• Nuclear program abandoned post-Apartheid
• Recent reconsideration of pebble bed nuclear
technology
• Southern hemisphere appreciation of
Montreal protocol on CFCs: common but
differentiated responsibility for climate
Why industrialize?
International terms of trade have moved against developing countries
1. Primary commodities vs manufactures (Singer-Prebisch)
2. Tropical vs temperate agriculture (W A Lewis)
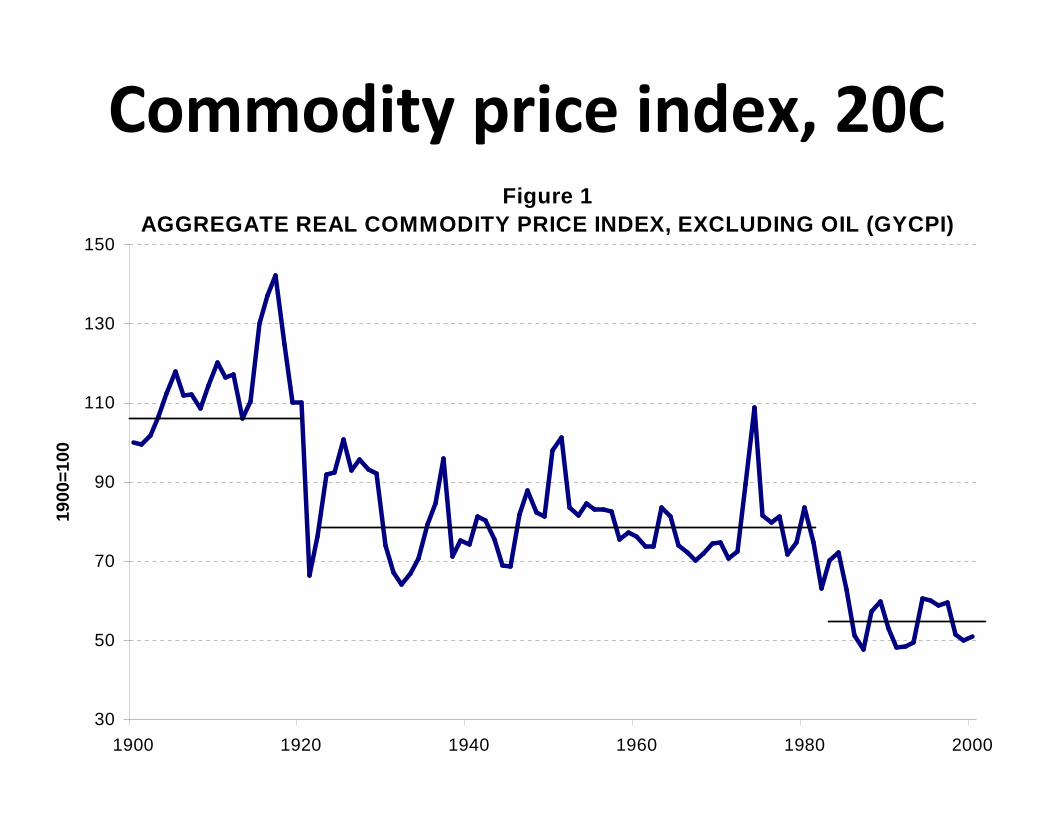
Commodity price index, 20CFigure 1
AGGREGATE REAL COMMODITY PRICE INDEX, EXCLUDING OIL (GYCPI)
30
50
70
90
110
130
150
1900 1920 1940 1960 1980 2000
1900
=100
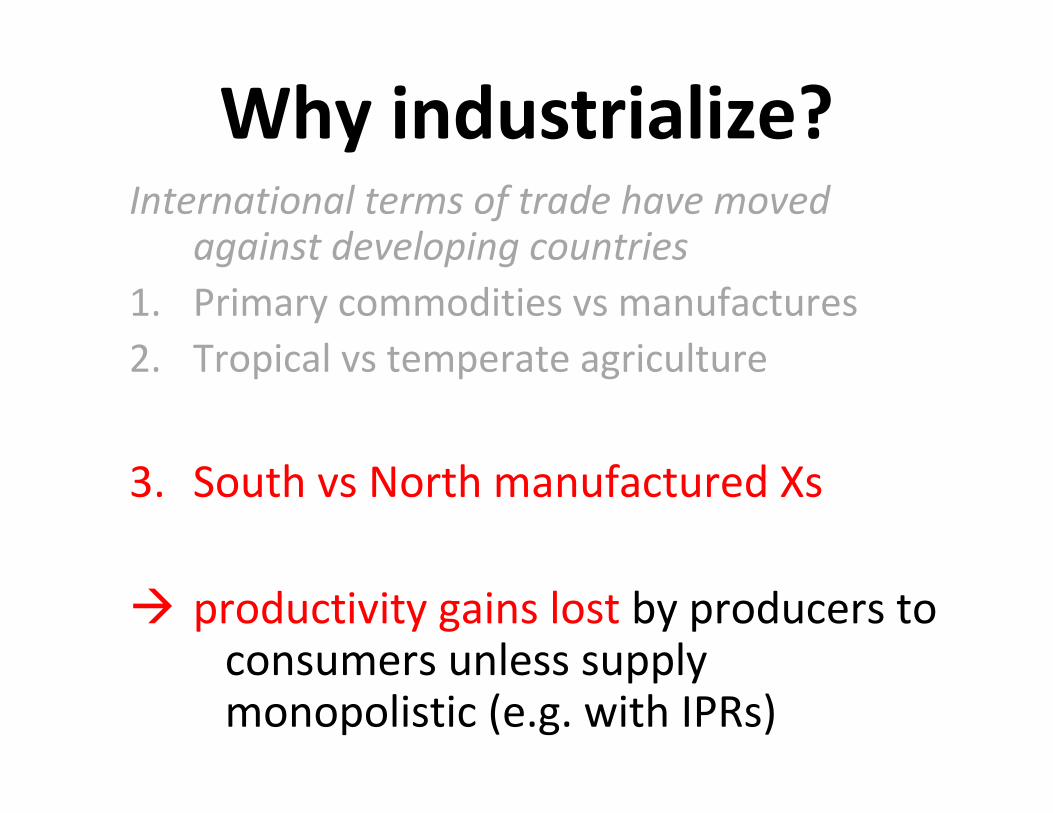
Why industrialize?International terms of trade have moved
against developing countries
1. Primary commodities vs manufactures
2. Tropical vs temperate agriculture
3. South vs North manufactured Xs
� productivity gains lost by producers to consumers unless supply monopolistic (e.g. with IPRs)

South vs North manufacturedexports’ terms of trade
Unit value of manufactures exported by developing countries relative to manufactures exported by developed countries
90
95
100
105
110
115
120
125
130
1980
1981
1982
1983
1984
1985
1986
1987
1988
1989
1990
1991
1992
1993
1994
1995
1996
1997
1998
1999
2001
2002
2000
=10
0
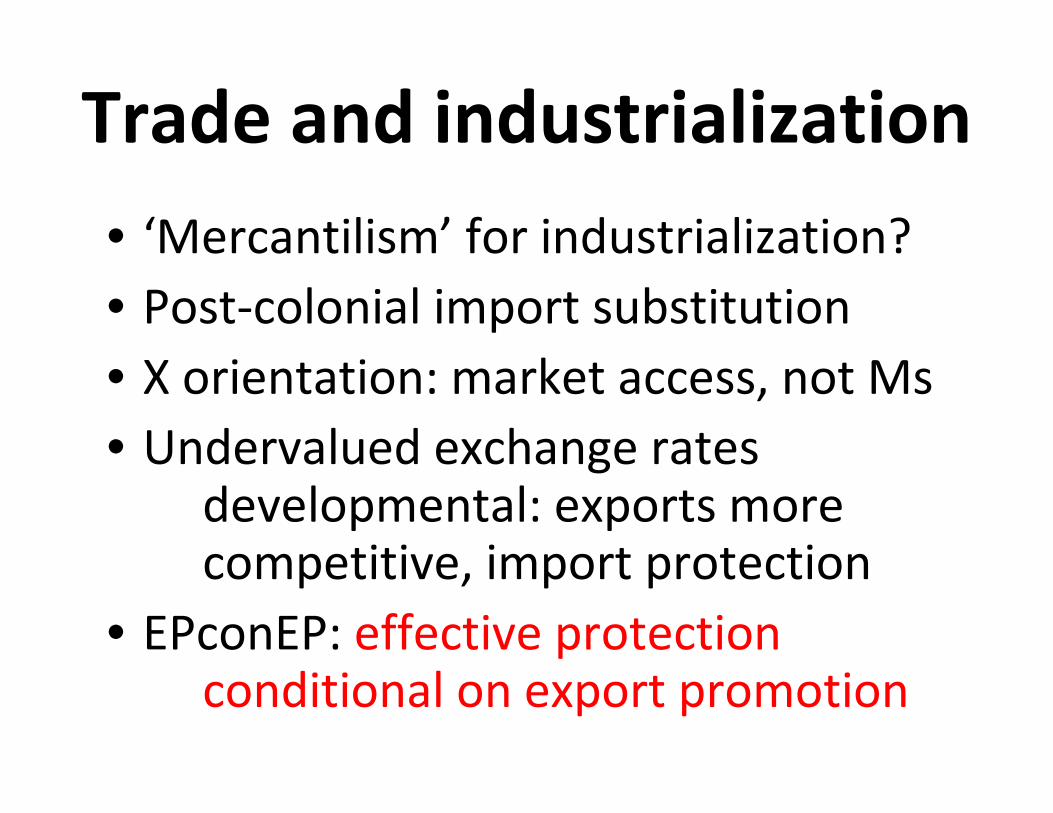
Trade and industrialization
• ‘Mercantilism’ for industrialization?
• Post-colonial import substitution
• X orientation: market access, not Ms
• Undervalued exchange rates developmental: exports morecompetitive, import protection
• EPconEP: effective protection conditional on export promotion
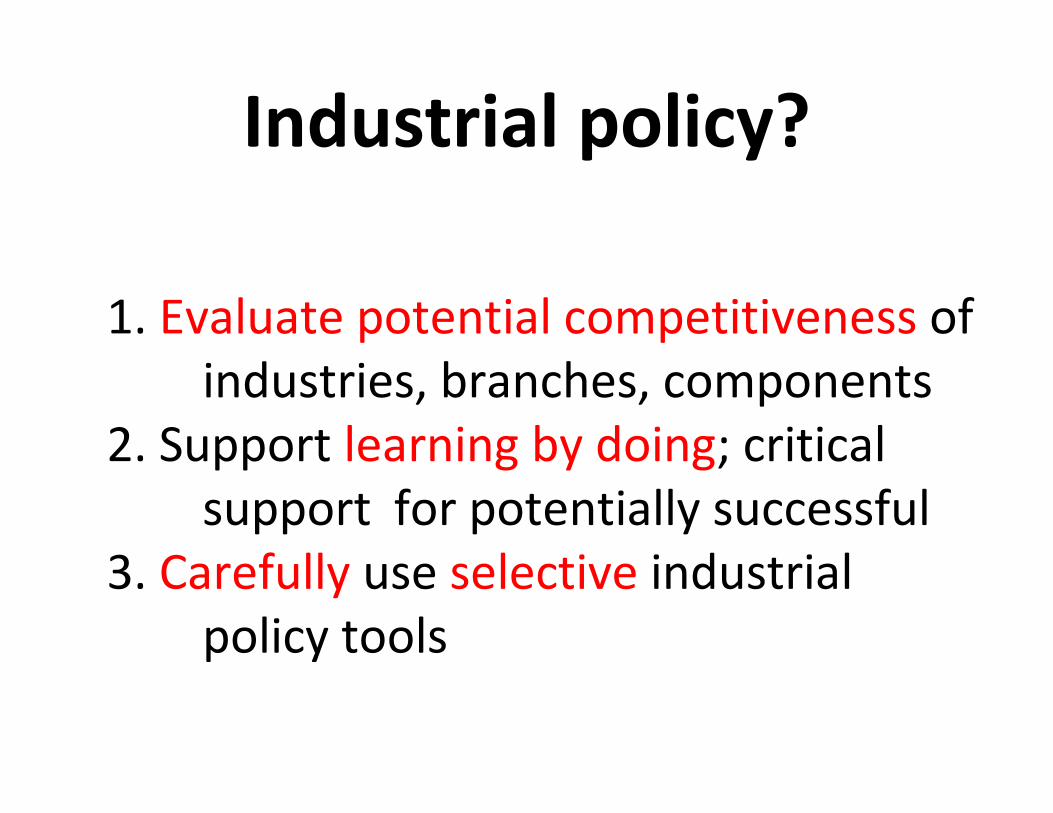
Industrial policy?
1. Evaluate potential competitiveness of
industries, branches, components
2. Support learning by doing; critical
support for potentially successful
3. Carefully use selective industrial
policy tools

Crafting industrial policyIdentify:
• national priorities for investment,
technology policy
• critical constraints, bottlenecks
Consider:
• existing economic sectors + sub-sectors
• Backward, forward linkages
• national priorities (employment growth,
wage growth, export earnings, etc.)
32
Avoiding industrial policy abuse
Warning: Tools involving more
discretion more susceptible to
lobbying, abuse
Government support should be
conditional on meeting strictly
enforced performance criteria in
enhancing competitiveness
Technology policy priorities
• address critical constraints or
bottlenecks
• feasible, given conditions
• compatible with implementation
capacities, including fiscal
constraints
• consistent with other policies
Pre-crisis over-investment has impeded recovery
Cheap credit � over-investment
� under-utilized capacity
� private sector reluctant to invest
� need cross-subsidized public
investments, incentives to induce
private investments in renewable
energy, smallholder food agriculture
Global Green New Deal
Addressing crises together? – Financial– Food– Climate – Jobs – Development
New Deal? recovery, jobsGreen? food, climateGlobal? inequality, development
Climate vs development?
Promote renewable energy for
industrialization to slow global
warming (Deutsche Bank 2009)
Investment-led – not market-led --
approach to achieve both climate
change + development goals
Global or trans-regional feed-in tariff
regimes for cross-subsidization

Policy implications
Investments must be front-loaded, given danger of lock-in and importance of scale, learning economies for technology leapfrogging
Public investment to crowd-inprivate investment to sustain new development pathway
Significant transfers (finance, technology) required for big push

Summary
• No BRICS pattern, model
• Many lessons from BRICS nonetheless
• Appropriate industrial (investment,
technology) policies crucial
• Technical cooperation crucial: need
coherence, complementariness
• GGND: investment-led promotion of
renewable energy for sustainable
industrialization, overcome poverty
40
Thank youSome relevant publications:
Manufacturing Competitiveness in Asia
Technology, Competitiveness and the State
Globalization and Development in Sub-Saharan Africa
Reforming the International Financial System for
Development
Poor Poverty: The Impoverishment of Analysis,
Measurement and Policies
Growth Divergences: Explaining differences in economic
performance
Policy Matters: Economic and Social Policies To Sustain
Equitable Development
The New Development Economics


![[AW]policy BRICS - ITD · กลุ่มประเทศ brics จะก่อให้เกิดประโยชน์ทางเศรษฐกิจกับไทย”](https://img.pdfslide.net/doc/110x75/5eb6589d95ac763ff45c6af5/awpolicy-brics-aaaaaaaaaaa-brics-aaaaaafaaaaaaaaaaaaaaoeaaaaaaaaaaaaaaaaaa.jpg)