Embed Size (px)
Citation preview

SUSTAINABLE PROCESS DESIGN IN THE CONTEXT OF
SYNTHETIC FUELS AND CO2 EMISSIONS
Ofélia Q. F. AraujoFederal University of Rio de Janeiro

Electricity Consumption (kwh per Capita) (2004)
Brazil: 2340
http://hdr.undp.org

CO2 Emissions (t) (2004)
Brazil: 331.6
http://hdr.undp.org

CO2 Emissions(t/$ PIB) (2004)
Brazil: 0.24
http://hdr.undp.org

R. G. Watts, Engineering Response
to Global Climate Change, Lewis
Publishers, New York, 1997.100
500
1000
5000
10,000
$ 20,000
50,000
$ 200
2000
0.01 0.10 1.0 10 100
GIP
per
capit
a (
$/y
ear)
U.S.A.
Canada
Bangladesh
China
MexicoPoland
South CoreaRussia
France
Japan
U.K.
kW per capita
Brazil (2010)
Energy(CO2), a By-product of Economic Development

6
2E
2P

Economy x Environment
NOT EVIL JUST WRONG
“The True Cost of Global Warming
Hysteria” “(…) warns Americans that their jobs, modest
lifestyles and dreams for their children are at
stake.”
www.noteviljustwrong.com
Phelim McAleer & Ann McElhinney
2E
World Sellers of Carbon Credits
Source: World Bank, 2010http://siteresources.worldbank.org/INTCARBONFINANCE/Resources/State_and_Trends_of_the_Carbon_Market_2010_low_res.pdf

Economy x Environment
Source: World Bank
Source: World Bank
2E

Sustainability Reduced CO2 Emissions + Energy(Depletion of Carbon Resources?)
PH
OTO
SYN
TH
ESIS
CO2
GLUCOSE
CO
MBU
STIO
N
COXIDIZED
CREDUCED
ELECTRONS PHOTONS

PHOTOBIOREACTOR
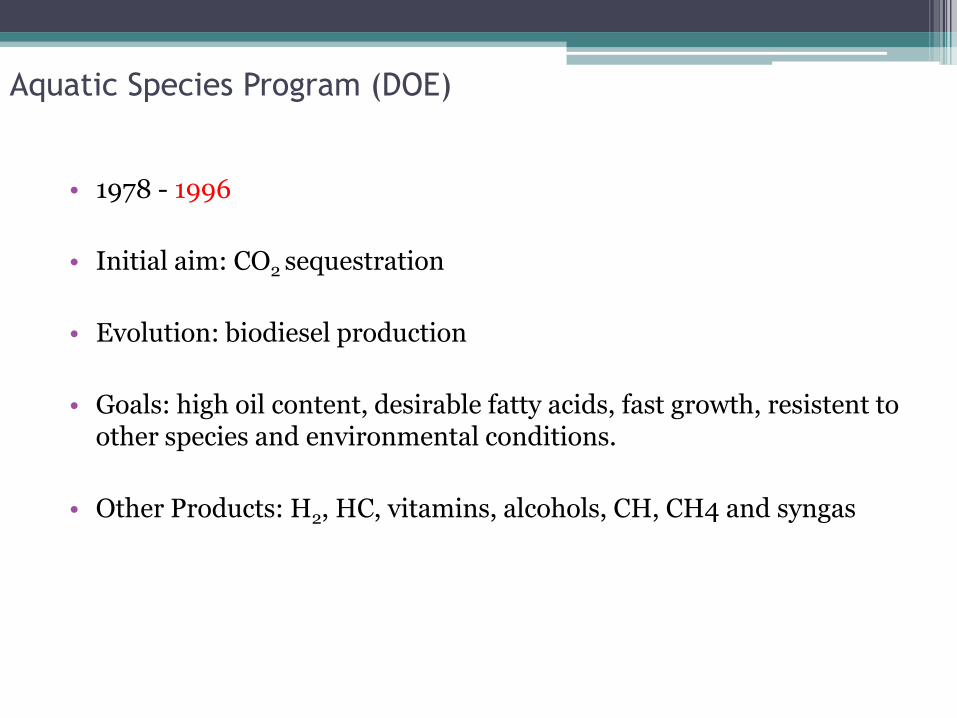
Aquatic Species Program (DOE)
• 1978 - 1996
• Initial aim: CO2 sequestration
• Evolution: biodiesel production
• Goals: high oil content, desirable fatty acids, fast growth, resistent to other species and environmental conditions.
• Other Products: H2, HC, vitamins, alcohols, CH, CH4 and syngas

Photosynthesis Now?
DOE
“Aquatic Species Program”

Microalgae Tomorrow?
U.S. Energy Prices from 1986 to 2008[1]. Source: Hubbad, 2009
Relatively stable in the late 1980s and through much of the 1990sDOE Aquatic Species Program

Economy x Process Engineering
Since 2000, the volatility in oil prices has been extremely high
Processes should be designed for flexibility
Raw material
Capacity

Economy x Process Engineering
• Process (bio)chemistry INTEGRATED to screening of process alternatives
• Predict PRODUCTS and EMISSIONS, and identify synergies: INDUSTRIAL ECOLOGY
• Process intensification (reduced inventories)
• Develop metrics applied to environmental impacts
• Inherent safety allied to inherent resilience and controllability
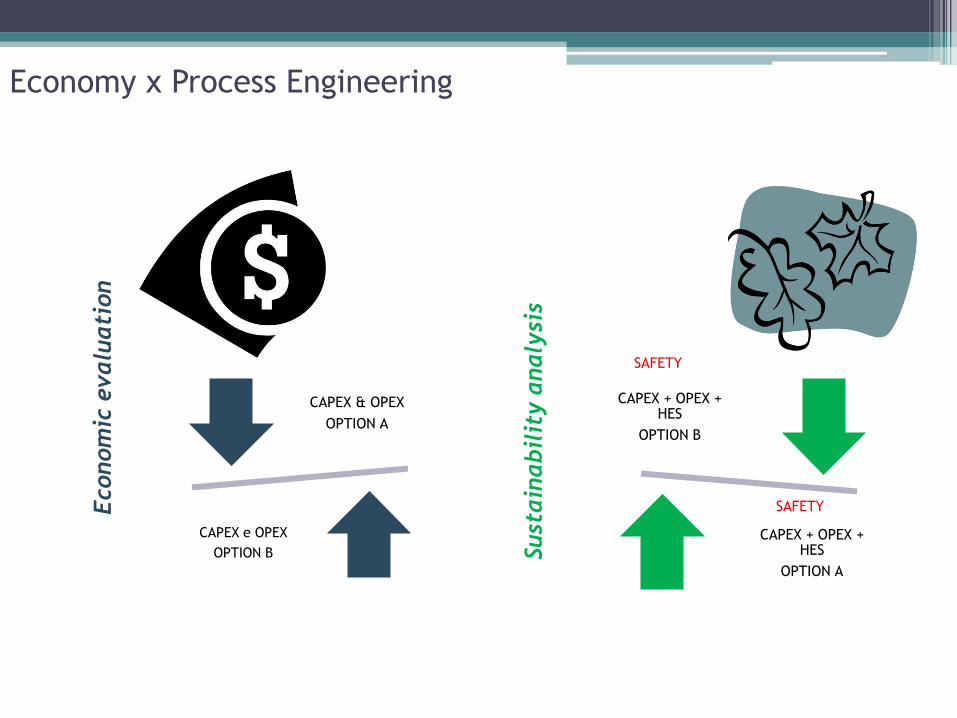
CAPEX & OPEX
OPTION A
CAPEX e OPEX
OPTION B
Econom
ic e
valu
ati
on
CAPEX + OPEX + HES
OPTION A
CAPEX + OPEX + HES
OPTION B
Sust
ain
abil
ity a
naly
sis
SAFETY
SAFETY
Economy x Process Engineering

18

Problem Solving Hints and Wisdom
19
1. Take time to examine and explore the problem thoroughly before setting out in search of a solution.
Often, to understand the problem is to solve it.
2. Breaking the problem into smaller parts will often make solving it much easier. Solve each part separately.
3. The resources for problem solving are immense and ubiquitous.
4. You can always do something.
5. A problem is not a punishment; it is an opportunity to increase the happiness of the world, an opportunity to
show how powerful you really are.
6. The formulation of a problem determines the range of choices: the questions you ask determine the answers
you receive.
7. Be careful not to look for a solution until you understand the problem, and be careful not to select a solution
until you have a whole range of choices.
8. The initial statement of a problem often reflects a preconceived solution.
9. A wide range of choices (ideas, possible solutions) allows you to choose the best from among many. A choice
of one is not a choice.
10. People work to implement their own ideas and solutions much more energetically than they work to
implement others' ideas and solutions.
11. Remember the critical importance of acceptance in solving problems. A solution that is technologically
brilliant but sociologically stupid is not a good solution.
12. When the goal state is clear but the present state is ambiguous, try working backwards.
13. Procrastinators finish last.
14. Denying a problem perpetuates it.
15. Solve the problem that really exists, not just the symptoms of a problem, not the problem you already
have a solution for, not the problem you wish existed, and not the problem someone else thinks exists.
16. A maker follows a plan; a creator produces a plan.
17. Creativity is the construction of something new out of something old, through effort and imagination.

Problem Solving Hints and Wisdom
20
1. Take time to examine and explore the problem thoroughly before setting out in search of a solution.
Often, to understand the problem is to solve it.
2. Breaking the problem into smaller parts will often make solving it much easier. Solve each part separately.
3. The resources for problem solving are immense and ubiquitous.
4. You can always do something.
5. A problem is not a punishment; it is an opportunity to increase the happiness of the world, an opportunity to
show how powerful you really are.
6. The formulation of a problem determines the range of choices: the questions you ask determine the answers
you receive.
7. Be careful not to look for a solution until you understand the problem, and be careful not to select a solution
until you have a whole range of choices.
8. The initial statement of a problem often reflects a preconceived solution.
9. A wide range of choices (ideas, possible solutions) allows you to choose the best from among many. A choice
of one is not a choice.
10. People work to implement their own ideas and solutions much more energetically than they work to
implement others' ideas and solutions.
11. Remember the critical importance of acceptance in solving problems. A solution that is technologically
brilliant but sociologically stupid is not a good solution.
12. When the goal state is clear but the present state is ambiguous, try working backwards.
13. Procrastinators finish last.
14. Denying a problem perpetuates it.
15. Solve the problem that really exists, not just the symptoms of a problem, not the problem you already
have a solution for, not the problem you wish existed, and not the problem someone else thinks exists.
16. A maker follows a plan; a creator produces a plan.
17. Creativity is the construction of something new out of something old, through effort and imagination.

Best Process Configuration (Design)
Challenge in designing green processes
is on building an adequate design
objective function
Process Model
(Product Description)
Operations Model (Processing
Requirements)
Financial Model
(Resource Requirements)
PRODUCTION COST
An Introduction to Environmental Accounting as a Business Management Tool: Key Concepts and Terms. EPA 742-R-95-001
Conventional Costs (Easier to Measure)
Potentially Hidden and Contingent Cost
Societal Costs
(More Difficult to Measure)
ENVIRONMENTAL COST
Process Cost Modeling: StrategicEngineering and Economic Evaluation ofMaterials Technologies .Frank Field, Randolph Kirchain, and Richard Roth

22

CAPEX, OPEX
23
24
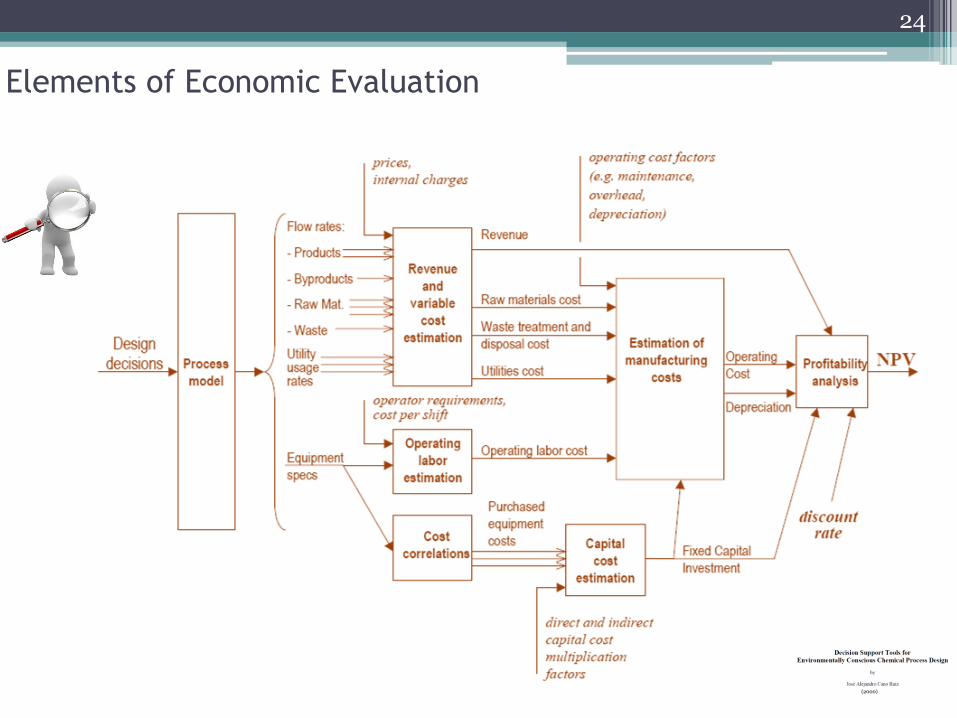
Elements of Economic Evaluation
(2000)

Process Engineering Index, CPE Index
25
Coulson & Richardson

Estimation of Fixed Capital Cost
26
Coulson & Richardson

Equipment Cost
27
Coulson & Richardson

28

Metrics of Environmental Risks
•Global Warming
•Stratospheric ozone depletion
•Acid deposition
•Smog formation
Abiotic Indexes
•Inhalation toxicity
•Ingestion toxicity
•Inhalation carcinogenicity
•Ingestion carcinogenicity
Health-Related Indexes
•Fish aquatic toxicityEcotoxicity Indexes
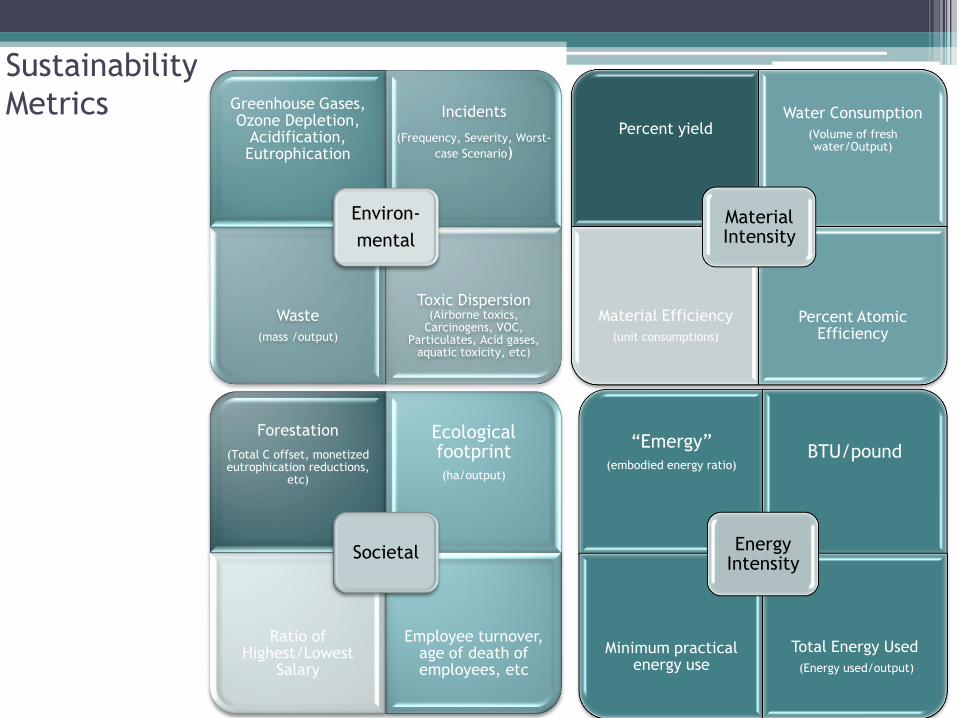
Sustainability
MetricsPercent yield
Water Consumption
(Volume of fresh water/Output)
Material Efficiency
(unit consumptions)
Percent Atomic Efficiency
Material Intensity
“Emergy” (embodied energy ratio)
BTU/pound
Minimum practical energy use
Total Energy Used
(Energy used/output)
Energy Intensity
Greenhouse Gases, Ozone Depletion,
Acidification, Eutrophication
Incidents
(Frequency, Severity, Worst-
case Scenario)
Waste
(mass /output)
Toxic Dispersion (Airborne toxics,
Carcinogens, VOC, Particulates, Acid gases,
aquatic toxicity, etc)
Environ-
mental
Forestation
(Total C offset, monetized eutrophication reductions,
etc)
Ecological footprint (ha/output)
Ratio of Highest/Lowest
Salary
Employee turnover, age of death of employees, etc
Societal

Sustainability Metrics – Weighting Factors
Weighting Factors
Input (50%)
Energy Consumption (25%)
Raw Material Consumption (25%)
Undesired Output (50%)
Risk Potential (10%)
Emissions (20%)
Atmospheric (50%)
Global Warming Potential (50%)
Ozone Depletion Potential (20%)
Photochemical Ozone Creation Potential (20%)
Acidification Potential (10%)
Water (35%)
Waste (15%)Toxicity Potential
(20%)

32

Safety
33
• Continual effort to analyze, reduce and control risks to the lowest levels
practical, while balancing other business objectives.
• Safety = tolerable risks in comparison to the benefit of the activity.
• Hazard = situation with the potential for harm
• Risk = the likelihood that a defined consequence (harm) will occur.
• Risk = f(hazard, frequency).

Reducing Risk Frequency or Consequences of Potential Accidents
34
• Inherent
Eliminating the hazard at process design: hazard reduction
or elimination is permanent and inseparable
• Passive
Minimizing the hazard through process and equipment design features;
• Active
Using controls, alarms, safety instrumented systems, and mitigation systems to
detect and respond to process deviation from normal operation
• Procedural
Using policies, operating procedures, training, administrative checks, emergency
response, and other management approaches to prevent incidents, or to minimize
the effects of an incident
Inherently
safer

35
Reducing Risk Frequency or Consequences of Potential Accidents

Inherent Safety: Layers of Protection
36

Strategies for Inherently Safer Design
37

Strategies for Inherently Safer Design
38
Reduce the quantity of material or energy
The dimensions of process
equipments should be
specified as large enough
to accomplish its intended
purpose, and no larger.
However, surge
capacity should
be preserved
Minimize CAPEX meets
MINIMIZE STRATEGY for
inherently safer design
Smaller is safer
innovative process intensification

39
Replacement of a
material or process
equipment to reduce
or eliminate hazard
Substituting raw materials and
intermediates after the process has
been built, while possible in some
cases, is usually very difficult
PEI metrics can be adapted
and expanded to explicitly
include hazard
Strategies for Inherently Safer Design

40
Also called attenuation, means using materials under less hazardous conditions. Inherently
Robust Process
Equipment
• synthesis routes
• catalysis for milder conditions
• less reactive reagent, or bio-synthesis
• reduction of hazardous solvents
• volatile solvents to boil, removing the heat of reaction
• immobilization of hazardous reagents and catalysts
• dilution of reagents
• reactions in water
• elimination of hazardous unit operations
• near-critical and super-critical processing
• replacement of batch reaction processes with semi-batch or continuous processes
reducing the quantity of reactant present
• use of processes less sensitive to operating parameter variations
Strategies for Inherently Safer Design

Weighted Score Decision
41

Measuring Inherent Safety
42
Dow Fire and Explosion Index: [Unit Hazard Factor] x [Material Factor].
Quantifies the amount of energy released (e.g., exothermic chemical reactions).
Dow Chemical Exposure Index: relative acute health hazard potential of a
chemical release to workers and the neighboring community
Mond Index (ICI): The Dow Index expanded to a wider range of processes and
storage installations; processing of chemicals having explosive properties;
improved hazard consideration for hydrogen; additional special process hazards;
and, inclusion of toxicity in assessment.
Most
hazardous
substance
Worst case
scenario

Other Inherent Safety Indices
43
Integrated Inherent Safety Index (I2SI): economic evaluation and hazard potential
identification within the process life cycle. I2SI is comprised of sub-indices, with
main sub-indices being a hazard index and an inherent safety potential index.
Prototype Index of Inherent Safety (PIIS): is based on a chemical score (inventory, flammability, explosiveness and toxicity) and a process score (T, P). The chemical
score takes into consideration. Judgment and experience are used in weighting of
those factors.
Inherent Safety Index: used to classify process alternatives during the process
synthesis phase. This method assigns scores to chemical factors (heat of main and
side reactions, flammability, explosiveness, toxicity, corrosiveness, chemical
interaction) and process factors (inventory, process temperature and pressure,
equipment safety, safety of process structure). The final index is a summation of
the chemical and process factors.

44

12 Principles of Green Chemistry
1. Prevention
2. Atom economy
3. Less hazardous chemical
synthesis
4. Design safer chemicals
5. Safety solvents and auxiliaries
6. Design for energy efficiency
7. Use renewable feedstocks
8. Reduce derivatives
9. Catalysis
10. Design for degradation
11. Real-time analysis for pollution
prevention
12. Inherently safer chemistry for
accident prevention
a. Green Chemistry is the application of P2 principles to the chemistry discipline;
b. Emphasis of Green Chemistry tends to be on synthesis routes and solvent
selection, ignoring the role of equipment engineering

12 Principles of Green Engineering
1. All material and energy inputs and
outputs are as inherently non-
hazardous as possible
2. Prevention Instead of Treatment
3. Design for Separation and
Purification
4. Maximize efficiencies (Le
Chatelier’s Principle)
5. Output-Pulled Versus Input Pushed
6. Conserve Complexity
7. Durability Rather than
Immortality
8. Meet Need, Minimize Excess
9. Minimize Material Diversity
10. Integrate Material and Energy
Flows
11. Design for Commercial
“Afterlife”
12. Renewable Rather than
Depleting
Anastas, P.T., and Zimmerman, J.B., "Design through the Twelve Principles, Principles of Green Engineering", Env. Sci. and Tech., 37, 5, 95 -101, 2003.
Process Alternatives under GC and GE Perspectives
• Increase the integration of process chemistry into the generation of design
alternatives.
• Predict by-products and emissions.
• Recognize opportunities to match waste streams with feed streams.
• Link process and environmental models (environmental databanks and process
simulators).
J. A. Cano-Ruiz and G. J. McRae, ENVIRONMENTALLY CONSCIOUS CHEMICAL PROCESS DESIGN, Annu. Rev. Energy Environ. 1998. 23:499–536

Process Alternatives Under GC and GE Perspectives
• Detail used in process models should match the accuracy needed to make
decisions.
• Allocate environmental impacts to specific processes and products in plants.
• Develop environmental impact metrics.
• Define preferences needed to weight multi-objective optimization.
• Sensitivity analysis and identification of the features that drive environmental
impact.
J. A. Cano-Ruiz and G. J. McRae, ENVIRONMENTALLY CONSCIOUS CHEMICAL PROCESS DESIGN, Annu. Rev. Energy Environ. 1998. 23:499–536

Green PSE
The “ How tos” of Systematic Generation Approaches
• How to select among alternative along the algorithm
• How to generate an initial superstructure containing the “greenest” solution;
• How to solve the resulting large optimization problem
• How to integrate process chemistry and process engineering.
• How to efficiently cope with multiple objectives: green chemistry principles,
pollution prevention, social aspects (labor utilization), inherent safety, profit…
49
Adapted from Siirola, 1995

Green PSE
Evaluation of Pareto sets
• The synthesis system generates families of designs, involving different chemistries. Each may
need to be evaluated from distinct points of view, or with yet-to-be-developed optimization
objectives that somehow incorporate social criteria (Siirola, 1995)
50

51
CO2

CO2 Capture from Power Plants
POWER PLANT
HY
DR
OC
AR
BO
N
CO
2
POWER PLANT
WATER CONDENSATION
POWER PLANT
CO2
CAPTURE
REFORMING/GASIFICATION
WGS
AIR
ASUAIR
O2
O2
H2
POWER EQUIPMENT
FUEL CELL
OXY-COMBUSTION
AIR
H2O H2O
CO2
H2
CO2
CAPTURE
H2O

POWER PLANT
HY
DR
OC
AR
BO
N
CO
2
CO2
CAPTURE
AIR
Technology CO2 Emissions (kg/MWh)PC-fired—subcritical 850
PC-fired—supercritical 800
IGCC 670
NGCC 370
Nuclear 0
CO2 Capture from Power Plants

CCGS
CostUS$ / kwh
Poor Gas
Rich Gas
RevenueUS$ / kwh
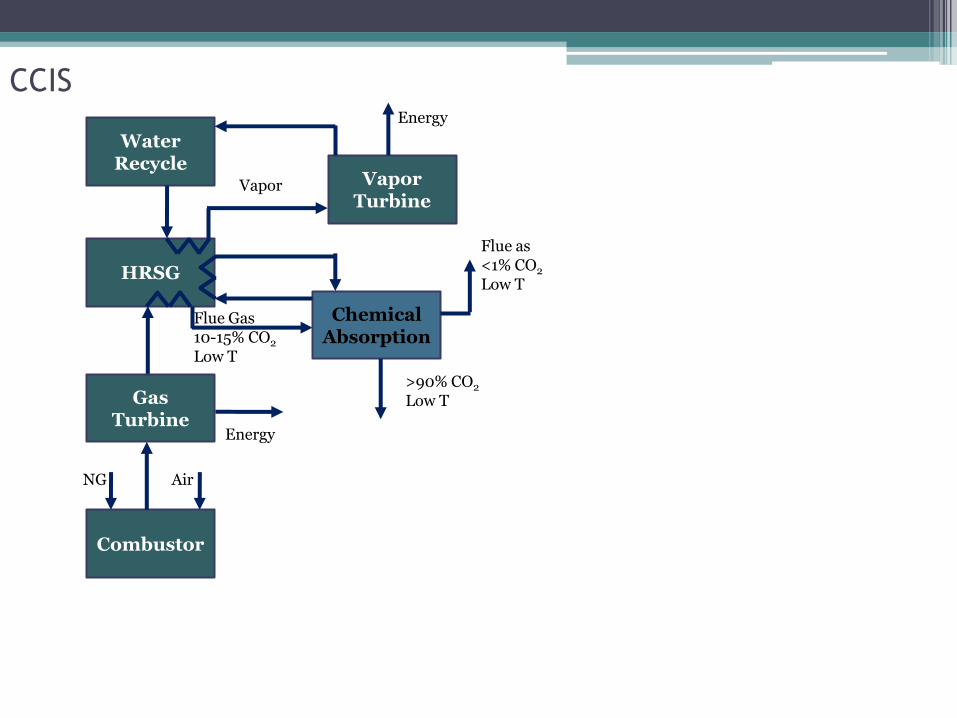
CCIS
CCGS (Cost of kwh) x CCIS (Cost of kwh)

Production Volume X Added Value
POTENTIAL MARKET
m3/yearPRICES
US$/t
Pharmaceuticals
Chemicals
Food
Biofuels

CCIS
Combustor
HRSG
Flue Gas10-15% CO2
Low T
Water Recycle
Gas Turbine
Vapor Vapor Turbine
Energy
Energy
NG Air

CCIS
Combustor
HRSG
Flue Gas10-15% CO2
Low T
Water Recycle
Gas Turbine
Vapor Vapor Turbine
Energy
Energy
NG Air
Chemical Absorption
Flue as<1% CO2
Low T
>90% CO2
Low T
CCIS
Combustor
HRSG
Flue Gas10-15% CO2
Low T
Water Recycle
Gas Turbine
Vapor Vapor Turbine
Energy
Energy
NG Air
Chemical Absorption
Flue as<1% CO2
Low T
>90% CO2
Low T

CCIS
Combustor
HRSG
Flue Gas10-15% CO2
Low T
Water Recycle
Gas Turbine
Vapor Vapor Turbine
Energy
Energy
NG Air
Chemical Absorption
Flue as<1% CO2
Low T
>90% CO2
Low T
Microalgae Culture
O2

CCIS
Combustor
HRSG
Flue Gas10-15% CO2
Low T
Water Recycle
Gas Turbine
Vapor Vapor Turbine
Energy
Energy
NG Air
Chemical Absorption
Flue as<1% CO2
Low T
>90% CO2
Low T
Microalgae Culture
O2
Drying
LPS
BM Suspension

CCIS
Combustor
HRSG
Flue Gas10-15% CO2
Low T
Water Recycle
Gas Turbine
Vapor Vapor Turbine
Energy
Energy
NG Air
Chemical Absorption
Flue as<1% CO2
Low T
>90% CO2
Low T
Microalgae Culture
O2
Drying
LPS
BM Suspension
Dry BM
Syngas
BM seca
Syngas
Humid Gasification

CCIS
Combustor
HRSG
Flue Gas10-15% CO2
Low T
Water Recycle
Gas Turbine
Vapor Vapor Turbine
Energy
Energy
NG Air
Chemical Absorption
Flue as<1% CO2
Low T
>90% CO2
Low T
Microalgae Culture
O2
Drying
LPS
BM Suspension
Dry BM
Humid Gasification
Syngas
Dry BM
Syngas
Separation H2
Reaction Methanol
Fischer Tropsch
Green DieselGasoline
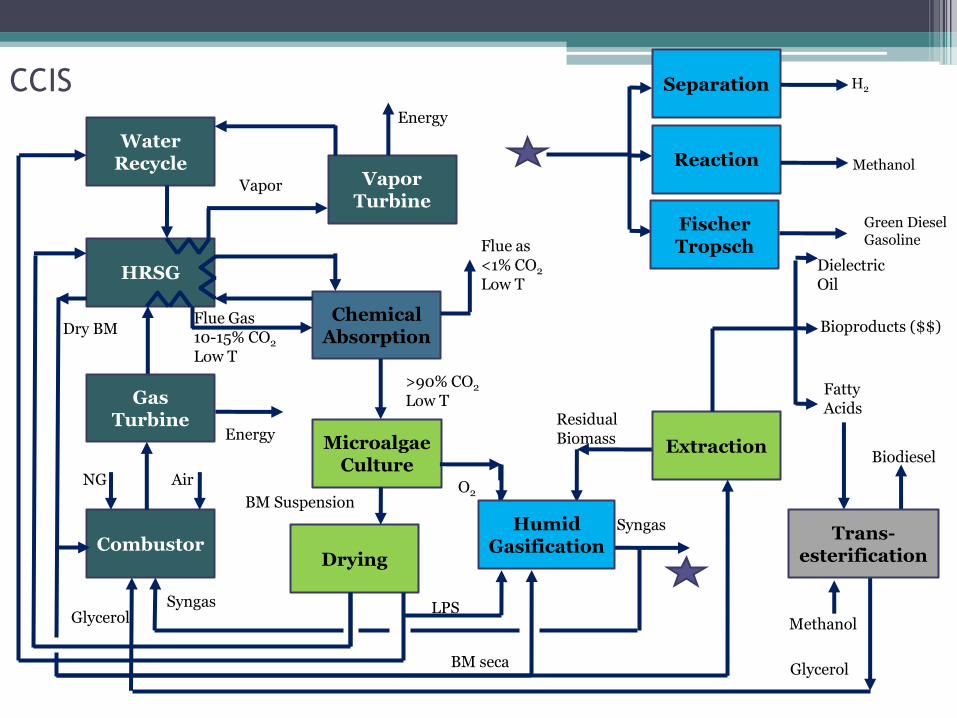
CCIS
Combustor
HRSG
Flue Gas10-15% CO2
Low T
Water Recycle
Gas Turbine
Vapor Vapor Turbine
Energy
Energy
NG Air
Chemical Absorption
Flue as<1% CO2
Low T
>90% CO2
Low T
Microalgae Culture
O2
Drying
LPS
BM Suspension
Dry BM
Syngas
BM seca
Syngas
Separation H2
Reaction Methanol
Fischer Tropsch
Green DieselGasoline
Extraction
Bioproducts ($$)
Residual Biomass
Dielectric Oil
Fatty Acids
Biodiesel
Glycerol
Glycerol Methanol
Humid Gasification
Trans-esterification

CCIS
Combustor
HRSG
Water Recycle
Gas Turbine
Vapor Vapor Turbine
Energy
Energy
NG Air
>90% CO2
Low T
Microalgae Culture
O2
Drying
LPS
BM Suspension
Dry BM
Syngas
BM seca
Syngas
Separation H2
Reaction Methanol
Fischer Tropsch
Green DieselGasoline
Extraction
Bioproducts ($$)
Residual Biomass
Dielectric Oil
Fatty Acids
Trans-esterification
Biodiesel
Glycerol
Glycerol Methanol
Humid Gasification

NGCC

NGCC

NGCC

NGCC and in situ Biomass Production
NGCCCULTIVO DE BIOMASSA
CAPTURA DE CO2CO2 Capture
Biomass Production
NGCC

69

Carbon Sequestering Industrial Complex
MinP(x,y) = - y P(i(x))PEI(x,y) = y P(i(x))
Stci(x) = 0c(x) > 0Ai x = biA x ≤ bli ≤ x ≤ ls
BIOREACTIONOXIDATION C2= EO
PRODUCTION DME DMC
MTO
PROD. NH3
PROD UREA
PROD DMC UREA
GLYCEROL CARBONATE
TRANSESTERI-FICATION
BIODIESEL
OIL EXTRACTION
GASIFICATION
SDTO
PRODUCTIONMETHANOL
FISCHER TROPSCH RXN
WATER GAS SHIFT REACTION
ETHYLENE
NH3
SYNGAS
RESIDUALBIOMASS
GLYCEROL
GLYCEROL CARBONATE
OILCAROTENE
1,2PROPANEDIOLHYDRO-
GENOLYSIS
UREA

“C
CIS
”
PROCESS REFERENCE REACTANTS PRODUCTS
Production of D. salina Chisti (2007) CO2, nutrients biomass, beta-carotene, O2
Biomass Gasification Olofsson et al. (2005) biomass, O2 SYNGAS, N2, CO2, vapor
Production of
Biodiesel Georgogianni et al. (2009) biomass, MeOH
Residual Biomass, biodiesel,
glycerol
Production of 1,2-PD Dasaria et al. (2006) glycerol, H2 1,2-PD, H2O
Production of H2 Monteiro et al. (2009) SYNGAS H2, CO2
Production of MeOH Nouri e Tillman (2005) SYNGAS MeOH
Production of NH3 Monteiro et al. (2009) H2 , N2 NH3
Production of Urea Baal e Lemmen (2003) NH3 , CO2 Urea
MTO Wei Wang et al. (2005) MeOH Methane, Ethane, ethylene,
propane, propylene,
butanes, butenes, C5+, H2O,
CO2
SDTO Cai et al. (1995) SYNGAS
FTCai et al. (1995) SYNGAS
Production of EO Coombs et al. (1997) Ethylene, O2 EO
Production of DMC via
EO Cui et al. (2004) EO, CO2, MeOH DMC, EG
Production of DMC via
Urea Cui et al. (2004) urea, MeOH DMC, NH3
Production of CG Rokicki et al. (2005) DMC, glycerol Glycerol carbonate

Complex Summary
72

Process Flow Diagram

Problem Dimension
15 processes
228 process streams
115 process equipaments
15 recycle streams
29 components
Computational Effort

Process Simulation Simplifications

Methodology
MASS ENERGY
FEEDSTOCKPRODUCTS
SUSTAINABILITY
FUNCTION PARETO FRONTIER
S=WEIEI + WPP
EI
P
PROCESS

i
k
i
k
i
k vpp 11 i
k
g
k
i
k
i
k
i
k
i
k pmrandcpmrandcvwv 22111
Position: Velocity:
c1 = 2
c2 = 2
w = 0,1
Optimization of S-CCIS Modules
Hybrid Algorithm (Leotitsis, 2009):
1 – set search region;
2 – locate initial particles;
3 – relocate particles according to objective function values,
generation of a new population;
4 – Pareto Frontier from memory of positions.

Avaliation of Optimal Solutions
Weights Weights Objectives
wP wEI P (1012 $/year) EI (108 PEI/year)
I 0.5 0.5 7.06 2.36
II 0.75 0.25 11.33 5.85
III 0.25 0.75 4.51 0.96

CCIS Results
I (wP = wEI)
II (wP > wEI)
III (wP < wEI)

CCIS
I II III
CO2 (t/h)
Consummed 1.83e5 8.85e3 1.32e5
Emitted 1.39e4 735 1.38e4
Net Capture (t/h) 1.69e5 8.12e3 1.18e5
PRODUCTS (t/h)
EO - 2.73 5.3
H2 - 0.6 0.13
Urea 0.44 1.58 0.17
DMC 1.32 - 4.9
1,2- Propanediol 0.084 0.08 -
Glycerol Carbonate 0.0321 - -
Glycerol 0.017 0.26 -
1
2
3
1 2 3

81
00,10,20,30,40,50,60,70,80,9
1
30 35 40 45 50
EI
(PE
I·t-1
)
Profit (USD·t-1)
Fronteira de Pareto
IA min
L max
Soluções intermediárias
L (USD/t de CO2)
IA (P
EI/t
de
CO
2)
00,10,20,30,40,50,60,70,80,9
1
30 35 40 45 50
EI (
PEI
·t-1
)
Profit (USD·t-1)
Fronteira de Pareto
S max(ωL /ωIA = 10)
S max(ωL /ωIA = 5)
L (USD/t de CO2)
IA (P
EI/t
de
CO
2)
S max(ωL /ωIA = 0)
P MAX
Pareto Frontier
Intermediate Solutions EIMIN
Pareto Frontier
SMAXSMAX
P (US$/t CO2)
P (US$/t CO2)
EI(
PE
I/t
CO
2)
EI(
PE
I/t
CO
2)
Pareto Frontier

Environmental Impact, Inherent Safety and Profitability
82

Alternative Routes
83
ROUTE 1
ROUTE 2
ROUTE 3
ROUTE 4
ROUTE 5

Intrinsic Safety
85
PRINCIPLES PARAMETERS
(Kletz, 1991) (Edwards and Lawrence, 1993) (Heikkilä et al., 1996)
Intensification
- Inventory
- Reaction Volume
Inventory
Reaction fieldInventory
Substitution
- Safer materials
Flammability,
Toxicity, Explosivity
Flammability, Explosivity,
Toxicity, Chemical interaction
Attenuation
- Low T, Low P T, P T, P
Limitation of Effects
- safer technical alternatives
- safer reaction conditions
T, P
Equipment safety, Safety of
process structure, T, P
Chemical interaction
Simplification
- Simplifly process environment -Safety of process structure
Impossible incorrect assimilation
- Selection of equipments, tubes and
connections -
Equipment safety
Safety of process structure
Tolerance
- Resistance to bad operation -
Equipment safety, Safety of
process structure, Corrosion
Easy to control-
Heat of reaction
Safety of process structure

Intrinsic Safety Metrics
86
CHEMICAL INDEXES (ICI) PROCESS INDEXES (IPI)
Sub-indexes for reaction dangers Sub-indexes for process conditions
Heat of main reaction(IRM)MAX Inventory (II)
Heat of secondary reactions (IRS)MAX Process Temperature (IT)MAX
Chemical interactions (IINT)MAX Process Pressure (IP)MAX
Sub-indexes for dangerous substances Sub-indexes for process system
Flammabilility (IFL)MAXEquipment (IEQ)MAX
Explosivity (IEX)MAX
Toxicity (ITOX) MAXProcess structure (IST)MAX

87
Heikkilä et al. (1996)
PICITI III
max,maxmax,max,max, )( CORTOXEXFLINTRSRMCI IIIIIIII
max,max,max,max, STEQPTIPI IIIIII
worst case scenario
chemical
process
Intrinsic Safety Metrics

88
Heikkilä et al. (1996)
PICITI III
max,maxmax,max,max, )( CORTOXEXFLINTRSRMCI IIIIIIII
max,max,max,max, STEQPTIPI IIIIII
Heat of Reaction (IRM,max and IRS,max ) Value
Neutral ≤ 200 J/g 0
Average Exothermicity < 600 J/g 1
Moderate Exothermicity < 1200 J/g 2
High Exothermicity < 3000 J/g 3
Extremely High Exothermicity ≥ 3000 J/g 4
Intrinsic Safety Metrics

89
Heikkilä et al. (1996)
PICITI III
max,maxmax,max,max, )( CORTOXEXFLINTRSRMCI IIIIIIII
max,max,max,max, STEQPTIPI IIIIII
Chemical Interaction (IINT,max) Value
Heat of Formation 1;2;3
Fire 4
Formation of non-dangerous substances or non-flammable gases 1
Formation of toxic gases 2;3
Formation of flammable gases 2;3
Explosion 4
Rapid polimerization 2;3
Toxic chemical substances 1
Intrinsic Safety Metrics

90
Heikkilä et al. (1996)
PICITI III
max,maxmax,max,max, )( CORTOXEXFLINTRSRMCI IIIIIIII
max,max,max,max, STEQPTIPI IIIIII
Flammability (IFL) Value
Non-flammable 0
Combustible (flash point > 55oC) 1
Flammable (flash point ≤ 55oC) 2
Easily flammable (flash point < 21oC) 3
Highly flammable (flash point < 0oC and boiling point ≤ 35o C) 4
Intrinsic Safety Metrics

91
Heikkilä et al. (1996)
PICITI III
max,maxmax,max,max, )( CORTOXEXFLINTRSRMCI IIIIIIII
max,max,max,max, STEQPTIPI IIIIII
Explosivity (IEX , HEV-LEV) Value
Non-explosive 0
0 - 20 1
20 - 45 2
45 - 70 3
70 - 100 4
Intrinsic Safety Metrics

92
Heikkilä et al. (1996)
PICITI III
max,maxmax,max,max, )( CORTOXEXFLINTRSRMCI IIIIIIII
max,max,max,max, STEQPTIPI IIIIII
Toxicity (ITOX , ppm) Value
TLV > 10000 0
TLV ≤ 10000 1
TLV ≤ 1000 2
TLV ≤ 100 3
TLV ≤ 10 4
TLV ≤ 1 5
TLV ≤ 0.1 6
Threshold Limit Values (TLV).
Intrinsic Safety Metrics
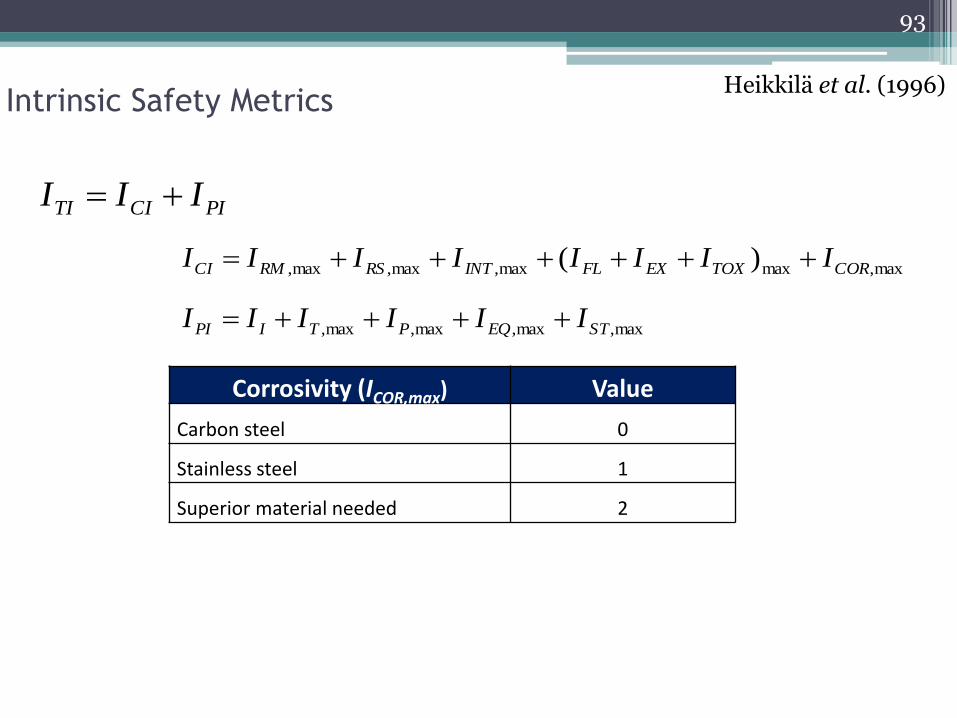
93
Heikkilä et al. (1996)
PICITI III
max,maxmax,max,max, )( CORTOXEXFLINTRSRMCI IIIIIIII
max,max,max,max, STEQPTIPI IIIIII
Corrosivity (ICOR,max) Value
Carbon steel 0
Stainless steel 1
Superior material needed 2
Intrinsic Safety Metrics

94
Heikkilä et al. (1996)
PICITI III
max,maxmax,max,max, )( CORTOXEXFLINTRSRMCI IIIIIIII
max,max,max,max, STEQPTIPI IIIIII
Inventory (II,max)
ValueISBL OSBL
0 - 1 t 0–10 t 0
1–10 t 10–100 t 1
10–50 t 100–500 t 2
50–200 t 500–2000 t 3
200–500 t 2000–5000 t 4
500–1000 t 5000–10000 t 5
OSBL based on Mond Index (ICI,1985). ISBL based on flow rate and residence time of 1h for each vessel
Intrinsic Safety Metrics

95
Heikkilä et al. (1996)
PICITI III
max,maxmax,max,max, )( CORTOXEXFLINTRSRMCI IIIIIIII
max,max,max,max, STEQPTIPI IIIIII
Process Temperature (IT,max) Value
< 0 °C 1
0–70 °C 0
70–150 °C 1
150–300 °C 2
300–600 °C 3
> 600 °C 4
OSBL based on Mond Index (ICI,1985). ISBL based on flow rate and residence time of 1h for each vessel
Intrinsic Safety Metrics

96
Heikkilä et al. (1996)
PICITI III
max,maxmax,max,max, )( CORTOXEXFLINTRSRMCI IIIIIIII
max,max,max,max, STEQPTIPI IIIIII
Process Pressure (IP,max) Value
0.5–5 bar 0
0–0.5 ou 5–25 bar 1
25–50 bar 2
50–200 bar 3
200–1000 bar 4
Index Dow E&F (DOW, 1987).
Intrinsic Safety Metrics

97
Heikkilä et al. (1996)
PICITI III
max,maxmax,max,max, )( CORTOXEXFLINTRSRMCI IIIIIIII
max,max,max,max, STEQPTIPI IIIIII
Equipment Type (ISBL IEQ,max) Value
Equipaments with non-flammable and non-toxical chemicals 0
Heat exchangers, pumps, towers, vessels 1
Air coolers, reactors, high risk pumps 2
Compressors, high risk reactors 3
Furnaces and heaters 4
Intrinsic Safety Metrics

98
Heikkilä et al. (1996)
PICITI III
max,maxmax,max,max, )( CORTOXEXFLINTRSRMCI IIIIIIII
max,max,max,max, STEQPTIPI IIIIII
Equipment Type (OSBL IEQ,max) Value
Equipaments with non-flammable and non-toxical chemicals 0
Atmospheric reservoir tanks, pumps 1
Tcooling towers, compressors, blowdown systems, pressurized or
refrigerated reservoir tanks 2
Flares, burners, furnaces 3
Intrinsic Safety Metrics

99
Heikkilä et al. (1996)
PICITI III
max,maxmax,max,max, )( CORTOXEXFLINTRSRMCI IIIIIIII
max,max,max,max, STEQPTIPI IIIIII
Levels of Process Structures (IST,max) Values
Recomended 0
Practice of Engineers 1
Neutral or without available data 2
Probably unsafe 3
Small accidents 4
Great accidents 5
Intrinsic Safety Metrics

Profitability Potential
100
Profitability Potential– MeOH Routes
n
i jijij PvPP1 1PP
PPPI
jj
Profitability
Potential
Price ($/mol) of
Component i in
ROUTE j
StoichiometricCoefficient ofComponent i in ROUTE j
Potential
Profitability
Index of
ROUTE j

Profitability Potential – MeOH Routes
101
COMPONENT PRICES (US$/mol)1 2 3 4 5
Stoichiometric Coefficients
HCl 0.00342 1
H2SO4 0.01201 1
H2O 1 -1 -1
CH3HSO4 0.02922 -1
CH3Cl 0.01401 -1
CO2 -1
H2 0.00159 -2 -3
CH4 0.00275 -1
CH3OH 0.04417 1 1 1 1 1
CO 0.01400 -1
O2 0.00477 -0,5
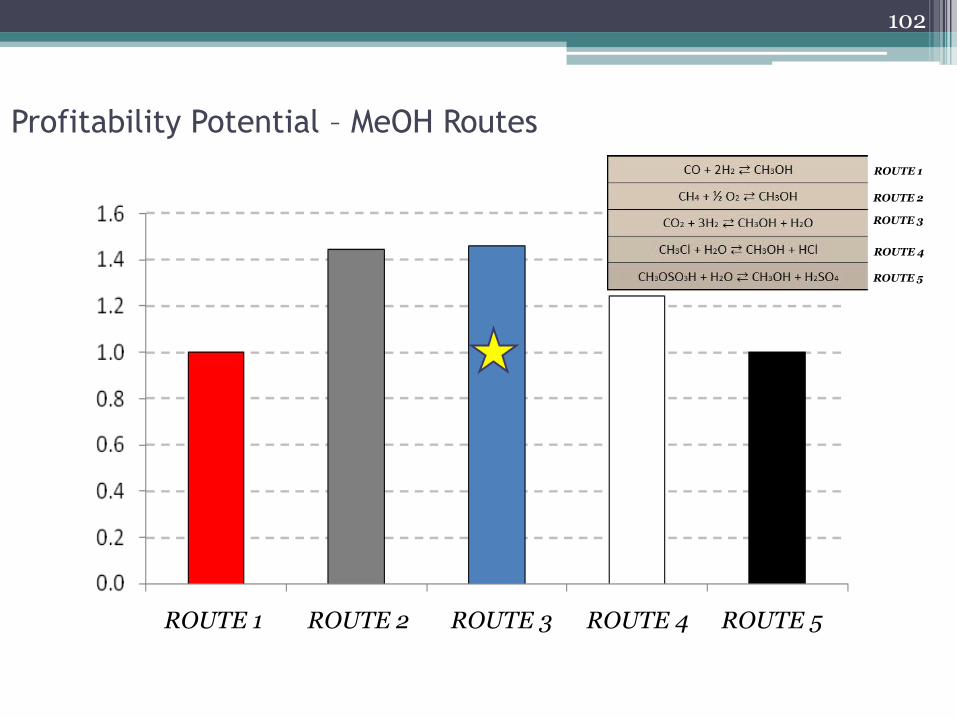
Profitability Potential – MeOH Routes
102
ROUTE 1 ROUTE 2 ROUTE 3 ROUTE 4 ROUTE 5
ROUTE 1
ROUTE 2
ROUTE 3
ROUTE 4
ROUTE 5

Environmental Ranking– MeOH Routes
103
ROUTE 1 ROUTE 2 ROUTE 3 ROUTE 4 ROUTE 5
IMPACT CATEGORIES
PE
I/h
ÎÎÎ genoutint
I sistema
ÎÎÎ genoutin0
ki
sComponente
k kj
Correntes
j inj
Categorias
i iin xMÎ ,
scorescore
k i
ki
ki

Hommel Diagram
104
PRODUTOS
DIAGRAMA DE HOMMEL PARA AS SUBSTÂNCIAS
CO H2 CH3OH
REAGENTES
CH3OH
CO2 H2 CH3OH H2O
CH4
N.A.
CH3Cl H2O CH3OH HCl
N.A.
N.A.
N.A.N.A.
O2
N.A.
H2O CH3OH H2SO4CH3OSO3H
ROTA 5
ROTA 4
ROTA 3
ROTA 2
ROTA 1ROUTE 1
ROUTE 2
ROUTE 3
ROUTE 4
ROUTE 5
REACTANTS PRODUCTS

Toxicity Ranking – MeOH Routes
105
Simple addition of indexes of risk to health, flammability and reactivity of reactants and products in each route
ROUTE 1 ROUTE 2 ROUTE 3 ROUTE 4 ROUTE 5
Health Risk
ROUTE 1 ROUTE 2 ROUTE 3 ROUTE 4 ROUTE 5
Flammability Risk
ROUTE 1 ROUTE 2 ROUTE 3 ROUTE 4 ROUTE 5
Reactivity Risk
3

MeOH Process Simulation – Route 3
106
CO2 + H2 → HCOOH Eq.(1)
HCOOH + C2H5OH → HCOOC2H5 + H2O Eq.(2)
HCOOC2H5 + 2H2 → CH3OH + C2H5OH Eq.(3)
Fan et al. (1998).

MeOH Process Simulation – Route 3
107

Evaluation of Intrinsic Safety – Route 3
108
-504.7734819 J/g
14.26 t/h
200 C
30 bar
Substância Explosividade (IEX )
H2 4
H2O 0
CO2 0
Metanol 2
Etanol 1
E-Formato 01
SUBSTÂNCIAS PERIGOSAS
Inflamabilidade (IFL)
Não determinado
0
0
1
2
IEQ = 2Reatores
Valor EncontradoPERIGOS DE REAÇÃO - reação principal
INTERAÇÃO QUÍMICA Valor Encontrado
IT = 2
PRESSÃO Valor Encontrado
IP = 2
TIPO DE EQUIPAMENTO (ISBL) Valor Encontrado
Valor Encontrado
II = 2
INVENTÁRIO
TEMPERATURA Valor Encontrado
Hidrogênio - Explosivo IINT, M ax = 4
SUBÍNDICES
IRM , M ax = 1
REACTION RISK – Main Reaction CALCULATED VALUE
CHEMICAL INTERACTION Hydrogen - explosive
CALCULATED VALUE
CALCULATED VALUE
CALCULATED VALUE
CALCULATED VALUE CALCULATED VALUE
CALCULATED VALUE
DANGEROUS SUBSTANCES
PRESSURE
TEMPERATURE
INVENTORY
EQUIPMENT TYPE (ISBL)
Reactors
Substance Flammability Explosivity
Not Determined
METHANOL
ETHANOL
E-FORMATE
ICI = 1 + 4 + (1 + 2 + 1 + 4 + 2 + 1) = 16IPI = 2 + 2 + 2 + 2 = 8ITI = 24

Reference
109

Reference
110

Reference
111