Embed Size (px)
Citation preview

© 2012 Sustainability Roundtable, Inc. Confidential – For use in connection with SR Inc Services only.
Sustainable Real Estate Roundtable Member Briefing:
REal EStatE SuStaInaBIlIty daShBoaRdS
Page 2SuStaInaBlE REal EStatE RoundtaBlE© 2012 Sustainability Roundtable, Inc. Confidential – For use in connection with SR Inc Services only.
REal EStatE SuStaInaBIlIty daShBoaRdS
table of Contents
IntRoduCtIon 3
daShBoaRd IMPlEMEntatIon 3Step 1: Select Key Performance Indicators 3Step 2: Compare Site Performance to Portfolio 4Step 3: Create Sustainability Index 8Step 4: track Site and Portfolio Performance over time 14Step 5: Improve Performance by Setting targets 15
aPPEndIx a: SElECtIng KEy PERFoRManCE IndICatoRS 16
aPPEndIx B: REal EStatE SuStaInaBIlIty daShBoaRd VEndoR PRoFIlES 19C3 19Ca technologies 19Enablon 20hara 20IBM tRIRIga 21InFoR global Solutions 21PE International 22SaP 22Summit Energy 23SuMo Cloudapps 23

REgIonal CoSt VaRIatIon oF ElEVEn toP EnERgy ConSERVatIon MEaSuRES
Page 3SuStaInaBlE REal EStatE RoundtaBlE© 2012 Sustainability Roundtable, Inc. Confidential – For use in connection with SR Inc Services only.
leading real estate (RE) executives deploy sustainability dashboards to benchmark and track the overall sustainability of each site and the entire portfolio, set performance targets, and track improvement. leaders also use dashboards to quickly see the relative ranking of sites, identify underperforming sites, and implement effective sustainability initiatives to improve performance. In addition, dashboards enable executives to easily report results internally and externally.
this briefing describes a comprehensive sustainability dashboard, based on examples of dashboards utilized by leading companies or implemented as part of third party commercial software applications. the dashboard tracks six key performance indicators (KPIs) - energy use, water usage, waste disposal, space utilization, greenhouse gas (ghg) emissions, and workplace quality (defined as indoor air quality and employee satisfaction.) It tracks the costs associated with each KPI as well. the briefing provides guidance on how to weight the six KPIs to create a portfolio-wide “sustainability index” and benchmark performance.
the dashboard presented here can be implemented as is, modified to suit enterprise needs, or used to inform discussions with third party software vendors. appendix B includes a list of third party sustainability dashboard software for executives seeking qualified partners for more advanced dashboard technology. SR Inc is strictly vendor-neutral and our selection of these vendors does not in any way indicate our endorsement of their product or offering.
Step 1: Select Key Performance Indicators
Executives select appropriate sustainability KPIs to ensure effectiveness and usefulness of the dashboard. table 1 shows the six KPIs and the corresponding units used in the template dashboard. alternative units for non-office commercial space are included in appendix a. For more information on selecting KPIs, see SR Inc Report Benchmarking Real Estate Portfolio Sustainability, 2011 and SR Inc guidebook for Sustainable Real Estate, 2012.
Key Performance Indicator units Costs
Energy kBtu/sq.ft $/sq.ft
Water gal/sq.ft $/sq.ft
Waste lbs/sq.ft $/sq.ft
Space utilization sq.ft/FtE $/sq.ft
ghg Emissions lbs/sq.ft $/sq.ft
Workplace Quality:-Indoor air Quality-Employee Satisfaction
Parts per million, PM2.5Survey
$ (salaries plus benefits) / sq.ft
note: See appendix a for alternative units for each KPI, including units for non-office space.
Introduction
dashboard Implementation
table 1. units for six key performance indicators for
commercial real estate.

Page 4SuStaInaBlE REal EStatE RoundtaBlE© 2012 Sustainability Roundtable, Inc. Confidential – For use in connection with SR Inc Services only.
REal EStatE SuStaInaBIlIty daShBoaRdS
Figure 1 is a summary display of all the charts by KPI within the template dashboard. this display allows executives to compare multiple metrics for each site.
Step 2: Compare Site Performance to Portfolio
Executives compare the performance of an individual site in terms of the six KPIs to the low, average, and high performance scores in the portfolio. Sites are compared to those with the same uses – eg. offices are compared with other offices. Figure 2 below is a series of charts that illustrate the comparison of an individual site performance to portfolio performance in terms of the six sustainability KPIs. External benchmarks, when available, are included as well. these typically indicate the average performance of a similar site size and type in that geographic location, ie. a 50th percentile site.
Figure 1. ‘at a glance’ view of site performance by KPI.
Source: SR Inc. analysis.
0.00
1.00
2.00
3.00
4.00
0.00
100.00
200.00
300.00
B F G A H C E D
$/sq
. ft
kBtu
/sq.
ft
Energy Usage and Cost
Usage/sq. ft Cost/sq. ft
-
20
40
60
80
100
Base Year(2011)
2012
Site Sustainability Index vs Portfolio
Workplace Quality
GHG Emissions
Space Utilization
Waste
Water
Energy
Low
AverageHigh
1852013 Target
150
0.0
50.0
100.0
150.0
200.0
250.0
300.0
Site Portfolio
Ener
gy In
tens
ity (k
Btu/
sq. f
t)
Energy Usage vs Portfolio
*National Benchmark

Page 5SuStaInaBlE REal EStatE RoundtaBlE© 2012 Sustainability Roundtable, Inc. Confidential – For use in connection with SR Inc Services only.
REal EStatE SuStaInaBIlIty daShBoaRdS
Figure 2. Site performance compared to portfolio performance in terms of the six sustainability KPIs. Source: SR Inc analysis.
Low
Average
High
2013 Target25
26
22
24
26
28
30
32
Site Portfolio
Was
te In
tens
ity (l
bs/s
q. ft
)
Waste Usage vs Portfolio
*National Benchmark
Low
Average
High
2013 Target20 18
0.0
5.0
10.0
15.0
20.0
25.0
30.0
Site Portfolio
Wat
er In
tens
ity (g
al/s
q. ft
)
Water Usage vs Portfolio
*National Benchmark
Low
AverageHigh
1852013 Target
150
0.0
50.0
100.0
150.0
200.0
250.0
300.0
Site Portfolio
Ener
gy In
tens
ity (k
Btu/
sq. f
t)
Energy Usage vs Portfolio
*National Benchmark
Low
Average
High
2013 Target2.5
$-
$1.00
$2.00
$3.00
$4.00
Site Portfolio
Ener
gy C
ost (
$/sq
.ft)
Energy Cost vs Portfolio
Low
Average
High
2013 Target0.2
$-
$0.05
$0.10
$0.15
$0.20
$0.25
$0.30
Site Portfolio
Wat
er C
ost (
$/sq
. ft)
Water Cost vs Portfolio
Low
Average
High
2013 Target2.1
$1.60 $1.70 $1.80 $1.90 $2.00 $2.10 $2.20 $2.30
Site Portfolio
Was
te C
ost (
$/sq
.ft)
Waste Cost vs Portfolio

Page 6SuStaInaBlE REal EStatE RoundtaBlE© 2012 Sustainability Roundtable, Inc. Confidential – For use in connection with SR Inc Services only.
REal EStatE SuStaInaBIlIty daShBoaRdS
Low
Average
High
2013 Target2.5
2.5
0.00.51.01.52.02.53.03.5
Site Portfolio
Surv
ey
Employee Satisfaction vs Portfolio
*National Benchmark
Low
Average
High
2013 Target200
$-
$100.00
$200.00
$300.00
$400.00
Site Portfolio
Wor
kpla
ce C
ost (
$/sq
.ft)
Workplace Quality Cost vs Portfolio
Low
AverageHigh2013 Target
1415
0.0
5.0
10.0
15.0
20.0
Site Portfolio
IAQ
(ppm
)
Indoor Air Quality vs Portfolio
*National Benchmark
Low
Average
High
2013 Target15 15
0.0
5.0
10.0
15.0
20.0
25.0
30.0
Site Portfolio
GHG
Em
issi
ons
(lbs/
sq. f
t)
GHG Emissions vs Portfolio
*National Benchmark
Low
Average
High
2013 Target200 200
0
50
100
150
200
250
300
Site Portfolio
Spac
e U
tiliz
atio
n (s
q. ft
/FTE
)
Space Utilization vs Portfolio
*National Benchmark
Low
Average
High
2013 Target36
$33.00 $34.00 $35.00 $36.00 $37.00 $38.00 $39.00 $40.00 $41.00
Site Portfolio
Spac
e U
tiliz
atio
n ($
/sq.
ft)
Space Utilization Cost vs Portfolio
Low
AverageHigh
2013 Target0.001
$-
$0.001
$0.001
$0.002
$0.002
Site Portfolio
GHG
Em
issi
ons
($/s
q. ft
)
GHG Emissions Cost vs Portfolio

Page 7SuStaInaBlE REal EStatE RoundtaBlE© 2012 Sustainability Roundtable, Inc. Confidential – For use in connection with SR Inc Services only.
REal EStatE SuStaInaBIlIty daShBoaRdS
Executives also compare individual sites within the portfolio in terms of total usage (energy, water, waste, space utilization), emissions, or workplace quality, and cost (see Figure 3 below). Sites with high cost and high usage represent opportunities for improvement. By ranking the portfolio from lowest to highest cost per square foot, executives can compare and decide where the most opportunity for improvement lies. For instance, sites with high cost but low usage represent opportunities for cost savings (see Figure 4 below).
Figure 3. 12 month intensity and cost for four KPIs.
Source: SR Inc analysis.
0.00
1.00
2.00
3.00
4.00
-
5.0
10.0
15.0
20.0
25.0
Jan Feb Mar Apr May Jun Jul Aug Sep Oct Nov Dec
Ener
gy C
ost
($/s
q.ft
)
Ener
gy In
tens
ity
(kB
tu/s
q.ft
)
12 Month Energy Intensity and Cost
Energy Use (kBTU) Energy Cost
0.000
0.010
0.020
0.030
0.040
0.00.51.01.52.02.53.0
Jan Feb Mar Apr May Jun Jul Aug Sep Oct Nov Dec
Wat
er C
ost (
$/sq
.ft)
Wat
er In
tens
ity
(gal
/sq.
ft)
12 Month Water Intensity and Cost
Water Use per Sq. Ft Cost per Sq. Ft
0.00
0.05
0.10
0.15
0.20
0.25
0.000.501.001.502.002.503.00
Jan Feb Mar Apr May Jun Jul Aug Sep Oct Nov Dec
Was
te C
ost
($/s
q.ft
)
Was
te In
tens
ity
(lbs/
sq.f
t)
12 Month Waste Intensity and Cost
Waste (lbs) Waste Cost
$-
$2.00
$4.00
$6.00
$8.00
0.00
0.05
0.10
0.15
0.20
0.25
Jan Feb Mar Apr May Jun Jul Aug Sep Oct Nov Dec
GH
G E
mis
sion
s Co
st($
)
GH
G E
mis
sion
Inte
nsit
y (l
bs/s
q.ft
)
12 Month GHG Emissions and Cost
GHG Emissions (lbs) GHG Emissions Cost

Page 8SuStaInaBlE REal EStatE RoundtaBlE© 2012 Sustainability Roundtable, Inc. Confidential – For use in connection with SR Inc Services only.
REal EStatE SuStaInaBIlIty daShBoaRdS
Figure 4. Portfolio-wide KPI use and cost Charts.
Source: SR Inc analysis.
1.80
1.90
2.00
2.10
2.20
2.30
22.00
24.00
26.00
28.00
30.00
32.00
F G H E D C B A
$/sq
. ft
lbs/
sq. f
t
Waste Usage and Cost
Usage/sq. ft Average Use Cost/sq. ft
35.0036.0037.0038.0039.0040.0041.00
0.00
100.00
200.00
300.00
400.00
E D A H F B G C
$/sq
. ft
Sq. f
t/FT
E
Space Utilization and Cost
Sq. ft/ FTE Average Use Cost/sq. ft
0.00
100.00
200.00
300.00
400.00
0.00
5.00
10.00
15.00
20.00
C E A G F B D H
$/sq
. ft
PPM
Indoor Air Quality
Air Quality Average IAQ Cost/sq. ft

Page 9SuStaInaBlE REal EStatE RoundtaBlE© 2012 Sustainability Roundtable, Inc. Confidential – For use in connection with SR Inc Services only.
REal EStatE SuStaInaBIlIty daShBoaRdS
Step 3: Create Sustainability Index
one of the challenges executives face is determining which sustainability KPIs matter more at each site based on local context. For instance, water will be extremely important in water-scarce areas such as India or the united arab Emirates. on the other hand, in certain areas in China indoor air quality may take on increased importance as a result of high levels of air pollution. Executives find that reporting a single, weighted ‘sustainability index’ that reflects the relative importance of the six KPIs is most effective when deciding where to focus efforts to reduce environmental impacts and costs across the portfolio. there are five steps, described below, to create such an index: establishing a weighting, determining the baseline, assembling the index, tracking performance over time, and setting targets.
1. Establish Weighting Factor
the six KPIs need to be weighted so that they can be incorporated in the index. the most robust method of weighting KPIs is by cost as this reflects the relative impact of a change in use or cost associated with each KPI. For example, the cost of energy per square foot is usually higher than the cost of waste management. therefore, a percentage change in energy consumption should impact the index more than a percentage reduction in waste. the actual weight by cost is unique to each company’s portfolio and risk profile (see Figure 5).
Figure 5. Weights by KPI in template dashboard.
Source: SR Inc analysis. 1.0%0.1% 0.7%
12.1%
0.0%
86.2%
Weights by KPI
Energy
Water
Waste
Space Utilization
GHG Emissions
Workplace Quality
KPIs Percentages
Energy 0.96%
Water 0.07%Waste 0.66%
Space Utilization 12.15%GHG Emissions 0.0004%
Workplace Quality 86.17%

Page 10SuStaInaBlE REal EStatE RoundtaBlE© 2012 Sustainability Roundtable, Inc. Confidential – For use in connection with SR Inc Services only.
REal EStatE SuStaInaBIlIty daShBoaRdS
2. Establish the Baseline
the baseline for each KPI must be established to enable comparisons (at the site and portfolio-level) over time. the base year is typically the earliest year for which comprehensive performance and cost data are available for major sites in the portfolio. the baseline for each KPI for each site is the total in site performance units (eg. energy intensity in kWh/sq.ft and cost in $/sq.ft) for the year. the baseline for each KPI in the Sustainability Index is the total in performance units (eg. kWh/sq.ft and $/sq.ft for energy) for the portfolio for the year.
3. Calculate the Index
the Sustainability Index combines scores for each KPI into a single number to facilitate comparison of the portfolio over time. the Index is weighted by the relative cost of each KPI (see weights in figure 5, above), as well as by the relative size (area) of each site in the portfolio. the methodology described below shows how to calculate the weighted value of a KPI and how to calculate the Sustainability Index.
name of Variable abbreviation
Sustainability Index SI
Current year Cy
Base year By
Energy Weight Factor EWF
Space utilization Weight Factor SuSF
Workplace Quality Weight Factor WQWF
Site area Weight SaW
Energy Subcomponent Energyx where x is the name of the site
Portfolio Energy Component E
Portfolio Water Component Wat
Portfolio Waste Component Was
Portfolio Space utilization Component Su
Portfolio ghg Emissions Component ghg
Portfolio Workplace Quality Component WQ
table 2. Variables used in Sustainability Index
calculations.
Source: SR Inc analysis.

Page 11SuStaInaBlE REal EStatE RoundtaBlE© 2012 Sustainability Roundtable, Inc. Confidential – For use in connection with SR Inc Services only.
REal EStatE SuStaInaBIlIty daShBoaRdS
a: Calculate the Weight Factor
1. Energy Weight Factor (EWF)
Cy Portfolio-Wide Energy Cost = $1,100,000Cy total Cost for all KPIs = $113,000,000
the energy weight factor (EWF) is the percent of total costs that portfolio-wide energy cost makes up. this number is multiplied by 100 to obtain the percentage.
EWF = (Energy Cost ÷ total Cost) * 100 = ($ 1,100,000 ÷ $ 113,000,000) * 100 = 1 %
Energy has a weight factor of 1%, which means it comprises 1% of the Sustainability Index.
the weight factor for water, waste, and ghg emissions may be calculated in an analogous manner.
2. Space utilization Weight Factor (SuWF)
Space utilization for commercial office space is a measure of how efficiently space is used in the office. units used for this KPI are sq.ft/ FtE. as many companies cannot accurately determine the exact FtE number, they can estimate this number by taking into account that on average, office space is occupied only approximately 50% at all times.1
FtE = total number of Employees * average Space utilization = total number of Employees * 50%
Space utilization cost is based upon rent costs at the site. the Space utilization Weight Factor is thus the percentage of total cost of total rent across the portfolio.
SuWF = (total Rent ÷ total Cost) * 100 = ($ 98,000,000 ÷ $ 113,000,000) * 100
= 87 %
1 SR Inc Report Integrated alternative Workplace Strategies (aWS), 2011.

Page 12SuStaInaBlE REal EStatE RoundtaBlE© 2012 Sustainability Roundtable, Inc. Confidential – For use in connection with SR Inc Services only.
REal EStatE SuStaInaBIlIty daShBoaRdS
3. Workplace Quality Weight Factor (WQWF)
In order to reflect the impact that indoor air quality and employee satisfaction have on the workplace, the two KPIs are combined into a single master KPI - Workplace Quality Score (WQS) - in a three-step process.
3-1 Calculate Employee Satisfaction Score (ESS)
average Employee Satisfaction (aES) based on survey results = 2.5
the Employee Satisfaction Score (ESS) is the percent of employees who are not entirely satisfied with the quality of their workspace. aES is the actual level of dissatisfaction. this result is divided by 4 (the maximum level of dissatisfaction), and then multiplied by 100 to obtain a percentage.
ESS = (aES ÷ 4 ) * 100
= (2.5 ÷ 4 ) * 100 = 62.5%
3-2 Measure Indoor air Quality (IaQ)
IaQ = 15 PPM
Measuring the concentrations of dangerous particulate matter (ie. smaller than 2.5 microns, as defined by the EPas 2006 PM2.5 standard) is one proxy for overall air quality. the annual fine particle standard is 15 PPM.
3-3 Calculate Workplace Quality Score (WQS)
the Workplace Quality Score is the average of the two components, i.e. employee satisfaction and IaQ.
WQS = (ESS + IaQ) ÷ 2 = (62.5 + 15 PPM) ÷ 2 = 38.7
Workplace quality costs are based upon total salaries of all employees, including benefits. Salaries are then normalized by square footage.
WQWF = (total Salaries ÷ total Cost) * 100 = ($ 98,000,000 ÷ $ 113,000,000) * 100 = 87 %
Page 13SuStaInaBlE REal EStatE RoundtaBlE© 2012 Sustainability Roundtable, Inc. Confidential – For use in connection with SR Inc Services only.
REal EStatE SuStaInaBIlIty daShBoaRdS
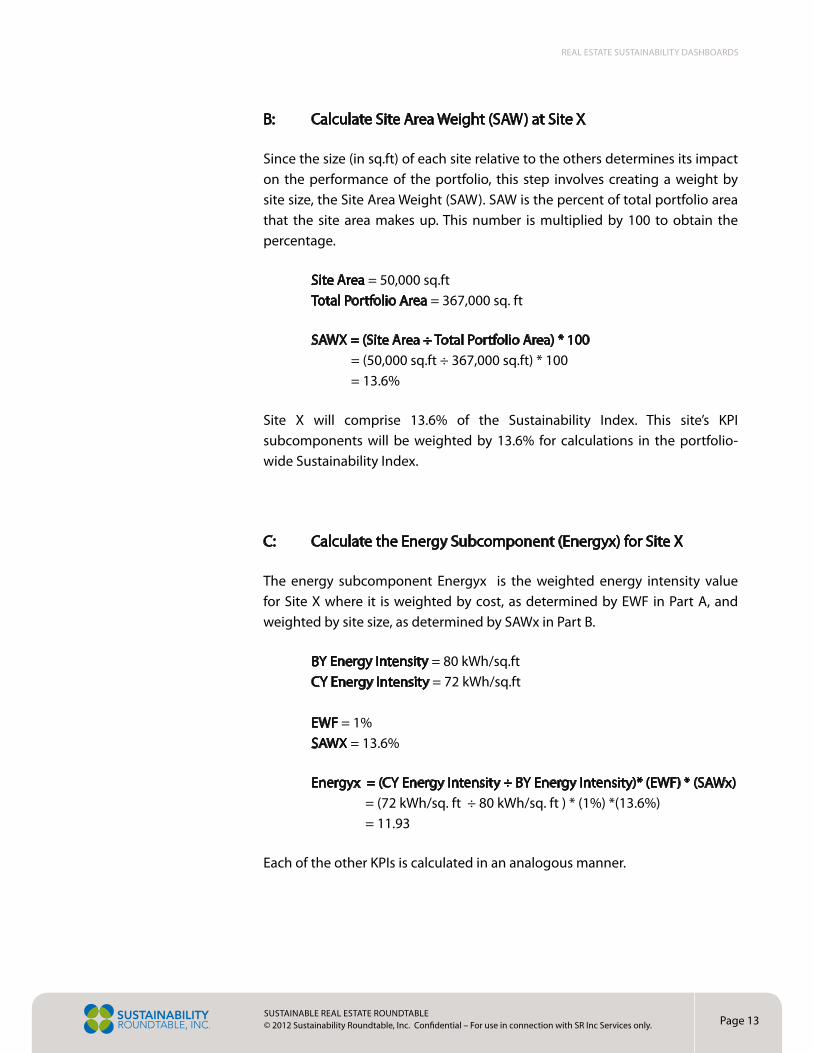
B: Calculate Site area Weight (SaW) at Site x
Since the size (in sq.ft) of each site relative to the others determines its impact on the performance of the portfolio, this step involves creating a weight by site size, the Site area Weight (SaW). SaW is the percent of total portfolio area that the site area makes up. this number is multiplied by 100 to obtain the percentage.
Site area = 50,000 sq.ft total Portfolio area = 367,000 sq. ft
SaWx = (Site area ÷ total Portfolio area) * 100 = (50,000 sq.ft ÷ 367,000 sq.ft) * 100 = 13.6%
Site x will comprise 13.6% of the Sustainability Index. this site’s KPI subcomponents will be weighted by 13.6% for calculations in the portfolio-wide Sustainability Index.
C: Calculate the Energy Subcomponent (Energyx) for Site x
the energy subcomponent Energyx is the weighted energy intensity value for Site x where it is weighted by cost, as determined by EWF in Part a, and weighted by site size, as determined by SaWx in Part B.
By Energy Intensity = 80 kWh/sq.ft Cy Energy Intensity = 72 kWh/sq.ft
EWF = 1% SaWx = 13.6%
Energyx = (Cy Energy Intensity ÷ By Energy Intensity)* (EWF) * (SaWx) = (72 kWh/sq. ft ÷ 80 kWh/sq. ft ) * (1%) *(13.6%) = 11.93
Each of the other KPIs is calculated in an analogous manner.
Page 14SuStaInaBlE REal EStatE RoundtaBlE© 2012 Sustainability Roundtable, Inc. Confidential – For use in connection with SR Inc Services only.
REal EStatE SuStaInaBIlIty daShBoaRdS
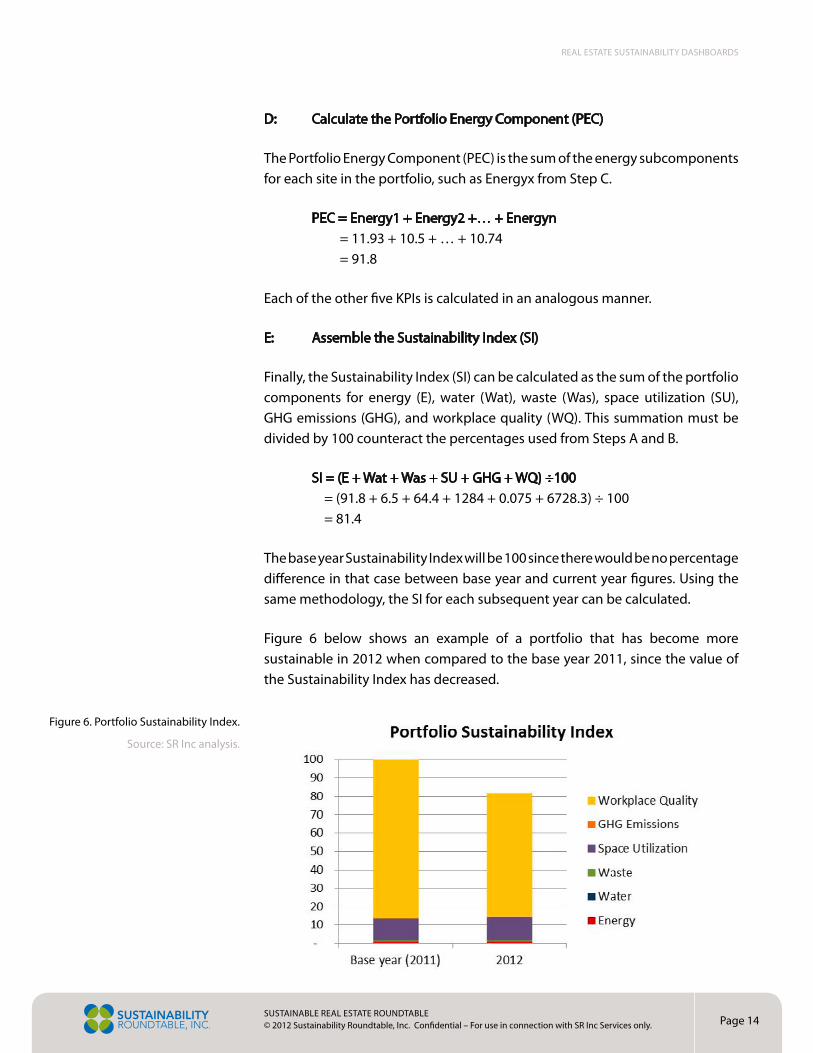
d: Calculate the Portfolio Energy Component (PEC)
the Portfolio Energy Component (PEC) is the sum of the energy subcomponents for each site in the portfolio, such as Energyx from Step C.
PEC = Energy1 + Energy2 +… + Energyn = 11.93 + 10.5 + … + 10.74 = 91.8
Each of the other five KPIs is calculated in an analogous manner.
E: assemble the Sustainability Index (SI)
Finally, the Sustainability Index (SI) can be calculated as the sum of the portfolio components for energy (E), water (Wat), waste (Was), space utilization (Su), ghg emissions (ghg), and workplace quality (WQ). this summation must be divided by 100 counteract the percentages used from Steps a and B.
SI = (E + Wat + Was + Su + ghg + WQ) ÷100 = (91.8 + 6.5 + 64.4 + 1284 + 0.075 + 6728.3) ÷ 100 = 81.4
the base year Sustainability Index will be 100 since there would be no percentage difference in that case between base year and current year figures. using the same methodology, the SI for each subsequent year can be calculated.
Figure 6 below shows an example of a portfolio that has become more sustainable in 2012 when compared to the base year 2011, since the value of the Sustainability Index has decreased.
Figure 6. Portfolio Sustainability Index.
Source: SR Inc analysis.

Page 15SuStaInaBlE REal EStatE RoundtaBlE© 2012 Sustainability Roundtable, Inc. Confidential – For use in connection with SR Inc Services only.
REal EStatE SuStaInaBIlIty daShBoaRdS
Step 4: track Site and Portfolio Performance over time
leading companies track performance of sites and the portfolio as a whole over time, and compare current performance to benchmarks as well as averages for the portfolio.
Figure 7. KPI use and cost for one site over a three-year period.
Source: SR Inc analysis.
Figure 8. average KPI use and cost portfolio-wide over a three year
period.
Source: SR Inc analysis.
00.511.522.533.544.5
00.5
11.5
22.5
33.5
44.5
2010 2011 2012
Ener
gy C
ost
($/s
q.ft
)
Ener
gy In
tens
ity
(kB
tu/s
q.ft
)
Site A: Energy Use and Cost over Time
Year Cost
00.511.522.533.54
0
50
100
150
200
250
2010 2011 2012
Ener
gy C
ost
($/s
q.ft
)
Ener
gy In
tens
ity
(kB
tu/s
q.ft
)
Portfolio: Energy Use and Cost over Time
Use Cost

Page 16SuStaInaBlE REal EStatE RoundtaBlE© 2012 Sustainability Roundtable, Inc. Confidential – For use in connection with SR Inc Services only.
REal EStatE SuStaInaBIlIty daShBoaRdS
Step 5: Improve Performance by Setting targets
leading companies set targets to improve performance. targets are based on many considerations such as comparisons with peers and sector leaders, benchmarks, regulations that the company must comply with, and whether or not the company wants to be a leader. a well-defined energy target consists of three components: 1) the baseline: the measure over which performance must improve; 2) the milestone: the deadline for improvement; 3) the increment: the relative improvement. an example of a well-defined target is: “By 2015, reduce energy use (measured in kWh per sf ) across the entire portfolio by 15% compared to the 2010 baseline”.
Companies can set stretch targets, cascaded down to business units or individual facilities, to challenge staff to identify new opportunities and apply resources in innovative ways to achieve the targets. the actual target for each facility must be adjusted based on its potential for reduction, as revealed in the benchmarking process.
Conservative targets follow a bottom-up approach based on a historic precedent and energy audits. Such targets are not cascaded down, but exist already at the facility level, as they have been derived from what has been determined as feasible.
For detailed guidance on energy targets, see SRER Member Briefing Setting Energy Reduction targets, 2012.
SR Inc created this report and released it to Member-Clients in august 2012.
Member-Clients should contact SR Inc with any questions or comments. Member-Clients who have sustainability dashboards best practices that they wish to share with others are encouraged to do so for inclusion in future updates of this briefing.
One Broadway, 14th FloorCambridge, MA 02142 617.682.3632 www.sustainround.com

Page 17SuStaInaBlE REal EStatE RoundtaBlE© 2012 Sustainability Roundtable, Inc. Confidential – For use in connection with SR Inc Services only.
REal EStatE SuStaInaBIlIty daShBoaRdS
appendix a: Selecting Key Performance Indicators
Selecting relevant key performance indicators (KPIs) is an important first step in ensuring effective benchmarking and consequently, usefulness of dashboards. Sustainability KPIs should be measured in absolute terms to measure the magnitude of usage or impact. they should also be measured in terms of intensity by normalizing the data (by area, full-time employees (FtE), revenue, etc.) to measure the intensity of usage or impact. Costs should also be measured in absolute terms and normalized by the same denominator as its corresponding KPI.
alternative units for non-office commercial space are included in table x below. For more information on selecting KPIs, see SR Inc Report Benchmarking Real Estate Portfolio Sustainability, 2011 and SR Inc guidebook for Sustainable Real Estate, 2012.
Key Performance Indicator
Selected units* Costs alternative units
Energy kBtu/sq. ft $/sq.ft kWh/sq. ft, kWh/m2
Water gal/sq. ft $/sq.ft gal/FtE, liters/FtE, liters/m2
Waste lbs/sq. ft $/sq.ft tons/sq. ft, lbs/year, kg/m2, kg/FtE, kg/
year
Space utilization sq. ft/FtE $/sq.ft m2/FtE/workstation, space/
workstation
ghg Emissions lbs/sq. ft $/sq.ft lbs/FtE, lbs/year, kg/m2, kg/FtE, kg/
year
Workplace Quality:-Indoor air Quality
-Employee Satisfaction
Parts per million, PM2.5
Survey
$ (salaries plus benefits) / sq.ft
*the units in this column are the ones used for the calculations and graphs in this briefing.
table 3. units for Key Performance Indicators (KPIs).
Source: SR Inc research.

Page 18SuStaInaBlE REal EStatE RoundtaBlE© 2012 Sustainability Roundtable, Inc. Confidential – For use in connection with SR Inc Services only.
REal EStatE SuStaInaBIlIty daShBoaRdS
Energy
Energy includes electricity, natural gas, oil, and renewable energy used in the portfolio. For comparison purposes, energy measurements in kWh, therms, and various other measures are converted into kBtu for use in portfolio KPIs including energy use intensity (EuI measured in kBtu per unit area) and energy cost (cost per unit area).
Water
Water costs include cost of water supply, wastewater treatment, municipal reuse water, etc. Water performance metrics include total water consumption per year in gallons, and total cost of water per annum. Water use intensity is measured by total water consumption per year in gallons per square foot. Water cost is measured in cost per square foot.
Waste
Waste costs include waste hauling, recycling, hazardous waste, etc. Measurement can include aggregate solid waste produced in pounds of waste per measure of time (day, month, year) by site or portfolio. Waste intensity is measured by pounds of waste per square foot, and waste costs are measured by cost per square foot.
Space utilization
KPIs for office space utilization can vary based on the data collected or the benchmark desired. a common unit of measure is sq. ft / FtE as the KPI in order to correlate rent costs for the area of the office with the number of employees. Cost for space utilization is the rent cost per square foot for the site.
ghg Emissions
the KPI includes Scope 1 and 2 emissions. Where data is available, Scope 3 emissions are also included in the KPI.
data collection measurements include total ghg emissions (converted to Co2e) in pounds or tons of Co2e emitted. For benchmarking or reporting purposes, absolute emissions are typically normalized by area (sq. ft or m2) to report in terms of intensity. a cost KPI for ghg emissions is only relevant in certain locations where emissions are directly charged a fee.
Page 19SuStaInaBlE REal EStatE RoundtaBlE© 2012 Sustainability Roundtable, Inc. Confidential – For use in connection with SR Inc Services only.
REal EStatE SuStaInaBIlIty daShBoaRdS
Workplace Quality: Indoor air Quality and Employee Satisfaction
leading executives are attentive to the link between indoor air quality (IaQ) and employee satisfaction, both of which impact productivity, and thus the overall workplace quality. Calculating a workplace quality KPI is thus the combination of an IaQ and employee satisfaction KPI.
Measuring the concentrations of dangerous particulate matter (ie. smaller than 2.5 microns, as defined by the EPas 2006 PM2.5 standard) is one proxy for overall air quality. therefore, leading executives are tracking monthly compliance with the EPa’s 2006 annual and 24 hour PM2.5 standard. the KPI is the average concentration of PM2.5 particulates over the past 12 months (for a minimum of 12 tests in 12 months where no test means non-compliance).
leading companies survey employees on their satisfaction with the quality of their workspace. a basic scale is used with scores following in parentheses: ‘Completely Satisfied (0), Somewhat Satisfied’ (1), ‘Indifferent’ (2), Somewhat dissatisfied’ (3) to ‘Completely dissatisfied’ (4). the survey is typically administered once a year, but more frequent surveys, especially before and after major renovations or relocations, are helpful.
In order to reflect the impact that indoor air quality and employee satisfaction both have on the workplace, the two categories are combined into one KPI as the Workplace Quality Score (WQS).

Page 20SuStaInaBlE REal EStatE RoundtaBlE© 2012 Sustainability Roundtable, Inc. Confidential – For use in connection with SR Inc Services only.
REal EStatE SuStaInaBIlIty daShBoaRdS
appendix B: Real Estate Sustainability dashboard Vendor Profilesthe following alphabetical list of software companies includes some of the leaders in the provision of sustainability dashboards to SR Inc Member-Clients and other companies. this list was compiled from ongoing discussion with Member-Clients and SR Inc’s prior research on enterprise energy and carbon accounting (EECa) systems.2 SR Inc’s research is strictly vendor neutral and does not endorse any of these products.
C3http://www.c3energy.com/
C3, founded in 2009 and headquartered in San Mateo, Ca, aims to enable customers to increase profitability and cash flow by optimizing their enterprise energy management strategy. C3 offers a family of software solutions to understand, optimize, and report on energy use and greenhouse gas emissions. the software features dashboards to profile and benchmark facilities, measure and verify data, and create customizable energy and emissions reports. the dashboards allow user to track energy use or emissions by facility or operation, create performance scorecards to show which sites are on target, and forecast and analyze emissions or energy reductions. In addition, C3 also provides software to capture incentives for mitigation and provides a SaaS platform to capture, store, and manage energy and emissions data across the enterprise.
Ca technologieshttp://www.ca.com/us/energy-sustainability-management.aspx
Ca technologies, Inc. (formerly Ca, Inc.), headquartered in Islandia, new york, creates software for mainframe, security/identity and access management, cloud, virtualization and automation, It management SaaS, service assurance, service and portfolio management, EcoSoftware, recovery management and data modeling, and nimsoft.
Within its energy and sustainability management solutions, Ca offers data center infrastructure management, enterprise energy and sustainability, and PC power management. data center infrastructure management can help to manage systems and services more reliably, make better use of power and cooling capacity, enhance efficiency and align the data center infrastructure to the changing needs of the business. With Ca Enterprise Energy and
2 SR Inc Report deploying Energy and Carbon accounting Software, 2011.

Page 21SuStaInaBlE REal EStatE RoundtaBlE© 2012 Sustainability Roundtable, Inc. Confidential – For use in connection with SR Inc Services only.
REal EStatE SuStaInaBIlIty daShBoaRdS
Sustainability solutions, managers automate data collection, reporting, analysis, actions, and more with proven integrations and align sustainability projects and initiatives with organizational goals. Ca’s PC Power Management solution delivers a rapid return on investment by reducing energy waste and increasing staff productivity. organizations can track desktop performance metrics and subsequently use the auditable data for corporate carbon and environmental disclosure for reporting to the CdP, ISo14001/EMaS and ISo50001 schemes.
Enablonhttp://enablon.com/home.aspx
Enablon is a leading provider of sustainability performance management software, furthering its vision of “enabling the sustainable company”. Founded in 2000, it is headquartered in Paris, France and has a north american office in Chicago. Enablon offers services for corporate responsibility, sustainable supply chain, quality, environment, health and safety (QEhS) performance, energy efficiency and carbon management risk management, internal control and audit, and corporate governance and legal management.
Enablon’s suite of products is differentiated by the ability to generate a gRI report and keep all of the data. Enablon’s software also features a library of dashboard reports that can be highly customized for different users for indicators including emissions, air quality, and utility data management. Enablon solutions are accredited and certified by the Carbon disclosure Project and the global Reporting Initiative.
harahttp://www.hara.com/
hara, founded in 2007 and headquartered in San Mateo, Ca, is a venture backed pure play firm that provides software for energy and sustainability management. the hara Energy and Sustainability System of Record (hara ESS) is a cloud-based software suite that includes modules that provide analytics for energy spend, modeling, forecasting, and budgeting for energy use, and a portfolio view for energy efficiency and sustainability projects to optimize capital and operation expenditures. the software captures data directly from the utilities. the hara dashboard is capable of tracking energy, water, waste, carbon, and other natural resource use providing insight and data for managers to improve efficiency, manage future risks, and to comply with regulatory reporting requirements.

Page 22SuStaInaBlE REal EStatE RoundtaBlE© 2012 Sustainability Roundtable, Inc. Confidential – For use in connection with SR Inc Services only.
REal EStatE SuStaInaBIlIty daShBoaRdS
IBM tRIRIgahttp://www-142.ibm.com/software/products/us/en/tririga-energy-optimization/
IBM, a multinational technology and consulting corporation, launched a Smarter Buildings initiative in 2010. headquartered in armonk, new york, IBM has created a portfolio of smarter buildings solutions that integrate with building automation software from across the industry. tRIRIga, acquired in 2011, provides an integrated software solution to combine real-time systems monitoring with facilities and event management.
IBM tRIRIga Energy optimization provides a comprehensive dashboard to address two key areas – energy and environmental management, as well as facilities management. the dashboard monitors information such as monthly peak electric demand and energy usage trends that can be tailored to different types of users or to tasks.
InFoR global Solutionshttp://www.infor.com/solutions/eam/
Infor global Solutions, headquartered in new york, is a privately held u.S. software company that specializes in enterprise software ranging from financial systems and resource planning (ERP) to supply chain and customer relationships. Infor offers deep industry-specific applications and suites to deliver a rich user experience, and flexible deployment options give customers a choice to run their businesses in the cloud, on-premises or both.
Infor recently acquired EnxSuite to complement it’s Infor10 EaM Enterprise Sustainability software platform. EnxSuite is a SaaS energy performance management (EPM) platform that provides actionable energy intelligence enabling companies to continuously plan, analyze, and manage their entire energy and sustainability footprint. users can continually monitor asset health and behavior, analyze data to detect key trends and anomalies, forecast performance issues, measure and manage their business performance against organizational energy reduction and sustainability goals, make decisions, and drive action.

Page 23SuStaInaBlE REal EStatE RoundtaBlE© 2012 Sustainability Roundtable, Inc. Confidential – For use in connection with SR Inc Services only.
REal EStatE SuStaInaBIlIty daShBoaRdS
PE Internationalhttp://www.sofi-software.com/america/ressources/solution-overview/
PE International, headquartered in Stuttgart, germany, is a sustainability software and consulting company in the fields of life cycle assessment and life cycle engineering. Its north american headquarters is in Boulder, Colorado. PE International offers two leading software solutions, the gaBi software and database for product sustainability and the SoFi software for corporate sustainability.
SoFi is an enterprise sustainability performance software platform that delivers the insights to realize the potential of sustainable business. unique performance analytics, intelligent diagnostics and planning tools coupled with sustainability content databases enable its users to uncover performance gaps and new opportunities.
SaPhttp://www.sap.com/index.epx
SaP is a multinational software corporation headquartered in germany. the main north american offices are in newtown Square, Pa. the company’s best known software products are its enterprise resource planning application (SaP ERP), its enterprise data warehouse solution - SaP Business Warehouse, SaP Businessobjects software, and most recently, Sybase mobile products and in-memory computing appliance SaP hana.
the SaP Sustainability Performance Management analytic application helps companies track and communicate sustainability performance, set goals and objectives, and target business improvement opportunities. It features:
• Centralized management of sustainability data, reporting frameworks, and KPIs
• guided processes to define, prioritize, assign, and track sustainability initiatives
• Functions to analyze, communicate, and execute strategies
• Integration with business data, operational information, and performance management processes

Page 24SuStaInaBlE REal EStatE RoundtaBlE© 2012 Sustainability Roundtable, Inc. Confidential – For use in connection with SR Inc Services only.
REal EStatE SuStaInaBIlIty daShBoaRdS
Summit Energyhttp://www.summitenergy.com/enterprise/services/online-reporting
Summit Energy, a subsidiary of Schneider Electric, provides energy management and sustainability services in the areas of energy procurement, sustainability consulting, energy efficiency, energy risk management, and rate analysis and demand response services. Summit was founded in 1991 and is headquartered in louisville, Kentucky.
Summit’s online sustainability and energy management platform is the dashboardView (dV). dV, a software-as-a-managed-service (SaaMS) collects data and generates reports and summaries to inform its clients of energy and sustainability performance. dV focuses on providing reports on energy spend, managing projects and scenarios, tracking performance, monitoring the market, and collecting and reporting data for other KPIs such as ghg emissions, water, and waste. dV is highly customizable and has different functionalities based upon different client needs. Summit Energy is an official Carbon disclosure Project Consultancy Partner.
SuMo Cloudappshttp://www.cloudapps.com/products/
Cloudapps, based in united Kingdom and established in 2009, is a leading provider in sustainability software. Cloudapps Sustainability Suite is complete cloud-based software for integrated sustainability management and employee engagement on enterprise level. Companies can measure and disclose their environmental performance; align the entire organization with its sustainability goals; engage every employee; deliver against sustainability programs; and communicate achievements in real time.
SuMo, (‘Sustainability Momentum’), is its employee engagement module and is used by Visa, Salesforce, yale, tMobile, and orange. SuMo links “the sustainability efforts of employees on the front-line, or ’bottom-up’ [actions], with ‘top-down’ commitments made by management.” SuMo works by scoring each employee’s behavior at the workplace against individual targets derived from company-wide goals; spurring competition by ranking based on relative performance; and encouraging employees to share, discuss and vote on new ideas via a web-based communication portal. SuMo 2.0 (to be released in 2012) is expected to incorporate social media and ‘gamification’ elements.