Embed Size (px)
Citation preview

University of Kentucky University of Kentucky
UKnowledge UKnowledge
University of Kentucky Master's Theses Graduate School
2010
SUSTAINABLE RESOURCE UTILIZATION IN MANUFACTURING OF SUSTAINABLE RESOURCE UTILIZATION IN MANUFACTURING OF
PRINTED CIRCUIT BOARD ASSEMBLY: EXERGY ANALYSIS OF THE PRINTED CIRCUIT BOARD ASSEMBLY: EXERGY ANALYSIS OF THE
PROCESS PROCESS
Subramaniam Saiganesh University of Kentucky, [email protected]
Right click to open a feedback form in a new tab to let us know how this document benefits you. Right click to open a feedback form in a new tab to let us know how this document benefits you.
Recommended Citation Recommended Citation Saiganesh, Subramaniam, "SUSTAINABLE RESOURCE UTILIZATION IN MANUFACTURING OF PRINTED CIRCUIT BOARD ASSEMBLY: EXERGY ANALYSIS OF THE PROCESS" (2010). University of Kentucky Master's Theses. 34. https://uknowledge.uky.edu/gradschool_theses/34
This Thesis is brought to you for free and open access by the Graduate School at UKnowledge. It has been accepted for inclusion in University of Kentucky Master's Theses by an authorized administrator of UKnowledge. For more information, please contact [email protected].

ABSTRACT OF THE THESIS
SUSTAINABLE RESOURCE UTILIZATION IN MANUFACTURING OF PRINTED CIRCUIT BOARD
ASSEMBLY: EXERGY ANALYSIS OF THE PROCESS.
Engineering for sustainable development requires prudent utilization of resources under economic, environmental and societal constraints. Resource utilization must follow a holistic approach. This brings in a need for comprehensive metrics which are simple, standard and universal. Thermodynamics may offer a metric that focuses on both quality and quantity of energy resources which may carry information to be combined with other metrics. This metric may be a thermodynamic property called exergy or available energy, which provides a better insight into resource use in both energy and non-energy producing systems. This thesis is devoted to a study of the exergy concept in manufacturing.
A high volume PCB assembly, manufactured in a state of the art soldering facility is chosen for the study. Various mass and energy resources flowing through the production line were quantified in terms of exergy. On the basis of exergy content and exergy utilization in the production process, the sustainability in terms of resources use is discussed. An early version of this approach was presented at the International Symposium on Sustainable Systems and Technologies, IEEE, Washington DC, in May 2010. KEYWORDS: Exergy Analysis, PCB Manufacturing, Sustainability Assessment, Soldering process sustainability,
Subramaniam Saiganesh 12/02/2010

SUSTAINABLE RESOURCE UTILIZATION IN MANUFACTURING OF PRINTED CIRCUIT BOARD
ASSEMBLY: EXERGY ANALYSIS OF THE PROCESS.
By
Subramaniam Saiganesh
Dr. Dusan P. Sekulic (Director of Thesis)
Dr. James M. McDonough (Director of Graduate Studies)
2nd December, 2010

RULES FOR THE USE OF THESES
Unpublished theses submitted for the Master’s degree and deposited in the University of
Kentucky Library are as a rule open for inspection, but are to be used only with due regard to
the rights of the authors. Bibliographical references may be noted, but quotations or
summaries of parts may be published only with the permission of the author, and with the
usual scholarly acknowledgments.
Extensive copping or publication of the thesis in whole or in part also requires the consent of
the Dean of the Graduate school of the University of Kentucky.
A library that borrows this thesis for use by its patrons is expected to secure the signature of
each user.
Name Date
___________________________________________________________
___________________________________________________________
___________________________________________________________
___________________________________________________________
___________________________________________________________
___________________________________________________________
___________________________________________________________
________________________________________________________

THESIS
Subramaniam Saiganesh
The Graduate School
University of Kentucky
2010

SUSTAINABLE RESOURCE UTILIZATION IN MANUFACTURING OF PRINTED CIRCUIT BOARD ASSEMBLY: EXERGY ANALYSIS OF THE PROCESS
______________________________
THESIS ______________________________
A thesis submitted in partial fulfillment of the
requirements for the degree of Master of Science in Mechanical Engineering in the College of Engineering
at the University of Kentucky
By
Subramaniam Saiganesh
Lexington, Kentucky
Director: Dr. Dusan P. Sekulic,
Professor of Mechanical Engineering
Lexington, Kentucky
2010
Copyright © Subramaniam Saiganesh, 2010

For Peace and Prosperity of Mankind…
Anbae Sivam (Love is GOD)

iii
ACKNOWLEDGEMENTS
First and foremost, I sincerely thank my advisor Dr. Dusan P.Sekulic, Professor,
University of Kentucky, for his excellent guidance and generous assistance in the course
of completing my thesis. All through my association with him, his valuable inputs and
timely suggestions have helped me think in new dimensions, which enhanced the
learning experience.
I am very thankful to Dr. I.S.Jawahir, Professor and Director of Institute of Sustainable
Manufacturing, University of Kentucky. He was not only instrumental in promoting my
interests on Sustainability concepts, but also provided many valuable guidance and
encouragements to me throughout this work. I also thank Mr. Tom Henninger and Mr.
Bill Young, CRMS, University of Kentucky, for offering their valuable assistance and
guidance during the data collection phase.
I take this opportunity to thank my parents, Mr. and Mrs. Saiganesh and my brother Mr.
Shivshankar Saiganesh, for affording all necessary resources and ample affections, which
propels me to pursue this gifted life. I am extremely grateful to all my friends and
relatives for engraving golden memories during my stay in the university.
And above all, my earnest thanks and sincere prayers to the omnipresent Al-Mighty, for
herding me from inside through all bright and dark patches of my life.

iv
TABLE OF CONTENTS
ACKNOWLEDGEMENTS ............................................................................................... iii
LIST OF TABLES .............................................................................................................. vi
LIST OF FIGURES ........................................................................................................... vii
LIST OF SYMBOLS USED ............................................................................................ viii
LIST OF FILES .................................................................................................................. ix
1. INTRODUCTION TO SUSTAINABILITY ................................................................... 1
1.1 SUSTAINABLE MANUFACTURING OF PRINTED CIRCUIT BOARDS (PCB) ................................. 1
1.1.1 Resource Utilization & Sustainable Engineering ....................................................... 1
1.1.2 Need for Sustainable Engineering in PCB assembly .................................................. 4
1.1.3 Assembling of PCB by soldering process ................................................................... 9
1.2 SUSTAINABLE LIFECYCLE ...................................................................................................... 16
1.2.1 Product Lifecycle and Sustainability ........................................................................ 16
1.2.2 R-strategies for sustainable development (6R Approach) in Product Lifecycle ....... 21
1.2.3 6R approach in Life cycle of Printed Circuit Boards ................................................ 30
1.3 SUSTAINABLE RESOURCE UTILIZATION IN MANUFACTURING ............................................... 33
1.3.1 Energy and Exergy flows in Manufacturing ............................................................. 34
1.3.2 Balancing of mass, energy and exergy flows ............................................................ 38
1.3.3 Exergetic efficiencies and Significance of Exergy ................................................... 44
2. RESOURCES UTILIZED IN MANUFACTURING OF PCB ASSEMBLY ............... 47
2.1 PRINTED CIRCUIT BOARD ASSEMBLY MANUFACTURING PROCESS ........................................ 47
2.2.1 Manufacturing (Assembly) line ................................................................................ 47
2.2.2 Manufacturing (Assembling) sequence .................................................................... 48
2.2 RESOURCE FLOW MAPPING .................................................................................................... 51
2.3 ASSESSMENT OF MASS AND ENERGY FLOWS .......................................................................... 54
2.3.1 Mass flows ................................................................................................................ 54
2.3.2 Enthalpy Flows ......................................................................................................... 58
2.3.3 Electrical Work Flow ................................................................................................ 61

v
3. EVALUATION OF RESOURCES UTILIZED ............................................................ 64
3.1 BALANCE OF ENERGY FLOWS ................................................................................................ 64
3.2 BALANCE OF EXERGY FLOWS ................................................................................................ 67
3.2.1 Heat and Work exergies ............................................................................................ 67
3.2.2 Physical and Chemical Exergies ............................................................................... 68
3.2.3 Net Exergy Balance .................................................................................................. 71
3.3 EXERGETIC EFFICIENCIES ...................................................................................................... 76
3.3.1 Net Use Efficiency .................................................................................................... 76
3.3.2 Electrical Exergy use efficiency ............................................................................... 81
4. DISCUSSION ............................................................................................................... 85
4.1 EVALUATION OF RESOURCE UTILIZATION ASPECT OF SUSTAINABILITY ................................ 85
4.1.1 Exergy based sustainability metric ........................................................................... 85
4.1.2 Limitations of Exergy metrics .................................................................................. 88
4.2 LIMITATIONS OF TRADITIONAL ENERGY INTENSIVE PRACTICES ............................................. 90
5.CONCLUSION .............................................................................................................. 93
5.1 SUMMARY .............................................................................................................................. 93
5.2 FUTURE AREAS OF INTERESTS ............................................................................................... 94
6. APPENDIX ................................................................................................................... 96
7. REFERENCES ........................................................................................................... 113
VITA ............................................................................................................................... 121

vi
LIST OF TABLES
1.1 - Toxic Characteristic limits of hazardous chemicals in PCB assembly 6
2.1 - Mass of product materials estimated by mass balance equations 55
2.2 - Enthalpies carried by the major product material flows 60
3.1 - Unaccounted energy streams in each subsystem 65
3.2 - Net Exergy flows in the PCB assembly line per unit PCB Assembly 74

vii
LIST OF FIGURES
1.1 - Resource associations in product lifecycle 16
1.2 - R-strategies for sustainable lifecycle of a typical product 24
1.3 - R strategies for sustainable resource utilization in lifecycle of PCB Assy. 32
2.1 - Manufacturing (Assembly) sequence of PCB Assembly 49
2.2 - Resource flow map of PCB Assembly line 53
2.3 - Mass flow per unit PCB assembly 57
3.1 - Sankey representation of Energy flows per unit mass of PCB assembly 66
3.2 - Grassmann Representation of Exergy flows per unit mass of PCB Assy. 75
3.3 - Fractions of exergy lost along the PCB assembly line 76
3.4 - Comparison of Exergetic Efficiencies of the processes in the assy. line 79
3.5 - Comparative Analyzes of various exergy flows through the PCB assy. 80
3.6 - Efficiency of Electrical Exergy Utilization in PCB assembly line 83
3.7 - Electrical Exergy Consumed for various process in the assembly line 84

viii
LIST OF SYMBOLS USED
(Arranged in alphabetical order)
A - Cross-sectional Area
C - Specific heat of the material
h - Specific Enthalpy
- Total enthalpy flow rate
i - Inlet port or entry conditions
I - Current
j - Outlet port or subsystem exiting condition
k - Constituent Material or element index
- Mass flowrate
n - Subsystem index
P - Pressure
Q - Heat
T - Temperature
t - Time
s - Specific entropy
S - Total entropy
V - Voltage (electrical calculations)
- Volumetric flow rate
ν - Specific volume (in work calculations)
v - Velocity of the flow
W - Work
WE - Electrical work
- Power
ρ - Density of the material
Ф - Phase (electrical calculations)
ε - Available energy or Exergy
λ - Unaccounted energy flows
δε - Exergy loss or destroyed.

ix
LIST OF FILES
1. ETD Thesis.pdf

1
1. Introduction to Sustainability
1.1 Sustainable Manufacturing of Printed Circuit Boards (PCB)
1.1.1 Resource Utilization & Sustainable Engineering
Sustainable development is the most widely used term, which has pulled the interest
of scientific community across a wide spectrum of professions. With rapid evolution of
industrialization, the shortage of resources and need for alternate sources was
experienced in many industries like automobiles and electronics, which dominate the
lifestyle of the people. Since the energy crisis of 1970s, the necessity for energy
conservation and means to efficiently utilize the energy resources are highly prioritized
among many other engineering concerns. All these consequences lead to a compelled
thrust for sustainable development, a mandatory focus of engineering sphere in twenty
first century.
When we talk about energy conservation and utilization, understanding of current
scenario is absolutely essential to propel towards better future. Burning of fossil fuels like
coal and oil generates most of the energy requirement of the globe. They contribute about
70% of the total power generation in a developed and energy craving countries like
United States (USEIA, 2009). Burning of fossil fuels has resulted in other apprehensions
like global warming and more harmful pollution concerns. This questions the efficiency
and effectiveness of the traditional practices and prolonged lifestyles. Are the current
procedures and manufacturing techniques are really worthy to continue?
To simply illustrate that current situation, the automobiles of mid seventies and
eighties are today considered as gas-guzzlers and not any more favorite of the consumers.
Today, the market is oriented towards an economic product, which helps the communities

2
to live better (ACEEE, 2010). The entire industrial complex is clamoring for green
manufacturing where ecological imbalances are minimized during and after the end of
life of the product. But to pursue on this mission, there is a need for a metric to assess the
current situation and rectify the shortcomings. In this research work, a potential of one
such metric called exergy, which may be considered as being more realistic and unbiased,
is assessed in a manufacturing environment.
Within the manufacturing science, the product quality is defined as ability to serve
its function and fitness to use (Harvey L., 2004-9). Function is the objective of the utility
for which the product is designed. Lean manufacturing guides towards the most
economic practices mostly within the prescribed functions of the product and associated
production systems in an identified manufacturing zone (Feld, 2001). The economic
aspects under scope of lean manufacturing include cost of failure, fatigue and
reinforcements by overstocking and unwanted wastes in the manufacturing environment.
Lean manufacturing principles help in optimizing the resources and provide efficient
handling of materials within a prescribed manufacturing location. But imprints of the
resources associated with manufacturing are far stretching beyond the manufacturing
zone.
A life cycle of a product begins from extraction of the resources from the
environment. All the material and energy resources are extracted from the environment
(land, water and air) and they are processed to a required form and utilized in
manufacturing a product. This product serves it’s utility by performing the designed
functions and at the end of life is may be discarded back into the environment. All along
its life cycle, it has many interactions with the environment that include other living

3
communities of this earth. So all these interactions with the environment should be safe
and be free of threats to the livelihood of living organisms. This adds another constraint
to product and process designs, which were initially focused only on the economic aspect
of manufacturing. The trepidations of environmental hazards and societal factors are to be
addressed along with the economical aspect of the product. This idea of a holistic
development in engineering is termed as the engineering for sustainable development
(WCED, 1987).
Resource utilization is one of the key factors of engineering sustainability. The
attributes of sustainability depend on the characteristics of the resource associated and
methods of the resource usage. So the objectives of the sustainable engineering could be
ascribed towards resource utilization in manufacturing. But the extent of contribution of
this factor may vary from case to case. In other words, the sustainable engineering may
also be defined as a prudent utilization of resources for the economic, environmental and
societal benefits. But to quantify and evaluate the resource utilization during a product
lifecycle, a simple and fundamental metric is required.
In general, the laws of thermodynamics may govern all the interactions between the
resources and systems considered. By understanding the thermodynamics of resource
utilization, its use can be quantified in terms of a new concept called exergy or available
energy. In this research work, potentials of using exergy as a metric to evaluate the
manufacturing process for a sustainable development are studied on an identified Printed
Circuit Board (PCB) assembly. An early version of this approach was presented and
published in International Symposium on Sustainable Systems and Technologies, IEEE,
Washington DC, in May 2010 (Saiganesh, S. et al., 2010).

4
1.1.2 Need for Sustainable Engineering in PCB assembly
With thrust towards miniaturization of electronics, the PCBs are becoming very
essential part of all latest electronic gadgets and assemblies. With development of
semiconductor electronics, the sizes of all essential electronic components were greatly
reduced to typically few milligrams only. Printed Circuit Boards efficiently package all
electronic components of the circuit within a small space.
The PCB assembly consists of the printed wiring board which has the circuit design
imprinted. On to this circuit, the components are assembled to complete the circuit. The
construction of a printed wiring board has three major constituents. They are (1) fabric,
(2) resin and (3) metal foil. The fabric is the substrate, which holds the body together and
provides rigid support. It is usually electric grade glass fibers and paper upon which
flame-retardants are coated. Resin is a dielectric medium between the copper strip and
substrate. They are mostly thermosetting plastic. Commonly used resins include epoxies,
polyamides and polytetrafluoroethylene (PTFE) (Harper, 1994). Metal foil is the
conducting material, which is usually copper. The foil is initially clad to the board and
later etched out to make the desired circuit.
The electronic network on the circuit can include a very wide range of components,
depending on the circuit design. Common electronic circuits include resistors, capacitors,
inductors, diodes, transistors and integrated chips. Most of commercial semiconductors
are made from silicon chips. Small quantities of various metals and chemical substances
are also added. All these complex material resources help moving towards
miniaturization of electronics, but on the other side they hinder waste management and
accelerate depletion of secondary resources like process materials and energy resources.

5
In a globalized economy, the regulations enforced in one part of the world impact
the manufactured products beyond geographical boundaries. With alarming increase of
waste electrical and electronics equipments (WEEE), their material composition may
pose a great hazard at the time of disposal. Usage of various heavy metals and
synthesized chemical compounds in making of various components are the major concern
for dumping of the wastes in a landfill. The leaching properties of the heavy metals like
lead and mercury contaminate the underground water table. For example exposure to lead
can cause varied health disorders like vomiting, fatigue, convolutions, irritability, but also
a greater damage like kidney failure, coma or even death in case of small children. Lead
exposure can affect the unborn children in pregnant women (Health Canada, 2008).
Exposure to mercury causes tremors, impairing of cognitive skills etc. (US EPA, 20091).
Hence the disposed electronics components are to be considered as toxic wastes, which
are to be regulated at disposal after use.
By Resource Conservation and Recovery Act (RCRA) of US Congress, toxicity
characteristic (TC) of a material in the waste is considered as a metric to assess the
leaching phenomena of hazardous material. US Environment Protection Agency (EPA) is
the authorized body to set norms and monitor the leaching of toxic elements in the
landfills in United States. According to USA EPA, any waste, which is ignitable,
corrosive, reactive or toxic, can be considered as hazardous waste. US EPA also lists the
maximum allowed toxic characteristic for various contaminants in landfill (USEPA,
20093).
In Basel convention of 1989, PCBs are identified as carriers of hazardous elements
and compounds and therefore disposal of discarded PCB along with electronic wastes are

6
to be monitored and handled efficiently (Basel convention). The hazardous chemicals in a
typical PCB assembly include lead, cadmium, mercury, arsenic and polychlorinated and
poly-brominated biphenyls. US EPA Toxic characteristic limits for the hazardous
chemicals are listed in the table below.
Table 1.1: Toxic Characteristic limits of hazardous chemicals in PCB assembly
(USEPA, 20093)
Waste Code Chemical (Symbol) Allowed toxic characteristic
concentration (mg/L or PPM)
D004 Arsenic (As) 5.0
D006 Cadmium (Cd) 1.0
D008 Lead (Pb) 5.0
D009 Mercury 0.2
According to various studies, the lead concentration in toxic characteristic leaching
procedure (TCLP) carried out in PCB assemblies used in computer CPUs ranged about
100 to 200 mg/L (Townsend et al, 2001). It is observed that average lead leaching is
about 40 mg/l for a typical 15.8g PCB assembly used in a computer CPU. Concentration
of lead in the leachate increases with the mass of PCB assembly. These values are way
above the permitted limit of 5mg/L. The main source of lead in PCB assembly is lead
based solder used for assembling the components on the board.
With increase in usage of electronic products, the proportion of discarded electronic
goods in municipal wastes has also increased very rapidly. On an average, the WEEE
constitutes about of 8% of municipal wastes (The Economist, 2005). According to EPA
study, in 1997 a total of about three million tons of e-wastes were disposed in landfills

7
(Gable and Shireman, 2001). With swift advancement of technology and increased
enhancement of features in electronics products, there is big drop in the average life of
products. In 2005 it is estimated that the average life of CPU in PCs has reduced to two
years from initial estimates of five years in 1997 (Widmer, R., et al., 2005). This pushes
towards increased proportions of obsolete products in the wastes. According to an
estimate, in 2004 the total number of obsolete PCs across the globe is about 100 million
units.
Certain developed countries, which were aware of the environmental hazards
associated with e-wastes, initially tried to push them to the developing world like China,
India and few African nations. But Basel convention on trans-boundary movement of
hazardous wastes prohibits the movement of e-wastes from waste generating country to a
developing country and recommends the generating states to take the responsibility to
treat these wastes (Basel convention, 1989). Moreover the fast growing economies are
also competing with the developed world in resource consumption and waste generation.
It is estimated that domestic volume of e-wastes (WEEE) generated in India is at 146,000
tons and expected to grow rapidly (CII, 2006). All these factors limit the waste handling
options of the generating states. In line with these views, European Union’s WEEE
regulation of 2002, urge for extended producer responsibility and mandatory take back by
the manufacturers themselves (WEEE Directive, 2002).
Along with WEEE directive, European Union also passed the Restriction of
Hazardous substances (RoHS) directive, which prohibits and limits the usage of
hazardous substances in consumer products. The six hazardous chemical identified are
lead, mercury, cadmium, hexavalent chromium, poly-brominated biphenyl and

8
polybrominated diphenyl ether. Usage in consumer electronics is restricted to a maximum
allowed concentration is 0.1% by mass of each homogenous material which could be
separated from the assembly (RoHS directive, 2002). Similarly USEPA has identified
thirty one hazardous chemicals and compounds as priority chemicals (PCs), including
lead, mercury, biphenyls and dioxins. Productions of these chemical compounds were
annually monitored at industrial facilities and initiatives were undertaken towards
elimination of PCs in products and wastes at source by substitution, and substantial
reduction through recovery and recycling efforts (USEPA, 20093).
By these initiatives, the overall quantities of toxic substances like lead, mercury,
and cadmium in wastes are controlled. Presence of Polybrominated biphenyls and di-
phenyl ethers hinders recycling of plastics and so by controlling these elements recycling
of discarded plastics is also enhanced. All individual manufacturers were forced to make
their own material use policies and guidelines, which encourages more transparency and
accountability on the manufacturers.
With restrictions on lead usage, the emphasis for lead free soldering is very much
augmented. But lead free alternatives have their limitations in terms of energy usage and
also enforce few critical changes in the component designs. Depending on the alternate
solder composition, to improve the mechanical characteristics of the joint, component
leads are to be coated with tin or other metals. Since lead free solders need higher melting
temperature, the delicate components on the board are to be provided with heat shields.
Although these efforts increase the overall cost, since July 2006 lead free soldering is
mandatory in Europe and Japan.
These regulations and other environmental concerns haunt sustainability of PCB

9
assemblies in long run. Thereby manufacturing of PCB assemblies has drawn the focus of
engineering research communities. In the efforts reduce the resource intensity and
environmental impacts, the recycling and remanufacturing options are to be further
explored. Along with elimination of hazardous chemicals, like lead and biphenyls, the
intensity of secondary resources associated with manufacturing process like energy,
process materials etc. also to be further investigated.
1.1.3 Assembling of PCB by soldering process
The soldering is the joining technique very widely used for packaging the electronic
components on to the printed wiring boards. In this process, a low melting point solder
alloy is used to join the component terminal leads with the wiring board at desired
locations (pads). The three most popular inline soldering furnaces used in mass
production are:
1. Reflow soldering
2. Wave soldering
3. Pot / Selective soldering.
Reflow soldering
In reflow soldering, the solder along with the flux are taken in the form of paste,
which is applied on the pads. Then the surface mountable electronic components are
stacked over pads. In conventional reflow ovens, this entire unit is heated to the melting
point of the solder through preheating and flux activation stages. Flux helps to prepare
the surface and enable better soldering at the joints. Entire heating is carried in a nitrogen
gas atmosphere, which prevents oxidation at higher temperatures.

10
The surface mount components, which are reflow soldered have shorter terminal
leads compared to the through hole components. This help to save the material resource
requirement of the components. But in reflow soldering, the entire mass of the circuit
board gets heated through various chambers of the furnace. A typical furnace has three
stages, namely preheating, reflow and cooling. In preheating stages, the board and
components are pre heated, which helps to activate the flux in the solder paste.
In many latest production ovens, the heat transfer is by both radiation and
convection. The heating coils located in the heating zones are the resistive heaters which
work by joule heating principle. Radiative heat transfer is easier to control but heating
depends on the emissivity and absorptivity of the associated materials. The sensitive
materials in the board are usually coated with reflective material and thereby their
temperature may be better controlled (Vianco P.T., 2000). The convective heat transfer is
through the nitrogen medium. The rapid flow of gases guided through baffles help to
improve uniform heating of products.
The preheated components are then passed through the reflow chamber, where they
are rapidly heated to the melting temperature of the solder. In this section of the furnace,
the molten solder makes joint between the terminals and pads. The temperature is
sustained for small duration to enable uniform spreading of the solder on the joining
surface. Then thermal energy is slowly recovered from the product as it passes through
the cooling chamber. The cooling chambers are the heat transfer units, where the thermal
energy from the surrounding gas is removed by using running water and air. As the heat
is exchanged, the product is cooled to a temperature slightly higher than the room
temperature.

11
Wave and Pot Soldering
In wave soldering, the terminal leads of the electronic components are located at the
holes on the board. The board with the through-hole components on it is passed over a
fountain of molten solder alloy. So only the leads come in contact with molten solder,
which flows through the gap between the lead and board by capillarity principle. In this
process also the flux is applied to the joining surfaces before soldering.
Pot/Selective soldering is also very similar to wave soldering, where molten solder
is available in a pot, in which the leads are dipped enabling the solder to flow through the
hole. The solder alloy which is available in the form of coils is taken and is melted in the
pot. The molten solder in a pot is maintained at higher temperature to prevent localized
solidification of the solder. Similar to reflow soldering, the parts are preheated for
activation of the flux. To prevent oxidation, the entire soldering operation is carried out in
nitrogen atmosphere.
Solder alloy
As the soldering process involves a heating till melting point of the solder alloy, its
energy intensity depends on the type of solder alloy used. Generally for uniform melting,
eutectic alloys are preferred for solders. Numerous solder alloys are available in the
market, with melting point ranging from 95oC to 320oC (Vianco, 2001). But most widely
used is the Sn-37Pb alloy which has a well-defined and relatively low melting point of
183oC. Sn-Pb solders have very good wetting and spreading characteristics with Copper,
which results in good mechanical strength of the soldered joint. They also have very good
thermal reliability to withstand up to 1000 cycles of thermal loading between -65oC to

12
125oC. Not many other solder alloys possess these fine points, thereby making Sn-37Pb
alloy as the most preferred.
Presence of lead in the alloy makes Sn-37Pb alloy, makes it potentially harmful and
it needs to be phased out of use. Tin offers good conductivity, low melting temperature
and good wettability characteristics and thereby tin alloys are considered. Among
various lead free alternatives, the most effective replacements are tin alloys with 2-4% of
silver and up to 1% of copper. But these alternatives have higher melting point than Sn-
37Pb and perform poorly in terms of wetting and spreading characteristics. These factors
affect the mechanical strength and reliability of the solder. Higher melting temperature
intensifies energy requirements for the soldering process. On the other hand, in order to
improve the mechanical strength of the joint, suitable coatings are required on the
soldering surface and terminals of the components. All these lead to an increased
utilization of resources.
Energy Utilization
As explained, the soldering process involves heating of parts to higher temperatures
and cooling down to room temperature. Because of heat transfer losses and inherent
limitation in the process, the energy invested for heating is not available for any further
use. In conventional manufacturing setup, the energy carried by exhaust gases, water and
the soldered assembly are dumped to the environment by ultimate equalization of
temperatures. In continuous production setup, the heat loss during normal production is
very common. Because of continuous movement of parts in and out, the heating process
cannot be adiabatic. So, the heating coils are to be switched on and off at high frequency
to optimize the heating. With the assistance of micro-controllers and PLC circuits, the

13
heaters are controlled precisely with minimum manual intervention.
In case of wave and pot soldering, during normal production the quantity of solder
in the pot is to be kept molten irrespective of parts flow. It usually takes very long time to
start the furnace from a cold condition, and so they are operational continuously. The
energy investment for this non -productive activity usually gets added to the energy
capital of the product.
Apart from energy investment, the process also has few additional features which
are necessary to improve the productivity and efficiency. Common auxiliary materials
associated with soldering process are compressed air, flux, inert medium (gas) and
coolant (water). The conveyors and parts handling systems are mostly mechanical
conveyors run by a pneumatic system. Let us consider each of these auxiliary flows.
Flux
Flux is a chemical which prepares the surface and prevents oxidation during/after
preheating. They help to improve the wetting and spreading characteristics of the solder.
Their primary constituents of the flux include corrosive and wetting agents mixed with a
water or alcohol. Higher solid contents in the flux may result in residues after soldering,
which may necessitate a separate cleaning process. Fluxes with low solid content (as less
as 5%) may leave no or very less residue. The corrosive agents disrupt and remove the
oxide layer on the substrate metal, while wetting agents help to reduce surface tension of
the solder (which improves the wetting and spreading characteristics of the molten
solder). In many cases, fluxes also provide a barrier coating on the surface, which helps
to prevent oxidation while preheating. Rosin based fluxes, which are commonly used in

14
PCB assembling are activated at a temperature approximately 130oC.
In reflow soldering, the fluxes are mixed with solder and used in the form of solder
paste. In other applications, they are separately applied on the surface before soldering.
Effectiveness of fluxes can be improved with increased temperature but on overheating,
they can lose their stability and begin to decompose. Thermal decomposition degrades the
fluxing action. All fluxes have a preferable, selected range of operating temperature and
non-indefinite shelf life. Presence of halide activators makes it absolutely necessary to
remove all residues from the product. With introduction of non-halide activators, the
above impacts are very much reduced (Vianco, 2001).
The evaporating flux fumes get mixed with the inert medium and are exhausted out
to the environment. To reduce the environmental impact, the low boiling vapors are
condensed from the exhaust gas and disposed separately. This condensate is one of the
harmful waste generated by the process and must be treated separately before discharged
to the environment.
Inert medium
To reduce the probability of oxidation during heating, an inert medium blanket is
provided for the base materials. The inert mediums commonly used are nitrogen, argon
and helium gases. Nitrogen is most preferred because it is the cheapest. Introduction of
nitrogen gas in the soldering chamber eliminates the water vapor and reduces oxygen
levels to a few hundred PPM. Lowering the partial pressure of oxygen inside the heating
chamber favors a reduction reaction on the surface. This helps to remove the oxide layer
on the surface.

15
Extent of nitrogen gas consumption depends on the chamber size and design. The
inert medium is very well conserved in batch processing ovens. Because of frequent part
movements, the loss of the inert medium to the environment is inevitable in inline
furnaces. But they can be minimized with air lock provisions which prevent leakage of
gases out of heating chambers.
Coolant
In reflow soldering process, after reaching higher temperatures during soldering, the
parts are to be gradually cooled to a temperature near room temperature. The cooled
nitrogen and other flux effluents are exhausted to the environment. So, the inline
soldering furnace must have a cooling chamber where the heat is removed from the
chamber using heat exchangers and fans. Water is used as coolant and it is usually
recycled continuously. Some quantities of the coolant may be lost due to evaporation.
These are the major concerns with the resources utilized for soldering processes.
The soldering process for the assembling of components onto the PCBs is well
established. Since a successful alternate method is not yet established, soldering process
is the preferred choice. The product economics gains upper hand over the intensity of
these sustainability concerns and thereby the shortcomings continue to prevail in the
manufacturing world. Evaluation of these resource consumptions in terms of exergy can
help to understand better about their intensities. As a first step towards building
sustainable manufacturing techniques, exergy analyzes is carried out in one such state of
the art, mass production assembly line.

16
1.2 Sustainable Lifecycle
1.2.1 Product Lifecycle and Sustainability
Lifecycle of an engineering product can be divided into four phases, namely Pre-
production, Production, Use and Post-Use phase. Fig 1.1 explains the resource
associations during the lifecycle of a typical engineering product.
Fig 1.1: Resource associations in Product lifecycle

17
Product lifecycle begins with conceptualization of ideas, which is developed into
technical design. This design undergoes various development and validation procedures
before getting approved for production. These activities collectively make up the Pre-
production phase. Considerable amount energy resources (Ede) are required in this phase.
A minimal amount of material resource may also be utilized, which is not identified in the
Fig 1.1.
Production cycle of a product begins with extraction of resources from the nature.
The raw materials (∑mex) required for the product are extracted by activities like mining
from the environment i.e. land, water or atmosphere. This activity may require separate
infrastructure which may require auxiliary (process) materials (∑mP1) and energy (E1)
resources. This may also produce wastes (∑mW1), which is dumped into the environment.
Then for refining the raw materials, additional auxiliary material (∑mP2) and energy
resource, (E2) may be required. This process may also produce byproducts and wastes
(∑mW2), which may either continue a separate lifecycle or may be dumped back into the
environment as industrial wastes. These processed raw materials (∑m2) are utilized for
manufacturing the necessary subcomponents and associated materials (∑m3) with the
consumption of secondary resources including energy resource (E3) and auxiliary
materials (∑mP3). Like the previous stage, this phase may also have process wastes and
byproducts (∑mW3). These subcomponents and sub-assemblies are assembled into a
product (∑m4), and product enters into Use phase. During its Use phase, product may
require energy (E5) and generate wastes (∑mW5) depending on its design and purpose.
At the end of life, the product (∑m5) enters Post-use phase, where it is dumped in
the landfill or disposed into the environment. For a typical consumer product, this is

18
analogous to materials discarded after use. In reality this is not a small number, and as
every year pass by it is increasing rapidly. According to USEPA 2008 data, of the 250
million tons of solid municipal wastes, the discarded products (excluding food and other
wastes) accounts for 181.14 million tons i.e. about 72.5% (USEPA, 20092).
This is the generic lifecycle of a typical manufacturing product. It could be noticed
that all resource interactions during the lifecycle can be assessed in terms of mass and
energy units. Unlike representation in Fig 1.1, in all real processes, a significant quantity
of energy resources is lost in transfer at each stage, which impacts the overall resource
consumption in the lifecycle.
As environment is the principal source for all resources, a resource intense product
may have sizable footprint on the environment. Ecological footprint is one of the metrics
that helps to assess the human pressure on the environment from the resources
consumption data (Schaefer, F., et al., 2006). Moreover, the consumer oriented lifestyles
of the developed and developing world accelerate the rate of resource depletion. The per
capita eco-footprint of the developed nations is five times of that the rest of the world put
together. More alarming forecast is that developing economies are also moving higher on
the resource consumption scale (Ewing, B, 2009).
The net quantity of renewable resources offered by the biosphere’s regenerative
capacity can be termed as Bio-capacity (Schaefer, F., et al., 2006). It actually represents
the aggregate output of all the ecosystems of the specified area. With the help of
advanced technologies, new alternate resources are discovered or explored, which can
help to expand the earth’s bio-capacity. But the human demand on the biosphere is also
increasing rapidly very rapidly in last forty years. In fact the current human demand on

19
the environment has even surpassed the maximum bio-capacity defined in 2002 (Kitzes,
J., et al, 2008). Resource depletion is experienced in many critical fields. These
circumstances have urged for viable solutions to manage the resources use. But the
solution is not limited to the search of alternate eco-friendly energy resources like solar,
wind, geothermal etc. Acute shortage of critical mineral resources is foresighted by many
scientific studies. At current rate of exploitation, availability of sufficient resources can
be uncertain for the future generations to survive in this world.
On the other side, the disposal of discarded resources during production and use
phase is the major concern as it continuously affects the ecological balance and threatens
the sustenance of living beings. More than 70% of the global energy resource
requirement is met by burning of oil and gas, which results in increased emission of
greenhouse gases, causing global warming. The disposal of products at the end of life
into landfills also poses serious threats to the environment. Leaching of metals and alloys
from landfill contaminates the soil and ground water sources. All these impacts have
created an urge for product lifecycle studies.
The very well established practices includes Lifecycle analyzes (LCA), which are
holistic approaches to study the environmental aspects and potential impacts all along the
product lifecycle, which helps in make informed decisions (ISO 14040:2006),. This is an
elaborate process which starts with a defined goal and scope. Goal of LCA, defines the
objective or the functional unit of the study in line with the purpose or application of the
study. The scope helps to define the boundaries and lists the process not considered for
the study. A clear definition of goal and study helps to save resources and time spent on
the study (US EPA, 2010).

20
Then comes the comprehensive data collection phase called as Lifecycle Inventory
(LCI). In this phase, an extensive data on quantities of relevant energy and material
inputs and their respective discards is collected. The preciseness of the data is very
significant for effective decision making in the relevant application, which necessitates
extensive knowledge about the resource and the process involved in the chosen lifecycle
(Tukker A., 1999). Using this information, optimization of resources for recyclability,
waste minimization etc. is facilitated.
Then next stage is about impact assessment with the quantities enumerated in the
LCI activity. This phase is about assessing the significance of the numbers or quantities
which may affect global aspects (outside the process) like environmental hazards, global
warming, pollution etc. The fourth phase is about informed decision making on
comparative analysis with other available information, like policy making, alternate
resource development, elimination or minimization of harmful substances etc. There are
many approach for an LCA, like Economic input output LCA (EIO-LCA), Eco-LCA,
Lifecycle energy analyzes (LCEA) etc. All these methods focus on significance of the
data generated in LCI with respect to different aspects like economy, ecological footprint,
energy utilization etc (Carnegie Mellon University Green Design Institute, 2008).
Although LCA is helpful in comprehensive understanding of various factors of
resource use in a product lifecycle, it has few shortcomings as well. The effectiveness of
the LCA depends on the goal and scope definition for the relevant application or purpose.
And the results depends the depth and extent of the scope and objectives. Although, Life
cycle Analysis offers a systematic method to evaluate the environmental impacts, they are
resource and time intensive. For assessing certain environmental impacts, the data

21
records over a longer span, say more than 10-15 years may be necessary. So without such
extensive information, the assessment may not lead to appropriate results (Finnveden, G.,
2000). LCA can only assess potential impacts upon past evidence but cannot exactly
predict the outcome. As LCA is a geography depended study and so there can be
apprehensions about the availability of required data and their suitability across similar
processes (SAIC, 2006).
For widespread industrial application, the method for assessing the resource use
should be simple and flexible. The assessment method should be universal for various
types of processes and it should be applicable at the level of sub-stages of manufacturing.
It should also be very practical and help to find the best direction to proceed for
improving resource utilization aspect of sustainability. Exergy analyzes is one such
technique, which could be implemented across all processes and thereby it helps to
compare and find the better ones.
These lifecycle studies in many cases help to showcase the actual state of existing
systems and associated resource intensiveness of manufacturing products and processes.
But to improve from the current state, there are various strategies or approaches which
may guide towards a sustainable development in the lifecycle of the product.
1.2.2 R-strategies for sustainable development (6R Approach) in Product Lifecycle
For sustainable development, optimum resources are to be utilized in the product
lifecycle. The interactions with the environment are expected to be considerably reduced.
Across several fields, various methods and procedures have been evolved to uncover the
strategies for addressing the sustainability concerns. Among them, one of the widely

22
discussed tactics is often termed as the ‘R-strategies’ or ‘6R approach’. This idea is an
expansion of popular three R-terms namely Reduce, Reuse and Recycle, a model for eco-
friendly (or green) engineering. From the terms, it could be understood that objectives of
green manufacturing include reduction of potentially harmful interactions with
environment. It is believed to be achieved by encouraging secondary lifecycles for a
discarded resource by reuse and recycling options. But one of the major limitations is
reusability and recyclability of the discarded resource. The resources used in the designs
of existing engineering products, processes and systems may not exhibit many technically
and economically encouraging viabilities. This creates a necessity to generate
opportunities to explore within the domains of existing lifecycle.
Along with the existing three options, three new avenues, namely Recover,
Remanufacturing, Redesign can be included. These new three R-terms are focused on
encouraging the possible means of secondary lifecycles for a discarded resource (Jawahir,
I.S., 2006). Depending on the objective and scope of the endeavor, the sustainability
efforts can be categorized under different R-terms. But poor interpretation and
commonalities of objectives can causes ambiguities between the R-terms. In reality, the
R-terms identified in this approach are different avenues for sustainable development that
complement and sometimes overlap each other.
Depending on the product type, these R-term strategies may follow sequential or
parallel paths along the product lifecycle for sustainable development. Using these R-
terms, the efforts for sustainable development can be streamlined and organized
effectively. Employability of these R-terms as parallel avenues for prudent resource
utilization in a product lifecycle is discussed in detail in this section (Refer Fig 1.2).

23
Reduce
Addressing the tenets of sustainable development, namely environmental, societal
and economic benefits, the foremost objective will be to reduce the impacts of resources
associated with the existing products, processes and systems on the environment. This
infers to reduced mining and dumping of resources from/into the environment. As the
first step to reduce the impact, various harmful substances have been identified and
mandated and/or suggested to limit their usage in the resources associated with products
and processes. Directives like RoHS, clearly limit the use of various hazardous
substances in consumer products. To reduce the green house gases and energy
dependence on oil resources, alternative fuels and eco-friendly methods of power
generation are encouraged. Moreover rapid depletion of fossil fuels and mineral resources
has enforced a need to build systems that utilize resources prudently for sustainable
development.
Another important research front is miniaturization of products, moving towards
micro and nano technologies to reduce the material requirement. But in terms of energy
usage, the sustainability of nano-scale engineering with current techniques may be energy
intensive and needs to be scrutinized (Gutowski, T., 2010). But with focused efforts, eco-
footprints of these new technologies may be trimmed.
Yet another important research focus is to extend the use phase of the product
through better design, advanced materials etc. But to meet the growing needs, along with
reduction efforts, alternate resources are to be identified or generated. The most eco-
friendly method would be reusing the discarded resources, which will be the primary
focus for the other R-terms for sustainable development.

24
Fig 1.2 R-strategies for sustainable lifecycle of a typical product

25
Recover
During Pre-Use and Use phases, the wastes and effluents generated are discharged
into nearest environmental sinks, like landfills, water bodies or atmosphere. In a cradle to
grave cycle, the product itself is sent to landfill after the end of life. These wastes not
only disturb the ecosystem, but they are also potential resources. In the year 2008, about
54% of 250 million tons of US Municipal Solid Wastes were discarded after material and
energy recovery for recycling (US EPA MSW 2008 Facts, 2009).
In the first place, all these resources are to be recovered. Mandatory take-back
policies are administered in European Union. In USA and Japan, the manufacturers are
encouraged to take back the older versions, when upgraded products are offered. These
initiatives opened up new research interests in the field of a reverse logistics, design for
disassembly and modularity etc. (Klausner, M., et al, 2000). Industries like Nokia, Xerox
etc. are working towards taking back all outdated and discarded products and accessories,
which they are planning to put into another utility.
Special disassembly factories are under evolution, which aims at maximum
recovery of resources for a second lifecycle (Seliger, G., 1996). The recovered parts are
categorized depending on their potentials for reusing, remanufacturing, recycling and
energy recovery options. The discarded resources which cannot be recovered are
processed for safe disposal. But the product varieties pose many challenges for effective
recovery of all discarded resources.
Reuse
Reuse signifies putting the discarded material directly into another use phase,
prolonging its lifecycle. This kind of system is in practice for a long time in spare parts

26
industry. When a product reaches its end of life, all its sub-components need not be in
same condition. Many a times, they have a longer service life and find a utility in some
other appliance. Compared to recycling and remanufacturing, the secondary resource
requirement for reuse option is the least. Compared to the original new product, the
material and energy expense to pursue this avenue is almost negligible. But reliability of
the reused product is the big question. After the first life cycle, along with the product or
material resource many uncertainties on performance and service life come with it.
To enhance the reuse option, improving reliability of the product is very important.
A highly reliable component could find a better value in its second lifecycle (Anityasari,
M. et al, 2008). With this notion, reliability studies take prime importance which helps to
design better products that serve longer. This exercise can be a subset of the efforts to
improve fatigue life of the product.
Remanufacture
Remanufacturing is about module level recovery and reusing of sub-assemblies and
components from a discarded product. This is one of the vastly discussed modes for
prolonging the utility of the product. Moreover, this is the most favorable means for
products that failed to serve its full service life and where the extent of damage is
reversible or repairable. The products that take up their second lifecycle are notably
called by many popular jargons like refurbished, refurnished goods etc. The
remanufactured products are expected to serve as good as new products. This activity was
in practice for a longtime in production of machine tools, off-road massive vehicles etc
which were refurbished and sold to developing countries for after their first lifecycle.
Recently this trend is becoming very popular for heavy diesel engines, printer cartridges,

27
many consumer goods and electronic products, etc.
But remanufacturing is very much a product-specific approach and prospectus of
remanufacturing is to be considered in the product design phase. For efficient
remanufacturing, the need for concepts like modular designs and design for disassembly
and remanufacture are all to be applied extensively. Subsequently, the sustainability of
existing designs and technology are to be reviewed in line with their prospect for
remanufacturing. Often the existing joining processes like welding, soldering etc hinder
the prospects of implementing remanufacturing. Economic models are under
development to evaluate the significance of remanufacturing on the product features like
cost, modularity, etc. for commodities that obsoletes faster like personal computers
(Ferrer, G., 1997).
Remanufacturing is more favorable than recycling, because the secondary resource
requirement along the remanufacturing route is much lesser than the recycling option. So
it should be pursued over recycling options. Although the quality of remanufactured
product is expected and assured to be as good as a new one, the market reception for
remanufactured goods is uncertain.
Recycle
Recycling for some years was the first choice of a sustainable resource use.
Recycling is oriented towards extraction of materials at the level of elements and
compounds. In this pursuit, efforts and resources spent on building the forms and shapes
of the product are marginalized. As the focus is on material content, not on the forms or
quality of the product, it may look simpler than remanufacturing options.
The product is usually shredded and segregated often by mechanical methods. The
28
components separated to their nearest stable states by different method using electro-
magnetic and chemical properties. The secondary refining process involves thermo-
chemical processes like smelting etc. All these subsequent processes, as a rule may
increase the secondary resource requirement. Effectiveness of recycling vastly depends
on the quality of the scrap that is recycled. More cleaner is the scrap (devoid of unwanted
substances), better are the results in terms of quality, resource capital and cost. These
factors signify the importance of resource recovery after disposal.
In assessing the sustainability of a product, the recyclability properties of materials
play a major role. For example on recycling, aluminum can undergo about eight
lifecycles, whereas steel can successfully undergo only about two or three lifecycles.
Thereby making aluminum more preferable than steel. Moreover, using secondary
materials (i.e. in their 2nd or more lifecycle) results in higher energy savings in the
production process (Das, S. et al, 2007). Recycling also offers a better choice for non-
degradable (plastics) and hazardous substances, which dangerously threaten the
environment.
But process of recycling is not very glamorous as it appeals. Not many safe and
economical methods of recycling were fully established for all kinds of materials in use.
It is often considered as dirty and deported to developing countries, where very crude
methods were employed. Many cases of poisoning and environmental damages were
frequently reported from the recycling zones (Puckett, J., et al., 2002).
Redesign
Product design holds key for its sustainability. Suitable and economical
manufacturing processes and associated systems are decided by the product design. Most
29
of the significant character, which affects health, safety, and environmental aspects, are
determined at the design stage. This signifies the importance of the product design. For a
successful sustainable engineering, existing designs are to be assessed for their
sustainability throughout the lifecycle and they are to be suitably redesigned. A complex
product design with advanced materials and high end technological requirements has
shown greater impact on the environment during the production and disposal stages.
With implementation of RoHS, many hazardous materials were banned or
controlled. This initiated a pursuit to identify a suitable, environmentally benign
alternative like lead free solders. But implementation of new systems like Pb free
soldering, necessitated a chain of changes and up-gradations including redesign of pad
sizes, associated fluxes, process parameters, tools, test procedures, etc. All these efforts
would finally ensure that the threat is nullified. Similar is the case, when there is a
material change from existing to a recyclable material used for a product. Successful
implementation of other five strategies are effectively enhanced and controlled in
redesign option.
Even after all these efforts, there will always be some residue which needs to be
extracted or dumped in to the environment. Designing a hundred percent sustainable
product is always a myth like Ouroboros serpent. Ouroboros serpent is an isolated system
which survives by eating its own tail. This is possible only when all interactions are
purely reversible, which is not possible with real processes. Laws of thermodynamics
limit all real processes to have some loss, which is attributed to the entropy generation in
the process. With this limitation in place for all available real processes, the objective of
sustainability studies should be for utilizing the maximum potential available in a

30
resource. This maximum available potential in a resource can be assessed in terms of
exergy. So it becomes evident that exergy studies are essential for understanding the
current scenario and work towards the best results, practically possible.
1.2.3 6R approach in Life cycle of Printed Circuit Boards
To explore the tenacity and potentiality of R-strategies, these concepts were applied
in the typical lifecycle of printed circuit boards. A typical PCB undergoes a usual ore to
landfill life cycle except for very limited recycling options under current practice. In this
system, possible avenues are identified and their probable challenges in the current state
of technology are briefly explored. Many discrepancies are identified in the existing
lifecycle and a sustainable PCB assembly is expected to overcome the discrepancies.
Using the R strategies, an ideal lifecycle for PCB assembly is hypothesized (Fig. 1.3)
which may open opportunities to resolve the discrepancies. This figure is an extension of
Fig. 1.2, which is applicable to the lifecycle of PCB assembly. From the extracted and
processed raw materials, various sub components (electronic components) are
manufactured and assembled to the board, conventionally by soldering process.
Reduce
With implementation of RoHS and other standards, the manufacturers in electronic
industry have moved towards lead-free soldering. Alternative lead-free solders considered
are mostly tin based solder alloys with few additives. It is estimated that in USA for the
Sn-Pb solders, Tin is consumed at a rate of 9.2 x 10⁶ kg/year. It is also estimated that
worldwide switching to lead free solders will increase the Sn consumption by about 60%
(Gordon, R.B., et al., 2006). With about 15x109 kg of known tin reserves, it may not
impact the manufacturing sector in near future. But with current rate of usage, it will not

31
last beyond next century. There is definitely a need to develop systems more efficient
systems for reusing and recycling the discarded PCB assemblies. But methods to
optimally use the material and energy resource in different phases of PCB lifecycle is the
need as identified in Fig 1.3. At the end of life (EOL), to reduce the dumping, the tack-
back option is encouraged and possibilities of reuse/remanufacturing/recycling are also
envisaged.
Reuse
To reuse, the first stage is to recover the PCB assembly from their respective
products. Once it is recover as PCB assembly, the viabilities of reusing the board is to be
assessed. But currently the options for reusing of PCBs are very limited because of the
uncertainties about the product quality. PCB assembly is made up of numerous minute
electronic components mostly consisting of semiconductors and ceramics. Reliability of
these components after the first life cycle is uncertain. Each PCB assembly is designed
for specific application, with a defined electronic circuit. So, interchangeability of PCB
assembly for different products (distinctively different in function) is minimum. Hence
component-wise recovery options are to be considered.
Recover
In case of PCB assembly, the soldered joints hinder efficient disassembling of
components from the board. Many researches are conducted on building robotics assisted
intelligent remanufacturing systems to perform the salvaging operations (Feldmann K., et
al., 1995). Except for complicated and costly high-end VLSI chips like processors, other
small components do not fetch profitable return on investment. But on building efficient
component recovery methods, the possibility of remanufacturing is encouraged.

32
Fig 1.3: R-strategies for sustainable resource utilization in lifecycle of PCB Assembly
Note: The above lifecycle focuses only on product materials. All above stages consumes energy and auxiliary materials as indicated in Fig. 1.2. These resources play important role in product and process sustainability, which are appropriately tackled in different R strategies.
32

33
Remanufacture
With good worth for recovered components, the PCB assembly can be
remanufactured. So there is an opportunity to study and develop better components that
can sustain multiple lifecycles through reuse and remanufacturing. But with existing
designs, the worthiness of the recovered components is doubtful. This leaves recycling as
the only plausible option to improve the sustainability of PCB assembly.
Recycle
The discarded PCB assemblies are collected from the waste products and undergo
special treatment where the recycling options are considered. Most of the PCB waste
treatment sites follow non-sophisticated ways to recycle the printed circuit boards. The
PCB assembly is heated in open setup to desolder the components, which results in toxic
fumes of lead oxide, etc (Puckett, J. et al., 2002). Of all the material contents, only very
small quantities like copper and few other precious metals carry good value for
investments in recycling. And the rest of it is dumped into the environment. To
successfully overcome these hurdles, the most effective approach can be to redesign the
existing design of the PCB assembly and manufacturing processes associated with it.
Redesign
The redesigning of the existing product and associated processes can take place at
various levels with specific objectives which focuses on sustainable development. In Fig.
1.3, the redesign activity is marked near the design phase to signify the importance of
pre-emptive thinking about ecological and economic benefits associated with the
complete lifecycle. The lead-free options, reliable designs for secondary lifecycle, design

34
for disassembly, remanufacturing and recycling, are some of the objectives of focus.
But treading these avenues of sustainable development in existing PCB lifecycle
can be an arduous endeavor. Probably the best objective to focus will be the resource
utilization in the manufacturing of PCB assembly. This needs the auxiliary material and
energy requirements of the processes to be optimized along the lifecycle. For that, the
maximum of the potentials available from the resources are to be fully utilized. To pursue
on these objectives, the current status of resource utilization is to be evaluated with a
basic, unambiguous metric. As a first step towards this mission, in this study on PCB
assembly, the manufacturing (assembling) stage is chosen for evaluating the
sustainability.
1.3 Sustainable Resource Utilization in Manufacturing
1.3.1 Energy and Exergy flows in Manufacturing
The manufacturing processes involve conversion of raw materials into required
products at the expense of materials and energy resources. Any manufacturing process
requires energy resources to perform the intended function. The association of the
secondary materials and energy resources during the lifecycle of the product is explained
in chapter 1.2. Manufacturing processes interact with material and energy resources to
perform the functions (Fig 1.1).
The depletion of critical resources and the need to conserve was briefly discussed in
in previous sections. Optimizing the overall resource use is very significant for resource
conservation and sustainable development. But for quantifying the current utilization rate
a universal metric is required. The metric must be applicable to all involved processes. It
should not give rise to ambiguities and it should be consistent under all situations.

35
Thermodynamics offers one such metric called available energy or exergy.
Exergy is the maximum available energy of a considered system, which in principle
could be fully extracted and converted into useful work (Szarguts, J., 2005). It will be
denoted as ‘ε’ and it is measured in joules (J), the same as energy. Exergy of resources
interacting with the manufacturing process can be of three forms: (1) exergy of heat flow,
(2) exergy of work flow and (3) exergy of material flows. Heat and work are different
forms of energy in transition. Material resources can carry different form of energies like
the potential energy, kinetic energy, thermal energy (enthalpy), chemical potentials etc. If
these properties are represented as extensive properties, the total value will be
proportional to their mass or mass flow rate. But the associated energy quantities are not
necessarily fully available for exploitation. Thermodynamic principles help to quantify
and evaluate the portion of energy which is available for further use. By using exergy as
metric, any resource interacting with a defined system can be quantified in suggested
manner. Thereby all resource interactions of a system can be expressed in terms of exergy
flows. As exergy is not conserved, the difference in net exergy flows represents the loss
of available energy inside the system. This loss of availability helps to rate the resource
use potential of the system.
In case of material resources, the total exergy or available energy is made of two
portions. The quotient of exergy which corresponds to the physical potentials like
position, temperature, pressure differences etc. is termed as physical exergy. But the
availability of these potentials varies from kind to kind. The potential and kinetic energies
are fully available for further conversion. But the enthalpies will not be fully available for
further use. A portion of it is restricted by the irreversibility associated with the real

36
conditions.
Every material has a chemical potential in the given state, by the virtue of
difference with its ultimate dead state or the state of natural occurrence (state of
equilibrium with the environment). This potential expressed in terms of available energy
is called as “chemical exergy”. All material resources are extracted from the environment
which includes lithosphere, hydrosphere and atmosphere. So the materials or chemicals
used for manufacturing or for any other process are extracted from any of these sources,
and processed to required conditions. The difference which is created in processing of
materials from their state of natural occurrence accounts for the chemical exergy.
Exergy carried by the resources amounts to a maximum reversible work possessed
by the resources in their current state which can be fully recovered and utilized (Bakshi
B. et al, 2008). Due to an irreversibility associated with the process, a certain quantity of
available energy is destroyed. Irreversibility in a system can be caused by friction,
diffusion, throttling, combustion processes, absorption and emission of thermal
radiations, heat transfer with finite temperature gradient and chemical reactions. All these
phenomena could result in exergy loss (Szargut, J., 2005). So the net exergy carried by all
the output resources is always less than the net exergy flowing in to the system. This ratio
between the net exergy flowing out to net exergy flowing in gives the extent of exergy
destruction. So the exergetic efficiency (ηε) of the system, which will be the measure of
process sustainability, may be defined as follows.
∑∑
(1.01)
Amount of exergy lost (δε) in the system can be calculated from the environment

37
temperature (T0) and net entropy generated (ΔSirr) by the irreversibility.
∆ (1.02)
Apart from this exergy which is lost inside the system, the other discarded
(unutilized) resources generated in the process add to the total exergy lost in the process.
In this context, the wastes include all the resource streams which are not utilized and are
dumped into environment. As long as there is exergy loss in a system, there would be a
possibility for improvement.
Exergy concept offers a comprehensive tool for analysis of sustainable development
by considering the importance of resource flows in economics and ecological aspects of
manufacturing process. The phenomenon of entropy generation within a considered
system is common for all processes. This quantity is directly or indirectly evaluated
during exergy analyzes. In thermodynamics, entropy is defined as a measure of
irreversibility property of a system. All real process will impact the entropy property of
the system through entropy generation and only in a completely reversible process the
entropy generation could be restricted to zero.
The concept of exergy for evaluation of a process is not novel. Exergy is used to
assess the irreversibility associated with energy conversion processes. For designing and
developing optimized energy system, exergy analyzes are carried out frequently. But
recently, the significance of exergy analyzes is applied in various non-energy producing
processes and manufacturing processes like chemicals and fertilizers industry, steel
industry, cement production processes etc. Compared to energy-based analyzes, exergetic
analyzes of a system provide better insight of resource consumption, particularly the

38
quality aspects. This opens new avenues for development, which may improve the overall
sustainable development.
In case of a production system, the quality of the output in terms of meeting the
functional requirements and costs associated are often alone considered for optimized
manufacturing. Resource requirement of such a manufacturing process is usually added
to the capital expense of the process and considered as inherent to the process. But
curbing the resource capital to the possible minimum is one of the foremost objectives of
manufacturing for sustainable development. Thereby it creates a scope for exploiting
exergy based methods in production systems.
1.3.2 Balancing of mass, energy and exergy flows
Well-defining a system is an important premise which is absolutely necessary for
performing an exergy analyzes. A thermodynamic system is said to be well-defined, if its
control volume and system boundary are clearly defined and the system constituents and
their specifications with the features of the system are specified. If the boundary of the
system is not clearly marked, it may lead to ambiguities while defining the state of the
system. If the boundary of the system is well defined, then any interaction between the
system and the surroundings can be identified clearly. This is the first step for any exergy
analysis.
In a well-defined system, the state of the system must be defined. In such a system,
the various interactions (resource flows) may be crossing the boundary. These resources
along with their state properties must be identified. At the end of this exercise, the
physical conditions of the material flows with respect to the environment are defined.
For exergy balancing, all the material and energy flows are to be quantified in terms

39
of exergy carried by them. To do that, their mass and energy quantities are to be
determined. For both steady state and transient conditions, the flow rates of energy and
materials must be balanced.
Mass Balance equation in a steady state system ‘n’ is given as
, , (1.03)
, , (1.04)
Where represents the mass of the system and represents the mass flows
crossing the boundary of the system. With the calculated mass quantities, the mass flow
diagram for the system can be specified. Next stage is to quantify the energy flows.
Under steady state conditions, net energies flowing in and out are equal ( .
The energy flows interacting with manufacturing system can be in the form of heat, work
(mechanical or electrical) and energy carried by the resources flows. Heat and work can
quantified from their mode of transfer and efficiency details. Similarly, the potential and
kinetic energy possessed by a material resource can be negligible in many conventional
manufacturing processes. Enthalpy (H) is a function of thermodynamic state of the
resources, which represents the combination of internal energy (U) and boundary work
(Pv) possessed by the material flows (Cengel, Y.A, 2006).
(1.05)
Internal energy (U) can be determined by the difference between heat possessed (Q)
and work done (W) by the system.

40
(1.06)
The work done (W) and the boundary work (Pv) can be considered negligible in
simple solids or incompressible liquid or ideal gases. In other words, it represents
thermal energy content in a material resource (Cengel, Y.A, 2006). If this thermal energy
content in a body is purely in form of sensible heat for a body that is not undergoing any
phase change, then the specific enthalpy (h) carried by material resources, which are
considered as simple solids or incompressible liquids or ideal gases at a given state i, can
be determined by their heat capacity (Ci) and temperature (Ti).
. ∙ (1.07)
Total Enthalpy flow rate ( ), is calculated with mass flow rate.
∙ . ∙ ∙ (1.08)
With these energy flow quantities, energy balance is drawn for all the systems
together.
, , , (1.09)
Under steady state condition,
. (1.10)
Energy is always conserved, but exergy is not conserved. Rather it is destroyed in
all real processes. Depending on the nature of resource, different methods are to be

41
employed for exergy calculations. The exergy balance is drawn with the quantities of
exergy available in each resource streams.
Exergy of Heat ( flowing in or out of the system can be determined by taking
the carnot co-efficient between temperatures at which heat is executed and the
environment temperature (T0).
(1.11)
Energy quantities carried by the mechanical (WM) or electrical (WE) work are fully
available for further exploitation. Therefore exergy of work ( ) flowing in or out of the
system is equal to the quantity of work available.
(1.12)
As discussed earlier, the exergy carried by the material flows are consequence of
two potentials. They may be physical, chemical or both. The flow exergy of a material
(εi) is given as below.
(1.13)
Physical exergy, also called as availability function, is calculated from the enthalpy
(hi), and entropy (si) of the material in the given state and with respect to the environment
(h0, s0). Environment is also called restricted dead state. Like explained earlier, when
enthalpy represents the thermal energy content in the material, then entropy of the
material helps to determine the unavailability of that thermal energy for conversion into
work (DOE handbook, 1992). The physical exergy is the maximum possible energy than
can extracted till the system is in equilibrium with surroundings (Ti=T0). Then specific
physical exergy ( ) of a substance at a temperature Ti, can be determined by the

42
following.
∙ (1.14)
Where
T0 – Environment temperature
hi & si – Enthalpy and entropy of the system at given state i, respectively.
h0 & s0 – Enthalpy and Entropy of the system in equilibrium with environment (P0, T0)
The chemical exergy is calculated from the chemical potential of the substance at
current state with respect to the ultimate dead state (Szargut, J., 2005). Then specific
chemical exergy of a substance can be calculated with chemical potentials and mole
fraction of the particular substance.
(1.15)
Where,
µi – Chemical Potential of material at current state
µ0 – Chemical Potential of material at ultimate dead state
χ – Mole fraction of the material.
With these exergy quantities, the exergy balance can be defined for a system.
From the exergy balance, the rate of exergy destruction is determined as the difference
between the exergies flowing in and out of the system.
, , , , , (1.16)
This exergy destruction ( ) is attributed to the entropy generation inside the

43
system during the process. This value will be the metric to assess the efficiency of the
manufacturing process in line with the sustainable resource utilization. This exergy loss is
inherent in the process by its design which cannot be recovered externally.
Under steady condition, . Then rate of exergy destruction ( ) can be
determined from rest of the balance.
, , , , , (1.17)
With all resource flows along the product lifecycle are quantified in terms of
exergy, the lifecycle diagram in section 1.2 (Fig 1.1) can be modified in terms of exergy
flows (Fig 1.5). It could be evidenced that materials and energy resources carry exergy
throughout their lifecycle. For this academic work, only the assembling process of a PCB
assembly is studied in detail. All exergy flows associated with this stage of the lifecycle,
were evaluated to study and enumerate the methodology of exergy analyzes for
sustainable development.
Before extraction, the resources that are in their natural states have their exergy
potentials at a minimum. All along the lifecycle in making of a product, at various
processing stages more exergy is invested into each products/material and subsequently it
is also lost. At the end of life cycle, the imbedded exergy is still available with the
resource particularly chemical exergy, which is often dumped into the environment.
Similarly all resources discarded at each stage carry a quantity of exergy along with it.
This may be destroyed when the resource attains thermal and chemical equilibrium with
the environment (dead state).

44
1.3.3 Exergetic efficiencies and Significance of Exergy
In an exergy analysis, the quantity of resources consumed and quality of process
outputs may be connected to the exergy quantities associated with them. Exergy loss
corresponds to a loss of a useful resource which results in an increased resource
consumption. Exergy analysis helps to identify a system with minimum entropy
generation which has better resource use. Many products involving recent technological
advancements like semiconductor chips, carbon nano-tubes etc. fail to address this aspect
(Williams, E.D., et al, 2002; Gutowski, T.G., et al 2010). For example it is observed that
resources used in making of carbon nano-tubes indicate a very large intensity. So, exergy
analysis may assist in evaluating the specific resource use for advanced technologies.
In recent past, the Carbon footprint is widely appreciated as a metric to evaluate the
ecological footprint of a product. Carbon foot print is developed to study the impact of a
product on the overall greenhouse gases emissions and global warming effects
(Wiedmann, T., et al, 2007). Using this method the energy consumption in manufacturing
of a product may be quantified in kilograms of Carbon Dioxide. Based on the type of
power generation, equivalent carbon emission values for generating this energy required
can also be evaluated.
In traditional energy resource evaluations, different forms of energy are lumped
together and compared. Although they carry the same units of measurement, the quality
of the energy associated with each type may differ. For example quality of a unit heat is
different from that of a unit mechanical work. In case of mechanical work, the quantity of
available work is fully available. But in the case of heat, only a portion of it is available
for further conversion, given by the exergy. By using exergy metrics, these kinds of

45
ambiguities can be avoided during the analysis of a system.
Exergy is a measure which indicates how far away a resource or a system is from
the state of natural occurrence or state of equilibrium with environment. As explained in
Fig. 1.5, all discarded resources, wastes and byproducts generated from a process carry
some quantity of exergy with them, which indicates their current state which may be
different from the state of equilibrium. A resource in perfect equilibrium with an ultimate
dead state will carry no exergy (Bejan, A., 2002). When a resource with some exergy is
dumped into the environment, it may not be in equilibrium with the environment. This
exergy difference impacts the environment but the significance of impact depends on the
potential of the resource and many studies are being carried out regarding this aspect
(Dincer, I. et al. 2007). In other words, exergy could be used as a measure to assess the
damage potential carried by waste streams.
When material streams are not in equilibrium with the environment, the tendency to
affect the environment is certainly higher. One of the basic tenets for designing a
sustainable system is to minimize damage to the ecosystem. Exergy analysis may help to
asses this aspect of sustainable development that a product or system may have. This
means, all or maximum of the potentials available in the waste streams ideally are to be
extracted before dumping. But availability of practical techniques and economic viability
of potential technologies represent the big challenge for utilizing the available exergy
potentials in auxiliary material and work flows. For example, not many techniques are
available to fully utilize the chemical potentials hidden in material resources.
An economic analyzes of exergy streams flowing through a system is sometimes
called as “exergonomics” or “Thermo-economics” which is slowly getting more

46
popularized. Using this, the resource use can be optimized with objectives to minimize
the overall cost and cost of exergy losses. Because of the inherent irreversibility
associated with real processes, it is difficult to exactly determine the cost of exergy lost.
So a comparative cost analyzes is preferred (Szargut, J., 2005). The exergy losses are to
be accounted as depletion of capital or added capital cost. There are few methods under
close scrutiny which were critically reviewed for their suitability across all processes
(Tsatsaronis, G., 1987; El-Sayed, Y.M., et al. 1989). One of the challenges for a wide
spread industrial application is that the suggested method should be simple and universal.
This may not be the case for the use of advanced procedures based on second law of
thermodynamics.
In a manufacturing setup, numerous resource streams flow in and out of the
processing center. Each resource stream along with it carries an energy potential called as
exergy. Current manufacturing practices are designed to meet the product requirement s
at an economical way. For sustainable development in manufacturing, the resources are to
be prudently used, which means the maximum potential of the resource is to be utilized.
Manufacturing systems are to be designed to perform at the optimum thermodynamic
efficiency of resource use, constrained by product quality, cost etc. In line with this
notion, current manufacturing processes are to be assessed and evaluated for their
measure of resource utilization. One such illustrative study is carried out in Printed
Circuit Board assembling process and discussed in this thesis.

47
2. Resources utilized in Manufacturing of PCB Assembly
2.1 Printed Circuit Board Assembly manufacturing process
2.1.1 Manufacturing (Assembly) line
The printed circuit board chosen for the study is a small but very instrumental unit
of an automotive control system. This 90g weighing PCB assembly is a part of an
electronic control unit of passenger cars. Each circuit board consist of 293
subcomponents (see Appendix 1) made up of 64 different materials including metals,
alloys, ceramics, metal oxides, organic compounds and polymers (as declared by
manufacturers). All these components are provided by different suppliers from different
parts of the world. Each board has a heavy connector unit, weighing 35g. This most
massive component is a through-hole component, and all others are surface mounts. All
the surface mount components are reflow soldered and the connector is selectively
soldered separately in the end. In the identified manufacturing line, all these components
are bonded to the board by using lead solder. The lead-free option is also under
production in a separate manufacturing line. This is a high volume product, produced at a
rate of 400,000 units per annum during its peak demand. The assembly line is run for two
shifts a day at 10 hours a shift.
The manufacturing process is carried out in panels comprising two circuit boards
each. After assembling and testing, the panel is cut and individual boards are packaged
into their casings. The manufacturing line is fully automatic and designed to the state of
art with minimum human interference. The manufacturing (assembling) process is carried
out in a controlled environment where temperature, humidity and dust levels are
monitored. The manufacturing area is maintained at a temperature of 20±3oC. There are

48
six stations involved in manufacturing process, which are arranged in a U-shaped
production/assembly line. Between the stations, the movement of products is assisted by
multiple conveyors. Apart from the linear movements, products need to move at right
angles at two points in the U-shaped assembly line. For that purpose, rotary conveyors
are also used. Material movement between the stations is electronically controlled with
sensors and logic controllers.
2.1.2 Manufacturing (Assembling) sequence
At the first stage, traceability barcodes are etched on each circuit board of the
unpopulated panel. This is carried out by a laser etching process with 30W fiber laser
marker. The panels are picked from the stack and placed on the conveyor with the help of
a pneumatic assisted pick and place system. The etch dust is removed from the work area
using a vacuum pump. The etched dust is collected separately and safely disposed in
accordance with industrial standards. Then the etched panel is moved to the next station.
In this station, the solder paste is applied on to the specified locations (pads) of the board
using the specifically designed stencils. Due to similarities with screen printing
technique, it is also called as solder paste printing process.
The solder paste contains eutectic 63Sn-37Pb solder alloy with low/no residue flux,
i.e. upon heating, the flux is fully vaporized and leaves no visual residue on the board.
Solder paste is also maintained in controlled conditions at a temperature of 16oC. The
entire operation is carried out using pneumatically assisted mechanical systems. The
solder paste printing equipment is also equipped with visual inspection feature to verify
the quality of the process. Subsequently, the etched PCBs with the paste deposited on
their pads are moved to the next station.

49
Fig. 2.1 Manufacturing (Assembling) Sequence of the PCB Assembly
In the next stage, the components are stacked on their respective pads as required
by the circuit design. Components are received in reels, from which they are picked and
placed on their respective pads assisted by the stacking equipment. The equipment uses
electro-pneumatic systems to control the pick and place mechanisms. To the break the
operation time and enable parallel operations, the components stacking operation is
divided into two stages (A&B). The stacking units used in these two stages are very
similar and are place consecutively in the assembly line. In the first stage, many smaller
components are stacked and in the next, the heavier components are handled. At both the
stages visual sensors and warning systems are available to qualify the products leaving
the station for reflow soldering process.
The panels with all surface mount components and solder paste positioned in place
are sent through the reflow furnace. This is a 10-stage oven with two cooling zones. Like
a typical reflow process, product undergoes preheating, activation and reflow conditions
during the ramping of temperature at different zones. In the furnace, the temperature is

50
ramped from room temperature to a maximum of 232oC at reflow zones. The heating
process is carried out in inert condition, provided with nitrogen gas by monitoring the
oxygen levels inside the furnace. Electric joule heating is used for heating and the
thermal energy carried by the product is partially removed as heat in the cooling zones
with help of heat exchangers. Water is used as the medium in these heat exchangers. The
reflow process is designed to have a cycle time of 35 seconds. As the reflow oven has
long startup time of about three hours, it is run continuously and shut only for a couple of
hours at the end of the day. At the end of the reflow line, a small pneumatics assisted PCB
stacker is available. A maximum of about ten panels can be stacked in this unit. In case of
the line stoppages, the boards are accumulated in this stacking unit. This helps to balance
the product flow in the assembly line.
The connector unit, which is bigger than other components, is stacked separately on
the reflowed PCB assembly in its specified position. This is carried out in a custom built
pneumatic machine, which is like a typical pick and place system. Then the board is sent
to the selective soldering oven. In selective soldering, the board with the through-hole
component (connector unit) is dipped in the molten solder alloy. By capillary action the
solder alloy fills the gaps and makes joints. Before passing the PCB assembly through the
selective soldering oven, minute quantity of flux is sprayed onto the pins of the
connector. Inside the oven, the board is placed on a chain conveyor, which takes it
through the preheating and activation zones before reaching the solder alloy pot. In the
pot, the eutectic 63Sn-37Pb alloy is kept in a molten state at 380oC. To avoid oxidation,
the selective soldering oven chamber is supplied with nitrogen gas. The hot PCB
assembly coming out of furnace is air cooled and sent for inspection and packaging.

51
Similar to the reflow oven, because of long start up times, the selective soldering oven is
made to run continuously and the solder in the pot is maintained at the operating
temperature. Selective soldering oven is shut down only during the annual inter sessions
and long maintenance breaks.
2.2 Resource flow mapping
The first activity in energy and exergy balancing is to identify the resources
associated with respect to a defined system boundary. The PCB manufacturing line can
be divided into six sub-systems with boundaries of these sub-systems selected around the
individual processing equipment. This includes all tools that assist in the assembling
process, like pneumatic pick and place systems, internal conveyors (located inside the
machines) etc. The identified assembly line is divided into six subsystems to
representing different stage of the manufacturing (assembling) processing. Each
subsystem can be interpreted as an individual thermodynamic system, characterized by
their corresponding resource flows.
A resource flow map, see Fig 2.2, is prepared to schematically indicate the resource
flows through individual sub-systems. On the basis of their utility, the various material
flows can categorized into two, namely product and auxiliary materials. Product materials
include all the materials that constitute the final product through their mass contributions.
Auxiliary materials are the process requisites which help to improve the process
performance. The product and auxiliary materials, relevant to the identified assembly line
are listed below.

52
Product Materials
1. Printed Circuit board (PCB)
2. Electronic components (∑EC)
3. Solder alloy (S)
4. Connector (Co)
Auxiliary Materials
1. Compressed air (A)
2. Nitrogen (N)
3. Water (CW)
4. Flux (F)
In the above list, the flux is included in process materials because in this case, it
does not leave residue. Moreover, it is not a part of the product design requirements. Flux
is used only improving the performance of soldering process.
The energy resource for processing units and conveyors are provided by the electric
power. So electrical work (W) is the primary source of the energy resource supplied to
the assembly line. With the above listed resources, the resource flow map is prepared
(Fig. 2.2).

53
Fig. 2.2 Resource Flow Map of PCB Assembly line
53

54
2.3 Assessment of mass and energy flows
2.3.1 Mass flows
The bulk flow materials flowing across the sub-system boundaries carry enthalpies
and exergies as their intensive thermodynamic properties. Along with physical properties,
the mass quantities of material flows are required to express the enthalpies and exergies
as extensive properties. The physical quantities of various material flows crossing the
boundary are quantified by direct and indirect measurement methods. Direct
measurement methods are the methods of mass measurement with an instrument or gauge
e.g. weighing scale. Indirect methods are the evaluation techniques, where mass or mass
flow rates of the materials are calculated from physical conditions of the material.
The other method for determining the masses is the by the mass balance of the
system. It is assumed that the subsystems are in steady state condition. If in and out
conditions are denoted by ‘i’ and ‘j’, then under steady state conditions, the mass balance
equation for the assembly line can be written as following.
(2.01)
Using electronic weighing scale (LC = 0.0001g), the mass of a printed circuit board
(mPCBn) is measured at the entry and exit of the each sub-system. The 42.0 g PCB (mPCB
0)
that enters the assembly line, upon all the components addition reaches 90.0 g (mPCB6) at
the end of the assembly process. Assuming steady state, all the other associated material
flows are determined using mass the balance equation (eqn. 2.01). The uncertainty
associated with this method of measurement is less than 0.05 grams and it can be
considered insignificant for evaluation purpose.

55
Table 2.1: Mass of product materials estimated by mass balance equations
Sys. #
Material Flow Balance Equation Mass per unit PCB assembly
(g)
1 PCB dust etched out , 0.01
2 Solder Paste , 1.00
3 Electronic Components , 11.50
4 Flux removed in reflow oven , 0.10
4 Solder alloy in the paste , , , 0.90
5 Connector , 35.00
6 Solder alloy 0.60
Mass flow rate of auxiliary materials were estimated based on the manufacturing
conditions (Appendix 3). All equipment is supplied continuously with a compressed air at
a pressure (PA,i) of 690 kN/m2 (100 Psi) through connecting ¼” pipes. Compressed air
consumption sequence is closely observed and the durations of consumption were
recorded for each process. Temperature of the compressed air is measured using Omega
digital thermometer, which is 17oC consistently. The nominal flow rate ( ) in a 25 mm
(¼”) diameter pipe is estimated to be at 8Nlps (0.008 m3/s) (engineeringtoolbox.com).
Compressed air is assumed to behave ideally and there are no leakages. The compressed
air delivery system is assumed to deliver at a constant flow rate consistently, i.e. variation
in mass flow rate during the production cycle is insignificant. Therefore by using the
ideal gas law, the mass flow rate of the compressed air in the inlet is determined.
,, ∙ ,
, ∙ , (2.02)
Under assumption of steady state conditions, the mass flow rates in and out are
equal. i.e.: , , .

56
Nitrogen gas is supplied for the reflow and selective soldering ovens at a pressure
of 552 kN/m2 (80 Psig) in a 15 mm (½”) diameter pipe. For calculation of mass flow
rates, it is assumed that the leakage is also insignificant and the system is efficiently air
tight. The reflow oven has a flow meter at the entry and from that it is observed that oven
consumes ( , ) at 540 Normal l/min (0.009 m3/s). Using the density of nitrogen at
N.T.P (1.165 kg/m3), the mass flow rate is determined as 10.5 g/s.
, , ∙ , (2.03)
In case of selective soldering unit, the pressure gauge and flow velocity meter is
available at the exhaust pipe of 100mm (4”) diameter. The flux added in this stage is
considered very minimal and the exhaust predominantly contains nitrogen gas and traces
of other vapors. The exhaust pressure , , velocity , ) and temperature ,
were at 0.3 kN/m2, 22.86 m/s (4500 fpm) and 55oC respectively. Using these conditions,
the flow rate of nitrogen is determined as 0.57g/s.
, , ∙ , ∙ , (2.04)
Both these ovens are run continuously during the production time. For estimation of
the mass consumed per unit board, consumption per shift (10 hours) is calculated. Using
the productivity per shift (average: 900 boards/shift), the mass of nitrogen gas
consumption per unit PCB assembly can be determined. Using this, nitrogen
consumption per unit PCB in reflow and selective soldering processes ovens 420 g and
23 g. The figures of merit for these values are subjected to the limitations of the above
described assumption. For evaluation purpose, these uncertainties are neglected.

57
Water is supplied in a 25 mm (1”) pipe to the reflow oven, which typically enters at
a temperature 6oC and exits at 15oC. By a rule of thumb in piping designs, the maximum
delivery flow velocity in a 1” pipe is considered as 1 m/s (engineeringtoolbox.com). For a
nominal system under the given conditions, velocity of the water flow in this reflow oven
is assumed to be at 0.5 m/s. From the density and pipe diameter, applying equation 2.04,
the mass flow rate is estimated to be at 245 g/s. From productivity achieved per shift, it is
calculated that reflow oven consumes 9.8 kg water for unit PCB assembly. In comparison
with the estimated values, the uncertainties associated with the above described
assumptions were considered to be negligible.
The stage by stage mass addition to the product is pictorially represented with help
of the mass flow diagram (Fig. 2.3). As shown in Table 2.1 and in Appendix 2 & 3, the
values are scattered in a wide range. So the thicknesses of the arrows were not scaled to
the mass quantities of the respective material flows.
Fig 2.3 Mass flow per unit PCB assembly
58
2.3.2 Enthalpy Flows
As explained in section 1.3.2, for the material flows that are considered as simple
solids or incompressible liquids or ideal gases, their enthalpies can be calculated from
specific heat values corresponding to the physical state of the constituent materials. . The
specific heat values for various constituent elements and compounds identified with the
product (PCB assembly) and auxiliary material flows are referred from standard sources
for physical properties of materials (NIST webbook, Kaye & Laby online, Goldsmith, A.,
et al. and Perry, R.H.).
The enthalpies carried by the minor constituents, whose mass were less than 0.01 g
the etched dust, flux were expected to carry negligible quantities and were not included.
All the sub-components are made up of various metals, alloys, polymers and organic
compounds. From the manufacturers of these components, the precise percentage mass of
individual constituents were collected. Because of proprietary concerns, many critical
compositions of were not available. In that case, the most simple or closest possible
composition materials were considered for the evaluation purpose.
But in the case of electronic components like resistors, capacitors etc., there exact
types of associations between the constituent elements or compounds are not known. So
it is assumed that electronic components are lumped together as a physical assembly or
mixture of various constituent elements and compounds, which do not interact with each
other. But in reality it may not be the case. When materials of various kinds, like in the
case of electronic components made of plastics, semiconductors, metals and chemical
compounds, it could be obvious that constituent materials as a package are tend to behave
differently. With limitations on data availability, it may be believed that the above

59
assumption can be the easy direction to proceed. Moreover, the electronic components
constitute only 11.5 g (see Table 2.1), which about 12% of the mass of the product.
Compared to the enthalpies possessed by other material flows, this uncertainty can be
considered to have minimal impact, which can be neglected.
The total enthalpy (H) carried by a component ‘D’ consisting of ‘k’ constituent at
materials at inlet condition i, will be sum of the individual contributions of all the
constituent materials (k).
∙ , ∙ , ∙ , (2.05)
Where
HB – Enthalpy carried by the component ‘D’
TD,I – Temperature of component ‘D’ (assuming uniform temp. is maintained)
mk – mass of individual constituent material ‘k’
Ck – Specific heat of constituent material ‘k’
There were about 64 different compounds and alloys. Out of that only, 29 major
constituents were taken for calculation and others whose contribution is less than 0.01%
by mass can be considered as insignificant quantities (Appendix 3).
The specific heat values of the elements vary with their physical state and
temperature. Knowing the state and temperature of the constituent materials, the specific
heats were estimated from the standard physical property tables. (NIST webbook, Kaye
& Laby online, and Perry, R.H.). The temperatures of the all these material flows were
measured at entry and exit of each system using Omega HH11A digital thermometer with

60
k-type thermocouple. This is a handheld device with a resolution of 0.1oC in a range of -
50oC to 1000oC. It is assumed that the temperature is uniform throughout the body.
Illustration: Enthalpy carried by PCB wiring board (HPCB, 0)
The mass fractions of printed circuit board (mPCB0) is made up of copper (37%), epoxy
resin (26%), silica (17%), fiber glass (6%) and other undisclosed constituents (14%). The
contributions of fiber glass and undisclosed constituents were considered insignificant.
∑ ∙
(2.06)∙ ∙ ∙ ∙ ∙
∙
Table 2.2 Enthalpies carried by the major product material flows
Similarly the enthalpies carried by the process materials are also calculated (See
Appendix 4).
Material Flow Mass,
mi Tempe-
rapture, Ti ∑ . )
Enthalpy Hi
(Units) (g) (K) (J/K) (J)
PCB (mPCB0) 42.0 291.15 24.7 7188.7
Solder paste (SP) 1.0 289.15 0.14 39.1
Elec. Components (∑ EC) 11.5 291.65 6.43 2320.7
PCB +SP +∑ EC (mPCB,3) 54.5 296.15 31.34 9733.2
Reflowed PCB (mPCB,4) 54.4 333.15 31.34 10946.5
Connector 35.0 293.15 42.54 12146.1
Final PCB Assy (mPCB,6) 90.0 348.15 61.67 25898.8

61
2.3.3 Electrical Work Flow
Electrical energy resources are the primary source of the work rate input given to
the manufacturing systems. Electric energy is continuously drawn (may be small
quantities) from the power source by the machine throughout the time for which the
machine is kept on. On the basis of the activity state, the consumption pattern of cyclic
machines can be categorized in active and passive (idle) states. The duration for which
the machine works on the product (PCB) can be considered as active state. If otherwise,
the machine is said to be in passive (idle) state. This is the period for which the machine
is kept waiting for the next job. Current consumption pattern during these two states were
observed and recorded. Based on these values, the power and work required were
calculated.
Active energy consumed is the electrical power drawn during active processing
time (cycle time of the machine). The fully automatic assembly line is often forced to
have stoppages because of technical reasons. These stoppages contribute to the idle times
and their durations vary with the severity of the issue. As the assembly line is designed to
have only a maximum inventory as explained in section 2.1.2, stopping one machine may
enforce a line stoppage. As these line stoppages are frequent and erratic, it is
cumbersome to exactly measure the average idle time for each machine in the line. In
order to quantify the idle times, all calculations were made with reference to the
production output achieved during one shift of operation (10 hours). On an average, this
particular assembly line delivers 900 PCB assemblies (450 panels) per shift. The total
time per board is about 40s. The idle time per board (taux) is calculated from the actual
processing time per assembly (tnec).

62
(2.07)
Measurement methods
The best suggested method is to monitor and record the current and voltage while
the regular running of the machines. Namely, there is a phase shift that impacts the power
otherwise calculated from the current and voltage. Current clamps and voltage probes
were used for measuring the current flow used. Fluke 33 600V CAT III clamp meter with
operating range of 0.3 A – 400 A is used to record the true RMS value of the current. For
0.3 A – 40 A range, it has a resolution of 0.01A at an accuracy of ± (2%+20). This device
also has features to capture the maximum, minimum and average reading during the
monitoring period. It also has features to get the three seconds running average when the
variations are very rapid. Voltage is monitored with probes on Fluke 73 multi-meter
600V maximum, with a resolution of 1mV at 2% accuracy. Using these probes, the
voltage and current flow values were monitored at the electrical panel of the machines.
For three phase machines, considering a balanced supply with unit power factor
( =1), the total electrical work input is calculated from phase, voltage and current
supply details (Appendix 5).
The Electrical work (WE) consumed is calculated from the observed time (t) and the
electrical power ( ) supplied. Power is quantified from the current and voltage flows
measured in the line. The assembly equipment is either single or three phased ( )
machines in the line, and so the power is calculated accordingly (eqn. 2.09, TRANSCAT,
2010). For calculation purpose, the conveyors were accounted as part of the work stations
prior to their locations.

63
, ∙ (2.08)
∙ . (2.09)
The total electrical work (W) consumed by the cyclic processes is the sum of active
(Wa) and passive (Wb) work consumed per board, which is quantified in the units of
joules.
, , , ∙ ∙ ∙ ∙ (2.10)
In case of the ovens, where the current is continuously consumed for maintaining
the temperature, the cycle time of the process is considered as the active time per board.
Many of the transport conveyors and laser etch machine at idle state draw less than
0.3 A. These current values are negligible compared to the scale of the other major flows
in the stream. So they are assumed to be at a minimum value, which is assigned as 0.01 A
for calculations. During the laser etching process, while initiating the laser, the machine
draws a maximum current of 0.5A for couple of seconds and then maintains a constant
rate of 0.38A during the processing cycle. The rotary conveyor machines also draw
different current values during different stages of the processing cycle. Those current
values and their respective durations were recorded as observed. In Reflow oven, the
current flow variations were very instantaneous, and the range was like 5A - 40A. And
hence three seconds running average values were recorded for active and passive stages
were 16A and 20A respectively. Similarly during the selective soldering, the passive
(idle) current was varying from 6 - 12 A, so the running average value of 8 A is recorded
as the passive current consumed.

64
3. Evaluation of Resources Utilized
3.1 Balance of Energy Flows
With the quantified values, the energy flows are balanced across each subsystem.
The energy balance equation for the PCB assembly line is derived on the basis of all
resources identified. From equation 1.07, with ‘i' and ‘j’ denoting in and out interaction
ports respectively, the energy balance equation for the PCB assembly line is derived.
(3.01)
In the chosen PCB manufacturing line, there is no well-defined heat energy stream
that is crossing the defined system boundary. ( ; ; excluding heat losses).
Like in any typical manufacturing system, no work is extracted out of the system
( ). In these systems, the work supplied is in the form of electrical work ( , The
enthalpy crossing the system boundary is the aggregate of the enthalpies carried by all
individual bulk mass flow interactions (∑ , ).
Apart from the energy resource carried by the material flows, in this case the
enthalpies, there are many other energy out-streams from the system. These processing
centers are fully automatic and have many electro-mechanical and pneumatic units that
help to control the system performance. Apart from heat dissipation losses, work-transfer
losses may also be experienced in the systems. Frictional losses are expected between
mechanical moving parts. Display devices use electricity and give out heat and light
radiations. In other words, these are the energy streams exhausted by the auxiliary
components of the system, which assist in production process. Apart from these, heat
losses in the form of convection and radiation are inherent in the soldering ovens. And

65
there will also be some uncertainties in the measurement methods. Due to technical
difficulties, direct measurement of these individual out streams was avoided. Instead they
are lumped together as unaccounted energy streams ( ), which effectively includes all
uncertainties in accomplishing the energy balance.
In a steady state process, the net energy balance is zero, i.e. total energy flowing in
is equal to the total energy flowing out of the boundary layer ( ). The energy
balance for the assembly line can be redrawn as the following.
, , , (3.02)
Then the unaccounted energy streams in each system can be calculated from the
relationship derived from equation 3.02.
, , , (3.03)
Table 3.1 Unaccounted energy streams in each subsystem (Appendix 5B and 7)
Process
Electrical work
Total Enthalpies
in
Total Enthalpies
out
Unaccounted Energy streams
, , ,
(Units) (kJ) (kJ) (kJ) (kJ/kg)
Bar code etching 4.50 21.24 21.43 4.31
Solderpaste printing 14.97 35.38 35.63 14.72
Component stacking 433.62 65.77 66.54 432.86
Reflow Soldering 1027.05 11575.07 11962.88 639.25
Connector stacking 18.25 41.36 42.32 17.30
Selective soldering 347.48 48.96 52.00 344.44
Total 1845.86 11787.78 12180.80 1452.85
With the above quantified energy streams are represented with a Sankey diagram.

66
Fig. 3.1 Sankey representation of Energy flows per unit mass of PCB assembly (as tabled in Table 3.1 and Appendix 5A).
66

67
3.2 Balance of Exergy Flows
The exergy carried by the resources are to be evaluated and balanced for the
assembly line. While balancing the energy flows, it is noted that there are only three
kinds of resources associated with PCB assembly line. They are electrical work (WE),
enthalpy flows (Hi) and unaccounted energy flows (λ). There is no specific heat flow into
the system.
, (3.04)
In line with the energy balance (eqn. 3.02), the exergy balance equation for the
PCB assembly line was deduced for steady state conditions.
, , , , (3.05)
3.2.1 Heat and Work exergies
The potential of the electrical work (WE) is fully available for further potential and
so its exergy is equivalent to its work quantity. The calculated electrical works are
directly taken as the electrical exergy associated.
, , (3.06)
As explained in Sec 3.1, the unaccounted energy flows (λ) are not in a single
definite form. It accounts for different forms of energy transfer which were not exactly
verified for their proportions. But this stream of energy is not available for any further
exploitation. It is mostly consumed by the system for performing auxiliary functions or
dumped into the environment. For evaluation purpose, it can be logically considered as

68
the low temperature loss in form of a heat released from the processing centers at room
temperature. Then using the equation 1.09, their exergy content can be calculated.
(3.07)
Then unaccounted energy streams are considered to carry no exergy (i.e., all this
exergy is lost).
3.2.2 Physical and Chemical Exergies
The exergy potential available with the materials entering or leaving the system is
also called as flow exergy. As explained in Sec 1.3, the exergy consists of two parts,
namely, physical and chemical exergies. Like explained in section 2.3.2, the potential and
kinetic energy carried by the material streams are insignificant. As the list of the
individual constituent elements in the product are considered in their simplified forms,
knowing their thermodynamic state (like temperature and pressure along the assembly
line) enthalpy and entropy values can be estimated. Enthalpy and entropy values for
various chemical compounds are available in many scientific resources (NIST web book,
Kaye & Laby online and Perry, R.H.). If else, approximate values of enthalpies and
entropies were calculated from their pressure, temperature and specific heats. As
explained in section 1.3.2 (equation 1.12), the physical exergy calculation for any
material stream require to know the thermodynamic properties (enthalpy and entropy)
both at the given state and at the state of thermodynamic equilibrium with the
surroundings (at the surrounding temperature (also called as restricted dead state).
The physical exergies carried by different material streams can be calculated from
the exergies carried by the individual constituent elements. It is taken into account that

69
exergy although non conserved quantity does possess the additive property. In soldering
processes, although higher temperatures are reached inside the system, the out streams
were relatively at lower temperatures. The hottest material stream crossing the system
boundary is the final product (mPCB,6) coming out of the selective soldering oven at a
temperature of 75oC. The corresponding heat carried by the PCB is dissipated to
surroundings by slow cooling along the subsequent inspections stages. Since the
temperatures of individual material streams at entry and exit of the systems are near room
temperature (20oC), their physical exergies are very small and hence in most cases
negligible.
Chemical exergy per mole of the substance is derived from the chemical potential
of the material. It can also be calculated from the Gibbs free energy of the formation
reaction. An elaborate database about the chemical exergy of various engineering
materials is available in Dr. Szargut’s Text Book on Exergy (Szargut, J., 2005). This data
is referred for calculation of chemical exergies. For example, the printed wiring board
contains about 15.5 g of copper. The chemical exergy is carried by this copper is
calculated from the reference value of 132.5 kJ/mol at atmospheric conditions (1.01 bar
and 25oC). Using the Molecular weight of copper (63.5 g/mol), chemical exergy carried
per unit mass (g) can be calculated. Then using the mass of copper, chemical exergy can
be represented as extensive property.
, , . . . (3.08)
Similarly exergy carried by all individual constituent is calculated. It is assumed
that each material stream (including the PCB assembly) is a mixture of individual
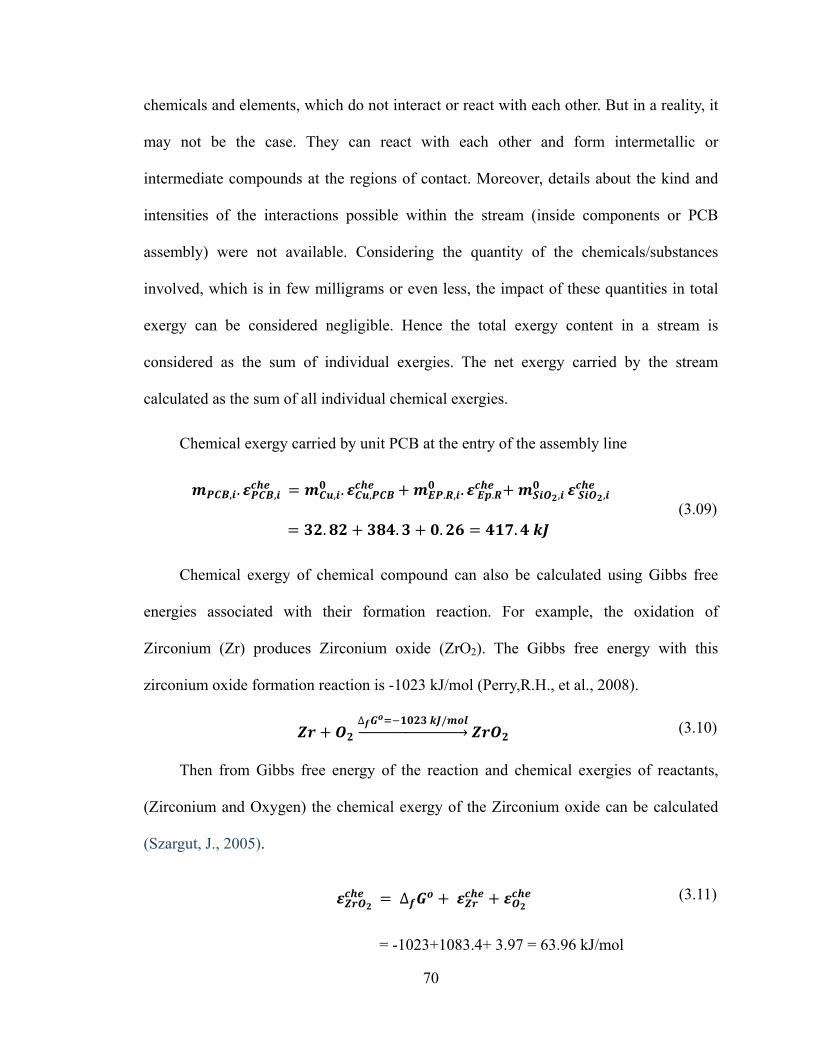
70
chemicals and elements, which do not interact or react with each other. But in a reality, it
may not be the case. They can react with each other and form intermetallic or
intermediate compounds at the regions of contact. Moreover, details about the kind and
intensities of the interactions possible within the stream (inside components or PCB
assembly) were not available. Considering the quantity of the chemicals/substances
involved, which is in few milligrams or even less, the impact of these quantities in total
exergy can be considered negligible. Hence the total exergy content in a stream is
considered as the sum of individual exergies. The net exergy carried by the stream
calculated as the sum of all individual chemical exergies.
Chemical exergy carried by unit PCB at the entry of the assembly line
, . , , . , . , . . , ,
. . . . (3.09)
Chemical exergy of chemical compound can also be calculated using Gibbs free
energies associated with their formation reaction. For example, the oxidation of
Zirconium (Zr) produces Zirconium oxide (ZrO2). The Gibbs free energy with this
zirconium oxide formation reaction is -1023 kJ/mol (Perry,R.H., et al., 2008).
∆ / (3.10)
Then from Gibbs free energy of the reaction and chemical exergies of reactants,
(Zirconium and Oxygen) the chemical exergy of the Zirconium oxide can be calculated
(Szargut, J., 2005).
∆ (3.11)
= -1023+1083.4+ 3.97 = 63.96 kJ/mol

71
The chemical exergy of the pure organic compounds can be calculated from the
structure of the constituent elements, using group contribution method (Szargut, J., 2005).
According to this method, for pure organic compounds, the chemical exergies carried by
the compound is some of the standard chemical exergy of individual carbon/chemical
groups. Using this method, the chemical exergy of organic substances in the PCB
assembly can be calculated.
In case of polymers, the chemical exergy can be calculated from the exergies of
monomer molecules using the Gibbs free energy of polymerization (as explained in eqn.
3.11). Since exact details about the polymerization reactions were not available, the
Gibbs free energy of polymerization reaction data cannot be gathered. But it was
observed that Gibbs free energy of polymerization for common polymers were within the
range of 100 - 300 kJ/mol. Considering the chemical exergies possessed by monomers,
which was 2000-10000 kJ/mol (see appendix 9), simply the Gibbs free energy of
polymerization can be considered insignificant. A detailed list of associated chemical
compounds with all their chemical exergy is available (Appendix 9).
With physical and chemical exergies calculated, the total exergy carried by each
stream can be calculated as the sum of their physical and chemical exergies (Appendices
7 and 8). Using these total exergy quantities, the exergy balance can be completed.
3.2.3 Net Exergy Balance
As all mapped resource flows were assessed in terms of exergies flowing in and out
of the system, they can be represented in Grassmann diagram (Grassmann P., 1959). In
the Fig. 3.3, the exergy flows are represented in kilojoules per unit mass of the PCB

72
assembly. This representation clearly shows the magnitude of various exergies with
respect to the mass of PCB assembly. It could be noticed that for assembling a unit PCB,
a total of about 2.5 MJ of exergy is fed to the assembly line in the form of work(W) and
auxiliary flow(∑ , ) exergies (see appendix 12). Apart from the electrical exergy
supplied to the system, the various auxiliary materials take in exergies of about 690 kJ
per PCB assembly. In that 690 kJ, of about 538 kJ of exergy is carried out as waste
streams which are dumped unutilized. These values enumerate the resource intensity of
the assembling process.
Each product at the end of the assembly line not only carries a weight of 90g but
also has an exergy content of about 1.4 MJ (See appendix 8). Most of it is in the form of
chemical exergy which shows the resource intensity of the product. This high value could
be attributed to the richness of chemical composition and their resource intense states. It
is clear that to meet the designed function the PCB assembly needs these high quality
resources. But this raises questions about the sustainability of the product design in terms
of resources utilization. It should be noted that assessment of sustainability represents a
complex matter, which may not be represented by a single (physical) metric. But in this
case, we are presenting a metric that considers only the resource utilization aspect. In
terms of mass quantities these appear as small entities (less than 100 g). But apparently
their corresponding resource intensities may be significant.
It could be observed that there is a difference in the net exergy flowing in and out of
each system. This difference is proportional to the exergy destroyed or lost inside the
system during the process. This will be relevant for measuring the efficiency of the
manufacturing in terms of resources used, expressed by exergy flows. With that objective,

73
the net exergy flow diagram is drawn for the manufacturing line.
It should be noted that unaccounted streams which were lumped to form rest of the
balance in the energy balance, were considered as low temperature heat dissipations. As
explained in earlier (equation 3.07), these exergy streams , were accounted to carry no
valuable exergy. But in reality, they may possess small quantities of exergy, which is not
utilized. In calculation of exergy loss associated with the system, these unaccounted
streams can be lumped with the exergy losses ( ).
The exergy losses identified at each sub-system, as well as for the overall
manufacturing line, are the attributes of the associated thermodynamic irreversibility, i.e.,
entropy generation in each sub-system of the manufacturing (assembly) line. From the
exergy balance (eqn. 3.05) the rate of exergy lost ( in each system in the PCB
assembly line is derived.
,
,,
,, (3.12)
This shows in the PCB assembly line, the exergy is destroyed at a rate of 22MJ/kg
of the product (PCB assembly).
From table 3.3, it can be noticed that there is an exergy loss of about 2 MJ in the
making of unit PCB assembly. When the trend of the exergy destroyed (Fig 3.3) in the
assembly line is analyzed, it is noticed that maximum of the exergy lost, about 56% is in
the reflow soldering process. It could also be noted that compared to other processes, the
reflow soldering processes requires more energy resources (Refer Table 3.1, particularly
∑ , and , ). But this is also the process more which involves controlled heating of

74
the entire board with components to about 230oC. Whereas in case of selective soldering,
most of the energy consumed is spent on maintaining the solder pot temperature, to keep
the solder molten. Moreover, only one connector unit is selectively soldered to the board.
So this heating activity is limited and concentrated only on the solder pot. That may be
the reason for less exergy loss in selective soldering than reflow soldering, in spite of
reaching higher temperature of about 380oC.
Table 3.2 Net Exergy flows in the PCB assembly line per unit PCB Assembly (see appendix 11)
Processing station / System (n)
Total (Work + Flow) Exergies in
Total (Flow) Exergies out
Net Exergy Destroyed
(Total in – Total out)
, , ,
kJ/kg kJ kJ/kg kJ kJ/kg kJ
1 Barcode Etching 4811 433 4678 421 144 13
2 Solder paste printing
5100 459 4744 427 344 31
3 Components Stacking
11067 996 5900 531 5167 465
4 Reflow Soldering 23589 2123 11344 1021 12244 1102
5 Connector Stacking 15400 1386 15200 1368 200 18
6 Selective Soldering 19244 1732 15233 1371 4011 361
Total 79211 7129 57100 5139 22111 1990
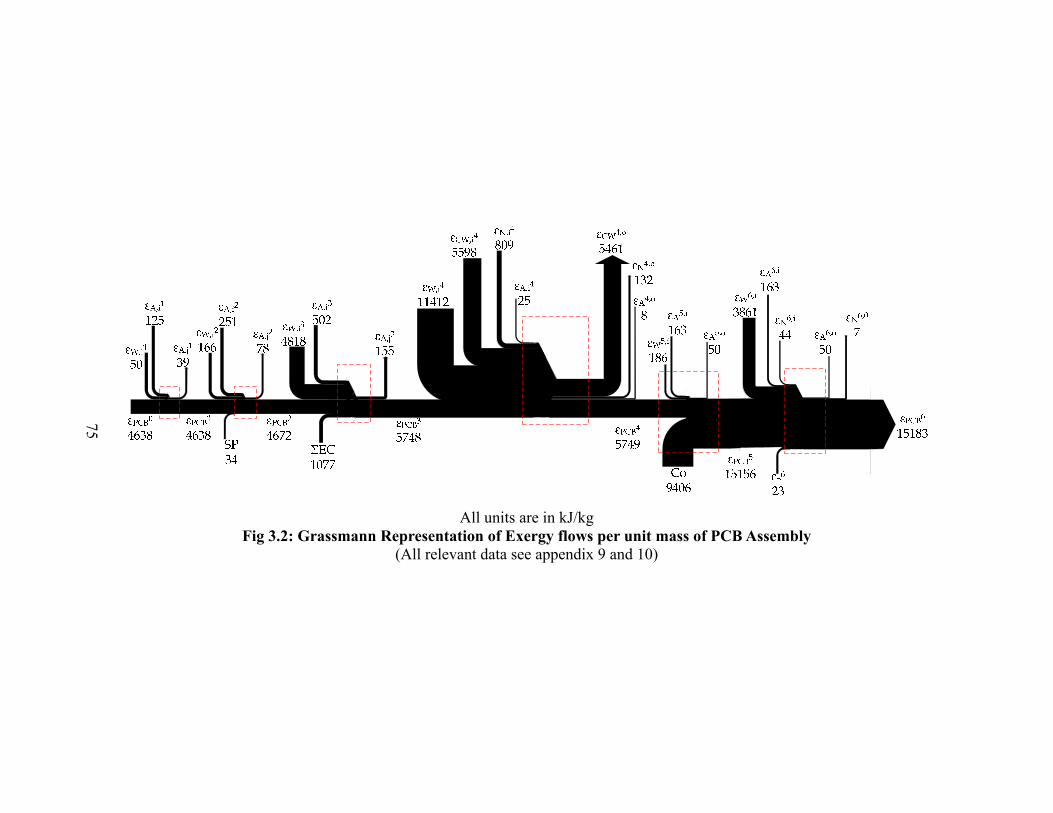
75
All units are in kJ/kg Fig 3.2: Grassmann Representation of Exergy flows per unit mass of PCB Assembly
(All relevant data see appendix 9 and 10)
75

76
Fig 3.3: Fractions of exergy lost along the PCB assembly line
3.3 Exergetic Efficiencies
3.3.1 Net Use Efficiency
A process can be evaluated on the basis of the exergy utilized and destroyed during
the manufacturing process. Efficiency of a process can be defined using the net exergies
flowing in and out of the process. The maximum exergetic efficiency of the system can
be defined as the ratio of total exergy output to the total exergy supplied to the system. In
other way, this ratio is proportional to the exergy destruction inside the system, which is
inherent in the system.
Maximum exergetic efficiency of a system
(3.13)
0.01 0.02 0.05
0.98 0.991.00
0
0.2
0.4
0.6
0.8
1
BarcodeEtching
Solder pastescreenprinting
Componentsstacking
Reflowsoldering
Connectorstacking
Selectivesoldering
Fra
ctii
on o
f n
et e
xerg
y lo
ss in
eac
h p
roce
ss
,
,
max n,εη n
i
n
j

77
Where,
,n
j - Sum of all exergies flowing out of subsystem ‘n’.
,n
i - Sum of all exergies flowing in to subsystem ‘n’.
But in a conventional manufacturing setup, not all the output exergies are utilized.
In many cases, the exergies carried by the wastes are dumped unutilized. In this assembly
line also, large quantities of exergy are dumped into environment. Of the various output
exergy flows, only the product is utilized in next station. The perception in this analyzes
is that the efficiency carried by the PCB assembly is fully required in the next station of
the assembly line. With this viewpoint, the efficiencies can be redefined with the product
achieved at the station. Then the ratio of the exergy carried by the product (PCB assy.) to
the total exergy invested in that system can be termed as the actual exergetic efficiency.
This is also termed as rational efficiency or effectiveness (Szargut, J, 2005).
Actual exergetic efficiency of the system,
(3.14)
Where,
outn
jPCB
,
, - Total exergy carried by the product at the exit of the substation.
n
i- Total exergy fed to the subsystem through various flows.
But for evaluation of manufacturing process, it is disputed to use only a selected
exergy flow quantity (product exergy) as the objective function or purpose of the process.
It may vary case to case. For example in drilling a small hole in a large mass of material,
n
i
outn
jPCB
,
,Act n,εη

78
the output (product) exergy can be the exergy carried by the large mass or the small hole
(removed material). Then, the exergetic efficiencies depend on the perspective of the
analyzer. Relevance of these exergy efficiencies (equation 3.14), as the ultimate metric
for assessing the manufacturing process sustainability should be weighed carefully
(Gutowski, T.G. et al, 2009).
Using the above equations (3.13 and 3.14), the efficiencies of the individual stations
(processes) were determined. Similarly the maximum and actual exergetic efficiency of
the assembly line was also determined and tabled (See appendix 13).
Maximum exergetic efficiency of the assembly line,
(3.15)
Actual exergetic efficiency of the assembly line,
(3.16)
Where,
n j
n
j, - Sum of all exergy flowing out of the subsystems
6
1
,
n i
n
i - Sum of all exergies flowing in to the subsystems
n
outn
PCB , - Sum of exergy carried by the PCB assembly after processing.
Using these efficiencies (see appendix 13) a comparative study of the individual
subsystems for their exergy destruction and exergy utilization was carried out. Like
6
1
,
6
1
,
max L,εη
n i
n
i
n j
n
j
6
1
,
,
act L,εη
n i
n
i
n
outn
PCB

79
explained, the maximum exergetic efficiency (equation 3.13) is proportional to the exergy
destroyed inside the subsystem. The actual exergetic efficiency (equation 3.14), can be
considered to signify the proportions of the outflowing exergies which is utilized in
subsequent operations. In Fig 3.4, these efficiencies of the subsystems are pictorially
compared.
From Fig. 3.4, it could be concluded that most of the processes use maximum of the
output exergies and their actual efficiencies are close to the maximum possible efficiency.
But Reflow soldering process is an exception in which the gap between the actual and
maximum is widest. The actual efficiency of reflow soldering process is about 24 %,
which is half of the maximum efficiency (48%). These values are very lower than the
overall line efficiencies, which has a maximum efficiency of 72% and actual efficiency of
65%. To understand the reasons for this drop, the contribution of various exergy flows
are to be studied in detail.
Fig 3.4: Comparison of Exergetic Efficiencies of the processes in the assembly line
97 93
5348
99
79
96 92
52
24
98
79
0
20
40
60
80
100
BarcodeEtching
Solder pastescreenprinting
Componentsstacking
Reflowsoldering
Connectorstacking
Selectivesoldering
Maximum exergetic efficiency (%) Actual exergetic efficiency (%)
Max Line efficiency (72%) Actual line efficiency (66 %)

80
A comparative analysis of various exergy flows in the assembly line helps to reason
the low efficiencies in the assembly line. So exergies flows in each subsystem are
grouped into three categories, namely total work exergies in ( , ), total flow exergies in
(∑ , ) and total flow exergies out (∑ , j). These lumped quantities were stacked
against the actual exergetic efficiency (Act n,
εη ) of each subsystem. In Fig. 3.5, in each
subsystem, the above lumped categorizes were compared with one another with the
exergy fractions against the total value (∑ , ∑ , , ) in that subsystem. And
the exergetic efficiency is plotted with line connecting the efficiency values in each
subsystem.
Fig. 3.5: Comparative Analyzes of various exergy flows through the PCB assembly
From Fig 3.5, it could appear that the materials flowing out of the subsystems carry
about 80% of their original exergy with which they enter the system. But this can vary
9692
52
24
98
79
0
20
40
60
80
100
0%
20%
40%
60%
80%
100%
BarcodeEtching
Solder pastescreenprinting
Componentsstacking
Reflowsoldering
Connectorstacking
Selectivesoldering
Act
ual
Exe
rget
ic E
ffic
ien
cy
% c
ontr
ibu
tion
Electrical Exergy In Flow Exergy Out
Total Flow Exergy In Actual exergetic efficiency (%)
81
case to case. For example, let us consider two auxiliary flow exergies flows, say exergy
carried by water and the nitrogen gas in reflow soldering process (See appendix 9). For a
unit PCB assembly, the exergy carried by the nitrogen gas, which enter the subsystem
with 72.8 kJ of exergy, is reduced to 11.8 kJ after utilization in reflow soldering. But in
the case of water, the exergy content remains almost intact, with a small exergy loss
( , , ) of about 12 kJ per PCB assembly only. This rich content is because the
chemical exergy content of water remain intact (based on the adopted assumptions), and
only their physical exergies are changed during the assembling process. This also means,
the quality of water is remains good which encourages recycling of water.
From Fig. 3.5, the exergetic efficiencies are observed to be low for processes which
consume more electrical exergy. This electrical exergy provided to the process gets
converted primarily into heat or mechanical work. It is in this energy transfer process that
lot of useful exergy is wasted (heat dissipation, friction). Utilization of electrical exergy
in the system plays a vital role in determining the net exergetic efficiency of the system.
3.3.2 Electrical Exergy use efficiency
Among various exergy streams, electrical exergy is predominant and it is consumed
at a rate of about 1.85 MJ per PCB assembly (see appendix 7). In mechanical assembling
process under the prevailing condition (As explained chapter 2), exergy lost in product
material is insignificant (as observed from Appendix 8 and Fig. 3.2). On observing
exergy of auxiliary flows (See appendix 12), it could be observed that for a unit PCB
assembly, the auxiliary materials (air, water and compressed air) lose only about 22% of
the exergy content inside the system. So the majority of the lost exergy should be from
the electrical exergy. This value cannot be fully attributed for the unaccounted exergy

82
out-streams (ελq), which is assumed to carry zero exergy (as explained in section 3.2.1).
This invokes interest to study the utilization pattern of electrical exergy.
From observing the consumption pattern, it is noticed that the maximum electrical
work was consumed while material is processed. But there are many occurrences in
which the machines were running idle during the production time. To evaluate this
passive consumption, one typical production shift was studied in detail. In an assembly
line where the provision for work-in-progress inventory is to be maintained at minimum
level (about 10 panels, as explained in chapter 2), the stoppage of one machine forces the
entire line to stop. But as long as the machines are plugged to an electrical power source,
machines continue to absorb some quantities of electrical work. This may be acceptable
for small users and high efficiency electrical devices but may not applicable for the
ovens. Due to high startup times, the ovens are made to maintain their temperatures
throughout the production shift.
The efficiency of a system in terms of it electrical exergy utilization is derived with
their necessary and auxiliary use quantities as defined in section 2. The electricity use
efficiency ( ) of the subsystem can be calculated as the ratio of necessary electrical
exergy (Work) to the total electrical exergy consumed by the subsystem for a unit PCB
assembly.
,
, (3.17)
Where,
, - Electrical work consumed during the active phase in the subsystem ‘n’.
, - Total Electrical work consumed by the subsystem ‘n’.

83
Similarly the Electricity use efficiency for the whole assembly line ( ) can be
derived as
∑ ,
∑ , (3.18)
Where,
∑ , - Sum of the active electrical work consumption in individual subsystems.
∑ , – Total electrical exergy invested in the manufacturing line.
Electrical use efficiency of the assembly line is just about 55%, which denotes that
rest of the energy consumed is not contributing for the assembling process.
Fig 3.6: Efficiency of Electrical Exergy Utilization in PCB assembly line
From the Fig. 3.6, it could be evidenced that except for laser etching, the other
machines operate at nearly the same electricity use efficiency, around 50%. But the actual
magnitudes of the energy consumed ( , ) are not the same. For example, though
96
5259
4944
68
0
20
40
60
80
100
Ele
ctri
city
US
e E
ffic
ien
cy (
%)
Auxiliary Use Necessary Use

84
reflow soldering and connector stacking operation run at a nearly same efficiency, their
actual intensities are very different. As evidenced in Fig. 3.7, the reflow soldering
process consumes at least sixty times more energy than that of connector stacking.
Unlike other machines, the ovens are designed to run continuously to maintain the set
point temperatures. So the power consumption is almost uniform during the shift,
resulting in poor utilization.
Fig 3.7: Electrical Exergy Consumed for various process in the assembly line
Barcode Etching
50
Screen Printing
166
Components Stacking
4818
Reflow Soldering
11412
Connector stacking
186
Selective soldering
3861
All values are in kJ/kg

85
4. Discussion
4.1 Evaluation of Resource utilization aspect of Sustainability
4.1.1 Exergy based sustainability metric
As discussed earlier (Chapter 1), the scientific and industrial communities invest a
significant effort in a search of a universal, unambiguous metric to assess the sustainable
development in different domains as well as globally. Manufacturing products and
processes must be the part of such assessments and proper selection of sustainability
metrics is an important direction of related efforts. Like demonstrated in this exercise so
far, any manufacturing product and process can be assessed in terms of exergy, to study
the resource utilization aspect. For developing optimized designs, the exergies of the
associated resources indicate their resource intensities without any ambiguity. Moreover,
the same metric may be used for various kinds of energy and material resources
(otherwise considered as physical entities, as mass and energy). So during the
product/process development, inclusion of exergy analysis helps to evaluate some aspects
of the resources sustainability of a product/process.
The exergy carried by the product is a physical indicator that may demonstrates the
resource intensity of the product through exergy balances and efficiency definitions. The
exergy content at the given thermodynamic state of a resource also reveals the potential
available with the resource to pursue on the secondary and/or subsequent lifecycles. At
the end of a lifecycle, the discarded products also carry significant quantity of exergy
potential.
The exergy indicates the resource “intensity,” a difference of a potential between
the existing (current) state, and an ultimate dead state (characterized with the presence of

86
equilibrium between a system and its surroundings). Continuous utilization in secondary
lifecycles extracts these available potentials, which may be devised with the reuse,
remanufacturing and recycling options. On this basis, comparative studies can be carried
out between two products or resource options, which can help to judge the sustainability
of the product.
In this exercise, it was observed that the resource intensity of the 90g PCB is about
1360 kJ of exergy ( , at the end of manufacturing (assembling) process. This is
carried in the form of chemical exergies possessed by the product materials associated
with the PCB. After the utilization phase in the automobile, at the end of life the PCB
dumped in the landfill may possess nearly the same quantity of exergy. However, not
only that actual, physically present resource quantity is available, rather the product has
an “imbedded” energy resource acquired during manufacturing that may be revealed only
if a LCA in exergy terms is performed. To optimally reclaim the actual hidden potential,
the PCB may have to undergo second lifecycle after reuse/ remanufacturing/recycling
options as explained earlier (Sec. 1.2). On the other hand, the existing PCB can be
redesigned to use optimal resources with an alternate more sustainable design. That could
mean that one may perform design optimization with exergy as one of the constraints.
Similarly from the sustainability viewpoint, the process may be assessed on the
basis of exergetic efficiencies. Like explained earlier (Sec 3.3), the exergetic efficiency of
the process directly indicates the effectiveness of a resource utilization and the exergy
loss is the indicator of resource destruction happening inside the system. The low value
of 24% in reflow soldering (see appendix 13), precisely enumerates the limitations of the
existing reflow soldering technology. With replacement of lead solders with lead-free

87
alternatives, within the confines of the same manufacturing technology, requires reaching
higher temperatures for soldering. This will increase the resource consumption,
particularly electrical exergy. This can further worsen current situation and lower
efficiencies. So, the trade-offs must be considered between the environmental impact and
resources use within the given technology, or a transformational technology must be
developed (Sekulic, D.P., 2011)
Moreover the exergies of the outgoing streams carry their resource intensities,
which may cause local disturbances when dumped into the environment. In the case
considered, water is continuously recycled for few more cycles and only its physical
exergy is transferred to the environment. Since physical exergy of water constitutes a
small value, the most of their exergy would be reutilized. But the exergy of the exhaust
gases are transferred to the surroundings often without any use. The exergies of the
compressed air out may include some physical exergy (chemical exergy will not
significantly differ at the exit from the value at the inlet) which may indicate a measure of
a resource spent (availability of compressed air used for the process). The practical step
for reducing this exergy loss would be to minimize the compressed air requirement and
effective utilize the available compressed air.
Considering the exergy investments in different production phases, the analyses of
exergetic efficiencies may point out the directions for further development. Like in this
case study, the comparative analysis of electrical exergy investments between active and
passive production regimes indicate the exergy potential lost during passive (idle) phases
of production. In this assembly line about 45% of the electricity invested is not
productive due to maintaining the furnace temperature continuously. There is a need to

88
develop alternate production methods featuring the resource consumption that is
comparatively less than the existing state-of-the-art processes. To replace conventional
soldering techniques with new transformational, developing technologies (like laser
soldering, conductive adhesives etc.) is usually a big leap forward which may demand
more support from the engineering communities, and may impact in diverse domains of
sustainability (economic impact, social impact etc.).
One of the tenets of sustainability is to earn economic benefits. To understand the
economics, the costs associated with exergies are to be evaluated. This kind of studies has
been developed in energy field and is called ‘Thermo-economics’ or ‘Exergonomics’.
This methodology is virtually never implemented for energy using manufacturing
systems (except for large petrochemical and process industry plants (Bejan, A., et al.,
1996) The cost of a unit exergy in a resource depends on the availability and market
value of the resource. On this basis, the exergies can be represented in terms of their
monetary values. On further extension, the cost associated with the rate of exergy
destruction inside a process can also be evaluated.
4.1.2 Limitations of Exergy metrics
Like demonstrated, the exergy analyzes can help to evaluate different types of
resources in same units without compromises or ambiguities. For an extensive
application, the analysis method is needed to be simple to use. But the intricacies of
exergy analysis impede the wide spread application. At present, concept of exergy
analysis for non-energy systems are in developing stage. Although the significance of
such an analysis looks promising, the full potential of it needs to be explored.
Optimum use of exergy, followed with a minimum exergy loss can be the premise
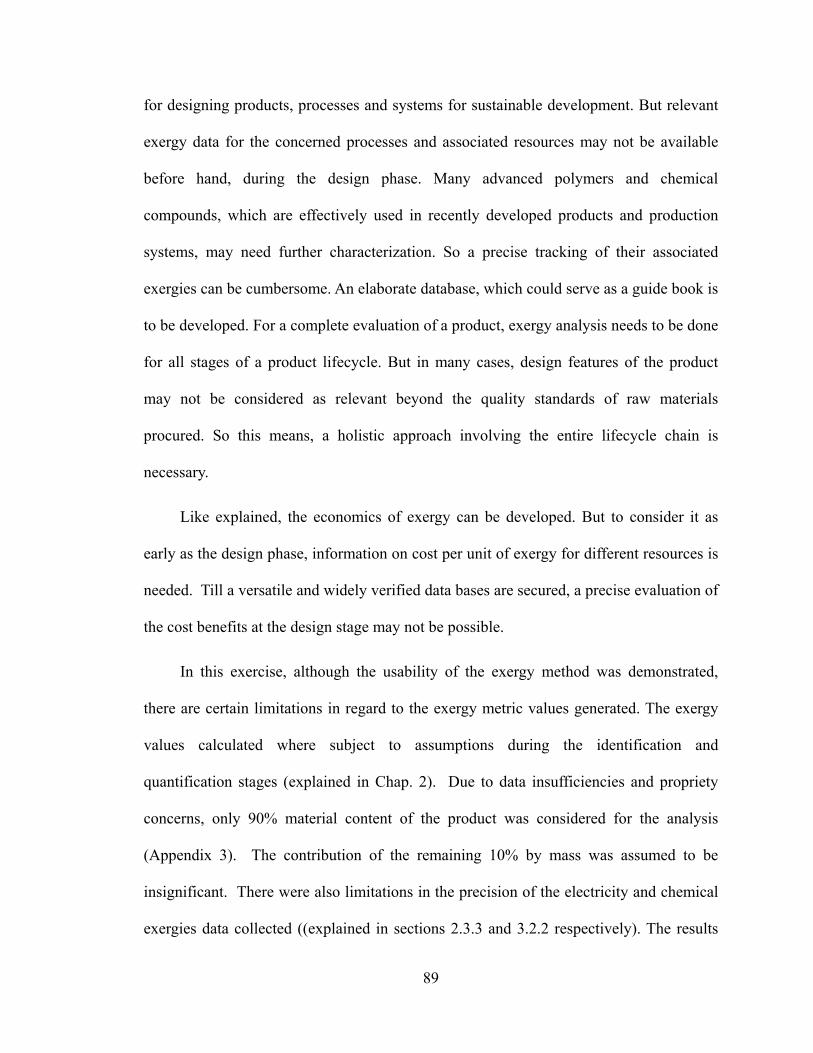
89
for designing products, processes and systems for sustainable development. But relevant
exergy data for the concerned processes and associated resources may not be available
before hand, during the design phase. Many advanced polymers and chemical
compounds, which are effectively used in recently developed products and production
systems, may need further characterization. So a precise tracking of their associated
exergies can be cumbersome. An elaborate database, which could serve as a guide book is
to be developed. For a complete evaluation of a product, exergy analysis needs to be done
for all stages of a product lifecycle. But in many cases, design features of the product
may not be considered as relevant beyond the quality standards of raw materials
procured. So this means, a holistic approach involving the entire lifecycle chain is
necessary.
Like explained, the economics of exergy can be developed. But to consider it as
early as the design phase, information on cost per unit of exergy for different resources is
needed. Till a versatile and widely verified data bases are secured, a precise evaluation of
the cost benefits at the design stage may not be possible.
In this exercise, although the usability of the exergy method was demonstrated,
there are certain limitations in regard to the exergy metric values generated. The exergy
values calculated where subject to assumptions during the identification and
quantification stages (explained in Chap. 2). Due to data insufficiencies and propriety
concerns, only 90% material content of the product was considered for the analysis
(Appendix 3). The contribution of the remaining 10% by mass was assumed to be
insignificant. There were also limitations in the precision of the electricity and chemical
exergies data collected ((explained in sections 2.3.3 and 3.2.2 respectively). The results

90
obtained on exergy loss and exergetic efficiencies (in sections 3.2.3 and 3.3 respectively)
are precise within the limitations of the assumptions (as explained in chapters 2 and 3).
4.2 Limitations of traditional energy intensive practices
Traditional manufacturing processes are designed to deliver quality products with
the resource use as a factor of cost for product performance. Resources and process
parameters are optimized for the best quality and its associated economics. But in
sustainable manufacturing, minimization of resource use and elimination of wastes and
harmful concerns should be included in an objective function. The challenge for
sustainable development lies in designing profitable products and processes, which must
satisfy much more complex objective functions – as a rule not explicitly formulated. In
the pursuit for minimization of resource use and elimination of wastes, a full exploitation
of potentials hidden in the resources is necessary. The exergy approach brings more than
the energy approach. The additional aspect addressed is the quality of an energy resource
(included through thermodynamic irreversibility and expressed through exergy losses).
So, the resource use efficiencies of manufacturing processes are to be assessed to identify
the critical factors which essentially affect both (i) quantity, and (ii) quality of resources
use for the product sustainability.
Lead free soldering is the most significant industrial initiative that improves the
sustainability rating of the PCB assembly and electronic products. This study was,
however, conducted only for a lead containing soldering assembly line. This traditional
process consumes resources (both material and energy) at a rate of about 28MJ/kg of
PCB assembly (see appendix 12). As explained earlier (see Section1.3), the lead free
alternatives demand more process resources than the existing lead soldering method.

91
Since the technology would not be altered (except for material change and operating
parameters change – with the sequence the same), the switch to lead free solders is
expected to have higher resource intensities. This may create reservations regarding the
resources effectiveness of the new lead-free processing. However, the new approach is
mandated by the requirement that is beyond the energy/material resource use, in the
domain of environmental and human (societal) protection. This is an excellent example of
a complex trade-off situation imposed by a sustainable development implementation at
the level of a manufacturing process.
During a soldering process, the solder alloy is melted and let to make joint, driven
by surface tension between the connectors/leads, substrate and liquid solder alloy made
of Sn-Pb. In this 90g PCB assembly, the quantity of eutectic Sn-Pb alloy solder is about
1.5g. Theoretical calculations show that the energy requirement for a complete melting
1.5g of Sn-37Pb solder alloy is only about 50 J. But in this assembly, the soldering
processes together demand an electrical exergy of about 1.4 MJ for each PCB assembly!
The difference between the theoretical minimum resource use and an industrial
manufacturing process is about O (105)! (See appendix 15). Although an idle running of
the ovens and other losses associated with the manufacturing system could cause this
high value, a fundamental reason is the necessity to use a large quantity of exergy to heat
the other material flows (including some auxiliary flows, and surroundings). More
precisely, this large need is because in a traditional soldering technology, along with the
solder alloy, the components, and the entire chamber are to be heated to a temperature as
high as 230oC, and subsequently cooled without utilizing the invested energy resources.
The energy invested in heating is dumped into the environment by the subsequent cooling

92
processes. Moreover, a lack of instantaneous heat generation in any such conventional
method, costs more resources for processes to maintain the required thermal state inside
the system. IN the context of sustainability, this limits the performance of the soldering
process dramatically.
Since the resource use margin between the existing technology and the assessed
minimum resource use is too wide, it cannot be overcome within the present technology
solutions. This demands an alternate non-intensive (resource conserving) technology (if
other trade-offs permit such a change), which must be commercially viable and
industrially efficient. Few techniques under development are the electrically conductive
adhesives (ACA), laser soldering, ultrasonic soldering, solder jet printing etc. Only a
limited heating is required in these techniques, the losses are expected to be minimum.
But as of now, there are reservations about the applicability of these techniques for a
mass production of dense circuit boards.

93
5. Conclusion
5.1 Summary
It appears that sustainable development will be the only option for the society in the
twenty first century. But to navigate and monitor the progress, metrics for measuring
sustainability are needed. One of the aspects for such a development is the optimal use of
appropriate materials and energy resources, as imposed by the requirements of
sustainable development. The universal metric for assessment of resources use may be
offered by thermodynamics. The metric evaluates at a given state of the system, the level
of available energy used or obtained by the system. This available energy is also called
exergy. Potency and versatility of such a metric, so far has been demonstrated and
extensively used in energy systems. There are challenges in using it in non-energy
systems, such as manufacturing systems. One such exercise was carried out in this work
and it is applied in manufacturing of PCB assembly by soldering process.
Like every resource is quantified in mass and energy quantities, it can be in
measured in terms of exergies associated with the resources. The exergy analysis can
enumerate both the resource quantity and its hidden quality. In the case of this study, each
PCB is weighing 90 g and carries about 1.4MJ of exergy. It was estimated that for each
PCB assembly, about 2MJ of exergy is destroyed along the path of product
manufacturing by the adopted technique, which involves soldering. This value adds to the
overall resource requirement that can (and should) be determined for a PCB assembly
during its lifecycle. This relatively high value (i.e., about 22 MJ/kg of the product)
signifies limitations of a traditional (although the state of the art) soldering process, one
of the traditional manufacturing techniques.

94
In the existing soldering technology, apart from the required solder quantity, the
energy resources are invested for inevitable heating of the significant mass of associated
materials, which increases the resource consumption. The difference between the
theoretical minimum energy requirement and the existing practice is for multiple orders of
magnitude, i.e. O (104). It is assessed that no appreciable investments of capital, energy
and material resources and time can bring the existing technology closer to the theoretical
minimum values – unless novel, transformational technologies are introduced. This, for
example, signifies a need for developing alternate joining technologies and/or netshape
assembly procedures that may operate closer to the idealized conditions.
5.2 Future Areas of Interests
Viabilities of exergy analysis for non-energy (manufacturing) systems analysis were
demonstrated on the identified PCB assembling process. In the current work, exergies
associated with the identified product and the associated assembly line were quantified
and analyzed. This analysis can be further extended into a thermo-economic analysis for
evaluating economic significance by appropriately identifying the cost value of a unit of
exergy, hence converting an exergy balance into a monetary objective function. Similarly,
the exergy flows may be pondered to express the environmental impact associated with
the products, auxiliary by-products and released effluents,
To have the full assessment of a product, in this case the chosen PCB assembly, the
analysis has to be performed along its lifecycle. Moreover, such effort may be performed
for any subsequent life cycle as well. The main premise is that these material/energy
resources can be recovered in part from the process/product and or effluents and put back
into another lifecycle, through reuse/remanufacturing/recycling options.

95
In evaluation of the process exergies, it was found that 45% of the net energy
consumed is used in passive phase of production. Effective counter measures can be
developed to improve the active utilization phase over the passive phase. This can be
done by improving the productivity and by reducing the line stoppages. Methods can be
developed to maintain an optimal temperature in the ovens during the passive phases of
operation and hike the temperatures to the required values during the active phase of
production. This variable consumption pattern can reduce the passive phase electricity
consumption. But these remedies within the given technologies, most likely would not
lead to significant reductions of resources use. The solution has to be uncovered in
developing and implementing entirely new process technologies, the so-called
transformational technologies.
A detailed study the exergy destruction in the soldering ovens can be carried out.
Similar studies as conducted for lead solders, should be carried out for lead-free
alternatives, which are of the current interests in a search for sustainable development
alternatives in a PCB assembling process (for example, reduction of the ecological
footprint). Such studies will offer a margin of difference between the existing (less energy
intensive!) soldering technologies and lead-free alternatives (most likely more energy
intensive but with a smaller ecological footprint).

96
6. Appendix
List of Appendix
APPENDIX 1: LIST OF SUB-COMPONENTS ON THE PCB ASSEMBLY ............................. 97
APPENDIX 2: MASS OF PRODUCT MATERIALS, MEASURED VALUES ........................... 98
APPENDIX 3: AUX. MATERIALS - RECORDED AND QUANTIFIED MASSES. ................ 99
APPENDIX 4: LIST OF PRODUCT MATERIALS INCLUDED FOR EVALUATION ........... 100
APPENDIX 5A: ENTHALPY IN THE AUX. MATERIAL FLOWS FOR UNIT PCB ASSY . 101
APPENDIX 5B: ENTHAPY FLOWS PER UNIT PCB ASSEMBLY ........................................ 102
APPENDIX 6: ELECTRICAL WORK (WE) MEASUREMENT ............................................... 103
APPENDIX 7: ELECTRICAL EXERGY SUPPLIED PER UNIT PCB .................................... 104
APPENDIX 8: FLOW EXERGY CARRIED BY PCB AND ASSO. COMPONENTS .............. 105
APPENDIX 9: FLOW EXERGIES CARRIED BY AUXILIARY MATERIALS ...................... 106
APPENDIX 10: CHEMICAL EXERGY OF VARIOUS CONSTITUENT COMPOUNDS ...... 107
APPENDIX 11: EXERGY FLOW THROUGH THE SYSTEMS PER UNIT PCB ASSY. ........ 108
APPENDIX 12: WORK AND AUXILIARY FLOW EXERGIES PER UNIT PCB ASSY. ....... 109
APPENDIX 13: EXERGETIC EFFICIENCY OF THE SUBSYSTEMS ................................... 110
APPENDIX 14: ELECTRICAL EXERGY USE EFFICIENCY FOR UNIT PCB ASSY. ....... 111
APPENDIX 15: COMPARING THE ACTUAL WORK CONSUMPTION WITH THE IDEAL
ENERGY REQUIREMENT. ....................................................................................................... 112

97
Appendix 1: List of Sub-components on the PCB assembly
S. No. Component Type No. of Units
1 PCB 1
2 Connector 1
3 Filter 1
4 Resonator 2
5 Integrated Circuits 7
6 Transistor 7
7 Zener diode 9
8 Diode 15
9 Capacitor 99
10 Resistor 151
TOTAL 293

98
Appendix 2: Mass of Product Materials, measured along the assembly line using weighing scale
Instrument: Digital weighing scale
Least count: 0.0001g
S. No. Product material Denoted
by
Average mass considered for evaluation
(g)
1 PCB 42.0
2 Etched PCB 42.0
3 Etched PCB with Solder paste deposited 43.0
4 Etched PCB with Solder paste and components stacked 54.5
5 Reflow soldered PCB assembly 54.4
6 Connector 35.0
7 Reflowed PCB with Connector 89.4
8 Selective soldered PCB assembly 90.0

99
Appendix 3: Auxiliary Materials and their recorded values and quantified masses.
Materials and Intake type and conditions
Process
Mass flow rate
Mass consumed per board
(g/s) (g)
Compressed air Barcode etching 9.64 48.2
Cyclic Consumption Solder paste screen-printing 9.64 96.4
PAi = 100 Psig = 690 kN/m2 Component stacking 9.64 192.8
T Ai= 17oC = 290.15 K Reflow soldering 9.64 9.64
φAi= ¼” = 8 mm Connector stacking 9.64 62.7
Selective soldering 9.64 62.7
Nitrogen Reflow soldering
10.5 420 Continuous Consumption P = 80 Psig = 552 kN/m2
Time : 36000 s / shift V = 540 n l/min= 0.009 m3/s
Output: 900 boards Selective soldering
0.57 23 P = 0.3 kN/m2
TN5,i = 55oC = 338.15 K
v = 4500 fpm = 22.86 m/s
Water Reflow soldering
245 9800 Continuous Consumption φCW = 25 mm
Time : 36000 s / shift TCW5,i = 279.15 K
Output: 900 boards

100
Appendix 4: List of Product Materials included for evaluation
S.No Element Formula / Structure Mass (g) % mass
1 Copper Cu 27.36 30.40
2 Plastic-bakelite (C8H9O)n 22.37 24.86
3 Epoxy Resin (C18H24O)n 11.28 12.53
4 Silica SiO2 10.15 11.28
5 Zinc Zn 4.2 4.67
6 Solder alloy 63Sn-37Pb 1.5 1.67
7 Aluminum Al 1.09 1.21
8 Alumina Al2O3 0.59 0.66
9 Butyl Rubber C9H16 (C5H8. C4H8) 0.42 0.47
10 Barium oxide BaO 0.26 0.29
11 γ-Butyrolactone C4H6O2 0.22 0.24
12 Cellulose (C6H10O5)n 0.15 0.17
13 Titanium oxide TiO2 0.14 0.16
14 Tin Sn 0.13 0.14
15 Nickel Ni 0.13 0.14
16 Silicon Si 0.1 0.11
17 Ferric oxide Fe2O3 0.09 0.10
18 Iron Fe 0.08 0.09
19 Talc 3MgO/4SiO2/H2o 0.07 0.08
20 Lead Pb 0.05 0.06
21 Phenol Formaldehyde Resin (C8H9O)n 0.04 0.04
22 Epoxy resin bromide (C8H23O2Br) 0.03 0.03
23 Silver Ag 0.03 0.03
24 Zinc oxide ZnO 0.03 0.03
25 Zirconium-dioxide ZrO2 0.02 0.02
26 Silicone cmpd (SiC2H6O)n - 0.02 0.02
27 Gold Au 0.02 0.02
28 carbon black C 0.01 0.01
29 Nickel-monoxide NiO 0.01 0.01
30 Others† 9.41 10.46
† Includes materials that are < 0.01 % by mass and undisclosed proprietary materials.

101
Appendix 5A: Enthalpy in the auxiliary material flows consumed for unit PCB assembly
Materials Process Cycle time
Mol Wt.
Temp., Ti
Mass flow rate
Mass per
PCB
Sp. Heat of air
Enthalpy Carried per PCB assembly
s g/ mol K g/s g kJ/kg.K J kJ/kg
Compressed Air
Barcode etching
In 10
28.97 290.15 9.6 48.2 1.005 14055.16 156.17
Out 28.97 293.15 9.6 48.2 1.005 14200.48 157.78
Solderpaste screen-printing
In 20
28.97 290.15 9.6 96.4 1.005 28110.31 312.34
Out 28.97 293.15 9.6 96.4 1.005 28400.96 315.57
Component stacking – I
In 20
28.97 290.15 9.6 96.4 1.005 28110.31 312.34
Out 28.97 293.15 9.6 96.4 1.005 28400.96 315.57
Component stacking – II
In 20
28.97 290.15 9.6 96.4 1.005 28110.31 312.34
Out 28.97 293.15 9.6 96.4 1.005 28400.96 315.57
Reflow soldering
In 2
28.97 290.15 9.6 9.6 1.005 2811.03 31.23
Out 28.97 293.15 9.6 9.6 1.005 2840.10 31.56
Connector stacking
In 13
28.97 290.15 9.6 62.7 1.005 18271.70 203.02
Out 28.97 293.15 9.6 62.7 1.005 18460.62 205.12
Selective soldering
In 13
28.97 290.15 9.6 62.7 1.005 18271.70 203.02
Out 28.97 293.15 9.6 62.7 1.005 18460.62 205.12
Nitrogen
Reflow soldering
In 40
28.01 292.15 10.5 419.4 1.040 127428.82 1415.88
Out 28.01 333.15 10.5 419.4 1.040 145312.03 1614.58
Selective soldering
In 40
28.01 292.15 0.6 22.8 1.040 6805.93 75.62
Out 28.01 328.15 0.6 22.8 1.040 7644.58 84.94
Water Reflow
soldering In
40 18.01 279.15 245.0 9800.0 4.180 11435100.60 127056.67
Out 18.01 288.15 245.0 9800.0 4.180 11803776.60 131153.07
101

102
Appendix 5B: Enthapy flow through subsystems per unit PCB assembly
S.no
Process Energy flow Symbol Enthalpy Hi Hj
kJ kJ kJ
1 Barcode Etching
PCB in Hpcb,i0 7.19
21.24 21.43
PCB out Hpcb,j1 7.23
Etched dust out Hed,j1 0.00
comp air in HA,i1 14.06
comp air, out HA,j1 14.20
2 Solderpaste
printing
PCB in Hpcb,i2 7.23
35.38 35.63
Solder paste, in Hsp,i2 0.04
PCB out Hpcb,j2 7.23
comp air in HA,i2 28.11
comp air out HA,j2 28.40
3 Component
Stacking
PCB in Hpcb,i3 7.23
65.77 66.54
ΣEC in HΣC,i3 2.32
PCB out Hpcb,j3 9.73
comp air in HA,i3 56.22
comp air out HA,j3 56.80
4 Reflow
soldering
PCB in Hpcb,i4 9.73
11575.07 11962.88
PCB out Hpcb,j4 10.95
comp air in HA,i4 2.81
comp air out HA,j4 2.84
Nitrogen in HN,i4 127.43
Nitrogen out HN,j4 145.31
Water in HCW,i4 11435.10
Water out HCW,j4 11803.78
5 Connector stacking
PCB in Hpcb,i5 10.95
41.36 42.32
Connector in HCo,i5 12.15
PCB out Hpcb,j5 23.86
comp air in HA,i4 18.27
comp air out HA,j5 18.46
6 Selective soldering
PCB in m6 23.86
48.96 52.00
PCB out m7 25.90
Solder, in S7 0.03
Flux added, in F7i 0.00
Flux vapors out F7o 0.00
comp air in a7i 18.27
comp air out a7o 18.46
Nitrogen in N7i 6.81
Nitrogen out N7o 7.64

103
Appendix 6: Electrical work (WE) Measurement
Processing Equipment Phase
Voltage Current per panel Processing
time per panel
Active Work
Total Idle time per shift
Passive work Total Electrical work
(Condition) Idle Active Active per panel For 450
panels/shift per panel per PCB assy
ф Vi Iaux Inec tnec Wnec,i Taux x 450 Waux,i WE,in
(Units) # (V) (A) (A) (s) (J) (s) (J) (J) (kJ/kg)
Barcode etching 3 206 0.01 0.38 / 0.5 33 / 2 8367.72 20250 278.10 4322.91 48.03
Conveyor -1 1 117 0.01 0.44 5 257.40 33750 87.75 172.58 1.92
SP screenprinting 1 117 2.8 3.6 36 15163.20 19800 14414.40 14788.80 164.32
Conveyor -2 1 117 0.01 0.3 8 280.80 32400 84.24 182.52 2.03
Components staking -1 3 208 7 10.5 40 262080.00 18000 174720.00 218400.00 2426.67
Conveyor -3 1 117 0.38 0.5 / 0.7 5 / 5 702.00 31500 3112.20 1907.10 21.19
Components staking-2 3 208 7 10 40 249600.00 18000 174720.00 212160.00 2357.33
Conveyor -4 1 117 0.18 0.4 24 1123.20 25200 1179.36 1151.28 12.79
Reflow soldering 3 480 16 20 35 1008000.00 20250 1036800.00 1022400.00 11360.00
Conveyor -5a 1 117 0.01 0.4 9 421.20 31950 83.07 252.14 2.80
Conveyor -5b 1 117 0.38 0.42 8 393.12 32400 3201.12 1797.12 19.97
Conveyor -5c 1 117 0.01 0.44 8 411.84 32400 84.24 248.04 2.76
Conveyor -5d 1 117 0.44 0.40 / 0.6 8 /8 936.00 28800 3294.72 2115.36 23.50
Conveyor -5e 1 117 0.01 0.33 10 386.10 31500 81.90 234.00 2.60
Connector stacking 1 206 1.8 1.8 / 2 32/3 14955.60 20700 17056.80 16006.20 177.85
Conveyor -6a 1 117 0.42 0.5 /0.34 8/4 627.12 30600 3341.52 1984.32 22.05
Conveyor -6b 1 117 0.01 0.38 10 444.60 31500 81.90 263.25 2.93
Selective soldering 3 205 8 22 35 473550.00 20250 221400.00 347475.00 3860.83
103

104
Appendix 7: Electrical Exergy (εW) supplied for each process per unit PCB
S.
No
Process Electrical exergy
( , )
(Units) kJ/kg kJ
1 Barcode Etching 50 4.50
2 Screen Printing 166 14.97
3 Components Stacking 4818 433.62
4 Reflow Soldering 11412 1027.05
5 Connector stacking 186 18.25
6 Selective soldering 3861 347.48
Total 20493 1845.86

105
Appendix 8: Flow Exergy carried by PCB and associated components
Product & symbol Physical
Exergy
( )
Chemical
Exergy
( )
Total Exergy
( )
(Units) (J) (J) (J) (kJ/kg)
PCB (MPCB0) 0.2 417411.8 417411.9 4637.91
Etched PCB (MPCB1) 0.0 417411.8 417411.8 4637.91
Solder Paste (MSP1) 0.0 3050.0 3050.0 33.89
PCB + SP (MPCB2) 0.0 420461.8 420461.8 4671.80
Elec. Components (MEC3) 0.0 96947.3 96947.4 1077.19
PCB + SP + EC (MPCB3) 0.5 517290.8 517291.3 5747.68
Reflowed PCB (MPCB4) 82.3 517291.0 517373.2 5748.59
Connector (MCo5) 0.0 846524.6 846524.6 9405.83
PCB + Co (MPCB5) 93.4 1363971.6 1364065.1 15156.28
Solder alloy (MS6) 0.0 2033.3 2033.3 22.59
Final PCB assy. (MPCB6) 341.68 1366088.8 1366430.5 15182.56
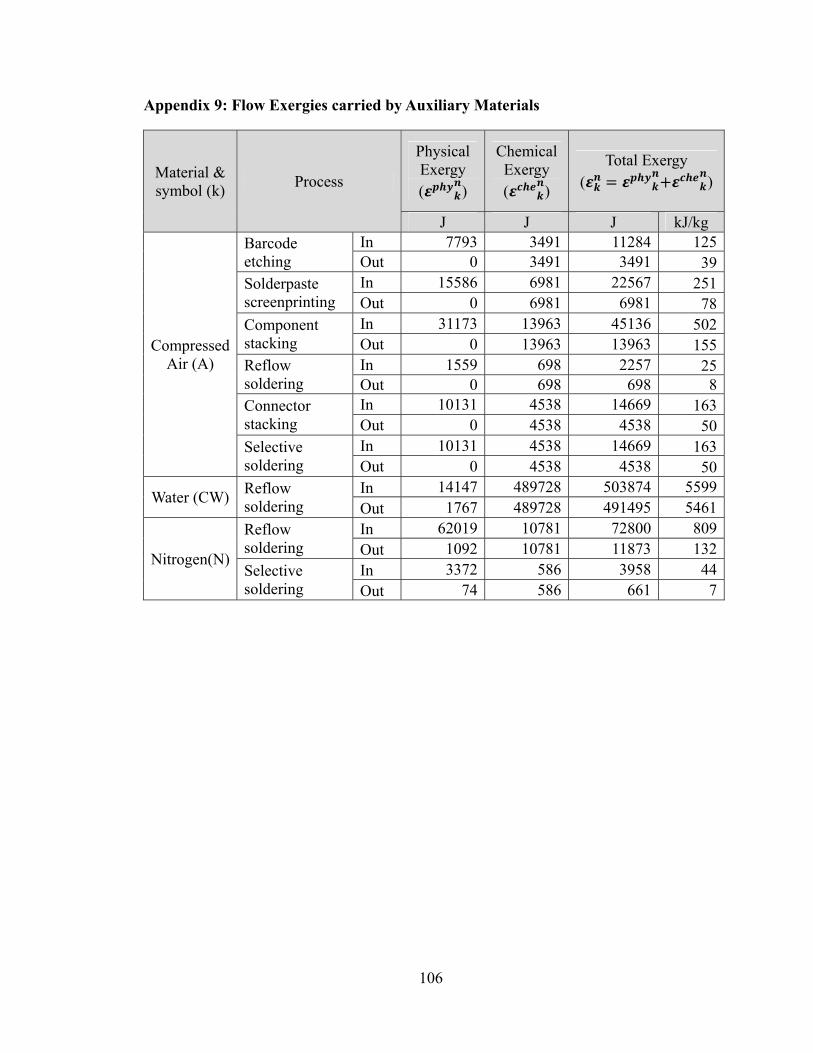
106
Appendix 9: Flow Exergies carried by Auxiliary Materials
Material & symbol (k)
Process
Physical Exergy ( )
Chemical Exergy ( )
Total Exergy ( )
J J J kJ/kg
Compressed Air (A)
Barcode etching
In 7793 3491 11284 125Out 0 3491 3491 39
Solderpaste screenprinting
In 15586 6981 22567 251Out 0 6981 6981 78
Component stacking
In 31173 13963 45136 502Out 0 13963 13963 155
Reflow soldering
In 1559 698 2257 25Out 0 698 698 8
Connector stacking
In 10131 4538 14669 163Out 0 4538 4538 50
Selective soldering
In 10131 4538 14669 163Out 0 4538 4538 50
Water (CW) Reflow soldering
In 14147 489728 503874 5599Out 1767 489728 491495 5461
Nitrogen(N)
Reflow soldering
In 62019 10781 72800 809Out 1092 10781 11873 132
Selective soldering
In 3372 586 3958 44Out 74 586 661 7

107
Appendix 10: Chemical Exergy of various constituent compounds
Element/Compouds Symbol / Formula
Mol. Wt
Specific Chemical Exergy Source/
Method g/mol kJ/mol kJ/kg
Copper Cu 63.54 134.20 2112 Data table
Silica SiO2 60.08 2.20 37 Data table
Aluminum Al 26.98 795.70 29492 Data table
Alumina Al2O3 101.96 15.00 147 Data table
Butyl Rubber C5H8. C4H8 124.22 5043.97 40605 Group Con.*
Epoxy Resin (C18H24O)n 284 9995.37 35195 Group Con.*
Plastic-bakelite (C8H9O)n 121 4424.36 36565 Group Con.*
Barium oxide BaO 153.33 252.00 1644 Data table
gamma-Butyrolactone C4H6O2 86.08 2072.24 24073 Group Con.*
Cellulose (C6H10O5)n 162.14 3013.44 18585 Group Con.*
Titanium oxide TiO2 79.87 21.70 272 Data table
Tin Sn 118.71 551.90 4649 Data table
Nickel Ni 58.69 232.70 3965 Data table
Silicon Si 28.09 854.90 30434 Data table
Ferric oxide Fe2O3 159.69 12.40 78 Data table
Iron Fe 55.85 374.30 6702 Data table
Talc 3MgO/4SiO2/H2O 379.27 14.80 39 Data table
Lead Pb 207.20 232.80 1124 Data table
Phenol Formaldehyde Resin (C8H9O)n 121 4424.36 36565 Group Con.*
Epoxy resin bromide (C8H23O2Br) 347 10078.72 29045 Group Con.*
Silver Ag 107.87 70.20 651 Data table
Zinc oxide ZnO 81.39 22.90 281 Data table
Zirconium-dioxide ZrO2 123.22 63.964 519 Formation†
Silicone cmpd - - Dimethyl silicone (SiC2H6O)n 74.14 2271.66 30640 Group Con.*
Gold Au 196.97 59.9 304 Data table
carbon black C 12.01 409.87 34127 Data table
Nickel-monoxide NiO 74.69 23.00 308 Data table
Solder alloy 63Sn-37Pb 140.82 437.11 3104 mole fract.**
Zinc Zn 65.39 134.20 5187 Data table
Air 78N2-21O20.9Ar0.04CO2 28.97 2.10 73 mole fract.**
Nitrogen N2 28.15 0.72 26 Data table
Water H2O 18.01 0.90 50 Data table
Source: Szarguts, J., (2005).
† Calculated from Gibbs free energy of formation reaction.
*Group Contribution method
**Contribution on the basis of mole fraction.

108
Appendix 11: Exergy Flow through the systems in manufacturing line per unit PCB assembly
S.
No
(n)
Process Electrical exergy
Total Flow
Exergy in
Total Flow Exergy
out
Net Exergy Destroyed
( , ) (∑ , ) (∑ , )
(Units) kJ/kg kJ kJ/kg kJ kJ/kg kJ kJ/kg kJ
1 Barcode Etching 50 5 4763 429 4677 421 144 13
2 Screen Printing 166 15 4923 443 4749 427 344 31
3 Components Stacking 4818 434 6250 563 5903 531 5167 465
4 Reflow Soldering 11412 1027 12180 1096 11349 1021 12244 1102
5 Connector stacking 186 17 15216 1369 15207 1369 200 18
6 Selective soldering 3861 347 15386 1385 15240 1372 4011 361
Total 20493 1844 58718 5285 57125 5141 22111 1990
108
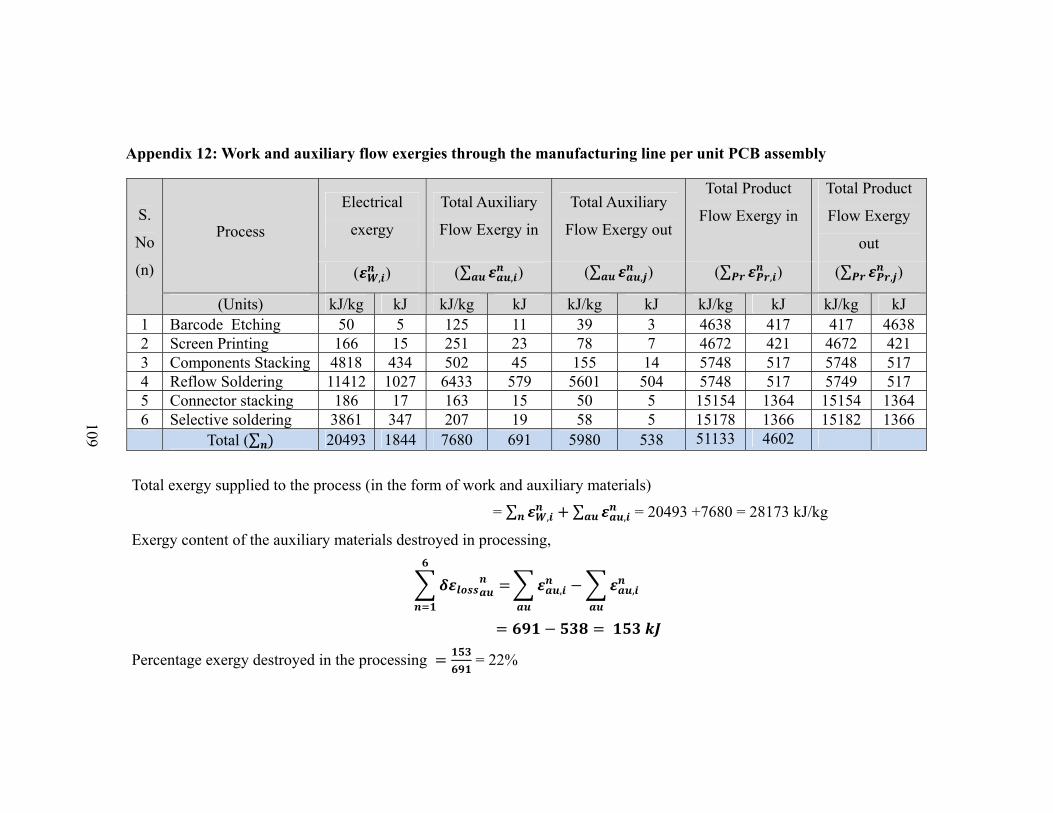
109
Appendix 12: Work and auxiliary flow exergies through the manufacturing line per unit PCB assembly
S.
No
(n)
Process
Electrical
exergy
Total Auxiliary
Flow Exergy in
Total Auxiliary
Flow Exergy out
Total Product
Flow Exergy in
Total Product
Flow Exergy
out
( , ) (∑ , ) (∑ , ) (∑ , ) (∑ , )
(Units) kJ/kg kJ kJ/kg kJ kJ/kg kJ kJ/kg kJ kJ/kg kJ 1 Barcode Etching 50 5 125 11 39 3 4638 417 417 4638 2 Screen Printing 166 15 251 23 78 7 4672 421 4672 421 3 Components Stacking 4818 434 502 45 155 14 5748 517 5748 517 4 Reflow Soldering 11412 1027 6433 579 5601 504 5748 517 5749 517 5 Connector stacking 186 17 163 15 50 5 15154 1364 15154 1364 6 Selective soldering 3861 347 207 19 58 5 15178 1366 15182 1366 Total (∑ 20493 1844 7680 691 5980 538 51133 4602
Total exergy supplied to the process (in the form of work and auxiliary materials)
= ∑ , ∑ , = 20493 +7680 = 28173 kJ/kg
Exergy content of the auxiliary materials destroyed in processing,
, ,
Percentage exergy destroyed in the processing = 22%
109

110
Appendix 13: Exergetic efficiency of the subsystems in manufacturing line
S.
No
(n)
Process
Total Exergy in Total Exergy out Total Product
Exergy out Exergetic Efficiencies
( ,n
i) ( ,n
j) ( , ) Maximum
Max n,εη
Actual Act n,
εη
(Units) kJ/kg kJ kJ/kg kJ kJ/kg kJ % % 1 Barcode Etching 4813 433 4677 421 4638 417 97 96 2 Screen Printing 5089 458 4749 427 4672 420 93 92 3 Components Stacking 11068 996 5903 531 5748 517 53 52 4 Reflow Soldering 23592 2123 11349 1021 5749 517 48 24 5 Connector stacking 15402 1386 15207 1369 15156 1364 99 98 6 Selective soldering 19247 1732 15240 1372 15183 1366 79 79 Total 79211 7129 57125 5141 51145 4603 72 65
110

111
Appendix 14: Electrical Exergy use efficiency of the assembly line for unit PCB assembly
Note: Exergy of electrical work is equal to electrical work ( , , )
S. No
(n)
Process
Total Electrical
exergy in
Electrical work for
necessary use
Electrical work for
auxiliary use
Electricity
Use
efficiency
( , ) or ( , ) , ,
(Units) kJ/kg kJ kJ/kg kJ kJ/kg kJ %
1 Barcode Etching 50 5 4.31 48 0.18 2 96
2 Screen Printing 166 15 7.72 86 7.25 81 52
3 Components Stacking 4818 434 256.75 2853 176.87 1965 59
4 Reflow Soldering 11412 1027 505.27 5614 521.77 5797 49
5 Connector stacking 186 17 7.09 79 9.68 108 42
6 Selective soldering 3861 347 236.78 2631 110.70 1230 68
Total (Σn) 20493 1844 1017.92 11310 826.45 9183 55
For relevant data table, see appendix 6.
111

112
Appendix 15: Comparing the actual work consumption with the ideal energy requirement.
Quantity of solder (Sn-37Pb) alloy required for unit PCB assembly (from Table 2.1)
= , , =0.9+0.6 =1.5 g
Minimum quantity of heat energy required to completely melt 1.5g of solder alloy
, ∙ , ∙ , ∙ ,
Where
ms – Mass of solder
C – Specific heat of solder (for Sn-37Pb alloy, C = ~ 0.15 kJ/kg)
Tmelt – Melting point of solder (for Sn-37Pb alloy, Tmelt = 183oC)
Ls – Specific latent heat (for Sn-37Pb alloy, L=~20 BTU/lb* = 9.5 kJ/kg)
1.5 ∗ 0.15 ∗ 183 20 1.5 ∗ 9.5 50.93
From appendix 14,
Total electrical work invested for unit PCB assembly = 1844 kJ = 18.4 x 10⁵ J
Electrical work supplied for soldering processes = ( , + , )
= 1374 kJ =13.7 x 10⁵J
The difference is in multiple orders of magnitude (O (105))
*Source: http://www.engineersedge.com/properties_of_metals.htm, last referred on 11/15/2010.

113
7. References
American Council for Energy Efficient Economy, (2010) “2010Market Trends”,
ACEEE’s Green Book, Online Resource. Source: http://www.greenercars.org; Referred on
07/12/2010.
Anityasari, M., and Kaebernick, H., (2008), “A concept of reliability evaluation for
reuse and remanufacturing”, Int. J. Sustainable Manufacturing, Vol. 1, No. 1/2 , pp. 3-17
Ayres, R.U., (1998) “Eco-thermodynamics: economics and the second law”,
Ecological Economics, Vol. 26, pp. 189-209.
Bakshi, B., Gutowski, T., and Sekulic, D.P., (2008). “Thermodynamics and the
destruction of resources”, Cambridge University Press, Chap. 1 & 2.
Basel Convention, (1989) , “Basel Convention on the control of Transboundary
movements of Hazardous Wastes and their Disposal”.
Bejan, A., (2002), “Fundamentals of exergy analysis, entropy generation
minimization and the generation of flow architecture”, International Journal of Energy
Reseach, Vol. 26, pp. 545-565.
Bejan, A., Tsatsaronis, G., and Moran, M., (1996), “Thermal Design and
optimization”, John Wiley and Sons Inc., USA.
Boddapati, V.S., (2006), “Exergy metric for the assessment of material processing
in manufacturing”, Master’s Thesis, University of Kentucky.
Carnegie Mellon University Green Design Institute, (2008), “Economic Input-
Output Life Cycle Assessment (EIO-LCA)”, US 1997 Industry Benchmark model

114
[Internet], Available from :<http://www.eiolca.net> Accessed 1 January, 2008.
Cengel, Y.A, and Boles, M.A., (2006), “Thermodynamics, An engineering
approach” 5th edition, McGraw-Hill USA.
Das, S. and Yin, W., (2007), “Trends in Global Aluminum Fabrication Industry”, J.
of Metullurgy, Feb. 2007, pp. 83 -87.
Department of Energy (DOE) handbook, (1992), “Thermodynamics, Heat
Transfer, and Fluid Flow”, Vol. 1/3, Chapters 3 and 4, USA Department of Energy.
Source:
http://www.hss.energy.gov/nuclearsafety/ns/techstds/standard/hdbk1012/h1012v1.pdf
Dincer, I., and Rosen, M.A., (2007), “Exergy. Energy, Environment and Sustainable
Development”, Elsevier, USA.
El-Sayed, Y.M., and Gaggioli, R.A., (1989), “A critical review of second law
costing methods: Parts I and II”, ASME Journal of Energy Research and Technology, Vol.
111, pp. 1–15.
Engineeringtoolbox.com, online resource, “Water Delivery Flow Velocities”,
Source: http://www.engineeringtoolbox.com/pump-delivery-flow-velocity-water-
d_232.html; as referred on: 11/14/2010.
European Union, (2002), “Restriction of Hazardous Wastes (ROHS) Directive”,
European Union 2002/95/EC, 2002.
European Union, (2002), “Waste Electrical and Electronic Equipments (WEEE)
Directive”, European Union 2002/96/E, 2001.
Ewing, B., Goldfinger, S., Ourseler, A., Reed, A., Moore, D., and Wackernagel, M.,
115
(2009), “Ecological footprint Atlas 2009”, Research and Standards Department, Global
Footprint Network, Source:
http://www.footprintnetwork.org/images/uploads/Ecological_Footprint_Atlas_2009.pdf
Feld, W.M., (2001), “Lean Manufacturing. Tools, Techniques and how to use
them”, The CRC Press Series on Resource Management, USA.
Feldmann, K. and Shcller, H., (1995), “The Printed Circuit Board – A challenge for
automated disassembly and for the design of recyclable interconnect devices”, Concept –
Clean Electronics Products and Technology, Conference Publication, 1995
Ferrer, G., (1997), “Economics of Personnel Computer Remanufacturing”,
Resources, Conservation and Recycling, Vol. 21, pp. 79-108.
Finnveden, G., (2000), “On the limitations of Lifecycle Assessment and
environmental systems Analysis Tools in General”, International journal of LifeCycle
Assessment, 5(4), pp.229-238.
Gable, C. and Shireman, B., (2001), “Computer and Electronics Product
Stewardship: Are We Ready for the Challenge?” Environmental Quality Management,
Vol. 11, pp. 35–45.
Gordon R.B., Bertram, M., and Graedel, T.E., (2006), “Metal stocks and
sustainability”, Proc. of National Academy of Sciences, Vol. 103, No. 5, pp. 1209–1214.
Grassmann, P., (1959), “The exergy and the flow diagram of the technically
available power”, Allgemeine Warmetechn, 9 (4/5), pp. 79-86.
Gutowski,T.G., Branham,M.S., Dahmus, J.B., Jones, A.J., Thiriez, A. and Sekulic,
D.P., (2009), “Thermodynamic Analysis of Resources Used in Manufacturing
116
Processes”, Environmental Science & Technology, 43, No. 1, pp. 1584-1590.
Gutowski, T.G., Liow, J.Y.H., and Sekulic, D.P., (2010), “Minimum Exergy
Requirements for the Manufacturing of Carbon Nanotubes”, IEEE, International
Symposium on Sustainable Systems and Technologies, Washington D.C.
ISO 14040:2006, (2006), “Environmental Management: Life Cycle Assessment–
Principles and framework”, International Organization for Standardization.
Harper, C.A. and Sampson, R.M., (1994), “Electronic materials and processes
handbook”, McGraw- Hill Inc., 2nd edition, Chap. 2.
Harvey, L., (2004–9), “Analytic Quality Glossary”, Quality Research International,
Source: http://www.qualityresearchinternational.com/glossary/. Referred 10/12/2010
Health Canada, (2008), “Effects of lead on Human heath”, Ministry of health.
Source: http://www.hc-sc.gc.ca/hl-vs/alt_formats/pacrb-dgapcr/pdf/iyh-vsv/environ/lead-
plomb-eng.pdf; Referred in 11/ 14 /2010
Jawahir, I. S., Wanigarathne, P. C., Wang, X., (2006), “Product Design and
Manufacturing Processes for Sustainability”, in Mechanical Engineers’ Handbook:
Manufacturing and Management, Third Edition, Chap. 12, pp. 414-443.
Kaye & Laby Online. Version 1.1 (2008), “Tables of Physical & Chemical
Constants”, Online Resource, National Physical Laboratory, UK. Source:
http://www.kayelaby.npl.co.uk/toc/
Kitzes J., Wackernagel, M., Loh, J., Peller, A., Goldfinger, S., Cheng D., and Tea,
K., (2008), “Shrink and share: Humanity’s present and future Ecological Footprint”,
Phil. Trans. R. Society of Biological Science, Vol. 363, pp. 467-475.

117
Klausner, M., and Hendrickson, C.T., (2000), “Reverse –Logistics Strategy for
product take-back” Interfaces, Vol. 30, No. 3, pp. 156- 165.
NIST, (2008), “Chemistry WebBook”, Online Resource, National Institute of
Standards and Technology, USA. Source http://webbook.nist.gov/chemistry/
Perry,R.H., and Green, D. W., (2008), “Perry's Chemical Engineers' Handbook”,
8th Edition, McGraw- Hill, USA.
Puckett, J., and Smith, T., (2002), “Exporting Harm: High-tech Trashing of Asia”,
Basel action network. .Source: http://www.ban.org/E-Waste/technotrashfinalcomp.pdf
Referred on 22/09/2010
Rosen, M.A., (2001), “Energy and exergy based comparison of coal fired and
nuclear steam power plants”, Exergy, an International Journal, Vol.1 (3), pp. 180-192.
Rosen, M.A. and Dincer, I., (1997), “On Exergy and Environmental Impact”,
International Journal of Energy Research, Vol. 21, pp. 643 - 654
Rosen, M.A. and Dincer, I., (2001), “Exergy as the confluence of energy,
environment and sustainable development”, Energy International Journal, Vol. 1, pp. 3-
13.
Saiganesh, S., and Sekulic, D. P., (2010), “Balancing of mass and exergy
flows for a PCB soldering process: A method and case study”, 2010 IEEE
International Symposium on Sustainable Systems and Technology (ISSST), Washington
D.C., vol., no., pp.1-6, 17-19 May 2010
Schaefer, F., Ute Luksch, U., Nancy Steinbach, N., Julio Cabeça, C., and
Hanauer J., (2006), “Ecological Footprint and Biocapacity”, Publications of the

118
European Communities, Source:
http://epp.eurostat.ec.europa.eu/cache/ITY_OFFPUB/KS-AU-06-001/EN/KS-AU-06-001-
EN.PDF, Referred on 10/21/2010
Scientific Applications International Corporation (SAIC), (2006), “Lifecycle
Assessment. Principles and Practice”, National Risk Management Laboratory, US EPA.
Source: http://www.epa.gov/nrmrl/lcaccess/pdfs/600r06060.pdf Referred on 12/10/2010.
Sekulic, D.P., (2009), “An entropy generation metric for non-energy systems
assessments”, Energy, Vol. 34, 2009, pp. 587– 592
Sekulic, D.P., (2011), “ An Entropy Based Metric for a Transformational
Technology Development” in “Thermodynamics and the Destruction of resources,
Chapter 5, Edited by T. Gutowski, B. Bakshi and D.P. Sekulic, Cambridge University
Press, Cambridge, UK, 2011
Seliger, G., Hentschel, C., and Wagner, M., (1996), “Disassembly Factories for
Recovery of resources in Product and Material cycles”, in Life-cycle Modeling for
innovative products and processes, Chapman and Hall, 1996, pp. 56-69
Szargut, J., (2005), “Exergy Method. Technical and Ecological Applications”, WIT
Press 2005.
The Economist. (2005). January 29, 2005. pp 56. London.UK.
Tsatsaronis, G., (1987), “A review of exergoeconomic methodologies”, in: M.J.
Moran, E. Sciubba (Eds.), “Second Law Analysis of Thermal Systems”, American
Society of Mech. Engineers, New York, pp. 81–87.
Townsend, T.G., Vann, K., Mutha, S., Pearson, B., Jang, Y.C., Musson, S. and

119
Jordan, A., (2004), “RCRA Toxicity Characterization of Computer CPUs and Other
Discarded Electronic Devices”, University of Florida, E-wastes TC report.
TRANSCAT technical Reference, (2010), Online Resource, Source:
http://www.transcat.com/PDF/ElectricalPowerMeasurement.pdf,; Refered: 14/11/2010.
Tukker A., (1999), “Lifecycle assessment as a tool in environmental impact
assessment”, Environmental Impact Assessment Review, 20, pp. 435-456.
US Energy Information Administration, (2009), “Net generation by Energy
Source”. Source: http://www.eia.doe.gov/cneaf/electricity/epm/table1_1.html Referred in
10/02/2010
USEPA , (20091), “ Health effects of Mercury”, Integrated Risk Information
System, US Environmental Protection Agency. Source:
http://www.epa.gov/hg/effects.htm; Referred on 09/20/2010.
USEPA, (20092), “US Environmental Protection Agency Municipality Solid Wastes
(MSW) Facts 2008”, source: www.epa.com
USEPA (20093), “Hazardous waste minimization”, Source:
http://www.epa.gov/epawaste/hazard/wastemin/index.htm; Referred on 10/11/2010
USEPA, (2010), “Lifecycle assessment”, Source:
http://www.epa.gov/research/NRMRL/lcaccess/; Referred on 09/11/2010
Vianco, P.T., (2001), “Soldering Handbook”, American Welding Society, Chap. 1-
5., USA
Wiedmann, T. and Minx, J., (2008), “A Definition of 'Carbon Footprint”, in:
Pertsova, C.C., “Ecological Economics Research Trends”, Nova Science Publishers,

120
Hauppauge NY, USA, Chap. 1, pp. 1-11.
Wildmer, R., Oswald-Krapf, H., Sinha-Khetriwal, D., Schnellmann, M., and Boni,
H., (2005), “Global Perspectives on E-waste”, Environmental Impact Assessment Review,
Vol. 25, pp. 436-458.
Williams E.D., Ayres R.U., and Heller M., (2002), “The 1.7 Kilogram Microchip:
Energy and Material Use in the Production of Semiconductor Devices”, Environmental
Science and Technology, Vol. 36, pp. 5504-5510.
World Commission on Environment and Development (WCED), (1987), “Our
Common Future”, Source: http://www.un-documents.net/wced-ocf.htm Referred on
09/04/2010.

121
VITA
Subramaniam Saiganesh was born on October 11, 1983 in Chennai, Tamil Nadu, India.
The author received his Bachelor of Engineering (B.E.) degree in Mechanical
Engineering from Anna University, Chennai, India in the year 2005. Before enrolling in
this Master’s degree, he was working in manufacturing and quality engineering positions
for about three years in automotive industry in Chennai, India. He joined Dr. Dusan P.
Sekulic’s research group in Center for Manufacturing, University of Kentucky, in
October 2007. He has also presented and published a portion of his research work titled
“Balancing mass and exergy flows for a PCB soldering process: A method and Case
study”, in IEEE’s International Symposium on Sustainable Systems and Technologies
(ISSST), at Washington D.C., in May 2010.