Embed Size (px)
Citation preview
STAC Report STAC-M3 / kdb+ 3.1 / Kove® XPD2 / Dell / Intel X7560 / Mellanox IB
Copyright © 2013 Securities Technology Analysis Center LLC Page 1
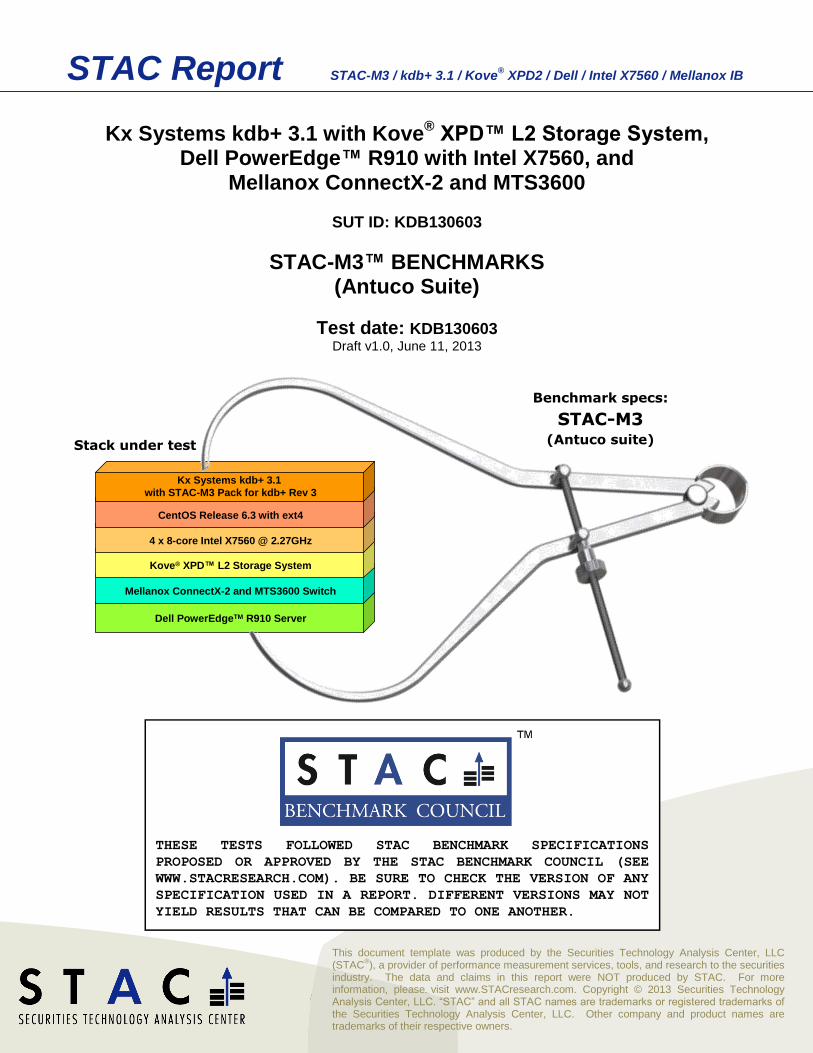
Kx Systems kdb+ 3.1 with Kove® XPD™ L2 Storage System,
Dell PowerEdge™ R910 with Intel X7560, and Mellanox ConnectX-2 and MTS3600
SUT ID: KDB130603
STAC-M3™ BENCHMARKS (Antuco Suite)
Test date: KDB130603 Draft v1.0, June 11, 2013
Dell PowerEdgeTM R910 Server
Mellanox ConnectX-2 and MTS3600 Switch
Stack under test
Benchmark specs:
STAC-M3(Antuco suite)
Kove® XPD™ L2 Storage System
4 x 8-core Intel X7560 @ 2.27GHz
CentOS Release 6.3 with ext4
Kx Systems kdb+ 3.1
with STAC-M3 Pack for kdb+ Rev 3
This document template was produced by the Securities Technology Analysis Center, LLC (STAC
®), a provider of performance measurement services, tools, and research to the securities
industry. The data and claims in this report were NOT produced by STAC. For more information, please visit www.STACresearch.com. Copyright © 2013 Securities Technology Analysis Center, LLC. “STAC” and all STAC names are trademarks or registered trademarks of the Securities Technology Analysis Center, LLC. Other company and product names are trademarks of their respective owners.
THESE TESTS FOLLOWED STAC BENCHMARK SPECIFICATIONS
PROPOSED OR APPROVED BY THE STAC BENCHMARK COUNCIL (SEE
WWW.STACRESEARCH.COM). BE SURE TO CHECK THE VERSION OF ANY
SPECIFICATION USED IN A REPORT. DIFFERENT VERSIONS MAY NOT
YIELD RESULTS THAT CAN BE COMPARED TO ONE ANOTHER.
STAC Report STAC-M3 / kdb+ 3.1 / Kove® XPD2 / Dell / Intel X7560 / Mellanox IB
Copyright © 2013 Securities Technology Analysis Center LLC Page 2
Contents
REFERENCES .............................................................................................................................................................. 3 SUMMARY ................................................................................................................................................................... 5 REPORT CARD............................................................................................................................................................. 6 STAC REPORT CARD (CONT’D) .................................................................................................................................... 7 STAC REPORT CARD (CONT’D) .................................................................................................................................... 8 STAC REPORT CARD (CONT’D) .................................................................................................................................... 8 STAC REPORT CARD (CONT’D) .................................................................................................................................... 9 CHART VIEW ................................................................................................................................................................ 9 1. OVERVIEW OF THE STAC-M3 BENCHMARK SPECIFICATIONS ................................................................................ 15 2. PRODUCT BACKGROUND ..................................................................................................................................... 20 3. PROJECT PARTICIPANTS AND RESPONSIBILITIES ................................................................................................... 22 4. CONTACTS ......................................................................................................................................................... 22 5. RESULTS STATUS ............................................................................................................................................... 22 6. SPECIFICATIONS ................................................................................................................................................. 22 7. LIMITATIONS ....................................................................................................................................................... 23 8. STACK UNDER TEST ............................................................................................................................................ 23 9. VENDOR COMMENTARY ...................................................................................................................................... 23
STAC Report STAC-M3 / kdb+ 3.1 / Kove® XPD2 / Dell / Intel X7560 / Mellanox IB
Copyright © 2013 Securities Technology Analysis Center LLC Page 3
References [1] Specifications used for this benchmark: STAC-M3 Benchmark Specifications, Antuco Suite, Rev M –
http://www.stacresearch.com/node/8777. Accessible by qualified members of the STAC Benchmark Council.
STAC Report STAC-M3 / kdb+ 3.1 / Kove® XPD2 / Dell / Intel X7560 / Mellanox IB
Copyright © 2013 Securities Technology Analysis Center LLC Page 4
Disclaimer
This document was prepared by the Securities Technology Analysis Center (STAC
®) at the
request of Kx Systems. It is provided for your internal use only and may not be redistributed, retransmitted, or published in any form without the prior written consent of STAC. “STAC” and all STAC names are registered trademarks or trademarks of the Securities Technology Analysis Center LLC. All other trademarks in this document belong to their respective owners. The test results contained in this report are made available for informational purposes only. Neither STAC nor the vendor(s) supplying the information in this report guarantee similar performance results. All information contained herein is provided on an “AS IS” BASIS WITHOUT WARRANTY OF ANY KIND. STAC explicitly disclaims any liability whatsoever for any errors or otherwise.
STAC Report STAC-M3 / kdb+ 3.1 / Kove® XPD2 / Dell / Intel X7560 / Mellanox IB
Copyright © 2013 Securities Technology Analysis Center LLC Page 5
Summary STAC recently performed the baseline STAC-M3™ Benchmarks on a stack involving Kx Systems kdb+ 3.1 with a new STAC-M3 Pack for kdb+ 3, which is compatible only with kdb+ 3.1 and higher. The software was hosted on a Dell PowerEdge™ R910 using Intel Xeon X7560 processors and connected by Mellanox ConnectX-2 and MTS3600 to a Kove
® XPD™ L2 Storage System.
In all, the STAC-M3™ specifications deliver dozens of test results, which are presented through a variety of tables and visualizations in this report. Of these, Kx Systems chose to highlight the following:
Lower mean latencies (response times) than the previously published best results for 15 of the 17 operations
Over 8x the performance of the previously published best result for 1T.VWAB-D (SUT ID: XTR111105)
Over 4x the performance of the previously published best result for 1T.NBBO (SUT ID: KDB130528)
Over 6x the performance of the previously published best result for 1T.STATS-UI (SUT ID: XTR111105)
Over 5x the performance of the previously published best result for 100T.STATS-UI (SUT ID: XTR111105) A STAC-M3 Report Card appears at the top of the report as a convenience for readers who want to get straight to the results. However, we recommend that readers who are not part of the STAC-M3 Working Group first read Section 1 (Overview) to get a feel for the test cases and metrics.
Getting the most from these results Any interested party can analyze public STAC Reports to compare the performance of different systems. However, members of the STAC Benchmark Council are able to put these reports to much greater use. Qualified members may: Read the detailed Configuration Disclosure for the system tested in this report
Read the detailed test specifications
Access additional reports in the confidential STAC Vault™
Obtain the materials to run the STAC-M3 Benchmarks on their own systems
Discuss benchmarks, technologies, and related business issues with their peers. To join the Council or upgrade your membership, please contact [email protected].
STAC Report STAC-M3 / kdb+ 3.1 / Kove® XPD2 / Dell / Intel X7560 / Mellanox IB
Copyright © 2013 Securities Technology Analysis Center LLC Page 6
Report Card
STAC-M3™ Benchmarks for SUT ID KDB130603: Kx Systems kdb+ 3.1 with Kove® XPD™ L2 Storage System,
Dell PowerEdge™ R910 with Intel X7560, and Mellanox ConnectX-2 and MTS3600
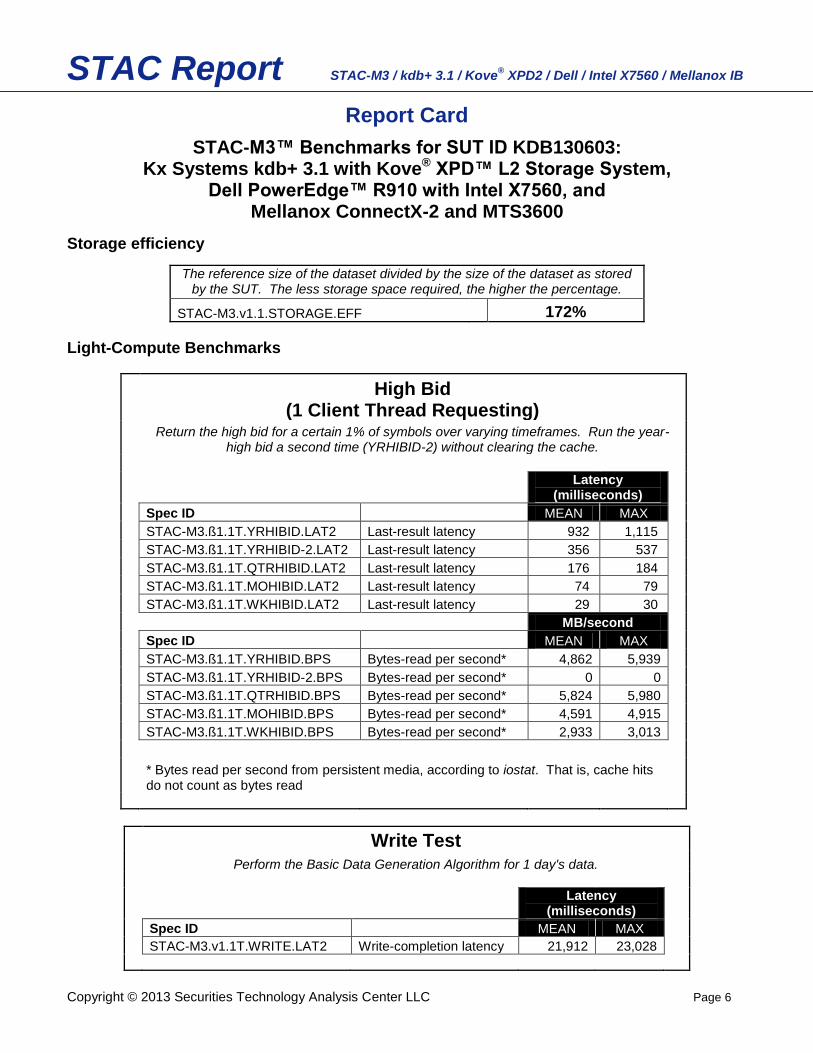
Storage efficiency
The reference size of the dataset divided by the size of the dataset as stored by the SUT. The less storage space required, the higher the percentage.
STAC-M3.v1.1.STORAGE.EFF 172%
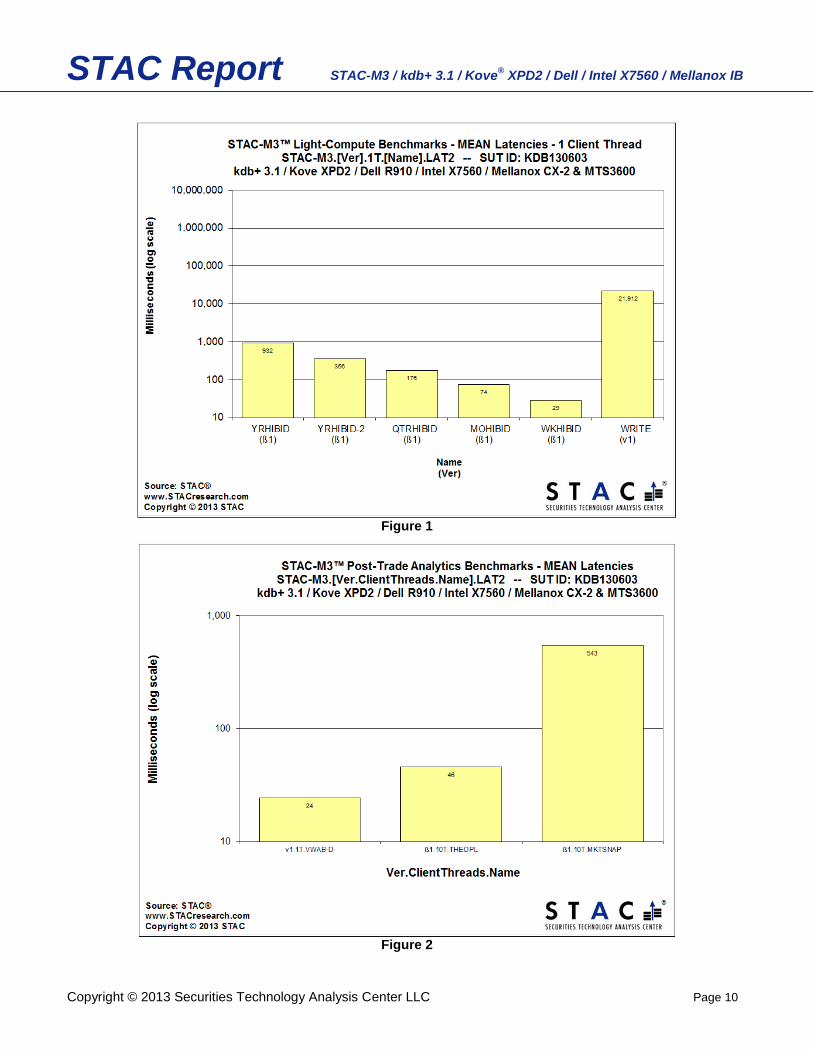
Light-Compute Benchmarks
High Bid (1 Client Thread Requesting)
Return the high bid for a certain 1% of symbols over varying timeframes. Run the year-
high bid a second time (YRHIBID-2) without clearing the cache.
Latency
(milliseconds)
Spec ID MEAN MAX
STAC-M3.ß1.1T.YRHIBID.LAT2 Last-result latency 932 1,115
STAC-M3.ß1.1T.YRHIBID-2.LAT2 Last-result latency 356 537
STAC-M3.ß1.1T.QTRHIBID.LAT2 Last-result latency 176 184
STAC-M3.ß1.1T.MOHIBID.LAT2 Last-result latency 74 79
STAC-M3.ß1.1T.WKHIBID.LAT2 Last-result latency 29 30
MB/second
Spec ID MEAN MAX
STAC-M3.ß1.1T.YRHIBID.BPS Bytes-read per second* 4,862 5,939
STAC-M3.ß1.1T.YRHIBID-2.BPS Bytes-read per second* 0 0
STAC-M3.ß1.1T.QTRHIBID.BPS Bytes-read per second* 5,824 5,980
STAC-M3.ß1.1T.MOHIBID.BPS Bytes-read per second* 4,591 4,915
STAC-M3.ß1.1T.WKHIBID.BPS Bytes-read per second* 2,933 3,013
* Bytes read per second from persistent media, according to iostat. That is, cache hits do not count as bytes read
Write Test
Perform the Basic Data Generation Algorithm for 1 day's data.
Latency
(milliseconds)
Spec ID MEAN MAX
STAC-M3.v1.1T.WRITE.LAT2 Write-completion latency 21,912 23,028
STAC Report STAC-M3 / kdb+ 3.1 / Kove® XPD2 / Dell / Intel X7560 / Mellanox IB
Copyright © 2013 Securities Technology Analysis Center LLC Page 7
STAC Report Card (cont’d) STAC-M3™ Benchmarks for SUT ID KDB130603
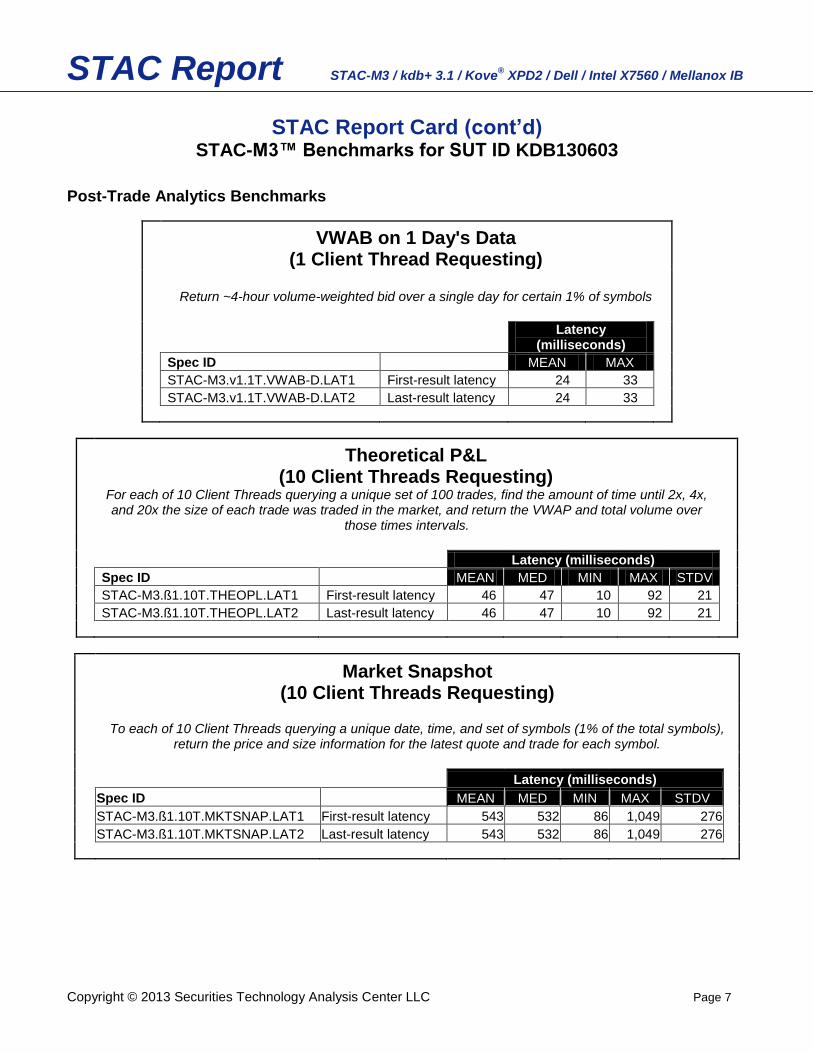
Post-Trade Analytics Benchmarks
VWAB on 1 Day's Data (1 Client Thread Requesting)
Return ~4-hour volume-weighted bid over a single day for certain 1% of symbols
Latency
(milliseconds)
Spec ID MEAN MAX
STAC-M3.v1.1T.VWAB-D.LAT1 First-result latency 24 33
STAC-M3.v1.1T.VWAB-D.LAT2 Last-result latency 24 33
Theoretical P&L (10 Client Threads Requesting)
For each of 10 Client Threads querying a unique set of 100 trades, find the amount of time until 2x, 4x, and 20x the size of each trade was traded in the market, and return the VWAP and total volume over
those times intervals.
Latency (milliseconds)
Spec ID MEAN MED MIN MAX STDV
STAC-M3.ß1.10T.THEOPL.LAT1 First-result latency 46 47 10 92 21
STAC-M3.ß1.10T.THEOPL.LAT2 Last-result latency 46 47 10 92 21
Market Snapshot (10 Client Threads Requesting)
To each of 10 Client Threads querying a unique date, time, and set of symbols (1% of the total symbols),
return the price and size information for the latest quote and trade for each symbol.
Latency (milliseconds)
Spec ID MEAN MED MIN MAX STDV
STAC-M3.ß1.10T.MKTSNAP.LAT1 First-result latency 543 532 86 1,049 276
STAC-M3.ß1.10T.MKTSNAP.LAT2 Last-result latency 543 532 86 1,049 276
STAC Report STAC-M3 / kdb+ 3.1 / Kove® XPD2 / Dell / Intel X7560 / Mellanox IB
Copyright © 2013 Securities Technology Analysis Center LLC Page 8
STAC Report Card (cont’d)
STAC-M3™ Benchmarks for SUT ID KDB130603
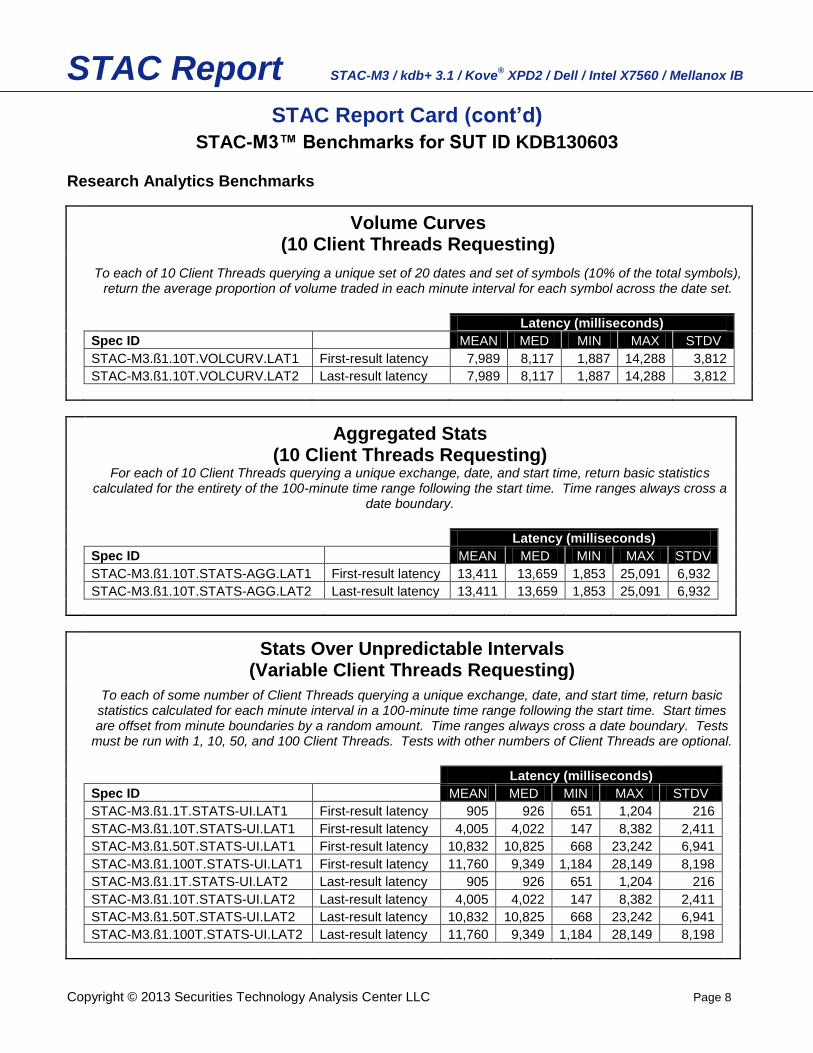
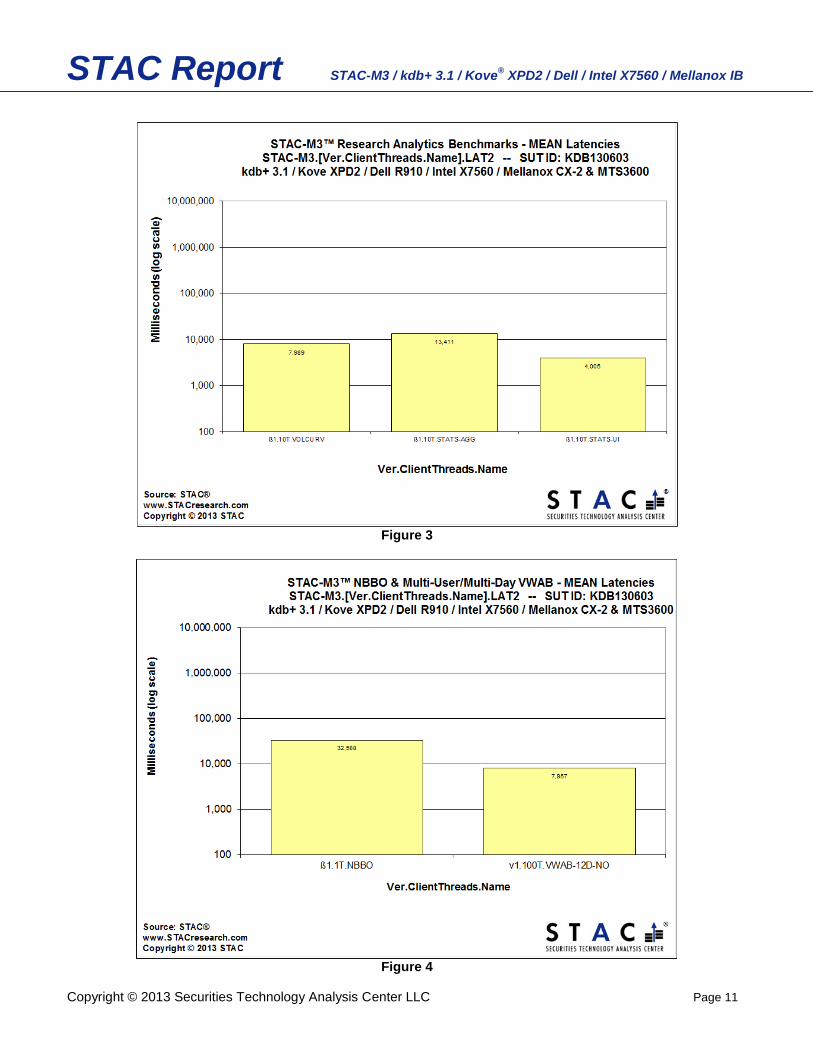
Research Analytics Benchmarks
Volume Curves (10 Client Threads Requesting)
To each of 10 Client Threads querying a unique set of 20 dates and set of symbols (10% of the total symbols),
return the average proportion of volume traded in each minute interval for each symbol across the date set.
Latency (milliseconds)
Spec ID MEAN MED MIN MAX STDV
STAC-M3.ß1.10T.VOLCURV.LAT1 First-result latency 7,989 8,117 1,887 14,288 3,812
STAC-M3.ß1.10T.VOLCURV.LAT2 Last-result latency 7,989 8,117 1,887 14,288 3,812
Aggregated Stats (10 Client Threads Requesting)
For each of 10 Client Threads querying a unique exchange, date, and start time, return basic statistics calculated for the entirety of the 100-minute time range following the start time. Time ranges always cross a
date boundary.
Latency (milliseconds)
Spec ID MEAN MED MIN MAX STDV
STAC-M3.ß1.10T.STATS-AGG.LAT1 First-result latency 13,411 13,659 1,853 25,091 6,932
STAC-M3.ß1.10T.STATS-AGG.LAT2 Last-result latency 13,411 13,659 1,853 25,091 6,932
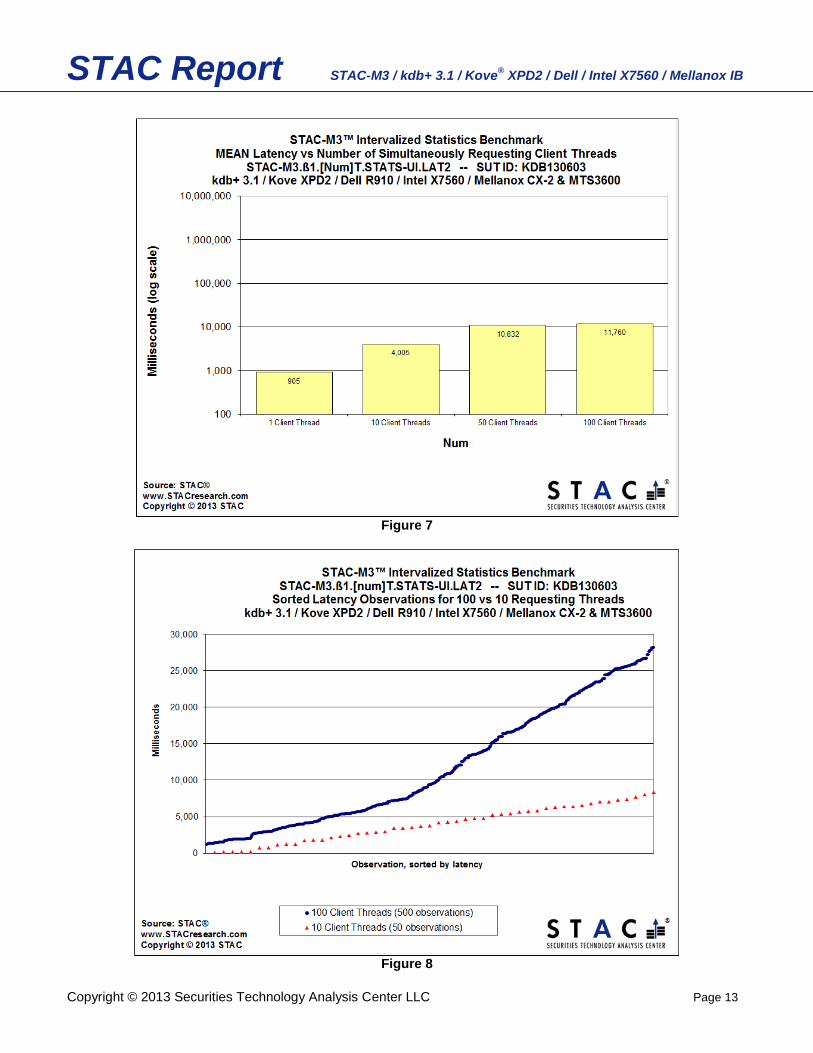
Stats Over Unpredictable Intervals (Variable Client Threads Requesting)
To each of some number of Client Threads querying a unique exchange, date, and start time, return basic statistics calculated for each minute interval in a 100-minute time range following the start time. Start times are offset from minute boundaries by a random amount. Time ranges always cross a date boundary. Tests
must be run with 1, 10, 50, and 100 Client Threads. Tests with other numbers of Client Threads are optional.
Latency (milliseconds)
Spec ID MEAN MED MIN MAX STDV
STAC-M3.ß1.1T.STATS-UI.LAT1 First-result latency 905 926 651 1,204 216
STAC-M3.ß1.10T.STATS-UI.LAT1 First-result latency 4,005 4,022 147 8,382 2,411
STAC-M3.ß1.50T.STATS-UI.LAT1 First-result latency 10,832 10,825 668 23,242 6,941
STAC-M3.ß1.100T.STATS-UI.LAT1 First-result latency 11,760 9,349 1,184 28,149 8,198
STAC-M3.ß1.1T.STATS-UI.LAT2 Last-result latency 905 926 651 1,204 216
STAC-M3.ß1.10T.STATS-UI.LAT2 Last-result latency 4,005 4,022 147 8,382 2,411
STAC-M3.ß1.50T.STATS-UI.LAT2 Last-result latency 10,832 10,825 668 23,242 6,941
STAC-M3.ß1.100T.STATS-UI.LAT2 Last-result latency 11,760 9,349 1,184 28,149 8,198
STAC Report STAC-M3 / kdb+ 3.1 / Kove® XPD2 / Dell / Intel X7560 / Mellanox IB
Copyright © 2013 Securities Technology Analysis Center LLC Page 9
STAC Report Card (cont’d)
STAC-M3™ Benchmarks for SUT ID KDB130603
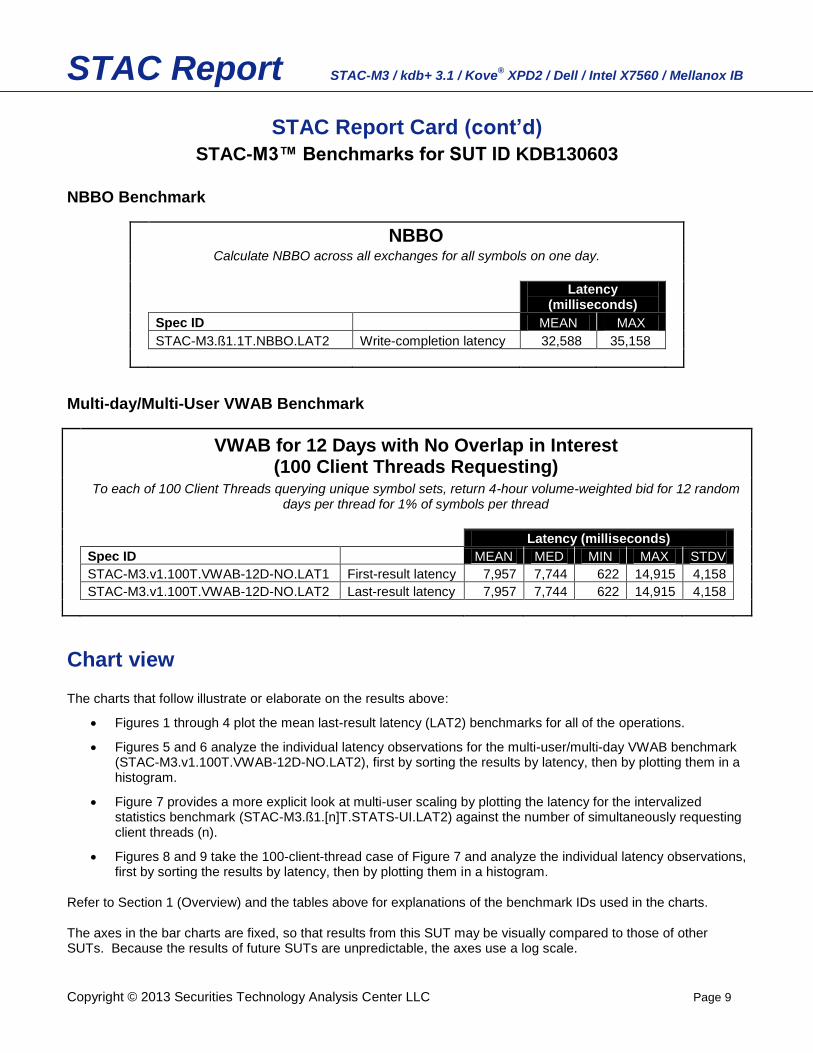
NBBO Benchmark
NBBO Calculate NBBO across all exchanges for all symbols on one day.
Latency
(milliseconds)
Spec ID MEAN MAX
STAC-M3.ß1.1T.NBBO.LAT2 Write-completion latency 32,588 35,158
Multi-day/Multi-User VWAB Benchmark
VWAB for 12 Days with No Overlap in Interest (100 Client Threads Requesting)
To each of 100 Client Threads querying unique symbol sets, return 4-hour volume-weighted bid for 12 random
days per thread for 1% of symbols per thread
Latency (milliseconds)
Spec ID MEAN MED MIN MAX STDV
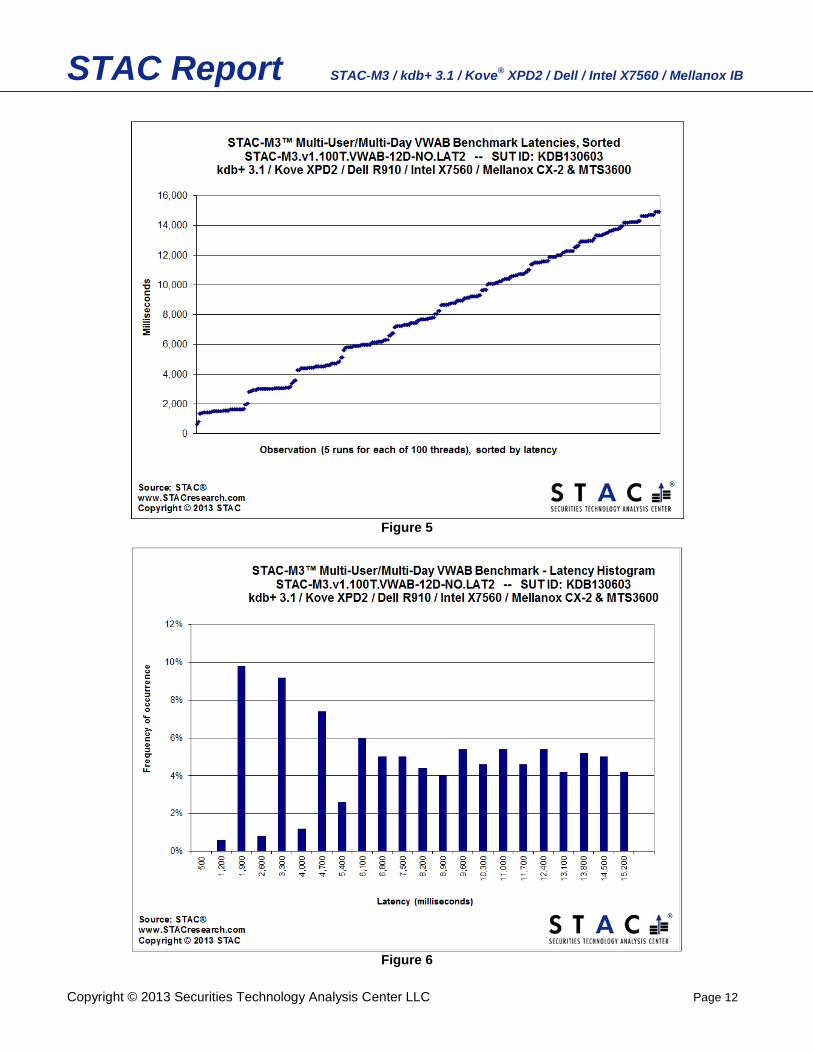
STAC-M3.v1.100T.VWAB-12D-NO.LAT1 First-result latency 7,957 7,744 622 14,915 4,158
STAC-M3.v1.100T.VWAB-12D-NO.LAT2 Last-result latency 7,957 7,744 622 14,915 4,158
Chart view The charts that follow illustrate or elaborate on the results above:
Figures 1 through 4 plot the mean last-result latency (LAT2) benchmarks for all of the operations.
Figures 5 and 6 analyze the individual latency observations for the multi-user/multi-day VWAB benchmark (STAC-M3.v1.100T.VWAB-12D-NO.LAT2), first by sorting the results by latency, then by plotting them in a histogram.
Figure 7 provides a more explicit look at multi-user scaling by plotting the latency for the intervalized statistics benchmark (STAC-M3.ß1.[n]T.STATS-UI.LAT2) against the number of simultaneously requesting client threads (n).
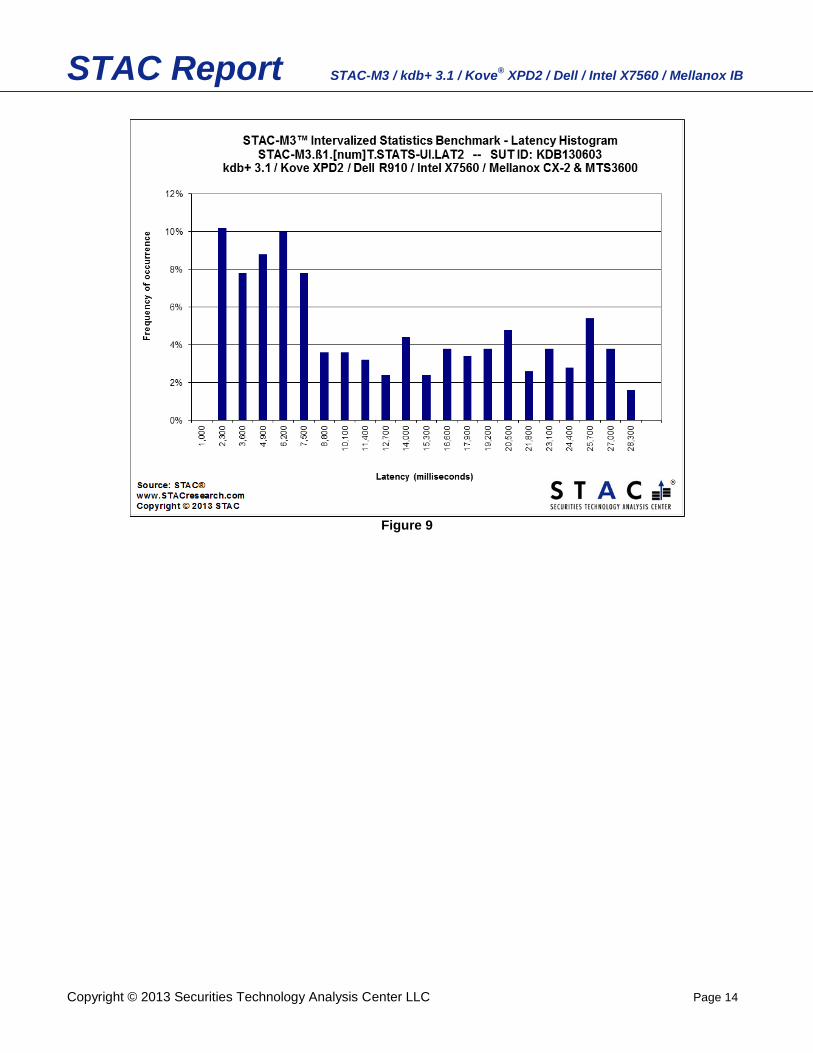
Figures 8 and 9 take the 100-client-thread case of Figure 7 and analyze the individual latency observations, first by sorting the results by latency, then by plotting them in a histogram.
Refer to Section 1 (Overview) and the tables above for explanations of the benchmark IDs used in the charts. The axes in the bar charts are fixed, so that results from this SUT may be visually compared to those of other SUTs. Because the results of future SUTs are unpredictable, the axes use a log scale.
STAC Report STAC-M3 / kdb+ 3.1 / Kove® XPD2 / Dell / Intel X7560 / Mellanox IB
Copyright © 2013 Securities Technology Analysis Center LLC Page 10
Figure 1
Figure 2
STAC Report STAC-M3 / kdb+ 3.1 / Kove® XPD2 / Dell / Intel X7560 / Mellanox IB
Copyright © 2013 Securities Technology Analysis Center LLC Page 11
Figure 3
Figure 4
STAC Report STAC-M3 / kdb+ 3.1 / Kove® XPD2 / Dell / Intel X7560 / Mellanox IB
Copyright © 2013 Securities Technology Analysis Center LLC Page 12
Figure 5
Figure 6
STAC Report STAC-M3 / kdb+ 3.1 / Kove® XPD2 / Dell / Intel X7560 / Mellanox IB
Copyright © 2013 Securities Technology Analysis Center LLC Page 13
Figure 7
Figure 8
STAC Report STAC-M3 / kdb+ 3.1 / Kove® XPD2 / Dell / Intel X7560 / Mellanox IB
Copyright © 2013 Securities Technology Analysis Center LLC Page 14
Figure 9
STAC Report STAC-M3 / kdb+ 3.1 / Kove® XPD2 / Dell / Intel X7560 / Mellanox IB
Copyright © 2013 Securities Technology Analysis Center LLC Page 15
1. Overview of the STAC-M3 Benchmark specifications Analyzing time-series data such as tick-by-tick quote and trade histories is crucial to many trading functions, from algorithm development to risk management. But the domination of liquid markets by automated trading—especially high-frequency trading—has made such analysis both more urgent and more challenging. As trading robots try to outwit each other on a microsecond scale, they dish out quotes and trades in ever more impressive volumes. This places a premium on technology that can store and analyze that activity efficiently. For example, the faster an algorithm developer can back-test and discard a haystack of unprofitable ideas, the faster he will find the needle of a winning algorithm, leaving more time to exploit it in the market. The STAC Benchmark Council has developed the STAC-M3 Benchmarks in order to provide a common basis for quantifying the extent to which emerging hardware and software innovations improve the performance of tick storage, retrieval, and analysis. STAC-M3 tests the ability of a solution stack such as columnar database software, servers, and storage, to perform a variety of operations on a large store of market data. The STAC-M3 Working Group designed these test specs to enable useful comparisons of entire solution stacks (i.e., to gauge the state of the art) as well as comparisons of specific stack layers while holding other layers constant. Comparisons can include (but are not limited to):
Different storage systems, including SSD, DRAM, interconnects, and file systems
Different server products, processors, chipsets, and memory
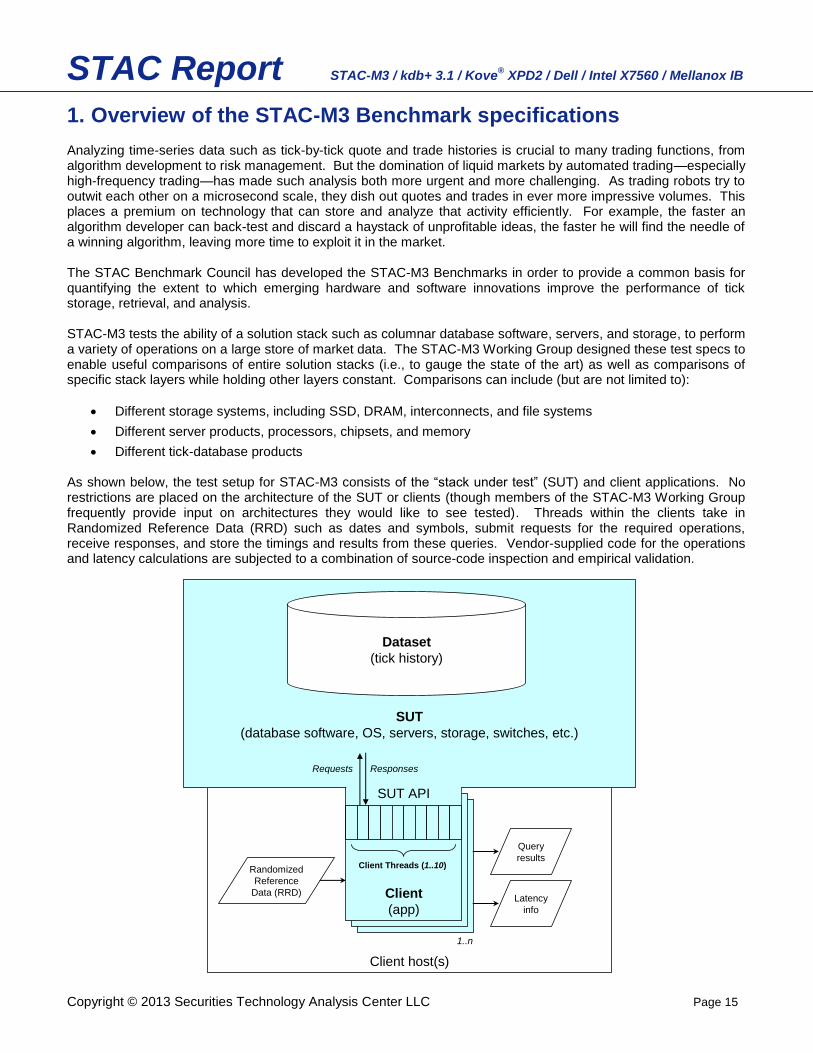
Different tick-database products As shown below, the test setup for STAC-M3 consists of the “stack under test” (SUT) and client applications. No restrictions are placed on the architecture of the SUT or clients (though members of the STAC-M3 Working Group frequently provide input on architectures they would like to see tested). Threads within the clients take in Randomized Reference Data (RRD) such as dates and symbols, submit requests for the required operations, receive responses, and store the timings and results from these queries. Vendor-supplied code for the operations and latency calculations are subjected to a combination of source-code inspection and empirical validation.
Client host(s)
SUT
(database software, OS, servers, storage, switches, etc.)
Dataset
(tick history)
Client
(app)
Client Threads (1..10)
SUT API
1..n
Requests Responses
Randomized
Reference
Data (RRD)
Query
results
Latency
info
STAC Report STAC-M3 / kdb+ 3.1 / Kove® XPD2 / Dell / Intel X7560 / Mellanox IB
Copyright © 2013 Securities Technology Analysis Center LLC Page 16
Dataset STAC-M3 draws from client experience with equities and FX use cases. The database is synthetic, modeled on NYSE TAQ data (US equities). While it is also desirable to test with real data, synthetic data has three advantages that make it compelling for this STAC-M3 suite:
Synthetic data allows us to control the database properties exactly, which in turn allows us to randomize elements of queries from project to project while keeping the resulting workload exactly the same (for example, we control how much volume is associated with each symbol).
Synthetic data does not incur fee liability from a third party such as an exchange.
Synthesizing the data makes it easy to scale the database to an arbitrarily large size and run benchmarks against projected future data volumes.
The dataset consists of high-volume symbols and low-volume symbols in proportions based on observed NYSE data. The data volume per symbol was based on doubling the typical volume in NYSE TAQ in 1Q10. The resulting database is considerably smaller than databases in use at customer sites. This was a deliberate choice by the STAC-M3 Working Group to minimize the cost of running benchmarks while still yielding valuable results. Benchmarks that scale the database to the size of existing customer footprints and well beyond are contained in the Kanaga suite of STAC-M3 Benchmark specifications.
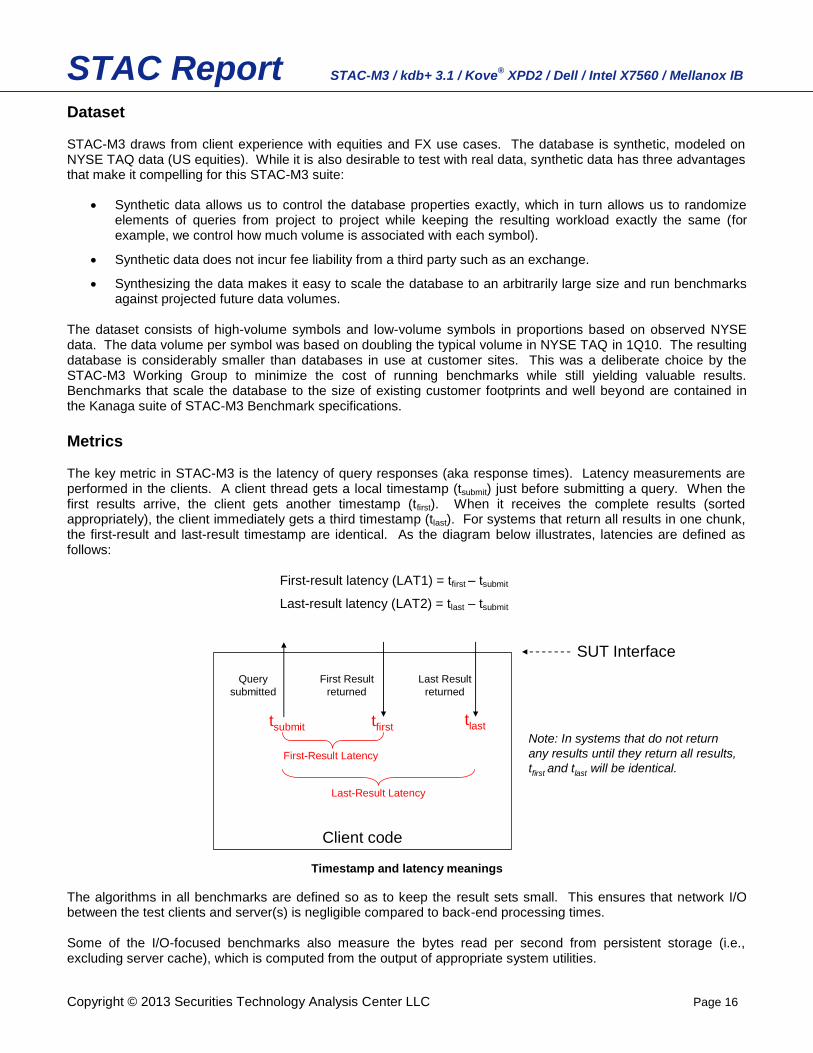
Metrics The key metric in STAC-M3 is the latency of query responses (aka response times). Latency measurements are performed in the clients. A client thread gets a local timestamp (tsubmit) just before submitting a query. When the first results arrive, the client gets another timestamp (tfirst). When it receives the complete results (sorted appropriately), the client immediately gets a third timestamp (tlast). For systems that return all results in one chunk, the first-result and last-result timestamp are identical. As the diagram below illustrates, latencies are defined as follows:
First-result latency (LAT1) = tfirst – tsubmit
Last-result latency (LAT2) = tlast – tsubmit
Client code
Query
submitted
First Result
returned
Last Result
returned
SUT Interface
tsubmit tfirsttlast
Note: In systems that do not return
any results until they return all results,
tfirst and tlast will be identical.First-Result Latency
Last-Result Latency
Timestamp and latency meanings
The algorithms in all benchmarks are defined so as to keep the result sets small. This ensures that network I/O between the test clients and server(s) is negligible compared to back-end processing times. Some of the I/O-focused benchmarks also measure the bytes read per second from persistent storage (i.e., excluding server cache), which is computed from the output of appropriate system utilities.
STAC Report STAC-M3 / kdb+ 3.1 / Kove® XPD2 / Dell / Intel X7560 / Mellanox IB
Copyright © 2013 Securities Technology Analysis Center LLC Page 17
Test cases
The current tests in the STAC-M3 suite are listed in the Summary Table below. As the versioning illustrates, the STAC-M3 Working Group is bringing benchmark specifications to market in phases. The first set of approved specs (those marked as “v1” or, in one case, “v1.1”) focused on storage-system performance with respect to heavy historical data loads. These workloads were deliberately light on compute and heavy on I/O. The second phase, (the Antuco suite, see [1]) added benchmark specs that involve more compute-intensive analytics. These new specifications, marked as “ß1”, have not been put to a vote by the full STAC Benchmark Council and will become v1 specs if approved. These new benchmarks operate by symbol on many fields of underlying tick data for both trades and quotes across varying time windows.
1 The table classifies each test case as relatively heavy on I/O,
compute, or both.
The tests require a client application that is written to a product API and is capable of submitting requests from 10 independent threads. As detailed in the table, some of the benchmarks call for one client instance making requests from a single thread, while others call for one client using 10 threads, and still others require 10 clients each using 10 threads (100 total requesting threads). One set of benchmarks (using the STATS-UI operation) tests multi-user scaling by running with 1, 10, 50, and 100 client threads and allowing the tester to scale to even higher numbers of concurrent threads. In all cases, benchmark results refer to per-request latency. For example, the mean of 10T.MKTSNAP.LAT2 is the mean time to satisfy a single market-snapshot request, not the total time to satisfy requests from all 10 client threads.
The range of dates eligible for querying depends on the benchmark. For example, some algorithms operate on dates randomly chosen throughout the year, some stick to a recent date range, and some always run on the most recent date (see the “Input Date Range” column of the table). The purpose of this is to provide a realistic optimization strategy for systems with multiple storage tiers of different speed, such as solid-state disk (SSD) and spindle-based storage. For example, suppose the tester wanted to demonstrate the benefit of adding an SSD to a system that otherwise relied on spindle-based storage. Furthermore, suppose the SSD was only large enough to store 1/5 of the test database. Benchmarks that accessed dates throughout the entire database would show some performance improvement when the SSD is added, since 1/5 of the queries would enjoy acceleration. In the real world, however, customers don’t simply add faster storage and randomly allocate data to it. Rather, they typically reserve the fastest storage tier for the most frequently accessed data or data accessed by especially time-sensitive algorithms. In STAC-M3, the tester can load the most recent data into the fastest storage. In the case above, the benchmarks that operate on, say, the most recent day (1/252 of the database) or the most recent month (1/12 of the database) will show the maximum improvement possible from the SSD, since their entire queries can be satisfied from SSD. This provides the clearest indication of acceleration possibilities for datasets that can fit within the faster tier.
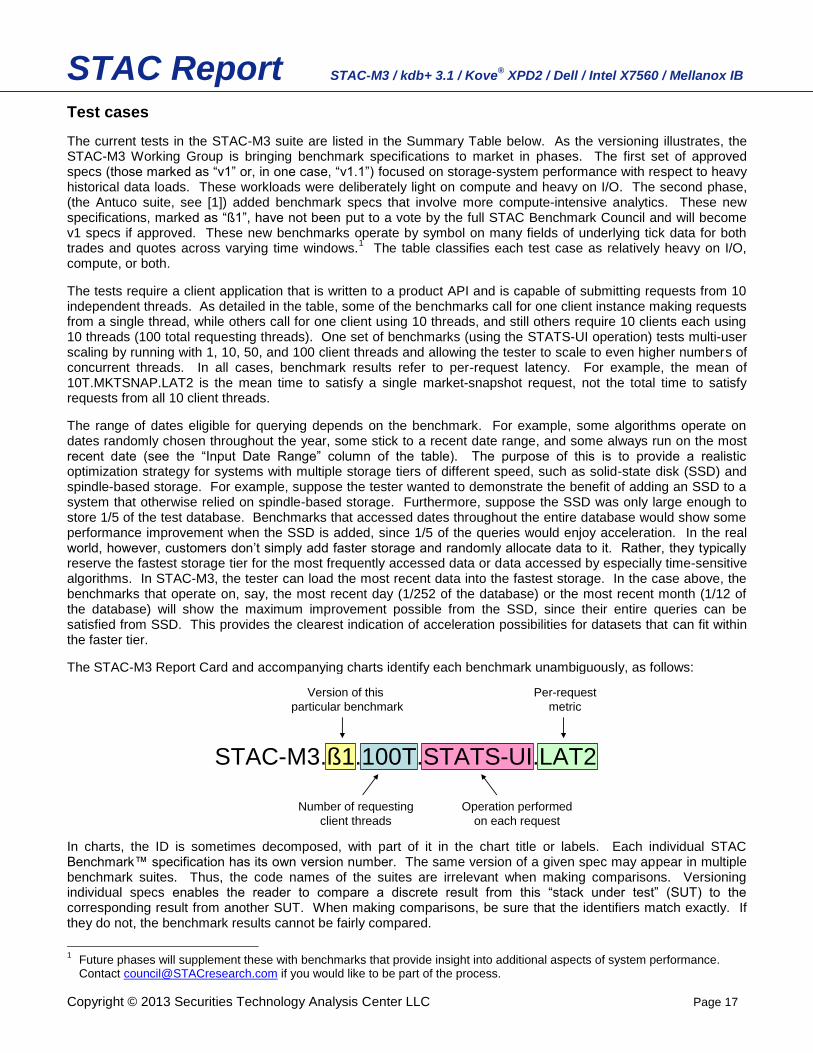
The STAC-M3 Report Card and accompanying charts identify each benchmark unambiguously, as follows:
STAC-M3.ß1.100T.STATS-UI.LAT2
Version of this
particular benchmark
Number of requesting
client threads
Operation performed
on each request
Per-request
metric
In charts, the ID is sometimes decomposed, with part of it in the chart title or labels. Each individual STAC Benchmark™ specification has its own version number. The same version of a given spec may appear in multiple benchmark suites. Thus, the code names of the suites are irrelevant when making comparisons. Versioning individual specs enables the reader to compare a discrete result from this “stack under test” (SUT) to the corresponding result from another SUT. When making comparisons, be sure that the identifiers match exactly. If they do not, the benchmark results cannot be fairly compared.
1 Future phases will supplement these with benchmarks that provide insight into additional aspects of system performance.
Contact [email protected] if you would like to be part of the process.
STAC Report STAC-M3 / kdb+ 3.1 / Kove® XPD2 / Dell / Intel X7560 / Mellanox IB
Copyright © 2013 Securities Technology Analysis Center LLC Page 18
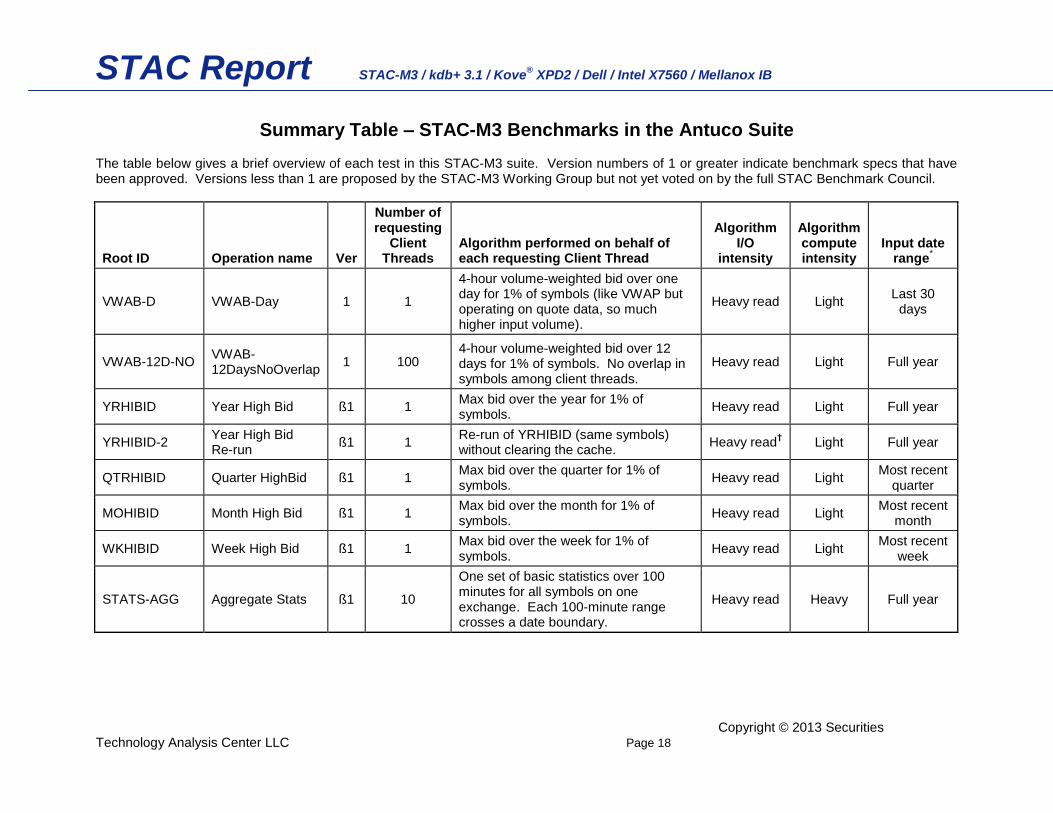
Summary Table – STAC-M3 Benchmarks in the Antuco Suite The table below gives a brief overview of each test in this STAC-M3 suite. Version numbers of 1 or greater indicate benchmark specs that have been approved. Versions less than 1 are proposed by the STAC-M3 Working Group but not yet voted on by the full STAC Benchmark Council.
Root ID Operation name Ver
Number of requesting
Client Threads
Algorithm performed on behalf of each requesting Client Thread
Algorithm I/O
intensity
Algorithm compute intensity
Input date range
*
VWAB-D VWAB-Day 1 1
4-hour volume-weighted bid over one day for 1% of symbols (like VWAP but operating on quote data, so much higher input volume).
Heavy read Light Last 30
days
VWAB-12D-NO VWAB-12DaysNoOverlap
1 100 4-hour volume-weighted bid over 12 days for 1% of symbols. No overlap in symbols among client threads.
Heavy read Light Full year
YRHIBID Year High Bid ß1 1 Max bid over the year for 1% of symbols.
Heavy read Light Full year
YRHIBID-2 Year High Bid Re-run
ß1 1 Re-run of YRHIBID (same symbols) without clearing the cache.
Heavy read† Light Full year
QTRHIBID Quarter HighBid ß1 1 Max bid over the quarter for 1% of symbols.
Heavy read Light Most recent
quarter
MOHIBID Month High Bid ß1 1 Max bid over the month for 1% of symbols.
Heavy read Light Most recent
month
WKHIBID Week High Bid ß1 1 Max bid over the week for 1% of symbols.
Heavy read Light Most recent
week
STATS-AGG Aggregate Stats ß1 10
One set of basic statistics over 100 minutes for all symbols on one exchange. Each 100-minute range crosses a date boundary.
Heavy read Heavy Full year
STAC Report STAC-M3 / kdb+ 3.1 / Kove® XPD2 / Dell / Intel X7560 / Mellanox IB
Copyright © 2013 Securities Technology Analysis Center LLC Page 19
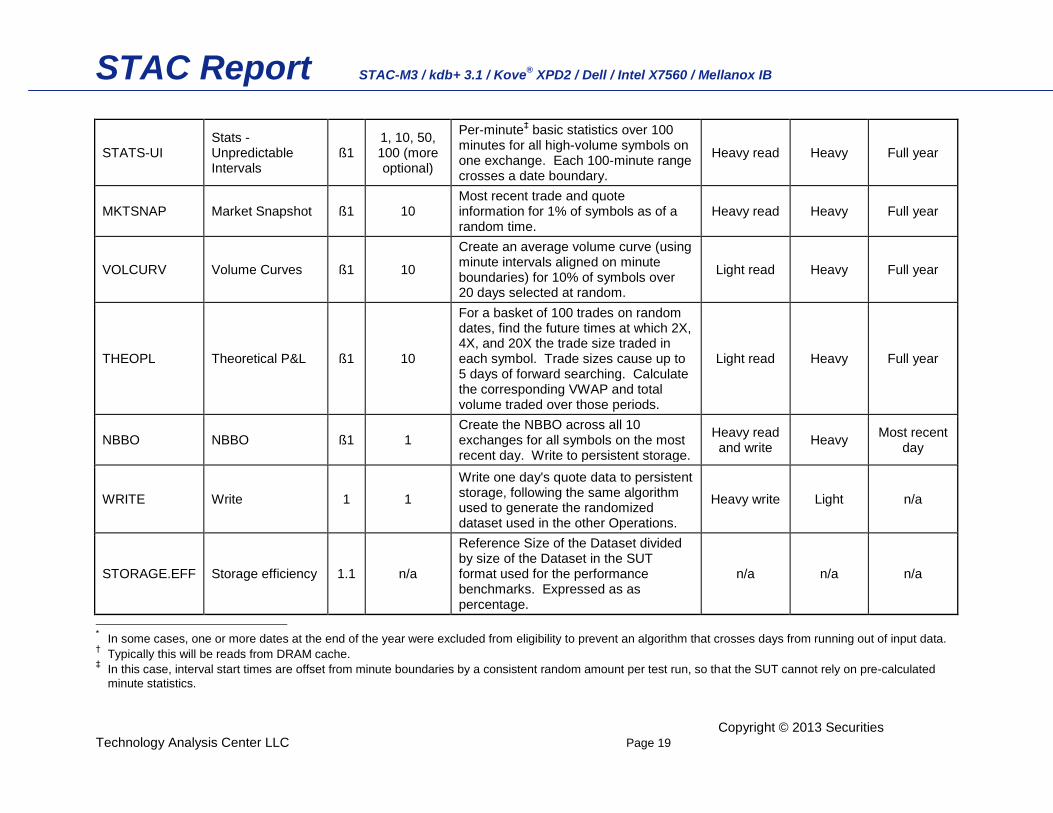
STATS-UI Stats - Unpredictable Intervals
ß1 1, 10, 50, 100 (more optional)
Per-minute‡ basic statistics over 100
minutes for all high-volume symbols on one exchange. Each 100-minute range crosses a date boundary.
Heavy read Heavy Full year
MKTSNAP Market Snapshot ß1 10 Most recent trade and quote information for 1% of symbols as of a random time.
Heavy read Heavy Full year
VOLCURV Volume Curves ß1 10
Create an average volume curve (using minute intervals aligned on minute boundaries) for 10% of symbols over 20 days selected at random.
Light read Heavy Full year
THEOPL Theoretical P&L ß1 10
For a basket of 100 trades on random dates, find the future times at which 2X, 4X, and 20X the trade size traded in each symbol. Trade sizes cause up to 5 days of forward searching. Calculate the corresponding VWAP and total volume traded over those periods.
Light read Heavy Full year
NBBO NBBO ß1 1 Create the NBBO across all 10 exchanges for all symbols on the most recent day. Write to persistent storage.
Heavy read and write
Heavy Most recent
day
WRITE Write 1 1
Write one day's quote data to persistent storage, following the same algorithm used to generate the randomized dataset used in the other Operations.
Heavy write Light n/a
STORAGE.EFF Storage efficiency 1.1 n/a
Reference Size of the Dataset divided by size of the Dataset in the SUT format used for the performance benchmarks. Expressed as as percentage.
n/a n/a n/a
* In some cases, one or more dates at the end of the year were excluded from eligibility to prevent an algorithm that crosses days from running out of input data.
† Typically this will be reads from DRAM cache.
‡ In this case, interval start times are offset from minute boundaries by a consistent random amount per test run, so that the SUT cannot rely on pre-calculated
minute statistics.
STAC Report STAC-M3 / kdb+ 3.1 / Kove® XPD2 / Dell / Intel X7560 / Mellanox IB
Copyright © 2013 Securities Technology Analysis Center LLC Page 20
2. Product background The stack under test (SUT) included the following:
Kx Systems kdb+ 3.1 with STAC-M3 Pack for kdb+ 3
Kove® XPD™ L2 Storage System with Mellanox QDR InfiniBand, dual port
Dell PowerEdge™ R910 server
Intel Xeon X7560 Processors
CentOS Release 6.3 with ext4
Mellanox MT26428 ConnectX®-2 QDR InfiniBand, dual port HCA
Mellanox MTS3600 InfiniScale-IV QDR InfiniBand switch
Kx Systems submitted the following information and claims about its products:
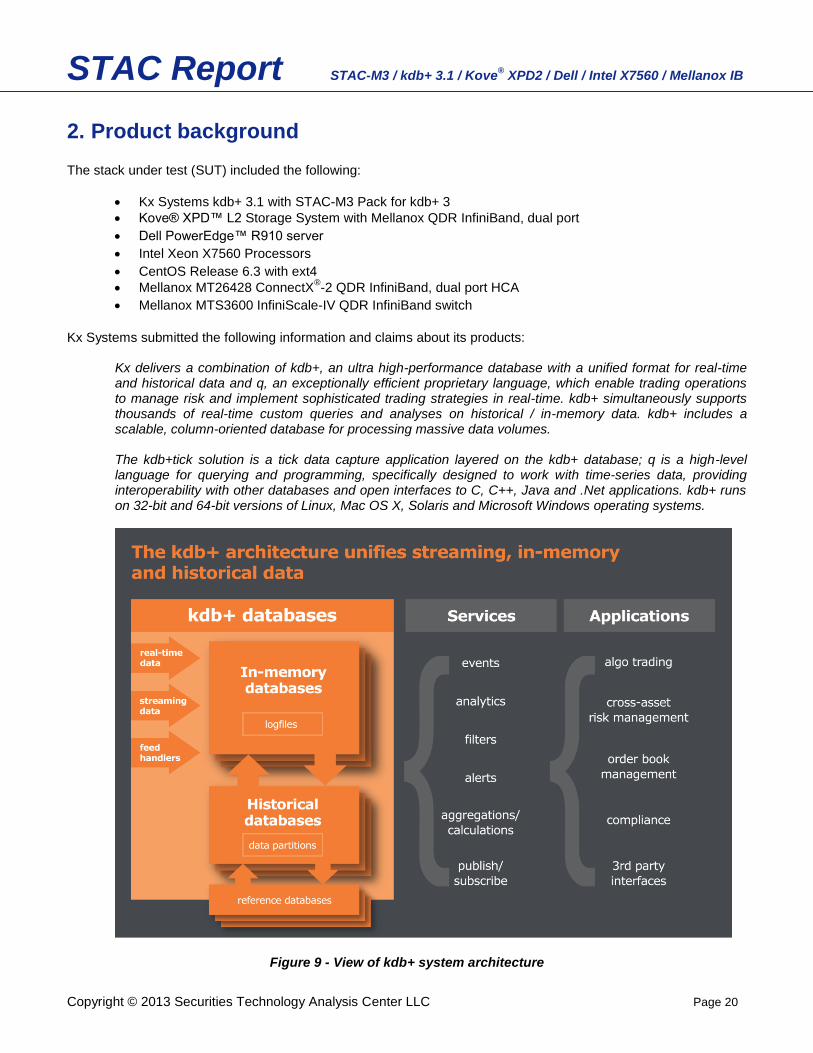
Kx delivers a combination of kdb+, an ultra high-performance database with a unified format for real-time and historical data and q, an exceptionally efficient proprietary language, which enable trading operations to manage risk and implement sophisticated trading strategies in real-time. kdb+ simultaneously supports thousands of real-time custom queries and analyses on historical / in-memory data. kdb+ includes a scalable, column-oriented database for processing massive data volumes. The kdb+tick solution is a tick data capture application layered on the kdb+ database; q is a high-level language for querying and programming, specifically designed to work with time-series data, providing interoperability with other databases and open interfaces to C, C++, Java and .Net applications. kdb+ runs on 32-bit and 64-bit versions of Linux, Mac OS X, Solaris and Microsoft Windows operating systems.
Figure 9 - View of kdb+ system architecture
STAC Report STAC-M3 / kdb+ 3.1 / Kove® XPD2 / Dell / Intel X7560 / Mellanox IB
Copyright © 2013 Securities Technology Analysis Center LLC Page 21
Kove submitted the following information and claims about its products:
Kove, a leading high performance storage vendor, produces the storage industry’s highest-density, highest performance memory disk. The next generation Kove Xpress Memory Disk is a continuation of our leadership in high performance storage. XPD2 delivers exceptional price to performance ratios, functionality, scalability and ease of use for any storage user. The Kove XPD2 is the world’s fastest and highest density memory storage device ever, and the highest density in a 4U chassis. The record-setting performance will allow organizations to improve I/O load processing and remove storage bottlenecks, without concern for media wear, capacity fill, sequential versus random usage patterns, small or large data, burst, bandwidth, latency, or IOPS. Core/Legacy systems can be easily redeployed without costly code rewrites, all the while reducing the cost of data center space and power consumption on a performance basis. In addition to cost savings, the “Green” XPD2 provides continuous, predictable, sustained I/O for any duration of time. The Kove XPD2s use DRAM rather than flash or spinning disk due to the increased performance gains, sustainability, predictability and reliability provided by DRAM. XPD2 maintains consistent performance even with 100% occupancy and it never wears out. The XPD2 easily connects directly to existing storage fabrics via Fibre Channel and InfiniBand while increasing performance metrics beyond any other storage option. Since the XPD2 can operate as a standard mesh sharable device in addition to direct-connect, it is easy to deploy, manage, and scale. Sharing data that exceeds any single unit’s capacity is easily accommodated without performance compromise. For more information please visit www.kove.com.
Dell submitted the following information and claims about its products:
Dell Inc. (NASDAQ: DELL) listens to customers and delivers innovative technology and services that give them the power to do more. For large enterprises in the banking and securities industries, Dell provides solutions that solve customers' IT challenges in performance, storage, security, and innovation in ways that are cost-effective and efficient. The Dell-Kove R910 Appliance is a purpose built solution, customized through the Dell OEM organization that has been designed for the highest performing databases, Tick Data/Tick Analytic databases and Market Data analytic requirements. The Dell-Kove R910 Appliance is available today and is supported through your local Dell Account Teams. For more information, please contact Dell through the contact listed in Section 4.
Mellanox submitted the following information and claims about its products:
Mellanox Technologies (NASDAQ: MLNX, TASE: MLNX) is a leading supplier of end-to-end InfiniBand and Ethernet connectivity solutions and services for servers and storage. Mellanox products optimize data center performance and deliver industry-leading bandwidth, scalability, power conservation and cost- effectiveness while converging multiple legacy network technologies into one future-proof architecture. The company offers innovative solutions that address a wide range of markets including HPC, financial services, enterprise, mega warehouse data centers, cloud computing, Internet and Web 2.0. Mellanox offers the lowest latency networking solutions for high frequency trading with its unique end-to- end solution (adapters, switching platforms and software), leveraging both InfiniBand and 10/40 Gigabit Ethernet technologies. As a pioneer in the field of high frequency trading networking, Mellanox has deployed its solutions at a large array of investment banks, hedge funds and exchanges. These solutions have been certified and deployed with the leading software providers in this industry. Founded in 1999, Mellanox Technologies is headquartered in Sunnyvale, California and Yokneam, Israel. For more information, please visit www.mellanox.com.
STAC Report STAC-M3 / kdb+ 3.1 / Kove® XPD2 / Dell / Intel X7560 / Mellanox IB
Copyright © 2013 Securities Technology Analysis Center LLC Page 22
3. Project participants and responsibilities The following firms participated in the project:
Kx Systems
Kove
Dell
Mellanox
STAC The Project Participants had the following responsibilities:
Kx implemented the STAC-M3 Clients and Operations using the STAC-M3 Benchmark specifications.
Kx configured and optimized the stack under test (SUT).
Kove supplied the Kove® XPD™ L2 storage hardware for the test.
Dell provided SUT host (Dell PowerEdge™ R910 server) for the test.
Mellanox provided the InfiniBand interconnect solutions for this test.
Kx sponsored the test.
STAC conducted the STAC-M3 Benchmark Audit, which included validating the database; inspecting any source-code revisions to the STAC Pack; validating the Operation results; executing the tests; checking the system configuration; and documenting the results.
4. Contacts Kx Systems: Fintan Quill, [email protected], tel: +1 212 792 4230
Kove: Jim Hetherington, Director of Business Development, [email protected], +1 505 379 3125, www.kove.com
Dell: Mark King, Global Strategy & Business Development Director, [email protected], +1 203 840 1631, www.dell.com
Mellanox: Asaf Wachtel, Director of Business Development FSI, [email protected], +972 74 7129306, www.mellanox.com
Intel: David O’Shea, Financial Services Software Manager ([email protected]) or Rick Carlin, Senior Performance Engineer ([email protected]). See also information posted at http://ipip.intel.com/FSI and http://software.intel.com/en-us/articles/financial-services-industry-community/
5. Results status These benchmark specifications were developed by the STAC-M3 Working Group of the STAC Benchmark
Council. Benchmarks with a “v1” or higher have been approved by the full Council. Those with a “ß” designation have been proposed by the STAC-M3 Working Group but have not yet been approved.
These test results were audited by STAC or a STAC-certified third party, as indicated in the Responsibilities section above. As such, they are official results. For details, see www.STACresearch.com/reporting.
The vendors attest that they did not modify the SUT during the Audit.
6. Specifications This project followed the Antuco suite of STAC-M3 Benchmark specifications. Full members of the STAC Benchmark Council can access these specifications at www.STACresearch.com/m3. Premium subscribers to the
STAC Report STAC-M3 / kdb+ 3.1 / Kove® XPD2 / Dell / Intel X7560 / Mellanox IB
Copyright © 2013 Securities Technology Analysis Center LLC Page 23
Market Data or Trade Flow STAC Tracks can download the programs used in these benchmarks in order to run the same tests on systems in the privacy of their own labs.
7. Limitations As discussed in Section 1, this suite of STAC-M3 Benchmarks was designed to test operations on a limited
amount of purely historical data. Tests involving much larger amounts of historical data are available in the Kanaga suite of STAC-M3 Benchmark specifications.
As discussed in Section 1, the dataset used in this version of STAC-M3 is synthetic. The algorithm to generate the dataset creates random values for prices and sizes that can vary widely from tick to tick. In the real world, by contrast, there is significant correlation of successive prices (i.e., large differences from tick to tick are relatively rare). Compression algorithms often take advantage of this fact, such as by focusing on deltas between successive values. Hence, the storage efficiency of a SUT may be higher when working with real data than with the synthetic dataset of this version of STAC-M3.
8. Stack under test Detailed configuration information is available to premium members of the STAC Benchmark Council. If this document is not in your myVault account (www.STACresearch.com/myVault), and you would like to request access, use the request form at: www.STACresearch.com/node/14095.
9. Vendor Commentary
Kx Systems provided the following comments:
Because kdb+ is an array database the complete results of queries are returned from the calls, so the
concept of "first result" (LAT1) has no meaning in the context of the Kx product.