Embed Size (px)
Citation preview
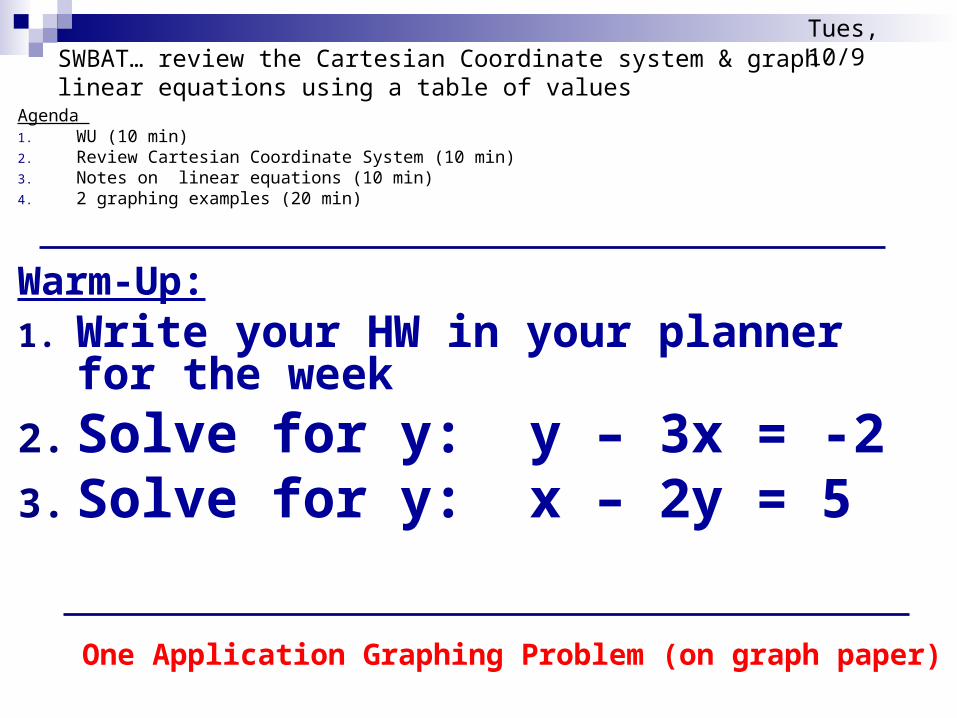
SWBAT… review the Cartesian Coordinate system & graph linear equations using a table of values
Agenda 1. WU (10 min)2. Review Cartesian Coordinate System (10 min)3. Notes on linear equations (10 min)4. 2 graphing examples (20 min)
Warm-Up:1. Write your HW in your planner for the
week
2. Solve for y: y – 3x = -2 3. Solve for y: x – 2y = 5
One Application Graphing Problem (on graph paper)
Tues, 10/9
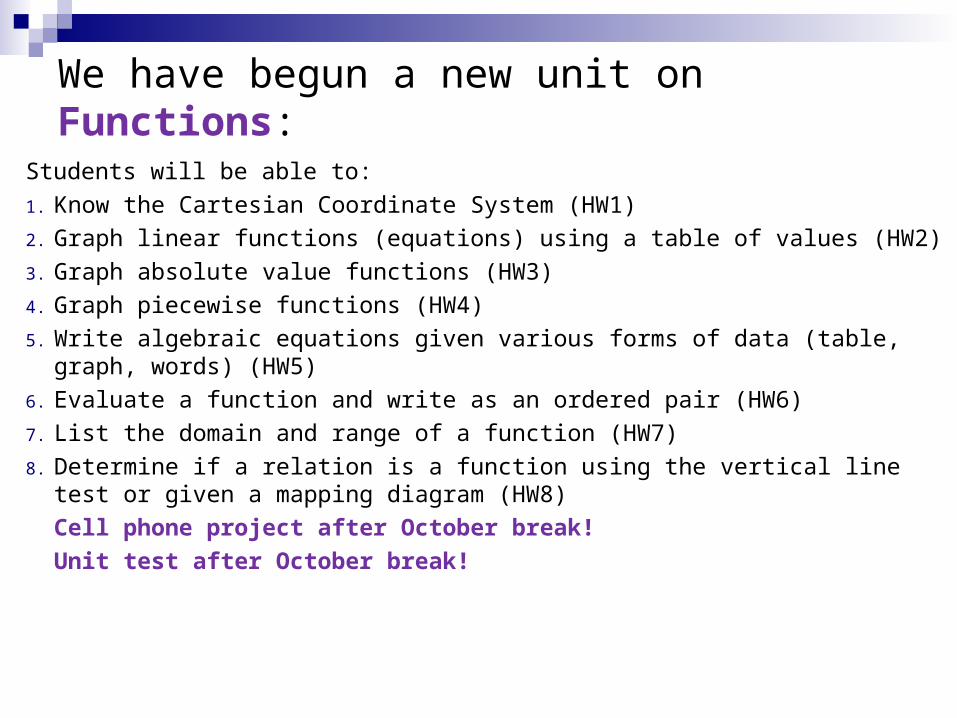
We have begun a new unit on Functions:
Students will be able to:
1. Know the Cartesian Coordinate System (HW1)
2. Graph linear functions (equations) using a table of values (HW2)
3. Graph absolute value functions (HW3)
4. Graph piecewise functions (HW4)
5. Write algebraic equations given various forms of data (table, graph, words) (HW5)
6. Evaluate a function and write as an ordered pair (HW6)
7. List the domain and range of a function (HW7)
8. Determine if a relation is a function using the vertical line test or given a mapping diagram (HW8)
Cell phone project after October break!
Unit test after October break!

Cartesian Coordinate System
Infinity HS
Ms. Sophia Papaefthimiou
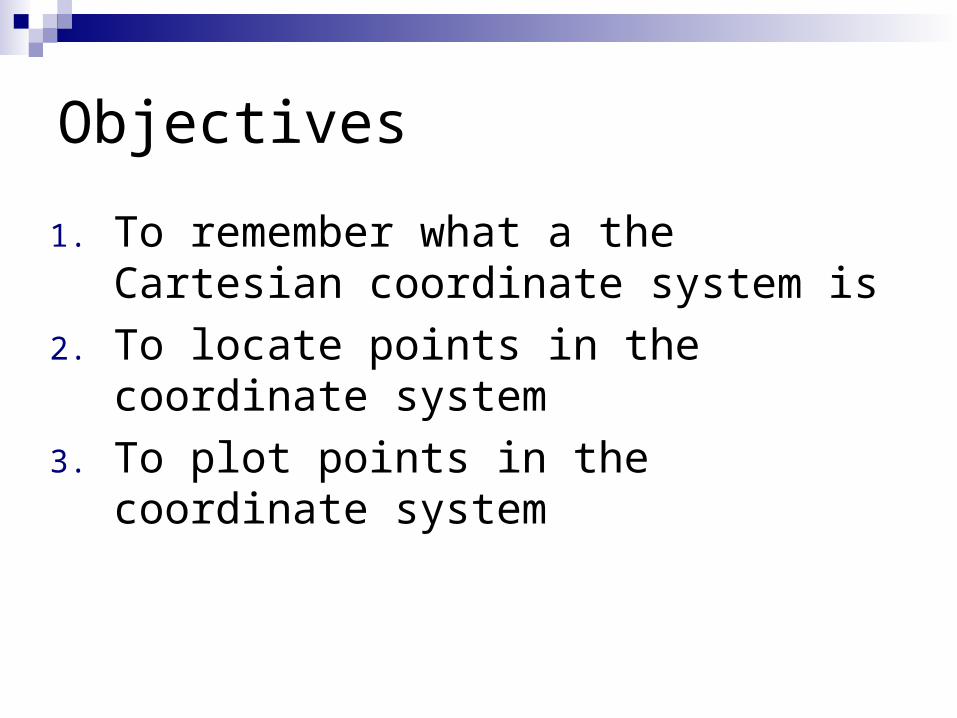
Objectives
1. To remember what a the Cartesian coordinate system is
2. To locate points in the coordinate system
3. To plot points in the coordinate system
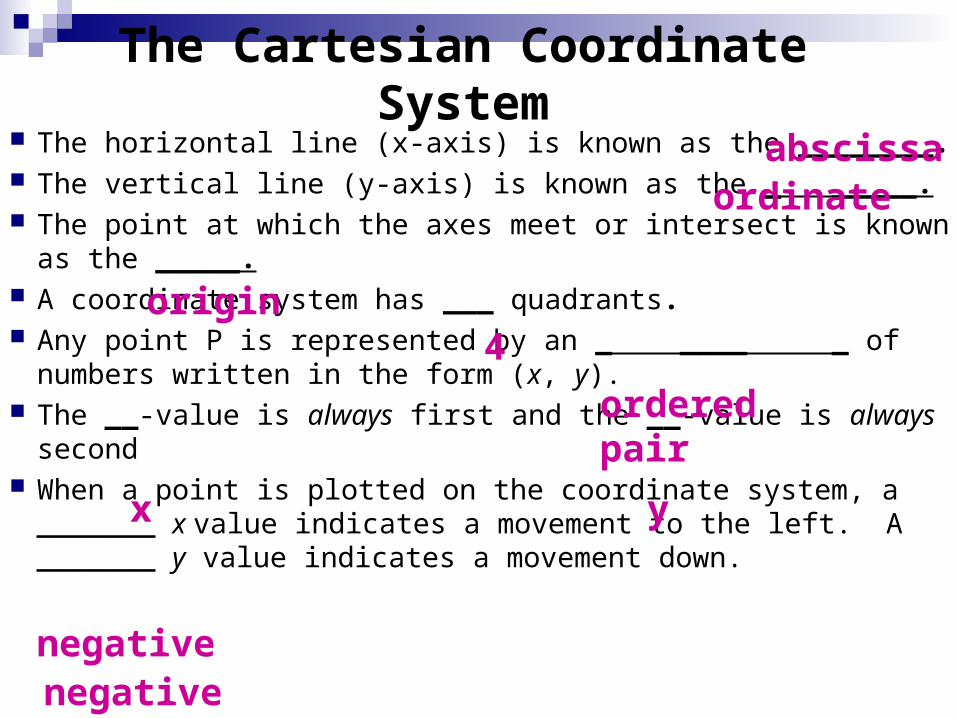
The Cartesian Coordinate System The horizontal line (x-axis) is known as the ________. The vertical line (y-axis) is known as the _ _____. The point at which the axes meet or intersect is known as the
_____. A coordinate system has ___ quadrants. Any point P is represented by an _ ____ _ of numbers
written in the form (x, y). The __-value is always first and the __-value is always second When a point is plotted on the coordinate system, a _______ x
value indicates a movement to the left. A _______ y value indicates a movement down.
abscissaordinate
origin4
ordered pair
x y
negativenegative
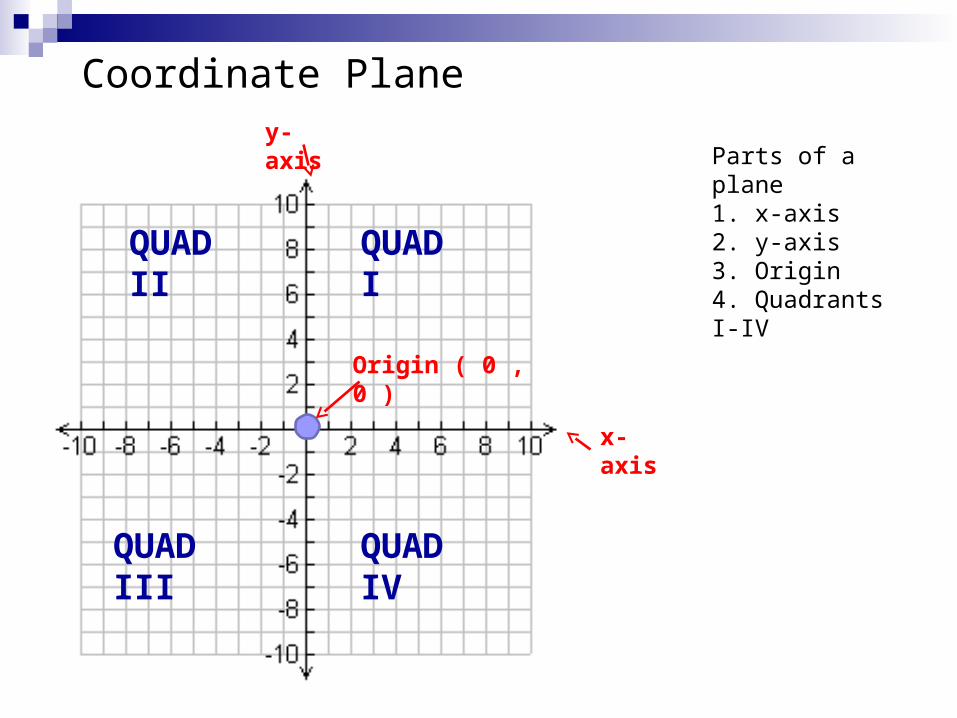
Coordinate Plane
Parts of a plane1. x-axis2. y-axis3. Origin4. Quadrants I-IV
x-axis
y-axis
Origin ( 0 , 0 )
QUAD IQUAD II
QUAD III QUAD IV
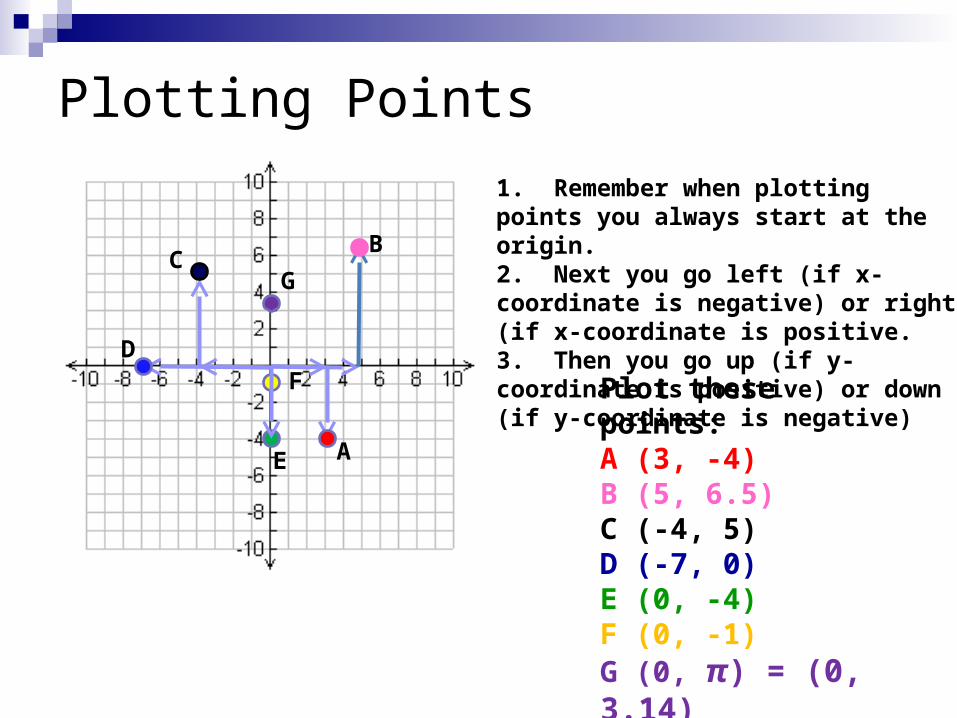
Plotting Points
1. Remember when plotting points you always start at the origin. 2. Next you go left (if x-coordinate is negative) or right (if x-coordinate is positive. 3. Then you go up (if y-coordinate is positive) or down (if y-coordinate is negative)
Plot these points:A (3, -4)B (5, 6.5)C (-4, 5)D (-7, 0)E (0, -4)F (0, -1)G (0, π) = (0, 3.14)
A
BC
DF
E
G
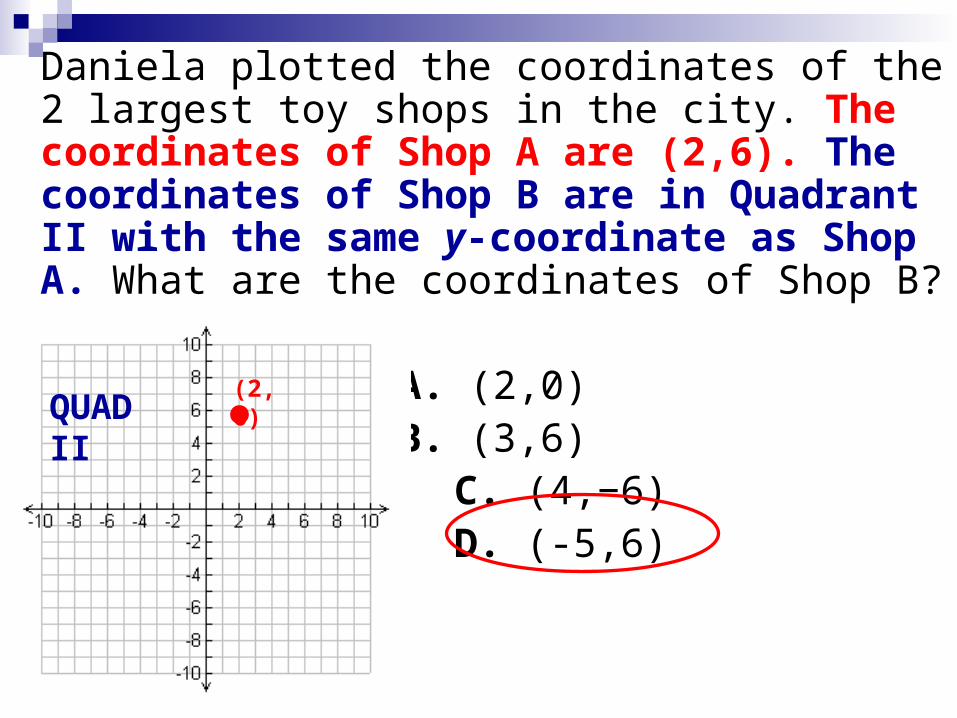
Daniela plotted the coordinates of the 2 largest toy shops in the city. The coordinates of Shop A are (2,6). The coordinates of Shop B are in Quadrant II with the same y-coordinate as Shop A. What are the coordinates of Shop B?
A. (2,0)B. (3,6)
C. (4,−6) D. (-5,6)
(2, 6)QUAD II

Graphing linear equations using a table of values
Infinity HS
Ms. Sophia Papaefthimiou
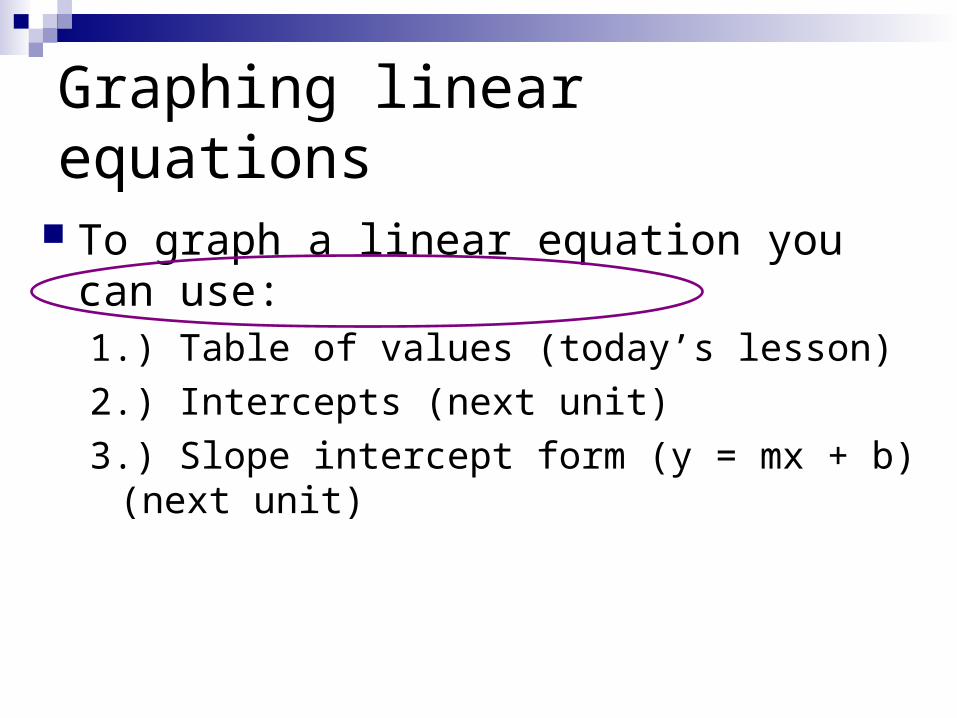
Graphing linear equations
To graph a linear equation you can use:1.) Table of values (today’s lesson)
2.) Intercepts (next unit)
3.) Slope intercept form (y = mx + b) (next unit)
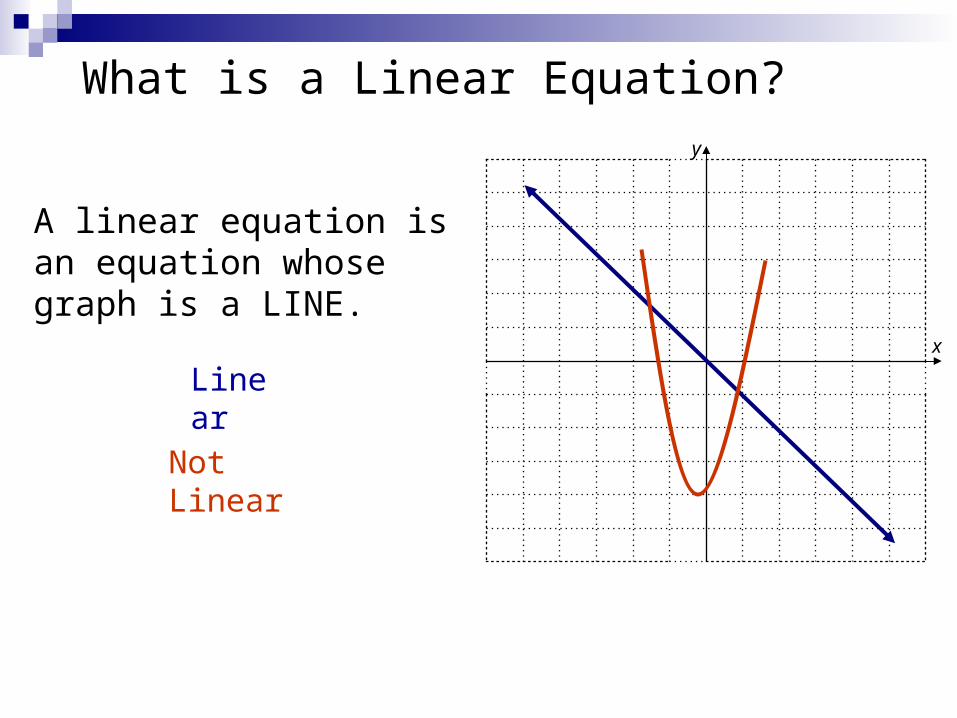
What is a Linear Equation?
A linear equation is an equation whose graph is a LINE.
y
x
Linear
Not Linear
( ) ( )2 3 3 2 12+ =
What is a Linear Equation?
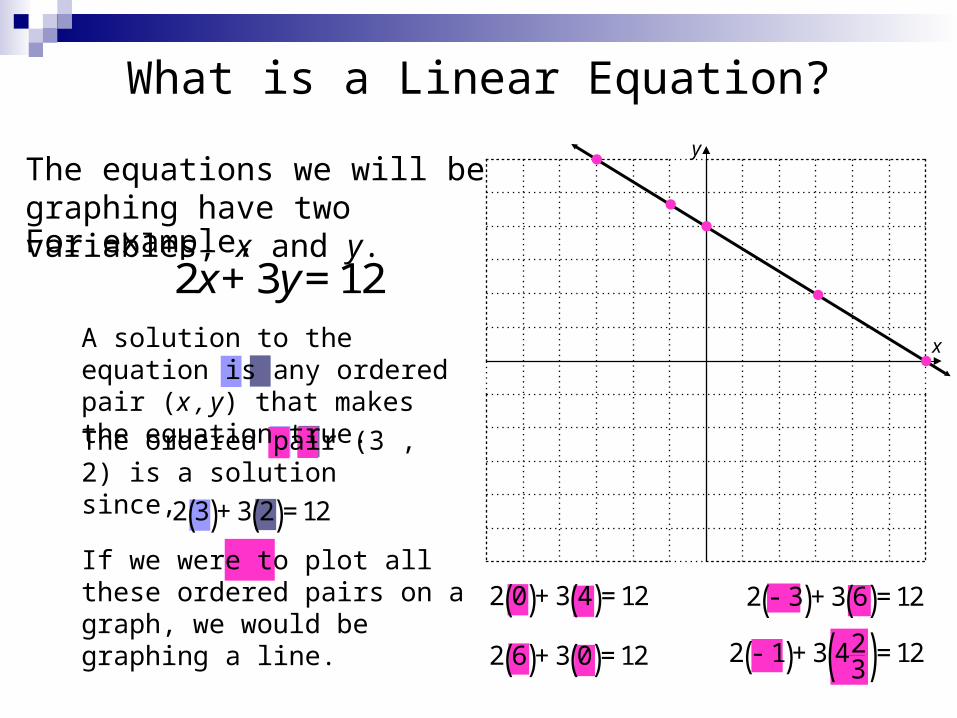
A solution to the equation is any ordered pair (x , y) that makes the equation true.
If we were to plot all these ordered pairs on a graph, we would be graphing a line.
The equations we will be graphing have two variables, x and y.
2 3 12x y+ =
y
x
For example,
The ordered pair (3 , 2) is a solution since,
( ) ( )2 0 3 4 12+ =
( ) ( )2 6 3 0 12+ =
( ) ( )2 3 3 6 12- + =
( ) ( )22 1 3 4 123
- + =
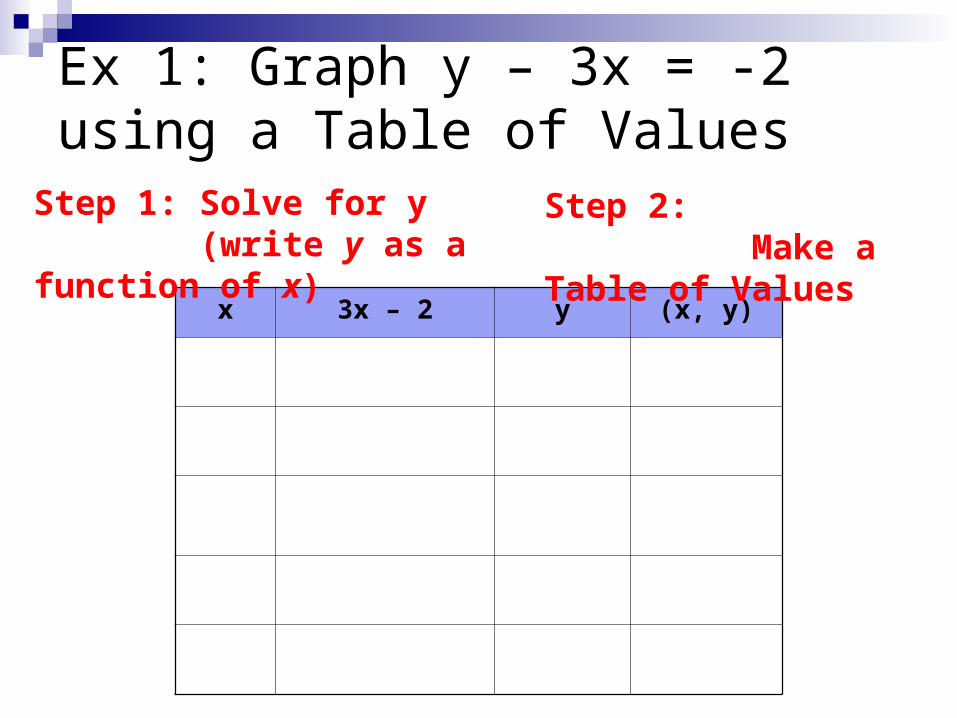
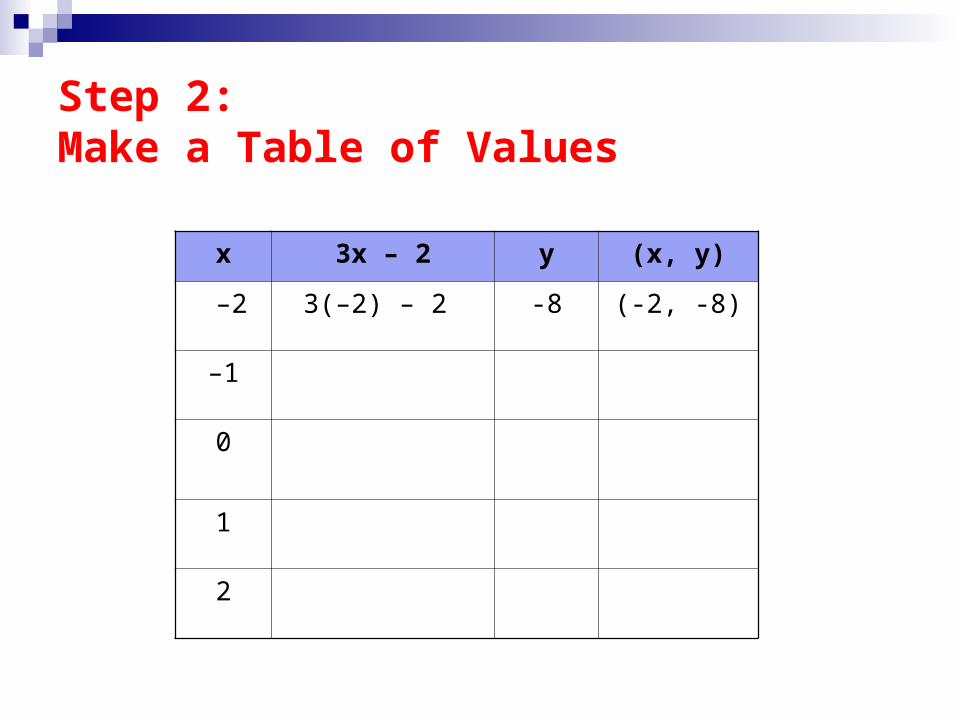
Ex 1: Graph y – 3x = -2 using a Table of Values
x 3x – 2 y (x, y)
Step 1: Solve for y (write y as a function of x)
Step 2: Make a Table of Values
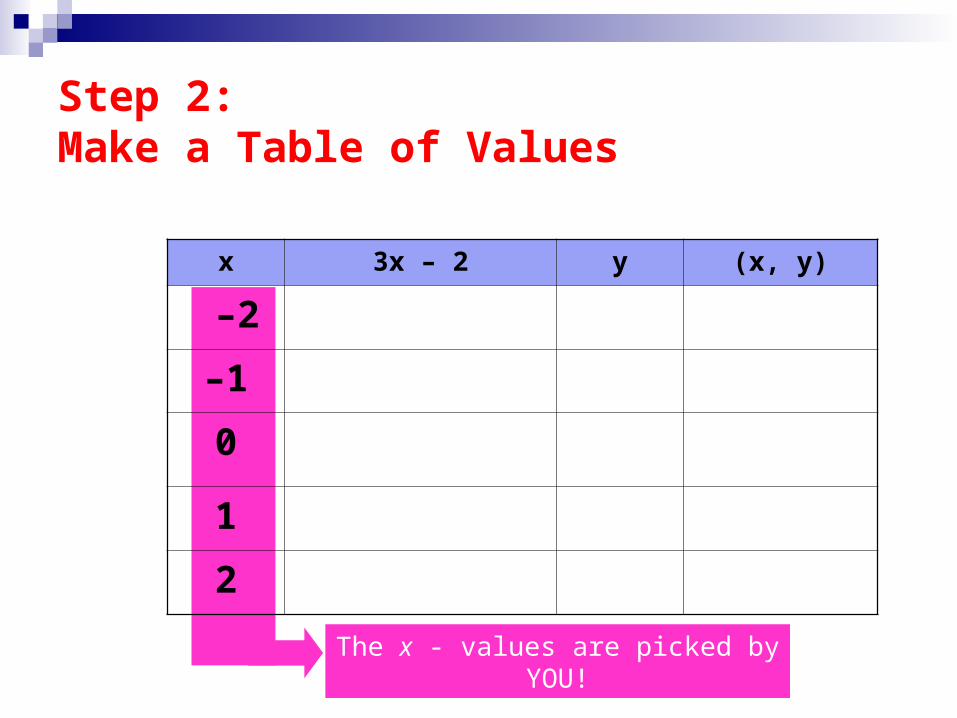
Step 2: Make a Table of Values
The x - values are picked by YOU!
x 3x – 2 y (x, y)
–2
–1
0
1
2
Step 2: Make a Table of Values
x 3x – 2 y (x, y)
–2 3(–2) – 2 -8 (-2, -8)
–1
0
1
2
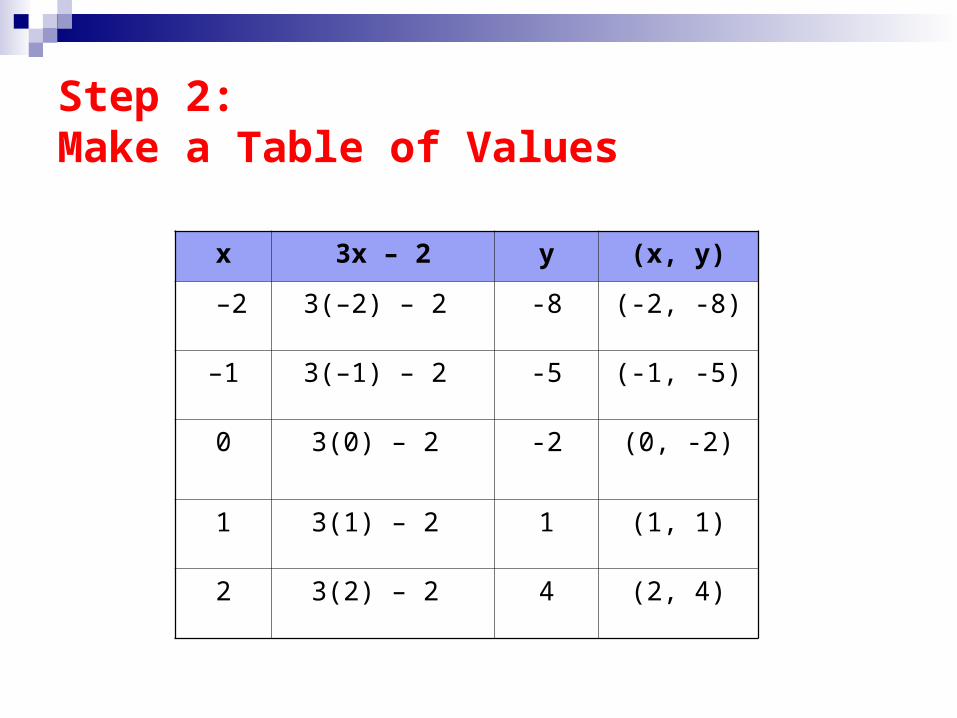
Step 2: Make a Table of Values
x 3x – 2 y (x, y)
–2 3(–2) – 2 -8 (-2, -8)
–1 3(–1) – 2 -5 (-1, -5)
0 3(0) – 2 -2 (0, -2)
1 3(1) – 2 1 (1, 1)
2 3(2) – 2 4 (2, 4)
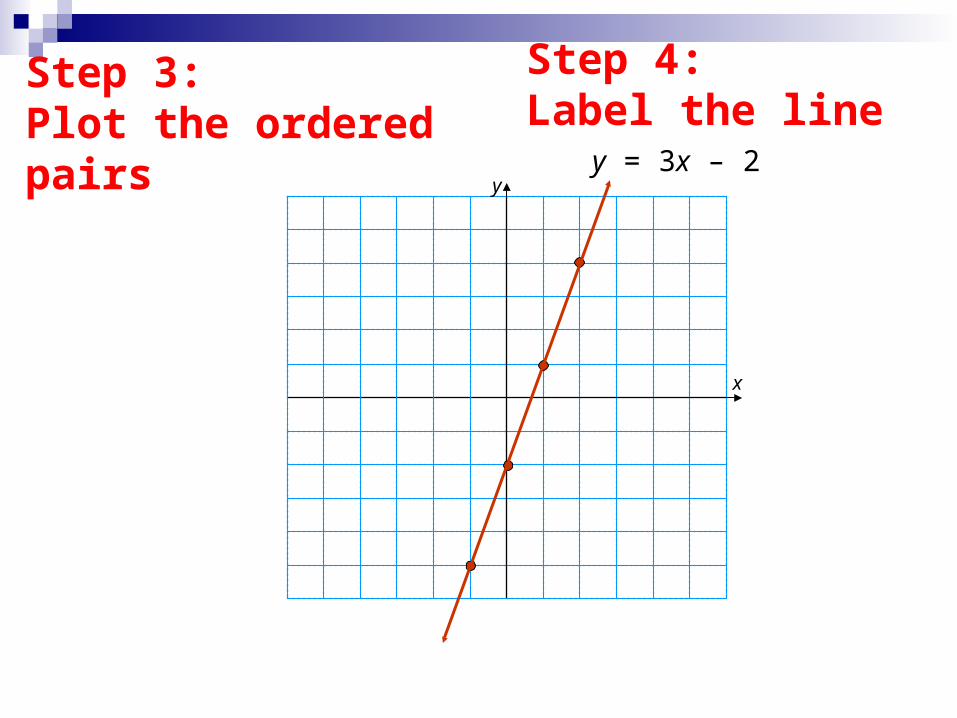
y = 3x – 2y
x
Step 3:Plot the ordered pairs
Step 4:Label the line
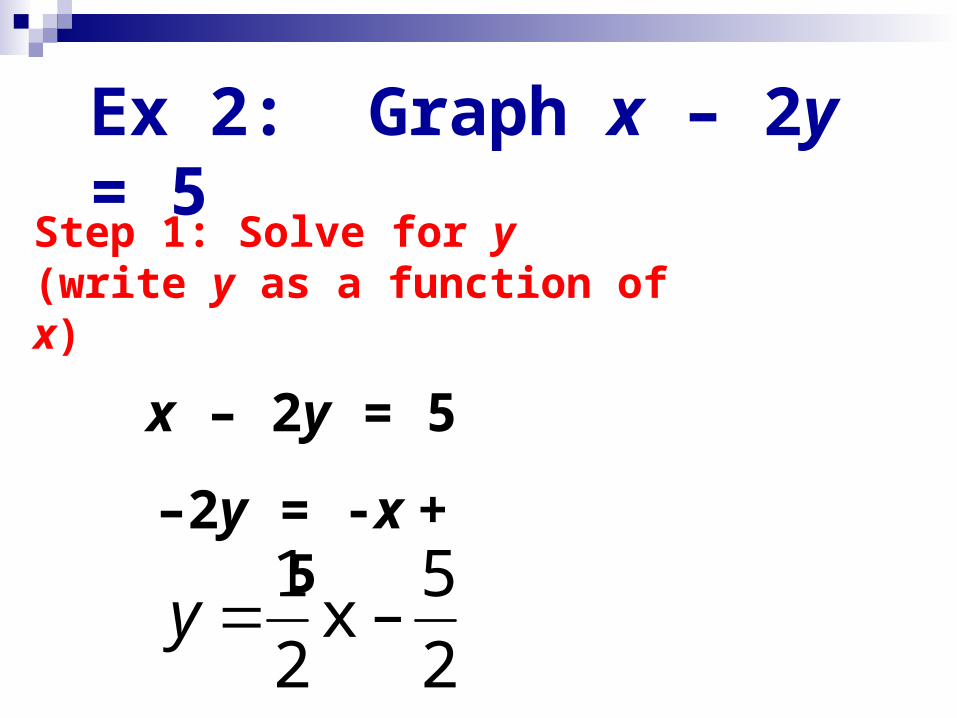
Ex 2: Graph x – 2y = 5
Step 1: Solve for y (write y as a function of x)
x – 2y = 5
–2y = -x + 5
2
5–x
2
1y
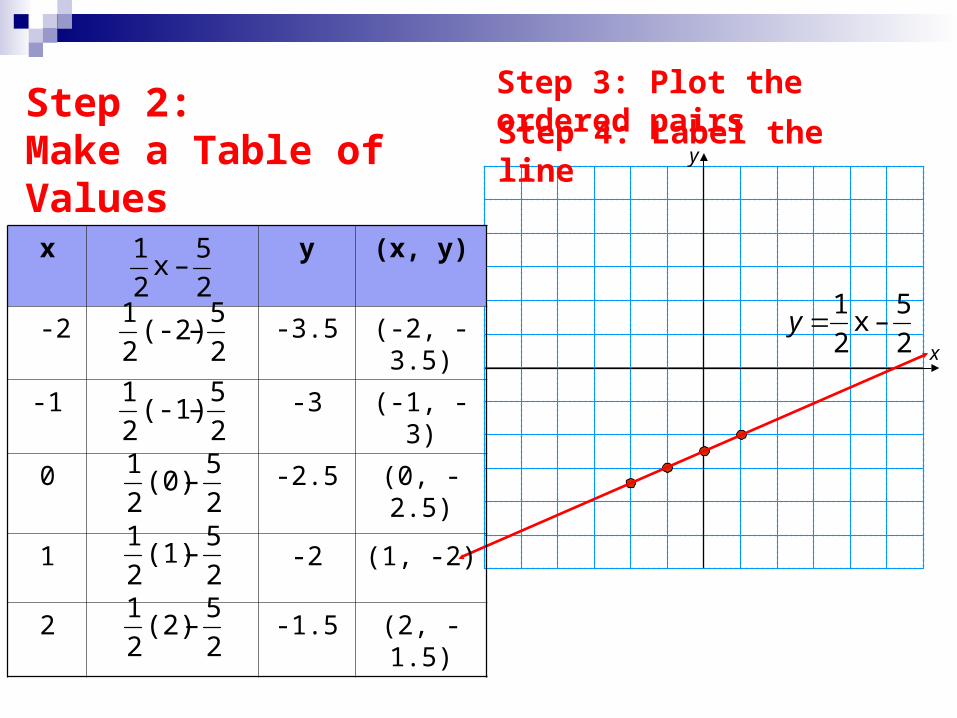
y
x
Step 2: Make a Table of Values
x y (x, y)
-2 -3.5 (-2, -3.5)
-1 -3 (-1, -3)
0 -2.5 (0, -2.5)
1 -2 (1, -2)
2 -1.5 (2, -1.5)
2
5–x
2
1
2
5–(-2)
2
1
2
5–(-1)
2
1
2
5–(0)
2
1
2
5–(1)
2
1
2
5–(2)
2
1
2
5–x
2
1y
Step 3: Plot the ordered pairs
Step 4: Label the line
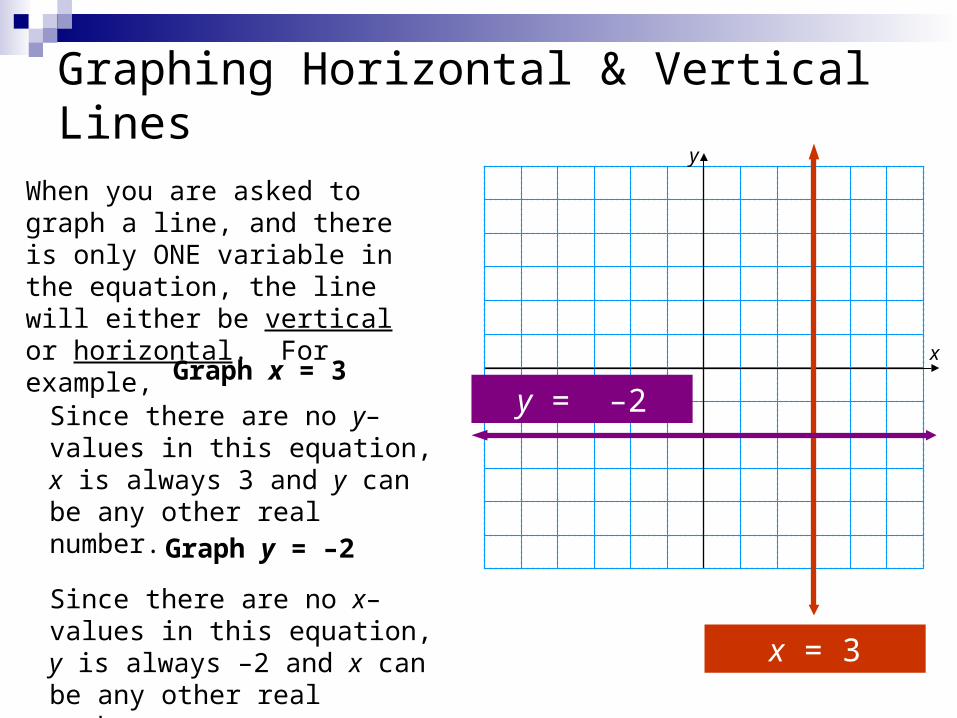
Graphing Horizontal & Vertical Linesy
x
When you are asked to graph a line, and there is only ONE variable in the equation, the line will either be vertical or horizontal. For example,
Graph x = 3
Since there are no y–values in this equation, x is always 3 and y can be any other real number.
x = 3
Graph y = –2
Since there are no x–values in this equation, y is always –2 and x can be any other real number.
y = –2
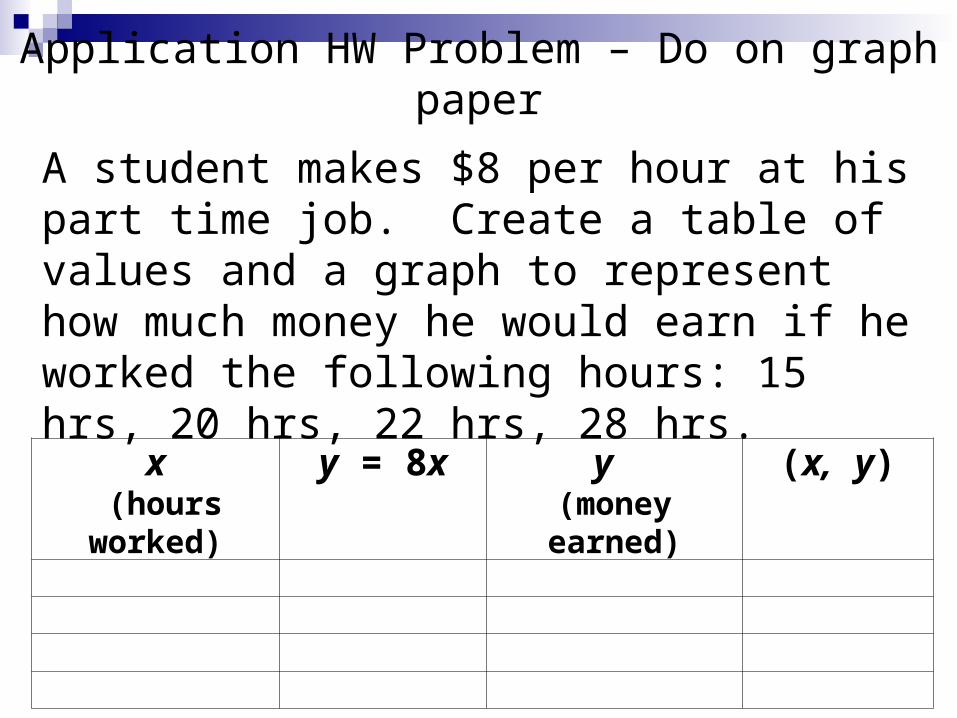
Application HW Problem – Do on graph paper
A student makes $8 per hour at his part time job. Create a table of values and a graph to represent how much money he would earn if he worked the following hours: 15 hrs, 20 hrs, 22 hrs, 28 hrs.
x (hours worked)
y = 8x y (money earned)
(x, y)