Embed Size (px)
Citation preview

Swedbank Q2 2006

2
Strategic Developments
Jan Lidén,President and CEO

3
Q2 business highlights
• Swedish Banking - Continued high business activity and less margin pressure
– Steady growth in corporate and household lending– Stabilizing mortgage margins– Improving deposit margins
• Baltic Banking - Continued rapid growth with stable margins– Stable growth in lending volumes – Deposit margins up in Estonia and Lithuania, down in Latvia– Lending margins down in Estonia and Lithuania and up in Latvia
• Swedbank Markets - Solid performance across all business areas in both Sweden and Norway, in particular …
– Equity and FX/Fixed Income trading performed well – Strong earnings in Project & Corporate Finance in both Sweden and
Norway– Strong growth of stock market volumes in Norway
• One-off items during Q2– Russian VAT provisions SEK -114 M – SpareBank 1 Gruppen shares increased value SEK 342 M

4
June 30 Dec 31 June 30 Change, Change,Lending 2006 2005 2005 YTD, % Y/Y, %
Swedbank Group 852 796 753 7 13Of whichSpintab household lending 357 340 322 5 11Corporate lending 353 331 322 7 10Baltic Banking 109 89 69 24 60
SavingsSwedbank Group 763 729 681 5 12Of which:Household deposits 204 182 173 12 18Funds under management 371 365 329 2 13Equity linked retail bonds 20 13 11 61 77
Volume GrowthSEK bn
*** **
*Excluding Baltic Banking
**Growth rate calculated in local currency, EEK

5Margins of loans and deposits
0.0%
0.5%
1.0%
1.5%
2.0%
2.5%
3.0%
3.5%
4.0%
Q2-05 Q3-05 Q4-05 Q1-06 Q2-06
Estonia Latvia Lithuania Sweden
0.0%
0.5%
1.0%
1.5%
2.0%
2.5%
Q2 05 Q3-05 Q4-05 Q1-06 Q2-06
Estonia Latvia Lithuania Sweden
Lending Deposits

6Swedish Banking
0
500
1,000
1,500
2,000
2,500
3,000
3,500
4,000
4,500
5,000
Q3-04 Q4-04 Q1-05 Q2-05 Q3-05 Q4-05 Q1-06 Q2-06
Income Expenses
SEK M
***
*Excluding EnterCard SEK 810 M **Excluding KIAB SEK 1,421 M
C/I 0.51
7Swedish Banking Net interest income
2,000
2,200
2,400
2,600
2,800
3,000
3,200
3,400
Q2-04 Q3-04 Q4-04 Q1-05 Q2-05 Q3-05 Q4-05 Q1-06 Q2-06
SEK M
4%

8Baltic Banking
0
200
400
600
800
1,000
1,200
1,400
1,600
1,800
Q3-04 Q4-04 Q1-05 Q2-05 Q3-05 Q4-05 Q1-06 Q2-06
Income Expenses
SEK M
C/I 0.46*
* Excluding provision for Russian VAT SEK 114 M in Q2 2006

9Swedbank Markets
0
100
200
300
400
500
600
Q3-04 Q4-04 Q1-05 Q2-05 Q3-05 Q4-05 Q1-06 Q2-06
Operating profit Profit for the period attributable to the shareholders
SEK M
Change in profit for the period attributableto the shareholders:Q1-Q2 51%Y05-Y06 73%

10
Net interest income
Net commissions
Net gains and losses on financial
items at fair value
0%
20%
40%
60%
80%
100%
Q1-05 Q2-05 Q3-05 Q4-05 Q1-06 Q2-06
Income increasingly diversified
Swedish Banking
Baltic Banking
Swedbank Markets
Asset Management
0%
10%
20%
30%
40%
50%
60%
70%
80%
90%
100%
Q1-05 Q2-05 Q3-05 Q4-05 Q1-06 Q2-06
* Excluding larger capital gains: EnterCard SEK 810 M; KIAB SEK 1,421 M
Income by Strategic Business Area* Income by category

11Group profit trend
SEK M
Profit for the period attributable to shareholders, excluding larger capital gains:* Excluding FIH SEK 1,200 M** Excluding EnterCard SEK 810 M*** Excluding KIAB SEK 1,421 M
*
*****
0
500
1,000
1,500
2,000
2,500
3,000
Q1-04 Q2-04 Q3-04 Q4-04 Q1-05 Q2-05 Q3-05 Q4-05 Q1-06 Q2-06

12
6.5
8.2
7.27.17.16.9 6.5 6.5
0
1
2
3
4
5
6
7
8
9
2000 2001 2002 2003 2004 2005 Q1-06 Q2-06
Group financial targets
21.320.1
17.915.8
13.4
11.0
20,2
16.6
24.6
20.5
15.9
11.2
0
5
10
15
20
25
30
2002 2003 2004 2005 Q1-06 Q2-06**Nordic peers* Swedbank
Average ROE of SEB, Nordea and SHB, as DnB NOR and Danske Bank have not reported their second quarter results yet
Return on equity compared to Nordic peers Primary capital ratio
0.00
0.10
0.20
0.30
0.40
0.50
0.60
0.70
0.80
Q3-01
Q4-01
Q1-02
Q2-02
Q3-02
Q4-02
Q1-03
Q2-03
Q3-03
Q4-03
Q1-04
Q2-04
Q3-04
Q4-04
Q1-05
Q2-05
Q3-05
Q4-05
Q1-06
Q2-06
C/I Ratio
• Return on equity
• Cost / Income ratio
• Primary capital ratio
Group Financial Objectives
*
**
Peer group consists of SEB, Nordea, SHB, DnB NOR and Danske Bank
% %

13
Group Financial Overview
Mikael Inglander,CFO and Head of Group Staffs

14
SEK M Q2 2006 Q1 2006 Change, %Net interest income 3,783 3,777 0Net commissions 2,353 2,098 12Net gains and losses on financialitems at fair value 1,032 260 Total income 7,578 6,543 16Expenses – 3,902 – 3,650 7*Loan losses 116 – 50 Operating profit 3,792 2,843 33Profit for the period attributable to shareholders 2,854 2,304 24Return on equity % 20.2 16.6Earnings per share SEK 5.40 4.41 Cost/Income ratio 0.51 0.56
Result highlights
*Adjusted for Russian VAT in both quarters, the increase was 5 percent or SEK 167 M

15
SEK M Swedish Baltic Other GroupBanking Banking
Lending volumes 142 152 2 296
Deposit volumes 18 8 3 29
Lending margins – 57 – 70 – 5 –132
Deposit margins 55 7 0 62
Other – 60 0 – 188 –248
Total 98 97 – 188 7
of which SEK – 181 M is change in elimination
Change in net interest incomeQ2 compared with Q1

16
Change in Eliminations
0
-27
41
0 -2
-250
-200
-150
-100
-50
0
50
100
150
200
250
Q2-05 Q3-05 Q4-05 Q1-06 Q2-06
Net interest incomeNet gains and losses on financial items at fair valueNet effect
SEK MSEK – 181 M change in
elimination Q2 /Q1

17
Change ChangeSEK M Q2 2006 Q1 2006 QoQ % Q2 2005 YoY %Payment 639 602 6 677 – 6Lending 189 129 47 83Brokerage 294 301 – 2 133Asset management 937 914 3 748 25Insurance 122 118 3 102 20Other 172 34 91
Total 2,353 2,098 12 1,834 28
Primarily corporate advisory fees in First Securities
Net commissions

18
-200
0
200
400
600
800
1,000
1,200
Q1 -05 Q2 -05 Q3-05 Q4-05 Q1-06 Q2-06
Net gains and losses on financial itemsat fair value
Swedbank Markets
Baltic Banking
Strategic shareholdingEliminationOther
SEK M
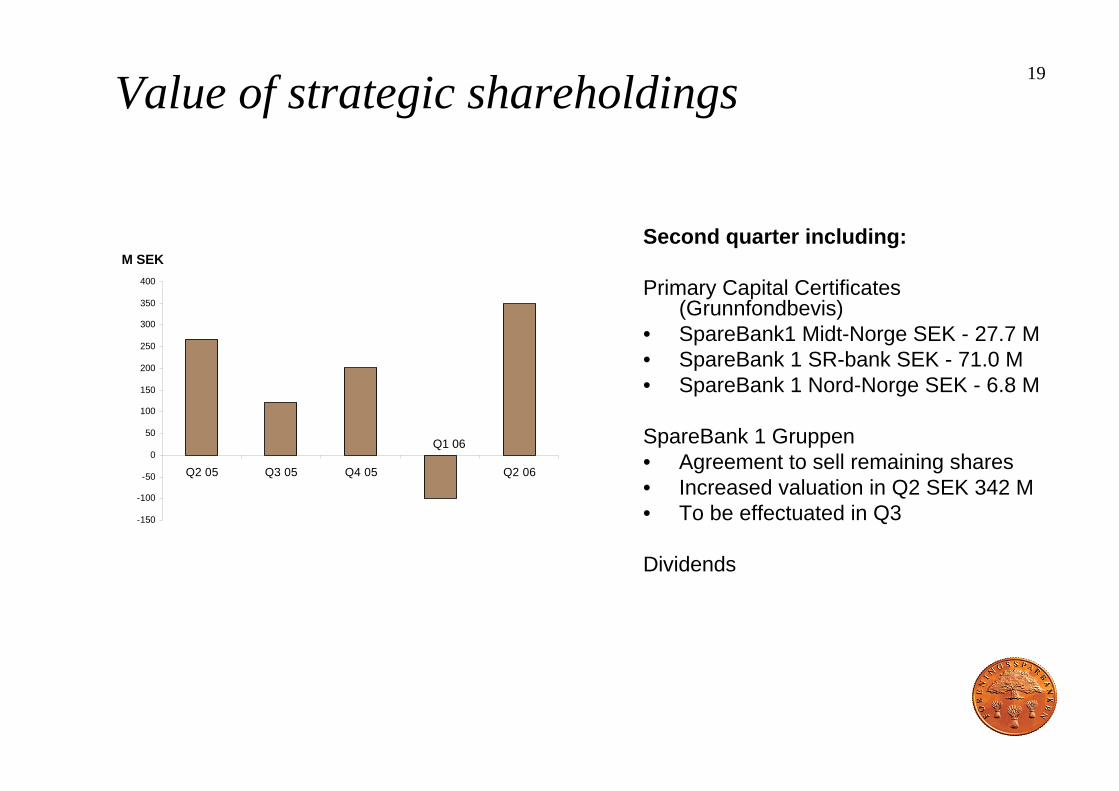
19Value of strategic shareholdings
Second quarter including:
Primary Capital Certificates (Grunnfondbevis)
• SpareBank1 Midt-Norge SEK - 27.7 M• SpareBank 1 SR-bank SEK - 71.0 M• SpareBank 1 Nord-Norge SEK - 6.8 M
SpareBank 1 Gruppen• Agreement to sell remaining shares • Increased valuation in Q2 SEK 342 M• To be effectuated in Q3
Dividends
-150
-100
-50
0
50
100
150
200
250
300
350
400
Q2 05 Q3 05 Q4 05 Q2 06
Q1 06
M SEK

20Expenses
120
68
84
3,902
3,650
1
-21
3 500
3 550
3 600
3 650
3 700
3 750
3 800
3 850
3 900
3 950
4 000
Q1 totalexpenses
Decreasedstaff cost
Increased prof itbased staff
costs
Increased othergeneral and
administrativeexpenses
IncreasedRussian VAT
provision
Increaseddepreciation
andamortization
Q2 totalexpenses
SEK 167 M5 % QoQ
SEK M

21Loan losses, Group
-150-100
-500
50100150200250300350400450500
Q1-02
Q2-02
Q3-02
Q4-02
Q1-03
Q2-03
Q3-03
Q4-03
Q1-04
Q2-04
Q3-04
Q4-04
Q1-05
Q2-05
Q3-05
Q4-05
Q1-06
Q2-06
Loan losses,SEK M
-0.10
-0.05
0.00
0.05
0.10
0.15
0.20
0.25
0.30
Loan loss level, Percent
Loan losses Loan loss level
22
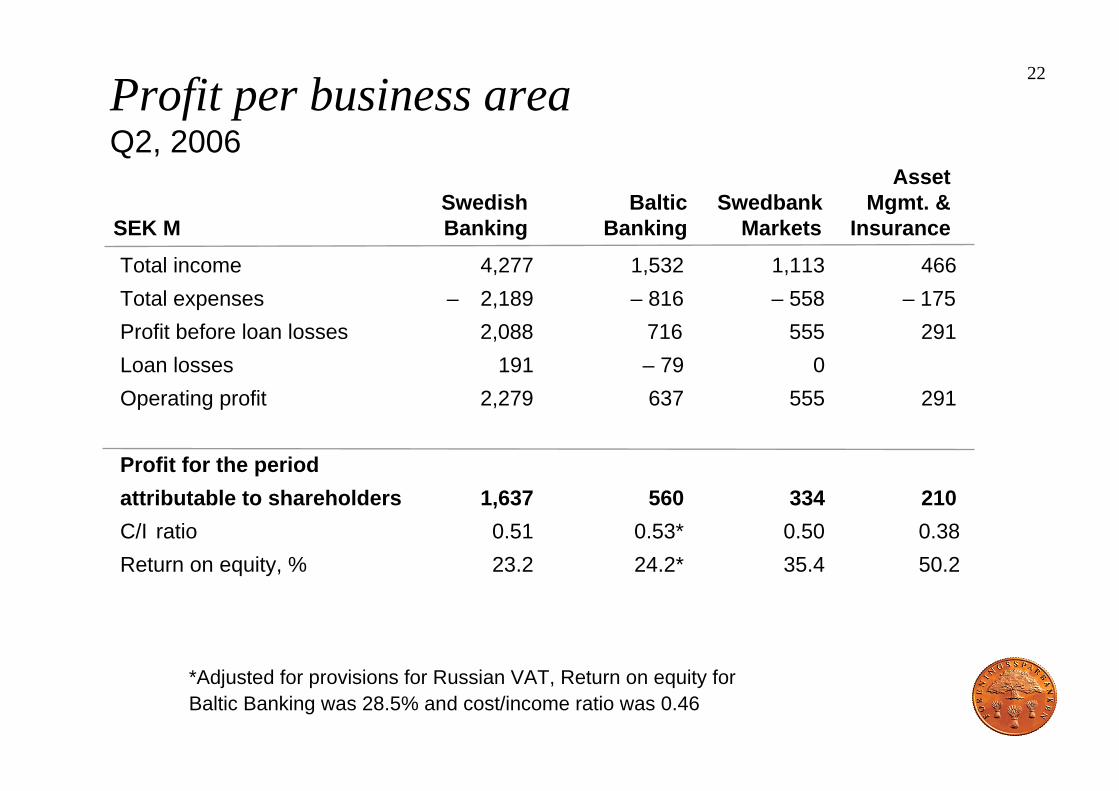
Total income 4,277 1,532 1,113 466Total expenses – 2,189 – 816 – 558 – 175Profit before loan losses 2,088 716 555 291 Loan losses 191 – 79 0Operating profit 2,279 637 555 291
Profit for the periodattributable to shareholders 1,637 560 334 210C/I ratio 0.51 0.53* 0.50 0.38Return on equity, % 23.2 24.2* 35.4 50.2
Profit per business areaQ2, 2006
AssetSwedish Baltic Swedbank Mgmt. &
SEK M Banking Banking Markets Insurance
*Adjusted for provisions for Russian VAT, Return on equity for Baltic Banking was 28.5% and cost/income ratio was 0.46

23
Q2 Highlights
• Profit for the period attributable to the shareholders increased by SEK 516 M or 23 percent to SEK 2,786 (2,270)
• Earnings per share, SEK increased by 22 percent to 5.40 (4.41)
• Return on equity increased to 20.2 percent (16.6)
• Cost / income ratio decreased to 0.51 (0.56)
• Primary capital ratio remained at 6.5
• Swedish Banking net interest income increased for the first time in 7 quarters
• Baltic Banking continued to grow (revenues increased by 13 percent) with maintained operating cost / income ratio at 0.46 (adjusted for provisions for Russian VAT)
• Swedbank Markets delivered its best quarterly result ever with profit for the period of SEK 334 M (221)
Figures in brackets refer to Q1 2006