Embed Size (px)
Citation preview

MNRAS 473, 1168–1185 (2018) doi:10.1093/mnras/stx1903Advance Access publication 2017 October 2
Galaxy And Mass Assembly (GAMA): The mechanisms for quiescentgalaxy formation at z < 1
K. Rowlands,1,2‹ V. Wild,1 N. Bourne,3 M. Bremer,4 S. Brough,5 S. P. Driver,16
A. M. Hopkins,5 M. S. Owers,5,7 S. Phillipps,4 K. Pimbblet,8,9 A. E. Sansom,10
L. Wang,11,12 M. Alpaslan,13 J. Bland-Hawthorn,14 M. Colless,15 B. W. Holwerda16,17
and E. N. Taylor18
Affiliations are listed at the end of the paper
Accepted 2017 July 25. Received 2017 July 20; in original form 2016 November 15
ABSTRACTOne key problem in astrophysics is understanding how and why galaxies switch off theirstar formation, building the quiescent population that we observe in the local Universe. Fromthe Galaxy And Mass Assembly and VIsible MultiObject Spectrograph Public ExtragalacticRedshift surveys, we use spectroscopic indices to select quiescent and candidate transitiongalaxies. We identify potentially rapidly transitioning post-starburst (PSB) galaxies and slowertransitioning green-valley galaxies. Over the last 8 Gyr, the quiescent population has grownmore slowly in number density at high masses (M∗ > 1011M� ) than at intermediate masses
(M∗ > 1010.6M� ). There is evolution in both the PSB and green-valley stellar mass functions,consistent with higher mass galaxies quenching at earlier cosmic times. At intermediate masses(M∗ > 1010.6M� ), we find a green-valley transition time-scale of 2.6 Gyr. Alternatively, atz ∼ 0.7, the entire growth rate could be explained by fast-quenching PSB galaxies, with avisibility time-scale of 0.5 Gyr. At lower redshift, the number density of PSBs is so low thatan unphysically short visibility window would be required for them to contribute significantlyto the quiescent population growth. The importance of the fast-quenching route may rapidlydiminish at z < 1. However, at high masses (M∗ > 1011M�), there is tension between thelarge number of candidate transition galaxies compared to the slow growth of the quiescentpopulation. This could be resolved if not all high-mass PSB and green-valley galaxies aretransitioning from star forming to quiescent, for example if they rejuvenate out of the quiescentpopulation following the accretion of gas and triggering of star formation, or if they fail tocompletely quench their star formation.
Key words: galaxies: evolution – galaxies: interactions – galaxies: luminosity function, massfunction – galaxies: starburst – galaxies: star formation – galaxies: statistics.
1 IN T RO D U C T I O N
The galaxy population displays a colour and morphological bi-modality (Strateva et al. 2001; Blanton et al. 2003; Baldryet al. 2004; Bell et al. 2004), which emerged at z < 2 (e.g. Arnoutset al. 2007; Brammer et al. 2011; Wuyts et al. 2011; Mortlocket al. 2013; Whitaker et al. 2015). Wide-area galaxy surveys haveshown that the stellar mass density of the star-forming populationhas been approximately constant over the last 8 Gyr (z < 1, e.g.Pozzetti et al. 2010; Ilbert et al. 2013; Moustakas et al. 2013; Muzzinet al. 2013). These recent studies have also charted the growth of
� E-mail: [email protected]
the quiescent population over cosmic time, although discrepanciesexist at z < 1 as to how quickly the quiescent population grows.Many studies found that the quiescent population doubled in massbetween 0 < z < 1 (Bell et al. 2004; Brown et al. 2007; Arnoutset al. 2007). Integrating over galaxies of all masses, Muzzin et al.(2013) found that the quiescent population grows in stellar massdensity from z = 1 to 0.3, but using the same survey data, Ilbertet al. (2013) found that the number density of quiescent galax-ies is flat from z = 1 to the present day. The growth rate of thequiescent population is likely to be mass dependent; Moustakaset al. (2013) concluded that the number density of quiescent galax-ies grows from z = 1 to now for low mass (M∗ < 1010.6M� ),but not for higher mass galaxies. For the quiescent population togrow, galaxies must transform from star forming to quiescent, as
C© 2017 The AuthorsPublished by Oxford University Press on behalf of the Royal Astronomical Society
Downloaded from https://academic.oup.com/mnras/article-abstract/473/1/1168/4315942by Swinburne Library useron 01 December 2017

The mechanisms for quiescent galaxy formation 1169
quiescent galaxies are no longer forming stars. Understanding theprocesses which quench star formation, and the time-scale overwhich this happens, is one of the major open questions in extra-galactic astronomy.
There is much debate about the dominant quenching mecha-nisms and transition time-scales for galaxies. There are two mainquenching channels suggested to halt star formation in galaxies: fastand slow, and while there is no agreement on exactly how fast orhow slow these channels are, they are generally linked to differentquenching processes (Faber et al. 2007; Fang et al. 2012, 2013;Barro et al. 2013; Yesuf et al. 2014). Star formation in galax-ies could quench slowly over many Gyr, where the gas may bestabilized against collapse (e.g. morphological quenching, Martiget al. 2009), or the supply is cut-off and galaxies gradually exhausttheir gas through star formation over a time-scale of a few Gyr. Forgalaxies to stop forming stars more rapidly requires the removalof large amounts of gas. Mergers could be responsible for trigger-ing a chain of events which lead to a more rapid shutdown of starformation in galaxies. Models have shown that the torques inducedduring a gas-rich major merger might funnel gas towards the galaxycentre, triggering an intense burst of star formation (e.g. Mihos &Hernquist 1994, 1996; Barnes & Hernquist 1996), capable of con-suming a significant portion of a galaxy’s gas supply. The gas is thenrapidly depleted, and may additionally be prevented from formingstars via feedback mechanisms (e.g. Benson et al. 2003; Di Matteo,Springel & Hernquist 2005) from stellar or active galactic nucleus(AGN)-driven winds (e.g. Springel, Di Matteo & Hernquist 2005;Hopkins et al. 2007; Khalatyan et al. 2008; Kaviraj et al. 2011).Other environment-dependent mechanisms such as ram-pressurestripping (Gunn & Gott 1972; McCarthy et al. 2008) may alsoremove the gas reservoir on short-intermediate time-scales.
Observational results on quenching time-scales and mechanismsvary substantially. The dearth of galaxies in the region interme-diate between the star-forming and quiescent populations in theoptical/ultraviolet (UV) colour–magnitude diagram has often beenused to argue that galaxies transition rapidly from star forming toquiescent (e.g. Martin et al. 2007; Kaviraj et al. 2007). Using broad-band colours, Schawinski et al. (2014) concluded that disc galaxiesquench slowly over many Gyr via gentle, secular processes withlittle morphological change, whereas spheroidal galaxies undergofaster, more violent quenching which also transforms their morphol-ogy. By fitting chemical evolution models to the difference in stel-lar metallicity between star-forming and quiescent galaxies, Peng,Maiolino & Cochrane (2015) found that M∗ < 1011M� galaxies inthe local Universe are quenched over a time-scale of 4 Gyr, whichsuggests strangulation is the dominant mechanism, whereby halogas is removed as a galaxy falls into a group/cluster. Wetzel et al.(2013) found that satellite galaxies continue to form stars for 2–4 Gyr before quenching rapidly in <0.8 Gyr, again leading them tosuggest that gas exhaustion (i.e. strangulation) of the gas reservoir isthe primary quenching mechanism. Haines et al. (2013) concludedthat cluster galaxies are quenched upon infall on time-scales of0.7–2.0 Gyr, and that slow quenching is suggestive of ram-pressurestripping or starvation mechanisms. The observed decrease in thefraction of star-forming galaxies with increasing environmental den-sity and the independence of star formation rate (SFR) and envi-ronment (Wijesinghe et al. 2012; Robotham et al. 2013) suggeststhat galaxy transformation due to environmental processes must berapid or have happened long ago (Brough et al. 2013). Cosmolog-ical simulations are also starting to provide constraints: Trayfordet al. (2016) found in the Evolution and Assembly of GaLaxiesand their Environments (EAGLE) simulation that the majority of
green-valley galaxies transition over a <2 Gyr time-scale. In reality,there is likely to be a diversity in quenching time-scales for galaxieseven in the local Universe (Smethurst et al. 2015), see also McGee,Bower & Balogh (2014) for a compilation of quenching time-scaleestimates.
It is clear that the relative importance of the fast and slow quench-ing channels are not well known, and may change over cosmic time,with stellar mass, and environment (Peng et al. 2010; Wijesingheet al. 2012; Crossett et al. 2017; Hahn, Tinker & Wetzel 2016).Such variation may help to explain the diversity of observationalresults, however, observational methods for identifying quenchedand transition galaxies may also be partly responsible. Previousstudies have largely relied on broad-band photometric data, withany available spectroscopic data only used to provide a redshift tohelp with the correction of observed frame colours and environmentestimates. Good quality spectroscopic data of galaxy continua con-tain a wealth of information on the star formation history (SFH) ofgalaxies, and are arguably better suited to cleanly identifying bothfully quenched and transitioning galaxies. In this paper, we fully ex-ploit the spectroscopic data from the Galaxy And Mass Assembly(GAMA) survey and VIMOS Public Extragalactic Redshift Survey(VIPERS) to robustly identify fully quenched and candidate fast-and slow-quenching galaxies.
To study galaxies undergoing fast quenching, we need galaxieswhere we have a good constraint on their recent SFH. Post-starburst(PSB) galaxies, where a galaxy has recently undergone a starburstfollowed by quenching in the last 1 Gyr, are ideal for studying fastquenching. PSB galaxies are sufficiently common at z ∼ 1–2 thatthey may contribute significantly to the growth of the red sequenceat this important epoch (Wild et al. 2016). It is not well known howmuch PSBs contribute to the build-up of the quiescent populationat z < 1, due to small number statistics in previous redshift sur-veys (Blake et al. 2004; Wild et al. 2009; Vergani et al. 2010), andaperture bias in spectroscopic surveys at very low redshifts (Broughet al. 2013; Iglesias-Paramo et al. 2013; Richards et al. 2016). Fur-thermore, studies of the evolution of the quiescent and green-valleypopulations have commonly been done using broad-band photome-try. In such studies, the sample selection and physical properties canbe affected by dust, and there is a larger uncertainty on parameterssuch as stellar population age, stellar mass and photometric red-shift compared to spectroscopic studies. Using spectra allows us tocleanly classify galaxies according to their likely quenching time-scales. By identifying large numbers of PSB and green-valley galax-ies in large spectroscopic surveys, we can identify which quenchingchannels are important for building the quiescent population at lowredshift.
In this paper, we investigate the mass functions and numberdensity evolution of candidate transition and quenched galaxies at0 < z < 1. This allows us to investigate whether the quiescent galaxypopulation is growing at z < 1, and what galaxies are responsiblefor any growth. We adopt a cosmology with �m = 0.30, �� = 0.70and Ho = 70 km s−1 Mpc−1.
2 DATA
Due to the rarity of PSBs in the local Universe, large-area spectro-scopic surveys are required to identify them. Our study necessitatesspectra so we can robustly identify quiescent and transition galax-ies, a high spectroscopic completeness and a good understandingof the survey selection function. These requirements are met bythe GAMA and VIPERS surveys. The GAMA survey allows usto span the range 0.05 < z < 0.35, above which only the most
MNRAS 473, 1168–1185 (2018)Downloaded from https://academic.oup.com/mnras/article-abstract/473/1/1168/4315942by Swinburne Library useron 01 December 2017

1170 K. Rowlands et al.
massive galaxies have adequate signal-to-noise (S/N) spectra. TheVIPERS data allow us to extend our study to higher redshift from0.5 < z < 1. Together these surveys give a total time span of 6.5 Gyr(0.05 < z < 1.0) to study galaxy evolution.
2.1 GAMA
The GAMA survey (Driver et al. 2011; Liske et al. 2015) is a mul-tiwavelength photometric and redshift data base, covering 230 deg2
in three equatorial fields at ∼9, 12 and 14.5 h (G09, G12 and G15),and two southern regions (G02 and G23). The GAMA data baseprovides r-band defined matched aperture photometry from theUV–far-infrared (FIR) as described in Hill et al. (2011), Driveret al. (2016) and Wright et al. (2016). In this work, we use theequatorial regions as they are the most spectroscopically completeto r = 19.8 mag, which cover 180 deg2.
Spectra are obtained for ∼250 000 galaxies with a magnitudelimit of rAB < 19.8 mag mostly using the AAOmega spectrograph(Saunders et al. 2004; Sharp et al. 2006) at the Anglo AustralianTelescope. The AAOmega spectra (Hopkins et al. 2013) have awavelength range of 3750–8850 Å and a resolution of R ∼ 1100 at∼4000 Å. Additional spectra are included from the Sloan DigitalSky Survey (SDSS, York et al. 2000), which have a wavelengthrange of 3700–9200 Å and a resolution of R ∼ 1600 at ∼4000 Å.The physical scale covered by the 2 arcsec AAOmega fibres rangefrom 2.0 kpc at z = 0.05 to 9.9 kpc at z = 0.35. The 3 arcsec SDSSfibres cover 2.9 kpc at z = 0.05 and 14.8 kpc at z = 0.35. We discussthe effects of aperture bias in Section 2.8, but we note that it isminimized by excluding galaxies at z < 0.05. We do not includeGAMA spectra from surveys such as 6dF Galaxy Survey (6dFGS)which are not flux calibrated (Hopkins et al. 2013).
We include all GAMA II main survey galaxies which havescience quality redshifts (nQ > 2), 10.0 < rPetro < 19.8 magand 9.9 < log10(M∗) < 12 totalling 111 477 spectra from0.05 < z < 0.35. These include 97 872 GAMA spectra and 13 605SDSS spectra. From this sample, we then excluded 1761 problem-atic spectra which show, e.g. fibre fringing (identified by eye andthrough GAMA redshift catalogue flags) and 331 galaxies hostingbroad-line AGN from Gordon et al. (2017) and Schneider et al.(2007), which prevents us from robustly measuring spectral fea-tures.
In this work, we calculate stellar masses using photometry fromthe GAMA LAMBDAR Data Release (Driver et al. 2016; Wrightet al. 2017). The catalogue comprises deblended matched aperturephotometry in 21 bands from the observed frame FUV–FIR, withmeasurements accounting for differences in pixel scale and pointspread function in each band. We utilize the UV FUV and NUVGALEX data, optical ugri magnitudes from SDSS DR6 imaging(Adelman-McCarthy et al. 2008) and near-infrared (NIR) ZYJHKphotometry from the Visible and Infrared Telescope for Astronomy(VISTA, Sutherland et al. 2015), as part of the VIsta Kilo-degreeINfrared Galaxy survey (VIKING). All photometry has been galac-tic extinction corrected using the values of E(B − V) derived usingthe Schlegel, Finkbeiner & Davis (1998) Galactic extinction mapsfor a total-to-selective extinction ratio of RV = 3.1. For all fluxes,we convolve the catalogue error in quadrature with a calibration er-ror of 10 per cent of the flux to allow for differences in the methodsused to measure total photometry and errors in the spectral synthesismodels used to fit the underlying stellar populations.
The GAMA and SDSS spectra were taken at a much higher spec-tral resolution (R ∼ 1100 and 1600, respectively) than the VIPERSspectra (R ∼ 210). To perform a consistent analysis, we convolvethe GAMA/SDSS spectra to the same spectral resolution as the
VIPERS spectra using a Gaussian convolution kernel. During theconvolution, we linearly interpolate over bad pixels. In practice, thismakes little difference to the galaxy spectra, but does allow us toinclude more spectra in our analysis which would have importantspectral features masked out if we simply propagated the bad pixelsin the convolution. We measure the new errors for each convolvedspectrum by scaling the unconvolved error array to the standard de-viation of the flux in line-free regions of the convolved spectrum at4200–4300 Å, to account for covariance between smoothed spectralpixels.
From the GAMA sample, we select galaxies to be at z > 0.05so that the higher order Balmer lines (Hδ, Hε, etc.) are redshiftedinto a more sensitive portion of the AAOmega spectrograph, andaway from regions at shorter wavelengths where poor flat fieldingcan affect the spectra. Additionally, at z > 0.05, the fibre samplesa substantial fraction of the galaxy light (10–30 per cent of the Pet-rosian radius) and so minimizes aperture effects (see Section 2.8and Kewley, Jansen & Geller 2005). The upper redshift limit isset to z = 0.35 as above this the mass completeness limit exceedsM∗ > 1011 in some spectral classes, leaving us with few galaxiesto study. Note that the 3750–4150 Å region (used for spectral clas-sification, see Section 2.3) is required to always be in the observedspectral range.
2.2 VIPERS
The VIPERS Public Data Release 11 (PDR1) provides 61 221 spec-tra for galaxies with 17.5 < iAB < 22.5 mag. The PDR1 covers10.315 deg2 (after accounting for the photometric and spectroscopicmasks) in the Canada–France–Hawaii Telescope Legacy SurveyWide (CFHTLS-Wide) W1 and W4 fields. A colour selection using(g − r) and (r − i) cuts was used to primarily select galaxies in therange 0.5 < z < 1.3. Spectra were observed using the VIsible Mul-tiObject Spectrograph (VIMOS) spectrograph on the Very LargeTelescope (VLT) with the LR-grism, yielding a spectral resolutionof R ∼ 210 (at ∼6000 Å) with wavelength coverage from 5500–9500 Å. Further details of the survey data are given in Guzzo et al.(2014) and Garilli et al. (2014). The VIPERS survey used a slit with1 arcsec width, but with considerably longer length. The majorityof each galaxy should be in each slit and any aperture bias betweenthe GAMA and VIPERS samples should be negligible, except atthe lowest redshifts in the GAMA sample.
To calculate stellar masses (see Section 2.4), we use total broad-band photometry in the FUV, NUV, u�, g′, r′, i′, z′ and Ks bandsmeasured using SEXTRACTOR MAG_AUTO as described in Moutardet al. (2016) . All photometry has been galactic extinction correctedusing E(B − V) values of 0.025 in the W1 field and 0.05 in theW4 field (Fritz et al. 2014), derived using the Schlegel et al. (1998)Galactic extinction maps for a total-to-selective extinction ratio ofRV = 3.1. Wide-field InfraRed Camera Ks band data are availablefor 91.5 per cent galaxies. We checked that the lack of NIR datafor some galaxies does not significantly affect our stellar mass esti-mates. For all fluxes, we convolve the catalogue error in quadraturewith a calibration error of 10 per cent of the flux to allow for differ-ences in the methods used to measure total photometry and errorsin the spectral synthesis models used to fit the underlying stellarpopulations.
We use galaxies with 0.5 < z < 1.0, 9.9 < log10(M∗) < 12, andwhich have secure spectroscopic redshifts with flags 2.0 ≤ zflg ≤ 9.5(corresponding to a 95 per cent confidence limit on the redshift) and
1 http://vipers.inaf.it/
MNRAS 473, 1168–1185 (2018)Downloaded from https://academic.oup.com/mnras/article-abstract/473/1/1168/4315942by Swinburne Library useron 01 December 2017

The mechanisms for quiescent galaxy formation 1171
Figure 1. The distribution of the 4000 Å break strength (PC1) and excess Balmer absorption (PC2) as measured by a PCA of the 4000 Å spectral region of theGAMA and VIPERS galaxies, in the seven different redshift bins used in this work. The grey scale indicates the logarithmic number of objects. The coloureddots are random samples of galaxies which occupy each spectral class delineated by dashed lines: quiescent (red), star forming (blue), green valley (green) andPSB (purple); these are discussed in detail in Section 2.3. Contours show 10, 30, 50, 70 and 90 per cent of the maximum number of galaxies in the sample.
which are inside the photometric mask. 616 galaxies with broad-line AGN (agnFlag = 1 or 10 < zflg < 20) were excluded from ouranalysis. We restrict the upper redshift limit of the VIPERS surveyto z = 1.0, as above this redshift we are only mass complete to themost massive galaxies (M∗ > 1011.5) which are not the main subjectof this study. Our final sample comprises 29 734 galaxies on whichto perform spectroscopic classification.
2.3 Spectroscopic sample classification
In the integrated optical fibre spectrum of a galaxy, the signaturesof stars of different ages can be used to obtain information abouta galaxy’s recent SFH. To define our sample, we make use of twoparticular features of optical spectra: the 4000 Å break strength andBalmer absorption line strength. Following the method outlined inWild et al. (2007, 2009), we define two spectral indices which arebased on a principal component analysis (PCA) of the 3750–4150Å region of the spectra. PC1 is the strength of the 4000 Å break(equivalent to the Dn4000 index), and PC2 is excess Balmer ab-sorption (of all Balmer lines simultaneously) over that expected forthe 4000 Å break strength. The eigenbasis that defines the principalcomponents is taken from Wild et al. (2009), and was built usingobserved VIMOS-VLT Deep Survey (VVDS) spectra.
To calculate the principal component amplitudes for each spec-trum, we correct for Galactic extinction using the Cardelli, Clayton& Mathis (1989) extinction law, shift to rest-frame wavelengths andinterpolate the spectra on to a common wavelength grid. We thenproject each spectrum on to the eigenbasis using the ‘gappy-PCA’procedure of Connolly & Szalay (1999) to account for possiblegaps in the spectra. Pixels are weighted by their errors during theprojection, and gaps in the spectra due to bad pixels are given zeroweight. The normalization of the spectra is also free to vary in theprojection using the method introduced by Wild et al. (2007).
In Fig. 1, we show the distribution of the two spectral indices forgalaxies in the GAMA and VIPERS surveys which have S/N per6 Å pixel >6.5 at ∼4000 Å. This choice of S/N cut allows us toreliably measure spectral indices from low-resolution spectra (Wild
et al. 2009). Our sample comprises 70 668 and 21 519 galaxies fromGAMA and VIPERS, respectively.
In Fig. 1, we divide our sample into four spectral classes based ontheir values of PC1 and PC2. The boundaries between the spectralclasses are red: PC1>0.9, green: <0.4 <PC1<0.9, star forming:PC1<0.4 and PSB: PC2>0.6. Classification is not influenced inany way by commonly used star formation indicators such as [O II]and Hα fluxes. After a starburst, the Balmer absorption lines in-crease in strength as the galaxy passes into the PSB phase (Dressler& Gunn 1983; Couch & Sharples 1987) i.e. A/F star light domi-nates the integrated galaxy spectrum. These objects with strongerBalmer absorption lines compared to their expected 4000 Å breakstrength lie to the top of each panel in Fig. 1. The boundaries forthe PSB class are defined to select the population outliers with highPC2. At low redshift, there are very few PSBs in each of the fourredshift bins in the GAMA survey, so we collapse all of the PSBsinto one large redshift bin from 0.05 < z < 0.26 so that we havesufficient number statistics for our analysis (see Fig. A1). We cannotextend the PSB sample to the highest redshift range of the GAMAsample as our mass completeness drops below our 90 per cent limit(see Section 2.6) for M∗>1010.6M� . We visually inspected all ofthe candidate PSB spectra above our S/N limit. As shown in Ap-pendix A, we found that ∼2/3 of GAMA galaxies with PC2>0.6are contaminants caused by problems with unmasked noise spikes,or exhibited an extreme fall-off in flux to the blue (this could be dueto poor tracing of the fibre flux on the CCD when the S/N is low).Furthermore, some spectra in the PSB region were removed if wecould not positively identify a Balmer series. We note that if wedid not remove the visually identified contaminants from the PSBsample our conclusions would be unchanged, even if the PSBs aretwice as numerous at low redshift.
One concern is that, as we exclude broad-line AGN from oursamples and PSBs are found to contain a higher fraction of narrow-line AGN than other galaxies (Yan et al. 2006; Wild et al. 2007),we may be systematically missing PSBs from our samples. How-ever, a typical AGN lifetime is two orders of magnitude shorterthan the time during which PSB features are visible (e.g. Martini &
MNRAS 473, 1168–1185 (2018)Downloaded from https://academic.oup.com/mnras/article-abstract/473/1/1168/4315942by Swinburne Library useron 01 December 2017

1172 K. Rowlands et al.
Figure 2. Stacked spectra in each spectral class with 10.6 < log10(M∗) < 11. We stack galaxies in a fixed mass range so that we can be sure we are comparingsimilar galaxies in each survey. Black lines show the stacked VIPERS spectra with 0.5 < z < 0.6, blue lines show the stacked GAMA/SDSS spectra with0.05 < z < 0.35 convolved to the same resolution as the VIPERS spectra. Note that the PSBs are selected to be at 0.05 < z < 0.26. The stacked spectra arenormalized to the same value at 4000 Å to aid comparison of the two samples. Dotted vertical lines indicate the rest-frame vacuum wavelengths of emissionand absorption lines labelled at the top of each panel.
Weinberg 2001), thus even if all PSBs undergo a powerful un-obscured AGN phase (which we consider unlikely at the redshiftsstudied in this paper), we will only miss a small fraction of galaxies.
Galaxies which show no evidence of recent or current star for-mation comprise the quiescent population which lies on the rightin each panel of Fig. 1, as they have a strong 4000 Å break. Galax-ies that are forming stars lie in the centre and left of each panel.These galaxies have younger mean stellar ages and therefore weaker4000 Å breaks. Galaxies in the sparsely populated region betweenthe star-forming and quiescent populations are defined as greenvalley (akin to that of the green valley in NUV/optical colour–magnitude diagrams). These spectroscopic green-valley galaxies donot show characteristic deep Balmer absorption lines, which indi-cate a slower transition for these galaxies compared to PSB galaxies.We make fixed cuts in PC1 and PC2 to separate our spectral classes,and we do not evolve these with redshift. This is because we want toselect candidate transition populations between defined limits (i.e.fixed age) to test whether galaxies are changing from star formingto quiescent through these transition populations.
The boundaries between the spectral classes are somewhat ar-bitrary, but the broad-band colours of spectroscopically selectedgalaxies lie in the expected regions of the g − r colour–magnitudediagram (see Figs B1 and B2). Stacking spectra in each class withsimilar stellar masses shows that on average the galaxies show theexpected characteristic features, see Fig. 2. Star-forming galaxiesshow strong emission lines, a weak 4000 Å break and blue con-tinua. The stacked quiescent galaxies show strong 4000 Å breaksand no emission lines. Green-valley galaxies show spectra inter-mediate between those of star-forming and quiescent galaxies withmoderately strong 4000 Å breaks and weak emission lines. PSBshave strong Balmer absorption lines and moderately strong 4000 Åbreaks. Our stacked PSB spectra show a strong [O II] emission line;we measure equivalent widths (EWs) of −10.8 and −10.1 Å forthe stacked GAMA and VIPERS spectra, respectively. Note thatour selection method makes no cuts on emission line strength, as isoften done in the selection of PSBs (Goto 2005, 2007). If we wereto use the Goto (2007) cut of [O II] EW>−2.5 Å, the average PSBin our sample would be excluded. It is important not to exclude
MNRAS 473, 1168–1185 (2018)Downloaded from https://academic.oup.com/mnras/article-abstract/473/1/1168/4315942by Swinburne Library useron 01 December 2017

The mechanisms for quiescent galaxy formation 1173
galaxies with emission lines, as narrow line AGN are common inPSB samples (Wild et al. 2007; Yan et al. 2006, 2009), and shockscan excite emission lines in PSBs (Alatalo et al. 2016a). We deferexamination of the ionizing sources in PSBs to a future paper.
The stacked spectra in each spectral class look very similar inthe 4000 Å break region for both the GAMA/SDSS and VIPERSsamples. The similarity is quantified by the values of PC1 and PC2of the stacked spectra for the GAMA and VIPERS samples in Fig. 2.This shows that our PCA method is successful at selecting similargalaxies in each sample, despite differences in redshift and the initialspectral resolution. We observe a slightly weaker 4000 Å break andstronger Balmer absorption lines in the stacked VIPERS spectra,indicating that on average the higher redshift galaxies are younger.This is most pronounced in the stacked star-forming spectra, wherea significantly stronger [O II] line is visible in the VIPERS spectracompared to GAMA spectra consistent with the expected increasein the specific SFR of galaxies with redshift.
2.4 Stellar masses
Stellar masses were calculated for each galaxy using a Bayesiananalysis which accounts for the degeneracy between physical pa-rameters. Specifically, we fit a library of tens of thousands (de-pending on the redshift) of Bruzual & Charlot (2003) populationsynthesis models to the FUV − K broad-band photometry, to obtaina probability density function (PDF) for each physical property.The model libraries have a wide range of SFHs, two-componentdust contents (Charlot & Fall 2000) and metallicities from 0.5–2 Z� . The assumed model SFHs assume a Chabrier (2003) initialmass function (IMF) and are exponentially declining with super-imposed random starbursts with priors as described in Kauffmannet al. (2003). We use the median of the PDF to estimate the stellarmass and the 16th and 84th percentiles to estimate the associateduncertainty. We calculate our own stellar masses instead of usingthose of Taylor (2011) for consistency with the VIPERS stellarmasses. When comparing our stellar mass estimates with those ofTaylor (2011) we see an offset which changes with redshift; thereis a 0.1 dex offset at z = 0.05 and −0.05 dex offset at z = 0.35.This is likely due to differences in the dust models and SFHs usedin the spectral energy distribution (SED) fitting (see Wright et al.(2017) who saw similar offsets between the Taylor (2011) and theirstellar masses as a function of redshift). We find good agreementbetween our stellar masses and those derived using the MAGPHYS
code in Wright et al. (2017), with only a small 0.05 dex offset atz = 0.35. This offset is likely because Wright et al. (2017) use ob-served frame FUV − 500µm data to estimate the stellar masses andwe only use FUV − K magnitudes. As galaxies are dustier at highredshift, this can cause a slight shift in the stellar masses. We alsocompare our stellar masses to those in the MPA-JHU catalogue2
which are calculated using fits to the SDSS DR7 ugriz photometry.There is a systematic offset of 0.1 dex as a result of using differentstellar population models but we do not see any trend with red-shift. Performing our analysis using the Taylor (2011) stellar massmeasurements does not change our conclusions. In Appendix C, wecompare our mass functions to those in the literature and generallyfind excellent agreement for both the GAMA and VIPERS samples.
2 http://wwwmpa.mpa-garching.mpg.de/SDSS/DR7/
2.5 Incompleteness corrections
We correct our number densities and mass functions for volumeeffects using the standard Vmax method (Schmidt 1968), whichweights the volume, V (the volume out to the redshift of eachgalaxy) by 1/Vmax , which is the maximum volume over which agalaxy is visible in a magnitude limited survey or the upper redshiftlimit of a given redshift bin. It is important to account for the varietyof SED shapes in a sample (Ilbert et al. 2004), as galaxies with aparticular SED shape are visible out to different distances. We dothis by using the best-fitting SED model found when calculatingthe stellar masses. We scale the best-fitting model to the observedgalaxy brightness and then shift it in redshift to determine the max-imum distance out to which the galaxy could be seen, given thesurvey magnitude limits.
As we only select spectra which have a high enough S/N toreliably compute spectral indices, we must correct for the fractionof missing galaxies before calculating number densities. FollowingWild et al. (2009), we define the quality sampling rate (QSR) asthe fraction of galaxies above the S/N threshold of 6.5, relative tothe total number of galaxies in each stellar mass bin. We computethe weight wQSR
i in stellar mass bins of width 0.1 dex and redshiftbins with widths of δz = 0.05–0.09 for the GAMA survey, andδz = 0.15–0.2 for the VIPERS data. We also multiply the QSRcorrection by a factor to account for the fraction of spectra which donot have a PCA measurement due to e.g. failure of the projection dueto having >20 per cent bad pixels, which is <1 per cent of the totalsample. The number of spectra that are missing due to fibre fringing,low-quality redshifts (nQ < 3) or highly uncertain PCA results is13–33 per cent, depending on the redshift bin, and we account forthis loss in our weighting scheme. We additionally account for the5 per cent of spectra excluded from our sample which are not SDSSor GAMA spectra.
In VIPERS, only ∼40 per cent of the targets meeting the selec-tion criteria in a given field were observed. We apply a statisticalweight wTSR
i as detailed in Guzzo et al. (2014) to correct for thefraction of photometric objects which were not targeted (the targetsampling rate, TSR). In GAMA, the spectroscopic completenessis 98 per cent. To correct for the missing spectra we use a TSRcorrection of 0.98. The ability to securely measure a spectroscopicredshift is a function of the observing conditions, and the bright-ness of the target. We correct for the fraction of targeted galaxieswithout secure redshifts (the spectroscopic sampling rate, SSR),and perform a completeness correction due to the colour selection(the colour sampling rate, CSR). Details of the SSR and CSR aregiven in Guzzo et al. (2014) and Garilli et al. (2014). The GAMAsample has no colour selection criteria, so there are no SSR or CSRcorrections to the low-redshift sample.
The weight given to each galaxy (wi) is
1
Vmax × wSSRi × wTSR
i × wCSRi × w
QSRi
. (1)
In Appendix C, we show that our corrections account for allsources of incompleteness as they allow us to recover total stellarmass functions which are consistent with published studies.
2.6 Mass completeness limits
The 90 per cent mass completeness limits were calculated in eachredshift bin and separately for each spectral class following Pozzettiet al. (2010). It is important to do this separately for each spectralclass, as our star-forming galaxy sample is complete to lower stellar
MNRAS 473, 1168–1185 (2018)Downloaded from https://academic.oup.com/mnras/article-abstract/473/1/1168/4315942by Swinburne Library useron 01 December 2017

1174 K. Rowlands et al.
Table 1. The single Schechter function fit parameters fitted to the total, PSB, red, green-valley and star-forming mass functions in each redshift bin. Thethird column shows the total number of galaxies in each class in the redshift bin. The fourth column shows the 90 per cent mass completeness limit inlog10(M∗/M� ) for each bin and spectroscopic class. The fifth column shows the number of galaxies in each class in the redshift bin above the masscompleteness limit. Uncertainties on each parameter account for the formal fitting errors on the Schechter function, uncertainty on the stellar masses, andcosmic variance. For the green-valley galaxies in the highest redshift bin, and the PSBs in the lowest and highest redshift bins we fix α to −1.0 because thereare not enough points to adequately constrain the faint end slope.
Class Redshift Number Completeness limit Number (φ�/Mpc−3) log10(M∗/M� ) α
Total 0.05 < z < 0.14 13 696 10.02 12303 3.87 ± 0.40 × 10⁻³ 10.80 ± 0.04 − 0.76 ± 0.10Total 0.14 < z < 0.21 22 321 10.36 14756 2.61 ± 0.32 × 10⁻³ 10.93 ± 0.04 − 1.02 ± 0.11Total 0.21 < z < 0.26 13 805 10.59 8110 1.82 ± 0.30 × 10⁻³ 10.97 ± 0.05 − 1.12 ± 0.17Total 0.26 < z < 0.35 20 846 10.87 9946 1.71 ± 0.22 × 10⁻³ 11.02 ± 0.05 − 1.07 ± 0.23Total 0.50 < z < 0.65 14 091 10.33 5988 3.23 ± 0.22 × 10⁻³ 10.77 ± 0.04 − 0.48 ± 0.14Total 0.65 < z < 0.80 13 962 10.60 5037 3.12 ± 0.17 × 10⁻³ 10.78 ± 0.05 − 0.38 ± 0.26Total 0.80 < z < 1.00 10 125 10.87 2688 2.18 ± 0.24 × 10⁻³ 10.86 ± 0.09 − 0.73 ± 0.50
PSB 0.05 < z < 0.26 172 10.57 33 7.62 ± 16.61 × 10⁻⁵ 10.23 ± 0.27 − 1.00 ± 0.00PSB 0.50 < z < 0.65 180 10.45 73 5.04 ± 6.88 × 10⁻⁵ 10.81 ± 0.53 − 0.99 ± 1.50PSB 0.65 < z < 0.80 332 10.46 171 1.52 ± 0.31 × 10⁻⁴ 10.58 ± 0.23 − 0.37 ± 1.07PSB 0.80 < z < 1.00 362 10.81 121 1.32 ± 0.68 × 10⁻⁴ 10.86 ± 0.11 − 1.00 ± 0.00
Quiescent 0.05 < z < 0.14 6936 10.00 6750 3.02 ± 0.12 × 10⁻³ 10.65 ± 0.03 0.16 ± 0.09Quiescent 0.14 < z < 0.21 9655 10.39 8383 2.14 ± 0.10 × 10⁻³ 10.80 ± 0.03 − 0.20 ± 0.12Quiescent 0.21 < z < 0.26 5457 10.64 4365 1.37 ± 0.09 × 10⁻³ 10.87 ± 0.05 − 0.39 ± 0.24Quiescent 0.26 < z < 0.35 8921 10.94 5823 1.18 ± 0.13 × 10⁻³ 10.90 ± 0.06 − 0.15 ± 0.36Quiescent 0.50 < z < 0.65 2829 10.36 2648 1.64 ± 0.08 × 10⁻³ 10.68 ± 0.04 0.34 ± 0.17Quiescent 0.65 < z < 0.80 2493 10.62 2160 1.33 ± 0.14 × 10⁻³ 10.73 ± 0.05 0.32 ± 0.30Quiescent 0.80 < z < 1.00 1192 11.01 712 0.81 ± 0.77 × 10⁻³ 11.10 ± 0.25 − 1.79 ± 1.08
Green 0.05 < z < 0.14 2066 9.99 1926 1.04 ± 0.06 × 10⁻³ 10.33 ± 0.06 0.21 ± 0.26Green 0.14 < z < 0.21 3351 10.38 2302 0.90 ± 0.19 × 10⁻⁴ 10.42 ± 0.08 0.16 ± 0.53Green 0.21 < z < 0.26 2005 10.60 1209 0.66 ± 0.12 × 10⁻⁴ 10.57 ± 0.11 − 0.24 ± 0.70Green 0.26 < z < 0.35 3039 10.89 1334 0.68 ± 0.24 × 10⁻⁴ 10.70 ± 0.19 − 0.65 ± 1.39Green 0.50 < z < 0.65 960 10.36 792 6.64 ± 0.57 × 10⁻⁴ 10.63 ± 0.10 − 0.24 ± 0.46Green 0.65 < z < 0.80 868 10.68 589 4.54 ± 2.99 × 10⁻⁴ 10.58 ± 0.15 0.51 ± 1.11Green 0.80 < z < 1.00 476 10.95 251 6.35 ± 3.66 × 10⁻⁴ 10.80 ± 0.09 − 1.00 ± 0.00
SF 0.05 < z < 0.14 4661 10.10 3060 2.33 ± 0.35 × 10⁻³ 10.35 ± 0.07 − 0.75 ± 0.28SF 0.14 < z < 0.21 9145 10.34 3999 1.57 ± 0.41 × 10⁻³ 10.57 ± 0.09 − 1.26 ± 0.34SF 0.21 < z < 0.26 6243 10.54 2440 1.23 ± 0.48 × 10⁻³ 10.68 ± 0.12 − 1.48 ± 0.52SF 0.26 < z < 0.35 8712 10.80 2466 1.28 ± 0.52 × 10⁻³ 10.73 ± 0.15 − 1.51 ± 0.75SF 0.50 < z < 0.65 3437 10.17 2150 1.65 ± 0.24 × 10⁻³ 10.52 ± 0.06 − 0.83 ± 0.21SF 0.65 < z < 0.80 4388 10.43 1919 1.56 ± 0.25 × 10⁻³ 10.64 ± 0.08 − 0.83 ± 0.34SF 0.80 < z < 1.00 2984 10.68 909 1.01 ± 0.11 × 10⁻³ 10.66 ± 0.11 − 0.42 ± 0.63
masses than quiescent galaxies in a given redshift bin. We calculatethe mass completeness limit using the stellar mass of each galaxyif it had a magnitude equal to the survey magnitude limit, so thatlog10(Mlim) = log10(M) + 0.4(m − mlim), where M is the galaxystellar mass, m is the observed apparent magnitude in the surveyselection band (r for GAMA and i for VIPERS), and mlim is thesurvey magnitude limit (r = 19.8 mag for GAMA and i = 22.5 magfor VIPERS). We use the Mlim of the faintest 20 per cent of thesegalaxies to represent galaxies with a typical M/L ratio near thesurvey limit. We then calculate the 90 per cent mass completenesslimit of these typical faint galaxies, assuming Mlim is for galaxies ina relatively narrow redshift bin. The mass completeness limits foreach spectral class and redshift bin are given in Table 1.
2.7 Uncertainties
The total uncertainty in the number and stellar mass densities arecalculated by adding in quadrature the errors due to sample size,uncertainty on the stellar masses, and those due to cosmic vari-ance. The errors due to sample size (i.e. Poisson uncertainty) areestimated following Moustakas et al. (2013), where the method ofGehrels (1986) is used to compute the upper and lower limits on theuncertainty in the mass function. This method properly accounts
for the uncertainty on a value when there are a small number ofgalaxies per mass bin, which is common at the high-mass end ofthe stellar mass function. We estimate the cosmic variance in eachGAMA and VIPERS field with the publicly available tool GETCV
(Moster et al. 2011). As the GAMA survey covers three separatefields, and VIPERS covers two separate fields, the uncertainty dueto cosmic variance is reduced further, as the uncertainties for eachfield are combined following Moster et al. (2011). The uncertaintiesdue to cosmic variance are minimized by the large survey volumes,and range from 5 to 11 per cent at M∗∼1010.6 and 6 to 12 per cent atM∗>1011 in the GAMA survey, and 4 to 6 per cent at M∗∼1010.6 to6 to 8 per cent at M∗>1011 in the VIPERS survey. To estimate theimpact of the uncertainty in stellar mass on the mass function andthe cumulative number densities, we perturb each stellar mass by arandom amount drawn from a Gaussian distribution with a standarddeviation equal to the 1σ error on the stellar mass. We do this for100 realizations and take the standard deviation of the number andmass density in each stellar mass and redshift bin.
There are also systematic uncertainties in the stellar mass due tothe choice of stellar population models and IMF of around ∼0.2–0.3 dex; see Wright et al. (2017) for a discussion of the effect ofdifferent stellar mass estimates on the galaxy stellar mass function.We note that we have used exactly the same method to calculate
MNRAS 473, 1168–1185 (2018)Downloaded from https://academic.oup.com/mnras/article-abstract/473/1/1168/4315942by Swinburne Library useron 01 December 2017
The mechanisms for quiescent galaxy formation 1175
the stellar mass in both samples, which is crucial to make thiscomparison valid, therefore systematics between the two samplesare minimized.
2.8 Aperture bias
We note that our results could be affected by aperture bias, as thefibre spectra cover a larger proportion of the galaxy at high redshift.Galaxy outskirts are usually bluer than the centre in spiral galaxies,but early-type galaxies tend to have flat or positive colour gradients(Gonzalez-Perez, Castander & Kauffmann 2011). Since the major-ity of the quiescent population is likely comprised of early-typegalaxies, aperture bias should have a negligible impact on our re-sults involving the quiescent population. Indeed, both the SDSS andGAMA fibres cover >90 per cent of the flux from a model galaxywith an effective radius of 4 kpc and with Sersic index of 4 at z > 0.1.However, for the star-forming, PSB and green-valley populations,at low redshift these may be classified as having redder spectra.We may therefore select fewer galaxies at low redshift than at highredshift, leading to an overestimation of the decline in these popu-lations with time. The SDSS (GAMA) fibres cover 32–78 per cent(18–56 per cent) of the flux from a model galaxy with Sersic in-dex of 1 at z = 0.1–0.3, respectively. We note that green-valleyand PSB galaxies have a range of Sersic indices and so will notbe as affected by aperture bias as the star-forming galaxies, whichtend to have lower Sersic indices. Furthermore, Pracy et al. (2012)found that low-redshift PSBs showed declining Balmer absorptionline strengths with increasing radius. At higher redshift, we mayselect fewer PSBs because aperture effects dilute the Balmer linestrength, but the amount by which aperture bias affects the spectraof low-redshift PSBs may not be equal to the amount by whichBalmer absorption bias affects the spectra of high-redshift PSBs.We test the effects of aperture bias on the classifications of galaxiesin Fig. B2 and find no evidence that the broad-band colours of spec-troscopically classified galaxies change with redshift. We thereforeconclude that aperture bias has a negligible effect on our results.
Whilst aperture corrections are available for physical parame-ters such as SFR and have been shown to be robust for largegalaxy populations (Brough et al. 2013; Richards et al. 2016),aperture corrections for detailed stellar population analysis arenot available. This issue will be addressed by next generationintegral field spectroscopic surveys such as Mapping NearbyGalaxies at APO (MaNGA, Bundy et al. 2015) and Sydney-Australian-Astronomical-Observatory Multi-object Integral-FieldSpectrograph (SAMI, Croom et al. 2012; Bryant et al. 2015).
3 R ESULTS
Most previous studies of the build-up of the number and stellar massdensity of star-forming and quiescent galaxies have used broad-banddata (e.g. Arnouts et al. 2007; Ilbert et al. 2013; Muzzin et al. 2013;Moustakas et al. 2013). Studies of the actively quenching popula-tions which may be responsible for the build-up of the quiescentpopulation have been limited to small samples of spectroscopicallyidentified PSBs (<20) at 0.5 < z < 1 (Wild et al. 2009; Verganiet al. 2010), which cannot be split by mass due to small num-ber statistics (although see Pattarakijwanich et al. 2016 who select∼6000 PSBs from the SDSS at 0.05 < z < 1.3). We use our spectro-scopic classifications of a large sample of quiescent, star-forming,green-valley and PSB galaxies to see how each of the populationschange as a function of stellar mass over a wide redshift range from0.05 < z < 1.0. In the following analysis, we only use redshift binsabove the 90 per cent mass completeness limit.
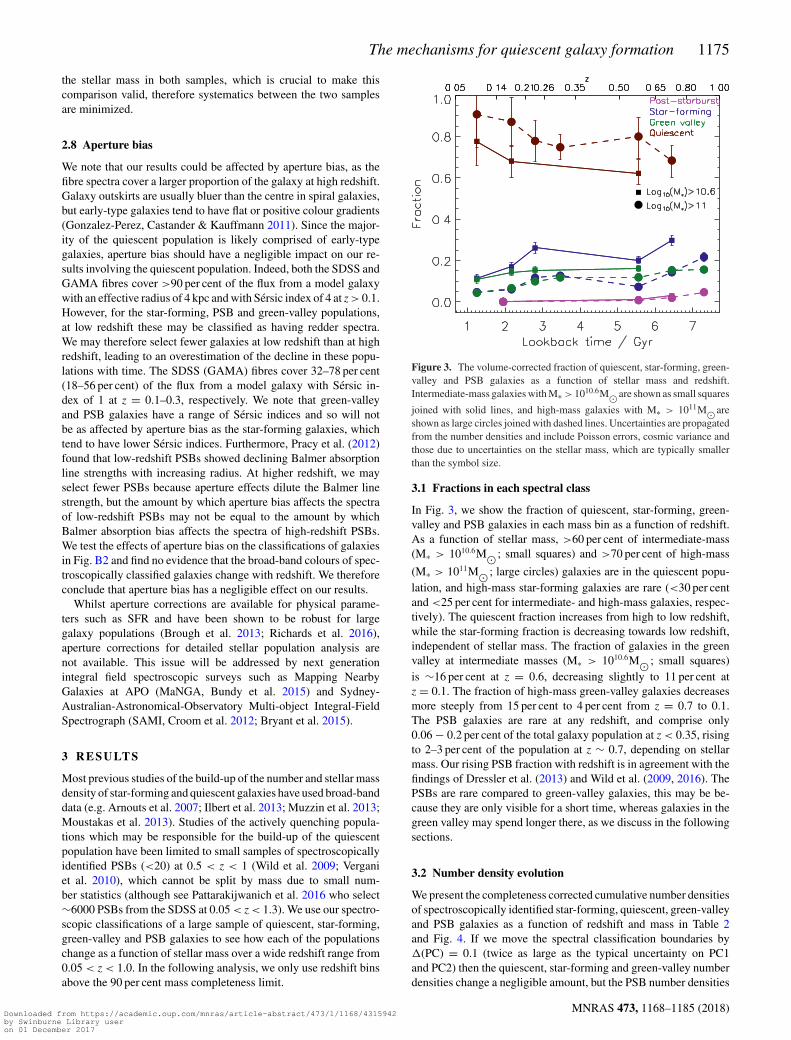
Figure 3. The volume-corrected fraction of quiescent, star-forming, green-valley and PSB galaxies as a function of stellar mass and redshift.Intermediate-mass galaxies with M∗ > 1010.6M�are shown as small squares
joined with solid lines, and high-mass galaxies with M∗ > 1011M�areshown as large circles joined with dashed lines. Uncertainties are propagatedfrom the number densities and include Poisson errors, cosmic variance andthose due to uncertainties on the stellar mass, which are typically smallerthan the symbol size.
3.1 Fractions in each spectral class
In Fig. 3, we show the fraction of quiescent, star-forming, green-valley and PSB galaxies in each mass bin as a function of redshift.As a function of stellar mass, >60 per cent of intermediate-mass(M∗ > 1010.6M� ; small squares) and >70 per cent of high-mass
(M∗ > 1011M� ; large circles) galaxies are in the quiescent popu-lation, and high-mass star-forming galaxies are rare (<30 per centand <25 per cent for intermediate- and high-mass galaxies, respec-tively). The quiescent fraction increases from high to low redshift,while the star-forming fraction is decreasing towards low redshift,independent of stellar mass. The fraction of galaxies in the greenvalley at intermediate masses (M∗ > 1010.6M� ; small squares)is ∼16 per cent at z = 0.6, decreasing slightly to 11 per cent atz = 0.1. The fraction of high-mass green-valley galaxies decreasesmore steeply from 15 per cent to 4 per cent from z = 0.7 to 0.1.The PSB galaxies are rare at any redshift, and comprise only0.06 − 0.2 per cent of the total galaxy population at z < 0.35, risingto 2–3 per cent of the population at z ∼ 0.7, depending on stellarmass. Our rising PSB fraction with redshift is in agreement with thefindings of Dressler et al. (2013) and Wild et al. (2009, 2016). ThePSBs are rare compared to green-valley galaxies, this may be be-cause they are only visible for a short time, whereas galaxies in thegreen valley may spend longer there, as we discuss in the followingsections.
3.2 Number density evolution
We present the completeness corrected cumulative number densitiesof spectroscopically identified star-forming, quiescent, green-valleyand PSB galaxies as a function of redshift and mass in Table 2and Fig. 4. If we move the spectral classification boundaries by(PC) = 0.1 (twice as large as the typical uncertainty on PC1and PC2) then the quiescent, star-forming and green-valley numberdensities change a negligible amount, but the PSB number densities
MNRAS 473, 1168–1185 (2018)Downloaded from https://academic.oup.com/mnras/article-abstract/473/1/1168/4315942by Swinburne Library useron 01 December 2017

1176 K. Rowlands et al.
Table 2. The cumulative comoving log number densities (Mpc−3) of galaxies in each spectroscopic class in redshift bins above a given stellar masslimit. Values are only shown for bins above the 90 per cent mass completeness limit in each spectroscopic class. Uncertainties include Poisson errors,cosmic variance and those due to uncertainties on the stellar mass.
Redshift All Star forming PSB Quiescent Green
log10(M/M∗) > 10.6
0.05 < z < 0.14 −2.75+0.04−0.05 −3.69+0.05
−0.05 −5.63+0.08−0.08 −2.86+0.04
−0.05 −3.72+0.05−0.05
0.14 < z < 0.21 −2.79+0.03−0.04 −3.56+0.03
−0.04 −5.63+0.08−0.08 −2.95+0.03
−0.04 −3.63+0.03−0.04
0.21 < z < 0.26 −2.91+0.03−0.03 −3.50+0.03
−0.03 −5.63+0.08−0.08 – −3.72+0.03
−0.04
0.26 < z < 0.35 – – – – –
0.50 < z < 0.65 −2.85+0.03−0.03 −3.54+0.03
−0.03 −4.70+0.05−0.06 −3.06+0.03
−0.03 −3.64+0.03−0.03
0.65 < z < 0.80 −2.85+0.02−0.02 −3.37+0.02
−0.03 −4.37+0.04−0.04 – –
0.80 < z < 1.00 – – – – –
log10(M/M∗) > 11
0.05 < z < 0.14 −3.41+0.05−0.06 −4.73+0.09
−0.10 −6.60+0.24−0.34 −3.45+0.05
−0.06 −4.76+0.09−0.10
0.14 < z < 0.21 −3.38+0.04−0.04 −4.59+0.05
−0.06 −6.60+0.24−0.34 −3.44+0.04
−0.04 −4.55+0.05−0.06
0.21 < z < 0.26 −3.48+0.04−0.04 −4.41+0.05
−0.05 −6.60+0.24−0.34 −3.59+0.04
−0.04 −4.48+0.05−0.05
0.26 < z < 0.35 −3.39+0.02−0.03 −4.29+0.03
−0.03 −6.60+0.24−0.34 −3.52+0.02
−0.03 −4.32+0.03−0.03
0.50 < z < 0.65 −3.44+0.03−0.04 −4.58+0.06
−0.07 −5.53+0.14−0.19 −3.54+0.03
−0.04 −4.37+0.05−0.05
0.65 < z < 0.80 −3.38+0.03−0.03 −4.23+0.04
−0.05 −5.10+0.08−0.10 −3.55+0.03
−0.03 −4.20+0.04−0.04
0.80 < z < 1.00 −3.49+0.03−0.03 −4.16+0.04
−0.04 −4.82+0.05−0.06 – −4.30+0.04
−0.04
Figure 4. The completeness corrected comoving number densities (Mpc−3)for star-forming, red, green-valley and PSB galaxies in redshift and stel-lar bins. Intermediate-mass galaxies with M∗ > 1010.6M�are shownas small squares joined with solid lines, and high-mass galaxies withM∗ > 1011M�are shown as large circles joined with dashed lines. Pointsare only shown for bins above the 90 per cent completeness limit. Errorsinclude uncertainties due to sample size and cosmic variance.
change by a factor of 2. The trends that we observe with redshiftremain unchanged. Qualitatively our results are robust to changesin the spectral classification boundaries and stellar mass binning.
For intermediate- (M∗ > 1010.6M� ) and high-mass
(M∗ > 1011M� ) star-forming galaxies, the population declinesin number density between z = 0.6 and 0.1. For intermediate-mass(M∗ > 1010.6M� ) quiescent galaxies, the population grows in num-ber density by a factor of 1.58 between z = 0.6 and 0.1. We findthat the number density of high-mass (M∗ > 1011M� ) quiescentgalaxies increases by a factor of 1.23 between z = 0.6 and 0.1. Our
results are similar to those of Moustakas et al. (2013), who foundthat the number density of quiescent galaxies (selected using a cut inthe broad-band photometry-derived M∗–SFR relation) grows moreslowly for high-mass galaxies from z = 1 to 0.1. We cannot recoverthe number density of less massive (M∗ < 1010M� ) galaxies be-yond the lowest redshift bin as our sample becomes incomplete inlow-mass galaxies at z > 0.14. Deeper spectroscopy or the use ofphotometric galaxy classification methods (Wild et al. 2014) are stillrequired to probe the low stellar mass quiescent galaxy regime. Itmay be that the quiescent population is growing more rapidly at lowredshift than suggested by our results, but only at lower masses thanthose probed by our study (Tinker et al. 2013; Muzzin et al. 2013).
To date, there have been few studies of the number den-sities of candidate transition (green-valley and PSB) galaxies.We find that green-valley galaxies with intermediate massesof M∗ > 1010.6M�have an approximately flat number density
of ∼10−3.7Mpc−3 from z = 1 to 0. At high stellar masses(M∗ > 1011M� ), the number density of green-valley galaxies de-creases by an order of magnitude from z = 1 to 0.
The number density of intermediate-mass (M∗ > 1010.6M� ) and
high-mass (M∗ > 1011M� ) PSB galaxies decreases by an order ofmagnitude in the redshift range 0.2 < z < 0.6. Our results are quali-tatively consistent with the results of Wild et al. (2016) who found afactor of 3 decrease in the number density of M∗ > 1010.6M�PSBsfrom z = 2 to 0.5 (see also Dressler et al. 2013). Our results alsoagree with the lower limits on the number density of compact, mas-sive (M∗ > 1011 M�) E+A galaxies at 0.2 < z < 0.8 from Zahidet al. (2016). Using VVDS spectra, Wild et al. (2009) found thatthere are more galaxies passing through the PSB phase at highredshift than at low redshift. The number densities of intermediate-mass PSBs in our study at 0.5 < z < 0.65 are similar to those inWild et al. (2016), who found a number density of 10−4.9 Mpc−3 forM∗ > 1010.5M�PSBs at 0.5 < z < 1. However, the PSB numberdensity at 0.65 < z < 0.8 is larger than that of Wild et al. (2016). Thisdiscrepancy may be because Wild et al. (2016) use a photometricselection method which may not be as sensitive to PSB features as
MNRAS 473, 1168–1185 (2018)Downloaded from https://academic.oup.com/mnras/article-abstract/473/1/1168/4315942by Swinburne Library useron 01 December 2017

The mechanisms for quiescent galaxy formation 1177
Table 3. The cumulative comoving log mass densities (M�Mpc−3) of galaxies in each spectroscopic class in redshift bins above a given stellar masslimit. Values are only shown for bins above the 90 per cent mass completeness limit in each spectroscopic class. Uncertainties include Poisson errors,cosmic variance and those due to uncertainties on the stellar mass.
Redshift All Star forming PSB Quiescent Green
log10(M/M∗) > 10.6
0.05 < z < 0.14 8.17+0.04−0.05 7.15+0.05
−0.06 5.30+0.09−0.11 8.08+0.04
−0.05 7.09+0.05−0.05
0.14 < z < 0.21 8.16+0.03−0.04 7.28+0.04
−0.04 5.30+0.09−0.11 8.03+0.03
−0.04 7.22+0.03−0.04
0.21 < z < 0.26 8.04+0.03−0.03 7.36+0.03
−0.03 5.30+0.09−0.11 – 7.16+0.03
−0.04
0.26 < z < 0.35 – – – – –
0.50 < z < 0.65 8.09+0.03−0.03 7.27+0.03
−0.03 6.15+0.05−0.06 7.93+0.03
−0.03 7.25+0.03−0.03
0.65 < z < 0.80 8.11+0.02−0.02 7.47+0.02
−0.03 6.50+0.04−0.04 – –
0.80 < z < 1.00 – – – – –
log10(M/M∗) > 11
0.05 < z < 0.14 7.80+0.05−0.06 6.59+0.09
−0.11 4.94+0.24−0.34 7.75+0.05
−0.06 6.37+0.08−0.10
0.14 < z < 0.21 7.84+0.04−0.04 6.69+0.05
−0.06 4.94+0.24−0.34 7.77+0.04
−0.04 6.63+0.05−0.06
0.21 < z < 0.26 7.73+0.04−0.04 6.81+0.05
−0.05 4.94+0.24−0.34 7.63+0.04
−0.04 6.69+0.05−0.05
0.26 < z < 0.35 7.84+0.02−0.03 6.89+0.03
−0.03 4.94+0.24−0.34 7.73+0.02
−0.03 6.84+0.03−0.03
0.50 < z < 0.65 7.74+0.03−0.04 6.54+0.06
−0.07 5.60+0.14−0.19 7.66+0.03
−0.04 6.78+0.05−0.05
0.65 < z < 0.80 7.81+0.03−0.03 6.91+0.04
−0.05 6.02+0.09−0.11 7.66+0.03
−0.03 6.96+0.04−0.04
0.80 < z < 1.00 7.71+0.03−0.03 7.00+0.03
−0.04 6.37+0.05−0.06 - 6.89+0.04
−0.04
the spectroscopic selection used in our study. The number densityof PSB galaxies identified spectroscopically from the VVDS surveywith 0.5 < z < 1.0 by Wild et al. (2009) was 10−4Mpc−3 for galax-ies with M∗ > 109.75M� , measured from 16 PSB galaxies. As weare highly incomplete at such low stellar masses, we cannot directlycompare to the results from Wild et al. (2009), which used VVDSdata which are two magnitudes deeper than the VIPERS survey.
The stellar mass densities (Table 3) show very similar behaviourto the number densities. For intermediate-mass (M∗ > 1010.6M� )quiescent galaxies, the population grows in stellar mass density bya factor of 1.41 between z = 0.6 and 0.1. The mass density ofhigh-mass (M∗ > 1011M� ) quiescent galaxies grows by a factorof 1.23 between z = 0.6 and 0.1. Our results for the growth of thequiescent population are smaller than those of Bell et al. (2004),Brown et al. (2007) and Arnouts et al. (2007), who found that thequiescent population has doubled in mass in the range 0 < z < 1. Thedifferences between our measured mass growth rate and literaturestudies may be because our spectroscopic selection, stellar massand redshift range are slightly different to those in other studies.Furthermore, we have checked that aperture bias does not cause usto misclassify large numbers of galaxies at low redshift, see Fig. B2.Our results show that, in general, there were more transition galaxiesat high redshift than in the local Universe.
3.3 Evolution of mass functions
We present the mass functions of the red, star-forming, green-valleyand PSB galaxies in Fig. 5. We fit our mass functions with singleSchechter functions (Schechter 1976), using the IMPRO IDL library3
(Moustakas et al. 2013). We do not fit our mass functions withdouble Schechter functions as we do not see an upturn at lowstellar masses. The Schechter fit parameters are in Table 1. Theuncertainties on the number density (φ) include contributions fromPoisson errors, cosmic variance and from uncertainties on the stel-
3 https://github.com/moustakas/impro
lar mass estimated via a Monte Carlo method with 100 realizations(Section 2.7).
The mass functions of the quiescent galaxies show a clear build-up in the low-mass end from z = 1 to 0, and a smaller increase inthe number density of high-mass galaxies, as is commonly foundin the literature. Conversely, the mass functions of the star-forminggalaxies show that from z = 1 to 0, there is a decline in the numberdensity of massive galaxies with redshift. Note that our spectro-scopically defined quiescent population mass function is differentto that selected on u − r and optical colour from Baldry et al. (2012,also using GAMA data), as we find fewer low-mass galaxies (seeAppendix C). This may be because Baldry et al. (2012) separatestar-forming and quiescent galaxies using broad-band colours, andwe use a cleaner spectroscopic selection that likely has less con-tamination by dusty objects. Furthermore, we separate quiescentfrom green-valley galaxies, whereas Baldry et al. (2012) do notmake this discrimination, meaning that green-valley galaxies willbe mixed with the red and blue populations defined with broad-bandcolours (Taylor et al. 2015). See Appendix B for an analysis of thebroad-band colours of galaxies in each spectral class.
As seen in Section 3.2, the green-valley galaxy mass functionsshow a negligible build-up at M∗ ∼ 1010.5M� with redshift, butthere is more evolution at the high-mass end of the mass func-tion. There were more high-mass galaxies in the green valley athigh redshift than at low redshift. The PSB mass function exhibitsstronger evolution in the mass function than green-valley galaxies,with galaxies in the PSB phase more massive at high redshift. Ourtransition galaxy mass functions are consistent with more massivegalaxies quenching earlier, and less massive galaxies quenchinglater. Similar results were found by Goncalves et al. (2012) forgreen-valley galaxies.
4 H OW FA S T D O G A L A X I E S QU E N C H ?
Previous studies using broad-band photometry have not reached aconsensus on the relative importance of the fast and slow chan-nels for galaxy quenching and building of the quiescent galaxy
MNRAS 473, 1168–1185 (2018)Downloaded from https://academic.oup.com/mnras/article-abstract/473/1/1168/4315942by Swinburne Library useron 01 December 2017

1178 K. Rowlands et al.
Figure 5. The stellar mass functions (corrected for incompleteness) for (a) quiescent, (b) star-forming, (c) green-valley and (d) PSBs, in different redshiftbins. Points are only shown where the bin is >90 per cent complete in stellar mass. Errors include Poisson uncertainties, cosmic variance and from uncertaintieson the stellar masses.
population. Spectroscopic surveys offer the unique advantage ofbeing able to cleanly identify both quiescent galaxies and candidatetransition galaxies with different quenching time-scales. In this sec-tion, we discuss our results in terms of the relative importance ofthese two channels for building the quiescent population.
4.1 Quiescent galaxies
We showed in Section 3.2 that the number density of the quiescentpopulation is consistent with slow evolution at 0.05 < z < 1 forM∗>1010.6M� , and almost flat evolution for M∗>1011M� . Weestimate the rate at which galaxies are entering the quiescent pop-ulation (dφ/dt) by fitting a straight line to the number density asa function of time to each mass bin of the quiescent population.The quantity dφ/dt is shown for intermediate- (M∗ > 1010.6M� )
and high-mass (M∗ > 1011M� ) quiescent galaxies in Fig. 6 as thesolid red and dashed lines, respectively. The hashed areas repre-sent the upper and lower limits on the growth rate of the quiescentpopulation, derived from the uncertainty on the linear fit to the qui-escent population number densities as a function of time. While itis possible that the growth rate is not linear with time, the currentdata do not allow any higher order terms to be fit. In the follow-ing discussion, we neglect the effect of dry mergers which would
cause quiescent galaxies to move within mass bins, as at these highmasses the rate of dry mergers with close to equal mass ratiosis expected to be small. While high–mass quiescent galaxies maymerge with low-mass companions, they are not thought to mergewith each other at low redshift to sufficiently affect their numberdensity.
For the intermediate-mass (M∗ > 1010.6M� ) quiescent galaxies,we find a number density evolution with time which is growing ata rate of dφ/dt = 8.8 ± 2.5 × 10⁻⁵Mpc−3Gyr−1. For the high-mass (M∗ > 1011M� ) quiescent galaxies, we find a growth rate
of dφ/dt = 7.6 ± 6.7 × 10⁻⁶Mpc−3Gyr−1. We note that apertureeffects could cause us to classify galaxies differently depending ontheir redshift, particularly in the lowest redshift bin. We test therobustness of our results to redshift effects by repeating the growthrate calculation without the lowest redshift point and measure aslightly slower growth rate in both mass bins. However, the val-ues are consistent within the 1σ uncertainties and our conclusionsremain unchanged.
4.2 Green-valley galaxies
To put an upper limit on the rate at which green-valley galaxiescould be passing into the quiescent population (dφ/dt), we divide
MNRAS 473, 1168–1185 (2018)Downloaded from https://academic.oup.com/mnras/article-abstract/473/1/1168/4315942by Swinburne Library useron 01 December 2017

The mechanisms for quiescent galaxy formation 1179
Figure 6. The rate of galaxies passing through the PSB (purple) and green-valley (green) phase, and the growth rate of the quiescent population, as afunction of redshift and mass. We assume a nominal transition time-scaleof 2.6 and 6.6 Gyr for intermediate- and high-mass green-valley galaxies,respectively (see Section 4.2), and 0.5 and 2.0 Gyr for intermediate- andhigh-mass PSBs, respectively (see Section 4.3). Transition time-scales areestimated by requiring that dφ/dtGreenvalley ≤ dφ/dtQuiescent and dφ/dtPSB
≤ dφ/dtQuiescent in the highest redshift bin. Results for intermediate-mass(M∗ > 1010.6M� ) galaxies are shown as small squares connected by solid
lines; high-mass (M∗ > 1011M� ) galaxies are shown as large circles con-nected by dashed lines. The errors for the PSB and green-valley populationsinclude Poisson, cosmic variance contributions and uncertainties propagatedfrom the uncertainty on the stellar masses. The growth rate of the quiescentpopulation is shown as a thick red line. The hatched area represents theuncertainty on the growth rate of the quiescent population, which is derivedfrom the uncertainty on the linear fit to the number densities. The growthrate of star-forming galaxies of all masses is negative and is not shown.
the number densities in the intermediate-mass bin by a nominaltransition time-scale such that dφ/dtGreenvalley ≤ dφ/dtQuiescent. Thiscorresponds to a lower limit on the transition time-scale. To dothis, we make the assumptions that (1) galaxies cannot be tran-sitioning faster than the growth rate of the quiescent population,and (2) that PSBs do not contribute to the growth of the quiescentpopulation. In reality both green-valley and PSB populations maybe transitioning into the quiescent population, which would thenrequire longer transition time-scales than given here. We discussthis further below. Green-valley galaxies with M∗ > 1010.6M� are
transitioning at a rate of 8 × 10⁻⁵Mpc−3Gyr−1, for a transitiontime-scale of 2.6 Gyr. Because the number density of intermediate-mass green-valley galaxies remains constant with cosmic time, thistransition time-scale refers to the rate at which galaxies pass throughthe boundaries we have defined for the green valley, assuming thatevery galaxy in this region is transitioning. If the transition time-scale does not change with redshift, the observed flat number den-sity leads to a flat transition rate, which is consistent with a lineargrowth rate for the quiescent population. Similar conclusions of arelatively unchanging green-valley population were found by Salimet al. (2012), Fang et al. (2012) and Salim (2014) who studied theUV morphologies and SFHs of green-valley galaxies.
The estimated transition time-scale of 2.6+1.4−0.7 Gyr (accounting
for the uncertainty on the growth rate of the quiescent population)is entirely reasonable, and is similar to time-scales found in the lit-erature. Accounting for uncertainties, the transition time-scale for
green-valley galaxies cannot be >4 Gyr otherwise dφ/dtGreenvalley
will exceed dφ/dtQuiescent. Using cosmological hydrodynamical sim-ulations with radiation transfer post-processing, Trayford et al.(2016) found using broad-band colours that most simulated galax-ies spend <2 Gyr in the green valley, independent of galaxy mass.Martin et al. (2007) used spectral indices to estimate quenchingtimes in local green-valley galaxies, finding a time-scale of 50 Myrto 6 Gyr, with more than 50 per cent of quenching occurring within2 Gyr. Using broad-band colours, Smethurst et al. (2015) found acontinuum of transition time-scales, but that most galaxies spend1–2 Gyr in the green valley. Differences in transition time-scalesmay be due to the differences in selection methods of green-valleygalaxies (e.g. optical or UV colour–magnitude, spectroscopy).
In Fig. 6, we show dφ/dt for high-mass (M∗ > 1011M� ) green-
valley galaxies, assuming a transition time-scale of 6.6+26.6−2.9 Gyr.
Given the large errors on the growth of the high-mass quiescentpopulation, the drop in number density of the high-mass green-valley galaxies remains consistent with a transition time-scale thatdoes not evolve with redshift. If we assumed a shorter time-scale of2.6 Gyr as used for the intermediate-mass galaxies, the rate at whichhigh-mass galaxies pass through the green valley would be formallyinconsistent with the growth rate of the quiescent population, afteraccounting for uncertainties at the 1σ level. Our findings hint atan increasing transition time-scale with increasing mass, and mayexplain our slightly longer time-scale compared to other publishedvalues given our high-mass limit (M∗ > 1010.6M� ).
Our results show that the growth of the quiescent population atthese masses and redshifts can be entirely explained by galaxiestransitioning slowly through the green valley. The presence of an-other, faster quenching channel would require a longer transitiontime for green-valley galaxies, or alternatively that only a fractionof the galaxies are actually transitioning.
4.3 Post-starburst galaxies
We can put an upper limit on the rate at which galaxies could bepassing through the PSB phase and into the quiescent populationin the same way as for the green-valley galaxies. To reconcile therate of intermediate-mass (M∗ > 1010.6M� ) galaxies transitioningthrough the PSB phase at z = 0.7 with the growth rate of thequiescent population, we find a transition time-scale of 0.5 Gyr. Asabove, this assumes that the green-valley galaxies do not contributeto the growth of the quiescent population.
A transition time-scale of 0.5+0.3−0.1 Gyr (accounting for the uncer-
tainty of the growth rate of the quiescent population) is a reasonableestimate for PSB galaxies and is similar to the time-scales found inhydrodynamical merger simulations by Wild et al. (2009), wherethe simulations are observed with the same spectral indices as usedto identify PSB galaxies in this paper. Visibility time-scales of a fewhundred Myr for PSB features were also found in similar mergersimulations by Snyder et al. (2011). Both papers found that thetime-scales depend sensitively on gas fractions, orbital dynamicsand progenitor types. The rapid decline in number density of PSBgalaxies means that they must have significantly shorter visibilitytime-scales at low redshift if they are to contribute significantlyto the growth of the quiescent population. While the simulationssuggest that a visibility time-scale a factor of 2 shorter may be rea-sonable, this does not come close to the factor of 18 decrease innumber density for intermediate-mass galaxies. Equally, while it ispossible that the rate of growth of the quiescent population slowsbetween z = 1 and 0.05, and this is not captured by our linear fit,
MNRAS 473, 1168–1185 (2018)Downloaded from https://academic.oup.com/mnras/article-abstract/473/1/1168/4315942by Swinburne Library useron 01 December 2017

1180 K. Rowlands et al.
the change in number density of quiescent galaxies does not seemto indicate such a significant change. Aperture bias may cause usto select fewer transition galaxies at low redshift than at high red-shift, but our tests in Section 2.8 and Appendix B show that this isunlikely to cause such a strong evolution in number density as weobserve. We can therefore conclude that while the fast-quenchingPSB channel may contribute significantly to quiescent populationgrowth of intermediate-mass galaxies at z = 0.7, it appears to beinsignificant by z ∼ 0.
To reconcile the rate of high-mass (M∗ > 1011M� ) galaxies tran-sitioning through the PSB phase at z = 0.7 with the growth rate of thequiescent population, we find a transition time-scale of 2.0+8.0
−0.9 Gyr.This seems marginally inconsistent with the maximum possible vis-ibility time-scale for PSB galaxies of ∼1 Gyr (the main-sequencelifetime of A-stars). Decreasing the time-scale to a more reason-able 0.5 Gyr would give a transition rate that is incompatible withthe observed growth of the quiescent population, especially whenadditional growth via the green valley is included. This indicatesthat at high masses some PSB galaxies may not be transitioninginto the quiescent population. Further processes may be needed tofully quench these high-mass transition galaxies, i.e. they will sub-sequently return to the green-valley or star-forming population. Al-ternatively, PSB galaxies may have rejuvenated from the quiescentpopulation rather than transitioning from the star-forming popula-tion. The former scenario fits well with the findings that PSBs stillhave substantial gas and dust contents (Zwaan et al. 2013; Frenchet al. 2015; Rowlands et al. 2015; Alatalo et al. 2016b), and oftenhave discy morphologies (Pawlik et al. 2016), indicating that theymay not be fully quenched.
4.4 Are galaxies quenching?
The growth in number density of quiescent galaxies shows thatquenching is occurring at 0.05 < z < 1. The data are consis-tent with a quenching rate that is constant with cosmic time, andwhen combined with the observed number density of green-valleygalaxies, fits with a scenario in which the predominant quenchingchannel is the slow transitioning of green-valley galaxies into thequiescent population over a time-scale of ∼2.6 Gyr for galaxieswith M∗ > 1010.6M� , increasing to ∼6.6 Gyr for galaxies with
M∗ > 1011M� . The existence of a significant number of PSBgalaxies at z ∼ 0.7 draws this conclusion into question however. Ifboth green-valley and PSB galaxies contribute to the growth of thequiescent population at z ∼ 0.7 then the transition time-scales ofboth populations must be longer than the values estimated above.The maximum possible time-scale for PSB galaxies is ∼1 Gyr (themain-sequence lifetime of A-stars). Therefore, at z ∼ 0.7 the growthof the intermediate-mass quiescent population could conceivably becomposed of, for example an equal fraction of PSBs with a tran-sition time of 1 Gyr and green-valley galaxies with a transitiontime of ∼5.2 Gyr. Although transition time-scales are generally ex-pected to be shorter at higher redshift (Goncalves et al. 2012; Tinkeret al. 2013; Balogh et al. 2016), better data would be required to de-termine the exact rate at which the quiescent population is growingwith redshift in order to rule out this scenario.
However, at high masses (M∗ > 1011M� ), there is clear ten-sion between the number density of transition galaxies and smallgrowth rate of the quiescent population. The transition times for thehigh-mass galaxies are already long (2 Gyr for PSBs and 6.6 Gyrfor green-valley galaxies). If both green-valley and PSB galaxiescontribute to the growth of the quiescent population at z ∼ 0.7, then
the transition time-scales of both populations will be unphysicallylong. The large number of high-mass transition galaxies comparedto the slow growth of the quiescent population could be resolvedif either (i) the uncertainties in the mass growth of the quiescentpopulation are underestimated, (ii) galaxies do not follow the linearevolutionary path of star forming, to quenching, to quiescent. Thefirst scenario could be due to underestimation of cosmic variance,aperture bias, or systematics in the stellar masses due to IMF varia-tion with redshift or galaxy mass. The first scenario will likely onlybe solved with larger spectroscopic surveys. Even though aperturebias may affect some classifications, the difference in the num-ber densities between transition and quiescent galaxies is so large,and the evolution in the number densities of the green-valley andPSB galaxies is so strong that some misclassified galaxies are un-likely to affect our conclusions. Regarding the second scenario,several authors have suggested that PSB and green-valley galaxiesmay have been rejuvenated and have temporarily come out of thequiescent population (Cortese & Hughes 2009; Fang et al. 2012;Dressler et al. 2013), and up to 60 per cent of local early-type galax-ies have a cold interstellar medium (ISM, e.g. Oosterloo et al. 2010;Young et al. 2011; Serra et al. 2012; Rowlands et al. 2012; Smithet al. 2012; Agius et al. 2013) which should allow them to rejuve-nate given some trigger event. The broad-band colours of these gas-rich early-type galaxies are consistent with a rejuvenation scenario(Young et al. 2014), where gas has been accreted recently via minormergers (Davis et al. 2011). Using cosmological hydrodynamicalsimulations with radiation transfer post-processing, Trayford et al.(2016) found that 10 per cent of simulated galaxies are classifiedas rejuvenated as they show blue broad-band colours but were redin the past, although only 1.6 per cent of simulated galaxies rapidlychange colour from red to blue over a <2 Gyr time period. How-ever, Furlong et al. (2015) showed that the passive fraction is toolow in EAGLE at log(M∗ > 10.5) by ∼15 per cent which may be aresult of too much rejuvenation in their simulations. Direct compar-isons of observations with simulations via the forward modelling ofthe simulations as mock data sets may help to unpick these relatedproblems. A temporary departure of galaxies from the quiescentpopulation into the PSB or green-valley phase, possibly as a resultof minor merger-driven star formation, would relieve the tensionbetween the number of candidate transition galaxies and the slowgrowth of the quiescent population at high masses. At intermediatemasses, rejuvenation may happen, but is not visible compared tothe number of truly quenching galaxies.
Alternatively, given the presence of a large cold ISM in PSBs(Zwaan et al. 2013; Rowlands et al. 2015; French et al. 2015;Alatalo et al. 2016a), high-mass galaxies may originate from, andreturn to, the star-forming population or green valley after a star-burst. This was suggested by Dressler et al. (2013) as the star-burst galaxy population far outnumbers the passive galaxies in fieldand group environments. Overall, our findings for the highest mass(M∗ > 1011M� ) galaxies are in agreement with Dressler et al.(2013) that the slow change in the numbers of quiescent galax-ies since z ∼ 1 indicates that either not many galaxies in the PSBphase or green valley finally join the quiescent population, or thatquenching takes multiple events happening over a long time.
Ultimately, since the growth rate of the quiescent population atM∗ > 1010.6M� is slow, there is not a lot of room for the com-plete quenching of all massive galaxies since z = 1, over half theage of the Universe. This means that although most galaxies arereducing their SFRs with time, very few of them completely halttheir star formation to become quiescent. At the highest masses(M∗ > 1011M� ), both rapid and slower quenching processes (e.g.
MNRAS 473, 1168–1185 (2018)Downloaded from https://academic.oup.com/mnras/article-abstract/473/1/1168/4315942by Swinburne Library useron 01 December 2017

The mechanisms for quiescent galaxy formation 1181
strangulation and starvation) may be less effective. This implies thatsome fraction of populations commonly thought to be moving fromstar forming to quiescent, such as green valley and PSBs, may notbe transitioning at all.
5 SU M M A RY
By exploiting the highly complete, wide-area GAMA and VIPERSspectroscopic surveys, we have studied the number densities ofquiescent, PSB and green-valley galaxies. This has allowed us toexplore the rate at which galaxies are quenching at 0.05 < z < 1as a function of mass, and the contribution of different transitiongalaxy populations to the build-up of the quiescent population. Ourmain conclusions are summarized as follows:
(i) Over the last 8 billion years, the quiescent population growsin number and mass density more quickly for intermediate-mass(M∗ > 1010.6M� ) galaxies compared to high-mass galaxies (M∗ >
1011M� ).(ii) The number densities of spectroscopically classified green-
valley galaxies from 0 < z < 1 is flat for intermediate mass anddeclining for high masses. We find the transition time-scale ofintermediate- (high) mass green-valley galaxies is 2.6 Gyr (6.6 Gyr)at 0.05 < z < 1 if green-valley galaxies contribute 100 per cent tothe growth of the quiescent population.
(iii) The number densities of PSB galaxies from 0 < z < 1 isdeclining for both intermediate- and high-mass populations. Thehigh-mass PSB population shows a steeper decline in number den-sity than at intermediate masses. We find that the transition time-scale of intermediate- (high) mass PSBs is 0.5 Gyr (2.0 Gyr) atz ∼ 0.7 if PSB galaxies contribute 100 per cent to the growth of thequiescent population. The rapid decline in number density of PSBswith decreasing redshift means that the fast quenching channel mustbe insignificant by z ∼ 0.
(iv) If high redshift, intermediate-mass PSB galaxies are visiblefor a slightly longer maximum time-scale of ∼1 Gyr, correspondingto the main-sequence lifetime of A-stars, this allows quenchingvia both a slow and fast route to contribute to the growth of theintermediate-mass quiescent population at z ∼ 0.7.
(v) Both the green-valley and PSB mass functions show thathigh-mass galaxies transitioned at earlier cosmic times. The PSBmass function shows stronger redshift evolution than that of thegreen-valley galaxy mass function.
(vi) The number of high-mass (M∗ > 1011M� ) green-valley andPSB galaxies is in tension with the observed slow growth of the qui-escent population. This indicates that at high masses, some PSB orgreen-valley galaxies are not transitioning from the star forminginto the quiescent population. The mechanisms which cause a com-plete shutdown in star formation may be rare or ineffective at z < 1.Quiescent galaxies may undergo rejuvenation events which tem-porarily cause a galaxy to be observed in the green-valley or PSBphase. Alternatively, the tension could be eased if the uncertaintieson the number densities due to cosmic variance or stellar massesare underestimated.
This study has put upper limits on the rate at which galaxiesare quenching, and by how much the slow- and fast-quenchingchannels may be contributing at masses M∗ > 1010.6M� and red-shifts in the range 0.05 < z < 1. Larger spectroscopic surveys areneeded to ascertain which quenching processes are acting in dif-ferent environment and mass regimes. This issue will be addressedby the Taipan survey (da Cunha 2017), which will measure fibrespectra for 1 million galaxies at z < 0.3. Detailed information about
the SFHs of candidate transition galaxies from high S/N spectrawould confirm the fraction of the progenitors that are truly com-ing from the star-forming population, rather than rejuvenating. Theprocesses which transform galaxies may leave different imprints onthe motion and spatial distribution of stars and gas. Integral fieldspectroscopy from surveys such as MaNGA and SAMI could alsohelp us to determine which processes cause quenching as a functionof mass and environment.
AC K N OW L E D G E M E N T S
We thank the referee for insightful and detailed comments whichimproved the paper. We thank Alice Mortlock, Omar Almaini,Tim Davis and Alan Dressler for useful discussions. VW andKR acknowledge support from the European Research CouncilStarting Grant SEDmorph (PI: VW). GAMA is a joint European-Australasian project based around a spectroscopic campaign us-ing the Anglo-Australian Telescope. The GAMA input catalogueis based on data taken from the SDSS and the UKIRT InfraredDeep Sky Survey. Complementary imaging of the GAMA re-gions is being obtained by a number of independent surveyprograms including GALEX MIS, VST KIDS, VISTA VIKING,WISE, Herschel-ATLAS, GMRT and ASKAP providing UV toradio coverage. GAMA is funded by the STFC (UK), the ARC(Australia), the AAO and the participating institutions. The GAMAwebsite is http://www.gama-survey.org/. Based on observationsmade with ESO Telescopes at the La Silla Paranal Observatoryunder programme ID 179.A-2004. This paper uses data from theVIMOS Public Extragalactic Redshift Survey (VIPERS). VIPERShas been performed using the ESO Very Large Telescope, un-der the ‘Large Programme’ 182.A-0886. The participating insti-tutions and funding agencies are listed at http://vipers.inaf.it Thisresearch has made use of NASA’s Astrophysics Data SystemBibliographic Services.
R E F E R E N C E S
Adelman-McCarthy J. K. et al., 2008, ApJS, 175, 297Agius N. K. et al., 2013, MNRAS, 431, 1929Alatalo K. et al., 2016a, ApJS, 224, 38Alatalo K. et al., 2016b, ApJ, 827, 106Arnouts S. et al., 2007, A&A, 476, 137Baldry I. K., Glazebrook K., Brinkmann J., Ivezic Z., Lupton R. H., Nichol
R. C., Szalay A. S., 2004, ApJ, 600, 681Baldry I. K. et al., 2012, MNRAS, 421, 621Balogh M. L. et al., 2016, MNRAS, 456, 4364Barnes J. E., Hernquist L., 1996, ApJ, 471, 115Barro G. et al., 2013, ApJ, 765, 104Bell E. F. et al., 2004, ApJ, 608, 752Benson A. J., Bower R. G., Frenk C. S., Lacey C. G., Baugh C. M., Cole S.,
2003, ApJ, 599, 38Bessell M. S., 1990, PASP, 102, 1181Blake C. et al., 2004, MNRAS, 355, 713Blanton M. R. et al., 2003, ApJ, 594, 186Brammer G. B. et al., 2011, ApJ, 739, 24Brough S. et al., 2013, MNRAS, 435, 2903Brown M. J. I., Dey A., Jannuzi B. T., Brand K., Benson A. J., Brodwin M.,
Croton D. J., Eisenhardt P. R., 2007, ApJ, 654, 858Bruzual G., Charlot S., 2003, MNRAS, 344, 1000Bryant J. J. et al., 2015, MNRAS, 447, 2857Bundy K. et al., 2015, ApJ, 798, 7Cardelli J. A., Clayton G. C., Mathis J. S., 1989, ApJ, 345, 245Chabrier G., 2003, PASP, 115, 763Charlot S., Fall S. M., 2000, ApJ, 539, 718Connolly A. J., Szalay A. S., 1999, AJ, 117, 2052
MNRAS 473, 1168–1185 (2018)Downloaded from https://academic.oup.com/mnras/article-abstract/473/1/1168/4315942by Swinburne Library useron 01 December 2017

1182 K. Rowlands et al.
Cortese L., Hughes T. M., 2009, MNRAS, 400, 1225Couch W. J., Sharples R. M., 1987, MNRAS, 229, 423Croom S. M. et al., 2012, MNRAS, 421, 872Crossett J. P., Pimbblet K. A., Jones D. H., Brown M. J. I., Stott J. P., 2017,
MNRAS, 464, 480da Cunha E., 2017, preprint (arXiv:1706.01246)Davidzon I. et al., 2013, A&A, 558, A23Davis T. A. et al., 2011, MNRAS, 417, 882Di Matteo T., Springel V., Hernquist L., 2005, Nature, 433, 604Dressler A., Gunn J. E., 1983, ApJ, 270, 7Dressler A., Oemler Jr A., Poggianti B. M., Gladders M. D., Abramson L.,
Vulcani B., 2013, ApJ, 770, 62Driver S. P. et al., 2011, MNRAS, 413, 971Driver S. P. et al., 2016, MNRAS, 455, 3911Faber S. M. et al., 2007, ApJ, 665, 265Fang J. J., Faber S. M., Salim S., Graves G. J., Rich R. M., 2012, ApJ, 761,
23Fang J. J., Faber S. M., Koo D. C., Dekel A., 2013, ApJ, 776, 63French K. D., Yang Y., Zabludoff A., Narayanan D., Shirley Y., Walter F.,
Smith J.-D., Tremonti C. A., 2015, ApJ, 801, 1Fritz A. et al., 2014, A&A, 563, A92Furlong M. et al., 2015, MNRAS, 450, 4486Garilli B. et al., 2014, A&A, 562, A23Gehrels N., 1986, ApJ, 303, 336Gonzalez-Perez V., Castander F. J., Kauffmann G., 2011, MNRAS, 411,
1151Goncalves T. S., Martin D. C., Menendez-Delmestre K., Wyder T. K., Koeke-
moer A., 2012, ApJ, 759, 67Gordon Y. A. et al., 2017, MNRAS, 465, 2671Goto T., 2005, MNRAS, 357, 937Goto T., 2007, MNRAS, 381, 187Gunn J. E., Gott III J. R., 1972, ApJ, 176, 1Guzzo L. et al., 2014, A&A, 566, A108Hahn C., Tinker J. L., Wetzel A. R., 2016, ApJ, 841, 17Haines C. P. et al., 2013, ApJ, 775, 126Hill D. T. et al., 2011, MNRAS, 412, 765Hopkins P. F., Bundy K., Hernquist L., Ellis R. S., 2007, ApJ, 659, 976Hopkins A. M. et al., 2013, MNRAS, 430, 2047Iglesias-Paramo J. et al., 2013, A&A, 553, L7Ilbert O. et al., 2004, MNRAS, 351, 541Ilbert O. et al., 2013, A&A, 556, A55Kauffmann G. et al., 2003, MNRAS, 341, 33Kaviraj S., Kirkby L. A., Silk J., Sarzi M., 2007, MNRAS, 382, 960Kaviraj S., Schawinski K., Silk J., Shabala S. S., 2011, MNRAS, 415, 3798Kewley L. J., Jansen R. A., Geller M. J., 2005, PASP, 117, 227Khalatyan A., Cattaneo A., Schramm M., Gottlober S., Steinmetz M.,
Wisotzki L., 2008, MNRAS, 387, 13Liske J. et al., 2015, MNRAS, 452, 2087Martig M., Bournaud F., Teyssier R., Dekel A., 2009, ApJ, 707, 250Martin D. C. et al., 2007, ApJS, 173, 342Martini P., Weinberg D. H., 2001, ApJ, 547, 12McCarthy I. G., Frenk C. S., Font A. S., Lacey C. G., Bower R. G., Mitchell
N. L., Balogh M. L., Theuns T., 2008, MNRAS, 383, 593McGee S. L., Bower R. G., Balogh M. L., 2014, MNRAS, 442, L105Mihos J. C., Hernquist L., 1994, ApJ, 431, L9Mihos J. C., Hernquist L., 1996, ApJ, 464, 641Mortlock A. et al., 2013, MNRAS, 433, 1185Moster B. P., Somerville R. S., Newman J. A., Rix H.-W., 2011, ApJ, 731,
113Moustakas J. et al., 2013, ApJ, 767, 50Moutard T. et al., 2016, A&A, 590, A102Muzzin A. et al., 2013, ApJ, 777, 18Oosterloo T. et al., 2010, MNRAS, 409, 500Pattarakijwanich P., Strauss M. A., Ho S., Ross N. P., 2016, ApJ, 833, 19Pawlik M. M., Wild V., Walcher C. J., Johansson P. H., Villforth C., Row-
lands K., Mendez-Abreu J., Hewlett T., 2016, MNRAS, 456, 3032Peng Y., Maiolino R., Cochrane R., 2015, Nature, 521, 192Peng Y.-j. et al., 2010, ApJ, 721, 193Pozzetti L. et al., 2010, A&A, 523, A13
Pracy M. B., Owers M. S., Couch W. J., Kuntschner H., Bekki K., BriggsF., Lah P., Zwaan M., 2012, MNRAS, 420, 2232
Richards S. N. et al., 2016, MNRAS, 455, 2826Robotham A. S. G. et al., 2013, MNRAS, 431, 167Rowlands K. et al., 2012, MNRAS, 419, 2545Rowlands K., Wild V., Nesvadba N., Sibthorpe B., Mortier A., Lehnert M.,
da Cunha E., 2015, MNRAS, 448, 258Salim S., 2014, Serb. Astron. J., 189, 1Salim S., Fang J. J., Rich R. M., Faber S. M., Thilker D. A., 2012, ApJ, 755,
105Saunders W. et al., 2004, in Moorwood A. F. M., Iye M., eds, Proc. SPIEConf.
Ser. Vol. 5492, Ground-based Instrumentation for Astronomy. SPIE,Bellingham, p. 389
Schawinski K. et al., 2014, MNRAS, 440, 889Schechter P., 1976, ApJ, 203, 297Schlegel D. J., Finkbeiner D. P., Davis M., 1998, ApJ, 500, 525Schmidt M., 1968, ApJ, 151, 393Schneider D. P. et al., 2007, AJ, 134, 102Serra P. et al., 2012, MNRAS, 422, 1835Sharp R. et al., 2006, in McLean I. S., Iye M., eds, Proc. SPIE Conf. Ser.
Vol. 6269, Ground-based and Airborne Instrumentation for Astronomy.SPIE, Bellingham, p. 62690G
Smethurst R. J. et al., 2015, MNRAS, 450, 435Smith D. J. B. et al., 2012, MNRAS, 427, 703Snyder G. F., Cox T. J., Hayward C. C., Hernquist L., Jonsson P., 2011, ApJ,
741, 77Springel V., Di Matteo T., Hernquist L., 2005, ApJ, 620, L79Strateva I. et al., 2001, AJ, 122, 1861Sutherland W. et al., 2015, A&A, 575, A25Taylor E. N., 2011, MNRAS, 418, 1587Taylor E. N. et al., 2015, MNRAS, 446, 2144Tinker J. L., Leauthaud A., Bundy K., George M. R., Behroozi P., Massey
R., Rhodes J., Wechsler R. H., 2013, ApJ, 778, 93Tokunaga A. T., Simons D. A., Vacca W. D., 2002, PASP, 114, 180Tomczak A. R. et al., 2014, ApJ, 783, 85Trayford J. W., Theuns T., Bower R. G., Crain R. A., Lagos C. d. P., Schaller
M., Schaye J., 2016, MNRAS, 460, 3925Vergani D. et al., 2010, A&A, 509, A42Wetzel A. R., Tinker J. L., Conroy C., van den Bosch F. C., 2013, MNRAS,
432, 336Whitaker K. E., Kriek M., van Dokkum P. G., Bezanson R., Brammer G.,
Franx M., Labbe I., 2012, ApJ, 745, 179Whitaker K. E. et al., 2015, ApJ, 811, L12Wijesinghe D. B. et al., 2012, MNRAS, 423, 3679Wild V., Kauffmann G., Heckman T., Charlot S., Lemson G.,
Brinchmann J., Reichard T., Pasquali A., 2007, MNRAS, 381,543
Wild V., Walcher C. J., Johansson P. H., Tresse L., Charlot S., Pollo A., LeFevre O., de Ravel L., 2009, MNRAS, 395, 144
Wild V. et al., 2014, MNRAS, 440, 1880Wild V., Almaini O., Dunlop J., Simpson C., Rowlands K., Bowler R.,
Maltby D., McLure R., 2016, MNRAS, 463, 832Williams R. J., Quadri R. F., Franx M., van Dokkum P., Labbe I., 2009, ApJ,
691, 1879Wright A. H. et al., 2016, MNRAS, 460, 765Wright A. H. et al., 2017, MNRAS, 470, 283Wuyts S. et al., 2011, ApJ, 742, 96Yan R., Newman J. A., Faber S. M., Konidaris N., Koo D., Davis M., 2006,
ApJ, 648, 281Yan R. et al., 2009, MNRAS, 398, 735Yesuf H. M., Faber S. M., Trump J. R., Koo D. C., Fang J. J., Liu F. S., Wild
V., Hayward C. C., 2014, ApJ, 792, 84York D. G. et al., 2000, AJ, 120, 1579Young L. M. et al., 2011, MNRAS, 414, 940Young L. M. et al., 2014, MNRAS, 444, 3408Zahid H. J., Baeza Hochmuth N., Geller M. J., Damjanov I., Chilingarian I.
V., Sohn J., Salmi F., Hwang H. S., 2016, ApJ, 831, 146Zwaan M. A., Kuntschner H., Pracy M. B., Couch W. J., 2013, MNRAS,
432, 492
MNRAS 473, 1168–1185 (2018)Downloaded from https://academic.oup.com/mnras/article-abstract/473/1/1168/4315942by Swinburne Library useron 01 December 2017

The mechanisms for quiescent galaxy formation 1183
A P P E N D I X A : R E M OVA L O F C O N TA M I NA N T SF RO M T H E PS B P O P U L AT I O N
In Fig. A1, we show the PCA selection of candidate PSBs(PC2 >0.6) with S/N >6.5 in the redshift range 0.05 < z < 0.26.Orange points show spectra which had problems with unmaskednoise spikes, or exhibited an extreme fall-off in flux to the blue (thiscould be due to poor tracing of the flux on the CCD when the S/N islow). Furthermore, some spectra in the PSB region were removedif we could not positively identify a Balmer series. The contami-nant sources mostly occupy regions above the quiescent populationand to the upper left of the star-forming galaxies, with unphysicalprincipal component amplitudes. Around ∼2/3 of candidate PSBgalaxies were removed, leaving a clean PSB sample (purple points),
Figure A1. The distribution of the 4000 Å break strength (PC1) and excessBalmer absorption (PC2) as measured using a PCA of the 4000 Å spectralregion of the GAMA galaxies in the range 0.05 < z < 0.26. The grey scaleindicates the logarithmic number of objects. The coloured dots are randomsamples of galaxies which occupy each spectral class delineated by dashedlines: quiescent (red), star forming (blue), green valley (green) and cleanPSB (purple), rejected PSB (orange). Contours show 10, 30, 50, 70 and90 per cent of the maximum number of galaxies in the sample.
which lie in the expected PSB region above the star-forming andgreen-valley populations.
A P P E N D I X B : B ROA D - BA N D C O L O U R S O FSPECTRALLY CLASSI FI ED GALAXI ES
In Fig. B1, we show the g − r colours of galaxies in each spectralclass. The broad-band colours have been K-corrected to rest-framewavelengths using the best-fitting model SED from the Bruzual &Charlot (2003) library and have been corrected for Galactic extinc-tion. The broad-band colours of PSB galaxies are mostly in the g − rblue cloud and green valley, with a minority of galaxies on the red se-quence. The spectroscopically classified quiescent galaxies mostlyreside in the red sequence, but there is some scatter towards thegreen valley. The spectroscopically classified green-valley galaxiesare centred on the g − r green valley, but there is also substantialscatter into the blue cloud and red sequence. The spectroscopicallyclassified star-forming galaxies lie mostly in the g − r blue cloudbut there is substantial scatter into the red sequence. We note that thedefinition of green valley based on broad-band photometry is arbi-trary. The disagreement between the spectroscopic and photometricclassifications for some galaxies may be because of the differenteffects of dust on broad-band photometry and the information fromperforming the PCA on the spectra, which span a relatively narrowwavelength range of 3750–4150 Å. Furthermore, aperture bias willcause some differences, as the broad-band colours are an averageover the whole galaxy, but the fibre only covers 2–3 arcsec of thegalaxy centre. This is discussed further in Section 2.8.
Aperture bias is an issue which could affect our conclusions. Totest this, in Fig. B2, we show the U − V and V − J colours (e.g.Williams et al. 2009) of the four spectral classes in four redshift bins.We compute the rest-frame U, V and J magnitudes by convolvingthe best-fitting SED model (see Section 2.4) with the Bessel U,Bessel V (Bessell 1990) and UKIRT J filters (Tokunaga, Simons& Vacca 2002). Spectroscopically, classified star-forming galaxieslie in the blue part of the UVJ diagram, whilst quiescent galaxieshave red UVJ colours. Spectroscopically, classified green-valleygalaxies have intermediate colours. The majority of PSBs overlapwith the star-forming and green-valley populations. Galaxies in oursample have broad-band colours consistent with their spectroscopicclasses, at all redshifts. If aperture bias was affecting our results
Figure B1. Rest-frame broad-band colours as a function of absolute r band magnitude of spectrally classified galaxies in the GAMA survey. The grey scaleindicates the logarithmic number of objects in the parent sample with S/N>6.5 per 6 Å pixel. Coloured contours show the different spectral classes in eachpanel, from left to right these are: PSB, quiescent, star-forming and green-valley galaxies. Contours show 10, 30, 50, 70 and 90 per cent of the maximumnumber of galaxies in each sample.
MNRAS 473, 1168–1185 (2018)Downloaded from https://academic.oup.com/mnras/article-abstract/473/1/1168/4315942by Swinburne Library useron 01 December 2017

1184 K. Rowlands et al.
Figure B2. Rest-frame broad-band colours of spectrally classified galaxies in the GAMA survey in four redshift bins. The grey scale indicates the logarithmicnumber of objects in the parent sample with S/N>6.5 per 6 Å pixel. Coloured contours show the different spectral classes in each panel, from left to right theseare: PSB, quiescent, star-forming and green-valley galaxies. Contours show 10, 50 and 90 per cent of the maximum number of galaxies in each sample. Solidblack lines are the commonly used separator between red-sequence, blue-sequence and dusty star-forming galaxies. The dotted black line from Whitaker et al.(2012) separates PSB galaxies from red-sequence galaxies.
we would see a shift in the locus of each spectral class from thebroad-band classification in a systematic way. We do not see anyshift in the locus of any spectral class with redshift, therefore wesee no evidence that aperture bias causes us to misclassify largenumbers of galaxies of any spectral class.
A P P E N D I X C : C O M PA R I S O N TOL I T E R ATU R E M A S S F U N C T I O N S
In Fig. C1, we compare our mass functions to those in the liter-ature to check that our QSR completeness correction for spectrabelow our S/N threshold allows us to correctly recover the massfunctions. Although the Baldry et al. (2012) mass functions are
Figure C1. The completeness corrected mass functions of the total, qui-escent population, star-forming populations, green valley, and combinedquiescent population and green-valley populations for our lowest redshiftbin (0.05 < z < 0.14) compared to those in the literature. Errors on massfunctions from our study include Poisson, cosmic variance contributions anduncertainties propagated from the uncertainty on fitting the stellar masses.
derived from GAMA galaxies at 0 < z < 0.06 and our samplespans 0.05 < z < 0.14, there should be negligible evolution inthis small redshift range. Our total and star-forming mass functionstrace the Baldry et al. (2012) mass functions well, which showsthat our completeness corrections are correct. Furthermore, we findexcellent agreement between our total mass function and that fromMoustakas et al. (2013) and Wright et al. (2017).
There is a slight deficit of low-mass quiescent galaxies in oursample compared to Baldry et al. (2012). This may be due to thedifferences in sample selection, as Baldry et al. (2012) separate star-forming and quiescent galaxies using the u − r optical colour, andwe use a cleaner spectroscopic selection that likely has less con-tamination by dusty objects. Furthermore, we separate quiescentfrom green-valley galaxies, whereas Baldry et al. (2012) do notmake this discrimination, meaning that green-valley galaxies willbe mixed with the red and blue populations defined on broad-bandcolours. Adding the quiescent population and green-valley massfunctions together, they approximately reproduce the Baldry et al.(2012) quiescent population mass function, with a slight deficit re-maining as a small number of galaxies which are red in u − r areclassified spectroscopically as star forming. The deficit of spectro-scopic quiescent galaxies at the low-mass end compared to Baldryet al. (2012) suggests that broad-band optical colour selection tendsto classify spectroscopic green-valley galaxies as red. Addition-ally, Baldry et al. (2012) calculated stellar masses with ugriz dataonly, whereas we derive more robust stellar mass measurements byusing UV and NIR data in addition to ugriz data, which may ac-count for small differences in the mass functions. Note that Wrightet al. (2017) use updated GAMA photometry and we find excellentagreement with their mass function.
In Fig. C2, we compare our VIPERS mass functions to those inDavidzon et al. (2013), Ilbert et al. (2013), Moustakas et al. (2013),Muzzin et al. (2013) and Tomczak et al. (2014) using similar redshiftranges and cosmology. In all redshift bins, we see good agreementwith most literature studies. Our mass function has slightly differentnumber densities in the 0.65 < z < 0.8 bin, which may be caused bymismatches in the redshift ranges of literature studies, by differentstellar population models and/or fitting methods, or dust laws usedby each study. Note that we use the same redshift ranges as Mous-takas et al. (2013) and we see an excellent agreement with this studyin all redshift bins. There is no trend of worsening discrepancy with
MNRAS 473, 1168–1185 (2018)Downloaded from https://academic.oup.com/mnras/article-abstract/473/1/1168/4315942by Swinburne Library useron 01 December 2017

The mechanisms for quiescent galaxy formation 1185
Figure C2. The completeness corrected total mass functions in this work (black diamonds) compared to those in Davidzon et al. (2013), Ilbert et al. (2013),Moustakas et al. (2013), Muzzin et al. (2013) and Tomczak et al. (2014). All points have been scaled to the same cosmology. Errors on the black points includePoisson, cosmic variance contributions and uncertainties propagated from the uncertainty on fitting the stellar masses.
most literature mass functions with increasing redshift. However,after scaling our masses to the same cosmology, we find that themass functions from Davidzon et al. (2013) show an increasing dis-crepancy with redshift compared to our total mass functions. Whilstwe do not use exactly the same redshift bins or stellar populationmodels, the strong redshift trend suggests that this is unlikely tobe the source of the difference between our mass functions. As thestellar masses from Davidzon et al. (2013) are not publicly availablewe are unable to dig deeper into this discrepancy.
1School of Physics and Astronomy (SUPA), University of St Andrews, NorthHaugh, St Andrews, Fife, KY16 9SS, UK2Department of Physics and Astronomy, Johns Hopkins University,Bloomberg Center, 3400 N. Charles St., Baltimore, MD 21218, USA3Institute for Astronomy, University of Edinburgh, Royal Observatory,Blackford Hill, Edinburgh EH9 3HJ, UK4Astrophysics Group, School of Physics, University of Bristol, Tyndall Av-enue, Bristol BS8 1TL, UK5Australian Astronomical Observatory, PO Box 915, North Ryde, NSW 1670,Australia6ICRAR, The University of Western Australia, 35 Stirling Highway, Crawley,WA 6009, Australia7Department of Physics and Astronomy, Macquarie University, NSW 2109,Australia
8E. A. Milne Centre for Astrophysics, University of Hull, Cottingham Road,Kingston-upon-Hull, HU6 7RX, UK9School of Physics and Astronomy, Monash University, Clayton, Victoria3800, Australia10Jeremiah Horrocks Institute, University of Central Lancashire, PR1 2HEPreston, UK11SRON Netherlands Institute for Space Research, Landleven 12, NL-9747AD Groningen, the Netherlands12Kapteyn Astronomical Institute, University of Groningen, Postbus 800,NL-9700 AV Groningen, the Netherlands13NASA Ames Research Center, N232, Moffett Field, Mountain View, CA94035, USA14Sydney Institute for Astronomy, School of Physics A28, University of Syd-ney, NSW 2006, Australia15Research School of Astronomy and Astrophysics, Australian National Uni-versity, Canberra, ACT 2611, Australia16University of Leiden, Sterrenwacht Leiden, Niels Bohrweg 2, NL-2333 CALeiden, the Netherlands17Department of Physics and Astronomy 102 Natural Science Building,University of Louisville, Louisville KY 40292, USA18Centre for Astrophysics and Supercomputing, Swinburne University ofTechnology, Hawthorn 3122, Australia
This paper has been typeset from a TEX/LATEX file prepared by the author.
MNRAS 473, 1168–1185 (2018)Downloaded from https://academic.oup.com/mnras/article-abstract/473/1/1168/4315942by Swinburne Library useron 01 December 2017